scf so - irs tax forms
TRANSCRIPT
IMPUTATION OF THE 1989 SURVEY OF CONSUMER FINANCESSTOCHASTIC RELATION AND MULTIPLE IMPUTATION
Arthur Kenmckell Federal Reserve System
The Survey of Consumer Fmances SCF is de- tics of Income Division of the Internal Revenue
signed to gather detailed infonnation on the financial Service SO the Congressional Joint Committee
and demographic characteristics of U.S households on Taxation tho Office of the Assistant Secretary
Inevitably in such survey some respondents are for Planning and Evaluation in the Depamnent of
unwilling or unable-to provide all of theinformation Health and Human Services thNational Inslittite
requestedofthem In waves of the SCF before 1989 on Aging the General Accounting Office the Small
imputations of missing values were made on an ad Business Administration the Office of the Comphoc basis decision was made for the 1989 survey troller of the Currency and the Social Security
to build systematic imputation and editing software Administration The data from the project are used
that reflects the current state of knowledge in the broadly for policy analysis and for more academic
area and that wouldbe substantially reusable in future research in economics and other areas
waves of the survey
The puipose of the SCF is to provide compreThis paper describes the Federal Reserve Impu- hensive and detailed view of the financial behavior
tation Technique Zeta FRITZ developed for the of households Altogether well over 1500 variables
1989 SCF In the next section of this paper give were collected Detailed infonnation was gath
description of the structure of the 1989 SCF and ered on all assets and liabilities attributable to the
evaluate the incidence of missing data In the third primary economic unit in the household
section ieview some of the theory underlying the Liabilities include credit card debts installment
procedures applied In the fourth section give an loans mortgages lines of credit and other loans
outline of the structure of the FRITZ model The Assets include the principal residence all types of
next section provides some statistics on the perfor- loans made to others real estate assets businesses
mance of the model In the final section provide various types of accounts including checking say-
brief summary and discuss areas for further re- ing money market IRA Keogh and brokerage
search accounts stocks mutual funds bonds and other
assets Detailed information was also collected on
1989 SURVEY OF the current job of respondents and their spouses
CONSUMER FINANCES their current and future pension rights and other
demographic characteristics supplementary sur
History and Purpose of the Survey vey was conducted of the pension providers of cur
rently employed respondents and their spouses in
The SCF as wealth survey traces its ongins tOorder to obtain more comprehensive and accurate
the landmark 1963 Survey of Financial Charactens-information than could reasonably be expected of
tics of Consumers conducted by Dorothy Projector householandGertrudeWeiss Other surveys known as
the SCF were conducted in the 1970s However it
was only in 1983 that the SCF was revived asQuestionnaire Design
wealth survey The 1989 SCF is the third of the new To accommodate the many types of information
series of SCFs Our hope is that there will be support requested from range of socio-economic groupsto continue the survey on triennial basis the questionnaire for the SCF is quite long and
highly structured Typically the design of the in-
The 1989 SCF was sponsored by the Board of strument is such that questions about dollar
Governors of the Federal Reserve System the Statis- amounts are preceded by one or more filter ques
57
tions For example before asking the amount in averaged about 75 minutes Some panel interviews
respondents fifth checking account the person is were conducted by telephone In addition some
asked first whether the unit has any checking other interviews were conducted at least in part by
accounts and then how many accounts the unit has telephone at the request of the respondent In
Sometimes respondents are asked different se- general the telephone and in person interviews
quences of questions depending on the answer to appear identical in tenns of the proportion of
such filter questions missing information amount of marginal com
ments and other such information
Sample Design
Data Editing
The sample design of the 1989 SCF is also com
plex The two major parts of the sample are the Beforethedata werepunched the questionnaires
overlapping panel cross-section based on the 1983 went through several stages of editing Interview
SCF sample 1803 cases and new independent ers performed aconsistency check as soon as poscross-section sample 2000 cases Without loss of sible after the interview In the field office the
information essential for this paper in this section questionnaires were examined more closely for evi
will review only the new cross-section sample dence of interviewer or respondent error -- with
design This design is based on dual frame One particular attention to the possibility of double-
part of this sample was drawn from standard counting of assets and liabilities Further machine
national area-probability frame and the remainder editing was performed on the punched data for more
was selected from list frame developed from complicated logical problems One area in which
administrative files maintained by SO wealth the survey is quite weak is in the retrieval of infor
index was constructed for each list frame element mation missing due to interviewer or respondent
using income flows reported on tax returns capital- errors
ized at various rates of return Elements were
then selected by stratified probability sampling to Data changes at all stages of editing represent
over-represent units with higher values of the something very close to if not identical to imputa
wealth index The motivation for the dual frame tion Generally conservative approach was taken
design was two-fold First since an important to changing data in editing However when
mission of the survey is to characterize the distribu- missing pieces of information were obvious in the
tion of financial assets which are highly concen- context of other information in the questionnaire
trated in small part of the population an efficient the data were filled in at this stage Records were
design should over-represent that group Sec- kept of major changes to the data As one might
ond common survey folklore and on-going analyses expect of an interview that was administered to
of the 1989 SCF support the claim that nonresponse households of all ranges of fmancial sophistication
tends to be higher for households with higher levels editing was substantial and important for the quality
of wealth In most area-probability samples of the fmal product Many lessons have been
there is no means of making systematic adjustment learned in the effort both about how to avoid
for this differential non-response The advantage of number of the more serious problems through
the list sample used for the 1989 SCF is that improved questionnaire design in the future and
nonresponse adjustments can be made based on ex- about what types of additional information are most
tensive income information contained in the adminis- useful in resolving inconsistencies that cannot be
trative records that served as the sample frame eliminated entirely
Data Collection Unit and Item Nonresponse
Data for the survey were collected between the The achieved sample for the entire 1989 survey
months of July 1989 and March 1990 by the Survey includes 3803 households Of this number 3134
Research Center at the University of Michigan have cross-section representation and 1479
Interviews were largely conducted in person and have panel representation Of the 2000 new cross
58
section cases 866 derive from the SO list frame The structure of missing values is quite compli
Area-probability and list cases were treated slightly cated As noted above the questionnaire is de
differently in the field Area-probability cases signed so that respondents are led down manywere approached directly by interviewers and question paths with several conditional branches
about 69 percent of these cases were eventually In addition very greatnumber of
patterns of
interviewed The list cases were given prior op- missing data appear in the data For all practical
portunity to refuse participation by returning purposes it is safe assumption that the overall
postpaid card About third of the list cases refused pattern of missingness for each case is unique
participation at this stage The remainder were Thus the imputation of the missing values cannot
approached by interviewers yielding an overall in- be addressed routinely using techniques developed
terview rate for the list sample of about 34 percent for monotone patterns of missingness without sac-
While the interview ratelor th list cases is not rificing substantial infonnation to achieve monoto
high according to usual criteria this figure merely nicity for subgroups
makes explicit the differential nonresponse with re
spect to income that is hidden in other surveys that Table provides response rates for nonrandom
have insufficient frame information to reveal the selection of survey variables for the panel and cross-
problem Moreover in the SCF we have at least section observations taken together As shown in
the hope of making systematic adjustments to the the table item nonresponse rates vary widely but
sample by estimation of response models using the generally within range that is typical of other
universe data under the assumption that units are economic surveys One exception is 1988 adjusted
conditionally missing at random gross income which was missing in over 28 percent
of cases suspect that this very high level of non-
Every observation in the survey contains at least response had two inportant sources --the field period
one piece of missing information -- often very began later than expected after April 15th and ran
trivial item such as the interviewer ID number longer than expected and respondents were not en-
Partial information was available for many items couraged to look up data where appropriate
Respondents who were reluctant to provide dollar
values directly were offered card containing dollar Shadow Variables
ranges labeled with letters For total income more
directed tree approach was taken to bound income We have attempted to incorporate in the dataset
more tightly Excluding range-card responses the as much information as possible about what went into
mean numberofmissingvaluespercaseis 21.6 the the determination of each data value For example
median is 11 the 90th percentile is 37 and the total piece of information might be provided exactly by
number of missing values to be imputed is 82125 the respondent provided by the respondent as
The mean number of range responses was 3.4 range refused by the respondent unknown by the
per interview and the total numberof such responses respondent inferred from other information at the
was 3477 For comparison the maximum possible stage of editing and imputation etc Every variable in
number of missing values is about million the survey has shadow variable that reflects the
However all pieces of missing information are not information content of the primary variable In all
of equal value in terms of the overall objectives of eachof these shadow variables can take on 63 values
the survey -- e.g the amount respondent has in The function of these variables is twofold First for
sixth checking account is usually less important that purposes of automated imputation these variables
the total amount of corporate stocks Another gauge serve as convenient flag for imputation Such flags
of severity of the problem the proportion of become even more important in the context of Ion-
missing dollar amounts based on the imputed values gitudinal imputation Second it is important for
is given below in the discussion of the results of the many analytic purposes to know exactly which items
model were not reported by the respondent For example
59

Table 1.Item Nonresponse Rates Selected Items Percent
1989 Survey of Consumer Finances Panel and Cross-Section Unweighted
Dont Not Unknown Range Memo item
Item know available whether response Percent of all
have item all cases inappr
Balance on bank credit cards 0.6 1.2 0.0 0.8 30.9
Value of own home excl mobile homes 1.6 1.2 0.0 0.6 29.6
Amount outstanding on mortgage on home 3.2 2.0 0.1 1.2 58.5
Have any owned cars 0.0 0.0 0.0 0.0 0.0
Number of owned cars 0.0 0.2 0.0 0.0 11.5
Value of 1st business with mgt role 15.0 3.1 1.1 4.8 73.7
Have checking acct 0.0 0.2 0.0 0.0 0.0
Number of chkg accts 0.0 0.2 0.3 0.0 11.6
Ann in lstchkg acct 1.4 4.6 0.3 2.5 11.6
Amount of CDs 3.1 7.8 1.8 5.7 73.9
Amt of savings bonds 4.9 2.3 2.5 2.5 76.3
Amount of stock excl.mutual funds 5.4 5.1 1.5 5.4 65.4
Cash value of life insurance 31.7 1.6 4.5 1.9 53.0
Wage for respondent currently working 0.9 4.3 1.1 2.1 2.3
Balance in 1st defined contribution pension
plan for respondent 16.7 1.8 6.2 2.7 84.2
Total family income 2.1 1.7 14.6 0.0 0.0
Filed 1988 tax return 0.2 1.0 0.0 0.0 0.0
Amount of 1988 adj.gross income 29.0 6.3 1.4 5.2 13.4
Amount of 1st inheritance 5.9 4.4 3.3 3.6 68.1
Amount of 1988 charitable contrib 1.6 1.9 2.5 3.0 48.9
Wage income for non-primary
unit members 30.3 2.9 5.1 5.9 90.1
Computed as percent of cases either where response was appropriate or where it was unknown whether
response is appropriate
some analysts may wish to use different methods of Three strands of literature are particularly rel
imputation or to use other techniques to allow for evant to the work reported in this paper the EMthe possibility of non-ignorable nonresponse algorithm multiple imputation and Gibbs sampling
or stochastic relaxation All of the methods dis
cussed here are strongly influenced by Bayesian
REVIEW OF IMPUTATION THEORYthinking more complete overview of this liters
tureis given inRubin and Gelfand and Smith
There are numerous ancestors of the missing
value techniques reviewed in this section For more
complete history refer the reader to the detailed The EM algorithm presented as distinct pro-
references in the landmark National Academy vol- cedure first appeared in Demster Laird and Rubin
umes Madow Olin and Rubin Little and That model is intended to estimate paraRubin and Rubin meters in dataset where some information is only
60
partially observed and direct estimation in the pies- Similarly one may write
ence of missing information is difficult but estima-
-s IjOf9IxzfxI$xd4 fZJXdZtion with complete data would be easier Using fX
observed information starting estimates of the pa-
rameters ate computed These estimates are then Both and are easily seen to be recursive
used to simulate the missing information The origi- relationship that might be solved by iterative substi
nal information is used along with the simulated tutions Tanner and Wong prove that under
information as basis for maximum likelihood esti- regularity conditions equivalently by simple
mation of the parameters of interest This process change of notation converges unifomily to unique
continues iteratively until the parameterestimates are fixed point
sufficiently close to fixed point The intuition of
this landmark paper underlies-all that-is reported Equation 4lias Sirtfle ffltrretatioti in the
here imputation framework with the parameters serving
as an intermediate step using simulation techniques
Rubins work on multiple imputation see par-and multiple imputation Given some starting values
ticularly Rubin and references therein serves one could draw number of replicates of and
as bridge between EM and the later simulationin turn until convergence of the posterior distribution
techniques that involve structure similar to EMof or isreached lnorderforthismethodtobe
Briefly multiple imputation simulates the distribu
lion of missing data and thus allows more realistic practical one must be able to compute several condi
assessment of variances and more efficientrepre- tional distributions to be able to draw samples of all
sentation of first momentsof and all of simultaneously In some complex
sets of data this constraint is not practicalpaper by Tanner and Wong follows
from the methods of EM and ideas of multiple impu
tation and offers clear framework forunderstand- Papers by Geman and Geman and Li
ing the usefulness of iterative simulation methods inprovide useful approaches for dealing with
imputation Tanner and Wong focus on the estima-more complex data structures These papers des
cribe an iterative Markovian procedure of succeslion of set of parameters where some potential
sive simulation of the distribution of variables condiconditioning information is unobserved but as
shown below it is easy to extend the argumenttioned on both observed data and distributions of
estimation of missing data brief review of ofvariables previously simulated in the same iteration
their arguments may help in understanding the de-The method is typically referred to as stochastic
velopment of this paperrelaxation or Gibbs sampling The procedure has
had extensive applications in the area of image
processing The iterative nature of the procedure is
Let be unobserved values of larger setsimilar to the model of Tanner and Wong with the
let X.X-X1 and let0beasetofparaineterfollowing exception if above is partitioned into
values to be estimated Using notation similar to
elements where ilto the procedure canTanner and Wong one may write
fO1X fOIX ZfZIX dZ and
be described as successive simulation of the dis
tribution of the separate elements of and condi
fXIX fXI4XfIXd tioned on all available information where avail
able is taken to mean nonmissing infonnation as
By substitution and rearrangement of terms one well as simulated missing data For example in
may write as do Tanner and Wongiteration for variable one draws from
AL AV4fOIX J1J fOIX ZfZi$.X dZ f$IX d$ fX lx .XOU
61

where X1 denotes simulated data on missing vari- procedures can be reused for future SCFs as well as for
able in the Ith iteration Moreover the set ofother purposes
conditioning variables need not be the entire set of
possible variables if it is know that some localIn designing the imputation proceduEes for the
ture or clique in the terminology of Geman andSCF we were constrained in number of ways
Geman can be assumed for each variable First reasonable estimates of the missing data for
ation of this procedure is applied in the constructionsubset of financial variables needed to be available
of the FRITZ model described below Althoughvery quickly for pressing policy needs Second for
convergence is reported to be slow for large numbers several reasons we were limited to about year from
of variables Geman and Geman show that underthe time the first complete data tape was received in
regularity conditions tbe process converges and thatthe fall of 1990 Third the system was required to
the simulated distribution of moves closer to theallow the imposition of prior infonnation both in the
form of edit rules and specific information about
true latent distribution with each iterationindividual cases Fourth the procedure had to accom
modate any possible pattern of missing values Fi
DESCRIFFION OF FRiTZ nally the woik had to be performed with limited
computer resources storage and CPUAfter review of the literature and of existing
procedures we decided to build comprehensive new There is continuum of changes to the respon
imputation software for statistical imputation of the dents answers from the point of interviewer record-
1989 SCF Fellegi and Holt and their ing through primary data editing to statistical
proposal for an automated system of edit and impu- imputation Virtually all imputations made after the
tation sets an imposing standard Two software primary editing stage are model-based though
packages represent important extensions of the ideas small number of documented cases have been
in that paper Statistics Canada maintains very in- imputed judgmentally -- typically variables that would
teresting edit-imputation software the Generalized be quite cumbersome to impute but which are re
Edit and Imputation System GElS review of solved with very high probability upon inspection
this model is given in Giles This is very Judgmentally imputed variables are flagged as
impressive model However for our purposes the such in the shadow variables and ifie of these deci
system is too limited in the types of imputation sions was created as part of the survey documenta
models available In addition it appears that ittion
would be cumbersome to implement the multiply-
imputed Gibbs sampling direction taken here The FRiTZ was designed to handle the great majority
Structured Program for Economic Editing and Re- of statistical imputations Although the procedure is
ferrals SPEER developed at the Census Bureau iterative and involves multiple imputations for rela
Greenberg and Surdi offers an excellent tive transparency of exposition it will be convenient
environment for the implementation of the types of to act at first as though the model were the more
complicated algebraic constraints important in the usual case of single imputations computed without
imputation of the SCF However given the nature of iterations The general procedures applied in the first
the SCF data and the theoretical direction taken here iteration are used in all later iterations Special
SPEER appeared too difficult to adapt for our pur- problems induced by the mixture of panel and cross-
poses section data will only be presented later in the dis
cussion
In the past imputation had been performed on an
ad hoc basis with significant and very frequent Basic Procedures in the First Iteration
intervention by analysts at the level of individuallet the potential set of variables collected for
imputations well beyond the editing stage While the
effort involved in the development of FRITZ has given case r1 to be denoted by where is
been great we believe that much of the core set of vector of variables Additionally let
62

OfflkNgand ofrankN N-N denote In the FRiTZ system there are four types of
model-based imputations imputation of continuous
respectivelythepartitioningof into variables thatvariables binary variables and polychotomous vari
ables and nonparametric imputation Unfortunatelyare available and those missing for some reason The
theory does not offer much help in finding the true
goal of the imputatioti process is to obtain good functional form of In the case of most con
tinuous-variable imputations it is assumed implicitly
estimate of FX IX Multiple imputation alloW5that the variables with missing values can be taken to
in
have conditional distribution of the formthe dataset itself to stand as proxy for that disiribu-
FGaIHkb Norma1.ttion
where is variable with missing values is set of
Using variation on the technique of Gibbs sam-conditioning variables and and are transfonna
pling or stochastic relaxation described abovetions of and respectively This assumptions
proceeds through the variables to be imputed in amounts to assuming that
predetermined sequence making imputations van- OaHb where NOcable-by-variable and for given variable indepen-
dentlyforeachobservation In the process theTypically is assumed to be multiplicative in and
information set available for imputation of each casethe transformations and are taken as log trans
expands as imputation proceeds through the forms implicitly yielding the linear model
quence of variables Imputed variables are treated
exactly like reported variables within each iteration Aconstant3lBl...EA
That is in the first iteration we estimatewhere the capital letters indicate the log transform
The great benefit of this assumption is that relative
F13 IX ly simple covariance matrix of the variables forms
sufficient statistic for imputation and the simulation of
FXIXgi is straightforward
In practice we can be almost certain that the
variables we observe are subset of the appropriate
vector At the least there are likely idiosyncratic
F3IXLXinn factors for every observation that would be extremely
difficult to represent as reasonably small set of
FX IX 43variables even in principle Once we face the factmnthat all of is not known potential problem of
nonignorable nonresponse arises --that is conditional
on the observed variables the set of nonrespondents
F3 IX for given item may be nonrandom subset of the
mN whole sample
FX IXL.X 43mN In FRITZ an agnostic approach is taken to the set
of observed variables chosen to proxy for In
principle it might be desirable to take the condition-where Xmn denotes the missing values imputed rn
ing set as series expansion of the function in-
the sequence before variable and where the pam-volving all variables available for each observation In
meters of the distribution are estimated from reportedpractice degrees of freedom limit the number of
and simulated dataintheprevious iteration and wherevariables interaction terms and higher order temis
is an intermediate parameter vector corresponding that can feasibly be included In any event no attempt
to the stage of EM is made to exclude variables that have no obvious
63

structural inteipretation -- the underlying model is plied taking the model coefficients to be fixed and
pure reduced fonn Most often the maximal set ofassuming that is distributed normally with mean
conditioning variables for given case is on the order
of 200 or more variables frequently includingzero and vanance given by
number of recoded variables particularly relevant for AA-.AB where the iti
given imputation Typically included in the set ofgi gi
variables used is group of interviewer observations evantmomentsarecornputedasdescribedbclow The
on respondents level of suspicion before and after the allowed distribution of may be truncated or other-
interview their level of interest etc The data wise altered using prior information or editing rules
indicate reasonable variation in the amount of infor- Because the inversion of large matrix is usually
mation reported for all levels of these variables me involved for each such imputation this method is
hope is that these variables wifi be correlated with quite time-consuming
unobserved characteristics of item non-respondents
and thus mitigate the potential for nonignorable The moment matrix for the continuous and binary
nonresponse bias imputations is computed for the appropriate sub-popu
lation -- e.g the covariance matrix needed for the
While there is no guarantee that such an approach imputation of the amount of holdings of certificates
eliminates--or even reduces--possible response bias of deposit is computed using only households that
such strategy may be the best practical insuranceactually have such instnnnents Conveniently mo
against bias Our means for testing this assumption ment matrix computed using the maximal set of con-
are very limited One possibility may be to compare ditioning variables allowed will suffice for every case
the distribution of variables available for the list The software automatically selects submatrix for
sample in the administrative records with the distribu- each case corresponding to theconditioning variables
tion of comparable variables in the survey While available In the first iteration the covariance matrix
confidentiality concerns strictly limit direct compari- for the imputations is computed without weights and
son of cases in the two ifies it may be possible to using all non-missing pairs of variables for each oblook at such distributions within some sub-groups servation As is well-known this method of
calculation allows the possibility that the covariance
Operationally FRITZ looks at given case matrix may no longer be positive definite implying
determines whether the current variable in the se-
negative value for Inpractice is rarely
quence should be imputed determmes which van-
ables in the conditioning set are available either asestimated to be negative For convenience at the first
reported values or previously imputed values and stage LAS given floor of zero The alternative of
computes randomized imputation As noted earlierusing only cases with full information would usually
the combinations of missingvalues varies widely overtoo drastically reduce the number of observations
all cases so that virtually every case involves dif-available for the calculation
ferent regression Thus the imputed value of
variable for observation is drawn according to more serious problem in the covariance esti
marion is that induced by the presence of very influ
.B LB A1 and ential cases Typically this has been problem in
cases where there are coefficients of conditioning
FAIBJ13A
variables that areidentifiedby averysmallnumberof
observations In such cases .ashave been detected
where denotes the set of values of all obser- the set of conditioning variables has been reduced to
vations for variables included in .8 the set ofexclude the offending variables Unfortunately
g.j have not had either computer power or staff resourcesavailable reported and already imputed within the
to explore tiiis dimension systematically FRITZ
iteration values for case writes out information about imputations as it proceeds and such problems detected to date have been
In the first iteration an improper impUtation is found through inspection of the model output One
made by drawing value from the distribution im- sign of problems is the frequent inability of given
64
model to impute value strictly within the bounds ally every observation would require different
imposedby theconstraintseitherdetennined through model and additional passes through the data
edit rules or from range card estimates The most Goldberger has suggested that one use the
desirable approach would be to use robust estimation estimates from the linear probability model to create
techniques for the covariance matrix This will be weights for second iteration which as Rubin has
an important line of research for this project in the pointed out in conversation would amount to first
future Newton step in the maximum likelihood estimation
Unfortunately the time required for even that refme
There appears to be another -- pethaps related -- ment is prohibitive given the current speed of the
class of problems with covariance matrices estima- computers available to the project
ted in this way Initially it would happen occasion
ally that the model would impute values that were Given an estimated probability from the linear
clearly absurd Although sweep algorithm with probability model draw is made from the implied
facility for elimination of near-singularities is used binomial distribution to detennine the outcome
in FRiTZ decomposition of the covariance matrix Some key polychotomous imputations are structured
indicated situation normally corresponding to near- as the sequential prediction of binary choices The
collinearity i.e very large condition numbers input covariance matrix is computed exactly as in the
Moreover the problem disappears once complete- continuous variable case above
iy imputed file is available for covariance estimation
after the first iteration Thus the problem seems to Less critical polychotomous variables are imstem from characteristic of using all non-missing puted using type of randomized hotdeck Cases are
pairs for variables in the first iteration Although arrayed as multidimensional frequency table using
have not been able to resolve the problem analyti- number of classifying variables The imputation
cally have implemented numerical patch in the procedure randomly selects value for the missing
first iteration only that is related to principal com- variable from the appropriate conditional cell
ponent regression minimumnumber of cases is required in each cell If
that minimum is not achieved there are rules for
For binary variables it is assumed that the same collapsing adjacent cells Very closely related to this
model holds as in the continuous case This amounts simple hotdeck procedure is nonparametric regres
to the somewhat more suspect assumption that the sion technique Essentially the difference is that
linear probability model applies Problems with the continuous variables are allowed in the frequency
linear probability model are well-known The table and the collapsing procedures select slice of
model fails to account for the information implied specified size from the joint distribution of the van-
by the fact that probabilities must be in the closed in- ables
terval and because the model is hetero
skedastic produces inefficient estimates of the model Higher-Order Iterations
parameters Much better from theoretical point of
view would be to pose the relationship as probit In the first iteration the goal is to estimate
logit or other such explicit probability model reasonable set of starting values for further iter
As it turns out here however the informational ations At the end of the first iteration we have one
requirements of such models are too large to be copy of the dataset with all missing values filled in
practical First such models must be estimated From the second iteration and on the initial dataset
iteratively requiring an additional pass through all containing missing values is replicated to times
of the data at each iteration of that probability and the missing values are filled in based on statistics
model In addition as is the case with the computed using the completed dataset from the prior
continuous variable imputations patterns of missing iteration In the second iteration the covariance
data are such that virtually every observation has matrices and other such basic statistics needed for
different information set Because there is no low- imputation are estimated from the reported data and
dimensional set of summary statistics that would the single imputations from the first iteration In
apply to all subsets of conditioning variables virtu- higher-order iterations these statistics are pooled
65

across the imputation replicates Also from the sec- Generally FRITZ requires four types of state
ond iteration on the imputations from the regression- ments for each variable to be imputed These types are
based models are proper that is full vector of illustrated in more detail below First set of rules
coefficients is drawn from the distribution of the isspecified to impose editing rules and other prior
parameters under normality rather than just random information about the feasible distribution of imputa
constant as in the first iteration tions Second set of transformations is specified
given the imputed value Third set of statistics is
Following the example of Tanner and Wong the computed for the imputation for the appropriate sub-
number of replicates is allowed to vary over itera- population Fmally there is call to the central
tons The first iteration involves one replicate the imputation driver An annotated version of simple
second iteration three replicates and later iterations set of such routines for the imputation of directly-held
five replicates The primary justification for the vary- corporate stocks is provided as Appendix
ing number of replicates is the severe constraints on
disk storage Given the complex tree structure of As in the example in the appendix the edit rules
the data it is an open question how many replicates generally are posed in terms of feasible upper and
may be needed to reflect adequately the variation due lower bounds for imputations In the example there
to imputation may be prior information from range card from
information on the subset of stock held in the corn-
if the assumptions we have made do not move us pany where someone in the household works from
too far from the requirements of the underlying the number of companies in which the household
theory at each iteration FRITZ will move closer owns stocks or from the combination of legal re
toward the true latent posterior distribution of the quirements and the amount borrowed on stock
data For convenience we define convergence in margin account Often in other cases the constraints
terms of changes in the implied distribution of derive from complex algebraic relationships between
wealth rather than as function of all possible variables In the recode section an attempt is made
variables In many applications Gibbs sampling is to create all related variables for which there is corn
knownto converge slowly Unfortunately thismaybe plete information at the time of the imputation Inthe
severe limitation in this application The first example theprogram may fill in the missing amount
iteration of FRiTZ requires at least 11 days -- largely or percent that the stock had changed in value since
due to the number of matrices that must be inverted its purchase and other items
-- on fairly fast Solboume minicomputer computer
dedicated to the project Subsequent iterations can The call to the module that computes the moment
take weeks or longer The amount of time required matrix generally specifies list of variables and
places particularly strains on our ability to debug such sub-population on which these estimates should be
complex software For this paper only the output made In the appendix the calculation is made only
of the first two iterations is available for the population that has already been determined
to have stocks Finally the call to the main
Structure of Software imputation program specifies type of model the
input covariance matrix conditions under which the
FRITZ is written in the SAS language version variable should beimputed and so forth
6.03 and makes extensive use of the SAS MACRO
language to create subroutine structure The entire The larger program is constructed as series of
model comprises about 100000 lines of code The six large SAS MACROs Each of these modules in
majority of the basic computer code is written in turn creates working dataset containing all variables
PROC IML The advantages of SAS are that it is to be imputed and all condtioning variables needed
known and closely-monitored product with excellent within the module calls large number of smaller
data management facilities Among the important modules for the imputation of individual variables
disadvantages are that it can be slow and there are such as that described above and then stores the
bugs in PROC ilviL in the version of SAS used basic variables that have changed in the main dataset
66
For the interested reader Appendix provides imputation modules for the newly included variables
sketch of how the overall code is arranged More Since the historical variables will only exist for the
detailed information is available from the author upon panel cases problems may arise in the covariance
request estimation similar to those encountered in the first
iteration of the imputations discussed above Alter-
Panel Imputations natively and preferably one could simply treat the
panel variables as missing from the cross-section
The wori reported in this paper is primarily con- cases and proceed as before Unfortunately the very
cemed with the imputation of data for the 1989 SCF large number of variables that would then be miss-
cross-section rather than the panel part of that ing may render such an approach infeasible with
project With the exception of marital and employ- current resources In light of the importance of panel
ment history variables which were constructed from data for research further work in panel imputation
the cjües-willhVe ailihriority inihº SCFpTmject atidi
tions in the survey for the cross-section cases are hope the woit of others
proper subset of the questions asked of the panel
cases In order to expand the basis for covariance
estimation the panel observations have been included SOME RESULTS FROM THE MODELwith the cross-section variables in the imputations
along with dummy variable indicating that case is As noted earlier short of adding up all missing
panel case values equally it is difficult to find universally
applicable single measure of the information missing
Explicit recognition of the longitudinal dimen- due to nonresponse After imputation other metrics
sion of the panel cases increases the complexity of are available One such compelling measure is the
the imputation and editing problem by an order of proportion of dollars imputed forvarious items Table
magnitude Patterns of missing data are even more provides an estimate of the unweighted percentage
complicated when the longitudinal dimension is of dollars that were imputed for selected items for the
added respondent may report one data item in panel and cross-section cases together Weighted
1989 but have refused the same item in 1983 or data percentages might be more informative here but
items may be only partially comparable In sampling weights are at such stage that do not
principle one should use all information in all believe such estimates would be reliable Weighted
periods to model the joint distribution of all variables and unweighted estimates will be provided later for
and impute -- or re-impute -- all data missing in any the panel and cross-section separately
period
An estimated 19 percent of total net worth in the
Panel imputation is an enormously complicated sample was imputed with 4.9 percentage points of
task that grows in complexity with the number of that amount imputed using range information In the
panel observations The amount of time needed case of total income 35.2 percent of dollars were
for modeling and for computation would be ex- imputed with an amazing 30.5 percentage points of
tremely large Moreover degrees of freedom in this amount constrained by range estimates Most of
modeling would quickly become very limited The the other figures reported lie somewhere between
strategy expect to follow is compromise vector these cases
of key panel financial and other variables wifi be
created along with indicators of the degree of Table also displays the coefficient of variation
missingness for each variable If the amount of due to imputation for components of household net
missing information exceeds certain percent worth and other variables based on data from the
variable will betreated as missing single pass will second iteration of FRITZ As might be expected
then be made through the data augmenting the sets of the model performs better in terms of predicting
conditioning variables used for cross-section impu- higher-order aggregates than in terms of individual
tation to include the constructed variables and adding assets For example while the variation for money
67

Table 2.--Proportion of Total Dollar Value Imputed Coefficient of Variation Due to
Imputation Various Items 1989 Survey of Consumer Finances Panel and
Cross-Section Unweighted
Proportion of Proportion of Coefficierit of
Item total dollar dollar value variation due
imputed using imputed without to imputation
range information range information
Checking accounts 3.1 11.8 0.039
IRA and Keogh accounts 10.9 4.2 0.013
Money market accounts 4.2 16.3 0.076
Savings accounts 3.6 13.8 0.056
Certificates of deposit 5.4 8.0 0.014
Corporate stock 13.2 15.5 0.056
Mutual funds 7.5 15.6 0.087
Savings bonds 3.6 41.7 0.026
Other bonds 3.9 8.3 0.042
Trust assets and annuities 7.5 6.0 0.024
Cash value of life insurance 1.8 19.0 0.033
Notes held 0.8 15.4 0.037
All financial assets 7.1 12.0 0.005
Principal residence 3.3 2.2 0.003
Other real estate 5.5 2.9 0.016
All businesses 22.2 6.3 0.066
Vehicles 2.6 0.3 0.001
Misc assets 9.8 5.0 0.011
Total assets 5.3 12.9 0.005
Credit card debt 6.0 4.2 0.012
Consumer debt 0.1 4.2 0.000
Principal residence mortgage 0.7 6.3 0.002
Other mortgages 4.4 5.8 0.036
Lines of credit outstanding 0.9 3.4 0.007
Misc debt 12.2 7.1 0.028
Total debt 3.8 6.3 0.030
Net worth 4.9 14.1 0.003
Total income 30.5 4.7 00l0
Adjusted gross income 15.6 38.6 0.036
Total inheritances received 6.6 19.5 0.117
Total charitable contributions 4.3 2.6 0.009
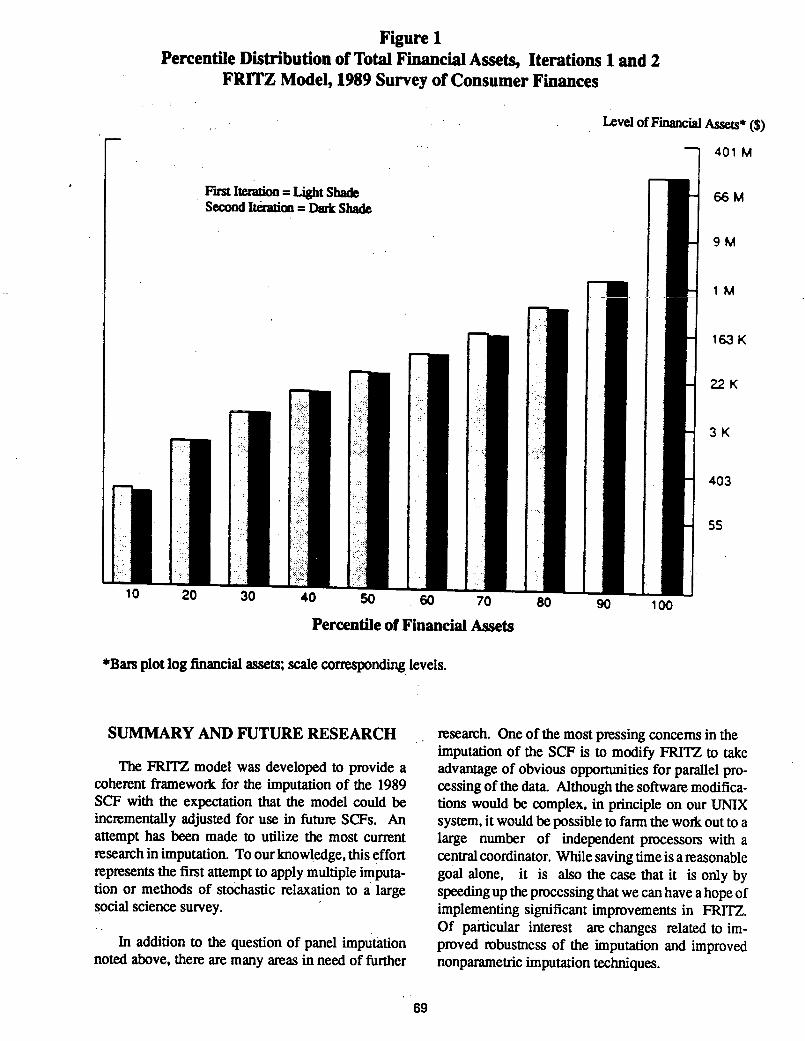
market accounts is 7.6 percent the total variation in FRI1Z However as shown in Figure it does
net worth is only 0.3 percent appear from the data that are currently available that
Because only the first two iterations of the model the difference in the cumulative distribution of net
are currently available it is impossible to say very worth key variable is virtually unchanged
much about the empirical convergence properties of between the first two iterations
68
Figure
Percentile Distribution of Total Fin2ncial Assets Iterations and
FRiTZ Model 1989 Survey of Consumer Finances
Level of Financial Assets
401M
First Iteration Light Shade 66
Second Iteration Dark Shade
9M
1M
163K
rI22K
403
20 30 40 50 60 70 80 90 100
Percentile of Financial Assets
plot log financial assets scale corresponding levels
SUMMARY AND FUTURE RESEARCH research One of the most pressing concerns in the
imputation of the SCF is to modify FRITZ to take
The FRITZ model was developed to provide advantage of obvious opportunities for parallel pro-
coherent framework for the imputation of the 1989 cessing of the data Although the software modifica
SCF with the expectation that the model could be tions would be complex in principle on our UNIX
incrementally adjusted for use in future SCFs An system it would be possible to farm the work out to
attempt has been made to utilize the most current large number of independent processors with
research in imputation To our knowledge this effort central coordinator While saving time is reasonable
represents the first attempt to apply multiple imputa- goal alone it is also the case that it is only by
tion or methods of stoŁhastic relaxation to large speeding up the processing that we can have hope of
social science survey implementing significant improvements in FRITZ
Of particular interest are changes related to imIn addition to the question of panel imputation proved robustness of the imputation and improved
noted above there are many areas in need of further nonparametric imputation techniques
69

Currently the software used for nonparametric lessee or who is otherwise economically domi
imputation is limited in the number of conditioning nant together with the spouse and minor chil
variables that can be used It is possible to trick the dren of that person and any other persons who
software by creating complex index numbers to be are economically dependent on that group
used as conditioning variables The difficulty in brief section of the interview was devoted to
allowing larger number of variables is in devising summary information about other economic
reliable classes of rules for grouping observations to units within the household
create high-dimensional cells with sufficient number
of observations more complete description of the sample de
sign is available in Heennga and Woodbum
At the time this paper was completed only the
first two iterations of FRiTZ were available As we
progress it will be important to study the conver- For example taxable interest income was as
gence propeities of the model If the model con- sumed to be supported by stock of interest-
verges as slowly as Gibbs sampling appears to bearing assets equal to ten times the interest
converge in some application it is unlikely that in income implicitly this assumes rate of return
the near future there will be sufficient computer of ten percent See Heeringa Juster and
power to allow calculation to near neighbothood of Woodbum for more details
convergence related problem is the sensitivity of
the model to starting values Wu has noted It was estimated from the 1983 and 1986 SCFs
that the convergence of EM to global maximum is that about half of one percent of households in
not always guaranteed Since the Gibbs sampling the U.S owns about quarter of total house-
approach is in sense logically subordinate to EM hold net worth The degree of concentration
FRITZ might be expected to have similar problems was even greater for assets such as stocks and
bonds See Avery Elliehausen and Kennickell
Finally we plan to examinehow our estimates and Avery and Kennickell
of imputation variance change as the number of repli- ing 1991
cates increases Because the survey variables have
complicated hierarchical structure it seems plausible Preliminary information on unit nonresponse in
that larger number of replicates might be neces- the 1989 SCF is given in Woodbum
sary to allow the data to express possible variations
in that structure due to imputation However addi- This figure includes both cases from the new
tional replicates are very expensive in terms of time cross-section and from the part of the overlap-
required for imputation amount of storage required ping panel cross-section with cross-section rep-
for the data and time required at the analysis stage resentation
As in many other applied statistical exercises
greater computer power will eventually solve alot of See Woodbum for review of our
problems recent efforts in this direction
For purposes of this count if branch variable
is missing all subsequent variables within the
FOOTNOTES branch arc also taken as missing
This figure is adjusted for cases where the If one looks only at dollar amounts of financial
same figure could be reported in more than one assets checking money maiiet savings and
place other such accounts certificates of deposits
stocks mutual funds bonds and trusts out of
The primary economic unit is defined as the maximum of 136908 data items 3350 are miss-
person within household who holds primary ing the mean number missing per case is 0.9 and
title to the dwelling who is the principalthe median number is zero
70
For discussion of monotonicity and tech- common in the two parts ofthe survey Special
niques for imputation where missing data pat- problems which are noted later in this paper
tems are monotone see Rubin and Little arise when we begin to use prior-wave infonna
tion in the estimation
Fewer than 500 variables were imputed
judginentally One frequent imputation of this See forexample Judge et al p.756 if
type is the case where respondent has
reported an amount of payment or type of As Rod Little has pointed out the discriminate
income but the frequency of that amount is model uses the same set of input statistics as
missing e.g respondents who reports re- the linear probability model but has the ad
ceiving $450 in Social Security payments but vantage that outcomes are contrained to lie be-
reports no time interval oer which thepay- .tween zern-and one n-the-on-going revision
ments are received Almost all other imputa- of the FRITZ model the discriminant function
tions of this sort are similarly obvious approach is being implemented
In fact is not constant for all cases In An efficiently written replicate requires about
particular panel cases were asked different l2OM of disk space
questions in number of areas Allowing for
this distinction would only complicate the no- The main imputation program is discussed fur
tation here ther in Kennickell
In principle the sequencing of the variables for The task is further complicated here by the fact
imputation should not be important Every im- that the data structure of earlier SCFs makes it
putation should be conditioned on every pos- very difficult to identify which values were imsible bit of relevant infomiation Practically puted
this is not possible both because of degrees of
freedom problems and because of the time
required to invert enormous matrices in the BIBLIOGRAPHY
application For example suppose for an
observation that the number of business the Avery Robert Gregory Elliehausen and Arthur
household owns is missing and the only infor- Kennickell Measuring Wealth with
mation known is that for the second business Survey Data An Evaluation of the 1983 Survey
the householdloaned $500000 to the business of Consumer Finances Review of Income and
model could be specified especially for this Wealth Series 34 No.4 December pp 339-
case but that would be quite cumbersome Al- 369
tematively very large model could be built
but that would likely exhaust the degrees of _________ and Arthur Kennickell forth-
freedom It turns out that careful sequencing coming Household Saving in the U.S Review of
of the imputation of variables often allows the Income and Wealth
use of summary variables that appear to be
reasonable proxy for more detailed data e.g _________ and _________ forthcoming
the total amount of money in all checking ac- Changes in the Distribution of Wealth 1983 to
counts instead of the amount in each of as 1986 based on the Surveys of Consumer Fi
many as six accounts nances mimeo Cornell University
See Little Demster A.P N.M Laird and D.B Rubin
Maximum Likelihood From Incomplete Data Via
Both cross-section and panel observations are the EM Algorithm Journal of the Royal Statis
pooled for estimations for variables that are tical Society 5cr 39 pp 1-38
71

Felligi I.P and Holt Systematic Ap- The Theory and Practice of Econometrics New
proach to Automatic Edit and imputation York Wiley
Journal of the Anerican Statistical Association
Vol 71 No 353 pp 17-34 Kennickell Arthur Manual for the
MACRO IMPUTE1 mimeo Board of Gover
Gelfand Alan and Adrian F.M Smith nors of the Federal Reserve System
Sampling-Based Approaches to Calculating Mar
ginal Densities Journal of the Anerican Statisti- Li Kim-Hung imputation Using Markov
cal Association Vol 85 No 410 pp 398-409 Chains Journal of Statistical Computing and
Simulation Vol 30 pp 57-79
Geman Stuart and Donald Geman Stochastic
Relaxation Gibbs Distributions and the Bayesian Little Roderick J.A The Ignorable Case
Restoration of images IEEE Tratsactions on Chapter 21 and The Nonignorable Case
Pattern Analysis and Machine Intelligence Vol Chapter 22 in Incomplete Data in Sample
PAMI-6 No November pp 721-741 Surveys New York Academic Press
Giles Philip Towards the Development of _________ and Donald Rubin Statistical
Generalized Edit and imputation System Pro- Analysis with Missing Data New York Wiley
ceeding of the Third Annual Research Confer
ence Bureau of the Census pp 185-193 Madow William xxx Olin and Donald Rubin
editors Incomplete Data in Sample Sur
Goldberger Arthur Econometric Theory veys New York Academic Press
New York Wiley
Projector Dorothy and Gertrude Weiss
Greenberg and Surdi Flexible and Survey of Financial Characteristics of Consum
Interactive Edit and imputation System Pro- ers Washington Board of Governors of the
ceeding of the Section on Survey Research Meth- Federal Reserve System
ods American Statistical Association pp 421-
436 Rubin Donald Multiple Imputation for
Nonresponse in Surveys Wiley New York
Heeringa Steven and Louise Woodburn
The 1989 Surveys of Consumer Finances __________ EM and Beyond mimeo De
Sample Design Documentation mimeo Survey partment of Statistics Harvard University forth-
Research Center University of Michigan Ann coming in Psychometrica
Arbor
Tanner Martin and Wing Hung Wong
__________ Thomas Juster and Louise The Calculation of Posterior Distributions by
Woodburn The 1989 Survey of Consumer Data Augmentation with comments Journal
Finances Survey Design for Wealth Estima- of the American Statistical Association Vol 82
tion forthcoming in the Review of Income and No 398 pp 52 8-550
Wealth
Woodburn Louise Using Auxiliary
Herzog Thomas and Donald Rubin Infonnation to Investigate Nonresponse Bias
Using Multiple Imputations to Handle paper presented at the annual meetings of the
Nonresponse in Sample Surveys Chapter 15 American Statistical Association Atlanta
in Incomplete Data in Sample Surveys NewYork Academic Press
Wu CF Jeff On the Convergence Proper-
Judge George W.E Griffiths Carter Hill ties of the EM Algorithm Annals of Statistics
Helmut Lutkepohl and Tsoung-Chao Lee Vol 11 No pp 91-103
72

Appendix
Imputation Modules for Amount of Lirectly-Held and Publicly-Traded Stocks
this MACRO defines constraints on the imputation of value of directly-held publicly-traded corporate
stocks
this MACRO and the following one are written in IML code and are called in the processing of the
IMPUTE MACRO below
%MACROTR1ISTK3
defme default bounds
assume have at least$10 in each company where-own stock
LBl0MAXl NCOSTKUB9999999999
use information on amount in margin account legal requirements to set LBIF AMARGLN0 JAMARGLN24 THEN LBAMARGIN4ELSE IF JAMARGIN24 JAMARGIN45 THEN DO
%CARDBBJJAMARGJNUBMUBLBMLB extract information from range card
LBMAXLBMLB4END
use information from range card for stocks
IF JASTK24 JASTK45 THEN DO%CARDBBJJASTKUBSUBLBSLBUBMINUBSUBLBMAXLBSLB
END
use information on amount of stock in place where woik $10/company
WLB0 WUB0IF JASTKWRK24 JASTKWRK45 THEN DO
%CARDBBJJASTKWRKUBWUBLBWLBENDIF WLB0 THEN LBMAXLBWLBMAX0NCOSTKl 10ELSE IF ASTKWRK0 THEN LBMAXLBASTKWRK-i-MAX0NCOSTK- 10IF NCOSTK1 WUB0 THEN UBMINUBWUB
put bounds in log form
UBLOGMAXLB UBLBLOGMAX10LB
%MEND TR1ISTK3
this MACRO sets recodes using imputation of logstock
%MACROTR2ISTK3
compute level value of stock from log
ASTKINTEXPLASTK-i-.5 ....create the level value of stock holdings
73

compute percentage/amount of gain/loss since bought all stock
IF GAINSTK1 PGSTKZ AGSTK.Z THEN AGSTKMAXl INT.5ASTK1 l/l-i-PGSTK/10000
IF GAINSTKl PGSTK.Z AGSTK.Z THEN PGSTKMAX1 INT.5ASTK/ASTK-AGSTK- 10000
IF GAINSTK5 PLSTK.Z ALSTK THEN ALSTKMAX11NT.5ASTKl1/1PLSTK/10000
IF GAINSTK5 PLSTK.Z ALSTK.Z THEN PLSTKMAX1 INTASTK/ASTKALSTK..1 10000
try to compute total financial assets
AFINACHKGAIRAAMMAACDASAVAMUTFASAVBABONDASTKIF AFLN.Z THEN LAFINLOGMAX1AFIN
if only stock in one company and have stock in business where work the value of stock same as value
of stock in business where work
IF NCOSTK1 STKWORK1 THEN DOASTKWRKASTKLASTKWRKLASTK
END
create interaction term from logstock and lognumber brokerage transactions in past year
LNBTSTKLNBRTRALASTK
%MEND TR2ISTK3
this MACRO computes covariance matrix for imputation using standard input set %INCVARS2 and
variables specific to variable -- using only population with stocksfor calculation
%SSCPMISS VAR%INCVARS2 NCSTK GAINSTK LAGSTK LALSTK STKWORKLASTKWRK GAINMF NCMUTF LNBRTRADATAOLDIOUT_TABWHERE%STRDSTOCKl
call to the main imputation MACROspecify continuous variable model dependent variable is log of holdings of corporate stock JASTK is
the name of the shadow variable _TAB contains the covariance matrix estimated above the dataset
containing the values to be imputed is given by NEWI the MACROs TR1ISTK3 and TR2STK3 are
called imputation is restricted to cases that own stock and have current missing value or have
temporary value based on range card TOLER specifies variance decomposition routine in the first
iteration to stabilize the model AUX specifies variables that are needed for the imputation and KEEP
specifies variables to be kept in the working dataset
%IMPUTE1TYPECONTINDEPLASTKMISSJASTKTABLE_TABDATANEWITRANS lTR1ISTK3TRANS2TR2ISTK3WI-IEREVDSTOCK ASTK JASTKWHEREDSTOCK1 ASTK.Z JASTK45TOLERYESAUXSTK WORK NCOSTK JASTK ASTK ACHKG AIRA AMMA ACD ASAVAMUTF LNBRTRA JAFIN ASAVB ABOND ASTKWRK JASTKWRK AMARGINKEEPASTK AFIN LAFIN ASTKWRK LASTKWRK LNBTSTK AGSTK ALSTKPGSTK PLSTK GAINSTK
74

AppendixOverall Organization of FRITZ
Control ifie for FRITZ Federal Reserve Imputation Technique Zeta
Designed and implemented for the 1989 SCFArthur Kennickell
Current version August 1991
set and define all FILENAMES here
FILENAME IMPUTE /mfs/scf2/sc189/pgmfimpute.macro
FILENAME INCOME /mfslscf2/scf89lpgmfincome.r.3
FILENAME RESPROP1 fs/scWscf89/pgnrespropr2
FILENAME 1NST1T1 /mfs/scf2/scf89/pgmftnstitution.r
FILENAME MORTDEB /mfs/scf2/scf89/pgm/mortdeb.rl
FILENAME CONDEB /mfs/scf2/scf89/pgm/condeb.r
FILENAME BUS /mfs/scf2/scf89/pgm/business.r
FILENAME LABOR1 /mfs/scf2/sc189/pgm/labor.r.3
FILENAME DEMOG imfs/scf2/scf89/pgm/demog.r.2
FILENAME SSCP /mfs/scI2Iscf89/pgm/compute.miss.macros .alt
FILENAME CARDB /mfs/sc2/scf89/pgm/cardb.bounds.macm
FILENAME CONVERGE /mfs/scf2/sc189/pgm/convergence.criterion
FILENAME BACKUP /mfslscf2/scf89/pgmIbackup.to.tape
LIBNAME LOUISE /mfs/scfl/sas
LIBNAME LiTTLE /mfs/scf4/Iittle
LIBNAME RUB IN /mfs/scf3/rubin
all include statements here for MACROs%INCLUDE CARDB%INCLUDE SSCP%INCLUDE IMPUTE1%INCLUDE INCOME%INCLUDE RESPROP1%INCLUDE INST1T1
%INCLUDE MORTDEB%INCLUDE CONDEB1%INCLUDE BUS1%INCLUDE LABOR1%INCLUDE DEMOG1%INCLUDE CONVERGE%INCLUDE BACKUP
begin imputation control code
%MACROFRITZ
set-up variables
%LET 1TERNUM1%LET CNVRGNO%LET NOPRINTYES%LETSEEDlllllll%GLOBAL ITERNUM NOPRINT SEED
75

FRITZ1 is always the name of the dataset used to compute the
statistics for imputation
FR1TZ2 is always the name of the dataset that contains the imputed
values
at the 1st iteration the input dataset is the original dataset
and the output dataset is single replicate of the same dataset
%LET FRITZ1%QUOTELOUISE.SCFR%LET FR1TZ2%QUOTERUBIN.SCFR1
begin iteration loop
%DO %UNTIL CNVRG EQ YES OR ITERNUM EQ 100
create new replicates of the original RECODES dataset to contain the imputations
DATA FRITZ2SET LOUISE.SCFR
set number of replicates
%IF ITERNUM1 THEN %LET NREPL1%ELSE %IF ITERNUM2 THEN %LET NREPL3%ELSE %LET NREPL5
alter original ID number Xxi to reflect replicate number
DO 11 TO NREPLxxx 10OUTPUT %QUOTEFRITZ2
END
RUN
invoke the MACROS that contain the imputation modules for each variable
total income for the PEU AGI principal branch variables financial assets
%INCOME1 OLDDATA%STRFRITZ1NEWDATA%STRFRflZ2WGT1
home value vehicles loans made total value of investment properties
%RESPROP1OLDDATA%STRFRflZ1NEWDATA%STRFRITZ2WGT
financial institutional relationships
%1NSTIT1 OLDDATA%STRFR1TZ1NEWDATA%STRFRITZ2WGT1
impute mortgages
%MORTDEB OLDDATA%STRFRITZ1NE WDATA%STRFRITZ2WGT
impute temis of all consumer loans and all non-mortgage loans for home purchase and home
improvement
%CONDEB OLDDATA%STRFRITZ1NE WDATA%STRFRITZ2WGT
businesses credit cards lines of credit misc properties working or not misc attitudinal questions
%BUS1OLDDATA%STRFRflZl NEWDATA%STRFRflZ2WGT
76

impute labor force participation current job pensions and employment history
%LABOR1OLDDATA%STRFRITZ1NEWDATA%STRFRITZ2WGT
current pension/SS other future pensions past settlements inheritances Section demographics
unimputed at this point including non-PEU fmances and misc income etc
%DEMOG1 OLDDATA%STRFRITZ1NE WDATA%STRFRITZ2WGT
determine convergence CNVRGYESINO%CONVERGE
t_ L_j _.._ULU1 -uIciIrsL iteiatioii Oaup-1mpuLU UdL4L irii Ld on Lape
%IF ITERNUM GT %THEN %DO%BACKUPFRITZ1%END
after first iteration delete imputed dataset from previous iteration
%IF ITERNUM GT %THEN %DOPROC DATASETS
DELETE %STRFRITZ1RUN%END
determine location of files for next iteration
%IF %EVALMODITERNUM2 EQ %THEN %DO%LET TAG lRUBIN%LET TAG2LITFLE%END%ELSE %DO%LET TAG lLITTLE%LET TAG2RUBIN%END%LET FRITZ1
%QUOTE%UNQUOTETAG .%QUOTE.%UNQUOTESCFRR%EVALITERNUM%LET FR1TZ2
%QUOTE%UNQUOTETAG2.%QUOTE.%UNQUOTESCFRRITERNIJM
increment iteration number
%LET 1TERNUM%EVAL1TERNUM
%END
%MEND FRiTZ
%FRITZ
77