scenario: m 7.35 saddle mountain fault benton county...
TRANSCRIPT

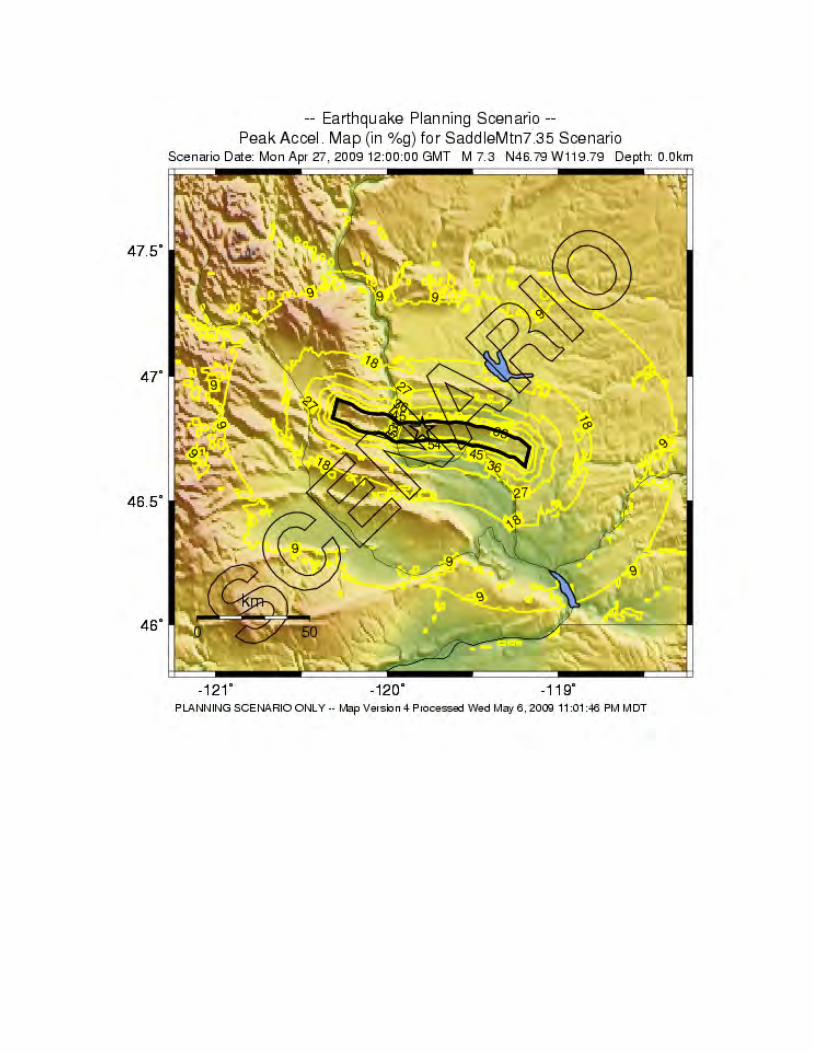
Scenario: M 7.35 Saddle Mountain FaultBenton County
Casualties Summary Report
2:00 AM 2:00 PM 5:00 PM 2:00 AM 2:00 PM 5:00 PM 2:00 AM 2:00 PM 5:00 PM 2:00 AM 2:00 PM 5:00 PM 2:00 AM 2:00 PM 5:00 PMCommuting 0 0 0 0 0 0 0 0 0 0 0 0 0 0 0Commercial 0 14 10 0 1 1 0 0 0 0 0 0 0 15 11Educational 0 3 0 0 0 0 0 0 0 0 0 0 0 3 0
Hotels 0 0 0 0 0 0 0 0 0 0 0 0 0 0 0Industrial 0 2 1 0 0 0 0 0 0 0 0 0 0 2 1
Other-Residential 10 2 4 1 0 0 0 0 0 0 0 0 11 2 4Single Family 2 0 1 0 0 0 0 0 0 0 0 0 2 0 1
Total Benton 12 21 16 1 1 1 0 0 0 0 0 0 13 22 17
Severity Level 1: Injuries will require medical attention but hospitalization is not needed.Severity Level 2: Injuries will require hospitalization but are not considered life-threatening.Severity Level 3: Injuries will require hospitalization and can become life threatening if not promptly treated.Severity Level 4: Victims are killed by the earthquake
Number of Buildings Damaged by General Occupancy Class
None Slight Moderate Extensive Complete TotalAgriculture 258 33 15 1 0 307
Commercial 2121 341 108 5 0 2,575Education 67 8 3 0 0 78
Government 112 35 17 1 0 165Industrial 607 110 46 3 0 766Religion 156 20 7 0 0 183
Other Residential 10410 2,332 1,125 47 0 13,914Single Family 33,988 1,400 46 1 0 35,435
Structural damage states vary by building type. See HAZUS Technical Manual Vol. I. “Complete damage” indicates structural collapse or is in imminent danger of collapse.
Direct Economic Losses For Buildings
Cost Structural Damage
Cost Non-structural Damage
Cost Contents Damage
Inventory Loss
Loss Ratio %
Relocation Loss
Capital Loss Wages Losses
Rental Income Loss
Total Loss
$7,997,000 $43,564,000 $22,889,000 $572,000 0.49 $5,740,000 $2,250,000 $2,781,000 $3,241,000 $89,032,000
Hospital Functionality
Total Number of Beds
Number of Beds % Number of Beds
% Number of Beds
% Number of Beds
% Number of Beds
%
LargeMedium 311 287 92 288 93 310 100 311 100 311 100Small 32 27 86 28 86 32 99 32 100 32 100
Total 343 314 316 342 343 343 Large Hospital: > 150 bedsMedium Hospital: 50-150 bedsSmall Hospital: < 50 beds
Highway Bridge Damage
Total Number of Bridges
None Slight Moderate Extensive Complete
155 153 2 0 0 0
Number of Buildings
Capital Stock Losses Income Losses
Average Number for Damage State
At Day 1
Injury Severity LevelSeverity 1 Severity 2 Severity 3 Severity 4 Total
At day 3 At day 7 At day 30 At day 90
W:\x_wcfs\PROJECTS\FEMA Washington Scenarios\Saddle Mountains Scenario\_benton.xls Page 1

Scenario: M 7.35 Saddle Mountain FaultBenton County
Fire Following Analysis Summary ReportNumber of Ignitions
Population Exposed
Value Exposed
5 381 $20,341,000
Potable Water System Performance
Total Households
Count % Count % Count % Count % Count %58,697 0 0 0 0 0 0 0 0 0 0
Electrical Power System Performance
Total Households
Count % Count % Count % Count % Count %58,697 0 0 0 0 0 0 0 0 0 0
Debris Summary ReportBrick, Wood & Others (tons)
Concrete & Steel (tons)
Total (tons) Number of Truckloads
7,000 10,000 17,000 680
Shelter Summary ReportNumber of Displaced
Households
Number of People Needing
Short Term Shelter
17 10
Essential Facilities FunctionalityCount Functionality
(%)At Day 1
Emergency Operation Center
1 95
Fire Station Facilities
29 94
Police Station Facilities
6 97
School 62 97
Number of Households Without PowerAt day 1 At day 3 At day 7 At day 30 At day 90
At day 3 At day 7 At day 30Number of Households Without Water
At day 1 At day 90
W:\x_wcfs\PROJECTS\FEMA Washington Scenarios\Saddle Mountains Scenario\_benton.xls Page 2

Scenario: M 7.35 Saddle Mountain FaultFranklin County
Casualties Summary Report
2:00 AM 2:00 PM 5:00 PM 2:00 AM 2:00 PM 5:00 PM 2:00 AM 2:00 PM 5:00 PM 2:00 AM 2:00 PM 5:00 PM 2:00 AM 2:00 PM 5:00 PMCommuting 0 0 0 0 0 0 0 0 1 0 0 0 0 0 1Commercial 0 6 5 0 1 0 0 0 0 0 0 0 0 7 5Educational 0 3 0 0 0 0 0 0 0 0 0 0 0 3 0
Hotels 0 0 0 0 0 0 0 0 0 0 0 0 0 0 0Industrial 0 0 0 0 0 0 0 0 0 0 0 0 0 0 0
Other-Residential 14 3 5 1 0 0 0 0 0 0 0 0 15 3 5Single Family 2 0 1 0 0 0 0 0 0 0 0 0 2 0 1
Total Franklin 16 12 11 1 1 0 0 0 1 0 0 0 17 13 12
Severity Level 1: Injuries will require medical attention but hospitalization is not needed.Severity Level 2: Injuries will require hospitalization but are not considered life-threatening.Severity Level 3: Injuries will require hospitalization and can become life threatening if not promptly treated.Severity Level 4: Victims are killed by the earthquake
Number of Buildings Damaged by General Occupancy Class
None Slight Moderate Extensive Complete TotalAgriculture 155 52 43 9 0 259
Commercial 700 182 97 12 0 991Education 29 7 4 0 0 40
Government 24 6 3 0 0 33Industrial 178 48 28 4 0 258Religion 61 13 7 1 0 82
Other Residential 3610 1,357 1,061 160 3 6,191Single Family 8,779 794 56 2 0 9,631
Structural damage states vary by building type. See HAZUS Technical Manual Vol. I. “Complete damage” indicates structural collapse or is in imminent danger of collapse.
Direct Economic Losses For Buildings
Cost Structural Damage
Cost Non-structural Damage
Cost Contents Damage
Inventory Loss
Loss Ratio %
Relocation Loss
Capital Loss Wages Losses Rental Income Loss
Total Loss
$7,136,000 $21,045,000 $10,193,000 $477,000 0.97 $4,408,000 $1,190,000 $1,587,000 $1,757,000 $47,793,000
Hospital Functionality
Total Number of Beds
Number of Beds % Number of Beds
% Number of Beds
% Number of Beds
% Number of Beds
%
LargeMedium 132 96 73 97 74 129 98 132 100 132 100Small
Total 132 96 97 129 132 132 Large Hospital: > 150 bedsMedium Hospital: 50-150 bedsSmall Hospital: < 50 beds
Highway Bridge Damage
Total Number of Bridges
None Slight Moderate Extensive Complete
137 (136*) 123 4 3 3 3* values in parentheses include rounding error.
At day 3 At day 7 At day 30 At day 90
Injury Severity LevelSeverity 1 Severity 2 Severity 3 Severity 4 Total
Number of Buildings
Capital Stock Losses Income Losses
Average Number for Damage State
At Day 1
W:\x_wcfs\PROJECTS\FEMA Washington Scenarios\Saddle Mountains Scenario\_franklin.xls Page 1

Scenario: M 7.35 Saddle Mountain FaultFranklin County
Fire Following Analysis Summary ReportNumber of Ignitions
Population Exposed
Value Exposed
1 230 $9,496,000
Potable Water System Performance
Total Households
Count % Count % Count % Count % Count %18,183 0 0 0 0 0 0 0 0 0 0
Electrical Power System Performance
Total Households
Count % Count % Count % Count % Count %18,183 0 0 0 0 0 0 0 0 0 0
Debris Summary ReportBrick, Wood & Others (tons)
Concrete & Steel (tons)
Total (tons) Number of Truckloads
6,000 9,000 15,000 600
Shelter Summary ReportNumber of Displaced
Households
Number of People Needing
Short Term Shelter
13 13
Essential Facilities FunctionalityCount Functionality (%)
At Day 1Emergency
Operation Center1 97
Fire Station Facilities
17 79
Police Station Facilities
3 92
School 33 90
At day 90At day 3 At day 7 At day 30Number of Households Without Water
At day 1
Number of Households Without PowerAt day 1 At day 3 At day 7 At day 30 At day 90
W:\x_wcfs\PROJECTS\FEMA Washington Scenarios\Saddle Mountains Scenario\_franklin.xls Page 2

Scenario: M 7.35 Saddle Mountain FaultGrant County
Casualties Summary Report
2:00 AM 2:00 PM 5:00 PM 2:00 AM 2:00 PM 5:00 PM 2:00 AM 2:00 PM 5:00 PM 2:00 AM 2:00 PM 5:00 PM 2:00 AM 2:00 PM 5:00 PMCommuting 0 0 1 0 0 1 0 0 2 0 0 0 0 0 4Commercial 0 37 41 0 10 12 0 2 2 0 3 4 0 52 59Educational 0 34 0 0 10 0 0 2 0 0 3 0 0 49 0
Hotels 1 0 0 0 0 0 0 0 0 0 0 0 1 0 0Industrial 0 3 2 0 1 0 0 0 0 0 0 0 0 4 2
Other-Residential 158 33 56 35 7 12 2 0 1 4 1 1 199 41 70Single Family 15 3 6 2 0 1 0 0 0 0 0 0 17 3 7
Total Grant 174 110 106 37 28 26 2 4 5 4 7 5 217 149 142
Severity Level 1: Injuries will require medical attention but hospitalization is not needed.Severity Level 2: Injuries will require hospitalization but are not considered life-threatening.Severity Level 3: Injuries will require hospitalization and can become life threatening if not promptly treated.Severity Level 4: Victims are killed by the earthquake
Number of Buildings Damaged by General Occupancy Class
None Slight Moderate Extensive Complete TotalAgriculture 307 59 56 35 18 475
Commercial 1174 188 109 72 33 1,576Education 48 6 5 4 2 65
Government 45 5 4 5 2 61Industrial 279 50 31 19 10 389Religion 109 13 6 3 1 132
Other Residential 9581 2,266 1,805 1,084 620 15,356Single Family 14,721 1,028 704 89 7 16,549
Structural damage states vary by building type. See HAZUS Technical Manual Vol. I. “Complete damage” indicates structural collapse or is in imminent danger of collapse.
Direct Economic Losses For Buildings
Cost Structural Damage
Cost Non-structural Damage
Cost Contents Damage
Inventory Loss
Loss Ratio %
Relocation Loss
Capital Loss Wages Losses
Rental Income Loss
Total Loss
$40,547,000 $102,081,000 $39,426,000 $2,406,000 3.18 $22,060,000 $7,300,000 $7,311,000 $8,756,000 $229,886,000
Hospital Functionality
Total Number of Beds
Number of Beds % Number of Beds
% Number of Beds
% Number of Beds
% Number of Beds
%
LargeMedium 161 150 93 150 93 160 100 161 100 161 100Small 38 28 73 28 74 37 98 38 100 38 100
Total 199 178 178 197 199 199 Large Hospital: > 150 bedsMedium Hospital: 50-150 bedsSmall Hospital: < 50 beds
Highway Bridge Damage
Total Number of Bridges
None Slight Moderate Extensive Complete
272 256 5 3 3 5
Number of Buildings
Capital Stock Losses Income Losses
Average Number for Damage State
At Day 1
Injury Severity LevelSeverity 1 Severity 2 Severity 3 Severity 4 Total
At day 3 At day 7 At day 30 At day 90
W:\x_wcfs\PROJECTS\FEMA Washington Scenarios\Saddle Mountains Scenario\_grant.xls Page 1

Scenario: M 7.35 Saddle Mountain FaultGrant County
Fire Following Analysis Summary ReportNumber of Ignitions
Population Exposed
Value Exposed
3 57 $3,390,000
Potable Water System Performance
Total Households
Count % Count % Count % Count % Count %27,584 837 3 253 1 0 0 0 0 0 0
Electrical Power System Performance
Total Households
Count % Count % Count % Count % Count %27,581 3,198 12 2,078 8 911 3 184 0.7 4 0
Debris Summary ReportBrick, Wood & Others (tons)
Concrete & Steel (tons)
Total (tons) Number of Truckloads
48,000 80,000 128,000 5,120
Shelter Summary ReportNumber of Displaced
Households
Number of People Needing
Short Term Shelter
131 152
Essential Facilities FunctionalityCount Functionality
(%)At Day 1
Emergency Operation Center
1 97
Fire Station Facilities
52 84
Police Station Facilities
13 86
School 60 83
Number of Households Without PowerAt day 1 At day 3 At day 7 At day 30 At day 90
At day 3 At day 7 At day 30Number of Households Without Water
At day 1 At day 90
W:\x_wcfs\PROJECTS\FEMA Washington Scenarios\Saddle Mountains Scenario\_grant.xls Page 2

Scenario: M 7.35 Saddle Mountain FaultKittitas County
Casualties Summary Report
2:00 AM 2:00 PM 5:00 PM 2:00 AM 2:00 PM 5:00 PM 2:00 AM 2:00 PM 5:00 PM 2:00 AM 2:00 PM 5:00 PM 2:00 AM 2:00 PM 5:00 PMCommuting 0 0 0 0 0 1 0 0 1 0 0 0 0 0 2Commercial 0 10 11 0 2 2 0 0 0 0 1 1 0 13 14Educational 0 6 1 0 1 0 0 0 0 0 0 0 0 7 1
Hotels 0 0 0 0 0 0 0 0 0 0 0 0 0 0 0Industrial 0 2 1 0 0 0 0 0 0 0 0 0 0 2 1
Other-Residential 21 3 8 4 1 1 0 0 0 0 0 0 25 4 9Single Family 6 1 2 1 0 0 0 0 0 0 0 0 7 1 2
Total Kittitas 27 22 23 5 4 4 0 0 1 0 1 1 32 27 29
Severity Level 1: Injuries will require medical attention but hospitalization is not needed.Severity Level 2: Injuries will require hospitalization but are not considered life-threatening.Severity Level 3: Injuries will require hospitalization and can become life threatening if not promptly treated.Severity Level 4: Victims are killed by the earthquake
Number of Buildings Damaged by General Occupancy Class
None Slight Moderate Extensive Complete TotalAgriculture 117 25 27 12 4 185
Commercial 646 131 115 46 12 950Education 17 4 4 2 1 28
Government 25 4 5 2 1 37Industrial 201 33 35 18 6 293Religion 56 9 7 3 1 76
Other Residential 5,262 988 659 342 92 7,343Single Family 8,665 1,172 428 33 4 10,302
Structural damage states vary by building type. See HAZUS Technical Manual Vol. I. “Complete damage” indicates structural collapse or is in imminent danger of collapse.
Direct Economic Losses For Buildings
Cost Structural Damage
Cost Non-structural Damage
Cost Contents Damage
Inventory Loss
Loss Ratio %
Relocation Loss
Capital Loss Wages Losses Rental Income Loss
Total Loss
$12,251,000 $43,983,000 $17,483,000 $622,000 2.14 $8,196,000 $3,333,000 $4,332,000 $3,997,000 $94,197,000
Hospital Functionality
Total Number of Beds
Number of Beds % Number of Beds
% Number of Beds
% Number of Beds
% Number of Beds
%
LargeMediumSmall 25 21 85 21 85 24 97 25 100 25 100
Total 25 21 21 24 25 25 Large Hospital: > 150 bedsMedium Hospital: 50-150 bedsSmall Hospital: < 50 beds
Highway Bridge Damage
Total Number of Bridges
None Slight Moderate Extensive Complete
257 (258*) 234 8 5 8 3* values in parentheses include rounding error.
At day 3 At day 7 At day 30 At day 90
Injury Severity LevelSeverity 1 Severity 2 Severity 3 Severity 4 Total
Number of Buildings
Capital Stock Losses Income Losses
Average Number for Damage State
At Day 1
W:\x_wcfs\PROJECTS\FEMA Washington Scenarios\Saddle Mountains Scenario\_kittitas.xls Page 1

Scenario: M 7.35 Saddle Mountain FaultKittitas County
Fire Following Analysis Summary ReportNumber of Ignitions
Population Exposed
Value Exposed
2 23 $921,000
Potable Water System Performance
Total Households
Count % Count % Count % Count % Count %14,952 696 5 284 2 2 0 0 0 0 0
Electrical Power System Performance
Total Households
Count % Count % Count % Count % Count %14,952 1,184 8 850 6 434 3 104 0.7 1 0
Debris Summary ReportBrick, Wood & Others (tons)
Concrete & Steel (tons)
Total (tons) Number of Truckloads
14,000 21,000 35,000 1,400
Shelter Summary ReportNumber of Displaced
Households
Number of People Needing
Short Term Shelter
100 85
Essential Facilities FunctionalityCount Functionality (%)
At Day 1Emergency
Operation Center2 80
Fire Station Facilities
27 86
Police Station Facilities
5 88
School 18 85
At day 90At day 3 At day 7 At day 30Number of Households Without Water
At day 1
Number of Households Without PowerAt day 1 At day 3 At day 7 At day 30 At day 90
W:\x_wcfs\PROJECTS\FEMA Washington Scenarios\Saddle Mountains Scenario\_kittitas.xls Page 2

Scenario: M 7.35 Saddle Mountain FaultLincoln County
Casualties Summary Report
2:00 AM 2:00 PM 5:00 PM 2:00 AM 2:00 PM 5:00 PM 2:00 AM 2:00 PM 5:00 PM 2:00 AM 2:00 PM 5:00 PM 2:00 AM 2:00 PM 5:00 PMCommuting 0 0 0 0 0 0 0 0 0 0 0 0 0 0 0Commercial 0 0 0 0 0 0 0 0 0 0 0 0 0 0 0Educational 0 0 0 0 0 0 0 0 0 0 0 0 0 0 0
Hotels 0 0 0 0 0 0 0 0 0 0 0 0 0 0 0Industrial 0 0 0 0 0 0 0 0 0 0 0 0 0 0 0
Other-Residential 0 0 0 0 0 0 0 0 0 0 0 0 0 0 0Single Family 0 0 0 0 0 0 0 0 0 0 0 0 0 0 0
Total Lincoln 0 0 0 0 0 0 0 0 0 0 0 0 0 0 0
Severity Level 1: Injuries will require medical attention but hospitalization is not needed.Severity Level 2: Injuries will require hospitalization but are not considered life-threatening.Severity Level 3: Injuries will require hospitalization and can become life threatening if not promptly treated.Severity Level 4: Victims are killed by the earthquake
Number of Buildings Damaged by General Occupancy Class
None Slight Moderate Extensive Complete TotalAgriculture 123 1 0 0 0 124
Commercial 248 2 0 0 0 250Education 15 0 0 0 0 15
Government 19 0 0 0 0 19Industrial 56 0 0 0 0 56Religion 36 0 0 0 0 36
Other Residential 3,618 28 2 0 0 3,648Single Family 3,970 3 0 0 0 3,973
Structural damage states vary by building type. See HAZUS Technical Manual Vol. I. “Complete damage” indicates structural collapse or is in imminent danger of collapse.
Direct Economic Losses For Buildings
Cost Structural Damage
Cost Non-structural Damage
Cost Contents Damage
Inventory Loss
Loss Ratio %
Relocation Loss
Capital Loss Wages Losses
Rental Income Loss
Total Loss
$15,000 $237,000 $176,000 $5,000 0.03 $6,000 $3,000 $5,000 $3,000 $450,000
Hospital Functionality
Total Number of Beds
Number of Beds % Number of Beds
% Number of Beds
% Number of Beds
% Number of Beds
%
LargeMedium 95 95 100 95 100 95 100 95 100 95 100Small 44 44 99 44 99 44 100 44 100 44 100
Total 139 139 139 139 139 139 Large Hospital: > 150 bedsMedium Hospital: 50-150 bedsSmall Hospital: < 50 beds
Highway Bridge Damage
Total Number of Bridges
None Slight Moderate Extensive Complete
181 181 0 0 0 0
At day 3 At day 7 At day 30 At day 90
Injury Severity LevelSeverity 1 Severity 2 Severity 3 Severity 4 Total
Number of Buildings
Capital Stock Losses Income Losses
Average Number for Damage State
At Day 1
W:\x_wcfs\PROJECTS\FEMA Washington Scenarios\Saddle Mountains Scenario\_lincoln.xls Page 1

Scenario: M 7.35 Saddle Mountain FaultLincoln County
Fire Following Analysis Summary ReportNumber of Ignitions
Population Exposed
Value Exposed
0 0 $0
Potable Water System Performance
Total Households
Count % Count % Count % Count % Count %4,276 0 0 0 0 0 0 0 0 0 0
Electrical Power System Performance
Total Households
Count % Count % Count % Count % Count %4,276 0 0 0 0 0 0 0 0 0 0
Debris Summary ReportBrick, Wood & Others (tons)
Concrete & Steel (tons)
Total (tons) Number of Truckloads
0 0 0 0
Shelter Summary ReportNumber of Displaced
Households
Number of People Needing
Short Term Shelter
0 0
Essential Facilities FunctionalityCount Functionality
(%)At Day 1
Emergency Operation Center
1 100
Fire Station Facilities
12 100
Police Station Facilities
4 100
School 16 100
At day 90At day 3 At day 7 At day 30Number of Households Without Water
At day 1
Number of Households Without PowerAt day 1 At day 3 At day 7 At day 30 At day 90
W:\x_wcfs\PROJECTS\FEMA Washington Scenarios\Saddle Mountains Scenario\_lincoln.xls Page 2
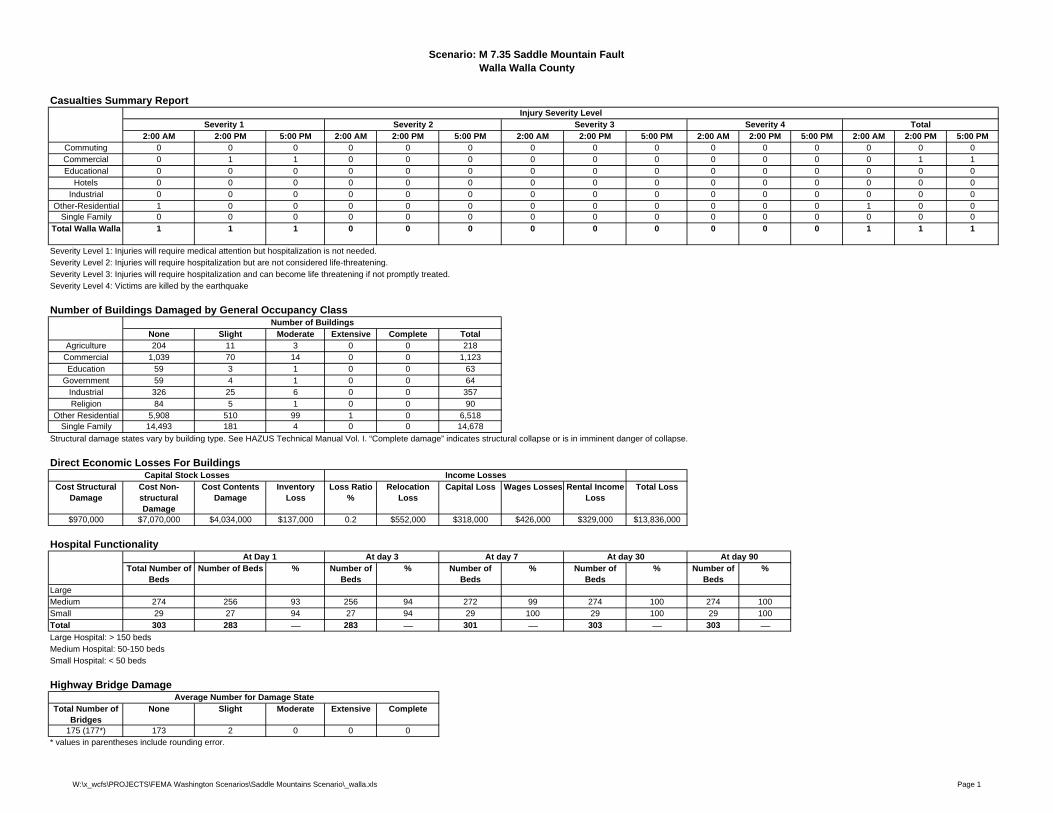
Scenario: M 7.35 Saddle Mountain FaultWalla Walla County
Casualties Summary Report
2:00 AM 2:00 PM 5:00 PM 2:00 AM 2:00 PM 5:00 PM 2:00 AM 2:00 PM 5:00 PM 2:00 AM 2:00 PM 5:00 PM 2:00 AM 2:00 PM 5:00 PMCommuting 0 0 0 0 0 0 0 0 0 0 0 0 0 0 0Commercial 0 1 1 0 0 0 0 0 0 0 0 0 0 1 1Educational 0 0 0 0 0 0 0 0 0 0 0 0 0 0 0
Hotels 0 0 0 0 0 0 0 0 0 0 0 0 0 0 0Industrial 0 0 0 0 0 0 0 0 0 0 0 0 0 0 0
Other-Residential 1 0 0 0 0 0 0 0 0 0 0 0 1 0 0Single Family 0 0 0 0 0 0 0 0 0 0 0 0 0 0 0
Total Walla Walla 1 1 1 0 0 0 0 0 0 0 0 0 1 1 1
Severity Level 1: Injuries will require medical attention but hospitalization is not needed.Severity Level 2: Injuries will require hospitalization but are not considered life-threatening.Severity Level 3: Injuries will require hospitalization and can become life threatening if not promptly treated.Severity Level 4: Victims are killed by the earthquake
Number of Buildings Damaged by General Occupancy Class
None Slight Moderate Extensive Complete TotalAgriculture 204 11 3 0 0 218
Commercial 1,039 70 14 0 0 1,123Education 59 3 1 0 0 63
Government 59 4 1 0 0 64Industrial 326 25 6 0 0 357Religion 84 5 1 0 0 90
Other Residential 5,908 510 99 1 0 6,518Single Family 14,493 181 4 0 0 14,678
Structural damage states vary by building type. See HAZUS Technical Manual Vol. I. “Complete damage” indicates structural collapse or is in imminent danger of collapse.
Direct Economic Losses For Buildings
Cost Structural Damage
Cost Non-structural Damage
Cost Contents Damage
Inventory Loss
Loss Ratio %
Relocation Loss
Capital Loss Wages Losses Rental Income Loss
Total Loss
$970,000 $7,070,000 $4,034,000 $137,000 0.2 $552,000 $318,000 $426,000 $329,000 $13,836,000
Hospital Functionality
Total Number of Beds
Number of Beds % Number of Beds
% Number of Beds
% Number of Beds
% Number of Beds
%
LargeMedium 274 256 93 256 94 272 99 274 100 274 100Small 29 27 94 27 94 29 100 29 100 29 100
Total 303 283 283 301 303 303 Large Hospital: > 150 bedsMedium Hospital: 50-150 bedsSmall Hospital: < 50 beds
Highway Bridge Damage
Total Number of Bridges
None Slight Moderate Extensive Complete
175 (177*) 173 2 0 0 0* values in parentheses include rounding error.
At day 3 At day 7 At day 30 At day 90
Injury Severity LevelSeverity 1 Severity 2 Severity 3 Severity 4 Total
Number of Buildings
Capital Stock Losses Income Losses
Average Number for Damage State
At Day 1
W:\x_wcfs\PROJECTS\FEMA Washington Scenarios\Saddle Mountains Scenario\_walla.xls Page 1

Scenario: M 7.35 Saddle Mountain FaultWalla Walla County
Fire Following Analysis Summary ReportNumber of Ignitions
Population Exposed
Value Exposed
2 63 $3,867,000
Potable Water System Performance
Total Households
Count % Count % Count % Count % Count %20,557 0 0 0 0 0 0 0 0 0 0
Electrical Power System Performance
Total Households
Count % Count % Count % Count % Count %20,557 0 0 0 0 0 0 0 0 0 0
Debris Summary ReportBrick, Wood & Others (tons)
Concrete & Steel (tons)
Total (tons) Number of Truckloads
1,000 1,000 2,000 80
Shelter Summary ReportNumber of Displaced
Households
Number of People Needing
Short Term Shelter
1 0
Essential Facilities FunctionalityCount Functionality (%)
At Day 1Emergency
Operation Center1 99
Fire Station Facilities
18 99
Police Station Facilities
4 99
School 38 99
At day 90At day 3 At day 7 At day 30Number of Households Without Water
At day 1
Number of Households Without PowerAt day 1 At day 3 At day 7 At day 30 At day 90
W:\x_wcfs\PROJECTS\FEMA Washington Scenarios\Saddle Mountains Scenario\_walla.xls Page 2

Scenario: M 7.35 Saddle Mountain FaultYakima County
Casualties Summary Report
2:00 AM 2:00 PM 5:00 PM 2:00 AM 2:00 PM 5:00 PM 2:00 AM 2:00 PM 5:00 PM 2:00 AM 2:00 PM 5:00 PM 2:00 AM 2:00 PM 5:00 PMCommuting 0 0 1 0 0 1 0 0 1 0 0 0 0 0 3Commercial 0 21 16 0 2 2 0 0 0 0 0 0 0 23 18Educational 0 7 0 0 1 0 0 0 0 0 0 0 0 8 0
Hotels 0 0 0 0 0 0 0 0 0 0 0 0 0 0 0Industrial 0 4 2 0 0 0 0 0 0 0 0 0 0 4 2
Other-Residential 27 6 10 3 1 1 0 0 0 0 0 0 30 7 11Single Family 6 1 2 0 0 0 0 0 0 0 0 0 6 1 2
Total Yakima 33 39 31 3 4 4 0 0 1 0 0 0 36 43 36
Severity Level 1: Injuries will require medical attention but hospitalization is not needed.Severity Level 2: Injuries will require hospitalization but are not considered life-threatening.Severity Level 3: Injuries will require hospitalization and can become life threatening if not promptly treated.Severity Level 4: Victims are killed by the earthquake
Number of Buildings Damaged by General Occupancy Class
None Slight Moderate Extensive Complete TotalAgriculture 724 101 51 5 0 881
Commercial 2,947 781 352 29 0 4,109Education 112 21 10 1 0 144
Government 114 31 16 1 0 162Industrial 766 203 112 13 0 1,094Religion 283 56 25 2 0 366
Other Residential 17,629 4,411 2,599 244 4 24,887Single Family 49,920 3,268 142 6 1 53,337
Structural damage states vary by building type. See HAZUS Technical Manual Vol. I. “Complete damage” indicates structural collapse or is in imminent danger of collapse.
Direct Economic Losses For Buildings
Cost Structural Damage
Cost Non-structural Damage
Cost Contents Damage
Inventory Loss
Loss Ratio %
Relocation Loss
Capital Loss Wages Losses Rental Income Loss
Total Loss
$21,793,000 $88,073,000 $45,023,000 $1,741,000 0.81 $14,919,000 $7,852,000 $9,909,000 $7,566,000 $196,876,000
Hospital Functionality
Total Number of Beds
Number of Beds % Number of Beds
% Number of Beds
% Number of Beds
% Number of Beds
%
Large 426 352 83 353 83 419 98 426 100 426 100Medium 63 46 73 46 74 62 98 63 100 63 100Small 38 21 56 22 57 36 95 38 100 38 100
Total 527 419 421 517 527 527 Large Hospital: > 150 bedsMedium Hospital: 50-150 bedsSmall Hospital: < 50 beds
Highway Bridge Damage
Total Number of Bridges
None Slight Moderate Extensive Complete
520 (519*) 504 5 5 5 0* values in parentheses include rounding error.
At day 3 At day 7 At day 30 At day 90
Injury Severity LevelSeverity 1 Severity 2 Severity 3 Severity 4 Total
Number of Buildings
Capital Stock Losses Income Losses
Average Number for Damage State
At Day 1
W:\x_wcfs\PROJECTS\FEMA Washington Scenarios\Saddle Mountains Scenario\_yakima.xls Page 1

Scenario: M 7.35 Saddle Mountain FaultYakima County
Fire Following Analysis Summary ReportNumber of Ignitions
Population Exposed
Value Exposed
7 462 $29,183,000
Potable Water System Performance
Total Households
Count % Count % Count % Count % Count %76,461 0 0 0 0 0 0 0 0 0 0
Electrical Power System Performance
Total Households
Count % Count % Count % Count % Count %76,461 0 0 0 0 0 0 0 0 0 0
Debris Summary ReportBrick, Wood & Others (tons)
Concrete & Steel (tons)
Total (tons) Number of Truckloads
18,000 30,000 48,000 1,920
Shelter Summary ReportNumber of Displaced
Households
Number of People Needing
Short Term Shelter
85 78
Essential Facilities FunctionalityCount Functionality (%)
At Day 1Emergency
Operation Center1 92
Fire Station Facilities
55 92
Police Station Facilities
18 93
School 114 93
At day 90At day 3 At day 7 At day 30Number of Households Without Water
At day 1
Number of Households Without PowerAt day 1 At day 3 At day 7 At day 30 At day 90
W:\x_wcfs\PROJECTS\FEMA Washington Scenarios\Saddle Mountains Scenario\_yakima.xls Page 2

HAZUS-MH: Earthquake Event Report
Region Name:
Earthquake Scenario:
Print Date:
Disclaimer:The estimates of social and economic impacts contained in this report were produced using HAZUS loss estimation methodology software
which is based on current scientific and engineering knowledge. There are uncertainties inherent in any loss estimation technique.
Therefore, there may be significant differences between the modeled results contained in this report and the actual social and economic
losses following a specific earthquake. These results can be improved by using enhanced inventory, geotechnical, and observed ground
motion data.
SadleMtnM735redoOct09
Saddle Mtn redo Oct09
March 10, 2010
Totals only reflect data for those census tracts/blocks included in the user’s study region.

Table of Contents
Section Page #
General Description of the Region
Building and Lifeline Inventory 4
3
Building Inventory
Critical Facility Inventory
Transportation and Utility Lifeline Inventory
Earthquake Scenario Parameters 6
Direct Earthquake Damage 7
Buildings Damage
Critical Facilities Damage
Transportation and Utility Lifeline Damage
Induced Earthquake Damage 11
Fire Following Earthquake
Debris Generation
Social Impact
Shelter Requirements
Casualties
Economic Loss
12
Building Losses
Transportation and Utility Lifeline Losses
Long-term Indirect Economic Impacts
Appendix A: County Listing for the Region
Appendix B: Regional Population and Building Value Data
13
Page 2 of 20Earthquake Event Summary Report

HAZUS is a regional earthquake loss estimation model that was developed by the Federal Emergency Management Agency
and the National Institute of Building Sciences. The primary purpose of HAZUS is to provide a methodology and software
application to develop earthquake losses at a regional scale. These loss estimates would be used primarily by local, state
and regional officials to plan and stimulate efforts to reduce risks from earthquakes and to prepare for emergency response
and recovery.
The earthquake loss estimates provided in this report was based on a region that includes 12 county(ies) from the following
state(s):
General Description of the Region
Washington
Note:
Appendix A contains a complete listing of the counties contained in the region.
The geographical size of the region is 30,351.31 square miles and contains 146 census tracts. There are over 282
thousand households in the region and has a total population of 804,030 people (2005 Census Bureau data). The
distribution of population by State and County is provided in Appendix B.
There are an estimated 324 thousand buildings in the region with a total building replacement value (excluding contents) of
50,352 (millions of dollars). Approximately 92.00 % of the buildings (and 73.00% of the building value) are associated with
residential housing.
The replacement value of the transportation and utility lifeline systems is estimated to be 48,261 and 8,791 (millions of
dollars) , respectively.
Page 3 of 20Earthquake Event Summary Report

HAZUS estimates that there are 324 thousand buildings in the region which have an aggregate total replacement value of
50,352 (millions of dollars) . Appendix B provides a general distribution of the building value by State and County.
Building and Lifeline Inventory
Building Inventory
In terms of building construction types found in the region, wood frame construction makes up 73% of the building inventory.
The remaining percentage is distributed between the other general building types.
Critical Facility Inventory
HAZUS breaks critical facilities into two (2) groups: essential facilities and high potential loss (HPL) facilities. Essential
facilities include hospitals, medical clinics, schools, fire stations, police stations and emergency operations facilities. High
potential loss facilities include dams, levees, military installations, nuclear power plants and hazardous material sites.
For essential facilities, there are 30 hospitals in the region with a total bed capacity of 2,158 beds. There are 462 schools,
304 fire stations, 70 police stations and 13 emergency operation facilities. With respect to HPL facilities, there are 213
dams identified within the region. Of these, 62 of the dams are classified as ‘high hazard’. The inventory also includes 132
hazardous material sites, 0 military installations and 1 nuclear power plants.
Within HAZUS, the lifeline inventory is divided between transportation and utility lifeline systems. There are seven (7)
transportation systems that include highways, railways, light rail, bus, ports, ferry and airports. There are six (6) utility
systems that include potable water, wastewater, natural gas, crude & refined oil, electric power and communications. The
lifeline inventory data are provided in Tables 1 and 2.
The total value of the lifeline inventory is over 57,052.00 (millions of dollars). This inventory includes over 5,059 kilometers
of highways, 2,227 bridges, 160,914 kilometers of pipes.
Transportation and Utility Lifeline Inventory
Page 4 of 20Earthquake Event Summary Report

Table 1: Transportation System Lifeline Inventory
System Component# locations/# Segments
Replacement value(millions of dollars)
Bridges 2,227 17,585.40 Highway
Segments 753 25,897.10
Tunnels 3 7.10
43,489.60 Subtotal
Bridges 44 13.30 Railways
Facilities 19 50.60
Segments 1,098 2,213.40
Tunnels 0 0.00
2,277.20 Subtotal
Bridges 0 0.00 Light Rail
Facilities 0 0.00
Segments 0 0.00
Tunnels 0 0.00
0.00 Subtotal
Facilities 12 14.40 Bus
14.40 Subtotal
Facilities 10 13.30 Ferry
13.30 Subtotal
Facilities 20 39.90 Port
39.90 Subtotal
Facilities 39 415.40 Airport
Runways 53 2,012.10
2,427.50 Subtotal
Total 48,262.00
Page 5 of 20Earthquake Event Summary Report

Table 2: Utility System Lifeline Inventory
System Component# Locations /
Segments
Replacement value(millions of dollars)
Potable Water Distribution Lines 1,609.10 NA
Facilities 256.40 7
Pipelines 0.00 0
Subtotal 1,865.60
Waste Water Distribution Lines 965.50 NA
Facilities 3,296.70 45
Pipelines 0.00 0
Subtotal 4,262.20
Natural Gas Distribution Lines 643.70 NA
Facilities 24.00 20
Pipelines 0.00 0
Subtotal 667.60
Oil Systems Facilities 0.00 0
Pipelines 0.00 0
Subtotal 0.00
Electrical Power Facilities 5,203.00 43
Subtotal 5,203.00
Communication Facilities 11.60 105
Subtotal 11.60
Total 12,009.90
Page 6 of 20Earthquake Event Summary Report

Earthquake Scenario
HAZUS uses the following set of information to define the earthquake parameters used for the earthquake loss estimate
provided in this report.
Scenario Name
Latitude of Epicenter
Earthquake Magnitude
Depth (Km)
Attenuation Function
Type of Earthquake
Fault Name
Historical Epicenter ID #
Longitude of Epicenter
Probabilistic Return Period
Rupture Length (Km)
Rupture Orientation (degrees)
Saddle Mtn redo Oct09
User-defined
NA
NA
NA
NA
NA
7.35
NA
NA
NA
NA
Page 7 of 20Earthquake Event Summary Report
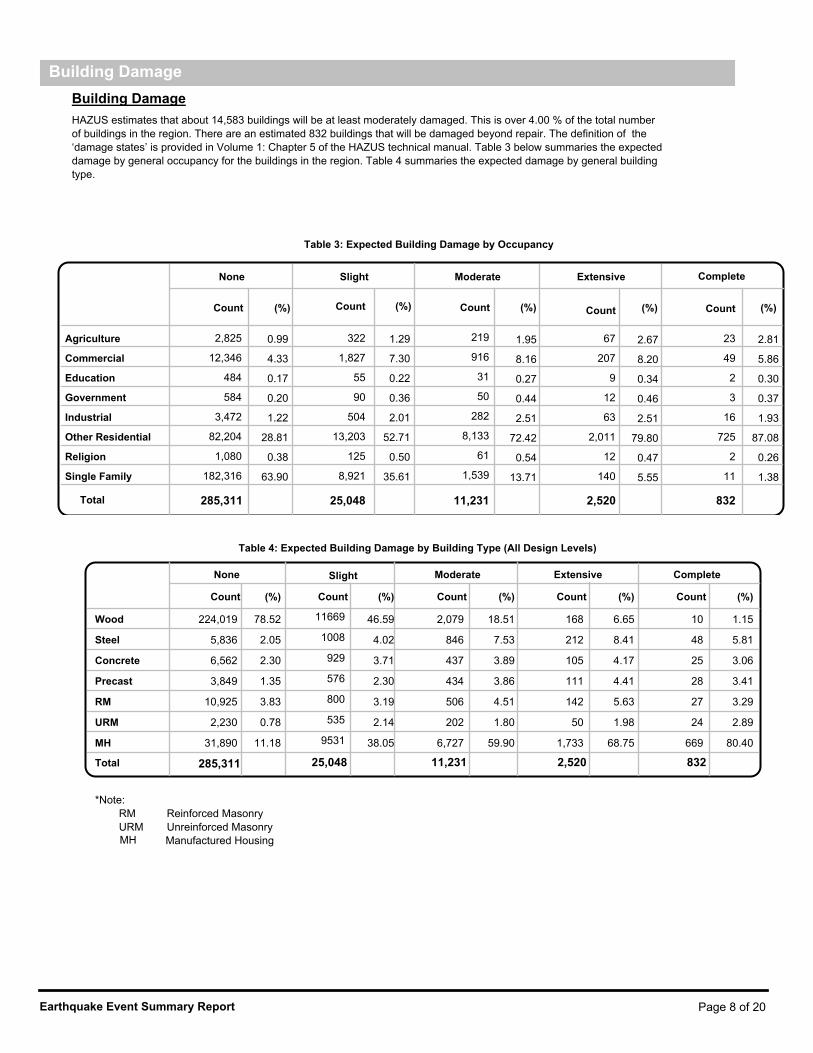
Building Damage
HAZUS estimates that about 14,583 buildings will be at least moderately damaged. This is over 4.00 % of the total number
of buildings in the region. There are an estimated 832 buildings that will be damaged beyond repair. The definition of the
‘damage states’ is provided in Volume 1: Chapter 5 of the HAZUS technical manual. Table 3 below summaries the expected
damage by general occupancy for the buildings in the region. Table 4 summaries the expected damage by general building
type.
Building Damage
Table 3: Expected Building Damage by Occupancy
None Slight
Count (%)Count
Moderate Extensive
(%)Count
Complete
(%) Count Count (%)(%)
Agriculture 2,825 322 2.81 2.67 1.95 1.29 0.99 23 67 219
Commercial 12,346 1,827 5.86 8.20 8.16 7.30 4.33 49 207 916
Education 484 55 0.30 0.34 0.27 0.22 0.17 2 9 31
Government 584 90 0.37 0.46 0.44 0.36 0.20 3 12 50
Industrial 3,472 504 1.93 2.51 2.51 2.01 1.22 16 63 282
Other Residential 82,204 13,203 87.08 79.80 72.42 52.71 28.81 725 2,011 8,133
Religion 1,080 125 0.26 0.47 0.54 0.50 0.38 2 12 61
Single Family 182,316 8,921 1.38 5.55 13.71 35.61 63.90 11 140 1,539
Total 285,311 25,048 11,231 2,520 832
Table 4: Expected Building Damage by Building Type (All Design Levels)
Extensive
Count
Complete
(%)Count(%)Count
Moderate
(%)Count
Slight
(%)Count
None
(%)
Wood 224,019 11669 2,079 168 10 78.52 46.59 18.51 6.65 1.15
Steel 5,836 1008 846 212 48 2.05 4.02 7.53 8.41 5.81
Concrete 6,562 929 437 105 25 2.30 3.71 3.89 4.17 3.06
Precast 3,849 576 434 111 28 1.35 2.30 3.86 4.41 3.41
RM 10,925 800 506 142 27 3.83 3.19 4.51 5.63 3.29
URM 2,230 535 202 50 24 0.78 2.14 1.80 1.98 2.89
MH 31,890 9531 6,727 1,733 669 11.18 38.05 59.90 68.75 80.40
Total
*Note:
RM Reinforced Masonry
URM Unreinforced Masonry
Manufactured HousingMH
25,048 285,311 11,231 2,520 832
Page 8 of 20Earthquake Event Summary Report

Essential Facility Damage
Before the earthquake, the region had 2,158 hospital beds available for use. On the day of the earthquake, the model
estimates that only 1,901 hospital beds (88.00%) are available for use by patients already in the hospital and those injured
by the earthquake. After one week, 97.00% of the beds will be back in service. By 30 days, 100.00% will be operational.
Table 5: Expected Damage to Essential Facilities
Total
Damage > 50%
At Least Moderate
# Facilities
Complete
Damage > 50%
Classification With Functionality
> 50% on day 1
Hospitals 30 1 0 29
Schools 462 7 0 446
EOCs 13 0 0 12
PoliceStations 70 1 0 67
FireStations 304 3 0 293
Page 9 of 20Earthquake Event Summary Report

Transportation and Utility Lifeline Damage
Table 6 provides damage estimates for the transportation system.
Table 6: Expected Damage to the Transportation Systems
Number of Locations
Locations/ With at Least
After Day 7After Day 1
With Functionality > 50 %
Damage
With CompleteSystem Component
Mod. DamageSegments
Highway Segments 753 0 0 753 753
Bridges 2,227 17 6 2,213 2,217
Tunnels 3 0 0 3 3
Railways Segments 1,098 0 0 1,098 1,098
Bridges 44 0 0 44 44
Tunnels 0 0 0 0 0
Facilities 19 0 0 19 19
Light Rail Segments 0 0 0 0 0
Bridges 0 0 0 0 0
Tunnels 0 0 0 0 0
Facilities 0 0 0 0 0
Bus Facilities 12 0 0 12 12
Ferry Facilities 10 0 0 10 10
Port Facilities 20 0 0 20 20
Airport Facilities 39 2 0 39 39
Runways 53 0 0 53 53
Tables 7-9 provide information on the damage to the utility lifeline systems. Table 7 provides damage to the utility system
facilities. Table 8 provides estimates on the number of leaks and breaks by the pipelines of the utility systems. For electric
power and potable water, HAZUS performs a simplified system performance analysis. Table 9 provides a summary of the
system performance information.
Note: Roadway segments, railroad tracks and light rail tracks are assumed to be damaged by ground failure only. If ground
failure maps are not provided, damage estimates to these components will not be computed.
Page 10 of 20Earthquake Event Summary Report
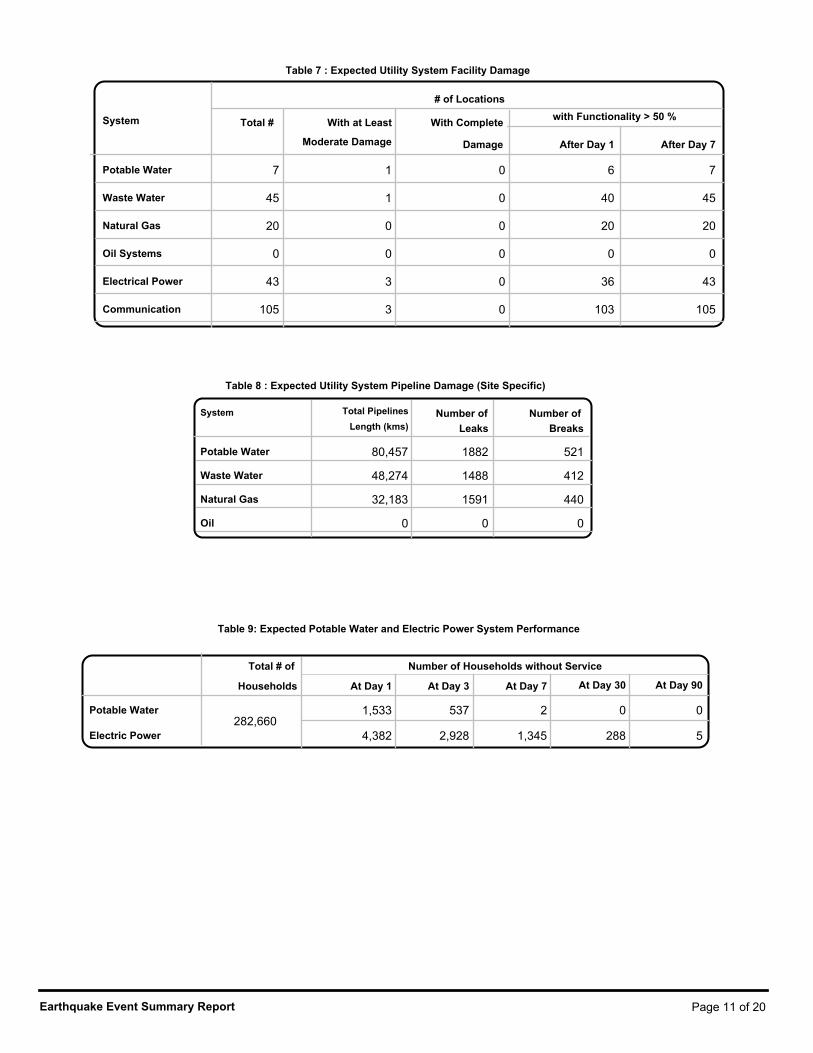
Table 7 : Expected Utility System Facility Damage
With at Leastwith Functionality > 50 %
After Day 7After Day 1
With Complete
Damage
System
# of Locations
Moderate Damage
Total #
Potable Water 7 1 0 6 7
Waste Water 45 1 0 40 45
Natural Gas 20 0 0 20 20
Oil Systems 0 0 0 0 0
Electrical Power 43 3 0 36 43
Communication 105 3 0 103 105
Table 8 : Expected Utility System Pipeline Damage (Site Specific)
System
Breaks
Number of
Leaks
Number ofLength (kms)
Total Pipelines
Potable Water 80,457 1882 521
Waste Water 48,274 1488 412
Natural Gas 32,183 1591 440
Oil 0 0 0
Potable Water
Electric Power
Total # of
Households At Day 3 At Day 7 At Day 30
Number of Households without Service
Table 9: Expected Potable Water and Electric Power System Performance
At Day 90
282,660 1,533 537 2 0 0
4,382 2,928 1,345 288 5
At Day 1
Page 11 of 20Earthquake Event Summary Report

Fire Following Earthquake
Fires often occur after an earthquake. Because of the number of fires and the lack of water to fight the fires, they can often
burn out of control. HAZUS uses a Monte Carlo simulation model to estimate the number of ignitions and the amount of
burnt area. For this scenario, the model estimates that there will be 22 ignitions that will burn about 1.04 sq. mi 0.00 % of
the region’s total area.) The model also estimates that the fires will displace about 1,271 people and burn about 70 (millions
of dollars) of building value.
Debris Generation
HAZUS estimates the amount of debris that will be generated by the earthquake. The model breaks the debris into two
general categories: a) Brick/Wood and b) Reinforced Concrete/Steel. This distinction is made because of the different types
of material handling equipment required to handle the debris.
The model estimates that a total of 0.270 million tons of debris will be generated. Of the total amount, Brick/Wood
comprises 38.00% of the total, with the remainder being Reinforced Concrete/Steel. If the debris tonnage is converted to an
estimated number of truckloads, it will require 10,760,000 truckloads (@25 tons/truck) to remove the debris generated by
the earthquake.
Induced Earthquake Damage
Page 12 of 20Earthquake Event Summary Report

Shelter Requirement
HAZUS estimates the number of households that are expected to be displaced from their homes due to the earthquake and
the number of displaced people that will require accommodations in temporary public shelters. The model estimates 405
households to be displaced due to the earthquake. Of these, 396 people (out of a total population of 804,030) will seek
temporary shelter in public shelters.
Casualties
HAZUS estimates the number of people that will be injured and killed by the earthquake. The casualties are broken down
into four (4) severity levels that describe the extent of the injuries. The levels are described as follows;
· Severity Level 1: Injuries will require medical attention but hospitalization is not needed.
· Severity Level 2: Injuries will require hospitalization but are not considered life-threatening
· Severity Level 3: Injuries will require hospitalization and can become life threatening if not
promptly treated.
· Severity Level 4: Victims are killed by the earthquake.
The casualty estimates are provided for three (3) times of day: 2:00 AM, 2:00 PM and 5:00 PM. These times represent the
periods of the day that different sectors of the community are at their peak occupancy loads. The 2:00 AM estimate
considers that the residential occupancy load is maximum, the 2:00 PM estimate considers that the educational, commercial
and industrial sector loads are maximum and 5:00 PM represents peak commute time.
Table 10 provides a summary of the casualties estimated for this earthquake
Social Impact
Page 13 of 20Earthquake Event Summary Report

Table 10: Casualty Estimates
Level 4Level 3Level 2Level 1
1Commercial 0 0 02 AM
0Commuting 0 0 0
0Educational 0 0 0
1Hotels 0 0 0
2Industrial 0 0 0
242Other-Residential 44 2 4
36Single Family 3 0 0
282 48 3 5Total
97Commercial 18 2 42 PM
0Commuting 0 0 0
56Educational 13 2 4
0Hotels 0 0 0
11Industrial 2 0 0
50Other-Residential 9 1 1
8Single Family 1 0 0
222 42 5 9Total
91Commercial 18 2 55 PM
3Commuting 4 6 1
2Educational 0 0 0
0Hotels 0 0 0
7Industrial 1 0 0
86Other-Residential 16 1 1
13Single Family 1 0 0
203 40 9 8Total
Page 14 of 20Earthquake Event Summary Report

Economic Loss
The total economic loss estimated for the earthquake is 1,332.04 (millions of dollars), which includes building and lifeline
related losses based on the region's available inventory. The following three sections provide more detailed information
about these losses.
Building-Related Losses
The building losses are broken into two categories: direct building losses and business interruption losses. The direct
building losses are the estimated costs to repair or replace the damage caused to the building and its contents. The
business interruption losses are the losses associated with inability to operate a business because of the damage sustained
during the earthquake. Business interruption losses also include the temporary living expenses for those people displaced
from their homes because of the earthquake.
The total building-related losses were 736.06 (millions of dollars); 20 % of the estimated losses were related to the business
interruption of the region. By far, the largest loss was sustained by the residential occupancies which made up over 47 % of
the total loss. Table 11 below provides a summary of the losses associated with the building damage.
Table 11: Building-Related Economic Loss Estimates
(Millions of dollars)
Total OthersIndustrialCommercialOther
Residential
Area Single
Family
Category
Income Loses
Wage 0.00 24.32 1.16 2.68 30.23 2.06
Capital-Related 0.00 22.63 0.69 0.87 25.08 0.89
Rental 2.11 16.12 0.46 1.23 28.42 8.50
Relocation 7.34 22.88 2.47 9.33 61.84 19.82
9.45 Subtotal 31.27 85.95 4.79 14.11 145.57
Capital Stock Loses
Structural 12.83 31.48 6.25 23.04 99.10 25.49
Non_Structural 104.52 84.14 18.92 34.43 333.17 91.16
Content 50.73 45.58 12.29 22.11 151.79 21.08
Inventory 0.00 1.63 2.71 2.10 6.44 0.00
168.07 Subtotal 137.72 162.83 40.18 81.68 590.49
Total 177.52 168.99 248.79 44.97 95.79 736.06
Page 15 of 20Earthquake Event Summary Report

Transportation and Utility Lifeline Losses
For the transportation and utility lifeline systems, HAZUS computes the direct repair cost for each component only. There
are no losses computed by HAZUS for business interruption due to lifeline outages. Tables 12 & 13 provide a detailed
breakdown in the expected lifeline losses.
HAZUS estimates the long-term economic impacts to the region for 15 years after the earthquake. The model quantifies this
information in terms of income and employment changes within the region. Table 14 presents the results of the region for
the given earthquake.
Table 12: Transportation System Economic Losses
(Millions of dollars)
System Loss Ratio (%)Economic LossInventory ValueComponent
Highway Segments 25,897.07 $10.33 0.04
Bridges 17,585.44 $113.81 0.65
Tunnels 7.08 $0.00 0.00
43489.60 Subtotal 124.10
Railways Segments 2,213.38 $0.35 0.02
Bridges 13.27 $0.05 0.36
Tunnels 0.00 $0.00 0.00
Facilities 50.60 $3.76 7.43
2277.20 Subtotal 4.20
Light Rail Segments 0.00 $0.00 0.00
Bridges 0.00 $0.00 0.00
Tunnels 0.00 $0.00 0.00
Facilities 0.00 $0.00 0.00
0.00 Subtotal 0.00
Bus Facilities 14.39 $1.09 7.57
14.40 Subtotal 1.10
Ferry Facilities 13.31 $0.00 0.00
13.30 Subtotal 0.00
Port Facilities 39.94 $2.40 6.01
39.90 Subtotal 2.40
Airport Facilities 415.39 $25.29 6.09
Runways 2,012.09 $0.65 0.03
2427.50 Subtotal 25.90
48262.00 Total 157.70
Page 16 of 20Earthquake Event Summary Report

Table 13: Utility System Economic Losses
(Millions of dollars)
Component Inventory Value Economic LossSystem Loss Ratio (%)
Potable Water 0.00 Pipelines 0.00$0.00
256.40 Facilities 4.44$11.38
1,609.10 Distribution Lines 0.56$8.97
1,865.55 Subtotal $20.35
Waste Water 0.00 Pipelines 0.00$0.00
3,296.70 Facilities 3.60$118.65
965.50 Distribution Lines 0.73$7.09
4,262.19 Subtotal $125.74
Natural Gas 0.00 Pipelines 0.00$0.00
24.00 Facilities 2.02$0.48
643.70 Distribution Lines 1.18$7.58
667.64 Subtotal $8.07
Oil Systems 0.00 Pipelines 0.00$0.00
0.00 Facilities 0.00$0.00
0.00 Subtotal $0.00
Electrical Power 5,203.00 Facilities 5.45$283.70
5,203.00 Subtotal $283.70
Communication 11.60 Facilities 3.37$0.39
11.55 Subtotal $0.39
Total 12,009.93 $438.24
Page 17 of 20Earthquake Event Summary Report

Table 14. Indirect Economic Impact with outside aid(Employment as # of people and Income in millions of $)
LOSS Total %
First Year
Employment Impact 1,298 0.69
Income Impact (1) -0.01
Second Year
Employment Impact 398 0.21
Income Impact (14) -0.17
Third Year
Employment Impact 9 0.00
Income Impact (20) -0.24
Fourth Year
Employment Impact 0 0.00
Income Impact (20) -0.25
Fifth Year
Employment Impact 0 0.00
Income Impact (20) -0.25
Years 6 to 15
Employment Impact 0 0.00
Income Impact (20) -0.25
Page 18 of 20Earthquake Event Summary Report

Adams,WA
Benton,WA
Chelan,WA
Douglas,WA
Ferry,WA
Franklin,WA
Grant,WA
Kittitas,WA
Lincoln,WA
Okanogan,WA
Walla Walla,WA
Yakima,WA
Appendix A: County Listing for the Region
Page 19 of 20Earthquake Event Summary Report
TotalNon-ResidentialResidential
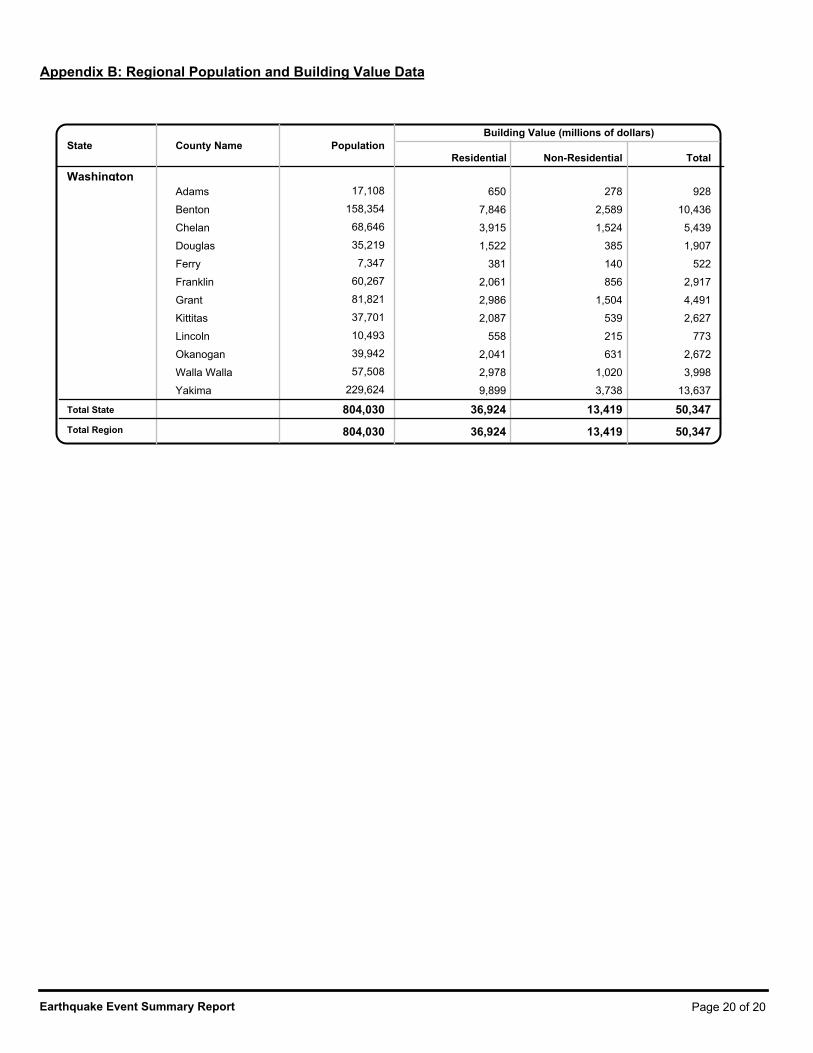
Building Value (millions of dollars)PopulationCounty NameState
Washington
Adams 17,108 650 278 928
Benton 158,354 7,846 2,589 10,436
Chelan 68,646 3,915 1,524 5,439
Douglas 35,219 1,522 385 1,907
Ferry 7,347 381 140 522
Franklin 60,267 2,061 856 2,917
Grant 81,821 2,986 1,504 4,491
Kittitas 37,701 2,087 539 2,627
Lincoln 10,493 558 215 773
Okanogan 39,942 2,041 631 2,672
Walla Walla 57,508 2,978 1,020 3,998
Yakima 229,624 9,899 3,738 13,637
804,030 36,924 13,419 50,347Total State
Total Region 804,030 36,924 13,419 50,347
Appendix B: Regional Population and Building Value Data
Page 20 of 20Earthquake Event Summary Report


���
YAKIMA
GRANT
KITTITAS
BENTON
ADAMS
FRANKLIN
CHELANLINCOLN
WALLA WALLA
DOUGLAS
Saddle Mountain fault
Population Density and Ground Shaking Intensities - Earthquake Scenario: Washington
−
0 5 10 15 20 25 302.5Miles
1-26-10 Fabia Terra, URS Corporation
Population Density
M 7.35 Saddle Mtn.-Hanford
Figure 1
MM Intensity
VI Strong
VII Very Strong
VIII Severe
V Moderate
Counties
IV Light
People
0 - 4
4 - 20
20 - 40
40 - 50
> 50
Sources: 2009 HAZUS runs by URS Corporation, MMI Map USGS 2009Projection: NAD83 Harn State Plane Washington 4602 (feet)
Faultsource

Æq
Æq
Æq
Æq
Æq
Æq
Æq
Æq
ÆqÆq
Æq
Æq
Æq
Æq
Æq
Æq
���90
���395
���82
GRANT
YAKIMA
KITTITAS
ADAMS
BENTON
FRANKLIN
CHELAN LINCOLNDOUGLAS
WALLA WALLA
Injuries (2 pm) and Impaired Hospitals (Day 1) - Earthquake Scenario: Washington
−
0 5 10 15 20 25 302.5
Miles
1-26-10 Fabia Terra, URS Corporation
Impaired Hospitals at Day 1Damage is expressed as the probability that a given hospital will be functional at Day 1.
Æq < 50%Æq 50 - 90%Æq > 90%
Figure 2
1 Dot = 1 Death (Severity Level 4 delineated by census tract)
RoadsInterstate
Highway
Sources: 2009 HAZUS runs by URS Corporation, Highways HSIP Gold 2007Projection: NAD83 Harn State Plane Washington 4602 (feet)
Counties
Faultsource
*Injuries are for Severity 1, 2, & 3
M 7.35 Saddle Mtn.-Hanford
CountyInjuries Requiring
Hospital Treatment (2 PM)*
Fatalities (2 PM)
Adams 17 0Benton 23 0Douglas 1 0Franklin 13 0Grant 144 8Kittitas 28 1Walla Walla 2 0Yakima 47 0Total 275 9

Æq
Æq
Æq
Æq
Æq
Æq
Æq
Æq
ÆqÆq
Æq
Æq
Æq
Æq
Æq
Æq
���90
���395
���82
GRANT
YAKIMA
KITTITAS
BENTON
ADAMS
FRANKLIN
CHELANLINCOLN
DOUGLAS
WALLA WALLA
Impaired Hospitals (Day 1), Hospital Bed Availability, & Bridge Functionality - Earthquake Scenario: Washington
−0 4 8 12 16 20 242
Miles
1-26-10 Fabia Terra, URS Corporation
Highway Bridge Impacts
Impaired Hospitals at Day 1
Bridge Seg.
Æq < 50%Æq 50 - 90%Æq > 90%
high
moderate
low
Damage is expressd as the probability that a given bridge segment will realize at least
moderate damage.
Damage is expressed as the probability that a given hospital will be functional at Day 1.
Figure 3
RoadsInterstate
Highway
Sources: 2009 HAZUS runs by URS Corporation, Highways HSIP Gold 2007Projection: NAD83 Harn State Plane Washington 4602 (feet)
CountiesFault source
M 7.35 Saddle Mtn.-Hanford
CountyTotal #
Hospital Beds
Hospital Beds
Available
Injuries Requiring Hospital
Treatment 2pm
Adams 69 36 17Benton 343 305 23Chelan 284 282 1Franklin 132 96 13Grant 199 166 144Kittitas 25 21 28Walla Walla 303 284 2Yakima 527 371 47Total 1,882 1,561 275

Æq
Æq
Æq
Æq
Æq
Æq
Æq
Æq
ÆqÆq
Æq
Æq
Æq
Æq
Æq
Æq
���90
���395
���82
Distribution of Elderly, Impaired Hospitals (Day 1), & Hospital Bed Availability - Earthquake Scenario: Washington
−0 4 8 12 16 20 242
Miles
1-26-10 Fabia Terra, URS Corporation
Impaired Hospitals at Day 1
1 Dot = 30 People over 65
Æq < 50%Æq 50 - 90%Æq > 90%
NursingHome
!(
Damage is expressed as the probability that a given hospital will be functional at Day 1.
Figure 4
RoadsInterstate
Highway
Sources: 2009 HAZUS runs by URS Corporation, Highways and Nursing homes HSIP Gold 2007Projection: NAD83 Harn State Plane Washington 4602 (feet)
Counties
Faultsource
M 7.35 Saddle Mtn.-Hanford
CountyTotal #
Hospital Beds
Hospital Beds
Available
Injuries Requiring Hospital
Treatment 2pm
Adams 69 36 17Benton 343 305 23Chelan 284 282 1Franklin 132 96 13Grant 199 166 144Kittitas 25 21 28Walla Walla 303 284 2Yakima 527 371 47Total 1,882 1,561 275

���90
���395
���82
GRANT
YAKIMA
KITTITAS
BENTON
ADAMS
FRANKLIN
CHELANLINCOLN
DOUGLAS
WALLA WALLA
Estimated Displaced Households & Short Term Public Shelter Needs - Earthquake Scenario: Washington
−0 4 8 12 16 20 24Miles
1-26-10 Fabia Terra, URS Corporation
1 Dot = 1 Displaced Households*
1 Dot = 1 Public Shelter Needs (Individuals)*
* delineated by census tract
Interstate
HighwayMajor Road
Roads
Figure 5Sources: 2009 HAZUS runs by URS Corporation, Highways HSIP Gold 2007Projection: NAD83 Harn State Plane Washington 4602 (feet)
Counties
Faultsource
M 7.35 Saddle Mtn.-Hanford
Total #Public Shelter
Needs (Individuals)
396
Displaced Households
405

Æq
Æq
Æq
Æq
Æq
Æq
Æq
Æq
ÆqÆq
Æq
Æq
Æq
Æq
Æq
Æq
���82
���395
���90
YAKIMA
GRANT
KITTITAS
BENTON
ADAMS
FRANKLIN
CHELANLINCOLN
DOUGLAS
WALLA WALLA
Injuries (2pm), Collapsed Structures, and Impaired Hospitals - Earthquake Scenario: Washington
−0 4 8 12 16 20 242Miles
1-26-10 Fabia Terra, URS Corporation
Impaired Hospitals (Day1)
1 Dot = 1 Life Threatening Injury (Severtiy Level 3*)
Damage is expressed as the probability that a given hospital willbe functional on Day 1.
*Severity Level 3 is defined as injuries that require hospitalization and can become life threatening if not promptly treated.
Æq < 50%Æq 50 - 90%Æq > 90%
**Totals for counties in view extent.
Figure 6Sources: 2009 HAZUS runs by URS Corporation, Highways HSIP Gold 2007Projection: NAD83 Harn State Plane Washington 4602 (feet)
Counties Faultsource
M 7.35 Saddle Mtn.-Hanford
Structure Type Red (Complete)Collapse Rates for Complete
DamageTotal Collapse
Wood 10 3% 0Steel 48 6% 3Concrete 25 10% 3Precast 28 13% 4Reinforced Masonry
27 10%3
Unreinforced Masonry
24 15%4
Manufactured Housing
669 3% 20Total 831 36
Requiring Hospital Treatment**
Immediate Life Threatening Injuries**
275 10

!(
!(
!(
!(
!(
!(
!(
!(
!(
!(
!(
!(
!(
!(
!(
!(
!(
!(
!(!(
!(
!(
!(
!(!(
!(
!(
!(!(
!(
!(
!(!(
!(
!(!(
!(
!(
!(
!(
!(
!(
!(
!(
!(!(
!(
!(
!(
!(
!( !(
!(
!(
!(
!(
!(
!(
!(
!(
!(
!(
!(
!(
!(
!(
!(
!(
!(
!(
!(
!(
!(
!(
!(
!(
!(
!(
!(!(
!(!(
!(
!(
!(
!(
!(
!(
!(
!(
!(
!(
!(!(
!(
!( !(
!(
!(
!(!(!(
!(
!(
!(
!(
!(
!(
!(
!(
!(
!(!(
!(
!(
!(
!(
!(
!(
!(
!(
!(
!(
!(
!(!(
!(
!(
!(
!(
!(
!(
!(
!(
GRANT
YAKIMA
KITTITAS
BENTON
ADAMS
FRANKLIN
CHELAN LINCOLN
WALLA WALLA
DOUGLAS
Power Lines and Facilities, Households Without Electricity, and Ground Shaking Intensities - Earthquake Scenario: Washington
−0 5 10 15 20 25 302.5
Miles1-26-10 Fabia Terra, URS Corporation
Power Lines
!( Power Facilities
Figure 7
MM Intensity
VI Strong
VII Very Strong
VIII Severe
V Moderate
IV Light
Sources: 2009 HAZUS runs by URS Corporation, Power lines and facilities HSIP Gold 2007Projection: NAD83 Harn State Plane Washington 4602 (feet)
Counties
Faultsource
M 7.35 Saddle Mtn.-Hanford
Number of Households without ElectricityGrant 3,198Kittitas 1,184

GRANT
YAKIMA
KITTITAS
BENTON
ADAMS
FRANKLIN
CHELANLINCOLN
DOUGLAS
WALLA WALLA
Estimated Building Inspection Needs - Earthquake Scenario: Washington
−1-26-10 Fabia Terra, URS Corporation
Red Tag (Complete Damage)Yellow Tag (Extensive Damage)Blue Tag (Slight/Moderate Damage)
*Estimated number of inspectors needed to complete inspections in 30 days.
1 Dot = 1 building (by census tract)
Figure 8
0 4 8 12 16 20 242Miles
Sources: 2009 HAZUS runs by URS Corporation, Highways HSIP Gold 2007Projection: NAD83 Harn State Plane Washington 4602 (feet)
Counties
Faultsource
M 7.35 Saddle Mtn.-Hanford
Estimated # of Structures
Estimated # of Inspectors Needed
Red (Complete)
832 6
Yellow (Extensive)
2,520 34
Light Blue (Slight/
Moderate)36,282 242
Total 39,634 281

���82
���395
���90GRANT
YAKIMA
KITTITAS
BENTON
ADAMS
FRANKLIN
CHELANLINCOLN
DOUGLAS
WALLA WALLA
Direct Building Economic Loss - Earthquake Scenario: Washington
−0 5 10 15 20 25 30
Miles1-26-10 Fabia Terra, URS Corporation
* All values are millions of dollars
1 Dot = $1,000,000 worth of vulnerable building stock (by census tract)
Figure 9Sources: 2009 HAZUS runs by URS Corporation, Highways HSIP Gold 2007Projection: NAD83 Harn State Plane Washington 4602 (feet)
Faultsource
Counties
M 7.35 Saddle Mtn.-Hanford
County
Cost
Strucutral
Damage
Cost Non-
Structural
Damage
Total Loss
(Including
Contents)
Clallam $8 M $21 M $38 MIsland $8 M $44 M $74 MJefferson $0 M $3 M $6 MKing $0 M $3 M $5 MKitsap $7 M $21 M $38 MMason $41 M $102 M $182 MPierce $12 M $44 M $74 MSan Juan $1 M $7 M $12 MSkagit $22 M $88 M $155 MTotal $99 M $333 M $584 M

�
�
�
�
�
�
�
�
�
�
�
�
���
�
�
YAKIMA
GRANT
KITTITAS
BENTON
ADAMS
FRANKLIN
CHELANLINCOLN
WALLA WALLA
DOUGLAS
Natural Gas, and Oil Facility Damage - Earthquake Scenario: Washington
−0 5 10 15 20 25 30
Miles1-26-10 Fabia Terra, URS Corporation
Damage is expressed as the percentage chance that a given Utility System
will realize at least moderate damage.
Utility Damage (at least moderate)
Natural Gas Facility
� < 20%
� 20% - 60%
� > 60%
Figure 10Sources: 2009 HAZUS runs by URS Corporation, Highways HSIP Gold 2007Projection: NAD83 Harn State Plane Washington 4602 (feet)
Faultsource
Counties
M 7.35 Saddle Mtn.-Hanford
MM Intensity
VI Strong
VII Very Strong
VIII Severe
V Moderate
IV Light

+]
+]
+]
+]
+]
+]
+]
+]
+] +]
GRANT
YAKIMA
KITTITAS
BENTON
ADAMS
FRANKLIN
CHELAN DOUGLASLINCOLN
WALLA WALLA
Sewage Treatment Facility Distribution, Households Without Potable Water, and Liquefaction Susceptibility - Earthquake Scenario: Washington
−0 4 8 12 16 20 24Miles
1-26-10 Fabia Terra, URS Corporation
* Based on U.S. Army Corp Mission Guidebook(Daily water is based on an esimated 3 people per household.One truck can transport an esimated 5000 gallons of water.)
Sewage Treatment Facilities
+]
Note: Counties not listed had no potable water losses.
Figure 11
Liquefaction Susceptibility
Low
Low-Moderate
Moderate
High
Sources: 2009 HAZUS runs by URS Corporation, Sewage Treatment Faciiltes HSIP Gold 2007, Liquefaction The Wash State Geological SurveyProjection: NAD83 Harn State Plane Washington 4602 (feet)
Faultsource
Counties
M 7.35 Saddle Mtn.-Hanford
County
# Households without
Potable Water (at Day 1)
Daily Potable Water Needs Per Person
(Gallons/day)*
Number of Truckloads
needed Daily
Grant 837 2,511 1Kittitas 696 2,088 1

���82
���395
���90
YAKIMA
GRANT
KITTITAS
BENTON
ADAMS
FRANKLIN
CHELANLINCOLN
DOUGLAS
WALLA WALLA
Estimated Highway Bridge Damage - Earthquake Scenario: Washington
−
0 5 10 15 20 25 30
Miles
1-26-10 Fabia Terra, URS Corporation
Damage is expressed as the probability that a given Bridge
will realize at least moderate damage.
Major Roadway Bridge
* 2 engineers can inspect 5 bridges a day for 3 days
Highway Bridge Impacts
low
moderate
high
Figure 12
RoadsInterstate
Highway
Sources: 2009 HAZUS runs by URS Corporation, Highways HSIP Gold 2007Projection: NAD83 Harn State Plane Washington 4602 (feet)
Faultsource
Counties
M 7.35 Saddle Mtn.-Hanford
County# of Bridges
Needing Inspection
# of Bridge Engineers Needed*
Adams 202 27Benton 155 21Chelan 107 14Douglas 49 7Franklin 137 18Grant 272 36Kittitas 257 34Walla Walla 77 10Yakima 520 69Total 1,776 237

���82
���395
���90
YAKIMA
GRANT
KITTITAS
BENTON
ADAMS
FRANKLIN
CHELANLINCOLN
DOUGLAS
WALLA WALLA
Estimated Brick, Concrete, Steel, and Wood Debris - Earthquake Scenario: Washington
−
0 5 10 15 20 25 30Miles
1-26-10 Fabia Terra, URS Corporation
* Truck loads estimated at 25 tons per truck
1 Dot = 1 thousand tons ofConcrete and Steel Debris*1 Dot = 1 thousand tons ofBrick and Wood Debris**by census tract
Figure 13
RoadsInterstate
Highway
Sources: 2009 HAZUS runs by URS Corporation, Highways HSIP Gold 2007Projection: NAD83 Harn State Plane Washington 4602 (feet)
Faultsource
Counties
M 7.35 Saddle Mtn.-Hanford
CountyBrick and
Wood (tons)
Concrete and Steel
(tons)
Estimated Truck Loads*
Adams 6,000 14,000 800Benton 7,000 10,000 680Franklin 6,000 9,000 600Grant 48,000 80,000 5,120Kitttitas 14,000 21,000 1,400Walla Walla 1,000 1,000 80Yakima 18,000 30,000 1,920Total 100,000 165,000 10,600