scaling up handwashing behavior: findings from the impact
TRANSCRIPT

Scaling Up Handwashing Behavior: Findings from the Impact Evaluation Baseline Survey in Senegal
Alexandra Orsola-Vidal & Ahmad Yusuf
June 2011
The Water and Sanitation Program is a multi-donor partnership administered by the World Bank to support poor people in obtaining affordable, safe, and sustainable access to water and sanitation services.
Global Scaling Up Handwashing Project
WATER AND SANITATION PROGRAM: TECHNICAL PAPER
8154-Cover.pdf i8154-Cover.pdf i 6/28/11 12:49 PM6/28/11 12:49 PM

By Alexandra Orsola-Vidal and Ahmad Yusuf
Global Scaling Up Handwashing is a Water and Sanitation (WSP) project focused
on applying innovative behavior change approaches to improve handwashing
with soap behavior among women of reproductive age (ages 15–49) and primary
school-age children (ages 5–9). It is being implemented by local and national
governments with technical support from WSP in four countries: Peru, Senegal,
Tanzania, and Vietnam. For more information, please visit www.wsp.org/
scalinguphandwashing.
This Technical Paper is one in a series of knowledge products designed to
showcase project fi ndings, assessments, and lessons learned in the Global
Scaling Up Handwashing Project. This paper is conceived as a work in progress
to encourage the exchange of ideas about development issues. For more
information, please email Alexandra Orsola-Vidal at [email protected], or visit
www.wsp.org.
WSP is a multi-donor partnership created in 1978 and administered by the World Bank to support poor people in obtaining affordable, safe, and sustainable access to water, sanitation, and hygiene services. WSP’s donors include Australia, Austria, Canada, Denmark, Finland, France, the Bill & Melinda Gates Foundation, Ireland, Luxembourg, Netherlands, Norway, Sweden, Switzerland, United Kingdom, United States, and the World Bank.
WSP reports are published to communicate the results of WSP’s work to the development community. Some sources cited may be informal documents that are not readily available. The fi ndings, interpretations, and conclusions expressed herein are entirely those of the author and should not be attributed to the World Bank or its affi liated organizations, or to members of the Board of Executive Directors of the World Bank or the governments they represent. The World Bank does not guarantee the accuracy of the data included in this work. The map was produced by the Map Design Unit of the World Bank. The boundaries, colors, denominations, and other information shown on any map in this work do not imply any judgment on the part of the World Bank Group concerning the legal status of any territory, or the endorsement or acceptance of such boundaries.
The material in this publication is copyrighted. Requests for permission to reproduce portions of it should be sent to [email protected]. WSP encourages the dissemination of its work and will normally grant permission promptly. For more information, please visit www.wsp.org.
© 2011 Water and Sanitation Program
8154-Cover.pdf ii8154-Cover.pdf ii 6/28/11 12:50 PM6/28/11 12:50 PM

Scaling Up Handwashing Behavior: Findings from the Impact Evaluation Baseline Survey in Senegal
Alexandra Orsola-Vidal & Ahmad Yusuf
June 2011
Global Scaling Up Handwashing Project
8154-FM.pdf i8154-FM.pdf i 6/28/11 12:47 PM6/28/11 12:47 PM

8154-FM.pdf ii8154-FM.pdf ii 6/28/11 12:47 PM6/28/11 12:47 PM

www.wsp.org iii
As an integral component of the Water and Sanitation Program’s (WSP’s) Global Scaling Up Handwashing Project, a cross–country impact evaluation (IE) study is being conducted in Peru, Senegal, Tanzania, and Vietnam. This study is led by the World Bank’s WSP IE Team.
The World Bank’s Water and Sanitation Program Global Impact Evaluation Team in Washington, D.C., leads the study, with the contribution of WSP teams and consultants in each of the participating countries. The baseline data collec-tion for all countries was conducted during 2008 and 2009, and the reports have undergone several peer review processes.
The project’s Global Impact Evaluation Team oversees the IE design, methodol-ogy, and country teams. It is led by Bertha Briceno (in its early stages, the Global IE was led by Jack Molyneaux), together with Alexandra Orsola-Vidal and Claire Chase. Professor Paul Gertler has provided guidance and advice throughout the project. Global IE experts also include Sebastian Galiani, Jack Colford, Ben Ar-nold, Pavani Ram, Lia Fernald, Patricia Kariger, Paul Wassenich, Mark Sobsey, and Christine Stauber. At the country level, the Senegal Impact Evaluation Team, led by principal and co-principal investigators Lucie Heinzerling and Alexandra Orsola-Vidal, oversaw the in-country design and field activities. Helene Benga provided in-country research and operations assistance and Ahmad Yusuf pro-vided support with the data analysis and write up of this report.
The Senegal impact evaluation has also benefited from continuous support from Eduardo Perez, the global task team leader for the project; Seydou Koita, country task manager for the project in Senegal; Momar Kane, the Monitoring Informa-tion Systems (MIS) officer; and the global technical team comprised of Hnin Hnin Pyne, Jacqueline Devine, Nathaniel Paynter, and WSP support staff. Very special thanks to former Senegal task team leader, Ousseynou Diop (deceased November 2009) for his invaluable guidance and constant support.
The baseline survey was conducted by the Centre de Recherche pour le Dével-oppement Humain (CRDH) in Dakar, with management oversight from director Dr. Salif Ndiaye. A cadre of survey enumerators provided support. Photographs courtesy of Helene Benga and CRDH.
Finally, we wish to express our sincere gratitude to all the survey respondents for their generous donation of time and participation in this study.
Acknowledgements
8154-FM.pdf iii8154-FM.pdf iii 6/28/11 12:47 PM6/28/11 12:47 PM

iv Global Scaling Up Handwashing
• Direct consumer contact events such as road shows, dramas, games, and street parades;
• Interpersonal communication activities conducted at the household level.
One of the handwashing project’s global objectives is to learn about and document the long-term health and wel-fare impacts of the project intervention. To measure the magnitude of these impacts, the project is implementing a randomized-controlled impact evaluation (IE) in each of the four countries to establish causal linkages between the intervention and key outcomes. The IE uses household surveys to gather data on characteristics of the population exposed to the intervention and to track changes in key outcomes that can be causally attributed to the intervention.
Senegal InterventionIn Senegal, the handwashing initiative started in 2003 when the Public-Private Partnership for Handwashing with Soap (PPPHW) was created with technical assistance from the Water and Sanitation Program (WSP). A first set of activities began in 2004 and culminated in 2007 with a 10-month communications campaign. A second phase was initiated in 2008 through WSP’s Global Scaling Up Hand-washing Project and activities were expanded to eight of the country’s then 11 regions, with the objective of reach-ing over 1.5 million mothers with children under the age of five. The final objective is to improve the handwashing with soap practices of over 500,000 mothers and children. The target population includes mothers and other caregiv-ers aged 14 to 49, and children up to 13 years of age living in urban and rural areas.
Methodology and DesignThe impact evaluation study utilizes a series of data collec-tion activities to measure the impacts of the intervention, including baseline and post-intervention household and community surveys and longitudinal monitoring of diar-rhea prevalence. In Senegal, the baseline survey, conducted between June and August 2009, collected information from a representative sample of the target population living in four regions. The survey comprised a total of 110 clusters
BackgroundIn December 2006, in response to the preventable threats posed by poor sanitation and hygiene, the Water and Sanitation Program (WSP) launched Global Scaling Up Handwashing and Global Scaling Up Rural Sanitation1 to improve the health and welfare outcomes for millions of poor people. Local and national governments implement these large-scale projects with technical support from WSP.
Handwashing with soap at critical times—such as after contact with feces and before handling food—has been shown to substantially reduce the incidence of diarrhea. It reduces health risks even when families do not have access to basic sanitation and water supply. Despite this benefit, rates of handwashing with soap at critical times are very low throughout the developing world.
Global Scaling Up Handwashing aims to test whether handwashing with soap behavior can be generated and sustained among the poor and vulnerable using innovative promotional approaches. The goal is to reduce the risk of diarrhea and therefore increase household productivity by stimulating and sustaining the behavior of handwashing with soap at critical times in the lives of 5.4 million people in four countries, Peru, Senegal, Tanzania, and Vietnam, where the project has been implemented to date.
In an effort to induce improved handwashing behavior, the intervention borrows from both commercial and social marketing fields. This entails the design of communications campaigns and messages likely to bring about desired be-havior changes and delivering them strategically so that the target audiences are “surrounded” by handwashing promo-tion via multiple channels, including:
• Mass media at national and local levels, carried on television and radio broadcasts, and billboards;
Executive Summary
1 For more information on Global Scaling Up Handwashing, see www.wsp.org/scalinguphandwashing; for more information on Global Scaling Up Rural Sanitation, see www.wsp.org/scalingupsanitation
8154-FM.pdf iv8154-FM.pdf iv 6/28/11 12:47 PM6/28/11 12:47 PM

Findings from the Impact Evaluation Baseline Survey in Senegal Executive Summary
www.wsp.org v
Handwashing with Soap Handwashing with soap behavior—Nearly all caregivers (97.4%), despite their so-cioeconomic status, reported washing their hands with soap at least once during the past 24 hours when prompted. However, when prompted for the occasions over the past 24 hours during which they washed their hands with soap, less than a quarter reported washing hands with soap at times of fecal contact (20.4% during toilet use and 13.8% clean-ing children’s bottoms), 12.4 percent reported handwash-ing with soap at times of cooking or food preparation, and fewer than 5% did so before feeding a child. Overall, only 37% of the caregivers reported having washed their hands with soap at a critical juncture in the previous day, and poorer households are half as likely to report handwash-ing with soap at critical times as wealthier households. True handwashing behavior with soap at critical junctures, ob-served through structured observations, is three times lower than self-reported rates.
Access to place for handwashing—A designated place for handwashing stocked with soap and water is observed only in a third of the households, and among poorer households a handwashing station with soap and water can be observed only in 12% of the households.
Child Health Diarrhea prevalence—One in 11 children under the age of five had diarrhea symptoms during the two weeks preceding the survey, one in ten during the previous week, and one in seven during the previous 48 hours. Diar-rhea symptoms are less reported among households with a designated place for handwashing with soap and water. When diarrhea prevalence is disaggregated by wealth quin-tiles there seems to be no strong correlation between the two variables. However, diarrhea seems to vary by regions; for instance, diarrhea incidence was reported more than twice as high in Kaolack than in Fatick for all three-recall periods.
Acute lower respiratory infection (ALRI) prevalence—On average, 2.7 percent of children under the age of five presented ALRI symptoms during the previous 14 days preceding the survey, 2.5 percent during the previous week, and 1.8 percent during the previous 48 hours. ALRI preva-lence seems higher among households with a designated place for handwashing with soap and water compared to
and 1,600 households within 88 communes and communau-tés rurales. The survey results offer data on the characteris-tics of household members, access to water, sanitation and handwashing facilities, handwashing behavior, prevalence of child diseases such as diarrhea and respiratory infec-tion, child growth and development, anemia and parasites prevalence.
In addition, community questionnaires were conducted with key informants at the village level in all sample loca-tions to gather information on community access to trans-portation; commerce; health and education facilities; and other relevant infrastructure; contemporaneous health and development interventions; and environmental and health shocks. The main findings of the IE baseline survey in Sen-egal are presented in the next section.
Summary of FindingsHousehold Demographics, Access to Water and Sanita-tion Size, age, education, income—Households average 12.2 members, with 2.7 children under age five. On average, the household head is 50.5; only 27% have attained secondary education and the majority (83 percent) are employed. The average monthly household income per capita is 10,778 CFA (equivalent to US$23).
Access to water supply—On average 70 percent of house-holds have access to improved sources of drinking water. Access to improved water sources among the poorer house-holds decreases to 37 percent; these households rely mainly on unprotected wells for water supply. Access to improved water varies significantly among regions; Fatick seems to be the least privileged of the regions.
Access to sanitation—On average, almost 70 percent of the households have access to improved sanitation, but over 20 percent practice open defecation. Access to improved sanitation varies largely among wealth quintiles. Among the wealthier households access to improved sanitation is 99 percent, and the most common sanitation facility is a flush toilet with septic tank. In contrast, among the poorer households access to improved sanitation is as low as 24 percent, and open defecation is practiced by the majority of households (58 percent). Among the four regions, Fatick also seems to have the lowest access to improved sanitation.
8154-FM.pdf v8154-FM.pdf v 6/28/11 12:47 PM6/28/11 12:47 PM

Findings from the Impact Evaluation Baseline Survey in Senegal Executive Summary
vi Global Scaling Up Handwashing
sample were underweight, 12.7 percent were stunted and 8.9 percent were wasted. Malnourishment rates are lower among households with access to a place for handwash-ing station with soap and water. Among children living in households with a place for handwashing, underweight is about four percentage points lower than those without a designated place (7.6% versus 11.4%); similarly, stunt-ing is over 5 percentage points lower (8.9% versus 14.5%) and wasting almost three percentage points (6.8% versus 9.9%). When data is disaggregated by wealth, the most notable difference among wealth quintiles is for stunting, since the percentage of stunted children in the 1st or 2nd wealth quintiles (18.5% and 15.5%, respectively) is much higher than those in the wealthiest quintile (6.6%).
Growth measures—The survey included baseline growth mea-sures of children under the age of two, including arm and head circumference, weight, and length/height. Anthropometric z-scores were estimated to assess child growth by comparing chil-dren in the sample to the WHO reference population mean and standard deviation, for each of the aforementioned vari-ables. All measures, besides arm and head circumference, were found to be lower on average than the WHO reference popu-lation mean. Children coming from households with a des-ignated place for handwashing, had higher z-scores for most anthropometric measures included in the analysis. Wealth is particularly correlated with weight-for-age and height/length-for-age, and not so much with the other anthropometric measures. When disaggregated by regions, figures do not vary much, but z-scores for five out of the six measures are lower in Kaolack than in the other regions.
Child development— An index of child development was developed for specific skills for age using an adaptation of the Ages and Stages Questionnaire, and included three do-mains: communication, social-personal and gross motor skills. For every type of skill a higher degree of development was systematically observed in those children that come from households with a designated place for handwashing with soap and water. When compared across the different wealth groups, the findings show a huge increase from the poorest to the wealthiest households; however, there are no uniform patterns between the 2nd to the 4th quintile. When disaggregating the findings by regions, Fatick far ex-ceeds St Louis for all development z-scores.
those without. These findings seem counterintuitive, as one would expect that more hygienic conditions would result in lower prevalence of ALRI. While the latter finding may appear counterintuitive, these differences are not statically different from zero. Surprisingly, ALRI symptoms are also higher among the wealthier quintiles. Regarding regional variation, the highest prevalence is among children living in St Louis for all three-recall periods, while it is lowest for children living in Fatick.
Anemia—The large majority (90.7%) of the samples taken indicated the presence of anemia. Anemia is lower for house-holds with a designated place for handwashing (87.7%) and larger for those without (92.4%). The percentage is also a bit lower among children living in households with access to improved water sources and improved sanitation. Anemia prevalence does not seem to be correlated with wealth, as the lowest rates are observed among the 3rd and 5th quintiles, and the highest rates among the 1st, 2nd and 4th quintiles. Regarding different levels by regions, the percentage of ane-mia prevalence is also highest among children living in Ka-olack and lowest among children living in Thiès.
Parasitical infestations— Stool samples were collected in a subsample of 100 households and tested for parasite preva-lence. The most frequent parasites detected were Giardia and Crystosporidium. Giardia was detected in 11.2 percent of the samples, and Crystosporidium was found in 17.3%. The lowest prevalence of Crystosporidium is found among households with a handwashing station stocked with soap and water (11.1 percent vs. 19.7 percent for those without such facility). However, prevalence of Giardia does not fol-low the same pattern, and findings show higher levels of Giardia prevalence among households with access to im-proved water, improved sanitation, or a handwashing sta-tion with soap and water. Prevalence of parasites does not seem to be strongly correlated with wealth. It is worth not-ing that the sample size for parasite prevalence is very small (stool samples were collected in 99 households only) so not much weight should be allocated to these correlations.
Nutrition and Child Development Nutritional status—The three main nutritional status conditions concerned in anthropometric assessment are underweight, stunting, and wasting. On average, 10.2 percent of the children in the
8154-FM.pdf vi8154-FM.pdf vi 6/28/11 12:47 PM6/28/11 12:47 PM

www.wsp.org vii
ALRI Acute Lower Respiratory InfectionASQ Ages and Stages QuestionnaireBMI Body Mass IndexC Counterfactual or control groupCFA West African CFA FrancCRDH Centre de Recherche pour le Développement HumainDCC Direct Consumer ContactDHS Demographic Health SurveyHb HemoglobinHH(s) Household(s) HW HandwashingIE Impact evaluationIPC Interpersonal CommunicationsMIS Monitoring and Information SystemsNGOs Non-governmental organizationsPPPHW Public-Private Partnership for HandwashingSD Standard deviationSNDHS Senegal Demographic Health SurveyT Treatment USD United States DollarWHO World Health Organization WSP Water and Sanitation Program
Abbreviations and Acronyms
8154-FM.pdf vii8154-FM.pdf vii 6/28/11 12:47 PM6/28/11 12:47 PM

Global Scaling Up Handwashing
Contents I. Overview .................................................................................... 1 1.1 Introduction .......................................................................... 1 1.2 Project Background .............................................................. 2 1.3 Project Components ............................................................ 2 1.4 Objectives of the Study ........................................................ 3 II. Methodology .............................................................................. 4 2.1 Randomization ..................................................................... 4 2.2 Study Design ........................................................................ 4 2.3 Sampling Strategy and Sample Size .................................... 4 2.4 Variables for Data Analysis ................................................... 6 2.5 Instruments for Data Collection ............................................ 6 2.6 Field Protocols ...................................................................... 9 III. Findings ................................................................................... 10 3.1 General Households Characteristics .................................. 10 3.2 Handwashing Behavior ...................................................... 16 3.3 Water Source and Sanitation Facilities ............................... 23 3.4 Diarrhea, Acute Lower Respiratory Infection and
Anemia Prevalence ............................................................. 27 3.5 Child Care Environment ...................................................... 31 3.6 Child Growth and Development Measures ........................ 34 3.7 Parasite Prevalence ............................................................ 41 IV. Conclusion ............................................................................... 45 V. References ............................................................................... 46
Annexes 1: List of Districts Included in WSP Sample ........................ 48 2: Test of Baseline Balance .................................................. 52 3: Sample Representativeness ............................................ 60
Figures 1: Design of Impact Evaluation in Senegal ............................ 6 2: Histograms of Anthropometric Measures ........................ 37 3: Anthropometric Measures by Sex and Months of Age .... 39 4: Histrograms of Child Development Measures ................. 42
8154-FM.pdf viii8154-FM.pdf viii 6/28/11 12:47 PM6/28/11 12:47 PM

www.wsp.org ix
Boxes 1: Health and Welfare Impacts .............................................. 8 2: Handwashing Behavior and Determinants ........................ 8
Tables 1: Summary Statistics ......................................................... 11 2: Percent Distribution of the Basic Socio-Demographic
Characteristics................................................................. 12 3: Percent Distribution of Households Assets and
Non-Labor Income .......................................................... 13 4: Dwelling Characteristics .................................................. 14 5: Dwelling Building Materials ............................................. 14 6: Dwelling Energy Source .................................................. 15 7: Individual’s Work Activity and Wages .............................. 15 8A: Self-Reported Handwashing Behavior with Soap by
Wealth Quintile ................................................................. 16 8B: Self-Reported Handwashing Behavior with Soap by
Region ............................................................................. 17 9A: Observation of Handwashing Station with Soap and
Water by Wealth Quintile ................................................. 18 9B: Observation of Place for Handwashing with Soap and
Water by Region .............................................................. 18 10: Observation of Handwashing Facilities ........................... 19 11: Observation of Handwashing Facility .............................. 20 12A: Observations of Caregivers Hands by Wealth Quintile .... 21 12B: Observations of Caregivers Hands by Region ................ 21 13: Structured Observations of Handwashing Behavior ....... 22 14A: Access to Improved Water Source by Wealth Quintile .... 23 14B: Access to Improved Water Source by Region ................. 23 15: Type of Water Source ....................................................... 24 16A: Access to Improved Sanitation by Wealth Quintile
and Region....................................................................... 25 16B: Access to Improved Sanitation by Wealth Quintile
and Region ...................................................................... 25 17: Household Main Sanitation Facility Characteristics ........ 26 18: Other Characteristics of Households’ Sanitary Condition .. 26 19A: Diarrhea and ALRI Prevalence by Sanitary Conditions ... 27 19B: Diarrhea and ALRI Treatment by Wealth Quintile ............ 28 19C: Diarrhea and ALRI Prevalence by Region ....................... 28 20: Diarrhea and ALRI Treatment by Wealth Quintile ............. 29 21: Household with Lost Hours Due to Child Illness ............. 30
Findings from the Impact Evaluation Baseline Survey in Senegal Contents
8154-FM.pdf ix8154-FM.pdf ix 6/28/11 12:47 PM6/28/11 12:47 PM

x Global Scaling Up Handwashing
22: Anemia Prevalence .......................................................... 30 23: Child Breastfeeding ......................................................... 31 24: Infant/Young Child Feeding ............................................. 32 25: Discipline Measures Towards Infant During Previous ...... 33 26: Infant/Young Child Learning Environment ....................... 33 27: Maternal Depression ........................................................ 34 28: Prevalence of Underweight, Stunting and Wasting ......... 36 29A: Anthropometric Measures by Sanitary Conditions .......... 38 29B: Anthropometric Measures by Wealth Quintile ................. 38 29C: Anthropometric Measures by Region .............................. 38 30A: Child Development by Sanitary Conditions ..................... 41 30B: Child Development by Wealth Quintile ............................ 41 30C: Child Development by Region ......................................... 41 31A: Parasites Prevalence in Stool Samples by Sanitary
Conditions........................................................................ 43 31B: Parasites Prevalence in Stool Samples by Wealth
Quintile ............................................................................. 44 31C: Parasites Prevalence in Stool Samples by Geographic
Area ................................................................................. 44 32: List of Collectivités Locales Selected for Treatment ........ 48 33: List of Commune and Communaute Rurale to
Serve as Control .............................................................. 50 34: Household Demographics, Labor and Education ............ 52 35: Household Assets ............................................................ 53 36: Household Composition .................................................. 53 37: Handwashing Facilities .................................................... 56 38: Handwashing Behavior .................................................... 57 39: ALRI and Diarrhea Prevalence ......................................... 58 40: Child Growth and Anemia ................................................ 58 41: Child Learning Environment ............................................. 59 42: Household Demographics ............................................... 60 43: Dwelling Characteristics, Household Assets and
Access to Water and Sanitation ...................................... 61
Maps 1: Regions Selected for Handwashing Project Impact
Evaluation ........................................................................... 5 2: Localities Selected for Handwashing Project Impact
Evaluation ........................................................................... 7
Findings from the Impact Evaluation Baseline Survey in Senegal Contents
8154-FM.pdf x8154-FM.pdf x 6/28/11 12:47 PM6/28/11 12:47 PM

www.wsp.org 1
1.1 IntroductionIn December 2006, in response to the preventable threats posed by poor sanitation and hygiene, the Water and Sani-tation Program (WSP) launched two large-scale projects, Global Scaling Up Handwashing and Global Scaling Up Rural Sanitation, to improve the health and welfare out-comes for millions of poor people. Local and national governments are implementing these projects with tech-nical support from WSP. The goal of the Global Scaling Up Handwashing project (HWWS) is to reduce the risk of diarrhea and therefore increase household productivity by stimulating and sustaining the behavior of handwashing with soap at critical times for 5.4 million people in Peru, Senegal, Tanzania, and Vietnam.
Handwashing with soap at critical times (such as after con-tact with feces and before handling food) has been shown to substantially reduce the incidence of diarrhea. It reduces health risks even when families do not have access to basic sanitation and water supply service. Despite this benefit, rates of handwashing with soap at critical times are very low throughout the world.
The project aims to test whether this handwashing behav-ior can be improved among the poor and vulnerable using innovative promotional approaches. In addition, it will undertake a structured learning and dissemination process to develop the evidence, practical knowledge, and tools needed to effectively replicate and scale up future hand-washing programs.
WSP’s vision of success is that, at project end, it will have demonstrated that handwashing with soap at scale is one of the most successful and cost-effective interven-tions to improve and protect the health of poor rural and urban families, especially children under age five. The project further seeks to develop the evidence, practical knowledge, and tools for effective replication and scaling up of future handwashing programs, potentially reach-ing more than 250 million people in more than twenty countries by 2020.
OverviewI.The project’s global activities test innovative approaches at scale and have four main objectives:
• Design and support the implementation of innova-tive large-scale, sustainable handwashing programs in four diverse countries (Peru, Senegal, Tanzania, and Vietnam),
• Document and learn about the impact and sustainabil-ity of innovative large-scale handwashing programs,
• Learn about the most effective and sustainable ap-proaches to triggering, scaling up, and sustaining handwashing with soap behaviors, and
• Develop and disseminate evidence-based knowledge products and conduct advocacy to position hand-washing as a global public health priority, leading to the adoption of effective hand-washing programs in additional countries.
The project also aims to complement and improve upon existing hygiene behavior change and handwashing ap-proaches, and to enhance them with novel approaches—including social and commercial marketing—to deliver handwashing with soap messages, along with broad and inclusive partnerships of government, private commercial marketing channels, and concerned consumer groups and non-governmental organizations (NGOs). These innova-tive methods will be combined with proven community-level interpersonal communications and outreach activities, with a focus on sustainability. In addition, the project incorporates a rigorous impact evaluation component to support thoughtful and analytical learning, combined with effective knowledge dissemination and global advocacy strategies.
As reflected above, the process of learning, which is sup-ported in monitoring and evaluation components, is con-sidered critical to the project’s success. As part of these efforts, the project will document the magnitude of health impacts and relevant project costs of the interventions. To measure the magnitude of these impacts, the project imple-mented a randomized-controlled trial impact evaluation
8154-CH01.pdf 18154-CH01.pdf 1 6/28/11 12:42 PM6/28/11 12:42 PM

Findings from the Impact Evaluation Baseline Survey in Senegal Overview
2 Global Scaling Up Handwashing
In Senegal, the project targets mothers/caregivers of school children living in urban and rural areas, and it is aimed at im-proving handwashing with soap practices. In an effort to in-duce improved handwashing behavior, the project developed a research-based behavior change approach, borrowing from both commercial and social marketing fields. This entails the design of communications interventions and messages based on existing data on what is likely to bring about the desired behavior change. The data is derived from formative research and/or literature. The communications interventions are then implemented and delivered strategically so that the tar-get audiences are “surrounded” by handwashing promotion. Some key elements of the intervention include:
• Key behavioral determinants for each target audience,
• Persuasive arguments stating why and how a given concept or trigger will lead to behavior change, and
• Communication ideas to convey the concepts through many integrated activities and communica-tion channels.
1.3 Project Components In Senegal, the handwashing initiative started in 2003, when the Public-Private Partnership for Handwashing with Soap (PPPHW) was created with technical assistance from the Water and Sanitation Program (WSP). Housed initially within the Office Nationale de L’Assainissement, the gov-ernment unit overseeing sanitation within the Ministry of Health, the PPPHW’s main objective was to catalyze and coordinate multi-sectoral involvement in the promotion of handwashing with soap.2
The first phase of activities began in 2004 and culminated in 2007 with a 10-month communications campaign. The campaign included nationally aired television and radio spots, education-entertainment events in market places, and small-group discussions conducted with women’s as-sociations and in the waiting rooms of health centers.3
(IE) of the project in the four countries, using household surveys to measure the levels of key indicators.
This report is part of a series presenting the analysis of base-line data collection surveys conducted in the implementa-tion countries during 2008 and 2009.
Global Scaling Up Project Impact Evaluation Rationale and Aims The overall purpose of the IE is to provide decision mak-ers with a body of rigorous evidence on the effects of the hand-washing and sanitation projects at scale on a set of relevant outcomes. It also aims to generate robust evidence on a cross-country basis, understanding how effects vary according to each country’s programmatic and geographic contexts, and generating knowledge of relevant impacts such as child growth and development, child illness and anemia, and productivity of mothers’ time, among others.
The studies will provide a better understanding of at-scale sanitation and hygiene interventions. The improved evi-dence will support development of large-scale policies and programs, and will inform donors and policy makers on the effectiveness and potential of the Global Scaling Up proj-ects as large-scale interventions to meet global needs.
1.2 Project Background The overall objective of the project is to improve the health of populations at risk of diarrhea and acute lower respira-tory infections (ALRI), especially in children under five years old, through a strategic communications campaign aimed at increasing handwashing with soap behavior at critical times. Children under five represent the age group most susceptible to diarrheal disease and acute respira-tory infections, which are two major causes of childhood morbidity and mortality in less developed countries. These infections, usually transferred from dirty hands to food or water sources, or by direct contact with the mouth, can be prevented if mothers and caregivers wash their hands with soap at critical times (such as before feeding a child, cook-ing or eating, and after using a toilet or being in contact with child’s feces).
2 For more information on the PPPHW, see www.globalhandwashing.org.3 Small-group discussions were conducted in three regions, Thies, Diourbel and
Dakar, and in one department, Velingara.
8154-CH01.pdf 28154-CH01.pdf 2 6/28/11 12:42 PM6/28/11 12:42 PM

Findings from the Impact Evaluation Baseline Survey in Senegal Overview
www.wsp.org 3
A second phase of activities was initiated in 2008 through WSP’s Global Scaling Up Handwashing Project. During this second phase, activities in Senegal were expanded to eight of the country’s then 11 regions4, with the objective of reaching over 1.5 million mothers with children under the age of five through an integrated behavior change approach by the end of 2010.5 The final objective is to improve the handwashing with soap practices of over 500,000 mothers and children. In parallel, efforts were directed at strength-ening the enabling environment to ensure that activities and outcomes would be sustained after project end. The target population for the intervention is mothers and other caregivers age 14 to 49, and children up to 13 years of age living in urban and rural areas.
The impact evaluation aims to evaluate the combination of three different components of Phase 2 activities:
• Component 1—Mass Media CampaignThe mass media campaign is carried out at national (Component 1a) and local levels (Component 1b) and reaches a large number of the target audience. The main means of communication are television, radio broadcast, and mid-sized billboards, as these are useful in conveying the overarching concept of a campaign and providing an umbrella slogan or visu-als for all other channels. The communication mes-sages focus on caregivers’ commitment to promote handwashing behavior with soap among their family members, and to make water and soap available in key locations of the household.
• Component 2—Direct Consumer Contact (DCC)Used by commercial firms in their brand marketing efforts, DCC provides an opportunity to engage and interact with the audiences at the commu-nity level. The objective of this component is to reach mothers, caregivers, and children in public places to stimulate handwashing behavior using an entertainment-education approach. DCC invites
local authorities to participate; events include road shows, dramas, games, and street parades con-ducted in marketplaces and other public spaces in the community.
• Component 3—Interpersonal Communication (IPC)Interpersonal communication is conducted at the household level and focuses on influencing other handwashing determinants such as beliefs or skills for which mass media is less suited. It consists of one-on-one communications with caregivers of chil-dren under five years old and with children between 5 and 13 years of age. It is handled by relays (field-workers) who have previously worked on other pub-lic health issues, and whose main responsibility is to reach and convince caregivers to set up designated areas for handwashing (i.e., handwashing stations) to provide convenient access to soap and water when and where needed.
1.4 Objectives of the Study The objective of the IE is to assess the effects of the hand-washing on individual-level handwashing behavior and practices of caregivers. By introducing exogenous varia-tion in handwashing promotion (through randomized ex-posure to the project), the IE will also address important issues related to the effect of intended behavioral change on child health and development outcomes. In particu-lar, it will provide information on the extent to which improved handwashing behavior alters infant health and welfare.
The IE aims to address the following primary research ques-tions and associated hypotheses:
1. What is the effect of handwashing promotion on handwashing behavior?
2. What is the effect of handwashing promotion on health and welfare?
3. Which promotion strategies are more cost-effective in achieving desired outcomes?
The purpose of this report is to provide baseline informa-tion for the selected indicators and outcomes of interest in-cluded in the survey.
4 At the time of the project design Senegal had eleven regions; three regions were added in September 2008.
5 For more information, see Senegal: A Handwashing Behavior Change Journey, available at www.wsp.org/scalinguphandwashing.
8154-CH01.pdf 38154-CH01.pdf 3 6/28/11 12:42 PM6/28/11 12:42 PM

4 Global Scaling Up Handwashing
2.1 RandomizationTo address the proposed research questions, a proper IE meth-odology is needed to establish the causal linkages between the project and the outcomes of interest. In order to estimate the causal relationship between the project (treatment) and the outcomes of interest, a counterfactual is required—in other words, a comparison group that shows what would have hap-pened to the target group in the absence of the intervention.
Random assignment of treatment, whereby a statistically random selection of communities receives the treatment and the remaining serve as controls, generates a robust counterfactual to measure the causal effect of the interven-tion. The randomization process ensures that on average the treatment and comparison groups are equal in both observed and unobserved characteristics, and that an ap-propriate counterfactual can be measured.6 A randomized experimental evaluation with such a comparison group is valuable because it reduces the possibility that observed changes in outcomes in the intervention group are due to factors external to the intervention.
In the context of this evaluation project intervention, where assessment of implementation spans over a year and a half, it is possible that factors such as weather, macro-economic shocks, or other new and ongoing public health, nutrition, sanita-tion, and hygiene campaigns, for example, could influence the same set of outcomes that are targeted by the project (e.g., diarrhea incidence in young children, health, and welfare). If no control group is maintained and a simple pre- to post-assessment is conducted of the project, the observed changes in outcomes cannot be causally attributed to the intervention.
Random assignment of treatment helps to prevent ad-ditional problems that affect certainty that the observed changes in outcomes are due to the intervention. For in-stance, in many cases, communities chosen for health or
MethodologyII.development programs such as the project are selected pre-cisely due to the high likelihood of their success due to fa-vorable local conditions (strong leadership, existing water and sanitation infrastructure, highly educated population, etc.), and are likely to be systematically different from areas that are less desirable for implementation. If random as-signment is not used, a comparison of treated and untreated areas would confuse the program impact with pre-existing differences between communities, such as different hygiene habits, lower motivation, or other factors that are difficult to observe. This is known as selection bias in economics and confounding bias in the health sciences.7 Random assign-ment of treatment avoids these difficulties, by ensuring that the communities selected to receive the intervention are no different on average than those that are not. A detailed com-parison of means between the treatment and control groups on an exhaustive list of covariates is provided in Annex 1.
2.2 Study Design In order to measure the health and development impacts of the project, the IE utilizes an experimental design with one treatment and one control group, which serves as the coun-terfactual. Treatment consists of all project components: national mass media campaign (Component 1a), local mass media campaign (Component 1b), DCC (Component 2) and IPC activities (Component 3). The control group re-ceives only the national mass media campaign (Component 1a), since it is implemented at the national level. This study design makes it possible to investigate the net impact of Component 1b, 2, and 3, by comparing a treatment group exposed to all components (1a, 1b, 2, and 3) relative to a control group that only receives Component 1a. Both the treatment and control groups comprise a representative sample of the population of households with at least one child under the age of two at baseline.
2.3 Sampling Strategy and Sample Size The primary objective of the project is to improve the health and welfare of young children. Thus, a sufficient sample size (total number of households included in the IE 6 Technically, this is only true with infinite sample sizes, which is unaffordable
and unnecessary. Instead, this study seeks to minimize the risk that the means of the treatment and comparison groups differ significantly. For details of mean comparison tests across treatment and control groups, please see Annex 2: Baseline Balance Comparison of Means Tests. 7 Hernan 2004.
8154-CH02.pdf 48154-CH02.pdf 4 6/28/11 12:42 PM6/28/11 12:42 PM

Findings from the Impact Evaluation Baseline Survey in Senegal Methodology
www.wsp.org 5
was instead discussed and agreed upon by the country imple-mentation team and the survey firm. Although the project comprises eight regions, the IE study includes only four, as it excludes those regions with, or at risk for, a recent episode of cholera.9 The four selected regions for the IE study were Fatick, Kaolack, Saint-Louis, and Thiès (see Map 1).
The methodology to select the sample used a three-stage design.
First, a selection of collectivités locales, including communes and communautés rurales, was drawn from the universe of communes and communautés rurales included in the four se-lected regions. Two collectivités locales—Commune de Thiès and Touba Mosquée—were excluded from the sampling uni-verse due to a population size that was larger than the rest (Touba Mosquée was close to 500,000 residents and Com-mune de Thiès was around 250,000 residents; the popula-tion of the next seven largest cities was between 171,000 and 113,000); from the remaining list the largest 88 col-lectivités locales were randomly selected.
Second, a selection of clusters or Census Districts10 was drawn from the universe of clusters included in the 88 col-lectivités locales randomly selected for the study. Clusters were randomly selected with a probability proportional to the number of clusters in each collectivité locale. A total of 110 clusters were selected, out of which 55 were then ran-domly assigned to the treatment arm and the other 55 to the control group.
Third, a selection of households was randomly drawn among all households within the selected clusters that had at least one child younger than two years of age, and was proportional to the number of households per cluster.
This sample selection process explained above is illustrated in Figure 1. Further details on the selected list of collectivités locales and clusters can be found on Map 2 and in Annex 1.
survey) was calculated to capture a minimum effect size of 20 percent on the key outcome indicator of diarrhea preva-lence among children under two years old at the time of the baseline.8 By focusing on households with children under two at the time of the baseline (i.e. children will be under five by the time of the endline survey), the evaluation aims to capture changes in outcomes for the age range during which children are most sensitive to changes in hygiene behavior. Power calculations indicated that approximately 800 households per treatment arm would need to be sur-veyed in order to capture a 20 percent reduction in diarrhea prevalence, and in order to account for the possibility of household attrition (loss of participants during the imple-mentation of the project) during the project study phase. Therefore, since the evaluation consists of one treatment group and one control group, the total sample incorpo-rates 1,600 households, each of which has at least one child younger than two years of age at the time of the survey.
Households were randomly selected from a total of 110 clus-ters in 88 communes and communautés rurales in four regions of Senegal. The selection of regions was not random, and
9 Cholera-related morbidity, prevention efforts, and transient cholera-related behavior changes would have dominated any intended program impacts, and would not inform the likely handwashing behavior change program effects in a non-cholera endemic setting.
10 In accordance with the definition given by the General Census of the Population and Housing done in 2002.
MAP 1: REGIONS SELECTED FOR HANDWASHING PROJECT IMPACT EVALUATION
Dakar
TAMBACOUNDA
KÉDOUGOU
LOUGA
KAFFRINE
KOLDASÉDHIOUZIGUINCHOR
DAKARTHIÈS DIOURBEL
FATICK
SAINT-LOUIS
MATAM
KA
O
LACK
MAURITANIA
MALI
THEGAMBIA
GUINEA-BISSAUGUINEA
ATLANTICOCEAN
SENEGAL
Selected regions
National capitalRegion boundariesRegions added in 2008Internationalboundaries
0 50
0 25 50 75 Mi.
100 Km.
IBRD 38598JUNE 2011
8 A minimum effect size of 20 percent will allow the identification of a 20 percent reduction in diarrhea prevalence from the baseline level. Therefore, if diarrhea prevalence during the baseline survey is 10 percent, the IE will capture any reductions over two percentage points, i.e., if diarrhea prevalence drops below 8 percent.
8154-CH02.pdf 58154-CH02.pdf 5 6/28/11 12:42 PM6/28/11 12:42 PM

Findings from the Impact Evaluation Baseline Survey in Senegal Methodology
6 Global Scaling Up Handwashing
2.4 Variables for Data Analysis The IE aims to assess both the effect of promotion of hand-washing with soap on handwashing behavior and the ef-fect of the project on infant health and welfare. In order to measure potential impacts of the intervention the study will collect data on diarrhea, productivity, education, nutrition, child growth and development, iron deficiency, environ-mental contamination, parasite prevalence, and handwash-ing behavior and its determinants.
The above variables will be collected through three different surveys: the baseline survey, collected before the intervention and reported on here; the longitudinal surveys, collected a total of three times prior to the intervention and three times after the intervention began; and a post-intervention survey, to be collected after the intervention is complete.
Box 1 and Box 2 summarize the variables measured and how measurements were performed. This sample selection process explained above is illustrated in Figure 1. Further details on the selected list of collectivités locales and clusters can be found on Map 2 and in Annex 1.
2.5 Instruments for Data Collection
The baseline survey was conducted June through August 2009. The expectation was to conduct a total of 1,600 household questionnaires and 110 community question-naires (one per cluster) in 88 collectivités locales. By the end of the survey, data were collected from 1,550 households and 110 clusters within 88 collectivités locales.
The baseline survey included the following instruments:
• Household questionnaire: The household ques-tionnaire was conducted in all 1,550 households in 110 clusters to collect data on household mem-bership, education, labor, income, assets, dwell-ing characteristics, water sources, drinking water, sanitation, observations of handwashing facilities and other dwelling characteristics, handwashing behavior, child discipline, maternal depression, handwashing determinants, exposure to health interventions, relationship between family and school, and mortality.
FIGURE 1: DESIGN OF IMPACT EVALUATION IN SENEGAL
11 Regions(Universe)
4 RegionsFatick, Kaolack, Saint-Louis, and Thiès
88 Communities (CL)
Counterfactual
55 Clusters
Treatment(Components1a, 1b, 2, 3)
800 Households
55 Clusters
Control (Component 1a)
800 Households
8154-CH02.pdf 68154-CH02.pdf 6 6/28/11 12:42 PM6/28/11 12:42 PM

Findings from the Impact Evaluation Baseline Survey in Senegal Methodology
www.wsp.org 7
MAP 2: LOCALITIES SELECTED FOR HANDWASHING PROJECT IMPACT EVALUATION11
Dakar
MAURITANIA
MALI
THEGAMBIA
GUINEA-BISSAU
GUINEA
ATLANTICOCEAN
ATATLALANTNTICICEAANN
DDakar
EBIMBIIABIBIBI
SAINT-LOUIS
THIÈS
FATICK
KAOLACK
IBRD 38599JUNE 2011
National capitalLocal collective boundariesDepartment and arrondissementboundariesRegion boundariesRegions added in 2008International boundaries
Localities selected for treatmentLocalities selected for controlLocalities not included in the sample
0 50
0 25 50 75 Mi.
100 Km.
11 Since the time of the baseline survey, three new regions were created, when on 10 September 2008 Kaffrine region was split from Kaolack, Kédougou region was split from Tambacounda, and Sédhiou region was split from Kolda.
8154-CH02.pdf 78154-CH02.pdf 7 6/28/11 12:42 PM6/28/11 12:42 PM

Findings from the Impact Evaluation Baseline Survey in Senegal Methodology
8 Global Scaling Up Handwashing
• Community questionnaire: The community ques-tionnaire was conducted in 110 clusters, to collect data on: socio-demographics of the community; ac-cessibility and connectivity; education and health facilities; water and sanitation-related facilities and programs; and government assistance or programs related to health, education, cooperatives, agricul-ture, water, and other development schemes.
• Structured observations: Structured observations were conducted in a subsample of 110 households to collect data on direct observation of handwashing behavior.
• Health questionnaire: The health questionnaire was conducted in all 1,550 households in 110 clus-ters to collect data on children’s diarrhea prevalence, acute lower respiratory infection (ALRI) and other health symptoms, child development, child growth, and anemia.
BOX 1: HEALTH AND WELFARE IMPACTS
What Is Measured? How Is It Measured? Measuring Instrument
Diarrhea prevalence Caregiver-reported symptoms collected in
a 14-day health calendar
Household questionnaire
Productivity of mothers’ time Time lost to own and child’s illness Household questionnaire
Education Benefits School enrollment and attendance Household questionnaire
Child growth Anthropometric measures: weight, height/
length, arm and head circumferences12
In household collection of anthropometric
measures
Child development Caregiver reported personal-social, com-
munications, and gross motor skills
Modified Ages & Stages Questionnaire
(ASQ)13
Anemia Hemoglobin concentration (<110g/L per
international standards)14
In household collection and analysis of capil-
lary blood using the HemoCue photometer
Parasite prevalence Parasite prevalence in fecal samples In household collection of samples, and
parasitological analysis in lab
BOX 2: HANDWASHING BEHAVIOR AND DETERMINANTS
What Is Measured? How Is It Measured? Measuring Instrument
Handwashing w/ soap behavior Direct observation of handwashing station
stocked with soap and water
Self-report handwashing with soap behavior
Observed handwashing with soap behavior
Household questionnaire
Household questionnaire
Structured observations
Determinants to handwashing with soap
behavior15
Opportunity, ability, and motivation determinants Household questionnaire
12 Habitcht 1974.13 Bricker & Squires 1999.14 Stoltzfus & Dreyfus 1999.15 The analysis for determinants to handwashing with soap behavior change is not
included in this report.
8154-CH02.pdf 88154-CH02.pdf 8 6/28/11 12:43 PM6/28/11 12:43 PM

Findings from the Impact Evaluation Baseline Survey in Senegal Methodology
www.wsp.org 9
During the five-hour period, the observer noted any oppor-tunity for handwashing and whether handwashing occurred during that time, as well as the details of the opportunity: the type of critical event, the cleansing agent used (e.g., bar soap, liquid soap, mud), washing of one or both hands, and method of hand drying. Critical events of interest included fecal contact (going to the toilet, defecating, or changing chil-dren’s diapers), preparing food, eating, or feeding children.
A total of three pre-intervention longitudinal surveys and three mid-term monitoring surveys were conducted during the study. The post-intervention follow-up survey will be conducted in early 2011 and will collect data on the major-ity of outcomes collected during the baseline survey (some variables the were collected during the baseline survey as control variables are not outcomes of interest and will not be included in the follow-up survey).
2.6 Field ProtocolsThe Centre de Recherche pour le Développement Humain (CRDH) was contracted to conduct field work for the base-line survey. With support from the principal investigator, the research assistant, and the global IE team, CRDH research-ers trained field supervisors and enumerators on all data col-lection protocols and instruments, and were in charge of the standardization of anthropometric and anemia measures.
Each field survey team consisted of one team supervisor, a lab technician and three or four interviewers. There were eight survey teams and a total of 44 field workers. Each su-pervisor was in charge of overseeing one team, administering the community questionnaire, recording the GPS location of the cluster, and collecting anthropometric measures. The lab technician was in charge of conducting anemia tests and collecting fecal samples. The interviewers were in charge of administering the household and health questionnaire (be-sides anthropometry and anemia measures). Interviewers were also in charge of the structured observations in those households where these were conducted.
Specific training was designed for each member of the sur-vey team according to the specific needs required of the task to be performed in the field.
• Stool samples: Stool samples were collected in a subsample of 110 households16 to identify preva-lence of parasites in children’s feces.
The WSP global impact evaluation team, consisting experts from different disciplines, drafted the survey instrument. The complete survey instrument, which included a set of household, community and longitudinal questionnaires, was translated into French and pre-tested in 40 households prior to use in the baseline survey. Although the instru-ments were written in French, they were administered and answered by respondents in Wolof, the local language.17
This is a standard practice in Senegal, where all documents are written in French but the spoken language is Wolof.
Anemia was assessed in children under the age of two years using an in-household collection method. Hemoglobin concentrations were measured using the Hemocue Hb201 photometer, a portable device that allows for immediate and reliable quantitative results. Using sterile and disposable lancets (pricking needle), a drop of capillary blood was ob-tained from the child’s second or third finger and collected in a cuvette, and then introduced into the Hemocue ma-chine. Hemoglobin concentration appeared in the display screen of the device in about one minute, and results were transferred to the questionnaire. Anthropometric measures were made according to standardized protocols using por-table stadiometers, scales, and measuring tape to measure height/length, weight, and arm and head circumference.18
After the household questionnaires were administered, struc-tured observations of handwashing behavior were collected the same or the following day, during a five-hour period, by observing handwashing behavior of the primary caregiver of a child under two years old. Opportunities for handwashing for persons other than the primary caregiver were also noted if the individual came into the line of sight of the observer.
16 Stool samples were to be collected in 110 households, but actual samples were obtained from 99 households.
17 98 percent of the surveys were administered and answered by respondents in Wolof; the other 2 percent were administered either in French or one of the other three local languages spoken in Senegal.
18 Habicht 1974.
8154-CH02.pdf 98154-CH02.pdf 9 6/28/11 12:43 PM6/28/11 12:43 PM

10 Global Scaling Up Handwashing
Poorer households are half as likely to report handwash-ing with soap at critical times as wealthier households. This section presents summary descriptive statistics for key de-mographic, socioeconomic, hygiene, access to water and sanitation, health, and child development variables. Find-ings are cross-tabulated by household wealth and region, and for child outcomes of interest such as diarrhea, ALRI, anemia, growth and development measures, and parasite prevalence. Key findings are also cross-tabulated by sanitary conditions. The cross-tabulations are valuable for under-standing relationships between study outcomes and socio-economic, geographic, and environmental characteristics of the household, and can help generate hypotheses regarding important factors related to child health and development; however, no causality can be inferred between the variables from this bivariate analysis.
In the absence of income expenditure, an asset-based wealth index was created using ownership of durable goods and dwelling characteristics. The durable goods included in the index are radio, television, DVD player, computer, refrig-erator, bicycle, motorcycle, car, gas stove, and water boiler. The dwelling indicators included type of dwelling (e.g. house/hut or apartment); materials used to build wall, roof and floor; dwelling lighting source; cooking energy source; and the number of rooms per household size. In addition, indicators for improved sanitation and water facilities are included in the index. The procedure uses principal com-ponents analysis to assign relative weights to each indica-tor variable using a methodology developed by Filmer and Pritchett.19
In terms of regional analysis the set of variables mentioned above were cross-tabulated by each of the four regions in-cluded in the study. Senegal is a small country and re-gional differences among the four selected regions are not large; however, it is interesting to see if the outcomes of interest vary among regions. Each region includes both urban and rural zones. Saint-Louis is in the northwest cor-ner of the country, along the border with Mauritania. It
FindingsIII.includes coastal areas and the southern bank of the Sen-egal River, which constitutes the border between Senegal and Mauritania. The other three regions—Thiès, Fatick, and Kaolack—are all in central Senegal, in the interior east of Dakar. Fatick and Kaolack border with The Gam-bia, and Kaolack is the only interior region of the four, with no coastal areas. The predominant climate in all four regions is tropical arid, with a rainy season from May to November.
3.1 General Households Characteristics
Key Findings:• Households in Senegal are large; the average house-
hold is comprised of 12 members, out of which 2.7 are children under 5 years of age, and the average total monthly income per capita is 10,778 CFA (equivalent to US$23).
• Most households have a 50 year old male as a head; only 27 percent have ever attended school.
• The average monthly salary, including primary and secondary jobs, is 45,549 CFA (equivalent to US$97), although among poor households salaries are roughly half of that (23,440 CFA, equivalent to US$50).
• The average household among the poorer have no electricity, use wood for cooking and their dwellings are made of mud walls and dirt floors.
Table 1 shows a summary of household basic socio-economic characteristics. The average household (HH) comprises 12.2 individuals, among whom 2.7 are under the age of five. A man heads 87.2 percent of the households. The head of the household is, on average, 50.5 years of age and only 27.6 percent have ever attended school. Around 83 percent of the household heads are employed, and their average monthly salary is 81,171 CFA20 (equivalent to US$172).21 The mean age of the household members is 20.3. There is a higher pro-portion of females (53.4 percent) than males (46.6 percent) in this sample. Other household members are, on average, much younger (17.6 years old) and more educated (about 44 percent have some level of school attendance). Less than half
19 Filmer and Pritchett 1999 and 2001. For the binary indicators, the missing values were imputed to be zero (Filmer and Scott, 2001). Missing indicators did not exceed 2 percent of the number of households).
20 The average income throughout this report only includes individuals who reported positive income.
21 The USA-CFA exchange rate was provided by the Central Bank of West African States (BCEAO) on October 15, 2010 (1 US$= 471.92 CFA).
8154-CH03.pdf 108154-CH03.pdf 10 6/28/11 12:43 PM6/28/11 12:43 PM

Findings from the Impact Evaluation Baseline Survey in Senegal Findings
www.wsp.org 11
percent in the wealthiest households. The mean household size is the lowest among the poorest quintile, 11.2 members, it increases in size until the 4th quintile up to 13.5 mem-bers, and then decreases again to 12 members, so no clear pattern can be observed between wealth and household size. It is worth noting that over a quarter of the households (28.7 percent) are comprised of 15 or more members, and 5.2 percent of the households have over 25 members. Again these figures are the lowest among the poorest households, which seem to have smaller household sizes on average.
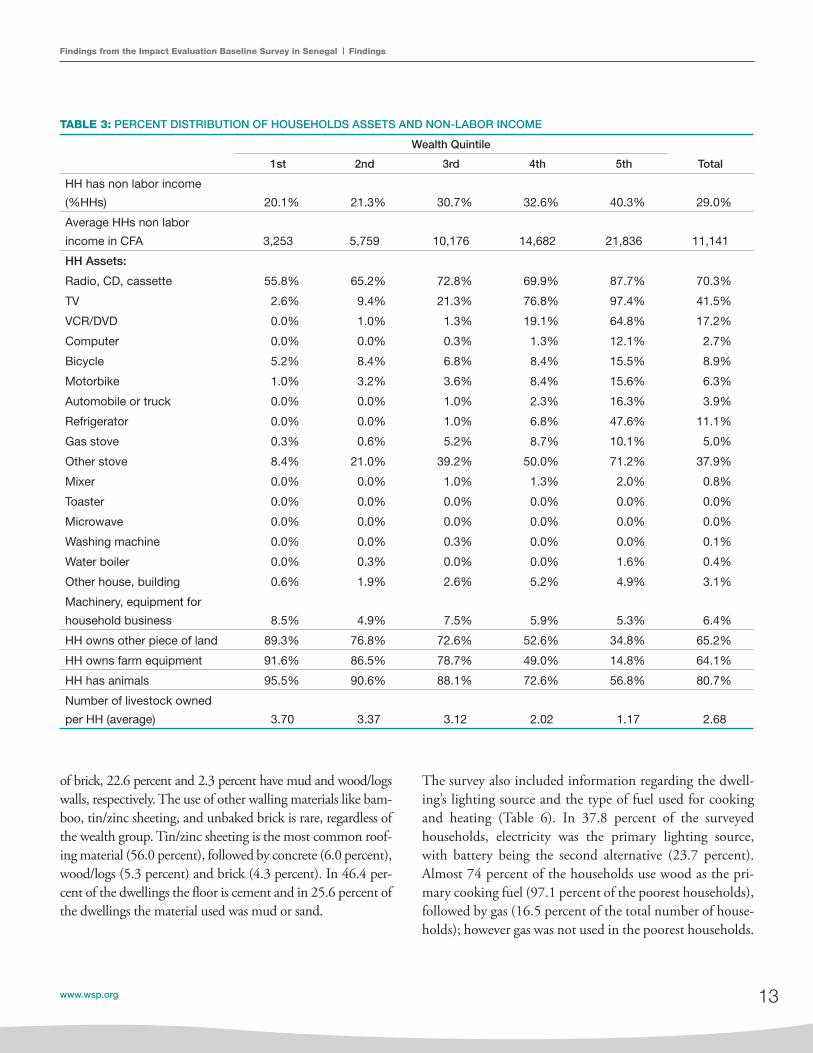
Asset and non-labor income information is summarized in Table 3. The findings show that almost 29 percent of the households declared having income sources other than labor. Non-labor incomes are more common among wealthier households (40.3 percent) than among the poorest (20.1 per-cent). The average non-labor income is 11,141 CFA (equiva-lent to US$24) per household. Non-labor incomes among the poorer households are 3,253 CFA compared to 21,386 CFA in the wealthiest households (equivalent to US$7 and US$45 respectively). The findings about assets show that the majority of the households (70.2 percent) have a radio, cas-sette, or CD player. This percentage is higher for the wealth-ier households at 87.7 percent. Owning luxury items such as television or VCR will vary highly based on wealth-index status; for instance, 97.4 percent of the wealthiest households have a television, while the percentage for poorest households is barely over 2.6 percent. On average, only 11.1 percent of households have a refrigerator, and the figure is insignificant for the poorest households, almost 0 percent. On average 42.9 percent of the households have some type of stove (ei-ther gas or non-gas). Cooking stoves are highly correlated with wealth; thus, only 8.7 percent of the poorest households have some type of cooking stove compared to 81.3 percent among the wealthiest households.
Table 4 shows household dwelling characteristics. More than one-third of households live in a detached, indepen-dent dwelling. The average number of rooms per dwelling is 4.9. A majority of households live in a single unit such as a house, building, or hut (41.7 percent), or in a unit part of a compound (41 percent).
Table 5 shows the main materials used to build the dwelling. Two thirds of the households, 67.3 percent, have walls made
TABLE 1: SUMMARY STATISTICS
Mean
HH size 12.2
Number of children under five yrs per HH 2.7
HH Head:
Male (% HH) 87.2%
Age 50.5
Ever attended school (% HH heads) 27.6%
Worked outside household in last 12 months
(% HH heads)
82.6%
Monthly labor income (in CFA) 81,171
Other HH Members:
Male (% HH) 43.0%
Age 17.6
Ever attended school (% other HH members,
age >4)
43.7%
Worked outside household in last 12 months
(% other HH members, age >14)
47.1%
Monthly labor income (in CFA) 34,360
All HH members:
Male (% individuals) 46.6%
Age 20.3
Ever attended school (% Individuals, age>4) 42.0%
Worked outside household in last 12 months
(% individuals, age>14)
53.0%
Monthly labor income (in CFA) 45,549
HH monthly income per capita (in CFA) 10,778
of the other household members are employed and their av-erage monthly salary is 34,360 CFA (equivalent to US$73). Finally, the average household monthly income per capita is 10,778 CFA (equivalent to US$23).
The following tables provide a more detailed description of the socio-demographic and socio-economic characteristics of the household by wealth quintiles. Table 2 presents the distribution of basic household demographic variables: age of the household members, household size, and total number of children under the age of five per household. On average, poorer households are composed of younger members. In the bottom quintile, for instance, 25 percent of the house-hold members are under four years old, and 18.6 percent between five and nine, compared to 19.6 percent and 12.3
8154-CH03.pdf 118154-CH03.pdf 11 6/28/11 12:43 PM6/28/11 12:43 PM

Findings from the Impact Evaluation Baseline Survey in Senegal Findings
12 Global Scaling Up Handwashing
TABLE 2: PERCENT DISTRIBUTION OF THE BASIC SOCIO-DEMOGRAPHIC CHARACTERISTICS
Wealth Quintile
Total1st 2nd 3rd 4th 5th
Age (% individuals):0–4 25.0% 22.6% 22.6% 21.0% 19.6% 22.1%5–9 18.6% 18.5% 17.0% 15.5% 12.3% 16.3%10–14 10.2% 11.6% 12.3% 12.1% 10.6% 11.4%15–19 8.0% 9.1% 8.8% 9.2% 9.8% 9.0%20–24 7.2% 7.1% 7.7% 8.5% 10.6% 8.2%25–29 5.8% 5.7% 5.6% 6.8% 8.4% 6.4%30–34 5.1% 5.0% 5.1% 6.3% 6.5% 5.6%35–39 5.3% 4.2% 4.8% 4.6% 5.1% 4.8%40–44 3.1% 3.3% 3.4% 2.9% 3.9% 3.3%45–49 3.0% 3.2% 2.7% 2.9% 2.9% 2.9%50+ 8.6% 9.7% 10.0% 10.2% 10.5% 9.8%Age of HH head (average) 46.1 51.4 51.5 50.8 52.5 50.5Age of other HH members
(average) 16.3 16.8 17.1 18.3 19.3 17.6HH head is male (% HH heads) 96.5% 95.2% 88.4% 81.6% 74.5% 87.2%Other HH member is male
(% other HH members) 37.3% 40.2% 40.1% 40.5% 38.8% 39.4%HH Size:2 0.0% 0.0% 0.3% 0.0% 0.0% 0.1%3 0.3% 1.0% 1.3% 2.6% 4.2% 1.9%4 2.6% 1.9% 2.3% 2.6% 3.2% 2.5%5 4.5% 4.5% 4.2% 3.2% 6.8% 4.6%6 8.1% 6.8% 5.8% 7.1% 5.8% 6.7%7 10.0% 8.7% 9.0% 8.7% 6.1% 8.5%8 11.0% 8.1% 9.7% 4.5% 6.8% 8.0%9 8.4% 9.7% 5.8% 9.0% 10.0% 8.6%10 9.7% 5.5% 7.7% 6.5% 8.4% 7.5%11 7.1% 7.4% 8.7% 4.8% 6.1% 6.8%12 8.4% 6.5% 6.1% 4.2% 4.8% 6.0%13 5.2% 5.5% 6.5% 4.5% 4.2% 5.2%14 4.2% 6.1% 2.9% 5.8% 5.8% 5.0%15–19 13.5% 16.5% 16.8% 18.7% 15.8% 16.3%20–24 4.5% 8.1% 7.7% 8.7% 6.8% 7.2%25+ 2.6% 3.9% 5.2% 9.0% 5.2% 5.2%HH size (average) 11.2 12.2 12.3 13.5 12.0 12.2Total Number of Children Under Five Years of Age:1 17.7% 17.1% 19.0% 20.3% 34.3% 21.7%2 35.8% 36.1% 36.1% 36.1% 34.6% 35.8%3 21.6% 19.7% 20.0% 17.4% 12.9% 18.3%4 11.9% 15.5% 11.9% 10.3% 9.4% 11.8%5 6.5% 7.1% 6.5% 7.4% 4.5% 6.4%>5 6.5% 4.5% 6.5% 8.4% 4.2% 6.0%Number of children under five
years of age (average) 2.8 2.8 2.7 2.8 2.3 2.7
8154-CH03.pdf 128154-CH03.pdf 12 6/28/11 12:43 PM6/28/11 12:43 PM
Findings from the Impact Evaluation Baseline Survey in Senegal Findings
www.wsp.org 13
TABLE 3: PERCENT DISTRIBUTION OF HOUSEHOLDS ASSETS AND NON-LABOR INCOME
Wealth Quintile
Total1st 2nd 3rd 4th 5th
HH has non labor income
(%HHs) 20.1% 21.3% 30.7% 32.6% 40.3% 29.0%
Average HHs non labor
income in CFA 3,253 5,759 10,176 14,682 21,836 11,141
HH Assets:
Radio, CD, cassette 55.8% 65.2% 72.8% 69.9% 87.7% 70.3%
TV 2.6% 9.4% 21.3% 76.8% 97.4% 41.5%
VCR/DVD 0.0% 1.0% 1.3% 19.1% 64.8% 17.2%
Computer 0.0% 0.0% 0.3% 1.3% 12.1% 2.7%
Bicycle 5.2% 8.4% 6.8% 8.4% 15.5% 8.9%
Motorbike 1.0% 3.2% 3.6% 8.4% 15.6% 6.3%
Automobile or truck 0.0% 0.0% 1.0% 2.3% 16.3% 3.9%
Refrigerator 0.0% 0.0% 1.0% 6.8% 47.6% 11.1%
Gas stove 0.3% 0.6% 5.2% 8.7% 10.1% 5.0%
Other stove 8.4% 21.0% 39.2% 50.0% 71.2% 37.9%
Mixer 0.0% 0.0% 1.0% 1.3% 2.0% 0.8%
Toaster 0.0% 0.0% 0.0% 0.0% 0.0% 0.0%
Microwave 0.0% 0.0% 0.0% 0.0% 0.0% 0.0%
Washing machine 0.0% 0.0% 0.3% 0.0% 0.0% 0.1%
Water boiler 0.0% 0.3% 0.0% 0.0% 1.6% 0.4%
Other house, building 0.6% 1.9% 2.6% 5.2% 4.9% 3.1%
Machinery, equipment for
household business 8.5% 4.9% 7.5% 5.9% 5.3% 6.4%
HH owns other piece of land 89.3% 76.8% 72.6% 52.6% 34.8% 65.2%
HH owns farm equipment 91.6% 86.5% 78.7% 49.0% 14.8% 64.1%
HH has animals 95.5% 90.6% 88.1% 72.6% 56.8% 80.7%
Number of livestock owned
per HH (average) 3.70 3.37 3.12 2.02 1.17 2.68
of brick, 22.6 percent and 2.3 percent have mud and wood/logs walls, respectively. The use of other walling materials like bam-boo, tin/zinc sheeting, and unbaked brick is rare, regardless of the wealth group. Tin/zinc sheeting is the most common roof-ing material (56.0 percent), followed by concrete (6.0 percent), wood/logs (5.3 percent) and brick (4.3 percent). In 46.4 per-cent of the dwellings the floor is cement and in 25.6 percent of the dwellings the material used was mud or sand.
The survey also included information regarding the dwell-ing’s lighting source and the type of fuel used for cooking and heating (Table 6). In 37.8 percent of the surveyed households, electricity was the primary lighting source, with battery being the second alternative (23.7 percent). Almost 74 percent of the households use wood as the pri-mary cooking fuel (97.1 percent of the poorest households), followed by gas (16.5 percent of the total number of house-holds); however gas was not used in the poorest households.
8154-CH03.pdf 138154-CH03.pdf 13 6/28/11 12:43 PM6/28/11 12:43 PM

Findings from the Impact Evaluation Baseline Survey in Senegal Findings
14 Global Scaling Up Handwashing
TABLE 4: DWELLING CHARACTERISTICS
Wealth Quintile
Total1st 2nd 3rd 4th 5th
Type of Dwelling (% HHs):
House, building or hut 14.8% 33.9% 46.3% 46.3% 67.4% 41.7%
Apartment 0.0% 1.3% 2.6% 7.8% 9.4% 4.2%
Room(s) in a house, apartment
or concession 10.6% 9.4% 12.3% 16.8% 13.2% 12.5%
Unit in concession or
compound 73.5% 54.1% 38.8% 28.8% 10.0% 41.0%
Makeshift dwelling 1.0% 0.0% 0.0% 0.0% 0.0% 0.2%
Other 0.0% 1.3% 0.0% 0.3% 0.0% 0.3%
Average number of rooms 4.4 4.5 4.8 5.4 5.5 4.9
TABLE 5: DWELLING BUILDING MATERIALS
Wealth Quintile
Total1st 2nd 3rd 4th 5th
Walling Materials (% HHs):
Brick 5.5% 45.7% 90.6% 94.8% 99.4% 67.3%
Concrete 4.9% 2.3% 0.3% 1.3% 0.6% 1.9%
Unbaked brick, adobe 1.3% 0.3% 0.0% 0.0% 0.0% 0.3%
Wood, logs 5.9% 4.6% 1.0% 0.0% 0.0% 2.3%
Tin, zinc sheeting 0.0% 2.0% 1.6% 1.0% 0.0% 0.9%
Mud 73.3% 33.6% 3.9% 2.6% 0.0% 22.6%
Bamboo 3.3% 3.9% 1.3% 0.3% 0.0% 1.8%
Other 5.9% 7.6% 1.3% 0.0% 0.0% 2.9%
Roofing Materials (% HHs):
Brick 0.0% 1.3% 3.6% 5.8% 10.7% 4.3%
Concrete 0.0% 0.3% 1.3% 3.9% 24.3% 6.0%
Unbaked brick, adobe 0.0% 0.0% 0.0% 0.6% 1.9% 0.5%
Wood, logs 19.9% 5.6% 0.0% 0.6% 0.3% 5.3%
Tin, zinc sheeting 11.1% 55.9% 86.0% 76.0% 51.1% 56.0%
Mud 2.9% 0.7% 0.3% 0.0% 0.0% 0.8%
Bamboo 7.2% 1.6% 0.3% 0.0% 0.0% 1.8%
Other 59.0% 34.3% 7.8% 11.0% 8.4% 24.1%
Flooring Materials (% HHs):
Parquet 0.0% 0.3% 0.3% 0.0% 0.0% 0.1%
Brick 0.0% 0.3% 0.0% 0.0% 0.0% 0.1%
Linoleum, vinyl, asphalt 1.0% 11.1% 16.7% 21.4% 12.9% 12.6%
Concrete 0.6% 1.3% 0.0% 0.6% 0.0% 0.5%
Soil, sand 89.0% 32.4% 3.3% 1.0% 1.9% 25.6%
Cement 6.8% 46.1% 73.9% 62.5% 43.2% 46.4%
Tiles 0.0% 0.3% 1.3% 2.9% 28.7% 6.7%
Cow dung 1.0% 0.0% 0.0% 0.0% 0.0% 0.2%
Carpet 0.0% 0.0% 0.3% 0.6% 1.3% 0.5%
Other 1.6% 8.2% 4.2% 11.0% 11.9% 7.4%
8154-CH03.pdf 148154-CH03.pdf 14 6/28/11 12:43 PM6/28/11 12:43 PM

Findings from the Impact Evaluation Baseline Survey in Senegal Findings
www.wsp.org 15
TABLE 6: DWELLING ENERGY SOURCE
Wealth Quintile
Total1st 2nd 3rd 4th 5th
Dwelling Lighting Source (% HHs):
No lighting 0.0% 0.0% 0.6% 0.0% 0.0% 0.1%
Electricity 0.3% 3.2% 7.7% 79.4% 98.4% 37.8%
Gas 0.0% 0.0% 0.0% 0.0% 1.0% 0.2%
Kerosene 1.0% 0.3% 0.6% 0.0% 0.0% 0.4%
Coal 0.0% 0.0% 0.0% 0.3% 0.3% 0.1%
Wood 3.9% 1.6% 1.3% 0.3% 0.0% 1.4%
Peat, manure 0.0% 0.6% 0.3% 0.0% 0.0% 0.2%
Candles 5.8% 15.2% 19.7% 7.7% 0.0% 9.7%
Battery 47.1% 36.1% 32.6% 2.6% 0.3% 23.7%
Other 41.9% 42.9% 37.1% 9.7% 0.0% 26.3%
Dwelling Cooking Fuel (% HHs):
Electricity 0.0% 0.0% 0.0% 0.0% 2.3% 0.5%
Gas 0.0% 0.0% 1.9% 13.5% 66.8% 16.5%
Kerosene 0.0% 0.3% 0.0% 0.3% 0.0% 0.1%
Coal 0.3% 1.9% 2.6% 11.6% 14.5% 6.2%
Wood 97.1% 95.2% 90.6% 70.0% 16.1% 73.8%
Peat, manure 0.6% 1.0% 2.9% 1.9% 0.0% 1.3%
Candles 0.3% 0.3% 0.3% 0.0% 0.0% 0.2%
Battery 0.6% 0.0% 0.6% 0.0% 0.0% 0.3%
Other 1.0% 1.3% 1.0% 2.6% 0.3% 1.2%
TABLE 7: INDIVIDUAL’S WORK ACTIVITY AND WAGES
Wealth Quintile
Total1st 2nd 3rd 4th 5th
Employment status:
HH head is employed outside household (% HH heads) 88.4% 86.1% 84.7% 81.4% 72.3% 82.6%
Other HH member is employed outside household
(% other HH members) 47.6% 48.4% 52.6% 45.4% 43.0% 47.1%
HH head helps in family business (% HH heads) 71.4% 56.1% 46.8% 48.3% 38.1% 49.1%
Other HH member helps in family business (% other
HH members) 74.8% 73.6% 73.5% 68.0% 74.6% 72.7%
Monthly Salary:
Primary job salary (in CFA) 20,098 35,844 31,876 56,905 63,772 42,369
Total salary for primary and secondary jobs (in CFA) 23,440 39,661 36,709 60,158 67,383 45,549
Total Hours Worked in a Week:
Hours spent on primary job 41.3 42.2 8.1 44.4 49.2 43.5
Hours spent on secondary jobs 11.8 8.1 48.6 3.7 1.7 6.7
Total hours spent on work 53.1 50.4 48.6 48.1 50.9 50.2
8154-CH03.pdf 158154-CH03.pdf 15 6/28/11 12:43 PM6/28/11 12:43 PM

Findings from the Impact Evaluation Baseline Survey in Senegal Findings
16 Global Scaling Up Handwashing
3.2 Handwashing Behavior
Key Findings:• Poorer households are twice as likely to report hand-
washing with soap at critical times than wealthier households.
• Poorer households are less likely to wash hands with soap after using the toilet or cleaning children’s bot-toms than wealthier households.
• Observed handwashing behavior with soap at critical junctures is three times lower than self-reported rates.
• A designated place for handwashing stocked with soap and water is observed only in a third of the households. Among poor households in particular, access to a hand-washing station with soap and water can be observed in 12 percent of the households.
• Caregiver’s fingernails, palms and finger pads seem to have a cleaner appearance among wealthier households.
The project seeks to achieve health and non-health impacts by promoting handwashing with soap at critical times. Objectively measuring handwashing behavior is therefore critical to the assessment of impacts of the intervention. Handwashing behavior is measured at baseline in two main ways: self-reported handwashing at critical times and through spot-check observations of whether the household has a designated place for handwashing with both soap and water available. An additional measure assesses the clean-liness of the caretaker’s hands through direct observation.
Table 7 presents information on the employment status and wages for any individuals over 15 years old. On average, 82.6 percent of the household heads were employed in the week previous to the interview, but only 47.1 percent of the other household members older than 15 years were employed. Poorer household heads reported higher employment activities outside household (88.4 percent). The average monthly salary for the primary job is 42,369 CFA (equivalent to US$90), and the total monthly salary for both primary and secondary jobs is 45,549 CFA (equivalent to US$97).21 The total number of hours worked in a week job is 50.
21 Primary job is an individual’s main employment occupation. A secondary job is an additional remunerated activity that some individuals held to supplement their main employment or primary job.
TABLE 8A: SELF-REPORTED HANDWASHING BEHAVIOR WITH SOAP BY WEALTH QUINTILE (PREVIOUS 24 HOURS)
Wealth Quintile
Total1st 2nd 3rd 4th 5th
Washed hands with soap at
least once in previous 24 hours
(% caregivers) 94.0% 96.5% 98.2% 98.8% 99.5% 97.4%
Washed Hands with Soap at Least Once in Previous 24 Hours During the Following Events (% caregivers):
During at least one critical
juncture (% caregivers) 25.7% 29.9% 35.1% 45.2% 49.0% 37.0%
Using the toilet (% caregivers) 8.8% 15.2% 19.0% 28.9% 29.9% 20.4%
Cleaning children’s bottom
(% caregivers) 7.8% 10.5% 13.8% 18.1% 18.7% 13.8%
Cooking or preparing food
(% caregivers) 12.3% 12.0% 11.5% 9.6% 16.9% 12.4%
Feeding children (% caregivers) 2.0% 4.0% 3.0% 5.4% 9.6% 4.8%
An anumerator conducts a survey with the head of the household.
8154-CH03.pdf 168154-CH03.pdf 16 6/28/11 12:43 PM6/28/11 12:43 PM

Findings from the Impact Evaluation Baseline Survey in Senegal Findings
www.wsp.org 17
However, the figure for that specific juncture was even lower for Kaolack; thus, there is no way to conclude a clear cut-pattern from the regional analysis.
It is worth noting the limitations of this proxy measure for handwashing behavior, since not all critical times can be expected to take place during the period 24 hours prior to the survey. However, the differences noted by region and by wealth quintile are instructive since particular critical times would not be expected to be systematically associated with either geographical location or household wealth status.
Table 9A and 9B present findings about to access to a place for washing hands with water and soap present anywhere in the home or yard. Despite the fact that practically all care-givers reported to wash hands with soap at least once since the previous day, a designated place for handwashing with both soap and water23 was present within the home or yard in only a third of the households (32.3 percent). Disaggre-gation of these findings by wealth quintiles shows that the number of households with a place for handwashing with soap and water is much higher among the wealthiest house-holds (56.1 percent) than among the poorest (12.3 per-cent). This finding points to a positive association between wealth and the presence of a place for washing hands, with the proportion of households with a place to wash hands steadily increasing as households move up the wealth index. Furthermore, it underscores the importance of targeting the
These measures serve as proxy indicators of handwashing with soap behavior in this study, since the actual behavior and when it takes place is only observed through structured observations in a subsample of 110 households.
As shown in Table 8A, nearly all caregivers (97.4 percent), despite their socioeconomic status, reported washing their hands with soap at least once during the past 24 hours when prompted. However, self-reported frequency of hand-washing at particular critical times is much lower. When prompted for the occasions over the past 24 hours during which they washed their hands with soap, less than a quarter reported washing hands with soap at times of fecal contact (20.4 percent during toilet use and 13.8 percent cleaning children’s bottoms). Regarding food handling, 12.4 percent of caregivers reported handwashing with soap at times of cooking or food preparation, and fewer than 5 percent did so before feeding a child. Overall, only 37 percent of the caregivers reported having washed their hands with soap at a critical juncture in the previous day, and on average, self-reported handwashing with soap was higher among wealth-ier than poorer households for most critical junctures.
Table 8B shows the same figures disaggregated by region. Among all regions, Fatick seems to have the lowest rates of handwashing, while Saint Louis seems to have the highest, although this is not the case for all critical junctures. For instance, 14.3 percent of caregivers living in Fatick reported handwashing with soap during toilet use, compared to 22.7 percent on in Thiès. Similarly, 11.9 percent of caregivers in Fatick reported handwashing with soap while cleaning chil-dren’s bottoms, compared to 22.6 percent in Saint Louis.
TABLE 8B: SELF-REPORTED HANDWASHING BEHAVIOR WITH SOAP BY REGION (PREVIOUS 24 HOURS)
Region
TotalFatick Kaolack St. Louis Thiès
Washed hands with soap at least once in
previous 24 hours (% caregivers) 91.2% 98.6% 95.5% 99.3% 97.4%
Washed Hands with Soap at Least Once in Previous 24 Hours during the Following Events (% caregivers):
During at least one critical juncture (% caregivers) 30.3% 37.3% 41.8% 37.7% 37.0%
Using the toilet (% caregivers) 14.3% 20.0% 21.8% 22.7% 20.4%
Cleaning children’s bottom (% caregivers) 11.9% 9.7% 22.6% 15.6% 13.8%
Cooking or preparing food (% caregivers) 9.2% 15.8% 11.9% 10.5% 12.4%
Feeding children (% caregivers) 4.8% 4.6% 8.6% 3.7% 4.8%
23 The variable ‘Designated Place for Handwashing with Soap and Water’ responds to the number of households with an observed place for handwashing stocked with soap AND water within the dwelling and/or yard premises.
8154-CH03.pdf 178154-CH03.pdf 17 6/28/11 12:43 PM6/28/11 12:43 PM

Findings from the Impact Evaluation Baseline Survey in Senegal Findings
18 Global Scaling Up Handwashing
TABLE 9A: OBSERVATION OF HANDWASHING STATION WITH SOAP AND WATER BY WEALTH QUINTILE
Wealth Quintile
Total1st 2nd 3rd 4th 5th
Observed HW station with soap
and water (%HHs) 12.3% 18.4% 33.2% 41.3% 56.1% 32.3%
Location of HW Station (% HHs):
Inside toilet or kitchen facility 4.2% 3.2% 8.7% 12.3% 12.6% 8.2%
In yard within 3 meters of toilet or
kitchen facility 4.5% 3.2% 13.5% 21.0% 30.0% 14.5%
In yard between 3 and 10 meters
of toilet or kitchen facility 2.6% 7.4% 7.7% 6.8% 9.7% 6.8%
In yard more than 10 meters from
toilet or kitchen facility 1.0% 4.5% 3.2% 1.3% 3.9% 2.8%
TABLE 9B: OBSERVATION OF PLACE FOR HANDWASHING WITH SOAP AND WATER BY REGION
Region
TotalFatick Kaolack St. Louis Thiès
Observed place for handwashing with soap
and water (% HH): 34.2% 26.4% 38.1% 34.4% 32.3%
Location of Place for Handwashing (% HH):
Inside toilet facility 8.8% 8.3% 8.6% 7.8% 8.2%
In yard within 3 meters of toilet facility 8.3% 13.6% 20.0% 15.7% 14.5%
In yard between 3 and 10 meters of toilet facility 10.0% 3.9% 8.1% 7.6% 6.8%
In yard more than 10 meters from toilet facility 7.1% 0.6% 1.4% 3.4% 2.8%
project to the poor in order to achieve the greatest impacts. The findings by region are likewise instructive, where ac-cess to a place for handwashing is lowest in Kaolack (26.4 percent) and highest in Saint Louis (38.1 percent).
The proximity of a place for washing hands with soap to the latrine or place of food preparation is hypothesized to be a key determinant of handwashing behavior, since the farther an individual must walk to wash her hands after defecation or before preparing food, the more likely she is to be distracted by another activity.24 In the households sampled, the place for handwashing with soap and water was located in the yard in 14.5 percent of the households, and inside the toilet or kitchen facility in only 8.2 percent of households. The wealthiest households have the place for handwashing relatively closer to the toilet and/or kitchen than the poorest households. Thus, in 4.5 percent of the poorest households the handwashing place is
within 3 meters of the kitchen or toilet facility compared to 30 percent in those households with the highest wealth.
Further information was collected among those households with a designated place for handwashing regarding its loca-tion, the type of handwashing device, whether water was available at the time of observation, the type of soap pres-ent, and whether ash or mud was observed as an alternative cleansing agent. These observations were made separately for places used to wash hands after going to the toilet, and those used before preparing food, eating, or feeding a child.
Table 10 summarizes findings for the principal place used by the household members to wash hands after using to the toilet. Over two-fifths (42.2 percent) of the households do not have a specific place for handwashing. Among those who have, there are two main types of handwashing devices, a
24 Ram 2010.
8154-CH03.pdf 188154-CH03.pdf 18 6/28/11 12:43 PM6/28/11 12:43 PM

Findings from the Impact Evaluation Baseline Survey in Senegal Findings
www.wsp.org 19
mud for handwashing purposes were only observed in 0.4 percent of the households).
Table 11 presents the findings for the same set of variables in regards to the place used for handwashing before preparing food, eating, or feeding children. A total of 37.2 percent of households reported that family members usually use a dif-ferent place for washing hands at these times than that used
basin or bucket (33.5 percent), and a container from which water is poured (39.5 percent). In almost three-quarters of the households, water was observed at the place for hand-washing. The most frequently observed types of soaps in the handwashing place used after going to toilet were bar soap (50.5 percent), followed by powder, detergent or laundry soap (11.9 percent). Cleansing agents other than soap were practically unobserved in the sampled households (ash and
TABLE 10: OBSERVATION OF HANDWASHING FACILITIES (AFTER USING THE TOILET)
Wealth Quintile
Total1st 2nd 3rd 4th 5th
Location of Handwashing Facilities (% HHs):
Inside toilet facility 12.8% 12.2% 25.1% 28.3% 34.6% 23.3%
Inside cooking place 1.3% 0.8% 0.8% 1.5% 2.0% 1.3%
Less than 3 meters from toilet
facility 8.1% 14.7% 28.2% 30.9% 31.9% 23.5%
Between 3 and 10 meters
from toilet facility 2.6% 5.9% 4.6% 9.2% 11.5% 7.0%
More than 10 meters from
toilet facility 3.4% 5.0% 3.1% 0.4% 1.0% 2.5%
No specific place 71.8% 60.5% 38.2% 29.8% 19.0% 42.2%
Type of Handwashing Facilities (% HHs):
Tap, faucet 0.0% 0.0% 1.9% 6.3% 25.1% 10.0%
Tippy Tap 0.0% 0.0% 0.6% 0.0% 0.8% 0.4%
Basin, bucket 42.4% 33.7% 35.4% 35.9% 27.6% 33.5%
Container from which water is
poured 37.9% 33.7% 41.0% 43.8% 37.7% 39.5%
Observation not possible 6.1% 5.4% 7.5% 1.6% 1.3% 3.6%
Other 13.6% 27.2% 13.7% 12.5% 7.5% 13.1%
Water is available at hand-
washing facility (% HHs) 62.5% 62.2% 71.3% 74.3% 85.0% 74.6%
Soaps Available at Handwashing Facility (% HHs):
Bar soap 39.4% 34.8% 45.6% 53.9% 60.3% 50.5%
Liquid/dishwashing soap 0.0% 1.1% 1.3% 2.1% 2.5% 1.7%
Powder/laundry soap/
detergent 7.6% 17.4% 11.9% 11.5% 11.3% 11.9%
No soap observed 31.8% 37.0% 28.7% 30.9% 23.8% 29.0%
Ash, mud at handwashing fa-
cility (% HH) 0.0% 0.0% 1.6% 0.0% 0.0% 0.4%
No cleansing agents at HW
station (no soap, nor ash, nor
mud observed) (% HHs) 24.2% 34.8% 25.5% 28.3% 23.4% 26.6%
8154-CH03.pdf 198154-CH03.pdf 19 6/28/11 12:43 PM6/28/11 12:43 PM

Findings from the Impact Evaluation Baseline Survey in Senegal Findings
20 Global Scaling Up Handwashing
observed was bar soap (38.3 percent), followed by powder or laundry soap and detergent (27.2 percent). The usage of soap increases with wealth for all types of soap. Cleansing agents other than soap were practically unobserved (ash or mud ob-served in 0.4 percent of the households).
An additional objective indicator of caretaker hygiene was the observation of the caretaker’s hands. During this portion of the survey the interviewer asked to look at the fingernails, palms, and finger pads of the caretaker and recorded their ap-pearance on a scale of visibly dirty, unclean appearance, and clean appearance. Table 12A summarizes these findings. On average, in 83 percent of the cases, caregiver’s palms appeared to be clean. This figure was lower for the households in the bottom wealth quintile (74.1 percent) and considerably
after going to the toilet. If the respondent indicated the same place for washing hands at all critical times, the results were reported in Table 10. The findings show that only 6.2 per-cent of the handwashing places are located inside the kitchen or cooking facility, 19.3 percent in an area located within three meters from the cooking facility, 14.1 percent in a yard between three and 10 meters away from the cooking facility and 6.9 percent in a place located more than 10 meters away from the cooking facility. The observations of these facili-ties reveal that the most common device is a basin or bucket (67.8 percent). The second most used device is a container from which water is poured (16.9 percent), and only house-holds in the two highest quintiles use a tap or faucet. In 69.2 percent of the households water was observed at the place for handwashing. Regarding the availability of soap, the most
TABLE 11: OBSERVATION OF HANDWASHING FACILITY (WHEN PREPARING FOOD OR FEEDING A CHILD)
Wealth Quintile
Total1st 2nd 3rd 4th 5th
Additional handwashing facility different from
table 11 (% HHs): 21.0% 32.3% 39.4% 40.3% 52.9% 37.2%
Location of Handwashing Facility (% HHs):
Inside kitchen facility 0.4% 0.0% 0.7% 0.8% 1.9% 0.8%
Inside cooking place 3.1% 5.0% 5.9% 9.8% 7.2% 6.2%
Less than 3 meters from kitchen facility 8.5% 10.9% 18.2% 23.8% 34.6% 19.3%
Between 3 and 10 meters from kitchen facility 10.9% 19.0% 14.9% 14.7% 11.0% 14.1%
More than 10 meters from kitchen facility 5.4% 6.6% 8.6% 4.2% 9.5% 6.9%
No specific place 71.7% 58.5% 51.7% 46.8% 35.7% 52.8%
Type of Handwashing Facility (% HHs):
Tap, faucet 0.0% 0.0% 0.0% 2.8% 10.1% 3.4%
Tippy Tap 0.0% 0.0% 0.8% 0.7% 0.0% 0.3%
Basin, bucket 75.3% 76.6% 71.0% 63.1% 60.4% 67.8%
Container from which water is poured 15.1% 12.1% 16.0% 17.7% 20.7% 16.9%
Other 2.7% 8.4% 7.6% 12.8% 8.3% 8.5%
Water is available at handwashing station (% HHs) 61.2% 77.0% 66.4% 74.8% 65.2% 69.2%
Soaps Available at Handwashing Facility (% HHs):
Bar soap 20.0% 30.0% 34.7% 47.2% 46.6% 38.3%
Liquid/dishwashing soap 0.0% 1.0% 1.7% 0.0% 0.0% 0.5%
Powder/laundry soap/detergent 16.9% 18.0% 23.1% 33.6% 35.0% 27.2%
No soap observed 38.5% 38.0% 30.6% 25.6% 29.4% 31.4%
Ash, mud at handwashing facility (% HHs) 0.0% 0.0% 0.0% 0.0% 1.8% 0.4%
No cleansing agents at handwashing facility (no
soap, nor ash, nor mud observed) (% HHs) 26.6% 34.5% 26.8% 25.3% 24.3% 27.1%
8154-CH03.pdf 208154-CH03.pdf 20 6/28/11 12:43 PM6/28/11 12:43 PM

Findings from the Impact Evaluation Baseline Survey in Senegal Findings
www.wsp.org 21
TABLE 12A: OBSERVATIONS OF CAREGIVERS HANDS BY WEALTH QUINTILE
Wealth Quintile
Total1st 2nd 3rd 4th 5th
Caregiver’s Fingernails Appear to Have:
Visible dirt 10.8% 16.8% 12.7% 6.7% 4.1% 10.3%
Unclean appearance 20.9% 18.1% 18.9% 18.1% 10.0% 17.3%
Clean appearance 66.3% 64.4% 66.9% 73.3% 83.6% 70.8%
Observation not possible 2.0% 0.7% 1.2% 1.9% 2.3% 1.6%
Caregiver’s Palms Appear to Have:
Visible dirt 3.7% 9.4% 3.7% 1.2% 0.3% 3.6%
Unclean appearance 20.4% 14.6% 13.7% 8.8% 2.8% 12.1%
Clean appearance 74.1% 75.2% 81.4% 88.8% 95.6% 83.0%
Observation not possible 1.7% 0.7% 1.2% 1.6% 1.3% 1.3%
Caregiver’s Finger Pads Appear to Have:
Visible dirt 4.4% 9.2% 4.2% 1.2% 0.3% 3.8%
Unclean appearance 20.9% 14.9% 13.2% 10.7% 3.8% 12.8%
Clean appearance 72.7% 75.2% 81.4% 86.5% 94.6% 82.0%
Observation not possible 1.7% 0.7% 1.2% 1.6% 1.3% 1.3%
TABLE 12B: OBSERVATIONS OF CAREGIVERS HANDS BY REGION
Region
TotalFatick Kaolack St. Louis Thiès
Caregiver’s Fingernails Appear to Have (% caregivers):
Visible dirt 7.4% 10.1% 20.6% 8.1% 10.3%
Unclean appearance 26.1% 14.5% 10.5% 18.7% 17.3%
Clean appearance 64.9% 73.3% 66.4% 72.1% 70.8%
Observation not possible 1.3% 2.1% 2.4% 1.1% 1.6%
Caregiver’s Palms Appear to Have (% caregivers):
Visible dirt 3.7% 4.0% 3.2% 3.4% 3.6%
Unclean appearance 13.4% 14.5% 10.1% 10.0% 12.1%
Clean appearance 82.9% 79.3% 85.0% 85.9% 83.0%
Observation not possible 0.0% 2.2% 1.6% 0.7% 1.2%
Caregiver’s Finger Pads Appear to Have (% caregivers):
Visible dirt 4.7% 4.5% 2.8% 3.2% 3.8%
Unclean appearance 12.7% 14.8% 11.7% 11.2% 12.8%
Clean appearance 82.6% 78.0% 83.8% 85.2% 82.0%
Observation not possible 0.0% 2.6% 1.6% 0.5% 1.3%
higher for those in the top wealth quintile (95.6 percent). Similarly, the wealthiest households appear to have cleaner fingernails and finger pads (83.6 percent and 94.6 percent respectively) than the poorest ones (66.3 percent and 72.7
percent). The regional analysis shows that findings for clean-liness of caregiver’s finger palms and finger pads are quite homogenous among regions, while cleanliness of fingernails presents more variation. The results are shown in Table 12B.
8154-CH03.pdf 218154-CH03.pdf 21 6/28/11 12:43 PM6/28/11 12:43 PM

Findings from the Impact Evaluation Baseline Survey in Senegal Findings
22 Global Scaling Up Handwashing
for handwashing and whether handwashing occurred dur-ing that time, as well as the details of the opportunity: the type of critical event, the cleansing agent used (e.g., bar soap, liquid soap, mud), washing of one or both hands, and method of hand drying. Critical events of interest included fecal contact (going to the toilet, defecating, or after cleaning children’s bottom), food preparation, eating, or feeding children.
Structured observations were completed in a total of 109 households. These observations yielded 1136 events of inter-est summarized in Table 13. There were a total of 93 fecal contact events, 264 eating events, 139 feeding events, 91 food preparation events and 176 water contact events. Over-all, handwashing with soap was observed in 10 percent of the events (109 of the 1136 events). When soap use is disag-gregated by critical juncture, soap use was observed in 19 percent of the fecal events (18 of the 53 events), 5 percent of eating events (13 of the 264 events), 4 percent of the feeding events (4 of the 139 events) and 4 percent of the food prepa-ration events (4 of the 91 events).
At least one fecal contact event was observed in 49 percent of the households (53 of the 109 households). One or more eating events were observed in 72 percent (79) of the house-holds, feeding events in 73 percent (80) and food prepara-tion events in 57 percent (62). Soap use was observed at least once in 39 percent (43) of the households.
Finally, the survey conducted structured observations of handwashing behavior in a subsample of households. Structured observations of handwashing behavior were collected during a five-hour period, by observing hand-washing behavior of the primary caregiver of a child under two years old. Opportunities for handwashing for persons other than the primary caregiver were also noted if the in-dividual came into the line of sight of the observer. During the five-hour period, the observer noted any opportunity
TABLE 13: STRUCTURED OBSERVATIONS OF HANDWASHING BEHAVIOR25
No. of Events
Observed (%)
No. of Events
Accompanied by
Soap Use (%)
No. of HH Observed with
at Least One Event (%)
No. of HH in Which Soap
Use Was Observed at
Least Once (%)
N=1136 N=1136 N=109 N=109
All types 1136 (100%) 109 (10%) 109 (100%) 43 (39%)
Fecal contact26 93 (8%) 18 (19%) 53 (49%) 13 (25%)
Before eating 264 (23%) 13 (5%) 79 (72%) 7 (9%)
Before feeding a child 139 (12%) 4 (3%) 80 (73%) 4 (5%)
Before preparing or
serving food 91 (8%) 4 (4%) 62 (57%) 4 (6%)
Water contact 176 (15%) 6 (3%) 79 (72%) 5 (6%)
25 Analysis conducted by Pavani Ram.26 Fecal contact event includes defecation, toileting of any kind, and cleaning a child who has defecated.
Handwashing stations are used to demonstrate proper handwashing.
8154-CH03.pdf 228154-CH03.pdf 22 6/28/11 12:43 PM6/28/11 12:43 PM

Findings from the Impact Evaluation Baseline Survey in Senegal Findings
www.wsp.org 23
TABLE 14A: ACCESS TO IMPROVED WATER SOURCE BY WEALTH QUINTILE
Wealth Quintile
Total1st 2nd 3rd 4th 5th
HH has improved water source (%HHs) 36.7% 54.0% 75.5% 88.1% 93.5% 69.6%
TABLE 14B: ACCESS TO IMPROVED WATER SOURCE BY REGION
Region
TotalFatick Kaolack St. Louis Thiès
HH has improved water source (%HHs) 57.1% 63.4% 72.6% 78.9% 69.6%
source27. When disaggregated by wealth quintile, there is huge variation among different quintiles; access to im-proved sanitation increases sharply with wealth. Thus, while the large majority (93.5 percent) of households in the wealthiest quintile have access to improved water sources, only 36.7 percent of the poorest households have access to improved water. Regional analysis also shows variation among regions, although not as large. The regions with the highest percentages of access to improved water sources are Thiès (78.9 percent) and Saint Louis (72.6), while Fatick has the lowest percentage (57.1 percent).
Table 15 presents information regarding the type of water source and whether the source is covered. The three more common types of water sources are: water directly piped into the yard (26.6 percent), piped water from a public tap or standpipe (24.4 percent), and an unprotected dug well (25.8 percent). The type of water source also varies largely among wealth quintiles. Thus, among the wealthiest quintiles over three-quarters of the household have access to water piped di-rectly into the yard (51.0 percent) or the dwelling (27.1 per-cent), while none of the poorest households have access to a piped-in water source. By contrast, over three-quarters (58.1 percent) of the poorest households use an unprotected dug well, and around 7.5 percent use a protected dug well, while only 1.3 percent of the wealthiest households use wells. For
3.3 Water Source and Sanitation Facilities
Key Findings:• On average, 70 percent of households have access to
an improved source of water, but access among poorer households is just over 36 percent.
• The poor rely mainly on unprotected wells for water sources.
• More than half of the poorest households practice open defecation, while the largest majority of non-poor households have access to improved sanitation.
• Access to improved water sources and improved sani-tation varies significantly among regions; Fatick seems to be the least privileged of the regions.
The survey investigates household water sources and access to sanitation facilities. Poor-quality water and lack of ac-cess to improved sanitation contribute to a serious disease burden including diarrhea, ALRI, and transmission of para-sites, among others. Therefore, it is important to collect in-formation about any variables that might affect the project’s primary health outcomes of interest.
Questions related to water source were disaggregated by sea-son (rainy versus dry season); however, since almost every household had the same water source during the whole year, results are presented only for the rainy season. Results are summarized in Tables 14A, 14B and 15.
On average, more than two-thirds of the households (69.6 percent) have access to an improved drinking water
27 The ‘Access to Improved Drinking Water Source’ variable was created following the definition and recommendations made by the WHO/UNICEF Joint Monitoring Programme (JMP) for Water and Sanitation (http://www.wssinfo/definitions/infrastructure.html).
8154-CH03.pdf 238154-CH03.pdf 23 6/28/11 12:43 PM6/28/11 12:43 PM

Findings from the Impact Evaluation Baseline Survey in Senegal Findings
24 Global Scaling Up Handwashing
16A and 16B show that almost 70 percent of the house-holds have access to improved sanitation facilities28. As with the patterns observed with water sources, when disaggre-gated by wealth, access to improved sanitation varies con-siderably among quintiles. In the poorest quintile, almost a quarter (23.5 percent) of the households have access to improved sanitation. In the second quintile, access increases to 48.1 percent of the households, and in the third quintile more than three quarters of the households have improved sanitation facilities. Among the 4th and 5th quintiles the
the majority (72.1 percent) of the households the water source is covered, while in 21.3 percent of the households the water sources are uncovered. Covered water sources are more com-mon among wealthier households (37.9 percent) than among the poorer ones (14.1 percent). In the majority of the house-holds (92.8 percent) an adult female is in charge of collecting water from the source. The task is performed by an adult male only in 4.3 percent of the households and by a child under 15 years old in 2.7 percent. On average, two-thirds of the house-holds pay for the water and 70.2 percent of the households are satisfied with the quantity of drinking water.
The following tables present information about the sanita-tion facilities observed in the surveyed households. Tables
TABLE 15: TYPE OF WATER SOURCE
Wealth Quintile
Total1st 2nd 3rd 4th 5th
HH Source of Water for Drinking Use (% HHs):
Piped water, into dwelling 0.6% 1.3% 2.6% 11.0% 27.1% 8.5%
Piped water, into yard, plot 2.9% 10.0% 23.2% 45.5% 51.0% 26.6%
Piped water, public tap, standpipe 23.1% 33.3% 31.0% 22.3% 12.3% 24.4%
Tube well, borehole 0.3% 0.0% 0.0% 0.0% 0.3% 0.1%
Dug well, protected 7.5% 7.1% 15.2% 4.5% 1.3% 7.1%
Dug well, unprotected 58.1% 41.4% 20.0% 8.1% 1.6% 25.8%
Spring water, protected 1.3% 1.6% 3.2% 4.8% 1.6% 2.5%
Spring water, unprotected 0.6% 3.2% 1.6% 0.3% 0.0% 1.2%
Rainwater 1.0% 0.6% 0.3% 0.0% 0.0% 0.4%
Water vendor 0.0% 0.3% 0.6% 2.9% 3.9% 1.6%
Surface water 2.3% 0.0% 0.0% 0.0% 0.0% 0.5%
Other 2.3% 1.0% 2.3% 0.6% 1.0% 1.4%
Covered Source (% HHs):
Covered 14.1% 8.2% 34.8% 46.2% 37.9% 21.3%
Open 83.7% 89.5% 59.8% 33.8% 20.7% 72.1%
Both covered and open 1.3% 1.8% 3.8% 7.7% 6.9% 2.9%
Don’t know 0.9% 0.6% 1.5% 12.3% 34.5% 3.7%
Water collection (% HHs):
Adult woman 95.9% 94.9% 94.7% 86.2% 76.2% 92.8%
Adult man 2.0% 2.2% 3.1% 8.5% 19.0% 4.3%
Girl < 15 yrs 1.7% 2.2% 1.3% 3.8% 1.6% 2.0%
Boy < 15 yrs 0.3% 0.7% 0.9% 1.5% 0.0% 0.7%
Satisfied with quantity of water (%HHs) 61.2% 56.4% 65.1% 79.9% 88.0% 70.2%
Household Pay for the water (% HHs) 38.6% 51.1% 66.1% 86.0% 96.4% 67.7%
28 The ‘Access to Improved Sanitation Facility’ variable was created following the definition and recommendations made by the WHO/UNICEF Joint Monitoring Programme (JMP) for Water and Sanitation (http://www.wssinfo/definitions/infrastructure.html).
8154-CH03.pdf 248154-CH03.pdf 24 6/28/11 12:43 PM6/28/11 12:43 PM

Findings from the Impact Evaluation Baseline Survey in Senegal Findings
www.wsp.org 25
TABLE 16A: ACCESS TO IMPROVED SANITATION BY WEALTH QUINTILE AND REGION
Wealth Quintile Total
1st 2nd 3rd 4th 5th
HH has improved sanitation (%HHs) 23.5% 48.1% 79.6% 97.1% 98.7% 69.4%
TABLE 16B: ACCESS TO IMPROVED SANITATION BY WEALTH QUINTILE AND REGION
Region
TotalFatick Kaolack St. Louis Thiès
HH has improved sanitation (%HHs) 57.3% 65.1% 77.0% 75.3% 69.4%
household and waste disposal practices. These findings are summarized in Table 18. In about half of the house-holds (49.6 percent) no visible feces were observed inside or around the household; this percentage was much higher among the wealthiest households (84.4 percent) than in the poorest families (35.6 percent). However, 10 or more signs of visible feces were observed in nearly a third of the households. Again, more feces were observed in the poorest households (38.8 percent) than in wealthiest ones (9.7 percent). Regarding waste disposal, the most com-mon practice for disposal of child feces among the poorest households was to throw the feces into the bushes or on the ground (45.8 percent), into a toilet or latrine (22.9 per-cent), or directly into the garbage (14.5 percent). Among the wealthiest households, the most common practice was to dispose of child feces into the toilet or latrine (77.4 percent), followed by disposal or into a pit or hole in the ground (15.8 percent).
large majority of the households have improved sanitation facilities (97.1 percent and 98.7 percent, respectively). The regional analysis summarized in Table 16B also shows varia-tion per region. For instance, in Fatick just over half (57.3 percent) of the households have access to improved sanita-tion compared to more than three quarters of the house-holds in Saint Louis (77 percent) or in Thiès (75.3 percent).
When looking at the types of sanitation facilities (Table 17) the most striking finding is that on average, more than a fifth of the households do not have sanitation facilities of any type. As expected, this is not the case for the wealthier house-holds, and nearly none of them lack a sanitation facility (just 0.9 percent of the households in the 4th and 5th quintiles have no facilities). However, among the poorest households nearly two thirds (57.7 percent) have no sanitation facility of any type and therefore have to defecate in the open. The two most common types of facilities are flush toilet piped to a sep-tic tank (37.3 percent), followed by pit latrine without slab (17.8 percent). As expected, flush toilets were almost entirely observed in wealthy households (flush toilets were observed in 74.5 percent of the wealthiest households but in barely none of the poorest), while pit latrines were largely observed among poor households (just 7.4 percent of the households in the 5th wealth quintile had a pit latrine with no slab, while the figures for the three lowest wealth quintiles were between 18 to 30 percent). Most of these facilities are located in the household yard (42.3 percent), inside the household (27.1 percent) or have no designated area (16.7 percent). On aver-age, 93.4 percent of the households have private facilities and only 6.6 percent use public facilities.
Finally, the survey collected information about other sani-tary conditions such as presence of visible feces around the
Many households rely on wells for water supply.
8154-CH03.pdf 258154-CH03.pdf 25 6/28/11 12:43 PM6/28/11 12:43 PM

Findings from the Impact Evaluation Baseline Survey in Senegal Findings
26 Global Scaling Up Handwashing
TABLE 18: OTHER CHARACTERISTICS OF HOUSEHOLDS’ SANITARY CONDITION
Wealth Quintile
Total1st 2nd 3rd 4th 5th
Visible Feces In/Around HH (% HHs):
1-5 feces 18.8% 11.3% 12.0% 7.1% 2.9% 10.4%
5-10 feces 5.8% 11.3% 9.4% 4.2% 2.9% 6.7%
More than 10 feces 38.8% 43.7% 38.2% 28.6% 9.7% 31.8%
Cannot tell 1.0% 2.3% 2.6% 1.3% 0.0% 1.4%
None 35.6% 31.4% 37.9% 58.8% 84.4% 49.6%
Disposal of Child Feces (% HHs):
Bushes, ground 37.1% 32.9% 13.9% 2.3% 0.3% 17.3%
Pit, hole in the ground 8.7% 8.1% 12.6% 15.2% 15.8% 12.1%
Open sewer, drain 0.3% 0.0% 1.0% 1.6% 2.3% 1.0%
Toilet, latrine 23.9% 43.2% 63.9% 77.1% 77.4% 57.1%
Garbage 21.6% 5.8% 3.2% 3.9% 4.5% 7.8%
River 0.6% 0.3% 0.0% 0.3% 0.6% 0.4%
Other 16.8% 10.6% 6.5% 1.0% 0.3% 7.0%
TABLE 17: HOUSEHOLD MAIN SANITATION FACILITY CHARACTERISTICS
Wealth Quintile
Total1st 2nd 3rd 4th 5th
HH Main Sanitation Facility (% HHs):
Flush, to piped sewer system 0.0% 0.0% 0.0% 1.9% 10.6% 2.5%
Flush, to septic tank 0.6% 12.3% 35.0% 64.3% 74.5% 37.3%
Flush, to pit latrine 3.2% 8.4% 11.0% 6.2% 0.6% 5.9%
Flush, to elsewhere 0.3% 0.0% 0.6% 0.0% 0.3% 0.3%
Flush, don’t know where 0.0% 0.0% 0.0% 0.0% 0.6% 0.1%
Ventilated improved pit latrine 0.6% 3.6% 6.1% 10.4% 4.8% 5.1%
Pit latrine with slab 18.4% 22.7% 26.5% 14.0% 7.4% 17.8%
Composting toilet 0.6% 1.0% 1.0% 0.3% 0.0% 0.6%
Pit latrine without slab, open pit 12.3% 6.2% 2.3% 1.6% 0.0% 4.5%
Bucket 0.0% 0.0% 0.0% 0.3% 0.0% 0.1%
No facilities, Open defecation 57.7% 37.0% 12.3% 0.6% 0.3% 21.6%
Other 6.1% 8.8% 5.2% 0.3% 0.6% 4.2%
Location of Main Sanitation Facility (% HHs):
Inside household 9.8% 16.9% 22.8% 39.2% 46.9% 27.1%
In household yard 16.6% 32.2% 56.0% 55.6% 50.8% 42.3%
Less than 10 minutes walk 17.3% 13.7% 10.4% 3.9% 0.6% 9.2%
More than 10 minutes walk 10.7% 6.2% 2.3% 0.3% 1.0% 4.1%
No designated area 44.6% 30.3% 7.2% 1.0% 0.3% 16.7%
Other 1.0% 0.7% 1.3% 0.0% 0.3% 0.7%
Toilet Facility Public or Private (% HHs):
Public 3.9% 10.4% 7.7% 6.2% 5.1% 6.6%
Private 96.1% 89.6% 92.3% 93.8% 94.9% 93.4%
8154-CH03.pdf 268154-CH03.pdf 26 6/28/11 12:43 PM6/28/11 12:43 PM

Findings from the Impact Evaluation Baseline Survey in Senegal Findings
www.wsp.org 27
one or more stools with blood and/or mucus present in the stool using the symptom data obtained from the child health histories.29 Acute lower respiratory infection (ALRI) was de-fined using the clinical case definition of the World Health Or-ganization (WHO 2005), which diagnoses a child as having an ALRI when he/she presents the following symptoms: constant cough or difficulty breathing, and raised respiratory rate (>60 breaths per minute in children less than 60 days of age, >50 breaths per minute for children between 60– 364 days of age, >40 per minute for children between 1–5 years of age).
A summary of diarrhea and ALRI prevalence in the sampled population of children younger than age five is presented in Tables 19. Findings are disaggregated by wealth, region and sanitary conditions. The findings reveal that 6.7 percent of the children presented diarrhea symptoms in the previous 48 hours, 9.9 percent presented symptoms in the past seven days, and 10.9 percent in the past 14 days. These figures are much lower than those reported by the last Demographic Health Sur-vey (DHS) (22 percent for a two-weeks recall); however, it is worth noting a couple points. First, the last DHS survey was conducted in 2005, four years before the WSP survey, and in-cluded all the regions in Senegal. As explained in Section 2, regions at risk or with a recent episode of cholera were excluded from the survey, therefore it is reasonable to expect much lower rates of diarrhea prevalence among those regions not affected by cholera. Second, the DHS variable for diarrhea is based on care-givers perception of whether the child has had diarrhea, rather than based on caregiver-reported symptoms, the latter being a more strict measure. Compared to other project countries, diar-rhea prevalence for a two-week recall period in Senegal is lower than in Peru (20.4 percent) or India (15.2 percent) and higher
3.4 Diarrhea, Acute Lower Respiratory Infection and Anemia Prevalence
Key Findings:• Poorer households are half as likely to report handwash-
ing with soap at critical times as wealthier households.• One in each 10 children had diarrhea symptoms in the
previous 14 days. ALRI symptoms were reported only in 2.3 percent of the households.
• Diarrhea symptoms were lower among those house-holds with access to a place for handwashing with soap and water.
• Diarrhea and ALRI do not seem to be correlated with in-come; however the findings show considerable regional differences.
• Anemia prevalence is observed in the majority of households, and does not seem to be highly correlated with income.
Households without access to a place for washing hands stocked with soap and water, without access to improved water, or without access to improved sanitation are more likely to lose productive hours due to child illness and have slightly higher percentages of anemia prevalence.
Recent health histories were obtained from caretakers for all children younger than five in the household. Symptoms that were prompted included fever, cough, congestion, diarrhea-related symptoms, nausea, vomiting, stomach pain or cramps, and refusal to eat. Additionally, hemoglobin concentrations were obtained from children between six months and two years of age to estimate the percentage suffering from anemia prevalence.
Diarrhea prevalence was defined as the reported presence of three or more loose or watery stools over a 24-hour period, or 29 Baqui et al. 1991.
TABLE 19A: DIARRHEA AND ALRI PREVALENCE BY SANITARY CONDITIONS (CHILDREN <5)
Improved
Sanitation
Improved Water
Source
Place for Handwashing
w/ Soap and Water
Yes No Yes No Yes No
Child had diarrhea symptoms in previous 48 hours (%Children<5) 7.2% 5.4% 6.7% 6.6% 6.3% 6.9%
Child had diarrhea symptoms in previous week (%Children<5) 10.5% 8.3% 10.3% 9.1% 9.3% 10.2%
Child had diarrhea symptoms in past 14 days (%Children<5) 11.4% 9.4% 11.4% 9.9% 9.9% 11.3%
Child had ALRI symptoms in previous 48 hours (%Children<5) 1.9% 1.6% 2.1% 1.2% 2.1% 1.7%
Child had ALRI symptoms in previous week (%Children<5) 2.6% 2.2% 2.8% 1.7% 3.0% 2.2%
Child had ALRI symptoms in past 14 days (%Children<5) 2.8% 2.3% 3.0% 1.9% 3.3% 2.4%
8154-CH03.pdf 278154-CH03.pdf 27 6/28/11 12:43 PM6/28/11 12:43 PM

Findings from the Impact Evaluation Baseline Survey in Senegal Findings
28 Global Scaling Up Handwashing
The prevalence of ALRI is lower than diarrhea in our sam-ple: 1.8 percent of children presented ALRI symptoms in the previous 48 hours, 2.5 percent presented symptoms in the past seven days, and 2.7 percent in the past 14 days. ALRI prevalence seems higher among households with access to im-proved water, improved sanitation and a designated place for handwashing with soap and water compared to those without. ALRI symptoms are also higher among the wealthier quintiles. Regarding regional variation, the highest prevalence is among children living in St. Louis for all three-recall periods, while it is lowest for children living in Fatick. Similarly to the di-arrhea figures, some of these findings seem counterintuitive, as one would expect that better sanitary conditions or higher income would result in lower prevalence of ALRI. Differ-ences observed among households by different sanitary condi-tion were tested again and it was found that those differences among households with and without improved sanitation or with and without a place for handwashing stocked with soap and water are statistically not different. Nonetheless, the test for significance shows that differences among households with
than in Indonesia (8.4 percent) or Vietnam (1.3 percent).30 When the results are disaggregated by sanitary condition the findings show that for all the three recall periods, the preva-lence of diarrhea is lower in households with access to a place for handwashing with soap and water. Diarrhea prevalence in households with access to improved sanitation and improved water sources appears to be higher than in those households without. While these latter findings may appear counterintui-tive, these differences are not statistically different from zero.31
When diarrhea prevalence is disaggregated by wealth quintiles there is no strong correlation between the two variables. Although the findings show that prevalence of di-arrhea is the highest among those households in the bottom wealth quintile for two of the three recall periods, no clear pattern can be observed among the other wealth quintiles. When disaggregating diarrhea prevalence by regions, diar-rhea for all three-recall periods was more than twice as high in Kaolack (3.7 percent, 6 percent and 6.8 percent) than in Fatick (10.2 percent, 14.2 percent and 15.4 percent).
TABLE 19C: DIARRHEA AND ALRI PREVALENCE BY REGION (CHILDREN <5)
Region
TotalFatick Kaolack St. Louis Thiès
Child had diarrhea symptoms in previous 48 hours (%Children<5) 3.7% 10.2% 4.9% 5.1% 6.7%
Child had diarrhea symptoms in previous week (%Children<5) 6.0% 14.2% 6.4% 8.5% 9.9%
Child had diarrhea symptoms in past 14 days (%Children<5) 6.8% 15.4% 7.5% 9.2% 10.9%
Child had ALRI symptoms in previous 48 hours (%Children<5) 1.0% 1.9% 2.6% 1.7% 1.8%
Child had ALRI symptoms in previous week (%Children<5) 1.0% 2.9% 3.6% 2.3% 2.5%
Child had ALRI symptoms in past 14 days (%Children<5) 1.0% 3.1% 4.5% 2.4% 2.7%
30 For more details see the baseline reports for Peru, India, Indonesia and Vietnam.31 Significance test shows that the observed differences are not statistically significant
at the 5% level.
TABLE 19B: DIARRHEA AND ALRI TREATMENT BY WEALTH QUINTILE (CHILDREN <5)
Wealth Quintile
1st 2nd 3rd 4th 5th Total
Child had diarrhea symptoms in previous 48 hours (%Children<5) 7.4% 6.9% 6.2% 6.4% 6.6% 6.7%
Child had diarrhea symptoms in previous week (%Children<5) 10.1% 10.6% 10.0% 9.9% 9.0% 9.9%
Child had diarrhea symptoms in past 14 days (%Children<5) 11.6% 11.1% 10.6% 11.1% 9.9% 10.9%
Child had ALRI symptoms in previous 48 hours (%Children) 1.5% 2.1% 1.3% 1.8% 2.3% 1.8%
Child had ALRI symptoms in previous week (%Children) 2.1% 2.8% 2.0% 2.4% 3.2% 2.5%
Child had ALRI symptoms in past 14 days (%Children) 2.3% 2.8% 2.0% 2.5% 3.9% 2.7%
8154-CH03.pdf 288154-CH03.pdf 28 6/28/11 12:43 PM6/28/11 12:43 PM

Findings from the Impact Evaluation Baseline Survey in Senegal Findings
www.wsp.org 29
TABLE 20: DIARRHEA AND ALRI TREATMENT BY WEALTH QUINTILE (CHILDREN <5)
Wealth Quintile
Total1st 2nd 3rd 4th 5th
Caregiver Did Seek Medical Advice (% Children <5):
Did not seek any medical
assistance 56.3% 52.5% 34.0% 44.6% 54.2% 48.6%
Day visit to doctor 21.9% 15.3% 32.1% 44.6% 35.4% 29.3%
Hospitalization 1.6% 0.0% 1.9% 0.0% 0.0% 0.7%
Pharmacist 0.0% 3.4% 3.8% 3.6% 4.2% 2.9%
Traditional healer 4.7% 8.5% 9.4% 3.6% 0.0% 5.4%
Herbalist 1.6% 0.0% 0.0% 0.0% 0.0% 0.4%
Type of Intestinal Treatment Given:
No treatment 37.5% 47.5% 26.4% 41.1% 45.8% 39.6%
Pill or Syrup 45.3% 25.4% 50.9% 42.9% 39.6% 40.7%
Injection 1.6% 1.7% 1.9% 3.6% 0.0% 1.8%
Intravenous 0.0% 0.0% 0.0% 0.0% 0.0% 0.0%
Traditional Remedies 17.2% 17.0% 9.4% 5.4% 10.4% 12.1%
Oral rehydration solution 4.7% 0.0% 5.7% 3.6% 2.1% 3.2%
Homemade sugar/salt water 3.1% 0.0% 1.9% 3.6% 2.1% 2.1%
Other 4.7% 5.1% 1.9% 3.6% 0.0% 3.2%
Did not pay for the intestinal
treatment (% Caregivers) 29.2% 27.5% 17.5% 14.0% 7.3% 19.5%
Type of Respiratory Treatment Given:
No treatment 46.2% 50.0% 18.2% 18.8% 29.4% 33.3%
Pill or Syrup 38.5% 27.8% 36.4% 56.3% 64.7% 45.3%
Injection 0.0% 0.0% 9.1% 0.0% 5.9% 2.7%
Intravenous 0.0% 0.0% 0.0% 0.0% 0.0% 0.0%
Traditional Remedies 7.7% 17.0% 9.4% 5.4% 10.4% 12.1%
Other 7.7% 16.7% 18.2% 0.0% 11.8% 10.7%
Did not pay for the respiratory
treatment (% Caregivers) 19.2% 18.1% 14.7% 15.9% 7.3% 15.2%
and without access to improved water are indeed statistically different. A plausible explanation is that households with im-proved water sources do not treat the water as much as those with unimproved sources. It is expected that the endline data will bring clarification to those unanswered questions.
As part of the child health history, caregivers were asked whether they sought medical advice for their child during the past two weeks for diarrhea or respiratory symptoms (Table 20). On average, almost half (48.6 percent) of the caregivers with children presenting either diarrhea or ALRI symptoms in the previous 48 hours did not seek medical advice, while almost a third (29.3 percent) went to visit the doctor. When
medical advice was requested, the most common prescribed treatment was pill or syrup for both intestinal (40.7 percent) and respiratory symptoms (45.3 percent) and traditional remedies (12.1 percent for both intestinal and respiratory symptoms), and most caregivers paid for the treatment (21.2 percent did not pay for intestinal treatment and 15.2 percent did not pay for respiratory treatment).
Finally, caregivers were asked whether they had lost work-ing hours in the previous 14 days due to their child’s re-ported symptoms. The findings, reported in Table 21, reveal that in an average of 15.8 percent of households, one or more primary caretakers lost time due to the illness of a
8154-CH03.pdf 298154-CH03.pdf 29 6/28/11 12:43 PM6/28/11 12:43 PM

Findings from the Impact Evaluation Baseline Survey in Senegal Findings
30 Global Scaling Up Handwashing
instance a quarter (25 percent) of the households living in Kaolack reported having lost hours due to child’s illness, compared to only 3.8 percent in Saint Louis. A plausible explanation to such large variation is that Kaolack had the highest rates of diarrhea prevalence; however, Saint Louis presented the highest levels of ALRI prevalence.
Findings for anemia prevalence are summarized in Table 22. A large majority (90.7 percent) of the samples taken indi-cated the presence of anemia. This proportion is lower for households with a designated place for handwashing (87.7 percent) and larger for those without (92.4 percent). The percentage is also a bit lower among children living in house-holds with access to improved water sources and improved sanitation. Anemia prevalence does not seem to be correlated with wealth, as the lowest rates are observed among the 3rd and 5th quintiles, and the highest rates among the 1st, 2nd and 4th quintiles. Regarding different levels by regions, the percentage of anemia prevalence is also highest among chil-dren living in Kaolack (93.5 perecnt) and lowest among chil-dren living in Thiès (87.7 percent).
child over the past 14 days. This percentage increases for households with no designated place for handwashing with soap and water, unimproved water sources, or unimproved sanitation. This percentage also increases with wealth lev-els. Larger variation is observed at the regional level; for
TABLE 21: HOUSEHOLD WITH LOST HOURS DUE TO CHILD ILLNESS
% Caregivers
By Sanitary Conditions:
Improved sanitation 15.2%
Unimproved sanitation 16.1%
Improved water source 12.1%
Unimproved water source 17.5%
Place for Handwashing w/ soap and water 12.7%
No Place for handwashing w/ soap and water 22.4%
By Wealth Quintile:
1st 15.2%
2nd 14.5%
3rd 12.3%
4th 16.5%
5th 20.6%
By Region:
Fatick 10.4%
Kaolack 25.0%
St. Louis 3.8%
Thiès 14.3%
Overall 15.8%
TABLE 22: ANEMIA PREVALENCE (CHILDREN <2)
(Hb < 110 g/L) % Children <2
By Sanitary Conditions:
Improved sanitation 90.3%
Unimproved sanitation 91.7%
Improved water source 90.0%
Unimproved water source 92.4%
Place for Handwashing w/ soap and water 87.7%
No Place for handwashing w/ soap and water 92.1%
By Wealth Quintile:
1st 94.3%
2nd 92.3%
3rd 88.3%
4th 91.6%
5th 87.4%
By Region:
Fatick 91.2%
Kaolack 93.5%
St. Louis 91.6%
Thiès 87.7%
Overall 90.7%
A child is tested for anemia.
8154-CH03.pdf 308154-CH03.pdf 30 6/28/11 12:43 PM6/28/11 12:43 PM

Findings from the Impact Evaluation Baseline Survey in Senegal Findings
www.wsp.org 31
enable the more carefully deliniation of the potential ef-fects of the interventions on child health, growth, and de-velopment, information was gathered on feeding practices, caregiving behavior, and caregiver well-being.
Table 23 summarizes breastfeeding habits within the inter-viewed households. The average breastfeeding time is 16.4 months, and 94.8 percent of children received colostrum33 during the first three days after childbirth. Although it is recommended that mothers feed only with breast milk dur-ing the first six months of life, 69.5 percent of mothers also fed their babies liquids other than colostrum or breast milk during the first three days of life.
The survey also includes a section on child diet. Specifi-cally, caregivers of infants under the age of two were asked about liquids and food given to their children in the day previous to the interview. Results are reported in Table 24.
3.5 Child Care Environment
Key Findings:• Most children under two years of age continue to be
breastfed. The average number of months a child is breastfed is around 16.
• The use of instant formula is not a common prac-tice and is more likely to be used among wealthier households.
• Children in poorer households are less likely to re-ceive nutritional supplements such as vitamin A or iron pills.
It is largely recognized that characteristics of the caregiver and the quality of care a child receives have huge impacts on young children’s health, nutritional status, and develop-ment.32 Moreover, some of these factors have been found to be significant predictors of child outcomes beyond vari-ation due to socio-economic and education variables. To
32 Black et al. 2008; Engle et al. 2007; Grantham-McGregor et al. 2007; Victora et al. 2008; Walker et al. 2007.
33 Colostrum is produced prior to mature breast milk during pregnancy and through the first 3–6 days of life. It contains not only necessary nutrients but also properties that help protect the baby from viral and bacterial infections.
TABLE 23: CHILD BREASTFEEDING (CHILDREN <2)
Wealth Quintile
Total1st 2nd 3rd 4th 5th
Average months breastfeeding 16.8 16.1 16.3 17.1 15.8 16.4
Still breastfeeding (% children) 88.1% 87.1% 83.5% 82.6% 76.5% 83.6%
Colostrum given during first three days (%
children) 91.7% 94.2% 96.4% 94.8% 97.1% 94.8%
Liquid given during first three days, other
than colostrum or breast milk (% children) 72.2% 65.6% 72.5% 68.4% 68.8% 69.5%
Liquid Other Than Breast Given During First Three Days (% Children):
Instant formula 5.0% 4.4% 1.0% 2.7% 4.6% 3.5%
Milk other than breast 9.7% 13.5% 10.1% 5.0% 6.4% 8.9%
Plain water 23.3% 24.4% 23.4% 8.7% 8.5% 17.7%
Sugar, glucose water 7.4% 8.8% 4.0% 6.0% 5.3% 6.3%
Gripe water 1.7% 3.3% 1.3% 1.0% 0.4% 1.5%
Sugar-salt solution 0.3% 0.4% 2.0% 0.7% 1.4% 1.0%
Fruit juice 0.0% 0.0% 0.0% 0.0% 0.0% 0.0%
Tea, infusions 0.3% 0.7% 0.0% 0.3% 0.0% 0.3%
Honey 3.7% 10.2% 14.1% 9.3% 9.2% 9.3%
Other liquids 65.7% 59.9% 67.9% 81.0% 83.4% 71.7%
8154-CH03.pdf 318154-CH03.pdf 31 6/28/11 12:44 PM6/28/11 12:44 PM

Findings from the Impact Evaluation Baseline Survey in Senegal Findings
32 Global Scaling Up Handwashing
Plain water was given to the majority of the children (79.7 percent), followed by breast milk (78.4 percent), and homemade porridge (23.4 percent). With respect to food, 67.7 percent of the children received solid or semi-solid food 2.67 times on average. When asked about dietary supplements, 9.1 percent of caregivers reported giving iron pills or syrup to her child and 71.7 percent affirmed having ever given vitamin A. A large number of caregiv-ers (58.2 percent) also mentioned that the children feed themselves.
TABLE 24: INFANT/YOUNG CHILD FEEDING (CHILDREN <2)
Wealth quintile
Total1st 2nd 3rd 4th 5th
Liquids Given Yesterday (% Children):
Breast milk 84.8% 83.0% 78.0% 73.3% 73.0% 78.4%
Plain water 85.6% 80.5% 82.4% 73.9% 76.6% 79.7%
Infant formula 6.3% 5.1% 7.2% 12.9% 20.0% 10.3%
Fortified child food 1.4% 1.4% 4.2% 8.1% 11.3% 5.3%
Homemade porridge 16.4% 18.6% 22.0% 31.1% 28.6% 23.4%
Other milks 3.3% 7.1% 7.9% 12.0% 16.5% 9.4%
Fruit juice 0.9% 1.1% 2.3% 1.5% 7.1% 2.6%
Caffeine beverages 7.9% 11.5% 17.1% 13.5% 9.9% 12.0%
Quinqueliba tea 4.9% 4.8% 5.3% 7.2% 10.6% 6.6%
Honey 0.2% 1.1% 2.8% 4.6% 4.9% 2.8%
Other Herbal teas 0.5% 0.9% 0.5% 0.4% 0.2% 0.5%
% of children that were given solid or semi-solid food yesterday 61.6% 65.3% 64.2% 71.2% 76.2% 67.7%
Average number of times food was given yesterday 2.54 2.72 2.49 2.70 2.87 2.67
Food Given Yesterday (% Children):
Cereal, rice, other grain-based food 96.9% 92.4% 92.6% 92.8% 89.5% 92.7%
Potatoes, yucca, other roots 26.3% 40.7% 47.8% 56.0% 61.3% 47.3%
Fruits or vegetables rich in vitamin A (carrots, yams, mango,
papaya, green leaf vegetables) 43.9% 60.7% 64.1% 77.4% 77.9% 65.7%
Other fruits or vegetables 35.0% 46.2% 44.4% 48.0% 56.4% 46.4%
Meat, fish, eggs 63.1% 68.7% 66.7% 79.3% 76.1% 71.3%
Beans, peas, lentils 36.3% 42.5% 40.4% 39.4% 39.3% 39.6%
Oil, butter, other fats 61.2% 60.2% 68.1% 75.6% 73.9% 68.3%
% of children that ever received vitamin A supplements 66.1% 72.5% 72.2% 73.3% 74.6% 71.7%
% of children that were given iron pills or syrup 3.6% 8.4% 8.4% 10.3% 14.8% 9.1%
% of children that feed themselves 65.4% 56.7% 55.2% 60.6% 53.8% 58.2%
The survey also included a section of caregiver behavior to-wards child discipline (only for caregivers of children under the age of two). Findings are summarized in Table 25 and indicate that while 54 percent of the caregivers explained to their chil-dren the reason why some behavior was inappropriate, 30.3 percent shook their child during the last month, 20.4 percent shouted or yelled at them, 37.8 percent spanked or slapped the child, and 8.7 percent used an insulting name. Although over one-third of the caregivers reported having spanked or slapped their under two-year-old child during the previous month,
8154-CH03.pdf 328154-CH03.pdf 32 6/28/11 12:44 PM6/28/11 12:44 PM

Findings from the Impact Evaluation Baseline Survey in Senegal Findings
www.wsp.org 33
TABLE 25: DISCIPLINE MEASURES TOWARDS INFANT DURING PREVIOUS MONTH (CHILDREN <2)
Wealth Quintile
Total1st 2nd 3rd 4th 5th
Caregiver took away or forbade something 41.3% 42.2% 48.8% 52.1% 56.0% 48.1%
Caregiver explained why the behavior was wrong 54.3% 55.1% 55.6% 55.2% 49.6% 54.0%
Caregiver shook the child (% caregivers) 18.0% 22.4% 22.1% 40.0% 48.4% 30.3%
Caregiver shouted or yelled at the child 15.8% 18.6% 19.6% 24.5% 23.3% 20.4%
Caregiver gave the child something else to do 73.1% 67.7% 75.0% 69.3% 75.5% 72.1%
Caregiver spanked, slapped the child 33.8% 34.9% 33.9% 42.3% 44.1% 37.8%
Caregiver hit the child on the bottom or elsewhere 13.7% 10.6% 14.5% 17.0% 12.4% 13.7%
Caregiver used an insulting name 7.6% 7.7% 5.0% 9.4% 14.1% 8.7%
Caregiver thinks that physical punishment is necessary 27.6% 25.2% 21.6% 19.2% 21.7% 23.0%
TABLE 26: INFANT/YOUNG CHILD LEARNING ENVIRONMENT (CHILDREN <2)
Wealth Quintile
Total1st 2nd 3rd 4th 5th
Child plays with household objects (% children) 70.4% 69.4% 65.1% 67.5% 66.1% 67.7%
Child plays with toys (% children) 24.1% 34.0% 35.2% 52.1% 64.6% 42.1%
Child attended early education programs (% children) 0.7% 1.2% 1.2% 0.4% 2.0% 1.1%
Adult reads books with child (% adults) 0.2% 5.0% 3.8% 9.2% 15.7% 6.7%
Adult tells stories to child (% adults) 17.5% 22.7% 16.7% 18.1% 18.7% 18.7%
Adult sings songs with child (% adults) 72.1% 73.9% 75.0% 67.9% 58.8% 69.6%
Adult take child outside home (% adults) 81.3% 81.4% 81.3% 81.7% 78.5% 80.9%
Adult plays with child (% adults) 81.1% 85.5% 85.7% 82.8% 88.4% 84.7%
Adult spend time naming, counting, drawing with child (% adults) 21.5% 31.3% 26.9% 28.6% 24.8% 26.6%
only 23 percent of caregivers stated that physical punishment is necessary in order to raise and educate a child.
Furthermore, there were specific questions related to house-hold support for learning and development. These include the availability of play objects, and the frequency with which adults engaged children in various activities demonstrated to promote language and cognitive development. Table 26 shows that 67.7 percent of the children under the age of two played with household objects and 42.1 percent of them played with toys. Only 1.1 percent of the children attend an early education
programs; this may be due to the fact that many centers only serve children three to five years of age. While the majority of children played with an adult (84.7 percent) or were taken on an outing outside the home (80.9 percent) in the past three days, only 6.7 percent caregivers read books or told stories to the child in the past three days which increases to 14.5 percent for the wealthiest household caregivers.
Finally, this survey also considered maternal depression, as it is an important determinant of the child’s health envi-ronment. Table 27 presents the most common symptoms
8154-CH03.pdf 338154-CH03.pdf 33 6/28/11 12:44 PM6/28/11 12:44 PM

Findings from the Impact Evaluation Baseline Survey in Senegal Findings
34 Global Scaling Up Handwashing
3.6 Child Growth and Development Measures
Key Findings:• Nearly 13 percent of children in poor households are
underweight, and almost 20 percent experience stunted growth.
• Children among households with a designated place for handwashing with soap and water are less likely to be malnourish.
• Malnutrition measures seem correlated with income; however the pattern for stunted growth is clearer than that for underweight and wasted growth, which do not have such clear pattern.
• A higher degree of development is observed for those children living in households with access to a hand-washing place with soap and water, access to improved sanitation, or access to improved water.
The survey included baseline growth measures of children under the age of two, including arm and head circum-ference, weight, and length/height. This information is important in order to assess the average growth of the chil-dren. To analyze the child growth findings, anthropomet-ric z-scores were estimated by comparing children in the sample to the WHO reference population mean and stan-dard deviation, for each of the aforementioned variables.34
The reference population is designed to be internationally
of depression for those mothers who answered being de-pressed “Sometimes or about half the time,” or “Most or all the time.” Results show that 6.5 percent of the mothers felt depressed most or all of the time during the last seven days, and 15.6 percent declared feeling depressed sometimes or about half the time. More than 23 percent of these moth-ers felt sad sometimes or most of the time, 23.9 percent felt lonely, 22.4 percent declared feeling fearful, and a large percentage, 39 percent, experienced restless sleep.
34 WHO 2006, 2007.
TABLE 27: MATERNAL DEPRESSION
Felt
Depressed
Everything
Demands
Huge Effort Felt Fearful
Restless
Sleep Was Happy Felt Lonely
Never or rarely (% caregivers) 43.3% 35.7% 41.6% 32.9% 10.8% 46.4%
Little of the time or occasionally (% caregivers) 34.6% 37.9% 36.1% 28.0% 22.8% 29.7%
Sometimes or about half the time (% caregivers) 15.6% 17.9% 16.6% 25.1% 30.6% 15.8%
Most or all of the time (% caregivers) 6.5% 8.5% 5.8% 13.9% 35.8% 8.1%
Felt People
Unfriendly Enjoyed Life
Felt Disliked
by Others Felt Sad
Could Not
Get Going
Never or rarely (% caregivers) 64.2% 11.2% 65.3% 39.9% 47.5%
Little of the time or occasionally (% caregivers) 23.8% 21.1% 22.2% 36.7% 31.5%
Sometimes or about half the time (% caregivers) 9.0% 34.3% 9.2% 18.1% 14.6%
Most or all of the time (% caregivers) 3.1% 33.4% 3.3% 5.4% 6.4%
A mother is interviewed about her child’s health.
8154-CH03.pdf 348154-CH03.pdf 34 6/28/11 12:44 PM6/28/11 12:44 PM

Findings from the Impact Evaluation Baseline Survey in Senegal Findings
www.wsp.org 35
children in the 1st or 2nd wealth quintiles (18.5 percent and 15.5 percent, respectively) is much higher than those in the wealthiest quintile (6.6 percent). The figures by re-gion do not seem to vary considerably, with the exemption of Fatick, where the findings show a higher percentage of wasted children than in the other three regions. The find-ings vary significantly by sanitary condition. For instance, underweight and stunting rates are lower among households with access to a place for handwashing, improved water sources or improved sanitation. Among children living in households with a place for handwashing, underweight is about four percentage points lower than in those without a designated place (7.6 percent versus 11.4 percent); simi-larly, stunting is over 5 percentage points lower (8.9 percent versus 14.5 percent) and wasting almost three percentage points (6.8 percent versus 9.9 percent). Households with access to improved sanitation and improved water also have lower rates of underweight and stunted children; however access to improved water and sanitation does not seem to be associated with lower rates of wasted growth.
The histograms of the z-scores for each child growth measure displayed in Figure 2 provide an additional il-lustration of the prevalence of inadequate child growth.
applicable regardless of ethnicity, socioeconomic status, or feeding practices.
The z-score (or standard score) indicates the number of standard deviations an observation or measure is above or below the mean of a reference population. As the mean is normalized to zero, any negative z-scores would be below the mean, and any positive z-scores would be above the mean. Z-scores are not only useful to assess the average growth and development of children against a reference population, but also to compare levels of growth and de-velopment among households with different characteristics, wealth levels, or regions.
Anthropometric z-scores are also used to determine whether a child is malnourished. The three main nutritional status conditions concerned in anthropometric assessment are underweight, stunting, and wasting. Underweight indicates whether a child has low weight-for-age and, although it does not take into consideration the height of the child, is the most common measure used to assess child nutrition. Stunting indicates whether a child has low height-for-age and reflects linear growth achieved pre- and postnatal. As height-for-age is considered a measure of past nutrition, stunting is generally assumed to indicate long-term, cumu-lative effects of inadequate nutrition and poor health status. Wasting indicates low weight-for-height and can be calcu-lated without knowing the age of the child. Weight-for-age is a measure of current body mass and is sensitive to changes in calorie intake or the effects of disease; thus wasting is a measure of acute or short-term exposure to a negative en-vironment. The WHO considers a child is malnourished if any of these three indexes fall below two standard devia-tions (SD) of the median value of the reference population, and severe malnutrition occurs when the indexes fall below three standard deviations of the median value.35
Table 28 presents the percentage of children being under-weight, stunted or wasted. On average, 10.2 percent of the children in the sample were underweight, 12.7 percent were stunted and 8.9 percent were wasted. When data is disaggre-gated by wealth, the most notable difference among wealth quintiles is for stunting, since the percentage of stunted
35 WHO 1995.
The anthropometric team measures child’s length.
8154-CH03.pdf 358154-CH03.pdf 35 6/28/11 12:44 PM6/28/11 12:44 PM

Findings from the Impact Evaluation Baseline Survey in Senegal Findings
36 Global Scaling Up Handwashing
Tables 29 present average z-scores for the six child-growth measures disaggregated by sanitary condition, wealth level, and region. With a few exceptions, chil-dren coming from households with a designated place for handwashing, improved water sources, or improved sanitation had higher z-scores for most anthropometric measures included in the analysis. In particular, these differences are larger for weight-for-age and height/length-for-age. For instance, z-scores for length/height-for-age are higher among households with a place for handwashing with soap and water (–0.30 SD versus –0.67 SD for those without), access to improved water (–0.45 SD versus –0.81 SD for those without), and ac-cess to improved sanitation (–0.43 SD versus –0.88 SD for those without). Wealth is also particularly correlated with weight-for-age and height/length-for-age, and not so much with the other anthropometric measures.
All measures, besides arm and head circumference, were found to be lower on average than the WHO reference population mean, as indicated by a red vertical line on the graph. Children outside of the normal range of healthy growth are plotted below the –2 SD and above the +2 SD cutoff points on the graph. Children who are under-weight are represented between the –5 and –2 SD cutoff point on the weight-for-age z-score histogram, while those who are stunted, and those who are wasted are represented between the –6 and –2 SD cut-off points in the length/height-for-age z-score and weight-for-length/height histo-grams respectively.36
36 Calculated z-scores below –5 and above 5 for weight-for-age and z-scores below –6 and above 6 for length/height-for-age and weight-for-length/height are considered to be implausible and therefore are not included in the prevalence statistics presented in Table 28.
TABLE 28: PREVALENCE OF UNDERWEIGHT, STUNTING AND WASTING (CHILDREN <2)
Underweight (% Children
under -2 SDs Weight-for-
Age z-score)
Stunted (% Children
under -2 SDs Height-for-
Age z-score)
Wasted (% Children
under -2 SDs Weight-for-
Height z-score)
By Sanitation Condition:
Improved water source 9.6% 11.3% 9.1%
Unimproved water source 11.8% 16.0% 8.6%
Improved Sanitation 10.1% 11.0% 8.9%
Unimproved sanitation 10.4% 17.1% 8.8%
Place for handwashing with soap and water 7.6% 8.9% 6.8%
No place for handwashing with soap and water 11.4% 14.5% 9.9%
By Wealth Quintile:
1st 12.6% 18.5% 11.0%
2nd 10.7% 15.5% 6.6%
3rd 9.2% 11.6% 10.2%
4th 11.4% 11.9% 8.4%
5th 7.2% 6.6% 8.4%
By Region:
Fatick 11.0% 13.4% 10.6%
Kaolack 11.6% 13.3% 8.5%
St. Louis 11.5% 14.5% 9.5%
Thiès 10.2% 12.7% 8.9%
Overall 10.2% 12.7% 8.9%
8154-CH03.pdf 368154-CH03.pdf 36 6/28/11 12:44 PM6/28/11 12:44 PM

Findings from the Impact Evaluation Baseline Survey in Senegal Findings
www.wsp.org 37
FIGURE 2: HISTOGRAMS OF ANTHROPOMETRIC MEASURES (Z-SCORES, CHILDREN <2)
Arm circumference-for-age z-score Weight-for-age z-score
Length/height-for-age z-score BM-for-age z-score
Weight for length/height age z-score Head circumference-for-age z-score
10
0
0
2
4
6
8
10
0
2
4
6
8
10
–5 –2 0 2 5 –5 –2 0 2 5
5Per
cent
10
0
5Per
cent
Per
cent
Per
cent
10
15
0–5 –2 0 2 5 –5 –2 0 2 5
–5 –2 0 2 5 –5 –2 0 2 5
5
10
15
5
Per
cent
0
Per
cent
8154-CH03.pdf 378154-CH03.pdf 37 6/28/11 12:44 PM6/28/11 12:44 PM

Findings from the Impact Evaluation Baseline Survey in Senegal Findings
38 Global Scaling Up Handwashing
TABLE 29B: ANTHROPOMETRIC MEASURES (Z-SCORES) BY WEALTH QUINTILE (CHILDREN <2)
Wealth Quintile
Total1st 2nd 3rd 4th 5th
Average Arm Circumference-for-age z-score –0.07 –0.32 –0.14 –0.18 –0.19 –0.18
Average Weight-for-age z-score –0.87 –0.78 –0.64 –0.62 –0.48 –0.67
Average Length/Height-for-age z-score –0.92 –0.83 –0.54 –0.38 –0.16 –0.56
Average Body Mass Index-for-age z-score –0.45 –0.35 –0.47 –0.51 –0.46 –0.45
Average Weight-for-Length/Height z-score –0.52 –0.40 –0.50 –0.56 –0.44 –0.48
Average Head Circumference-for-age z-score –0.09 –0.05 -0.02 –0.05 –0.07 –0.05
TABLE 29C: ANTHROPOMETRIC MEASURES (Z-SCORES) BY REGION (CHILDREN <2)
Region
TotalFatick Kaolack St. Louis Thiès
Average Arm Circumference-for-age z-score 0.15 –0.24 –0.06 –0.30 –0.18
Average Weight-for-age z-score –0.68 –0.78 –0.63 –0.58 –0.67
Average Length/Height-for-age z-score –0.63 –0.71 –0.55 –0.40 –0.56
Average Body Mass Index-for-age z-score –0.40 –0.52 –0.39 –0.42 –0.45
Average Weight-for-Length/Height z-score –0.44 –0.56 –0.44 –0.44 –0.48
Average Head Circumference-for-age z-score –0.10 –0.05 0.03 –0.07 –0.05
TABLE 29A: ANTHROPOMETRIC MEASURES (Z-SCORES) BY SANITARY CONDITIONS (CHILDREN <2)
Improved Sanitation Improved Water Source
Soap and Water at
HW Station
Yes No Yes No Yes No
Average Arm Circumference-for-age z-score –0.21 –0.11 –0.17 –0.20 –0.13 –0.21
Average Weight-for-age z-score –0.63 –0.79 –0.61 –0.81 –0.50 –0.75
Average Length/Height-for-age z-score –0.43 –0.88 –0.45 –0.81 –0.30 –0.67
Average Body Mass Index-for-age z-score –0.48 –0.36 –0.45 –0.44 –0.41 –0.46
Average Weight-for-Length/Height z-score –0.50 –0.44 –0.47 –0.51 –0.42 –0.51
Average Head Circumference-for-age z-score –0.05 –0.07 –0.04 –0.08 –0.06 –0.05
On average, weight-for-age and height/length-for-age z-scores for children in the highest wealth quintile are –0.48 SD and –0.16 SD, respectively, compared to –0.87 SD and –0.92 SD for those children in the low-est wealth quintile. When disaggregated by regions, fig-ures do not vary much, but z-scores for five out of the six measures are lower in Kaolack than in the other regions.
Figure 3 presents the average z-score corresponding to each variable disaggregated by age and sex. While the survey is a cross section of households, and it is not possible to observe the evolution of child growth measures over time for the children sampled, it is possible to approximate the trend in early child development for the sample population by ana-lyzing the average z-scores for children under two years at each age. A striking result is that, with the exception of the evolution of the average body mass index for age z-score, there is a negative relationship between z-score and age in
8154-CH03.pdf 388154-CH03.pdf 38 6/28/11 12:44 PM6/28/11 12:44 PM

Findings from the Impact Evaluation Baseline Survey in Senegal Findings
www.wsp.org 39
FIGURE 3: ANTHROPOMETRIC MEASURES (Z-SCORES) BY SEX AND MONTHS OF AGE (CHILDREN <2)
Arm circumference-for-age z-score
1.5
1.0
0.5
0
Male Female
5 10 2515 20
0
–0.5
Per
cent
Length/height-for-age z-score
0.5
0
–0.5
0
Male Female
5 10 2515 20
–1.0
–1.5
Per
cent
Weight-for length/height z-score
0.5
0
0
Male Female
5 10 2515 20
–1.0
–0.5
Per
cent
Weight-for-age z-score
0
–0.5
0
Male Female
5 10 2515 20
–1.0
–1.5
Per
cent
BMI-for-age z-score
0.5
0
0
Male Female
5 10 2515 20
–0.5
–1.0
Per
cent
Head circumference-for-age z-score
0.4
0.2
0
0
Male Female
5 10 2515 20
–0.2
–0.4
–0.6
Per
cent
8154-CH03.pdf 398154-CH03.pdf 39 6/28/11 12:44 PM6/28/11 12:44 PM

Findings from the Impact Evaluation Baseline Survey in Senegal Findings
40 Global Scaling Up Handwashing
physiological needs of young children in the sample are not met differentially as a result of the child’s gender. However, it is not evident whether this trend will continue. In the absence of panel data on each child in the sample it is im-possible to know whether the downward trend shown for most measures will continue as females reach age two years and beyond.
The survey also included a section related to child de-velopment, in which caregivers were asked a number of questions about the child’s reaction to specific stimuli (i.e., response to mother’s voice, reaction to seeing self in a mirror) or whether the child has yet achieved various milestones (i.e., sitting, walking, saying some words, etc.). Three domains were measured: commu-nication skills, including pre-verbal babbling as well as producing and understanding language; gross motor skills, including control of certain postures or coordina-tion of movements requiring large muscle systems; and personal-social skills or behaviors related to engaging with others, as well as to becoming independent. Scores on these types of outcomes have been useful for dis-criminating between groups of children with different environmental (poverty, etc.) and biological (stunting, etc.) profiles. The questions administered to each child were selected to measure a range of behaviors represent-ing lower- to higher-than average development per age range (based on U.S. estimates of age-related behaviors, as international standards are not available). With this information, a “degree of child development” index per skill was computed, with higher scores representing a higher level of development in that domain. Tables 30A, 30B, and 30C present the z-scores for these variables disaggregated by sanitary conditions, wealth status, and region.
For every type of skill a lower degree of development was systematically observed in those children that come from households without improved sanitation, without an improved water source, and without soap and water at the handwashing station. Although no inferences can
An anthropometrician carries a stadiometer to measure chil-dren’s height/length.
37 Victora, et al. 2010
months for the remainder of the child growth measures for both males and females. The findings suggest the gap be-tween the sample mean and the reference population mean widens as children age from 0–24 months, indicating that the nutritional status of children in the sample deteriorates over time. This growth pattern is typical among children under two in developing countries.37
Another notable finding is the absence of a gap be-tween male and female child growth, implying that the
8154-CH03.pdf 408154-CH03.pdf 40 6/28/11 12:44 PM6/28/11 12:44 PM

Findings from the Impact Evaluation Baseline Survey in Senegal Findings
www.wsp.org 41
disaggregating the findings by regions, Fatick far exceeds St. Louis for all development z-scores—e.g. average gross motor skills-for-age z-score is 0.28 for Fatick whereas it is -0.32 for St. Louis.
Figure 4 shows the histograms for the three variables’ z-scores. All of them have a mean value equal to 0.
be made about causal relationship between the vari-ables, the figures show a correlation between the sani-tary conditions and the degree of child’s development. When compared across the different wealth groups, the findings show a huge increase from the 1st quintile to the 5th quintile; however, there are no uniform patterns between the 2nd quintile to the 4th quintile. When
TABLE 30A: CHILD DEVELOPMENT Z-SCORES BY SANITARY CONDITIONS (CHILDREN <2)
Improved Sanitation Improved Water Source
Soap and Water at
HW Station
Yes No Yes No Yes No
Average communication skills-for-age z-score 0.06 –0.15 0.04 –0.09 0.10 –0.05
Average gross motor skills-for-age z-score 0.06 –0.15 0.04 –0.09 0.09 –0.05
Average personal-social skills-for-age z-score 0.05 –0.13 0.04 –0.10 0.18 –0.09
TABLE 30B: CHILD DEVELOPMENT Z-SCORES BY WEALTH QUINTILE (CHILDREN <2)
Wealth Quintile
Total1st 2nd 3rd 4th 5th
Average communication skills-for-age z-score –0.19 0.02 –0.13 0.01 0.25 0.00
Average gross motor skills-for-age z-score –0.10 –0.02 –0.04 –0.08 0.20 0.00
Average personal-social skills-for-age z-score –0.22 0.00 –0.02 -0.03 0.21 0.00
TABLE 30C: CHILD DEVELOPMENT Z-SCORES BY REGION (CHILDREN <2)
Region
TotalFatick Kaolack St. Louis Thiès
Average communication skills-for-age z-score 0.15 –0.01 –0.26 0.02 0.00
Average gross motor skills-for-age z-score 0.28 0.04 –0.32 –0.04 0.00
Average personal-social skills-for-age z-score 0.20 –0.20 –0.06 0.08 0.00
8154-CH03.pdf 418154-CH03.pdf 41 6/28/11 12:44 PM6/28/11 12:44 PM

Findings from the Impact Evaluation Baseline Survey in Senegal Findings
42 Global Scaling Up Handwashing
FIGURE 4: HISTOGRAMS OF CHILD DEVELOPMENT MEASURES (Z-SCORES, CHILDREN <2)
Z score: ASQ communication
10
8
6
4
2
0–3 –2 –1 0 1 2
Z score: ASQ motor
10
5
0–4 –2 0 2
2
Z score: ASQ personal/social
10
8
6
4
2
0–4 –2 0
Per
cent
Per
cent
Per
cent
8154-CH03.pdf 428154-CH03.pdf 42 6/28/11 12:44 PM6/28/11 12:44 PM

Findings from the Impact Evaluation Baseline Survey in Senegal Findings
www.wsp.org 43
sources (14.5 percent) than those with unimproved water (24.1 percent). The lowest prevalence of Crystosporidium is found among households with a handwashing sta-tion stocked with soap and water (11.1 percent) and it increases to 19.7 percent for those without such facility. However, prevalence of Giardia does not follow the same pattern, and findings show higher levels of Giardia preva-lence among those households with access to improved water, improved sanitation, and a handwashing station with soap and water. Prevalence of parasites does not seem to be strongly correlated with wealth. For instance, the highest levels of prevalence of Giardia are observed among the 3rd quintile. In the case of Crystosporidium, households among the two bottom wealth quintiles had a much higher percentage of Crystosporidium detected in
3.7 Parasite Prevalence
Key Findings:• Giardia was detected in over 10 percent of the children
stools samples, and Cryptosporidium, another parasite that affects intestines and is typically an acute short-term infection, in over 17 percent of the samples.
• Giardia prevalence is higher among households with no access to a handwashing station with soap and water, no access to improved sanitation, or no access to improved water. This is not the case for Cryptosporidium. It is worth noting, however, that stool samples were collected only in a subsample of 99 households; therefore not much weight should be allocated to these correlations.
The survey also collected stool samples on a subsample of 99 households to examine the presence of parasites. Base-line data on the presence of parasites in the household may allow better future understandings of the mechanism by which the treatment operates, whether it is through the mother or the child. In particular, the focus is set in the presence of bacteria parasites such as Giardia, a parasite that colonizes and reproduces in the small intestine, caus-ing giardiasis; and Cryptosporidium, another parasite that affects intestines and is typically an acute short-term infec-tion, causing cryptosporidiosis.
Giardia was detected in 11.2 percent of the stool sam-ples, and Crystosporidium was found in 17.3 percent of the stool samples. Prevalence of Crystosporidium is much lower among households with access to improved sanita-tion (14.7 percent) than those with unimproved sanita-tion (26.1 percent). Similarly, Crystosporidium prevalence is lower among households with access to improved water
Stool samples are collected to test for presence of parasites.
TABLE 31A: PARASITES PREVALENCE IN STOOL SAMPLES BY SANITARY CONDITIONS (CHILDREN <2)
(N=99)
Improved Sanitation Improved Water Source
Soap and Water at HW
Station
Yes No Yes No Yes No
Giardia detected in Stool Sample
(% of selected HHs) 12.0% 8.7% 11.6% 10.3% 14.8% 9.9%
Cryptosporidium detected in Stool
Sample (% of selected HHs) 14.7% 26.1% 14.5% 24.1% 11.1% 19.7%
8154-CH03.pdf 438154-CH03.pdf 43 6/28/11 12:44 PM6/28/11 12:44 PM

Findings from the Impact Evaluation Baseline Survey in Senegal Findings
44 Global Scaling Up Handwashing
the baseline survey to assess whether its collection and analysis was feasible, and the findings are presented for information purposes only. Since no major problems were observed during the baseline, stool samples will be col-lected in larger samples sizes during the endline survey, and therefore the findings of the impact assessment will be more meaningful.
their stools samples than those among than the top one, but nevertheless the pattern is not clear.
It is worth noting that the sample size for parasite prev-alence is very small (stool samples were collected in 99 households only) so not much weight should be allocated to these correlations. Stool samples were collected during
TABLE 31B: PARASITES PREVALENCE IN STOOL SAMPLES BY WEALTH QUINTILE (CHILDREN <2)
(Subsample; N=99)
Wealth Quintile
Total1st 2nd 3rd 4th 5th
Giardia detected in Stool Sample (% of selected HHs) 10.0% 15.8% 16.7% 4.5% 7.7% 11.2%
Cryptosporidium detected in Stool Sample
(% of selected HHs) 25.0% 26.3% 12.5% 13.6% 7.7% 17.3%
TABLE 31C: PARASITES PREVALENCE IN STOOL SAMPLES BY GEOGRAPHIC AREA (CHILDREN <2)
(Subsample; N=99)
Region
TotalFatick Kaolack St. Louis Thiès
Giardia detected in Stool Sample (% of selected HHs) 10.5% 14.3% 10.0% 8.8% 11.2%
Cryptosporidium detected in Stool Sample (% of selected HHs) 5.3% 17.1% 10.0% 26.5% 17.3%
8154-CH03.pdf 448154-CH03.pdf 44 6/28/11 12:44 PM6/28/11 12:44 PM

www.wsp.org 45
The findings presented in this report provide a snapshot of baseline character-istics of the target population in regard to household demographics, socioeco-nomic situation, mother’s and other caretaker’s handwashing behavior, access to improved sanitation and water, and key child health and development indicators. Low baseline rates of both handwashing with soap at critical times and access to a place for handwashing stocked with soap and water, indicates that there is scope for improving handwashing behavior in the target population, particularly among the poorest.
The subsequent collection and analysis of the post-intervention data, in con-junction with the longitudinal data, will enable a close examination of the links between poor handwashing behavior, poor health, and longer-term child devel-opment. The baseline survey identifies large proportions of children who are below average in terms of weight, length/height, and arm and head circumference for their age. Diarrhea is relatively high compared to other Global Scaling Up project countries and anemia affects the large majority of children. The impact evaluation aims to identify to what extent these outcomes are attributable to lack of handwashing with soap and to quantify the extent to which the project is able to improve these vital aspects of child health.
As outlined in the methodology section, the impact evaluation study utilizes a series of household and community surveys. These include the baseline, longi-tudinal monitoring, and post-intervention follow-up questionnaires. At the time of this report’s publication, longitudinal data collection is completed, and post-intervention data collection is ongoing and expected to be completed by mid 2011. Data analysis and impact assessments will be conducted soon after, and a full impact evaluation report of the Global Scaling Up Rural Handwashing Proj-ect will be published by the end of 2011.
ConclusionIV.
8154-CH04.pdf 458154-CH04.pdf 45 6/28/11 12:45 PM6/28/11 12:45 PM

46 Global Scaling Up Handwashing
Baqui, A. H., R. E. Black, M. Yunus, A. R. Hoque, H. R. Chowdhury, R. B. 1991. Sack. Methodological issues in diarrhoeal diseases epidemiology: definition of diar-rhoeal episodes. Int J Epidemiol. 20(4):1057–63.
Black, R. E., L. H. Allen, Z. A. Bhutta, et al. 2008. Ma-ternal and child undernutrition: global and regional exposures and health consequences. The Lancet. 371(9608):243-260.
Bricker, D, and J. Squires. 1999. Ages and Stages Question-naires: A Parent Completed, Child Monitoring System, 2nd Ed. Baltimore, MD: Paul Brookes.
Devine J., S. Koita. 2010. Senegal: A Handwashing Be-havior Change Journey. Washington, D.C.: WSP
Engle, P. L., M. M. Black, J. R. Behrman, et al. 2007. Strategies to avoid the loss of developmental potential in more than 200 million children in the developing world. The Lancet. 369(9557):229-242.
Filmer, D.L., I. Pritchett. 1999. “The Effect of Household Wealth on Educational Attainment: Evidence from 35 Countries.” Population and Development Review 25(1):85-120.
Filmer, D. L., l. Pritchett. 2001. “Estimating Wealth Ef-fects without Expenditure Data—or Tears: An Appli-cation to Educational Enrollments in States of India.” Demography 38 (1): 115–132.
Filmer, D., K. Scott. 2008. Assessing Asset Indices. World Bank Policy Research Working Paper Series, No. 4605.
Grantham-McGregor, S, Y. B. Cheung, S. Cueto, P. Glewwe, L. Richter, B. Strupp. 2007. Developmental potential in the first 5 years for children in developing countries. Lancet. 369(9555):60-70.
Habicht, J.P. 1974. Estandarización de métodos epidemi-ológicos cuantitativos sobre el terreno [Standardiza-tion of quantitative epidemiological methods in the field]. Bol Oficina Sanit Panam. 76(5):375-384.
Hernan, M. A., S. Hernandez-Diaz, J. M. Robins. 2004. “A Structural Approach to Selection Bias.” Epidemiol-ogy 15: 615–625.
Kumaranayake L., Vias S. 2006.” Constructing socio-economic status indices: how to use principal com-ponents analysis.” Health Policy Plan. (2006) 21 (6): 459-468.
Ram, P. 2010. Practical Guidance for Measuring Hand-washing Behavior. Washington, D.C.: WSP.
Stoltzfus, R.J., M. L. Dreyfus. 1999. Guidelines for the use of iron supplements to prevent and treat iron deficiency anemia: a report of the International Nutritional Ane-mia Consultative Group (INACG.) Washington, DC: The Nutrition Foundation.
Victora, C. G., L. Adair, C. Fall, P. C. Hallal, R. Martorell, L. M. Richter. 2008. Maternal and child undernutri-tion: consequences for adult health and human capi-tal. The Lancet. 371(9609):340-357.
Victora, C. G., M. de Onis, P. C. Hallal, M. Blössner, R. Shrimpton. 2010. “Worldwide Timing of Growth Faltering: Revisiting Implications for Interventions.” Pediatrics 125: e473–e480.
Walker S. P., T. D. Wachs, J. Meeks Gardner, et al. 2007. Child development: risk factors for adverse out-comes in developing countries. The Lancet. 2007; 369(9556):145-157.
WHO/UNICEF Joint Monitoring Programme for Water Supply and Sanitation Website (accessed October 2010). http://www.wssinfo.org/definitions/infrastructure.html
World Health Organization. 2005. Pocket book of hospital care for children: guidelines for the management of com-mon illnesses with limited resources. WHO Press.
_____________________. 2006. WHO child growth standards: length/height-for-age, weight-for-age, weight-for-length, weight-for-height and body mass index-for-age: methods and development. WHO Press.
_____________________. 2007. WHO child growth standards: head circumference-for-age, arm circumfer-ence 2 -for-age, triceps skinfold-for-age and subscapular skinfold-for-age: methods and development. WHO Press.
References
8154-CH05.pdf 468154-CH05.pdf 46 6/28/11 12:46 PM6/28/11 12:46 PM

8154-CH05.pdf 478154-CH05.pdf 47 6/28/11 12:46 PM6/28/11 12:46 PM

Findings from the Impact Evaluation Baseline Survey in Senegal Annex 1: List of Districts Included in WSP Sample
48 Global Scaling Up Handwashing
Annex 1: List of Districts Includedin WSP Sample
TABLE 32: LIST OF COLLECTIVITÉS LOCALES SELECTED FOR TREATMENT
N. Region Department
Collectivités Locales
Commune Communauté rurale (Arrondissement)
1 Fatick Fatick Fatick
2 Fatick Fatick Fatick
3 Fatick Fatick Fatick
4 Fatick Fatick Fatick
5 Fatick Fatick Fatick
6 Fatick Fatick Diakhao Diakhao
7 Fatick Fatick Niakhar Niakhar
8 Fatick Fatick Fimela Fimela
9 Fatick Foundiougne Diossong Djilor
10 Fatick Foundiougne Djilor Djilor
11 Fatick Foundiougne Nioro Allassane Toubacouta
12 Kaolack Kaffrine Birkilane Birkilane
13 Kaolack Kaffrine Diokoul
Mbellbouck
Nganda
14 Kaolack Kaffrine Nganda Nganda
15 Kaolack Kaffrine Ida Mouride Maka Yop
16 Kaolack Kaffrine Maka Yop Maka Yop
17 Kaolack Kaolack Keur Baka Koumbal
18 Kaolack Kaolack Latmingué Koumbal
19 Kaolack Kaolack Keur Socé Ndiedieng
20 Kaolack Nioro Gainthe Kaye Paoskoto
21 Kaolack Nioro Prokhane Paoskoto
22 Kaolack Nioro Keur Maba
Diakhou
Wack Ngouna
23 Kaolack Nioro Ndrame Escale Wack Ngouna
24 Kaolack Nioro Wack Ngouna Wack Ngouna
25 Kaolack Nioro Kaymor Médina Sabakh
8154-CH06.pdf 488154-CH06.pdf 48 6/28/11 12:46 PM6/28/11 12:46 PM

Findings from the Impact Evaluation Baseline Survey in Senegal Annex 1: List of Districts Included in WSP Sample
www.wsp.org 49
N. Region Department
Collectivités Locales
Commune Communauté rurale (Arrondissement)
26 Kaolack Nioro Médina Sabakh Médina Sabakh
27 Saint Louis Dagana Richard Toll
28 Saint Louis Dagana Ross Bethio Ross-Bethio
29 Saint Louis Dagana Gae Mbane
30 Saint Louis Dagana Mbane Mbane
31 Saint Louis Saint Louis Saint Louis
32 Saint Louis Saint Louis Saint Louis
33 Saint Louis Saint Louis Mpal Rao
34 Thiès Mbour Mbour
35 Thiès Mbour Mbour
36 Thiès Mbour Mbour
37 Thiès Mbour Mbour
38 Thiès Mbour Mbour
39 Thiès Mbour Mbour
40 Thiès Mbour Ngueniene Sessene
41 Thiès Mbour Ndiaganiao Fissel
42 Thiès Mbour Sessene Sessene
43 Thiès Thiès Pout
44 Thiès Thiès Pout
45 Thiès Thiès Fandene K Mousseu
46 Thiès Thiès Notto Notto
47 Thiès Thiès Ndieyene Sirakh Thieneba
48 Thiès Thiès Ngoundiane Thieneba
49 Thiès Thiès Thieneba Thieneba
50 Thiès Thiès Touba Toul Thieneba
51 Thiès Tivaouane Darou Khoudoss Meouane
52 Thiès Tivaouane Meouane Meouane
53 Thiès Tivaouane Koulor Merina Dakhar
54 Thiès Tivaouane Pekess Merina Dakhar
55 Thiès Tivaouane Merina Dakhar Merina Dakhar
8154-CH06.pdf 498154-CH06.pdf 49 6/28/11 12:46 PM6/28/11 12:46 PM

Findings from the Impact Evaluation Baseline Survey in Senegal Annex 1: List of Districts Included in WSP Sample
50 Global Scaling Up Handwashing
TABLE 33: LIST OF COMMUNE AND COMMUNAUTE RURALE TO SERVE AS CONTROL
N. Region Department
Collectivités Locales
Commune Communauté rurale (Arrondissement)
1 Fatick Fatick Diarrere Tattaguine
2 Fatick Fatick Diouroup Tattaguine
3 Fatick Fatick Tattaguine Tattaguine
4 Fatick Fatick Ngayokheme Niakhar
5 Fatick Fatick Patar Niakhar
6 Fatick Foundiougne Keur Saloum Dian Toubacouta
7 Fatick Foundiougne Keur Samba Gueye Toubacouta
8 Fatick Foundiougne Toubacouta Toubacouta
9 Fatick Gossas Mbar Colobane
10 Kaolack Kaffrine Kaffrine
11 Kaolack Kaffrine Kaffrine
12 Kaolack Kaffrine Kaffrine
13 Kaolack Kaffrine Kaffrine
14 Kaolack Kaffrine Mabo Birkilane
15 Kaolack Kaffrine Ndiognick Birkilane
16 Kaolack Kaffrine Boulel Maleme Hoddar
17 Kaolack Kaffrine Malem Hodar Maleme Hoddar
18 Kaolack Kaffrine Kathiotte Nganda
19 Kaolack Kaffrine Lour Escale Maka Yop
20 Kaolack Kaffrine Saly Escale Maka Yop
21 Kaolack Kaolack Kaolack
22 Kaolack Kaolack Kaolack
23 Kaolack Kaolack Kaolack
24 Kaolack Kaolack Kaolack
25 Kaolack Kaolack Kaolack
26 Kaolack Kaolack Kaolack
27 Kaolack Kaolack Dya Sibassor
28 Kaolack Kaolack Thiaré Koumbal
29 Kaolack Kaolack Ndiafatt Ndiedieng
30 Kaolack Kaolack Ndiedieng Ndiedieng
31 Kaolack Nioro Paoskoto Paoskoto
32 Kaolack Nioro Taiba Niassene Paoskoto
33 Kaolack Nioro Ngayene Medina Sabakh
34 Saint Louis Dagana Dagana
35 Saint Louis Dagana Dagana
8154-CH06.pdf 508154-CH06.pdf 50 6/28/11 12:46 PM6/28/11 12:46 PM

Findings from the Impact Evaluation Baseline Survey in Senegal Annex 1: List of Districts Included in WSP Sample
www.wsp.org 51
N. Region Department
Collectivités Locales
Commune Communauté rurale (Arrondissement)
36 Saint Louis Dagana Ronkh Ross-Bethio
37 Saint Louis Saint Louis Gandon Rao
38 Thiès Mbour Joal Fadiouth
39 Thiès Mbour Joal Fadiouth
40 Thiès Mbour Malicounda Sindia
41 Thiès Mbour Sindia Sindia
42 Thiès Mbour Diass Sindia
43 Thiès Mbour Fissel Fissel
44 Thiès Mbour Sandiara Sessene
45 Thiès Thiès Diender Guedji K Mousseu
46 Thiès Thiès Keur Moussa K Mousseu
47 Thiès Thiès Tassette Nott
48 Thiès Tivaouane Tivaouane
49 Thiès Tivaouane Tivaouane
50 Thiès Tivaouane Mboro
51 Thiès Tivaouane Cherif Lo Pambal
52 Thiès Tivaouane Notto Gouye Diama Pambal
53 Thiès Tivaouane Pire Goureye Pamba
54 Thiès Tivaouane Taiba Ndiaye Taiba Ndiaye
55 Thiès Tivaouane Ngandiouf Niakhene
8154-CH06.pdf 518154-CH06.pdf 51 6/28/11 12:46 PM6/28/11 12:46 PM

Findings from the Impact Evaluation Baseline Survey in Senegal Annex 2: Test of Baseline Balance
52 Global Scaling Up Handwashing
treatment group, then there would be little reason to believe that the unobserved variables are not balanced.
The standard errors used in those tests were clustered at the dis-trict level, allowing the possibility of intra-district correlation. For the comparison groups—Treatment versus Control—the null hypothesis of mean equality at the 10 percent level was re-jected in 8.53 percent of the answers (22 out of 258 answers).
Test of balance for the key indicators included in the IE baseline are presented in the following tables.
As mentioned in Section II: Methodology, a critical re-quirement of the IE methodology is to create an appropri-ate counterfactual for the treatment group. This section presents the mean comparison tests across the treatment and the control group for an exhaustive list of indicators included in the baseline survey.
Surveyed households possess many unobserved characteris-tics not included in the database, and thus cannot be evalu-ated to see if they are balanced. However, if a sufficiently large amount of observed variables are balanced across the
Annex 2: Test of Baseline Balance
TABLE 34: HOUSEHOLD DEMOGRAPHICS, LABOR AND EDUCATION
Treatment Control
z-value p-valueN Avg. SE N Avg. SE
HH size 782 12.237 0.356 768 12.181 0.426 0.100 0.920Number of children under five years of age (per HH) 782 2.707 0.089 768 2.664 0.085 0.350 0.726Age 9567 20.240 0.297 9355 20.339 0.220 –0.270 0.787Age of HH head 782 50.771 0.731 768 50.133 0.819 0.581 0.561Age of other HH members 8785 17.522 0.282 8587 17.675 0.226 –0.423 0.672HH head is male 782 0.868 0.021 768 0.876 0.020 –0.275 0.783Other HH members are male 8787 0.425 0.006 8587 0.434 0.008 –0.964 0.335Education:HH head ever attended school 773 0.281 0.033 758 0.276 0.031 0.110 0.913Other HH members ever attended school 6580 0.421 0.032 6474 0.455 0.030 –0.770 0.441Currently in school 2511 0.646 0.023 2720 0.658 0.015 –0.415 0.678Currently in vacation 1598 0.973 0.014 1743 0.936 0.023 1.399 0.162Teenager Spent Time On:School 2504 0.026 0.016 2479 0.035 0.014 –0.434 0.664Studying 2500 0.031 0.012 2474 0.063 0.014 –1.773 0.076Children care 2351 0.410 0.022 2256 0.405 0.024 0.136 0.892Homework 2296 0.505 0.023 2234 0.510 0.022 –0.160 0.873Paid work 2509 0.004 0.001 2475 0.008 0.002 –1.629 0.103Unpaid work 2411 0.254 0.026 2363 0.208 0.025 1.272 0.203Work and EarningsMonthly salary for primary work (in CFA) 1210 43,864 4,879 1147 50,062 6,286 –0.779 0.436Hours worked per week for primary work 2235 43.542 1.302 2166 43.947 0.919 –0.254 0.799Monthly salary for secondary work (in CFA) 301 33,382 6,390 217 23,193 3,712 1.379 0.168Hours worked per week for secondary work 546 32.881 1.782 437 30.629 1.774 0.895 0.371HH head is employed 782 0.811 0.016 768 0.835 0.016 –1.069 0.285Others in HH are employed 9569 0.197 0.008 9355 0.192 0.008 0.490 0.624Females in HH are employed 941 0.505 0.029 919 0.476 0.027 0.742 0.458Helped in the family business 2157 0.705 0.021 2207 0.720 0.023 –0.479 0.632
8154-CH06.pdf 528154-CH06.pdf 52 6/28/11 12:46 PM6/28/11 12:46 PM

Findings from the Impact Evaluation Baseline Survey in Senegal Annex 2: Test of Baseline Balance
www.wsp.org 53
TABLE 35: HOUSEHOLD ASSETS
Treatment Control
z-value p-valueN Avg. SE N Avg. SE
HH non-labor income 781 0.269 0.023 766 0.312 0.026 –1.242 0.214
Assets:
Radio, CD, cassette player 782 0.716 0.020 768 0.688 0.024 0.911 0.362
Television 782 0.359 0.045 768 0.471 0.048 –1.718 0.086
VCR, DVD 782 0.133 0.025 768 0.210 0.028 –2.031 0.042
Computer 782 0.028 0.010 768 0.026 0.006 0.181 0.856
Bicycle 782 0.074 0.013 768 0.103 0.013 –1.596 0.111
Motorcycle 782 0.055 0.009 768 0.072 0.010 –1.207 0.227
Automobile or truck 782 0.026 0.006 768 0.052 0.011 –2.210 0.027
Refrigerator 782 0.088 0.020 768 0.133 0.023 –1.463 0.143
Gas stove 782 0.047 0.012 768 0.052 0.013 –0.274 0.784
Other stove 780 1.509 0.126 768 1.603 0.041 –0.710 0.478
Other houses/properties 779 1.714 0.179 762 1.833 0.134 –0.534 0.593
Machinery, equipment for family business 771 1.791 0.129 758 1.950 0.012 –1.229 0.219
Mixer 782 0.010 0.005 768 0.007 0.003 0.697 0.486
Water Boiler 782 0.003 0.002 768 0.005 0.003 –0.738 0.461
HH owns other piece of land (over all HHs) 781 0.686 0.045 768 0.617 0.046 1.077 0.282
HH has all animals (over all HHs) 782 0.679 0.058 768 0.603 0.054 0.963 0.336
HH owns farm equipment (over all HHs) 782 0.826 0.034 768 0.788 0.031 0.837 0.403
TABLE 36: HOUSEHOLD COMPOSITION
Treatment Control
z-value p-valueN Avg. SE N Avg. SE
Rooms in dwelling 772 4.921 0.194 762 4.936 0.179 –0.056 0.956
Dwelling Lighting Source:
No lighting 782 0.001 0.001 768 0.001 0.001 –0.013 0.990
Electricity 782 0.289 0.053 768 0.469 0.059 –2.266 0.023
Kerosene 782 0.004 0.002 768 0.004 0.002 –0.023 0.982
Wood 782 0.019 0.008 768 0.009 0.004 1.111 0.266
Peat, manure 782 0.003 0.002 768 0.001 0.001 0.572 0.567
Candles 782 0.113 0.023 768 0.081 0.016 1.136 0.256
Battery 782 0.294 0.045 768 0.180 0.042 1.851 0.064
Other 782 0.274 0.043 768 0.253 0.046 0.333 0.739
Dwelling Cooking Fuel:
Electricity 782 0.006 0.003 767 0.003 0.002 1.010 0.313
Gas 782 0.178 0.040 767 0.151 0.030 0.534 0.593
Coal 782 0.038 0.010 767 0.086 0.020 –2.145 0.032
Wood 782 0.743 0.046 767 0.733 0.039 0.169 0.866
Peat, manure 782 0.017 0.012 767 0.009 0.005 0.605 0.545
Candles 782 0.001 0.001 767 0.003 0.002 –0.598 0.550
continued
8154-CH06.pdf 538154-CH06.pdf 53 6/28/11 12:46 PM6/28/11 12:46 PM
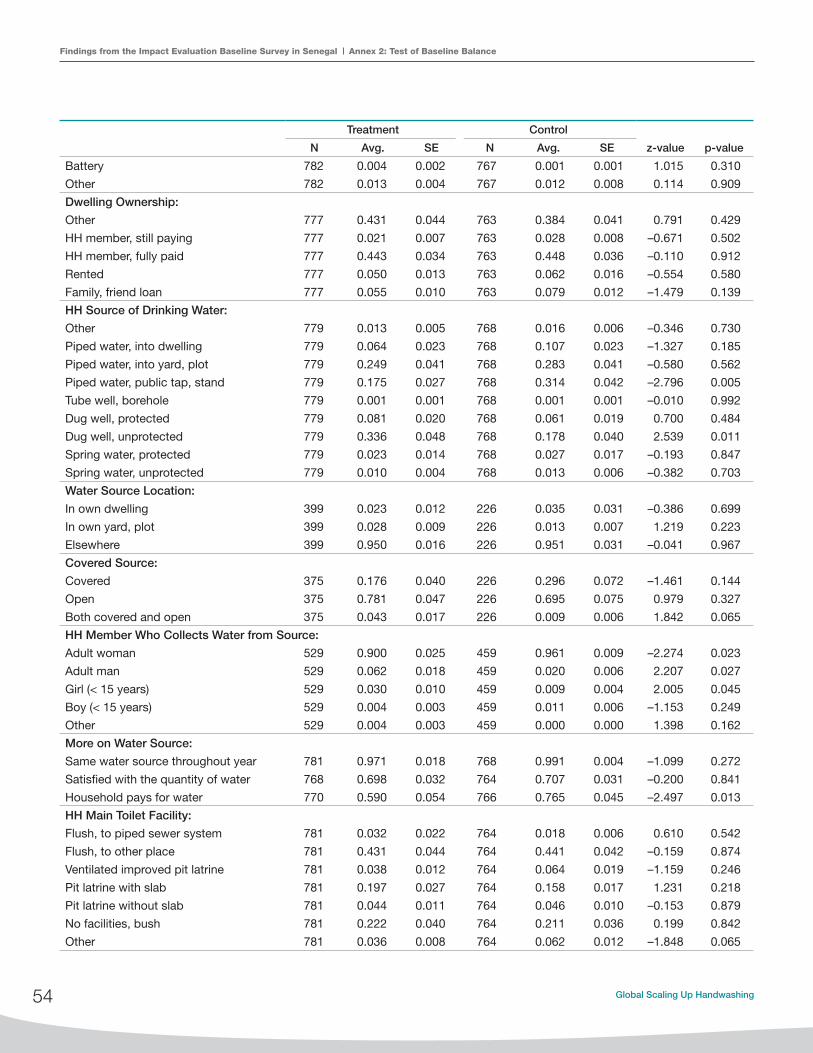
Findings from the Impact Evaluation Baseline Survey in Senegal Annex 2: Test of Baseline Balance
54 Global Scaling Up Handwashing
Treatment Control
z-value p-valueN Avg. SE N Avg. SE
Battery 782 0.004 0.002 767 0.001 0.001 1.015 0.310
Other 782 0.013 0.004 767 0.012 0.008 0.114 0.909
Dwelling Ownership:
Other 777 0.431 0.044 763 0.384 0.041 0.791 0.429
HH member, still paying 777 0.021 0.007 763 0.028 0.008 –0.671 0.502
HH member, fully paid 777 0.443 0.034 763 0.448 0.036 –0.110 0.912
Rented 777 0.050 0.013 763 0.062 0.016 –0.554 0.580
Family, friend loan 777 0.055 0.010 763 0.079 0.012 –1.479 0.139
HH Source of Drinking Water:
Other 779 0.013 0.005 768 0.016 0.006 –0.346 0.730
Piped water, into dwelling 779 0.064 0.023 768 0.107 0.023 –1.327 0.185
Piped water, into yard, plot 779 0.249 0.041 768 0.283 0.041 –0.580 0.562
Piped water, public tap, stand 779 0.175 0.027 768 0.314 0.042 –2.796 0.005
Tube well, borehole 779 0.001 0.001 768 0.001 0.001 –0.010 0.992
Dug well, protected 779 0.081 0.020 768 0.061 0.019 0.700 0.484
Dug well, unprotected 779 0.336 0.048 768 0.178 0.040 2.539 0.011
Spring water, protected 779 0.023 0.014 768 0.027 0.017 –0.193 0.847
Spring water, unprotected 779 0.010 0.004 768 0.013 0.006 –0.382 0.703
Water Source Location:
In own dwelling 399 0.023 0.012 226 0.035 0.031 –0.386 0.699
In own yard, plot 399 0.028 0.009 226 0.013 0.007 1.219 0.223
Elsewhere 399 0.950 0.016 226 0.951 0.031 –0.041 0.967
Covered Source:
Covered 375 0.176 0.040 226 0.296 0.072 –1.461 0.144
Open 375 0.781 0.047 226 0.695 0.075 0.979 0.327
Both covered and open 375 0.043 0.017 226 0.009 0.006 1.842 0.065
HH Member Who Collects Water from Source:
Adult woman 529 0.900 0.025 459 0.961 0.009 –2.274 0.023
Adult man 529 0.062 0.018 459 0.020 0.006 2.207 0.027
Girl (< 15 years) 529 0.030 0.010 459 0.009 0.004 2.005 0.045
Boy (< 15 years) 529 0.004 0.003 459 0.011 0.006 –1.153 0.249
Other 529 0.004 0.003 459 0.000 0.000 1.398 0.162
More on Water Source:
Same water source throughout year 781 0.971 0.018 768 0.991 0.004 –1.099 0.272
Satisfied with the quantity of water 768 0.698 0.032 764 0.707 0.031 –0.200 0.841
Household pays for water 770 0.590 0.054 766 0.765 0.045 –2.497 0.013
HH Main Toilet Facility:
Flush, to piped sewer system 781 0.032 0.022 764 0.018 0.006 0.610 0.542
Flush, to other place 781 0.431 0.044 764 0.441 0.042 –0.159 0.874
Ventilated improved pit latrine 781 0.038 0.012 764 0.064 0.019 –1.159 0.246
Pit latrine with slab 781 0.197 0.027 764 0.158 0.017 1.231 0.218
Pit latrine without slab 781 0.044 0.011 764 0.046 0.010 –0.153 0.879
No facilities, bush 781 0.222 0.040 764 0.211 0.036 0.199 0.842
Other 781 0.036 0.008 764 0.062 0.012 –1.848 0.065
8154-CH06.pdf 548154-CH06.pdf 54 6/28/11 12:46 PM6/28/11 12:46 PM

Findings from the Impact Evaluation Baseline Survey in Senegal Annex 2: Test of Baseline Balance
www.wsp.org 55
Treatment Control
z-value p-valueN Avg. SE N Avg. SE
Toilet Public/Private:
Public 571 0.053 0.013 574 0.080 0.015 –1.421 0.155
Private 571 0.947 0.013 574 0.920 0.015 1.421 0.155
Location of Main Toilet Facility:
Inside dwelling 776 0.202 0.028 760 0.342 0.034 –3.175 0.001
In household yard 776 0.491 0.038 760 0.353 0.032 2.814 0.005
Less than 10 minutes walk 776 0.090 0.014 760 0.093 0.017 –0.143 0.886
More than 10 minutes walk 776 0.045 0.013 760 0.037 0.009 0.524 0.600
No designated area 776 0.166 0.037 760 0.167 0.034 –0.017 0.986
Other 776 0.005 0.002 760 0.008 0.004 –0.630 0.529
Disposal of Child Feces:
Bushes, ground 782 0.193 0.034 768 0.152 0.027 0.937 0.349
Pit, hole in the ground 782 0.107 0.015 768 0.134 0.016 –1.230 0.219
Open sewer, drain 782 0.012 0.009 768 0.009 0.003 0.251 0.802
Toilet, latrine 782 0.570 0.036 768 0.572 0.037 –0.025 0.980
Garbage 782 0.073 0.017 768 0.083 0.014 –0.475 0.635
River 782 0.004 0.003 768 0.004 0.002 –0.020 0.984
Other 782 0.069 0.016 768 0.072 0.013 –0.123 0.902
Walling Materials:
Brick 774 0.658 0.044 763 0.689 0.046 –0.500 0.617
Concrete 774 0.021 0.007 763 0.017 0.007 0.370 0.711
Unbaked brick, adobe 774 0.001 0.001 763 0.005 0.003 –1.163 0.245
Wood, logs 774 0.030 0.013 763 0.016 0.006 0.961 0.336
Other 774 0.291 0.041 763 0.273 0.044 0.299 0.765
Roofing Materials:
Brick 775 0.052 0.015 762 0.034 0.008 1.057 0.291
Concrete 775 0.046 0.012 762 0.073 0.014 –1.454 0.146
Wood, logs 775 0.062 0.014 762 0.043 0.012 0.989 0.323
Tin, zinc sheeting 775 0.574 0.039 762 0.546 0.032 0.557 0.578
Bamboo 775 0.019 0.006 762 0.017 0.006 0.272 0.786
Concrete 775 0.006 0.004 762 0.014 0.008 –0.913 0.361
Other 775 0.240 0.035 762 0.272 0.037 –0.624 0.533
Flooring Materials:
Concrete 779 0.008 0.003 762 0.003 0.002 1.438 0.151
Soil, sand 779 0.262 0.039 762 0.249 0.038 0.230 0.818
Cement 779 0.510 0.034 762 0.417 0.030 2.044 0.041
Tiles 779 0.050 0.013 762 0.084 0.014 –1.804 0.071
Other 779 0.163 0.024 762 0.241 0.035 –1.855 0.064
8154-CH06.pdf 558154-CH06.pdf 55 6/28/11 12:46 PM6/28/11 12:46 PM

Findings from the Impact Evaluation Baseline Survey in Senegal Annex 2: Test of Baseline Balance
56 Global Scaling Up Handwashing
TABLE 37: HANDWASHING FACILITIES
Treatment Control
z-value p-valueN Avg. SE N Avg. SE
HH handwashing after using toilet 778 0.860 0.018 763 0.827 0.022 1.146 0.252
HH handwashing before/after food preparation 781 0.883 0.018 764 0.880 0.018 0.154 0.878
Location of Handwashing Facility (after using toilet):
Inside toilet facility 668 0.240 0.024 628 0.228 0.021 0.369 0.712
Inside food preparation area 668 0.003 0.002 628 0.024 0.006 –3.264 0.001
In yard, less than 3 feet from toilet facility 668 0.213 0.021 628 0.260 0.023 –1.509 0.131
In yard, between 3–10 feet from toilet facility 668 0.087 0.013 628 0.053 0.009 2.157 0.031
In yard, more than 10 feet from toilet facility 668 0.024 0.007 628 0.025 0.006 –0.168 0.866
No specific place 668 0.434 0.035 628 0.411 0.033 0.485 0.628
Type of Handwashing Facility (after using toilet):
Tap, faucet 368 0.095 0.036 355 0.113 0.023 –0.409 0.682
Basin, bucket 368 0.334 0.030 355 0.361 0.032 –0.594 0.553
Container from which water is poured 368 0.429 0.040 355 0.389 0.035 0.765 0.444
Water available at handwashing station 348 0.787 0.030 337 0.807 0.023 –0.521 0.602
Soaps Available at the Place for Washing Hands (after using toilet):
Multipurpose bar soap 669 0.272 0.027 631 0.311 0.026 –1.015 0.310
Beauty, toilet bar soap 669 0.009 0.004 631 0.011 0.004 –0.354 0.724
Powder soap, detergent 669 0.070 0.012 631 0.068 0.011 0.128 0.898
No soap observed 669 0.173 0.021 631 0.162 0.019 0.411 0.681
Location of Handwashing Facility (during food preparation):
Inside toilet facility 689 0.012 0.005 670 0.007 0.003 0.722 0.470
Inside food preparation area 689 0.062 0.012 670 0.066 0.013 –0.181 0.857
In yard, less than 3 feet from cooking facility 689 0.184 0.026 670 0.216 0.026 –0.876 0.381
In yard, between 3–10 feet from cooking facility 689 0.148 0.017 670 0.145 0.014 0.150 0.881
In yard, more than 10 feet from cooking facility 689 0.086 0.011 670 0.054 0.011 2.028 0.043
No specific place 689 0.508 0.027 670 0.512 0.031 –0.096 0.923
Type of Handwashing Facility (during food preparation):
Tap, faucet 303 0.026 0.012 299 0.043 0.012 –1.000 0.317
Basin, bucket 303 0.706 0.028 299 0.692 0.032 0.331 0.741
Water available at handwashing station 293 0.648 0.035 281 0.737 0.031 –1.896 0.058
Soaps Available at the Place for Washing Hands (during food preparation):
Multipurpose bar soap 324 0.386 0.034 314 0.414 0.036 –0.565 0.572
Beauty, toilet bar soap 318 0.006 0.004 305 0.003 0.003 0.553 0.580
Powder soap, detergent 319 0.210 0.032 313 0.326 0.031 –2.591 0.010
No soap observed 326 0.368 0.033 312 0.301 0.030 1.488 0.137
HH has improved water source 781 0.700 0.044 764 0.687 0.041 0.219 0.826
HH has improved sanitation 779 0.601 0.048 768 0.793 0.042 –2.995 0.003
HH has soap and water at HW station 782 0.312 0.026 768 0.333 0.029 –0.552 0.581
8154-CH06.pdf 568154-CH06.pdf 56 6/28/11 12:46 PM6/28/11 12:46 PM

Findings from the Impact Evaluation Baseline Survey in Senegal Annex 2: Test of Baseline Balance
www.wsp.org 57
TABLE 38: HANDWASHING BEHAVIOR
Treatment Control
z-value p-valueN Avg. SE N Avg. SE
Last Moment of Hand Wash Since Yesterday:
Bathing a child 1040 0.525 0.027 984 0.434 0.027 2.379 0.017
Bathing oneself 1044 0.565 0.024 984 0.530 0.023 1.037 0.300
Using toilet 1033 0.141 0.014 976 0.169 0.016 –1.324 0.186
Cleaning baby bottom 1034 0.106 0.015 978 0.100 0.013 0.308 0.758
Cleaning latrine 1033 0.028 0.006 976 0.009 0.003 2.643 0.008
Cleaning toilet 1033 0.065 0.012 976 0.049 0.008 1.101 0.271
Returning home 1034 0.056 0.010 977 0.055 0.008 0.065 0.948
Preparing food, cooking 1035 0.083 0.010 978 0.092 0.012 –0.572 0.567
Feeding children 1033 0.042 0.009 976 0.039 0.006 0.256 0.798
Washing child’s hands 1034 0.034 0.006 976 0.023 0.005 1.402 0.161
Cleaning dishes 1039 0.293 0.017 982 0.270 0.018 0.903 0.366
Doing laundry 1040 0.412 0.017 981 0.406 0.020 0.218 0.827
When looked dirty 1034 0.051 0.011 976 0.054 0.008 –0.233 0.816
Eating 1035 0.114 0.014 979 0.122 0.012 –0.417 0.677
Other 1033 0.014 0.004 976 0.027 0.006 –1.724 0.085
Caregiver’s Fingernails Appear to Be:
Visibly dirt 1024 0.119 0.015 980 0.089 0.010 1.646 0.100
Unclean 1024 0.166 0.016 980 0.186 0.018 –0.828 0.408
Clean 1024 0.715 0.022 980 0.726 0.022 –0.346 0.729
Caregiver’s Palms Appear to Be:
Visibly dirt 1032 0.037 0.006 981 0.037 0.008 0.012 0.990
Unclean 1032 0.124 0.014 981 0.121 0.014 0.137 0.891
Clean 1032 0.839 0.017 981 0.842 0.017 –0.122 0.903
Caregiver’s Finger Pads Appear to Have:
Visible dirt 1032 0.043 0.007 978 0.035 0.008 0.745 0.456
Unclean appearance 1032 0.125 0.014 978 0.134 0.014 –0.460 0.646
Clean appearance 1032 0.832 0.017 978 0.831 0.016 0.046 0.963
Best Way to Clean Hands:
Wipe on cloth 936 0.000 0.000 892 0.007 0.003 –2.207 0.027
Wash with water alone 936 0.022 0.005 892 0.017 0.005 0.758 0.448
Wash with soap 936 0.973 0.006 892 0.973 0.007 0.022 0.982
Wash with ash, mud 936 0.002 0.001 892 0.003 0.002 –0.431 0.667
8154-CH06.pdf 578154-CH06.pdf 57 6/28/11 12:46 PM6/28/11 12:46 PM

Findings from the Impact Evaluation Baseline Survey in Senegal Annex 2: Test of Baseline Balance
58 Global Scaling Up Handwashing
TABLE 39: ALRI AND DIARRHEA PREVALENCE (% CHILDREN <5)
Treatment Control
z-value p-valueN Avg. SE N Avg. SE
Diarrhea symptoms:
Diarrhea symptoms in previous
48 hours 2123 0.066 0.009 2054 0.068 0.007 –0.107 0.915
Diarrhea in previous 7 days 2123 0.097 0.011 2054 0.102 0.009 –0.328 0.743
Diarrhea in previous 14 days 2123 0.106 0.011 2054 0.112 0.010 –0.406 0.685
ALRI symptoms:
ALRI in previous 48 hours 2123 0.017 0.003 2054 0.019 0.004 –0.400 0.689
ALRI in previous 7 days 2123 0.023 0.004 2054 0.026 0.005 –0.519 0.604
ALRI in previous 14 days 2123 0.024 0.004 2054 0.029 0.005 –0.648 0.517
Average hours spent on Child
Caring last week 2026 2.135 0.032 1961 2.125 0.028 0.222 0.824
Household lost working hours
due to child illness (over all HHs) 7277 0.204 0.031 8478 0.292 0.035 –1.900 0.057
Diarrhea Treatment:
No treatment 296 0.672 0.040 288 0.750 0.030 –1.568 0.117
Pill or syrup 274 0.712 0.033 300 0.710 0.026 0.040 0.968
Injection 143 0.028 0.015 144 0.056 0.019 –1.141 0.254
Traditional remedies 192 0.370 0.048 174 0.282 0.042 1.377 0.169
Caregiver did not pay for diar-
rhea treatment 75 0.240 0.071 58 0.190 0.052 0.574 0.566
ALRI Treatment:
No treatment 167 0.856 0.032 165 0.842 0.033 0.301 0.763
Pill or syrup 272 0.941 0.015 239 0.895 0.025 1.564 0.118
Traditional remedies 85 0.612 0.075 62 0.452 0.084 1.423 0.155
Other 46 0.304 0.084 48 0.271 0.067 0.311 0.756
Caregiver did not pay for ALRI
treatment 23 0.174 0.079 23 0.130 0.092 0.359 0.720
TABLE 40: CHILD GROWTH AND ANEMIA (CHILDREN <2)
Treatment Control
z-value p-valueN Avg. SE N Avg. SE
Anthropometric measures:
Arm circumference-for-age z-score 908 –0.192 0.056 834 –0.168 0.060 –0.290 0.771
Weight-for-age z-score 1006 –0.691 0.053 932 –0.654 0.049 –0.508 0.611
Length/height-for-age z-score 992 –0.591 0.062 916 –0.519 0.065 –0.809 0.419
BMI-for-age z-score 971 –0.465 0.051 899 –0.431 0.052 –0.455 0.649
Weight-for-length/height z-score 1026 –0.493 0.046 957 –0.472 0.050 –0.313 0.755
Head circumference-for-age z-score 1005 –0.043 0.037 931 –0.065 0.049 0.356 0.722
Anemia (Hb <110g/L) 785 0.907 0.013 779 0.908 0.012 –0.032 0.974
8154-CH06.pdf 588154-CH06.pdf 58 6/28/11 12:46 PM6/28/11 12:46 PM

Findings from the Impact Evaluation Baseline Survey in Senegal Annex 2: Test of Baseline Balance
www.wsp.org 59
TABLE 41: CHILD LEARNING ENVIRONMENT (CHILDREN <2)
Treatment Control
z-value p-valueN Avg. SE N Avg. SE
Plays with household objects 1092 0.665 0.016 1035 0.690 0.015 –1.125 0.261
Plays with toys 1090 0.417 0.029 1035 0.425 0.023 –0.233 0.816
Attends early education program 1089 0.011 0.003 1033 0.011 0.004 0.079 0.937
Adults read books with child 1087 0.041 0.009 1032 0.095 0.016 –2.956 0.003
Adults tell stories to the child 1087 0.169 0.016 1032 0.206 0.016 –1.601 0.109
Adults sing songs with child 1083 0.682 0.025 1031 0.710 0.024 –0.789 0.430
Adults take the child outside the home 1091 0.815 0.019 1036 0.802 0.017 0.505 0.614
Adults play with the child 1089 0.851 0.016 1036 0.842 0.018 0.404 0.686
Adults spend time naming, counting, and drawing 1087 0.245 0.022 1030 0.289 0.023 –1.379 0.168
8154-CH06.pdf 598154-CH06.pdf 59 6/28/11 12:46 PM6/28/11 12:46 PM

Findings from the Impact Evaluation Baseline Survey in Senegal Annex 3: Sample Representativeness
60 Global Scaling Up Handwashing
Table 43 presents information on basic household composi-tion. Overall the comparison shows very similar results across the two surveys. For drinking water sources, 26.6 percent of the HHs piped water into the yard in the WSP IE survey whereas 16.7 percent of the DHS survey reported this type of facility. The most common type of toilet facility in the
The experimental group for the project impact evalua-tion was designed with the primary intention of produc-ing internally valid estimates of program impacts under the unique constraints of the project, and is not intended to be suitable for computing country, region, or commune level population statistics without additional assumptions. The experimental group is not a representative sample of the Senegalese population for several reasons:
• At the regional level, the experimental study includes only four out of a total of 11 regions that Senegal had when the baseline survey was conducted.
• At the commune level, the study includes only 88 out of 364 collectivités locales in Senegal. Addition-ally, these 88 collectivités were randomly selected for the purpose of the impact evaluation, rather than being weighted by population.
• At the household level, the study comprises only households with a child under the age of two at the time of the baseline survey.
Presented here is a comparison of basic characteristics of the Senegal population using the 2005 Senegal Demographic Health Survey (SNDHS) with characteristics of the indi-viduals included in the WSP IE survey subsample. The two surveys compare demographics characteristics, household assets, and facility composition.
Table 42 presents the basic demographics for the two sample populations. The large proportion of children between 0 and 4 years and household members from 25 to 35 are evidence of the WSP study sample selection restriction to households with children under two years old. As expected, on average, the individuals interviewed in the WSP survey are younger (20.3 years old) than those included in the SNDHS sample (22.3 years old). Similarly, while the average number of chil-dren under the age of five per household is 1.8 in the SNDHS, this figure is 2.7 in the WSP survey, again a likely factor of the unique sample selection of the WSP survey where each house-hold must have a child under the age of two.
Annex 3: Sample Representativeness
TABLE 42: HOUSEHOLD DEMOGRAPHICS
WSP
Survey
DHS
Survey
Age (% Individuals):
0–4 22.1% 16.8%
5–9 16.3% 15.0%
10–14 11.4% 13.4%
15–19 9.0% 11.2%
20–24 8.2% 8.2%
25–29 6.4% 6.6%
30–34 5.6% 5.3%
35–39 4.8% 4.4%
40–44 3.3% 3.7%
45–49 2.9% 3.2%
50+ 9.8% 12.1%
Average age 20.3 22.3
HH size 12.2 9.3
Total number of children under 5 (% HHs):
0 0.0% 27.6%
1 21.7% 23.1%
2 35.8% 22.2%
3 18.3% 12.7%
4 11.8% 6.6%
5 6.4% 3.6%
>5 6.0% 4.1%
Average number of children under 5 in HH 2.7 1.8
HH heads are male (% individuals) 87.2% 77.4%
School Attendance (% of individuals, children > 5):
Ever attended school 41.7% 41.2%
Currently enrolled in school 23.1% 22.4%
8154-CH06.pdf 608154-CH06.pdf 60 6/28/11 12:46 PM6/28/11 12:46 PM

Scaling Up Handwashing Behavior: Findings from the Impact Evaluation Baseline Survey in Senegal Annex 3: Sample Representativeness
www.wsp.org 61
WSP IE survey consists of flush to septic tank (37.3 percent) and a similar pro-portion of households (33.4 percent) own the same type of facility in the DHS survey. Rates for open defecation are also similar among the respondents of both surveys. There is a parallel trend in floor materials between the two surveys; cement is the most popular type for both (WSP 46.4 percent and DHS 39.6 percent). As for asset ownership, a large number of households own radios in both the WSP and the DHS samples (70.3 percent and 86.4 percent respectively). Ownership of assets such as TV, video, computer, motorbike, automobile, refrigerator and wash-ing machine also present very similar distributions between the two surveys; how-ever, ownership of a bicycle or a stove show variation between the studies.
TABLE 43: DWELLING CHARACTERISTICS, HOUSEHOLD ASSETS AND ACCESS TO WATER AND SANITATION
WSP Survey DHS Survey
Sources of Drinking water (% of HHs with access to a drinking water source):
Piped water, into yard, plot 26.6% 16.7%
Piped water, public tap, standpipe 24.4% 20.0%
Dug well, unprotected 25.8% 27.3%
Type of Toilet Facility (% of HHs with access to a toilet facility):
Flush, to septic tank 37.3% 33.4%
Pit latrine with slab 17.8% 24.2%
No facilities, bush, field 21.6% 25.8%
Flooring Materials (% HHs):
Linoleum, vinyl, asphalt 12.6% 11.7%
Soil, sand 25.6% 35.4%
Cement 46.4% 39.6%
HH Assets:
Radio 70.3% 86.4%
TV 41.5% 35.2%
Video 17.2% 11.4%
Computer 2.7% 1.5%
Bicycle 8.9% 16.3%
Motorbike 6.3% 7.0%
Automobile or truck 3.9% 6.0%
Refrigerator 11.1% 16.6%
Washing machine 0.1% 0.4%
Cooker 37.9% 21.0%
8154-CH06.pdf 618154-CH06.pdf 61 6/28/11 12:46 PM6/28/11 12:46 PM

7457-Book.indd 907457-Book.indd 90 8/16/10 7:04 AM8/16/10 7:04 AM

7457-Book.indd 917457-Book.indd 91 8/16/10 7:04 AM8/16/10 7:04 AM

7457-Book.indd 927457-Book.indd 92 8/16/10 7:04 AM8/16/10 7:04 AM