scaling up distributed solar in emerging markets
TRANSCRIPT

Policy Research Working Paper 8103
Scaling Up Distributed Solar in Emerging Markets
The Case of the Arab Republic of Egypt
Dalia SakrJoern HuentelerTyeler MatsuoAshish Khanna
Energy and Extractives Global Practice GroupJune 2017
WPS8103P
ublic
Dis
clos
ure
Aut
horiz
edP
ublic
Dis
clos
ure
Aut
horiz
edP
ublic
Dis
clos
ure
Aut
horiz
edP
ublic
Dis
clos
ure
Aut
horiz
ed

Produced by the Research Support Team
Abstract
The Policy Research Working Paper Series disseminates the findings of work in progress to encourage the exchange of ideas about development issues. An objective of the series is to get the findings out quickly, even if the presentations are less than fully polished. The papers carry the names of the authors and should be cited accordingly. The findings, interpretations, and conclusions expressed in this paper are entirely those of the authors. They do not necessarily represent the views of the International Bank for Reconstruction and Development/World Bank and its affiliated organizations, or those of the Executive Directors of the World Bank or the governments they represent.
Policy Research Working Paper 8103
This paper is a product of the Energy and Extractives Global Practice Group. It is part of a larger effort by the World Bank to provide open access to its research and make a contribution to development policy discussions around the world. Policy Research Working Papers are also posted on the Web at http://econ.worldbank.org. The authors may be contacted at [email protected] and [email protected].
Like many emerging markets, the Arab Republic of Egypt is keen to promote distributed solar, defined here as systems below 500 kilowatts, but has struggled to create condi-tions for growth in the sector. The aim of this paper is to identify policy actions to unlock the distributed solar market for on-grid and off-grid applications, using Egypt as a case study. The paper calculates the rate of return on investment for different distributed solar applications, identifies nonfinancial barriers to scaling up distributed solar, and derives policy implications. For on-grid appli-cations, the analysis finds that neither net metering nor the feed-in tariff makes distributed solar financially attrac-tive, despite recent reductions in electricity subsidies and adjustments of feed-in tariff levels in October 2016. For off-grid applications, the profitability of distributed solar depends highly on the local price of diesel: distributed solar
is viable only in areas where diesel is not available at the official (subsidized) price. In addition, several nonfinancial barriers limit the scalability of the distributed solar market. These findings indicate that the distributed solar market in Egypt will remain a niche market in the next few years with-out strengthened government support. First, for on-grid applications, the net metering scheme should be kept in place until a bankable feed-in tariff has been established. Second, for off-grid applications, the government should explore interventions to unlock opportunities in the agri-culture and tourism sectors. Third, the government should strengthen private-sector activity in the sector, including by addressing nonfinancial barriers, such as transaction costs and gaps in the availability of data, and by building capacity among users, suppliers, and financial institutions.
Scaling Up Distributed Solar in Emerging Markets – The Case of the Arab Republic of Egypt1
Dalia Sakra*, Joern Huentelerb, Tyeler Matsuoc, Ashish Khannab
a Energy & Resource Efficiency Cross Cutting Advisory Solutions, IFC. b Energy & Extractives Global Practice, The World Bank. c Department of Humanities, Social and Political Sciences, ETH Zurich. *Corresponding author: [email protected]
Keywords: Solar PV, distributed energy, feed-in tariffs, net metering, off-grid PV, Egypt;
JEL codes: H23, O13, Q42, Q48
1 Any views presented here are the authors alone and should not be attributed to the World Bank, the Egyptian Government or any other person or institution. We are very grateful for financial support from the Energy Sector Management Assistance Program (ESMAP). We thank Raihan Elahi, Amit Jain, Marwa Khalil, and Bryanne Tait who acted as peer reviewers. Any shortcomings are the sole responsibility of the authors.

2
1. Introduction
Solar PV has grown exponentially over the past decade. Cumulative PV installed capacity worldwide
jumped from 39 GW in 2010 to more than 222 GW in 2015, driven by government-led incentives and
falling costs (IEA, 2016a; IRENA, 2016).
Distributed solar PV systems, from here on referred to as distributed solar, account for about 42 percent
of the global solar PV installations (IEA, 2016b).2 Global investment in distributed solar has grown rapidly
over the last decade, from US$9.4bn in 2006 to US$67.4bn in 2015, as shown in Figure 1 (UNEP & BNEF,
2015). However, distributed solar investments have been concentrated in OECD countries, especially
Europe, Australia, Japan and the United States (IEA, 2016a). Emerging markets have struggled to unlock
this market; instead, most investment remains focused on large, utility-scale power plants. In recent
years, emerging markets such as India and China have set ambitious targets for distributed solar, but have
not been able to tap into this market as intended, despite targeted policy incentives (e.g., ADB, 2015;
Liang, 2014).
Figure 1: Global renewable asset investment 2005-2015 (REN21, 2013).
Like many emerging markets, the Arab Republic of Egypt is keen to promote distributed solar but has
struggled to create conditions for growth in the sector. Egypt has set a target of 20 percent of its electricity
generating capacity coming from renewable sources by 2022, which represents more than doubling of the
current share of 9.5 percent (including hydro which currently represents about 6% of the total capacity
and is expected to decrease to 4% by 2022). In 2013, the country introduced a net metering program to
2 The IEA in this statistic uses a definition of systems below 100 kilowatts (kW). This paper uses a definition of up to 500 kW to be consistent with the Government of Egypt’s definition.
63 76 7954 60 67
34220
50
100
150
200
250
300
212
243 249
2012 2013
Distributed solarinvestment
US$ bn
2006
124
2007
14
94
63
2005
9
266
2015
Utility-scale renewable asset investment
2014
10
2009
158 154
2008
216
20112010
257

3
promote distributed solar. In September 2014, the Government of Egypt (GoE) approved Feed-in Tariffs
(FIT) for electricity projects produced from renewable energy resources (solar energy and wind). A total
target of 4,300 MW is to be achieved under the FIT program, including 300 MW for distributed PV
installations below 500 kW. This program was extended by another two years in 2016, with revised tariffs.
However, under the FIT, investors have so far focused almost exclusively on utility-scale systems, and the
government is seeking ways to promote growth in the distributed solar segment (NREA, 2016).
Distributed solar systems that are connected to the grid – such as most rooftop installations – generate
power where it is consumed and thus reduce transmission and distribution (T&D) losses and avoid
additional T&D investments. Off-grid solar systems can displace imported diesel for off-grid users, thereby
reducing the fiscal burden of imports on the government budget (where diesel is subsidized), improving
the current account deficit, and mitigating the environmental and health hazards faced by local
communities when exposed to pollutants from diesel generators. In the case of Egypt, which faces huge
income disparities between rural and urban communities, distributed solar projects could further
contribute to the government’s plans to reach out to underprivileged regions, such as Upper Egypt, and
generate job opportunities for local service providers and installers.
This paper explores in depth the case of distributed solar in Egypt. While generally it aims to provide
recommendations to policy makers in Egypt on how to overcome barriers to investment in distributed
solar3 through investor-friendly policy frameworks, the conclusions and recommendations may also apply
to other emerging markets seeking to scale up their distributed solar market. The methodology for this
paper was as follows. First, a literature review was conducted of the global and Egyptian experience with
promoting distributed solar PV (section 2). Second, the investment case for distributed solar projects was
modeled for different distributed solar applications. The results of this analysis are presented in section
3. Third, a series of stakeholder interviews and consultation workshops were held with government
entities, clean tech entrepreneurs and NGOs/associations in Egypt (Annex 1 provides a list of
interviewees) between 2016 and 2017 in order to identify additional non-financial barriers to the
diffusion of distributed solar. Section 4 summarizes the outcomes of these workshops. The paper
concludes with policy recommendations in section 5.
3 For the purposes of this paper, distributed solar is defined as systems up to 500 kW, in line with the government’s definition under the feed-in tariff program.

4
2. Public Policy Experience in Promoting Distributed PV
2.1. Global Experience
Grid-connected distributed solar
Grid-connected distributed solar has outpaced utility scale solar in several OECD countries, especially in
Australia, where 94 percent of total PV capacity comes from distributed solar4; Japan (85 percent) and
Germany (56 percent), as shown in Figure 2.
Figure 2: Share of utility-scale and distributed solar globally and in the seven largest markets (Gupta, Sharda, & Shrimali, 2016), ordered by total market size. India data is for March 2016, other countries’ data for 2015.
Investment in on-grid distributed solar has in part been driven by market forces, as solar costs have
become competitive with retail electricity prices (i.e., they have reached ‘grid parity’) in many countries.
Distributed solar remains more expensive than utility-scale projects5 on a per-kW basis (REN21, 2016), but
costs have fallen steeply over the past five years (see Figure 3). In Australia, China, Germany, Italy and
the United States, the average levelized cost of electricity (LCOE) for residential PV systems fell by 42 to
4 Note that the solar PV market in Australia is small in comparison to other OECD countries. Thus, while the share of distributed solar is high, this is partly due to the fact that utility-scale solar PV was not supported with strong policies in Australia and therefore deployment of utility-scale solar has been very limited. 5 The capital cost of a PV system has two main components: (i) PV module cost, which includes raw materials for PV cells and manufacturing & assembly and (ii) the balance of system (BoS) costs. The BoS cost includes the structural system (e.g., site preparation), the electrical system costs (e.g., inverter, transformer), storage system if needed (e.g., a battery), and the soft costs of system development (e.g., permitting, labor costs for installation). Modules are traded globally and prices are relatively similar between countries, while the BoS differs from country to country and by end user category. Typically, large utility-scale projects have the lowest BoS costs per kW while the highest is the small residential rooftop systems due to economies of scale.
42%
14%
56%
85%
29% 33%
94%
58%
86%
44%
15%
71% 67%
89%
11%
100%39,700232,000 MW 18,920
USChinaGlobal Germany
43,530 25,62034,410
Japan Italy
6%5,0706,740
AustraliaIndia
Distributed solarUtility-scale solar

5
64 percent between 2008 and 2014 (IRENA, 2015). Wherever retail electricity tariffs are high – be it due
to taxes or high system costs – these cost trends have made distributed solar financially attractive for
households and commercial electricity consumers. This is particularly the case for Australia which, due to
its geography, is characterized by high distribution costs and thus high end-user tariffs. In some remote
locations, end-users are even expected to pay for their grid-connection costs, thus making self-
consumption of solar PV an attractive alternative.
Notably, as can be seen from Figure 3, the cost of distributed solar differs significantly between countries.
These cost differentials have in part been attributed to the cumulative market size in each country, as
more installations lead to learning effects that drive down costs. However, costs differ also because of
differences in ‘soft costs’, including customer acquisition, installation labor, permitting, interconnection,
and inspection procedures (Seel, Barbose, & Wiser, 2014). In Japan, for example, the standardization of
solar PV applications helped drive mass market development. Unlike in countries such as the US, which
cater to a range of distributed solar users (e.g., industrial, remote residential, or infrastructural
applications), the Japanese market is predominantly in the residential sector, with major housing
manufacturers even integrating solar PV into their newly built homes. This model not only allowed for
the integration of the solar system cost into home mortgages, but also helped drive down local installation
and balance-of-system costs as well as customer acquisition costs (Shum & Watanabe, 2007).
Figure 3: Historical and forecast typical solar PV investment costs, average for new capacity (IEA, 2016a)
In all major markets, investment in on-grid distributed solar has also benefited from significant policy
incentives. Most countries have used a combination of policy instruments, often combining performance-
based incentives (i.e., benefits proportional to the amount of electricity produced) with upfront subsidies

6
to reduce the cost of installing the solar system (e.g., rebates, grants, or low-interest loans). In many
countries, the markets for distributed PV only took off when the government allowed for high rates of
return on investment (e.g., Grau, 2014). The most common performance-based incentives are FITs (e.g.,
in Germany, Italy, Japan, and Australia) and net metering (e.g., in the US, Brazil). FIT programs allow
system owners to sell all produced electricity at a fixed price to the distribution utility, which is then often
reimbursed under a government-administered scheme. Under net metering, system owners consume
some of the electricity themselves and receive a credit for all surplus electricity on their electricity bill,
thus paying only for their ‘net’ consumption from the grid. Net metering schemes are attractive where
electricity tariffs are high and are relatively easy to administer, especially for users that already have two-
way meters installed that can run backwards when surplus electricity is fed back into the grid. In contrast,
well-designed FITs can attract renewable energy investors and lenders even when electricity tariffs are
low because they generate stable, low-risk cash flow that is not tied to current electricity tariffs. However,
FITs require more complex interactions with the distribution utility. Notably, most countries with FITs
differentiate tariffs by system size, offering higher rates to owners of distributed solar to account for
higher investment cost, as these are often considered justified due to lower T&D losses and other co-
benefits of distributed energy installations.
More recently, grid-connected distributed solar systems are also gaining momentum in developing
countries, most prominently in China and India. However, in most cases the distributed market segment
has been outpaced by utility-scale solar. China set ambitious targets for distributed solar in 2013 and
2014, aiming to install 8.4 GW by 2014, 20 GW by 2015 and 35 GW by 2017 (Liang, 2014) . However, at
the end of the first quarter of 2016, distributed capacity stood at 7.03 GW (14 percent of the total), even
when using a definition that includes all plants below 6 MW (NEA, 2016). India, too, has set an ambitious
target, aiming to install 40 GW of rooftop solar power by 2022. However, installed capacity was only 0.7
GW at the end of March 2016 (11 percent of the total), and is growing at a rate too slow than what will
be required to achieve the target (Gupta et al., 2016).
Growth of on-grid distributed solar in emerging markets has been subdued, among others, for the
following reasons (ADB, 2015; Gupta et al., 2016):
High upfront cost and limited access to debt finance: Consumers are often reluctant – or do not
have the means – to invest the high upfront amount required to install distributed solar systems.
At the same time, SMEs and households often have limited access to debt because of
underdeveloped financial markets.

7
Counterparty risks: Where net metering schemes exist, utilities are not forthcoming for
implementation as these imply negative cash flows. Where solar is reimbursed through FITs or
other long-term power purchasing agreements (PPAs), contract enforceability is a concern due to
the utilities’ weak balance sheets and/or unwillingness to honor agreements.
Low electricity tariffs: In order to incentivize investments, net metering requires that end-user
electricity tariffs are high, however electricity tariffs in most emerging markets are still subsidized.
Availability of suitable roof space: In many emerging economies, the built environment has
limited physical availability of roof space. A related concern is that of roof rights. For instance, in
case of rented accommodation, there is risk of the title of the rooftop. In case of a leased
property, the tenure of the lease may not match the duration of the PPA for the lifetime of the
solar system. There may also be uncertainty in terms of strength of the building structures and
risk of shadowing in the future.
Off-grid distributed solar
Off-grid distributed solar systems are often deployed to improve access to basic energy services either
through isolated systems that provide energy at a household level (e.g., solar lanterns or solar home
systems) or through community-based micro-grids. Consequently, recent uptakes in investments in off-
grid markets have been concentrated in emerging economies where energy access is still a problem:
Bangladesh is the world’s largest market for solar home systems, and other developing countries (e.g.,
Kenya, Uganda and Tanzania in Africa; China, India and Nepal in Asia; Brazil and Guyana in Latin America)
are seeing rapid expansion of renewables-based mini-grids to provide electricity for people living far from
the grid (REN21, 2016). While the market is still asymmetrically developed – with Kenya, Tanzania and
Ethiopia dominating the African market and India and Bangladesh the Asian market – about 70 countries
worldwide either had some off-grid solar PV capacity installed or had programs in place to support off-
grid solar PV applications by the end of 2015 (REN21, 2016).
The market for pico-solar products, or solar products less than 10W, has rapidly expanded in the last five
years: about 44 million off-grid pico-solar products had been sold globally by mid-2015, representing an
annual market of US$ 300 million. With this market growth, pico-solar products have experienced large
cost reductions due to both technological improvements and increased market competition, and are thus
competitive with alternatives such as kerosene (BNEF & Lighting Global, 2016). The lifecycle costs of larger
off-grid solar systems are also often cheaper than kerosene or diesel-based alternatives. However, the
higher upfront costs of these systems are often prohibitive for rural households with little disposable

8
income. Pay-as-you-go schemes (PAYG), under which the solar provider assumes the upfront cost and
charges the consumer a regular fee to recover its cost, have proven an effective business model for
overcoming this barrier. PAYG schemes are now the most common and fastest-growing business model
in the off-grid sector: BNEF estimates that a total of about US$ 276 million was invested in off-grid solar
companies (solar lanterns and home systems) in 2015, while PAYG companies received 87% of all such
direct investments in 2014 and 2015 (REN21, 2016).
Besides the provision of basic energy services to households or villages, off-grid distributed solar is
increasingly used for commercial applications, including irrigation, refrigeration, food drying or mining
(International Renewable Energy Agency, 2016b). In these applications, solar often displaces diesel
powered generators, which are growing less sustainable in many countries due to diesel scarcity,
increasing fiscal pressure to phase out diesel subsidies, and growing environmental concerns. In
particular, solar pumps for irrigation are gaining support from national governments. India and Morocco,
for example, have set targets to deploy 100,000 solar pumps by 2020 and 2022, respectively (International
Renewable Energy Agency, 2016a) .
In addition to specific targets for off-grid applications, national policies promoting distributed solar
markets have also played a key role in many countries. In early stages of market development, consumer
awareness campaigns that present solar PV as reliable technologies help increase demand and,
consequently, attract distributors and suppliers (BNEF & Lighting Global, 2016). Fiscal incentives (e.g.,
concessional loans, VAT exemptions on solar products or investment subsidies) are often highly effective
for technology diffusion given that off-grid customers tend to be highly price sensitive (REN21, 2016).
While the off-grid solar market has grown considerably in the last five years, several bottlenecks are cited
as a barrier for further growth (BNEF & Lighting Global, 2016):
High up-front cost, long payback times and limited access to finance. Finance provision is
currently dominated by donors and social impact investment funds, with some additional funding
coming from crowdfunding schemes. However, impact investors and donors are often unwilling
to invest in emerging SMEs with unfamiliar business models or operating in risky markets.
Distributors and manufacturers of off-grid solar technologies also lack access to debt finance, and
thus have limited working capital to scale-up operations. Finally, consumers living in rural areas
often have limited disposable income to pay for solar products and few acceptable assets to use
as collateral for loans.
9
Ready access to low-cost fossil fuel alternatives. In many potential markets, the presence of
fossil fuel subsidies (e.g., for diesel) provide little incentive to switch to solar powered
technologies.
Race to the bottom for solar products. Recent years have seen a proliferation of generic solar
products, some of which are of poor quality. The prevalence of these poor-quality products risks
market spoiling, particularly in areas in which the off-grid market is immature.
Last-mile distribution of quality products. While there is often awareness of off-grid solar
technologies, many potential users are unaware of where to buy a quality product. Furthermore,
in case technologies need to be tailored to specific applications (e.g., for solar irrigation systems),
there are often few incentives for suppliers to develop the appropriate technologies for new
markets.
2.2. Egypt’s Experience
The total installed PV capacity in Egypt was about 32.1 MW in 2015 (NREA, 2016). These are mostly stand-
alone applications, including solar powered mobile telephone towers, advertisements along highways,
solar pumps for irrigation, as well as 10 MW PV-diesel hybrid system in Siwa financed through a United
Arab Emirates grant and operated by El-Behera Distribution Company.6 Grid-connected PV capacity is
limited, but includes some public and residential buildings, e.g., a 540 kW system at the Egyptian Electricity
Holding Company and affiliated companies.
On-grid distributed solar in Egypt
While the GoE has not yet conducted a comprehensive assessment of its distributed solar potential, this
potential is likely to be very significant. Space for ground-mounted distributed solar is, by all practical
means, unlimited. Rooftop space is more limited because much of Egypt’s urban population lives in
densely built, multi-level apartment buildings, however suburban and rural areas as well as industrial and
commercial rooftops still provide plenty of space. To promote investment in this segment, Egypt is
offering net metering and FIT schemes for distributed solar.
6 The Middle Egypt Distribution Company has plans to use the same grant funds to install up to 6 MW of solar PV retrofits to hybridize Farafra, Abu Monqar and Qora Al Arbaeen diesel mini-grids.

10
The net metering scheme, adopted in early 2013 by EgyptERA, allows small-scale renewable energy
projects in the residential and industrial/commercial sector to feed electricity into the low voltage grid
(EgyptERA, 2013). The net metering scheme does not specify a limit on installed capacity, meaning that
customers can connect a system that produces more electricity than they consume, however systems are
limited to the low voltage level, typically around 380 volts. Under the scheme, PV generation is credited
against the user’s bill for consumption from the grid using a slightly unconventional crediting method7
(Åberg, 2014). This crediting method, which credits surplus electricity only in the consumers’ highest tariff
bracket, was adopted to maximize bill savings. However, this crediting scheme also adds complexity to
the Egyptian net metering design because it requires relatively complex billing procedures by the
distribution companies – especially if the consumer produces more electricity than is used in its highest
tariff bracket. This calculation method also requires two installed meters, just like in a FIT system,
eliminating one of the advantages of a normal net metering scheme.
The technical potential for net metering is significant. In terms of household consumption alone, the
highest two tariff brackets (above 650 kWh) consume 5,866 GWh per year (see Table 1). Despite this
potential, however, the net metering scheme has seen only very limited uptake. The main reason is that,
even after the tariff increases of 2014 and 2015, Egypt still had relatively low retail tariffs for electricity.
Tariffs are highest for household and commercial consumers, but even the top percentile of these groups
faced prices no higher than EGP 0.84 per kWh and EGP 0.86 per kWh, respectively, until the summer of
2016 (see Table 6 in Annex 2). The tariff reform announced in August 2016 has raised these categories to
EGP 0.95 and EGP 0.96 per kWh, respectively (see Table 1), but it is too early to judge the impact of these
tariff reforms on investor interest in net metering.
7 Surplus is being credited only against electricity consumed in the consumers’ highest tariff bracket for each month. If the consumer manages to produce more electricity than the one consumed in the highest tariff bracket, the excess amount is credited to the next month. A final settlement is done in the end of each year for the residential sector and in the end of each month for certain sectors such as street lighting. Any surplus electricity in the end of the settlement period will be granted to the distribution company (Åberg, 2014).

11
Table 1: Household consumption by tariff block and tariffs paid in 2014 (EgyptERA, 2014)
Residential tariff blocks Consumers per block
Total consumption
billed per block (GWh)
Tariff (PT/kWh)
Total value of consumption
per block (million EGP)
0 – 100 kWh 0 – 50 kWh 4.240 million 2,442 11.0 269
51 – 100 kWh 2.650 million 2,932 19.0 557
101 – 1,000 kWh
0 – 200 kWh 8.215 million 16,956 21.5 3,646
201 – 350 kWh 7.685 million 22,271 42.0 9,354
351 – 650 kWh 3.180 million 17,057 55.0 9,381
651 – 1,000 kWh 0.265 million 2,353 95.0 2,235
Above 1,000 kWh 0 -> 1,000 kWh 0.265 million 3,513 96.0 3,337
Total 26.500 million 67,524 28,779 aAssuming 1,700 full load hours per year.
In addition to the net metering scheme, Egypt introduced a FIT scheme in October 2014. Under the
scheme, the electricity transmission company and the distribution companies are committed to purchase
all power from eligible solar plants through 25-year PPAs. Distributed solar projects are to be handled by
the distribution companies. The government set a target of 4,300 MW under the FIT to be achieved by
2016, including 300 MW for distributed PV and 2,000 MW for utility scale solar. The tariff rates are
differentiated by system size (see Table 2), with original tariffs for distributed PV (set in 2014) ranging
from EGP 0.844 per kWh for systems below 10 kW up to EGP 0.973 per kWh for systems between 200 kW
and 500 kW. These tariffs were lower than those for utility scale projects because the government
envisioned that distributed solar investors would have access to concessional finance in local currency.
Specifically, the Ministry of Finance had proposed a financing program under which investors could
receive concessional loans at 4% interest for installations below 10 kW and 8% for installations below 500
kW. However, this financing program was not implemented.
Egypt’s FIT program generated considerable investor interest in the utility-scale segment. More than 40
utility scale solar PV projects with a total of 2,000 MW of capacity are under development, and
development banks including the IFC, EBRD and AfDB are considering concessional finance in the order of
US$3bn. However, the program ran into a roadblock when projects failed to reach financial closure in the
summer of 2016 amid the foreign exchange shortage and unfavorable arbitration arrangements, leading
lenders to wait for conditions to improve.

12
Distributed solar received much less interest. The concessional financing program was not implemented,
leaving investors with a FIT that was financially unattractive at market lending conditions. Falling far short
of the 300 MW target, Egyptian distribution companies have received about 200 requests for small solar
projects implemented on building rooftops as of October 2016 (Egypt O&G, 2016). North Cairo Electricity
Distribution Company, one of the nine distribution companies in Egypt, reports that 15 rooftop plants
ranging between 6 kW and 20 kW are connected to their network (Egypt O&G, 2016).
On September 6, 2016, the government introduced new FITs effective October 28, 2016. At the time of
their introduction, these tariffs, shown in Table 2, were higher for distributed solar (increases between
4.8% and 28.6%) and significantly lower for utility-scale projects (-41.4% and -42.6%) in order to account
for changes in the assumptions on lending conditions, technology cost and the exchange rate. The
government hopes that these revised tariffs will sustain interest in the utility-scale segment (projects are
allowed to transition to phase II) while attracting more investors into the distributed solar segment.
Additionally, although the original concessional finance program was never implemented, SMEs in Egypt
are eligible for loans at 5% interest rate since January 2016, as Egypt has taken recent steps to expand
commercial lending to SMEs. The effect of these changes on the market is not yet clear.
Table 2: Feed-in tariff rates for solar PV in Egypt (EgyptERA, 2014).
October 2014 to October 27, 2016 October 28, 2016 onwards Change
Residential ≤ 10 kW 84.4 PT/kWha 108.5 PT/kWha 28.6 %
Installed Capacity ≤ 200 kW 90.1 PT/kWha 108.5 PT/kWha 20.4 %
200 kW ≤ Installed Capacity < 500 kW 97.3 PT/kWha 102.0 PT/kWha 4.8 %
500 kW ≤ Installed Capacity < 20 MW 13.6 US$ cent/kWhb [7.8 US$ cent/kWhc]
6.6 US$ cent/kWh -42.6%
20 MW ≤ Installed Capacity ≤ 50 MW 14.34 US$ cent/kWhb [8.4 US$ cent/kWhc]
7.1 US$ cent/kWh -41.4%
aFor installations below 500 kW, the FIT program envisioned that the Ministry of Finance would provide soft loans, at 4 percent interest rate for residential projects and up to 200 kW and 8 percent interest rate for projects ranging between 200 kW and 500 kW. However, these concessional loans were not made available. The new FIT rates are based on market lending rates. bThe PV projects’ feed-in tariff for installed capacities more than 500 kW was to be paid in Egyptian pounds according to the following equation: FIT (in EGP) =[0.15 X FIT (US$ cent) X 7.15] + 0.85 X FIT (US$ cent) X exchange rate on the bill issuance day, as stated in the contract]. c The FIT for installed capacities more than 500 kW, is being paid in Egyptian pounds according to the following equation: FIT (EGP) =[0.30 X FIT (US$ cent) X 8.88] + [0.70 X FIT ($.Cent) X exchange rate on the bill issuance day, as stated in the contract]. The higher numbers cited here represent the FIT rate in EGP assuming an exchange rate of 8.88 EGP per USD, which was the exchange rate as of October 28, 2016. However, since the revision of the FIT in October 2016, the value of the EGP has decreased significantly. As a result of this devaluation and the indexing methodology used for setting FIT rates, the large-scale FITs effectively stand around 6.6 US$ cent/kWh (500kW – 20MW) and 7.1 US$ cent/kWh (20MW – 50MW), assuming an exchange rate of 18 EGP per USD.

13
In sum, during the first three years of support for on-grid distributed solar, neither the net metering nor
the FIT program has seen significant uptake as neither made distributed solar financially attractive for a
wide set of consumers. The business models pursued thus far have targeted either large commercial
consumers or rich households and operate largely under the net metering scheme. Additionally, there
are some business models that operate under neither policy mechanism, and instead focus on behind-
the-meter solar for self-consumption, targeting users that pay particularly high prices for marginal
consumption.8 These models are only applicable to a small niche of the Egyptian market. This paper thus
analyzes recent upward tariff and FIT revisions in order to understand if these changes can unlock a
greater portion of the market.
Off-grid distributed solar in Egypt
Egypt’s populated areas are almost fully electrified (over 99 percent), yet, due to growing off-grid energy
demand across the sectors of agriculture, tourism, residential, and extractive industries, the off-grid
market potential is high. Agricultural farmland in particular is increasingly located in off-grid areas, such
as the export-oriented mega-farms in the Western Desert. There is also rapid expansion into new
underdeveloped areas under projects announced by the government, such as the 1.5 Million Feddan9
desert reclamation project and the Golden Triangle Project.
No policy incentives exist to promote distributed solar for off-grid electricity. At present, the off-grid areas
are either partially or entirely dependent on diesel-based technologies, including generator sets, pumping
systems and desalination units. The formal price of diesel fuel is EGP 2.35 per liter in 2017. However,
many of the off-grid users obtain it at higher prices from the market and frequently face shortages of
supply. The agriculture sector is expecting that the diesel cost will increase in 2019 to be around US$ 0.70
to US$ 1.00 per liter including transportation costs to the site, which, assuming an exchange rate of 18
EGP per US$, is more than five times as much as the current subsidized rate (RCREEE, 2016). However,
because diesel is still frequently available at prices below market rates and no equivalent financial
incentives are available for solar PV, adoption of off-grid solar solutions remains limited.
Based on the existing diesel consumption, the total off-grid PV potential is estimated at 2,097 MW,
equivalent to around US$ 4 billion in investment, as shown in Table 3 (RCREEE, 2016). While a large share
8 These users include households that slightly exceed 1,000 kWh/month or commercial consumers whose electricity consumption exceeds license conditions, thus requiring diesel-based self-generation. 9 A feddan is a unit of area equivalent to 1.038 acres.

14
of this potential lies in the agricultural sector, solar systems for the tourism sector are also a potential
application.
Table 3: Potential Off-grid PV Market in Egypt (RCREEE, 2016).
Target application Diesel consumption (ktoe/year) Potential PV capacity (MW) Potential investment*
(US$ million)
Utility mini-grids 78 82 $123
Private mini-grids 60 77.3 $115
Water pumping in agriculture 3,775 1,938 US$ 3,876**
Single-activity application 1.87 0.09 US$ 0.135
Total 3,915 2,097 US$ 4,114 *Calculated based on PV price of US$ 1.5 million for 1 MW. ** Calculated based on average solar pumping system of US$ 2 per W.
Egypt’s Solar Industry
A local solar industry has developed in response to the recently introduced policy incentives. Most of the
existing local solar companies are project developers and/or distributors for international suppliers. The
local manufacturing of PV technologies is very limited, despite the high attractiveness index for
manufacturing PV components in Egypt compared to other MENA countries (The World Bank, 2015), due
to the availability of materials for solar industries (i.e. glass, steel, stainless steel) and high manufacturing
ability. The four existing PV manufacturers in Egypt are the military-owned Arab International Optronics,
Benha Electronics Company, government-owned Arab Renewable Energy Company (a subsidiary of the
Arab Organization for Industry), and the newly established private company Tiba Solar. However, Egypt
is heading to localize the PV manufacturing industry. Additionally, Egypt has a small but vibrant ecosystem
of start-ups, SMEs and financiers working on distributed solar, suggesting that significant local value
creation and employment can be expected if investment in distributed solar picks up.
3. Economics of Distributed PV in Egypt
In this section, we present the results of a techno-economic model of the profitability of distributed solar
in Egypt in three different applications: the net metering scheme, the feed-in tariff and off-grid
applications. It has to be noted that these results are based on the official exchange rate of 18 EGP per
US$ as of March 2017, following the devaluation of the Egyptian pound, and are sensitive to changes in
input assumptions, as discussed below. The following four findings are derived from the model analysis.

15
First, net metering remains financially unattractive for all residential and commercial consumers. Under
the tariff reforms from August 2016, 98 percent of households would realize a negative return on equity
investment (ROEI) assuming an investment cost of US$ 800 per kW,10 as shown in Figure 4. The top 2
percent (0.52 million) of household consumers, who now pay EGP 0.95 per kWh on all of their
consumption, and the largest commercial consumers, who pay EGP 0.96 per kWh for their consumption,
could generate a positive ROEI of 5.67 percent and 5.85 percent from net metering, respectively.
However, both of these rates are far below required rates of return on equity investments: the Central
Bank of Egypt’s benchmark overnight deposit rate, which can be considered a lower-end benchmark rate
for capital investments in the economy, stood around 15.75 percent as of January 2017, however more
realistically, private investors in Egypt would expect a return closer to 20 percent. Thus, while net
metering has become more attractive under the new tariff regime, it is still not an attractive investment
for any segment of the population.
Even if all tariffs were increased by 20% as Egypt continues to phase out its electricity subsidies, the net
metering scheme still only realizes a positive IRR for the largest energy consumers. This result raises
concerns about the social fairness of the net metering scheme as larger energy consumers are also higher
income. In Egypt’s current tariff structure, richer customers pay higher tariffs than poorer customers in
order to keep electricity affordable to all members of the population. If richer households start to defect
from this cross-subsidization system, the cost recovery of the utility will worsen, eventually requiring
EgyptERA to raise electricity prices for the poor. Other consumer groups in lower tariff brackets may still
install solar PV under the net metering to escape power outages in Egypt, for which the net metering
scheme is more suitable than the FIT (Åberg, 2014). However, outages have all but disappeared since the
winter of 2015, thus reducing the case for solar investment from an energy security perspective. In order
for the net metering scheme to work for a wider spectrum of society, the net metering scheme would
have to be combined with concessional finance or grants, which could be targeted to smaller consumers.
However, since the FIT is more attractive (see below) and government support for the net metering
10 Rooftop solar costs vary widely worldwide. 2015 estimates for a residential system were around US$ 2000 per kW in Tunisia and $3000 per kW in South Africa (International Renewable Energy Agency, 2016b), while current costs in India are as low as US$ 600 per kW. The US$ 800 per kW used in this analysis is thus a moderate benchmark, and sensitivities to this assumption are conducted.

16
scheme has already waned in practice, further government support to complement the net metering
scheme appears unlikely.
Figure 4: Results for profitability analysis for residential users under net metering scheme
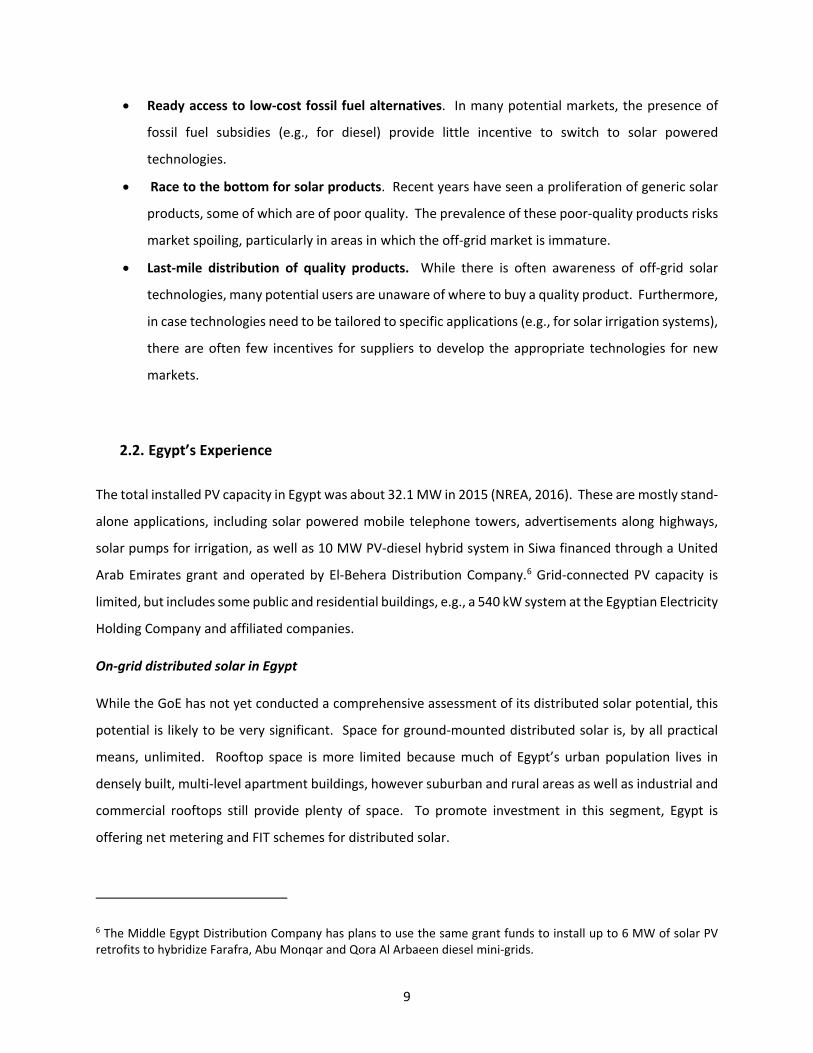
Secondly, although the new feed-in tariffs – which came into force on October 28, 2016 – are higher than
current electricity tariffs, these rates are still insufficient to make distributed solar a profitable investment
at current lending rates. Under the market lending rate, assumed 15.75 percent based on Egypt’s Central
Bank deposit rate, the ROEI ranges between 15.83 percent to -5.46 percent for installations below 200kW
(receiving a FIT rate of 108.5PT per kWh) and between 14.31 percent and -6.72 percent for installations
between 200kW and 500kW (receiving a FIT rate of 102PT per kWh), depending on the investment cost
(see Figure 5). Note that in many emerging markets, investment costs can vary substantially – in Tunisia
for example, investment costs between the most expensive and cheapest rooftop solar systems in 2015
varied by a factor of 2.2 (International Renewable Energy Agency, 2016b) – due to underdeveloped
markets. Even under the concessional lending conditions of 5% interest rates available for SMEs, the ROEI
for distributed solar only achieves a 15.75 percent investment benchmark at very optimistic investment
costs of around US$ 600 per kW.
8%
2%
0%
-5%
5%
4%
3%
1%
-1%
-2%
-3%
6%
9%
7%
-4%
Retu
rn o
n eq
uity
(%)
IRR -2.27%
3.2 million consumers(351-650kWh/month)
IRR -5.91%
7.7 million consumers(201-350kWh/month)
15 million consumers who consumebelow <200kWh/month
0.52 million consumers(>650kWh/month)
IRR n.a.
Assuming 20% higher electricity tariffs than FY2017 ratesAssuming electricity tariffs for FY2017
IRR 5.67%
Households clustered by monthly consumption
17
Figure 5: Results for profitability analysis under FIT scheme
Thirdly, despite the upward revision in FIT rates since 2014, distributed solar is an even less attractive
investment than under the conditions assumed by EgyptERA in 2014. As shown in Figure 6, six changes
since 2014 have affected the profitability of distributed solar. The tariff increase, the global decline in the
cost of solar PV and the decrease in the top rate income tax in Egypt have raised the net present value
(NPV) of a typical 5 kW system by between EGP 18,202 and EGP 34,782, depending on whether a
“conservative” or “aggressive” investment case is assumed (see Table 4 for details). However, over the
same time period, the devaluation of the Egyptian pound, the unavailability of concessional financing (see
Section 2.2) and the higher expected return on equity (due to higher inflation) have reduced the NPV by
EGP 49,423 to EGP 100,894, again depending on assumed investment conditions. Notably, the
devaluation of the Egyptian pound since 2014 has significantly affected the economics of distributed solar,
as Egypt lacks a domestic solar manufacturing industry and thus must import solar modules at
international prices. In reality, the effect of the devaluation may be less severe than modeled here
because, previously, when the FIT was introduced in 2014, it was not possible to buy US$ from the Central
Bank. Instead, US$ were sourced from the black market at rates that were higher than the official
exchange rate.
-8
-6
-4
-2
0
2
4
6
8
10
12
14
16
18
500 1000 1500 2000
IRR
(%)
Investment cost (USD/kW)
-6
-4
-2
0
2
4
6
8
10
12
14
16
18
20
500 1000 1500 2000
IRR
(%)
Investment cost (USD/kW)
a) Installations less than 200kW b) Installations between 200kW and 500kW
Market lending rate (15.75%)Concessional lending for SMEs (5%) Market lending rate (20%)

18
Figure 6: Net present value of a 5 kW solar rooftop system under the 2014 FIT and the 2016 FIT, and the factors that constitute the difference between the two.
The results are highly sensitive to input assumptions. The baseline assumptions for the 2014 FIT, the 2016
FIT and the net metering in 2016 are listed in Table 4. Figure 7 shows the sensitivity of the ROEI of a 5kW
solar rooftop system under the FIT scheme to seven key factors: the investment cost (in EGP), the solar
resource (i.e., the capacity factor), the bank lending rate, the O&M cost, the loan tenor, the income tax
rate and the share of equity. The ROEI is most sensitivity to the investment cost (a 20 percent decrease
improves the ROEI by 4.5 percentage points) and the solar resource (a 20 percent increase of the capacity
factor improves the ROE by 3.6 percentage points). Note that because it was assumed Egypt must import
solar modules – which are denominated in US$ – the ROEI is highly sensitive to the value of the Egyptian
pound as well (i.e., a 20 percent increase in value of the Egyptian pound against the dollar would also
improve the ROEI by 4.5 percentage points). Additionally, a change in the tariff would affect the results
in the same way as the capacity factor, as both are equivalent to a 20 percent change in operational cash
flows.
EGP -76,720
49,333
48,773
2016 FITHigher expected return
on equity
2,788
Market lending conditions instead of
concessional
Exchange rateIncome tax decrease
EGP 5,972
2014 FIT Tariff increase
1,155
Investment cost decrease
4,997
12,050
23,224
EGP -8,6687,730
18,469
1,495
12,050EGP 5,972
21,237
Break-even of investment
Break-even of investment
a) Conservative case
b) Aggressive case

19
Table 4: Techno-economic assumptions used for profitability analysis of distributed solar.
Variable 2014 FIT 2016 FIT (from October 28, 2016) /
Net metering (from July 1, 2016)
Value Source/Comment Value Source/Comment
Investment cost (overnight) US$ 1,450 per kW (NREA, 2016)
US$ 600 (aggressive) – 1,250
(conservative) per kW
Assumption based on (IEA, 2016a) data for
India
Exchange rate 7.15 EGP/US$ Central Bank 18.00 EGP/US$ Central Bank
O&M cost per year (including insurance)
2.5 % of initial investment (NREA, 2016)
Unchanged Depreciable lifetime 25 years (NREA, 2016)
Minimum book value 5% of initial investment Assumption
Capacity factor 19.4% EgyptERA
Share of equity 25% Assumption
Expected return on equity 12% (NREL, 2016) 15.75% (aggressive) 20% (conservative)
Assumption based on higher inflation
Lending rate 4% Concessional rate assumed in FIT of
2014
15.75% (aggressive) 20% (conservative)
Central Bank overnight deposit rate
Grace period 2 years Assumption for
concessional finance
0 years Assumption based on market conditions
Loan tenor 12 years Concessional rate assumed in FIT of
2014 5 years Assumption based on
market conditions
Income tax rate 25% Ministry of Finance 22.5% Ministry of Finance
Loss carryforward period 0 Other sources of taxable income
assumed Unchanged

20
Figure 7: Return on equity for distributed solar: Sensitivity to input parameters.
The fourth finding is that off-grid distributed solar to replace diesel consumption is highly dependent on
the local price of diesel. Figure 8 shows the ROEI for off-grid applications of distributed solar as a function
of the investment cost, as these costs can differ significantly between off-grid configurations. When the
solar system replaces diesel bought at the subsidized price (currently EGP 2.35 per liter), distributed solar
has a positive return on equity for investment costs below around 1150 US$ per kW, but generally is not
a very attractive investment even at very low investment costs. If the solar system replaces unsubsidized
diesel (currently estimated at US$ 450 per ton, or about EGP 6.75 per liter), the ROEI increases to between
8.0 and 43.1 percent, depending on the investment cost. RCREEE found that in practice, when there are
no diesel shortages, most consumers pay an average price somewhere between the subsidized and
unsubsidized prices, as diesel is sold by third parties at prices above the government rate. Thus, the
investment case for off-grid distributed solar is currently fragmented, as it is still unclear exactly how local
prices of diesel vary across the country.
3.6
-3.1
-0.9
-0.8
0.2
0.3
0.3
0.8
0.9
4.5
-0.2
-0.3
-0.4
-3.7
-4.0 -3.5 -3.0 -2.5 -2.0 -1.5 -1.0 -0.5 0.0 0.5 1.0 1.5 2.0 2.5 3.0 3.5 4.0 4.5
Percentage points (100s of basis points)
Lending rate
Capacity factor
Investment cost
Fixed O&M cost (%)
Loan tenor
Income tax rate
Share of equity (%)+20%-20%

21
Figure 8: Profitability of off-grid distributed solar investments.
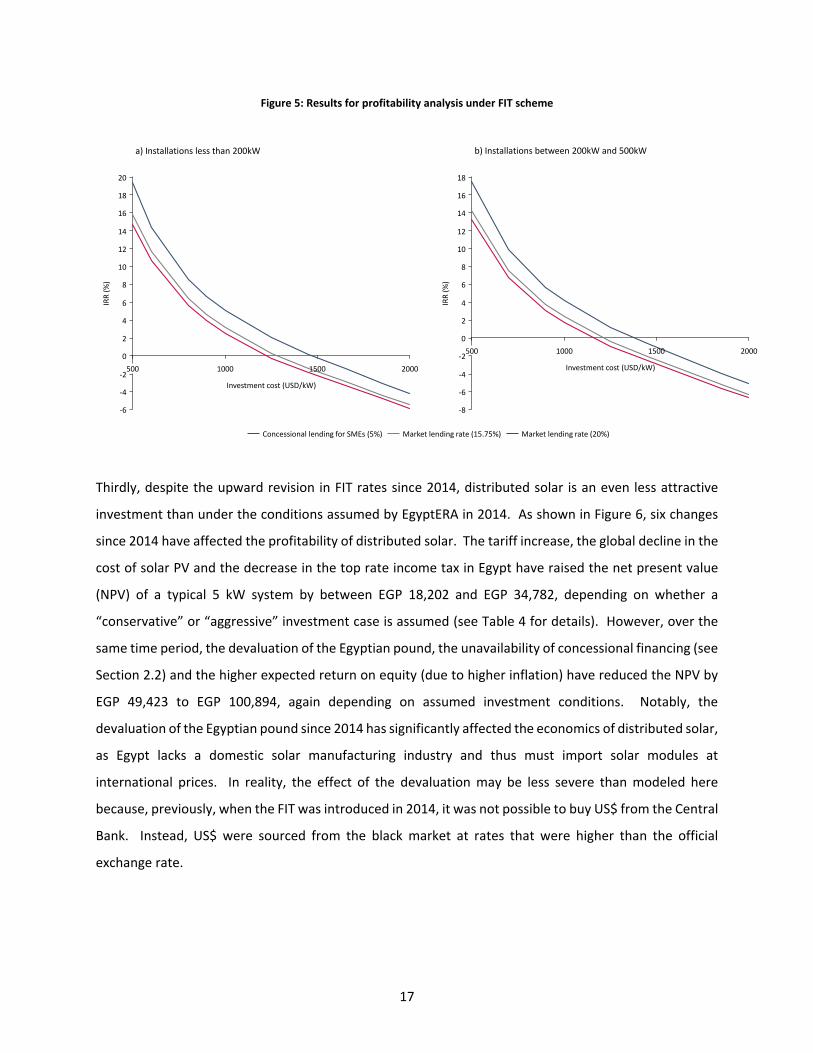
However, from the government’s perspective, off-grid solar is extremely economically attractive. Given
that solar is cheaper than unsubsidized diesel-powered generation, off-grid solar deployment presents an
opportunity for the government to reduce its subsidy bill. At present, off-grid water pumping in
agriculture consumes about 3.77 million tons of diesel per year. At the previous subsidized fuel price of
EGP 1.8 per liter (prior to the November 4, 2016 increase), displacing this diesel fully with PV systems
could have saved the government EGP 5.06 billion per year in diesel subsidies. Despite this, no PV
incentive schemes exist by the government for off-grid users. Although the government increased the
subsidized price of diesel from EGP 1.8 per liter to EGP 2.35 per liter- effective as of November 4, 2016 –
this increase in price was accompanied by a devaluation of the Egyptian pound of over 50%, effectively
increasing the value of the fuel subsidy. Thus, the previously estimated numbers are likely lower than the
current potential fiscal savings from displacing diesel by distributed solar. Additionally, given the high
emissions factor of diesel and low efficiency of many small-scale off-grid diesel applications, a single
2.5kW solar pump could provide CO2 emissions savings of 145 tons over its lifetime. Thus, if the off-grid
market is scaled up, this presents a large opportunity for Egypt to reduce its national emissions.
-10
-5
0
5
10
15
20
25
30
35
40
45
800 900 1000 1100 1200 1300 1400 1500 1600 1700 1800 1900 2000
Retu
rn o
n eq
uity
(%)
Investment cost (USD/kW)
Replacement of subsidized diesel, market lending (15.75%) Replacement of unsubsidized diesel, market lending (15.75%)
22
Table 5: Estimate of fiscally neutral support for PV pump systems in Egypt (RCREEE, 2016).
Target application Value
Total number of diesel pumps 258,239
Equivalent diesel consumption 3,775,000 ton
Government diesel subsidy for 3,775,000 tons (estimate) EGP 5.06 billion
Total equivalent solar capacity 1,938 MWp
Average investment needed per pump (average 7.5 kWp) EGP 77,256
Maximum fiscally neutral subsidy that could be provided by the Government EGP 21,196 (25.34%)
Total 3,915
4. Non-financial Barriers to Growth in Distributed PV in Egypt
Fixing the economics of distributed solar in Egypt will be important, but non-financial barriers can limit
growth in distributed solar even if the financial incentives are in place. As detailed below, interviews and
comments from consultation workshops suggest that, in spite of the large potential market and improved
economics, a number of barriers remain to growth in the distributed solar market.
First, stakeholders generally note that there is uncertainty in the government’s vision and policies for
distributed solar. Although the government set a target of 300 MW of small-scale solar under its FIT
program, quantified targets for distributed solar at both a national level and within certain key sectors,
such as agriculture or tourism, would provide clearer signals to the private sector of the government’s
commitment to supporting distributed solar. Similarly, the government’s policy signals lack clarity. The
existence of two parallel schemes, net metering and the FIT, appears to confuse the market. Even among
key sector experts, there was disagreement about whether projects were still eligible for the net metering
scheme, or if it had been replaced by the FIT. Finally, clarity regarding the schedule of electricity and
diesel subsidy reforms would provide greater certainty to the private sector about the opportunities for
distributed solar moving forward.
Second, lack of access to data and knowledge is a major barrier to scaling up distributed solar along the
value chain. End users lack knowledge about the potential benefits of solar, and how to source
appropriate and high-quality products. The wide range in quality and technical expertise of suppliers
represents a risk. Negative experiences may spoil the nascent market in the eyes of consumers.
Stakeholders highlighted the need for technical standards and transparency in PV supply. A training and
certification scheme for PV installers and system integrators could help leading to technical

23
standardization and ensure the quality of the delivered technical service. Entrepreneurs lack information
about market potential. Current initiatives in Egypt are scattered and lacking the necessary technical and
market information needed to scale-up their business. In the off-grid market in particular, technical
solutions are often highly customized, leading to high transaction costs for each application. Ecosystem
actors in particular highlighted the need to segment the market in order to cluster or aggregate the various
initiatives and facilitate customer acquisition and business development. The Access to Knowledge for
Development (A2K4D) project at the American University of Cairo is working to provide a platform for
data and knowledge exchange. Many stakeholders stressed the value of this initiative and highlighted the
need to sustain it going forward. On the off-taker side, the distribution companies still lack sufficient
technical understanding to integrate distributed solar into their grid planning. If not addressed, this may
lead to technical issues once distributed solar takes off, and the benefits of solar for grid operators may
not be fully realized. Finally, as to policy makers, there is low understanding of the potential economic,
social, and environmental benefits of PV solutions for off-grid areas and small-medium end users.
Third, access to debt finance remains a challenge. As systems with a higher debt share have a higher ROEI,
this is a barrier to the diffusion of distributed solar. Although concessional finance at 5% lending rates is
available to SMEs, smaller actors such as households or small farmers are not bankable due to their low
credit worthiness status and limited collateral due to a lack of property/land ownership rights. There is
thus a need for targeted concessional microfinance or innovative mechanisms (i.e. pay-as-you-go / mobile
payments) for end users. Entrepreneurs, too, reported limited access to finance as a barrier.
Entrepreneurs that manage to secure seed financing are often unable to secure follow-up rounds of
investment to move their businesses forward. In addition, there is a perception that solar technologies
are highly risky and non-reliable compared to traditional systems. The banks do not have the necessary
financial models, tools, and technical capacity to evaluate PV projects loan applications for solar projects.
Capacity building in banks to help them better understand distributed solar, including the development
of standard templates for project appraisals, is needed to unlock greater access to debt finance.
Fourth, the distributed solar industry lacks a voice in the policy debate in Egypt. This is partly due to
collective action problems as the industry is currently quite fragmented, with many small players working
in silos. Networks that facilitate sharing of knowledge, data, and information on technology suppliers are
only beginning to emerge. Examples include Cleantech Arabia, Nahdet El Mahrousa, Governorate
Economic and Social Revival (GESR; an initiative by the Misr El-Kheir Foundation) and American University
of Cairo’s Venture Lab and Technology Transfer office. More formal industry networks may be needed in
24
order for distributed solar actors to gain a stronger collective voice in steering policy decisions and
leveraging on each other’s capabilities and resources. Additionally, there is a need for linking government
with entrepreneurs though structured public-private dialogue for regulatory and policy advocacy.
Fifth, with a few exceptions, business models tailored to distributed solar have not yet been adopted in
Egypt. Although grants and subsidized financing will be needed to kick-off the PV market, the
development of an innovative business model for private investment is crucial for the sustainability of
distributed solar in Egypt. Most solution providers suffer from insufficient “business development and
implementation capacities” to identify and design profitable PV projects, attract clients, develop
appropriate business models, and delivery of aftersales operations and maintenance support. Most
companies act as equipment dealers rather than PV solutions and service providers.
Sixth, the institutional mechanism for periodic payments under the FIT is unclear to many. The
distribution companies should pay the FIT to the project developer (credited to their bank account or by
check). However, there is no clarity and adequate communication on the registration process and
payment arrangements, which has driven several interviewees to be skeptical. Many private sector actors
see the FIT as too risky due to the risk of non-payment or delayed payment by the distribution companies.
These payment risks are seen as larger for smaller investors without immediate access to the government
than for utility scale-investors.
Lastly, moving forward, there is a need for a better understanding of additional potential barriers not yet
raised in the interviews. For on-grid applications, this includes understanding and resolving issues of roof
rights and contract enforceability. For off-grid applications – in Egypt’s case, the largest potential lies in
replacing diesel powered pump sets with solar pumps – further analysis should look into whether
agricultural pumps are mobile (i.e., used at multiple locations), whether theft of solar panels poses a
threat, and the relevant water depths (pumps greater than 10 kW are difficult and unwieldy for solar
pumps).
25
5. Conclusions and Recommendations
Egypt’s growing energy needs, the gradual removal of subsidies, and its ambition to exploit its excellent
solar resources create opportunities for investment in distributed solar. However, this paper found that
the distributed solar market will remain a niche market in the next few years without government
interventions. The distributed solar market could be largely self-sustaining once electricity and diesel
subsidies are abolished, but with full subsidy removal still a few years away, growth in the market will
remain limited under the current policy framework. In order to unlock the market, this paper suggests
three policy priorities for the government.
First, for grid-connected distributed solar, the net metering scheme should be kept in place until a
bankable feed-in tariff has been established—i.e., a FIT with regular revisions of the tariff level to account
for movements in PV system costs and the exchange rate, and with payment security built into the
mechanism. The net metering scheme is currently the most bankable policy for investors and should
therefore be kept in place and, if possible, streamlined. Immediately available options to streamline the
net metering scheme include developing a bankable standard template for the net metering contract
between distribution companies and investors. Furthermore, the complicated method for ‘netting out’
sold and purchased electricity, which is imposing significant burden on distribution companies, should be
revisited. However, in the longer term, net metering is less suitable for scaling up the small-scale on-grid
market than a feed-in tariff. This is because (a) net metering does not allow the government to lower
incentives once tariffs are above the levelized cost of distributed solar and (b) net metering by design
favors richer consumers. However, a bankable FIT is not yet in sight. Therefore, the net metering should
be kept in place until significant reforms to the FIT have been implemented and the reformed FIT has
proven bankable for investors. These reforms are as follows. First, the feed-in tariff needs to be raised
to reflect current cost and financing conditions. Second, the government needs to create a bankable
payment mechanism that instills confidence in the market that the distribution companies will pay the
tariff in full and in a timely manner. Options for payment securitization include guarantees from an
external finance institution such as the IFC or World Bank and/or channeling the payments through a
commercial bank rather than the distribution company.
Second, for off-grid solar applications, the government should pursue interventions to unlock market
opportunities in the agricultural and tourism sectors. Three priorities for the government emerged from
the consultations. First, to evaluate the potential for off-grid solar to replace diesel consumption in
different applications. The off-grid market is more fragmented and data on potentials and the investment
26
case in different applications are patchy. Therefore, more analytical work is needed to underpin any policy
intervention to promote off-grid applications. Second, to identify policy options for shifting the diesel
subsidy savings towards financial incentives for off-grid users, such as tax incentives or customs
exemptions for imported PV technologies. If financial support is to be provided to users directly, this
support should take the form of performance-based payments in order to avoid that technologies sit idly
or being resold on black markets. Third, to identify options for aggregating users, for example in the 1.5
Million Feddan Project or in poorer areas in Upper Egypt. Because off-grid solar applications are affected
by policies of different government ministries, including the Ministry of Finance (for diesel subsidies), the
Ministry of Petroleum, the Ministry of Agriculture and the Ministry of Tourism, any intervention should
be coordinated between the relevant ministries.
Third, the government should strengthen private-sector activity in the sector, including by addressing non-
financial barriers such as transaction costs and gaps in the availability of data, and by building capacity
among users, suppliers, and financial institutions. The complexity and administrative procedures of any
new policy incentive should be minimized to reduce transaction costs and broaden access to the scheme.
The government should make easily accessible any data it has collected that could be useful to estimate
the potential for distributed solar in Egypt and should continue doing so for any new analyses conducted
in the future. Further, any future financial support by the government for distributed solar should be
accompanied an awareness campaign targeted at end-users, distribution companies and other market
participants, including banks. Furthermore, capacity building in the form of specialized trainings and
certification schemes should be availed.

27
Acknowledgements
This paper is a deliverable under the World Bank’s Egypt Energy Programmatic Technical Assistance for
implementation of Reforms Project. The authors gratefully acknowledge the support from the Energy
Sector Management and Assistance Program (ESMAP) and the cooperation of officials at the New and
Renewable Energy Agency (NREA), the Egyptian Electric Utility & Consumer Protection Regulatory Agency
(EgyptERA) and the Egyptian Ministry of Electricity and Renewable Energy (MoERE). The authors
appreciate the comments received from Raihan Elaihi, Amit Jain, Bryanne Tait and Marwa Mostafa Khalil.
The authors would like also to thank Farid Tadros, Operations Officer – Trade & Competitiveness Global
Practice, for his contributions and facilitating stakeholders input under the Clean Tech SME Support
Project.

28
References
Åberg, E. (2014). Solar power in the MENA region:: A review and evaluation of policy instrumnets for
distributed solar photovoltaic in Egypt, Palestine and Tunisia. IIIEE Theses 2014: 14, (September).
ADB. (2015). Lesson Learnt from ADB India Solar Power Generation Guarantee Facility Volume II:
Assessment of Alternate Financing Products, II(August).
BNEF, & Lighting Global. (2016). Off-grid solar market trends report 2016, (February), 108.
http://doi.org/10.1017/CBO9781107415324.004
Egypt O&G. (2016). Egypt Paid EGP 300,000 for Rooftop Solar Power.
EgyptERA. (2013). Egyptian regulation on the connection of Solar PV to the low and medium voltage grid.
EgyptERA. (2014). Renewable Energy – Feed- in Tariff Projects ’ Regulations.
Grau, T. (2014). Responsive feed-in tariff adjustment to dynamic technology development. Energy
Economics. http://doi.org/10.1016/j.eneco.2014.03.015
Gupta, S., Sharda, J., & Shrimali, G. (2016). The Drivers and Challenges of Third Party Financing for Rooftop
Solar Power in India, (September).
IEA. (2016a). Renewable Energy Medium-Term Market Report 2016 - Market Analysis and Forecasts to
2021. http://doi.org/10.1016/B978-0-7506-8670-9.00005-0
IEA. (2016b). Snapshot of Global Photovoltaic Markets; Paris, France: International Energy Agency (IEA).
International Renewable Energy Agency. (2016a). Solar pumping for irrigation: Improving livelihoods and
sustainability. Abu Dhabi.
International Renewable Energy Agency. (2016b). Solar Pv in Africa: Costs and Markets. Retrieved from
http://www.irena.org/menu/index.aspx?mnu=Subcat&PriMenuID=36&CatID=141&SubcatID=2744
IRENA. (2015). Renewable Power Generation Costs. Abu Dhabi, UAE: International Renewable Energy
Agency (IRENA).
IRENA. (2016). Renewable capacity statistics 2016.
Liang, X. (2014). Lost in transmission - Distributed Solar Generation in China. China Environment Forum.
http://doi.org/10.1016/S1470-2045(07)70048-7
29
NEA. (2016). Photovoltaic power generation: Information on installations and operation, Q1 2016.
Available Online at http://www.nea.gov.cn/2016-04/22/c_135303838.htm.
NREA. (2016). Personal communication.
NREL. (2016). Solar Resource Data. Available at Http://pvwatts.nrel.gov/pvwatts.php.
RCREEE. (2016). Diesel To Solar Transformation: Accelerating Achievement of SDG 7 on Sustainable
Energy, (444). http://doi.org/10.1016/S0955-470X(16)00008-2
REN21. (2013). Renewables 2013: Global Status Report. Paris, France: Renewable Energy Policy Network
for the 21st Century (REN21).
REN21. (2016). Renewables 2016. Global Status Report. Paris.
Seel, J., Barbose, G. L., & Wiser, R. H. (2014). An analysis of residential PV system price differences
between the United States and Germany. Energy Policy, 69(6), 216–226.
http://doi.org/10.1016/j.enpol.2014.02.022
Shum, K. L., & Watanabe, C. (2007). Photovoltaic deployment strategy in Japan and the USA-an
institutional appraisal. Energy Policy, 35(2), 1186–1195.
http://doi.org/10.1016/j.enpol.2006.02.014
The World Bank. (2015). Competitiveness Assessment of MENA countries to develop a Local Solar
Industry, 1–10.
UNEP, & BNEF. (2015). Global Trends in Renewable Energy Investment 2015. Global Trends Reports, 85.

30
Annex 1: Interviewed and consulted stakeholders
Sector institutions
• NREA/ MoERE
• SEDA
• ENCPC /MoTI
• ENCCC
• RCREEE
Clean Tech Entrepreneurs
• Sunergytech
• Solarize Egypt
• Elnour Geh
• IRSC, Cairo - Energy Management
• Jozour
• Dayra, Suez, Cairo, Minya - Waste to Energy
• Namaa Aswan - waste to handicrafts
• Tadweer
• Ashtechs
• Secret of the Earth (Ser el Ard), Qena
• Complete Energy Solutions
• KarmSolar
• Tiba Solar
• Solera
Clean Tech Ecosystems
• A2K4D
• Endeavor
• Clean Tech Arabia
• RiseUp
• CairoAngels
• AUC Vlab

31
• Nahdet El Mahrousa
• GESR
• RENAC / Oasis
• GIZ Business Innovation
• AUC Technology Transfer Office
• UNIDO
• UNDP
Financial and Legal Institutions
• Commercial International Bank (CIB)
• Social Fund for Development (SFD)
• Egyptian Private Equity Association (EPEA)
• Sharkawy & Sarhan Law Firm

32
Annex 2: Electricity tariffs in Egypt FY2016 and FY2017
Table 6: Electricity tariffs (variable charges only).
FY2016 FY2017 Annual increase FY2016 to FY2017
Categories of customers Off-peak
Peak hours Average Off-
peak Peak hours Average Off-
peak Peak hours
per kWh
Residential
0 – 50 kWh 7.5 1 46.7% 51 – 100 kWh 14.5 19.0 31.0% 0 – 200 kWh 16.0 21.5 34.4%
201 – 350 kWh 30.5 42.0 37.7% 351 – 650 kWh 40.5 55.0 35.8%
651 – 1,000 kWh 71.0 95.0 33.8% > 1,000 kWh 84.0 n.a. n.a.
0 – >1,000 kWh n.a. 95.0 n.a.
Commercial
0 – 100 kWh 32.0 35.0 9.4% 101 – 250 kWh 50.0
n.a. n.a. 251 – 600 kWh 61.0 0 – 600 kWh n.a. 69.0 n.a.
601 – 1,000 kWh 81.0 96.0
18.5% > 1,000 kWh 86.0 11.6%
Extra High Voltage (EHV) 220, 132 kV
Energy-intensive industries 35.5 53.1 38.4 42.9 64.4 46.5 20.8% 21.3%
Other industries 23.7 35.6 25.7 38.7 58.1 41.9 63.3% 63.2% Kima 4.7 n.a. 9.4 n.a. 100%
Metro 18.0 n.a. 30.3 n.a. 68.3%
High Voltage (HV) 66, 33 kV
Energy-intensive industries 36.7 55 39.7 45.2 67.2 49.0 23.2% 22.2%
Other industries 25.6 38.4 27.7 41.1 61.7 44.6 60.1% 60.7% Metro 20.5 n.a. 32.0 n.a. 56.1%
Medium Voltage (MV)
22, 11 kV All users 37.5 56.2 40.6 48.0 72.0 52.0 28.0% 28.1%
Low Voltage (LV) – 280, 380
V
Irrigation 22.0 n.a. 27.1 n.a. 23.2% Other users 43.5 n.a. 75.0 n.a. 72.4% Street lights 58.0 n.a. 64.4 n.a. 11.0%