scaling relationships of source parameters of inland ... · scaling relationships are discussed...
TRANSCRIPT

Scaling Relationships of Source Parameters of Inland Crustal Earthquakes in Tectonically
Active Regions
KEN MIYAKOSHI,1 KAZUHIRO SOMEI,1 KUNIKAZU YOSHIDA,1 SUSUMU KURAHASHI,2 KOJIRO IRIKURA,2 and
KATSUHIRO KAMAE3
Abstract—We examined the scaling relationships of inland
crustal earthquakes occurring in tectonically active regions such as
the Japanese Islands. Two important points related to reliable
scaling relationships are discussed empirically: the objective esti-
mation of source parameters such as the seismic moment and
rupture area, and the regionality of the scaling. Rupture areas are
objectively estimated by trimming heterogeneous slip distributions
obtained from waveform inversion. Two trimming procedures have
been proposed to determine effective rupture areas, by Somerville
et al. (Seismol Res Lett 70:59–80, 1999) and Thingbaijam and Mai
(Bull Seismol Soc Am 106:1802–1816, 2016). We confirmed that
both trimmed rupture areas agree well with each other when
applied to the same dataset. The source scaling characteristics are
known to depend on the seismotectonic regime. We investigate the
source scaling relationships of inland crustal earthquakes in Japan
using source parameters obtained from 36 slip models for 22 recent
events (Mw 5.4–7.1) by waveform inversion analysis. We con-
firmed that the source scaling relationships consisting of two stages
were almost the same as those obtained for crustal earthquakes on
the US West Coast by Hanks and Bakun (Bull Seismol Soc Am
92:1841–1846, 2002). For larger earthquakes (Mw [ 7.4) in seis-
mically active regions, Tajima et al. (ZISIN2; J Seismol Soc Jpn
66:31–45, 2013) found saturation of fault displacements showing
the third stage. Combining the earthquake data of Mw 5.4–7.1 in
this study with those of Mw 7.0–8.0 compiled by Murotani et al.
(Pure Appl Geophys 172:1371–1381, 2015), we conclude that the
scaling relationship for rupture area versus seismic moment coin-
cides with the three-stage source scaling relationship using source
parameters extracted from waveform inversions.
Key words: Three-stage scaling relationship, earthquake cat-
egory, waveform inversion, trimming method.
1. Introduction
After the 1995 Hyogo-ken Nanbu earthquake (Mw
6.9) in Japan, dense strong ground motion networks
(K-NET, KiK-net) were installed at about 20-km
intervals by the National Research Institute for Earth
Science and Disaster Resilience (NIED). Using
strong ground motions near the source region, many
heterogeneous slip models have been estimated by
waveform inversion analysis with high-accuracy
velocity structure models. Source parameters (e.g.,
rupture area, average slip, and asperity area) are
extracted from heterogeneous slip models using cer-
tain criteria, and empirical scaling relationships
between source parameters and seismic moment are
evaluated by regression analysis. A three-stage
source scaling relationship between the source rup-
ture area and seismic moment of inland crustal
earthquakes was initially proposed by Irikura and
Miyake (2011) then revised by Murotani et al.
(2015). The Headquarters for Earthquake Research
Promotion (HERP 2017) in Japan adopts such a
three-stage source scaling relationship in predicting
strong ground motions for identified earthquake sce-
narios. Figure 1 shows the schematic source model
for each stage. Irikura and Miyake (2011) proposed a
two-stage scaling relationship of source parameters
for crustal earthquakes occurring mostly on the US
West Coast and some in and around Japan, which
combined source parameters obtained from wave-
form inversion of strong-motion data (Somerville
et al. 1999; Miyakoshi et al. 2000) with those
obtained from geological and geomorphological sur-
veys, selecting only reliable data from the source
parameter catalog compiled by Wells and
Electronic supplementary material The online version of this
article (https://doi.org/10.1007/s00024-019-02160-0) contains sup-
plementary material, which is available to authorized users.
1 Geo-Research Institute, 6F, Kokuminkaikan-Sumitomo-
seimei Bldg., 2-1-2, Otemae, Chuo-ku, Osaka 540-0008, Japan.
E-mail: [email protected] Aichi Institute of Technology, 1247, Yachigusa, Yakusa-
cho, Toyota, Aichi 470-0392, Japan.3 Institute for Integrated Radiation and Nuclear Science,
Kyoto University, 2, Asashiro-Nishi, Kumatori-cho, Sennan-gun,
Osaka 590-0494, Japan.
Pure Appl. Geophys. 177 (2020), 1917–1929
� 2019 Springer Nature Switzerland AG
https://doi.org/10.1007/s00024-019-02160-0 Pure and Applied Geophysics
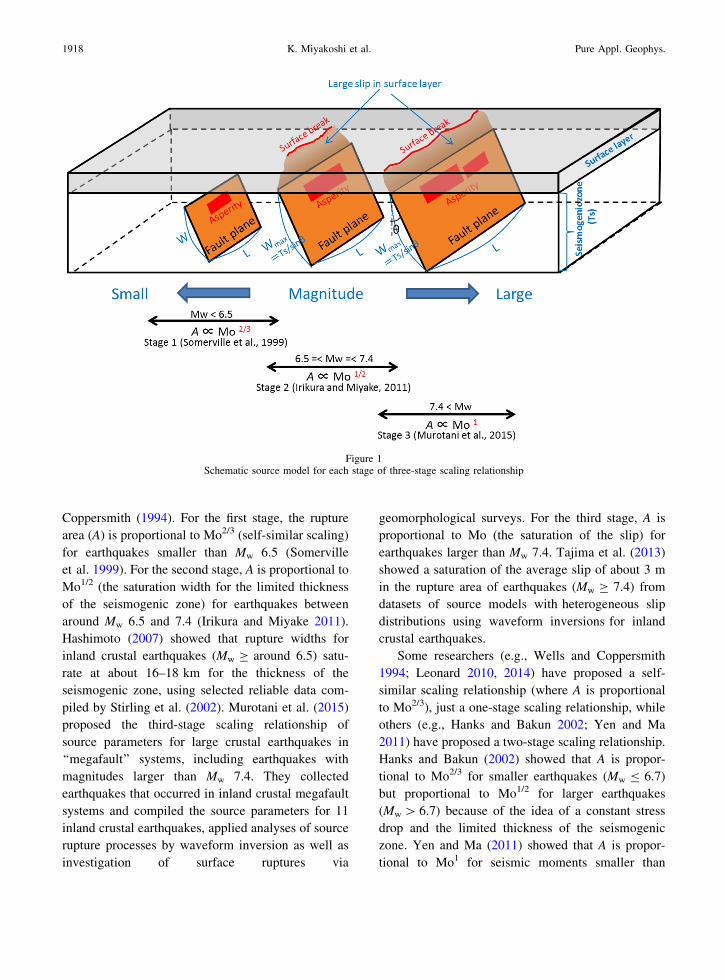
Coppersmith (1994). For the first stage, the rupture
area (A) is proportional to Mo2/3 (self-similar scaling)
for earthquakes smaller than Mw 6.5 (Somerville
et al. 1999). For the second stage, A is proportional to
Mo1/2 (the saturation width for the limited thickness
of the seismogenic zone) for earthquakes between
around Mw 6.5 and 7.4 (Irikura and Miyake 2011).
Hashimoto (2007) showed that rupture widths for
inland crustal earthquakes (Mw C around 6.5) satu-
rate at about 16–18 km for the thickness of the
seismogenic zone, using selected reliable data com-
piled by Stirling et al. (2002). Murotani et al. (2015)
proposed the third-stage scaling relationship of
source parameters for large crustal earthquakes in
‘‘megafault’’ systems, including earthquakes with
magnitudes larger than Mw 7.4. They collected
earthquakes that occurred in inland crustal megafault
systems and compiled the source parameters for 11
inland crustal earthquakes, applied analyses of source
rupture processes by waveform inversion as well as
investigation of surface ruptures via
geomorphological surveys. For the third stage, A is
proportional to Mo (the saturation of the slip) for
earthquakes larger than Mw 7.4. Tajima et al. (2013)
showed a saturation of the average slip of about 3 m
in the rupture area of earthquakes (Mw C 7.4) from
datasets of source models with heterogeneous slip
distributions using waveform inversions for inland
crustal earthquakes.
Some researchers (e.g., Wells and Coppersmith
1994; Leonard 2010, 2014) have proposed a self-
similar scaling relationship (where A is proportional
to Mo2/3), just a one-stage scaling relationship, while
others (e.g., Hanks and Bakun 2002; Yen and Ma
2011) have proposed a two-stage scaling relationship.
Hanks and Bakun (2002) showed that A is propor-
tional to Mo2/3 for smaller earthquakes (Mw B 6.7)
but proportional to Mo1/2 for larger earthquakes
(Mw [ 6.7) because of the idea of a constant stress
drop and the limited thickness of the seismogenic
zone. Yen and Ma (2011) showed that A is propor-
tional to Mo1 for seismic moments smaller than
Figure 1Schematic source model for each stage of three-stage scaling relationship
1918 K. Miyakoshi et al. Pure Appl. Geophys.

1020 N m, i.e., non-self-similar scaling, but Mo2/3 for
seismic moments greater than 1020 N m, i.e., self-
similar scaling.
There are some suggestions that source scaling is
affected by the tectonic regionality and focal mech-
anism. Scholz et al. (1986) proposed a classification
into three tectonic earthquake types: I (interplate), II
(intraplate, involving plate boundary-related), and III
(intraplate, involving midplate), on the basis of the
slip rate of the fault. They categorized earthquakes
occurring in inland crust of the Japanese Islands as
intraplate (type II). They also showed the indepen-
dence of faulting regimes for the scaling relationship.
Wells and Coppersmith (1994) proposed a classifi-
cation into two tectonic earthquakes, viz.
stable continental region (SCR) and non-SCR earth-
quakes. Almost all earthquakes in the dataset from
the US West Coast and Japan were categorized as
non-SCR. Their scaling relationships showed a
slightly different dependence on the focal mecha-
nisms. However, Hanks and Bakun (2002) classified
these US West Coast and Japanese earthquakes,
which are categorized into the non-SCR earthquakes
by Wells and Coppersmith (1994), as continental
earthquakes. They showed a bilinear scaling rela-
tionship for saturation of fault widths of 15–20 km
(Mw C 7.5). Leonard (2010, 2012) proposed a clas-
sification into two types of tectonic earthquake, viz.
plate boundary and SCR. The former type includes
interplate and plate boundary-related earthquakes,
including type I and II (Scholz et al. 1986), while the
latter includes mid-continental ones, including
type III (Scholz et al. 1986). Leonard (2010, 2012)
used not only datasets of Wells and Coppersmith
(1994) but also those of Somerville et al. (1999) and
Hanks and Bakun (2002). He categorized earthquakes
occurring in inland crust in both the US West Coast
and the Japanese Islands as interplate. He suggested
that interplate strike–slip earthquakes showed satu-
ration of fault widths of 12–20 km (Figure 2 of
Leonard 2010). Yen and Ma (2011) investigated
source scaling relationships in the collision zone of
Taiwan. Their relationship is influenced by a seis-
mogenic thickness of 35 km, suggesting that stress
drops for small events (Mo B 1020 N m) have some
variation of 1–10 MPa. Another notable feature is
constant slip for seismic moments smaller than
1020 N m. It is suggested that the tectonic regime in
the collision zone of Taiwan is different from that in
the Japanese Archipelago. Stirling et al. (2013)
showed different source scaling relationships
according to different tectonic regimes (e.g., plate
boundary crustal, stable continental, subduction, and
volcanic) and slip types (e.g., strike–slip, reverse, and
normal fault). Besides, plate boundary earthquakes
are classified into two subclasses (fast and slow plate
boundary faults). They concluded the importance of
choosing scaling relationships carefully for seismic
hazard applications in different tectonic environ-
ments. As noted below, the classification of inland
crustal earthquakes in Japan, the transform interplate
and crustal intraplate ones on the US West Coast
should be unified for the same tectonic regionality,
because the source scaling relationships for both are
almost the same.
Wells and Coppersmith (1994) also indicated that
the surface rupture length observed from geological
survey and the subsurface rupture length estimated
from the best-defined aftershock zone are not nec-
essarily consistent with each other. Hence, it is
possible that the reliability of datasets of source
parameters estimated from different measurements
will affect the source scaling relationship. To discuss
source scaling relationships accurately, one must
therefore use source parameters of earthquakes esti-
mated using the same measurement technique in the
same tectonic regionality. Rupture areas have been
estimated highly accurately by waveform inversion
rather than using the aftershock distribution or sur-
face rupture surveys after earthquakes. Inland crustal
earthquakes in the Japanese Archipelago occur in
crustal intraplate regions close to active plate mar-
gins, where the seismicity is very high. The crustal
earthquakes on the US West Coast also occur near
transform interplate and crustal intraplate regions
with high seismicity. We recognized that inland
crustal earthquakes in active regions with high
seismicity in Japan are almost the same as those on
the US West Coast. In this study, we investigated
source scaling relationships of inland crustal earth-
quakes in tectonically active regions using source
parameters obtained from rupture models by wave-
form inversion analysis.
Vol. 177, (2020) Scaling Relationships of Source Parameters of Inland Crustal Earthquakes 1919
2. Earthquake Categorization
Earthquakes occur in different seismotectonic
settings and involve various faulting styles. Firstly,
the seismotectonic setting in which earthquakes occur
must be identified for discussion of source scaling
relationships. The new regulatory guides of the
Nuclear Regulation Authority (NRA) in Japan cate-
gorize earthquakes in and around Japan into three
types (inland crustal earthquakes, interplate earth-
quakes, and oceanic intraplate earthquakes). Our
main targets are the inland crustal earthquakes in
tectonically active regions in Japan and on the US
West Coast. So far, we have categorized the inland
crustal earthquakes compiled by Somerville et al.
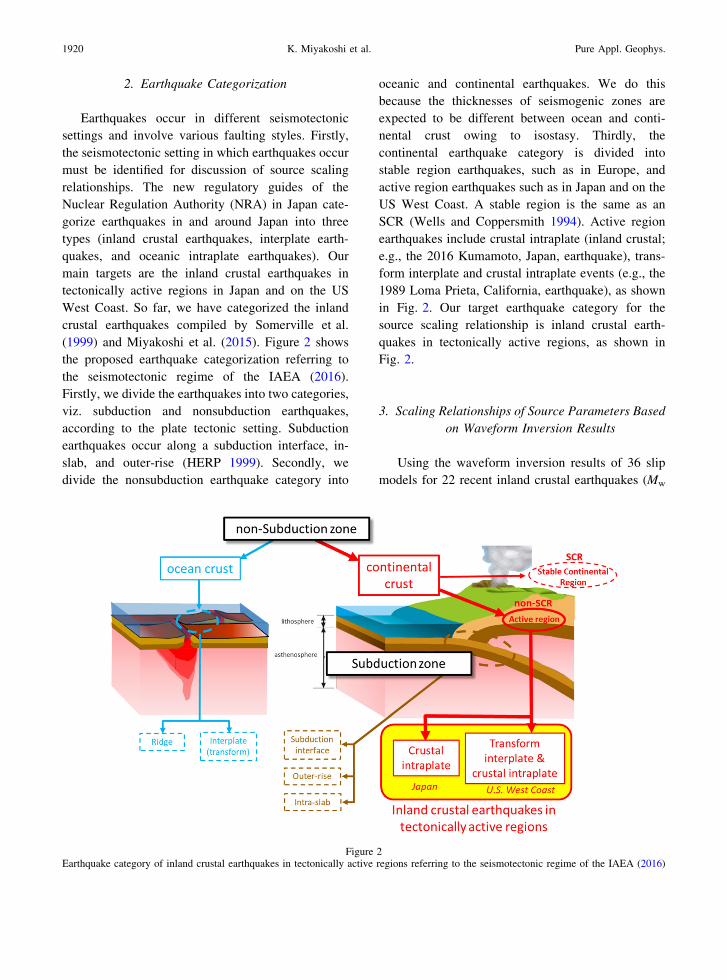
(1999) and Miyakoshi et al. (2015). Figure 2 shows
the proposed earthquake categorization referring to
the seismotectonic regime of the IAEA (2016).
Firstly, we divide the earthquakes into two categories,
viz. subduction and nonsubduction earthquakes,
according to the plate tectonic setting. Subduction
earthquakes occur along a subduction interface, in-
slab, and outer-rise (HERP 1999). Secondly, we
divide the nonsubduction earthquake category into
oceanic and continental earthquakes. We do this
because the thicknesses of seismogenic zones are
expected to be different between ocean and conti-
nental crust owing to isostasy. Thirdly, the
continental earthquake category is divided into
stable region earthquakes, such as in Europe, and
active region earthquakes such as in Japan and on the
US West Coast. A stable region is the same as an
SCR (Wells and Coppersmith 1994). Active region
earthquakes include crustal intraplate (inland crustal;
e.g., the 2016 Kumamoto, Japan, earthquake), trans-
form interplate and crustal intraplate events (e.g., the
1989 Loma Prieta, California, earthquake), as shown
in Fig. 2. Our target earthquake category for the
source scaling relationship is inland crustal earth-
quakes in tectonically active regions, as shown in
Fig. 2.
3. Scaling Relationships of Source Parameters Based
on Waveform Inversion Results
Using the waveform inversion results of 36 slip
models for 22 recent inland crustal earthquakes (Mw
Figure 2Earthquake category of inland crustal earthquakes in tectonically active regions referring to the seismotectonic regime of the IAEA (2016)
1920 K. Miyakoshi et al. Pure Appl. Geophys.

Figure 3Distribution of 22 events included in this study and their focal mechanisms (F-net)
Vol. 177, (2020) Scaling Relationships of Source Parameters of Inland Crustal Earthquakes 1921

5.4–7.1) (Fig. 3) that occurred in Japan after the 1995
Hyogo-ken Nanbu earthquake (Mw 6.9), we extracted
the source parameters from the inversion results using
the same criterion as Somerville et al. (1999). These
seismic magnitude ranges (Mw 5.4–7.1) correspond to
the first and second stage of the three-stage source
scaling relationship.
3.1. Trimming Methods for Fault Rupture Area
We calculated the averaged source parameters of
the logarithm using various inversion results for the
same events reported by different authors. Figure 4
shows an example of the waveform inversion result
of the 2016 Kumamoto, Japan, earthquake (Mw 7.1).
In most waveform inversion analysis, the rectangular
dimensions of the fault are chosen to be at least large
enough to accommodate the entire fault rupture as
estimated from the best-defined aftershock zone, and
thus sometimes overestimate the actual dimensions of
the rupture area. To estimate the ‘‘true’’ fault
dimension accurately, Somerville et al. (1999;
S1999) trimmed slip models by removing rows/col-
umns if their average slip was less than 0.3 times the
average slip in rupture area. A part of the Hinagu
segment (‘‘H’’ in Fig. 4), southwest segment of the
Kumamoto earthquake, is removed by the trimming
method of Somerville et al. (1999). Mai and Beroza
(2000; M2000) introduced the concept of effective
source dimensions, based on the autocorrelation
width of the spatially variable slip. Thingbaijam
and Mai (2016; T2016) proposed a new concept of
effective source dimensions extended from M2000.
Thingbaijam et al. (2017) also trimmed slip models
by using the T2016 trimming method and proposed
new scaling relationships. Because both trimming
methods (S1999 and T2016) have the common
purpose of estimating the ‘‘true’’ fault dimension
accurately, one must evaluate whether they can
extract the same source parameters. To do this, we
compare the rupture areas obtained using both
trimming methods, S1999 and T2016.
We used three datasets of inland crustal events
(hereinafter called datasets A, B, and C). Dataset A is
composed of 22 events in Japan, the slip models of
which were trimmed by S1999. Dataset B is com-
posed of 15 events on the US West Coast compiled
by Somerville et al. (1999), the slip models of which
were trimmed by S1999. Dataset C is composed of
133 events compiled by Thingbaijam et al. (2017),
the slip models of which were trimmed by T2016.
There are 11 common events between datasets A and
Figure 4Slip distribution on fault plane of the 2016 Kumamoto, Japan, earthquake (EQ.1, Mw 7.1). Star indicates hypocenter. A part of the Hinagu
segment (‘‘H’’ in this figure), southwest segment of Kumamoto earthquake, is removed by the trimming method of Somerville et al. (1999).
Solid red rectangle shows rupture area obtained by the trimming method of Somerville et al. (1999)
1922 K. Miyakoshi et al. Pure Appl. Geophys.
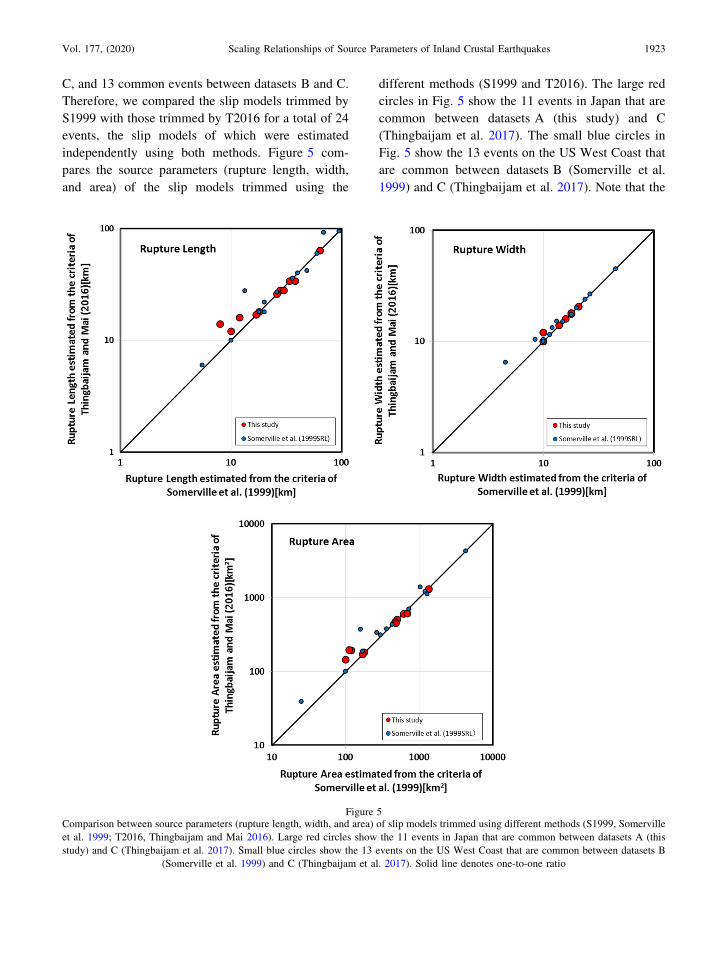
C, and 13 common events between datasets B and C.
Therefore, we compared the slip models trimmed by
S1999 with those trimmed by T2016 for a total of 24
events, the slip models of which were estimated
independently using both methods. Figure 5 com-
pares the source parameters (rupture length, width,
and area) of the slip models trimmed using the
different methods (S1999 and T2016). The large red
circles in Fig. 5 show the 11 events in Japan that are
common between datasets A (this study) and C
(Thingbaijam et al. 2017). The small blue circles in
Fig. 5 show the 13 events on the US West Coast that
are common between datasets B (Somerville et al.
1999) and C (Thingbaijam et al. 2017). Note that the
Figure 5Comparison between source parameters (rupture length, width, and area) of slip models trimmed using different methods (S1999, Somerville
et al. 1999; T2016, Thingbaijam and Mai 2016). Large red circles show the 11 events in Japan that are common between datasets A (this
study) and C (Thingbaijam et al. 2017). Small blue circles show the 13 events on the US West Coast that are common between datasets B
(Somerville et al. 1999) and C (Thingbaijam et al. 2017). Solid line denotes one-to-one ratio
Vol. 177, (2020) Scaling Relationships of Source Parameters of Inland Crustal Earthquakes 1923
source parameters of the slip models trimmed using
the different methods (S1999 and T2016) are consis-
tent with each other. Although some rupture areas
trimmed using S1999 are smaller than those obtained
using T2016, the discrepancies are small, reaching
about 0.2 (on a log scale) at the maximum. It is
important to note that the different trimming methods
S1999 and T2016 give almost the same source
parameters. This confirms that the trimmed slip
models from this study, Somerville et al. (1999),
and Thingbaijam et al. (2017) can be used to
investigate the source rupture scaling objectively.
3.2. Outer Fault Parameters
We evaluated the source scaling relationships of
inland crustal earthquakes in Japan using the source
parameters obtained from 36 slip models for 22
recent inland crustal earthquakes (Mw 5.4–7.1) by
waveform inversion analysis (Table S1). We also
added earthquake data compiled by Somerville et al.
(1999) and Murotani et al. (2015). Figure 6a, b shows
the relationships between rupture area (A) and seis-
mic moment (Mo) and between rupture length (L) and
seismic moment (Mo), respectively. We used seismic
moment estimated by F-net, NIED. The relation
between the rupture area and seismic moment seems
to bend at around Mw 6.5 due to saturation of fault
width. For larger earthquakes (Mw [ 7.0) in seismi-
cally active regions, we plot source parameters
compiled by Murotani et al. (2015). The relation
(Mw [ 7.4) seems to show another bend due to
saturation of fault displacements (Tajima et al. 2013).
Combining the earthquake data of Mw 5.4–7.1 from
this study with those of Mw 7.0–8.0 (Murotani et al.
2015), we recognize that the scaling relationship of
rupture area versus seismic moment coincides with
the three-stage source scaling relationship (Table S2)
using source parameters extracted from waveform
inversions. The empirical relationship of Leonard
(2014) almost agrees with datasets of estimated
source parameters at the first stage (A is proportional
to Mo2/3) of the three-stage scaling relationship
(Mw \ 6.5) in this paper. The empirical relationship
of Hanks and Bakun (2002) is in agreement with
datasets of source parameters at the first and second
stages (A is proportional to Mo2/3, Mo1/2) of the three-
stage scaling relationship (Mw B 7.4). However, the
rupture area in their empirical relationship is an
underestimate compared with that of our datasets at
the third stage (Mw[ 7.4). The rupture area for a
certain seismic moment obtained from the empirical
relationships by Thingbaijam et al. (2017) tends to be
slightly larger than that of our datasets at the second
and third stages (Mw[ 6.5). On the other hand, the
empirical relationships of Yen and Ma (2011) are not
in agreement with our datasets over a wide range of
seismic moment, suggesting that the tectonic regime
in the collision zone of Taiwan is different from that
in the Japanese Archipelago, as mentioned above. In
conclusion, our datasets for the first stage of the
three-stage scaling relationships are consistent with
the empirical scaling relationships of both Leonard
(2014) and Hanks and Bakun (2002), while those for
the second stage are consistent with the empirical
scaling relationships of Hanks and Bakun (2002).
Note that a clear dependence of the source parameters
on the faulting style cannot be seen in these figures.
Figure 6c shows the relationship between the rupture
width (W) and seismic moment (Mo). It is obvious
that rupture widths are saturated at 16–18 km
(Mw C 6.5–7) for the thickness of the seismogenic
zone in Irikura and Miyake (2001) and Leonard
(2014) in Fig. 6c. However, Thingbaijam et al.
(2017) proposed that the rupture width becomes
wider with increasing seismic moment without sat-
uration. We discuss below whether rupture width
saturates for the inland crustal earthquakes compiled
by Thingbaijam et al. (2017) if appropriate regional-
ity is taken into consideration for scaling of inland
crustal earthquakes.
3.3. Inner Fault Parameters
From the heterogeneous final slip model, we
determined the asperity area following the criterion
proposed by Somerville et al. (1999). The combined
areas of asperities are defined as large slip areas
where slips are more than 1.5 times the average slip
on the entire source fault. The asperity model has one
or several patches with constant large slip velocity
and a background area with less slip (Irikura and
Miyake 2011). The final slip distributions and the
extracted asperity areas for the 2005 Fukuoka, Japan,
1924 K. Miyakoshi et al. Pure Appl. Geophys.

earthquake (Mw 6.6, EQ.8) are shown in Fig. 7 as an
example. The combined area of asperities is an
important source parameter corresponding to the
effective stress drop for the prediction of strong
ground motions (Irikura and Miyake, 2011). Figure 8
shows the relationship between the combined area of
Figure 6Relationships between source parameters and seismic moment. Yellow symbols denote earthquakes included in this study (square: reverse-
slip, triangle: strike-slip, circle: normal-slip). Datasets of source parameters in this study are presented in Table S1. Datasets of Somerville
et al. (1999), Murotani et al. (2015), and Stirling et al. (2002) are also plotted in this figure. Selected datasets of Stirling et al. (2002) by
Murotani et al. (2015) are used in this study. a Relationship between rupture area and seismic moment. Solid black line shows empirical
scaling relationship proposed by HERP (2017). Solid green, gray, orange, and blue lines show empirical scaling relationships of Hanks and
Bakun (2002), Yen and Ma (2011), Leonard (2014), and Thingbaijam et al. (2017), respectively. b Relationship between rupture length and
seismic moment. Solid black lines show empirical scaling relationships proposed by Takemura (1998) (Mo\ 7.5 9 1018 N m) and Irikura
and Miyake (2001) (Mo C 7.5 9 1018 N m), respectively. The other solid lines show the same empirical scaling relationships as in a except
Hanks and Bakun (2002). c Relationship between rupture width and seismic moment. Solid black lines show empirical scaling relationships
proposed by Hashimoto (2007) (Mw C 6.5) and Irikura and Miyake (2001) (L\Wmax), respectively. The other solid lines show the same
empirical scaling relationships as in a except Hanks and Bakun (2002)
Vol. 177, (2020) Scaling Relationships of Source Parameters of Inland Crustal Earthquakes 1925

asperities (Aasp) and seismic moment (Mo). Note that
the slope of the scaling relationship between the
combined area of asperities and seismic moment in
this study coincides with that of Somerville et al.
(1999). If we give weight to recent results for 22
earthquakes, Aasp seems to bend at around Mw 6.5 to
become proportional to Mo1/2 (broken red line in
Fig. 8), keeping effective stress constant.
4. Discussion
4.1. Average Static Stress Drop in Rupture Area
Source scaling is an important issue for earth-
quake source physics. Since Kanamori and Anderson
(1975) proposed empirical relations between source
parameters such as fault length, fault width, fault
displacement, etc., it has been widely accepted that
the stress drop has a constant value independent of
seismic moment. Wells and Coppersmith (1994) and
Leonard (2014) assumed constant stress drop and
proposed a self-similar scaling relationship with
A proportional to Mo2/3 over a wide range of seismic
moment. Hanks and Bakun (2002) assumed increas-
ing stress drop and proposed bilinear scaling
relationships with A proportional to Mo1/2 over a
large seismic moment range (Mw[ 6.7). HERP
(2017) adopts a three-stage source scaling relation-
ship with different slopes between the source rupture
area and seismic moment (where A is proportional to
Mo2/3, Mo1/2, and Mo1). Therefore, whether stress
drop varies over a wide seismic moment range must
be discussed. We estimated the static stress drop in
the rupture area from the heterogeneous final slip of
waveform inversion results using the method devel-
oped by Okada (1992). Figure 9 shows an example of
the static stress drop obtained from the inverted slip
distribution of the 2005 Fukuoka, Japan, earthquake
(Mw6.6, EQ.8) estimated using Okada’s method.
Figure 10 shows the relationship between the average
static stress drop and seismic moment for 19 events
(Table S3). The average static stress drops do not
show such a large difference in the range of the first
Figure 7Slip distribution on fault plane of the 2005 Fukuoka, Japan,
earthquake (Mw6.6, EQ.8). Star indicates hypocenter. Red rectan-
gles denote asperity areas extracted using the criterion of
Somerville et al. (1999)
Figure 8Relationship between combined area of asperities (Aa) and seismic
moment. Datasets of Somerville et al. (1999) are also plotted in this
figure (small circles). Solid blue line shows empirical relationship
of Somerville et al. (1999). Broken red line shows relationship
proportional to Mo1/2 (Mw C 6.5)
Figure 9Static stress drop distribution of the 2005 Fukuoka, Japan,
earthquake (Mw6.6, EQ.8) estimated using the method of Okada
(1992). Star indicates hypocenter
1926 K. Miyakoshi et al. Pure Appl. Geophys.

and second stages of the three-stage source scaling
relationship. The average static stress drops in the
first stage (Mw \ 6.5) fluctuate within 1–4 MPa. The
average stress drop of 2.3 MPa used in the recipe for
strong motion prediction by HERP (2017) is in
approximate agreement with the mean value
(1.7 MPa) of the average static stress drops found
here for the first stage (Mw\ 6.5). Further, the
average static stress drops in the second stage
(6.5 B Mw\ 7.1) also fluctuate within 2–5 MPa.
The static stress drop (3.1 MPa) proposed by Fujii
and Matsu’ura (2000) for strike-slip-type earthquakes
(Mw C around 6.5) approximately agrees with the
mean value (3.1 MPa) of the average static stress
drops found here (6.5 B Mw \ 7.1). We find that the
fluctuation of static stress drops seems to be small
over a very wide range of seismic moment, being
almost constant from Mw 5.4 to 7.1.
4.2. Saturation of Rupture Width
Thingbaijam et al. (2017) proposed a new scaling
relationship for source parameters based on a large
SRCMOD database (Mai and Thingbaijam 2014). As
mentioned above, they showed that the rupture width
becomes longer with increasing seismic moment (or
Mw) and does not saturate for strike-slip-type
earthquakes (Fig. 6c). However, Hashimoto (2007)
and Leonard (2010) proposed that rupture widths for
inland crustal earthquakes (strike-slip, reverse-slip,
and normal-slip type) saturated at about 16–18 km
for the thickness of the seismogenic zone (Fig. 6c).
The saturation of the rupture widths forms the second
and third stages. Our compiled inversion results (e.g.,
Somerville et al. 1999; Miyakoshi et al. 2015)
involve intraplate, transform interplate, and inland
crustal earthquakes in tectonically active regions,
mainly in Japan and on the US West Coast (Fig. 2).
In contrast, Thingbaijam et al. (2017) compiled
strike-slip-type earthquakes, which include oceanic
intraplate earthquakes (Mw[ 7.2), e.g., the 2013
Scotia Sea earthquake (Mw 7.7). To discuss the
source scaling relationship accurately, it is important
to consider earthquakes that occur in the same
seismotectonic setting with high seismic activity, as
described above. Therefore, we try to remove the
oceanic intraplate earthquakes (Mw[ 7.2) compiled
by Thingbaijam et al. (2017). Figure 11 shows the
relationship between rupture width (W) and seismic
moment (Mo) for the dataset from which the oceanic
intraplate earthquakes (Mw [ 7.2) are omitted. We
recognized that rupture widths saturate at about
16–18 km for inland crustal earthquakes with
strike-slip in Fig. 11. The database of inland crustal
earthquakes from SRCMOD, except for the oceanic
intraplate earthquakes (Mw [ 7.2), is in good
Figure 10Relationship between average static stress drop in rupture area and
seismic moment estimated in this study (square: reverse-slip,
triangle: strike-slip, circle: normal-slip). Solid black line shows
self-similar stress drop (2.3 MPa) based on the recipe for strong
ground motion prediction by HERP (2017) (Mw\ 6.5). Broken
and solid grey line shows the static stress drop (3.1 MPa) proposed
by Fujii and Matsu’ura (2000) for strike-slip-type earthquakes
(Mw C around 6.5)
Figure 11Relationship between rupture width and moment magnitude for
inland crustal earthquakes of strike-slip type compiled by Thing-
baijam et al. (2017). Solid blue line shows empirical relationship of
Thingbaijam et al. (2017). ‘‘9’’ denotes oceanic intraplate earth-
quakes compiled by Thingbaijam et al. (2017). Solid black lines
show empirical scaling relationships proposed by Hashimoto
(2007) (Mw ‡ 6.5) and Irikura and Miyake (2001) (L\Wmax),
respectively. Solid orange line shows empirical scaling relation-
ships of Leonard (2014)
Vol. 177, (2020) Scaling Relationships of Source Parameters of Inland Crustal Earthquakes 1927

agreement with the empirical scaling relationship of
Hashimoto (2007) and Leonard (2010) in the second
and third stages.
5. Conclusions
Using waveform inversion results for 22 recent
inland crustal earthquakes (Mw 5.4–7.1) in Japan, we
extracted the source parameters (rupture area, asper-
ity area, etc.) from the inverted heterogeneous slip
distributions following the criterion of Somerville
et al. (1999). We recognized that the scaling rela-
tionship for rupture area (A) versus seismic moment
(Mo) obtained in this study coincide with the three-
stage source scaling relationship (HERP 2017). A
different trimming method for the heterogeneous slip
model by Thingbaijam and Mai (2016) gives almost
the same source parameters as when using that of
Somerville et al. (1999). It is important to note that
trimmed slip models have been used to objectively
investigate the source rupture scaling. We also esti-
mated the average static stress drop in the rupture
area from heterogeneous slip of source inversion
results using the method of Okada (1992). The esti-
mated static stress drops with variation of 1–5 MPa
were in approximate agreement with the self-similar
stress drops (2.3 MPa) based on the recipe used by
HERP (2017) (Mw \ 6.5) and the static stress drop
(3.1 MPa) proposed by Fujii and Matsu’ura (2000)
(Mw C around 6.5). Source parameters of rupture
width compiled by Thingbaijam et al. (2017),
excluding oceanic intraplate earthquakes, showed
saturation at about 16–18 km for inland crustal
earthquakes. We found that source scaling relation-
ships of inland crustal earthquakes are controlled by
the tectonic setting with high seismic activity rather
than faulting style.
Acknowledgements
We used the hypocentral information catalog of the
Japan Meteorological Agency (JMA) in cooperation
with the Ministry of Education, Culture, Sports,
Science, and Technology (MEXT), and source infor-
mation from F-net provided by the National Research
Institute for Earth Science and Disaster Resilience
(NIED). We would like to thank Dr. Asano, K.
(DPRI), Dr. Sekiguchi, H. (DPRI), Prof. Iwata, T.
(DPRI), Dr. Horikawa, H. (AIST), Dr. Kubo, H.
(NIED), Dr. Suzuki, W. (NIED), Dr. Aoi, S. (NIED),
and Dr. Hikima, K. (TEPCO) for provision of
waveform inversion results. Careful reviews and
comments by the editor and two anonymous review-
ers were quite helpful in improving the manuscript.
This study was mainly based on the 2017 & 2018
research project ‘‘Examination for uncertainty of
strong ground motion prediction for the inland crustal
earthquakes’’ by the Secretariat of the Nuclear
Regulation Authority (NRA), Japan.
Publisher’s Note Springer Nature remains neutral
with regard to jurisdictional claims in published maps
and institutional affiliations.
REFERENCES
Fujii, Y., & Matsu’ura, M. (2000). Regional difference in scaling
laws for large earthquakes and its tectonic implication. Pure and
Applied Geophysics, 157, 2283–2302.
Hanks, T. H., & Bakun, W. H. (2002). A bilinear source-scaling
model for M–logA observations of continental earthquakes.
Bulletin of the Seismological Society of America, 92, 1841–1846.
Hashimoto, T. (2007). The surface length of earthquake fault and
the moment magnitude. In Abstracts of Japan Geoscience Union
meeting, S145-013.
Headquarters for Earthquake Research Promotion (HERP). (1999).
Seismic activity in Japan. https://www.hp1039.jishin.go.jp/
eqchreng/eqchrfrm.htm. Accessed Oct 2018.
Headquarters for Earthquake Research Promotion (HERP). (2017).
Predicting strong ground motions for identified earthquake sce-
narios (RECIPE) (in Japanese). https://www.jishin.go.jp/main/
chousa/17_yosokuchizu/recipe.pdf. Accessed Oct 2018.
International Atomic Energy Agency (IAEA). (2016). Diffuse
seismicity in seismic hazard assessment for site evaluation of
nuclear installations. Safety reports series, no. 89. https://www-
pub.iaea.org/MTCD/publications/PDF/Pub1727web-33787836.
pdf. Accessed Oct 2018.
Irikura, K., & Miyake, H. (2001). Predicting of strong ground
motions for scenario earthquakes. Journal of Geography, 110,
849–875. (in Japanese).
Irikura, K., & Miyake, H. (2011). Recipe for predicting strong
ground motion from crustal earthquake scenarios. Pure and
Applied Geophysics, 168, 85–104.
Kanamori, H., & Anderson, D. L. (1975). Theoretical basis of some
empirical relations in seismology. Bulletin of the Seismological
Society of America, 65, 1073–1095.
1928 K. Miyakoshi et al. Pure Appl. Geophys.

Leonard, M. (2010). Earthquake fault scaling: Self-consistent
relating of rupture length, width, average displacement, and
moment release. Bulletin of the Seismological Society of Amer-
ica, 100, 1971–1988.
Leonard, M. (2012). Erratum: Earthquake fault scaling: Self-con-
sistent relating of rupture length, width, average displacement,
and moment release. Bulletin of the Seismological Society of
America, 102, 2972.
Leonard, M. (2014). Self-consistent earthquake fault-scaling rela-
tions: Update and extension to stable continental strike-slip
faults. Bulletin of the Seismological Society of America, 104,
2953–2965.
Mai, P. M., & Beroza, G. C. (2000). Source scaling properties from
finite-fault-rupture models. Bulletin of the Seismological Society
of America, 90, 604–615.
Mai, P. M., & Thingbaijam, K. K. S. (2014). SRCMOD: An online
database of finite-fault rupture models. Seismological Research
Letters, 85, 1348–1357.
Miyakoshi, K., Irikura, K., & Kamae, K. (2015). Re-examination of
scaling relationships of source parameters of the inland earth-
quakes in Japan based on the waveform inversion of strong
motion data. Journal of Japan Association for Earthquake
Engineering, 15, 141–156. (in Japanese with English abstract).
Miyakoshi, K., Kagawa, T., Sekiguchi, H., Iwata, T., & Irikura, K.
(2000). Source characterization of inland earthquakes in Japan
using source inversion results. In Proceedings of the 12th World
Conference on Earthquake Engineering (CD-ROM).
Murotani, S., Matsushima, S., Azuma, T., Irikura, K., & Kitagawa,
S. (2015). Scaling relation of source parameters of earthquakes
on inland crustal mega-fault systems. Pure and Applied Geo-
physics, 172, 1371–1381.
Okada, Y. (1992). Internal deformation due to shear and tensile
faults in a half-space. Pure and Applied Geophysics, 82,
1018–1040.
Scholz, C. H., Aviles, C. A., & Wesnousky, S. G. (1986). Scaling
differences between large interplate and intraplate earthquakes.
Bulletin of the Seismological Society of America, 76, 65–70.
Somerville, P., Irikura, K., Graves, R., Sawada, S., Wald, D.,
Abrahamson, N., et al. (1999). Characterizing crustal earthquake
slip models for the prediction of strong ground motion. Seis-
mological Research Letters, 70, 59–80.
Stirling, M., Goded, D., Berryman, K., & Litchfield, N. (2013).
Selection of earthquakes scaling relationships for seismic-hazard
analysis. Bulletin of the Seismological Society of America, 103,
1–19.
Stirling, M., Rhoades, D., & Berryman, K. (2002). Comparison of
earthquake scaling relations derived from data of instrumental
and preinstrumental era. Bulletin of the Seismological Society of
America, 92, 812–830.
Tajima, R., Matsumoto, Y., Si, H., & Irikura, K. (2013). Com-
parative study on scaling relations of source parameters for great
earthquakes in inland crusts and on subducting plate-boundaries.
ZISIN2 (Journal of the Seismological Society of Japan), 66,
31–45. (in Japanese with English abstract).
Takemura, M. (1998). Scaling law for Japanese intraplate earth-
quakes in special relations to the surface faults and the damages.
ZISIN2 (Journal of the Seismological Society of Japan), 51,
211–228. (in Japanese with English abstract).
Thingbaijam, K. K. S., & Mai, P. M. (2016). Evidence for truncated
exponential probability distribution of earthquake slip. Bulletin
of the Seismological Society of America, 106, 1802–1816.
Thingbaijam, K. K. S., Mai, P. M., & Goda, K. (2017). New
empirical earthquake source-scaling laws. Bulletin of the Seis-
mological Society of America, 107, 2225–2246. https://doi.org/
10.1785/0120170017.
Wells, D. L., & Coppersmith, K. J. (1994). New empirical rela-
tionships among magnitude, rupture length, rupture width,
rupture area, and surface displacement. Bulletin of the Seismo-
logical Society of America, 84, 974–1002.
Yen, Y. T., & Ma, K. F. (2011). Source-scaling relationship for M
4.6-8.9 earthquakes, specifically for earthquakes in the collision
zone of Taiwan. Bulletin of the Seismological Society of Amer-
ica, 101, 464–481.
(Received November 7, 2018, revised March 10, 2019, accepted March 11, 2019, Published online April 16, 2019)
Vol. 177, (2020) Scaling Relationships of Source Parameters of Inland Crustal Earthquakes 1929