scaling of the fracture process zone in rock
TRANSCRIPT
Int J Fract (2017) 204:191–204DOI 10.1007/s10704-016-0172-0
ORIGINAL PAPER
Scaling of the fracture process zone in rock
Ali Tarokh · Roman Y. Makhnenko ·Ali Fakhimi · Joseph F. Labuz
Received: 9 February 2016 / Accepted: 11 November 2016 / Published online: 28 November 2016© Springer Science+Business Media Dordrecht 2016
Abstract The zone of microcracks surrounding anotch tip—the process zone—is a phenomenonobserved in fracture of quasi-brittle materials, and thecharacterization of the process zone is the topic of thepaper. Specimens of different sizes with a center notchfabricated from a granite of large grain (Rockville gran-ite, average grain size of 10 mm), were tested in three-point bending. Acoustic emissions were recorded andlocations of microcracks were determined up to peakload. The results show that both the length and width ofthe process zone increase with the increase of the spec-imen size. Furthermore, the suitability of a proposedtheoretical relationship between the length andwidth ofthe process zone and specimen size was studied experi-mentally and numerically. The discrete elementmethodwith a tension softening contact bond model was usedto investigate the development of the process zone withthe specimen size. A synthetic rock composed of rigidcircular particles that interact through normal and shearsprings was tested in the numerical simulations. It was
A. Tarokh (B) · J. F. LabuzDepartment of Civil, Environmental, and Geo-Engineering,University of Minnesota, Minneapolis, MN, USAe-mail: [email protected]
R. Y. MakhnenkoDepartment of Civil and Environmental Engineering,University of Illinois at Urbana-Champaign, Urbana,IL, USA
A. FakhimiDepartment of Mineral Engineering, New Mexico Institute ofMining and Technology, Socorro, NM, USA
shown that the limiting specimen size, beyondwhich nofurther noticeable increase in the length of the processzone is observed, is significantly larger than the limitingspecimen size beyond which the width of the processzone shows no size effect.
Keywords Fracture process zone · Size effect ·Brittleness number · Acoustic emission · Discreteelement method
1 Introduction
The zone of microcracking that is formed at peak loadin a structure composed of a quasi-brittle material isreferred to as the process zone, and this region is associ-atedwith energy dissipation due to crack growth (Evans1976; Hillerborg et al. 1976). Furthermore, it is wellknown that the fracture energy must be finite and forlinear fracture mechanics, this parameter is a materialconstant (Knott 1973). Therefore, to ensure the condi-tion of constant fracture energy, the size of the processzone must eventually reach a limiting value (Bazantand Pfeiffer 1987; Bazant and Kazemi 1990). How-ever, someexperiments show that a limiting size is oftennot observed (e.g. Otsuka and Date 2000), while otherexperiments report a constant process zone size (e.g.Le et al. 2014). Indeed, the specimen size itself is animportant factor in evaluating the process zone.
Studies on the process zone have been of consider-able interest to many researchers (Jankowski and Stys
123

192 A. Tarokh et al.
Fig. 1 Two geometricallysimilar beams of the samematerial in three pointbending: a small beam inwhich the K -dominant zone(in black) falls within theprocess zone (in red) and blarge beam in which theprocess zone (in red) lieswithin the K -dominant zone
S1
D1
P1
a1
FPZ
S2
D2
P2
a2
FPZ
(a) (b)
1990; Cattaneo and Biolzi 2010; Biolzi et al. 2011; Linet al. 2014). Different parameters such as microstruc-ture (Barton 1982; Brooks et al. 2012; Tarokh andFakhimi 2014), notch length (Zhang and Wu 1999;Ohno et al. 2014), and loading rate (Bazant et al. 1993;Backers et al. 2005) have been reported to have animpact on process zone size.
The objective of this work is to investigate experi-mentally and numerically the size effect on the widthand length of the process zone in rock. Scaled speci-mens of Rockville granite, with an average grain sizeof 10 mm, were tested in three-point bending. Acousticemission (AE) monitoring was used to find the dimen-sions of the process zone. AE is one of the most com-mon methods to study fracture, with the advantage thatthe entire volume of the specimen is sampled (Mihashiet al. 1991; Zang et al. 2000). Speckle interferome-try (Wang et al. 1990; Haggerty et al. 2010) and dig-ital image correlation (Lin et al. 2014) are examplesof other techniques that provide higher resolution ofmeasurement, but these are limited to surface observa-tions. Numerical methods, where features of the frac-ture process (e.g. critical opening displacement) arefound through a comparison with experiments and fit-ting parameters such as load-deflection or load-crackmouth opening displacement curves (de Borst 2003),can also provide an insight. To demonstrate the abil-ity of the bonded particle model to simulate rockfracture, numerical beams of Rockville granite weretested. Experimental and numerical results are com-pared and the limiting specimen sizes for both widthand length of the fracture process zone are found anddiscussed.
2 Theoretical model
Consider two geometrically similar beams in twodimensions under three-point bending (Fig. 1), withthe process zone developed at the peak load around thenotch tip in both specimens. Linear fracture mechan-ics shows that the extent of the K -dominant zone,where stresses and displacements are well predictedby the one-term solution, scales with the specimensize: by increasing the beam dimensions, the extentof K -dominant zone increases proportionally. If theprocess zone size is assumed to be a material con-stant, a small beam size can be chosen in which thesize of the process zone is larger than the K -dominantzone (Fig. 1a). On the other hand, for a much largerbeam, the process zone can be completely confinedwithin the K -dominant zone. This suggests that in thevicinity of the notch tip in these beams, two differ-ent stress regimes can exist, which is not consistentwith the assumption that the size of the process zone isinvariant. Therefore, the process zone must change asthe specimen size is modified, although from an energyargument, a constant process zone size will be eventu-ally reached.
The concept adopted in this paper is a process zoneof a two dimensional rectangular shape with length land width W . Three different scenarios can be consid-ered for the size-dependency of the process zone. Inthe first scenario, the beam height (D) is smaller thana certain value (D < DW ) and, with increase in thebeam size, both the length and width of the processzone increase. In the second scenario, with beam sizein the range of DW < D < Dl , the width of the
123

Scaling of the fracture process zone in rock 193
process zone becomes approximately constant, but itslength can continue to increase with the specimen size.Eventually, in the third scenario, for beam size largerthan Dl (D > Dl), both the length and the width ofthe process zone do not change with specimen size.The limiting sizes of DW and Dl are postulated to bedependent on material characteristics (e.g. grain size).Furthermore, the limiting sizes of DW and Dl in somerock types (e.g. Berea sandstone with 0.2 mm grains)is small enough such that with typical laboratory sizes(tens of mm), a constant process zone size is observed(Le et al. 2014). However, in other rock types (e.g.Rockville granite), the minimum specimen size (Dl)
after which both the length and the width of the processzone are approximately constant is significantly large(>1 m) and difficult to test in a laboratory. As a conse-quence, depending on the specimen size and material,different conclusions regarding the size of process zonehave been reported in the literature (Zietlow and Labuz1998; Otsuka and Date 2000).
Based on Bazant’s size effect law, Fakhimi andTarokh (2013) proposed the following equation for theevolution of the process zone with specimen size:
W = W∞D
D0w
(1 + D
D0w
) (1)
whereW is thewidth of the process zone, D is a charac-teristic dimension (here it is equal to the beam height),D0w is a constant with the dimension of length, andW∞ is the width of the process zone for very largespecimens. Furthermore, the following formula for thelength of the process zone was proposed, which is sim-ilar to that suggested by Bazant and Kazemi (1990):
� = �∞D
D0l
(1 + D
D0l
) (2)
where l is the length of the process zone, D0l is aconstant with the dimension of length, and l∞ is thelength of the process zone for very large specimens.Figure 2 schematically illustrates the variation of widthand length of the process zone from Eqs. (1) and (2),where D0l = 3D0w and l∞ = 3W∞. An approachthat can be used to obtain the four constantsW∞, D0w,l∞ and D0l will be discussed in the subsequent sec-tions.
00Pr
oces
s zon
e di
men
sion
, W o
r l
Specimen size, D
FPZ widthFPZ length
DW Dl
W constant W constant
l constant l increasing
Wincreasing
l increasing
Fig. 2 Schematic view of the effect of specimen size on thedimensions of the process zone
3 Experimental procedure
3.1 Rock properties
A series of three-point bending tests with a center notchwere performed on Rockville granite. This rock, quar-ried in Cold Spring, Minnesota, is a porphyritic, micro-cline quartz monzonite. The average grain size for thisrock is 10 mm (largest grain size is about 20 mm)with the density of 2.7 g/cm3. The matrix is mediumto coarse grained, and is primarily composed of grayquartz and white plagioclase with some biotite. Anaverage P wave velocity is 3.2 km/s. Young’s modulusand Poisson’s ratio obtained from uniaxial compres-sion tests are E = 25–30 GPa and ν = 0.15–0.20. Theuniaxial compressive strengthUCS = 106 MPa and theindirect tensile strength σt = 8.1 MPa.
3.2 Testing apparatus
Four different beam sizes (height× span) of 50.8×127,101.6× 254, 203.2× 508 and 406.4× 1016 mm (eachsize increases by a factor of 2) were tested with thesame thickness of approximately 30 mm (Fig. 3). Foreach beam size, the tests were duplicated. The heightto span ratio was kept constant and equal to 0.4. Allbeamsweremachinedwith a sawnnotch (1.2mmwide)in the center position. The ratio of notch length to thespecimen height (ao/D)was constant and equal to 0.2.The rock beamswere loaded in three-point bending andas a result, the process zone developed at the centernotch; the sensors for monitoring the AE activity werepositioned around the notch tip (Fig. 4).
123
194 A. Tarokh et al.
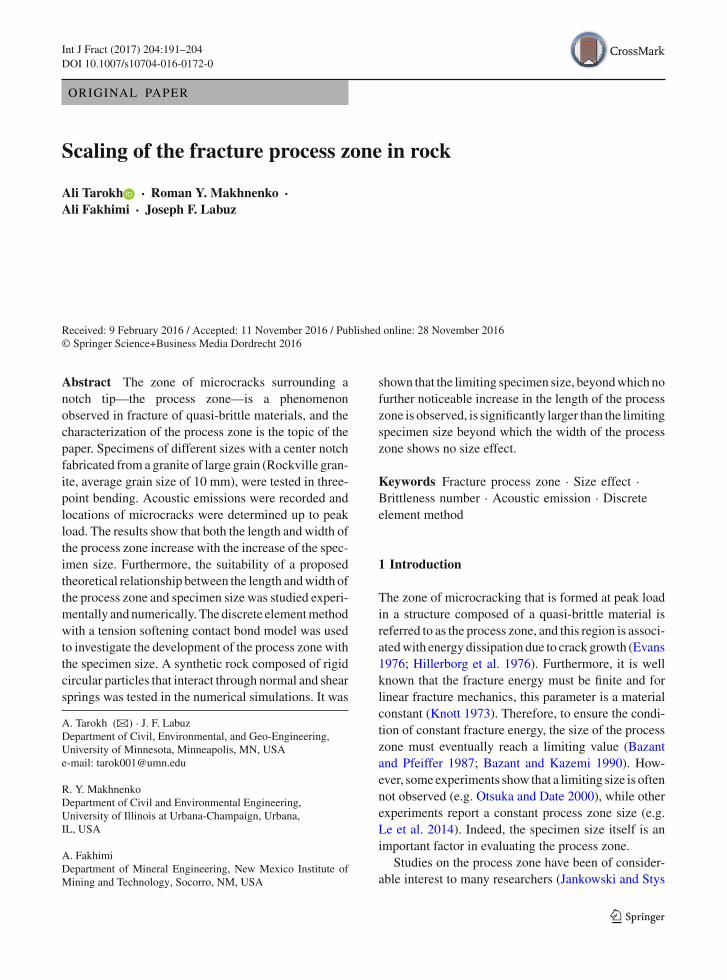
Fig. 3 Beams of Rockville granite scaled with a factor of 2
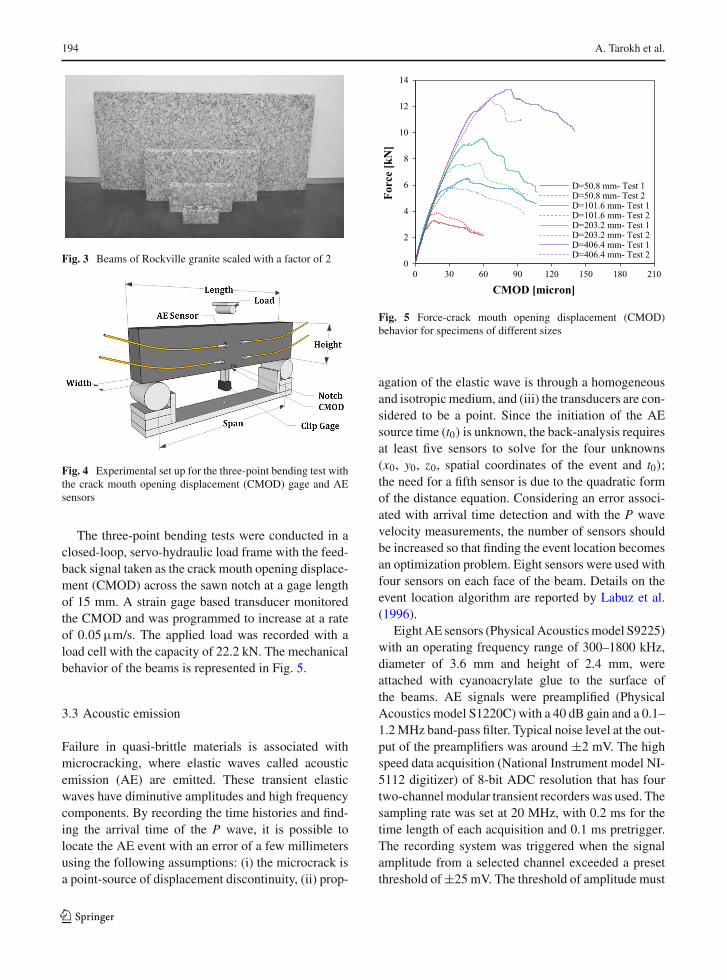
Fig. 4 Experimental set up for the three-point bending test withthe crack mouth opening displacement (CMOD) gage and AEsensors
The three-point bending tests were conducted in aclosed-loop, servo-hydraulic load frame with the feed-back signal taken as the crack mouth opening displace-ment (CMOD) across the sawn notch at a gage lengthof 15 mm. A strain gage based transducer monitoredthe CMOD and was programmed to increase at a rateof 0.05µm/s. The applied load was recorded with aload cell with the capacity of 22.2 kN. The mechanicalbehavior of the beams is represented in Fig. 5.
3.3 Acoustic emission
Failure in quasi-brittle materials is associated withmicrocracking, where elastic waves called acousticemission (AE) are emitted. These transient elasticwaves have diminutive amplitudes and high frequencycomponents. By recording the time histories and find-ing the arrival time of the P wave, it is possible tolocate the AE event with an error of a few millimetersusing the following assumptions: (i) the microcrack isa point-source of displacement discontinuity, (ii) prop-
0
2
4
6
8
10
12
14
0 30 60 90 120 150 180 210
Forc
e [k
N]
CMOD [micron]
D=50.8 mm- Test 1D=50.8 mm- Test 2D=101.6 mm- Test 1D=101.6 mm- Test 2D=203.2 mm- Test 1D=203.2 mm- Test 2D=406.4 mm- Test 1D=406.4 mm- Test 2
Fig. 5 Force-crack mouth opening displacement (CMOD)behavior for specimens of different sizes
agation of the elastic wave is through a homogeneousand isotropic medium, and (iii) the transducers are con-sidered to be a point. Since the initiation of the AEsource time (t0) is unknown, the back-analysis requiresat least five sensors to solve for the four unknowns(x0, y0, z0, spatial coordinates of the event and t0);the need for a fifth sensor is due to the quadratic formof the distance equation. Considering an error associ-ated with arrival time detection and with the P wavevelocity measurements, the number of sensors shouldbe increased so that finding the event location becomesan optimization problem. Eight sensors were used withfour sensors on each face of the beam. Details on theevent location algorithm are reported by Labuz et al.(1996).
Eight AE sensors (Physical Acousticsmodel S9225)with an operating frequency range of 300–1800 kHz,diameter of 3.6 mm and height of 2.4 mm, wereattached with cyanoacrylate glue to the surface ofthe beams. AE signals were preamplified (PhysicalAcoustics model S1220C) with a 40 dB gain and a 0.1–1.2MHz band-pass filter. Typical noise level at the out-put of the preamplifiers was around ±2 mV. The highspeed data acquisition (National Instrument model NI-5112 digitizer) of 8-bit ADC resolution that has fourtwo-channelmodular transient recorders was used. Thesampling rate was set at 20 MHz, with 0.2 ms for thetime length of each acquisition and 0.1 ms pretrigger.The recording system was triggered when the signalamplitude from a selected channel exceeded a presetthreshold of±25 mV. The threshold of amplitude must
123
Scaling of the fracture process zone in rock 195
be set so that background noise does not trigger the sys-tem, but not too high avoiding excluding low-amplitudesignals. The whole process is controlled by an in-houseprogram written in LabView and the data recording iscontinuous without interruption. Finally, AE locationswith an error less than 3 mm were considered.
4 Experimental results
4.1 Size effect analysis
The nominal strength of geometrically similar struc-tures can be defined as:
σN = cNPmax
bD(3)
where cN is a dimensionless constant, Pmax is the peakload, b is the structure width, and D is the structure size(e.g. beam height). In the three-point bending test, thisnominal strength can be determined from engineeringbeam theory (elastic beam without a notch) as:
σN = 3S
2D
Pmax
bD= 3SPmax
2bD2 (4)
where S is the beam span. Based on a strength of mate-rials (critical stress) approach, the nominal strength ofa structure is independent of the structural size (i.e.σN ∝ D0). On the other hand, when linear elasticfracture mechanics (LEFM) is applied to geometricallysimilar structures that are perfectly brittle and havegeometrically similar cracks, the nominal strength is afunction of D−1/2 (i.e. σN ∝ D−1/2). These size-effectrelationships can be considered as a type of power-lawscaling. However, for quasi-brittle materials, due to theexistence of the process zone, power-law scaling doesnot capture the transition from the two limiting cases,i.e. strength and fracture toughness (LEFM).
For quasi-brittle materials such as rock, the processzone could contain a large volume of the structure andhence its effect should not be ignored. A size effect lawwas proposed by Bazant (1984):
σN = Bσt√1 + D
D0
(5)
where σt is the tensile strength, B is a dimensionlessparameter characterizing the geometry, and D0 is the
transitional structure size. This scaling law has an ener-getic (i.e. non-statistical) basis and covers the two lim-iting cases (strength and toughness), together with thetransitional situation.
To find the size effect parameters, Bazant’s law canbe rearranged as a linear expression Y = AX + C byassuming X = D and Y = 1/σ 2
N . With this rearrange-ment, the size effect parameters are found using theslope A and the y-intercept C :
Bσt = 1√C
, D0 = C
A(6)
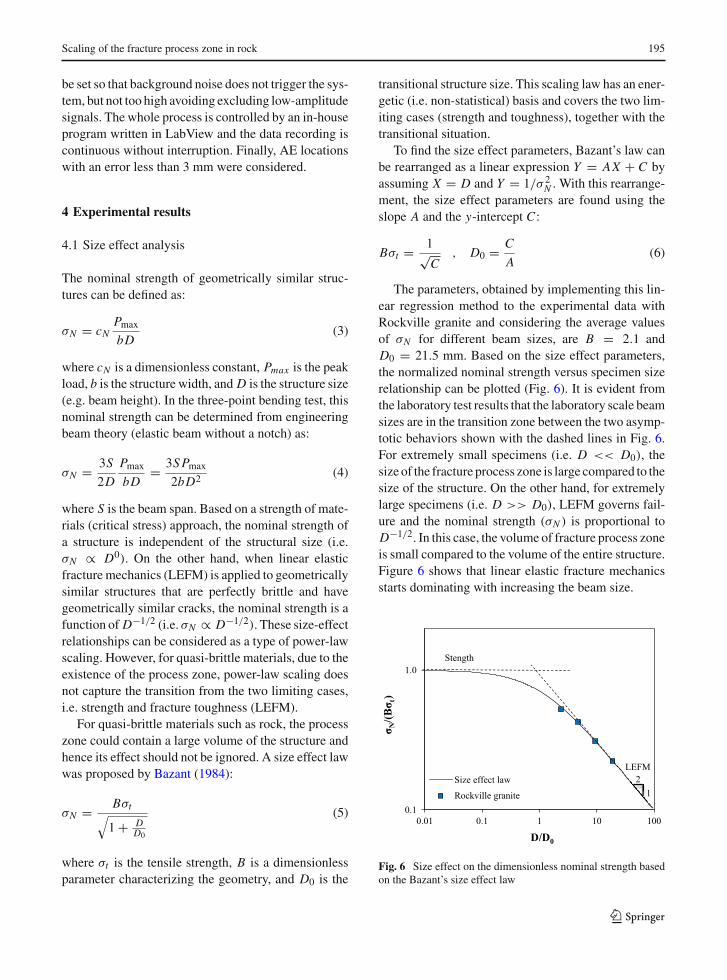
The parameters, obtained by implementing this lin-ear regression method to the experimental data withRockville granite and considering the average valuesof σN for different beam sizes, are B = 2.1 andD0 = 21.5 mm. Based on the size effect parameters,the normalized nominal strength versus specimen sizerelationship can be plotted (Fig. 6). It is evident fromthe laboratory test results that the laboratory scale beamsizes are in the transition zone between the two asymp-totic behaviors shown with the dashed lines in Fig. 6.For extremely small specimens (i.e. D << D0), thesize of the fracture process zone is large compared to thesize of the structure. On the other hand, for extremelylarge specimens (i.e. D >> D0), LEFM governs fail-ure and the nominal strength (σN ) is proportional toD−1/2. In this case, the volume of fracture process zoneis small compared to the volume of the entire structure.Figure 6 shows that linear elastic fracture mechanicsstarts dominating with increasing the beam size.
0.1
1.0
0.01 0.1 1 10 100
Nt)
D/D0
Size effect law
Rockville granite
Stength
LEFM
12
Fig. 6 Size effect on the dimensionless nominal strength basedon the Bazant’s size effect law
123
196 A. Tarokh et al.
To investigate the fracture properties of the rock, theapparent fracture toughness KICA was obtained usingthe following equation (Bazant and Planas 1998), validfor the three-point bending geometry:
KICA = σN√D
√α
(1 + 2α)(1 − α)1.5PS/D(α) (7)
where σN is the nominal strength, S is the beam span, αis the ratio of notch length to beam height (a0/D), andPS/D(α) is a shape factor. The equation for PS/D(α) is(Pastor et al. 1995):
PS/D(α) = P∞(α) + 4
(D
S
)(P4(α) − P∞(α)) (8)
in which the expressions for P4(α) and P∞(α) are:
P4(α) = 1.900 − α[−0.089 + 0.603(1 − α)
− 0.441(1 − α)2 + 1.223(1 − α)3] (9)
P∞(α) = 1.989 − α(1 − α)[0.448 − 0.458(1 − α)
+ 1.226(1 − α)2] (10)
Table 1 summarizes the nominal strength and appar-ent fracture toughness values obtained for the rockbeamswith average values from the tests. It is observedthat the apparent fracture toughness increases and thenominal strength decreases with the increase in thespecimen size.
4.2 Width and length of the process zone
The locations of AE events up to the peak load wereused to find the dimensions of the process zone. Thestandard deviation of the X -coordinates (SX ) and Y -coordinates (SY ) of the events were obtained and thewidth (W ) and length (l) of the process zone weredefined by three standard deviation:
Table 1 Nominal strength and apparent fracture toughness aver-age values from two tests at each beam size
D (mm) σN (MPa) KICA(MPam0.5)
50.8 8.7 1.48
101.6 7.1 1.70
203.2 5.2 1.75
406.4 3.7 1.78
W = 3SX (11a)
l = 3SY (11b)
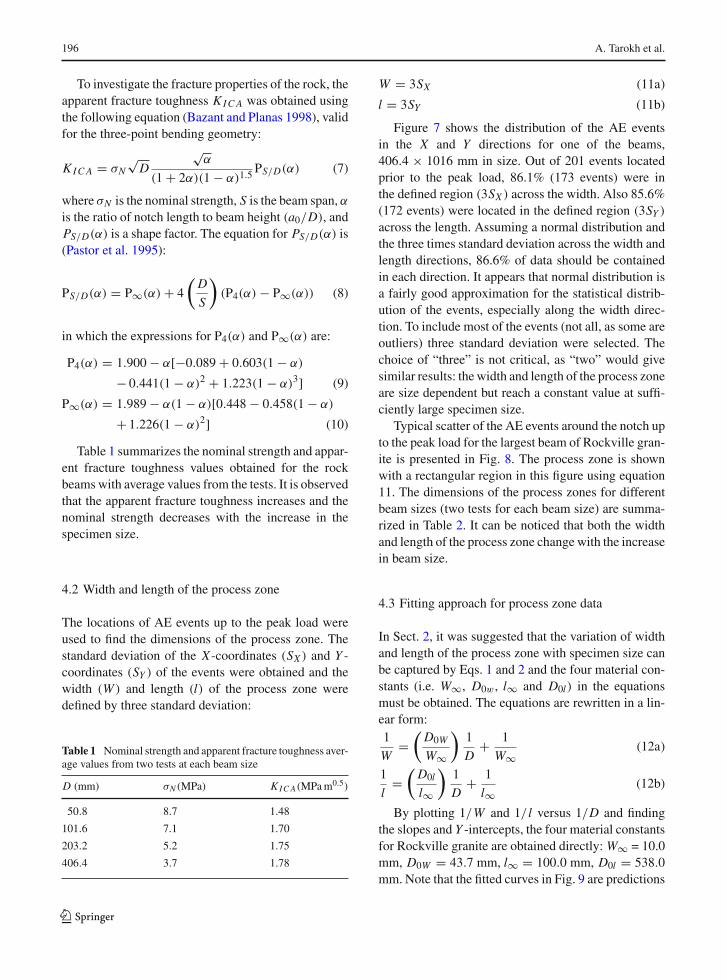
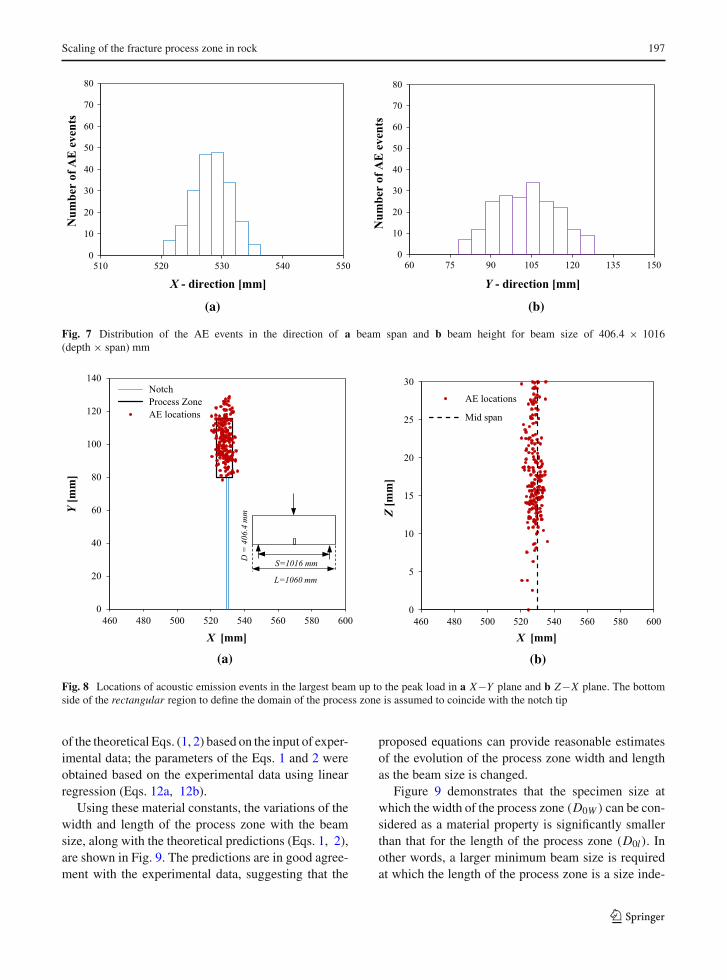
Figure 7 shows the distribution of the AE eventsin the X and Y directions for one of the beams,406.4 × 1016 mm in size. Out of 201 events locatedprior to the peak load, 86.1% (173 events) were inthe defined region (3SX ) across the width. Also 85.6%(172 events) were located in the defined region (3SY )
across the length. Assuming a normal distribution andthe three times standard deviation across the width andlength directions, 86.6% of data should be containedin each direction. It appears that normal distribution isa fairly good approximation for the statistical distrib-ution of the events, especially along the width direc-tion. To include most of the events (not all, as some areoutliers) three standard deviation were selected. Thechoice of “three” is not critical, as “two” would givesimilar results: the width and length of the process zoneare size dependent but reach a constant value at suffi-ciently large specimen size.
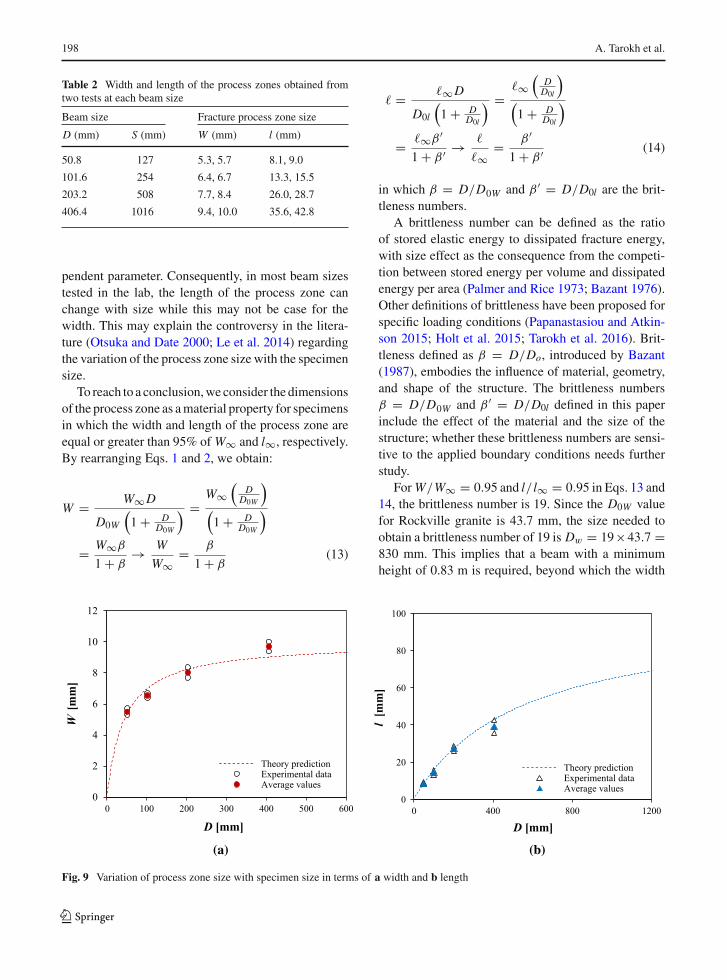
Typical scatter of the AE events around the notch upto the peak load for the largest beam of Rockville gran-ite is presented in Fig. 8. The process zone is shownwith a rectangular region in this figure using equation11. The dimensions of the process zones for differentbeam sizes (two tests for each beam size) are summa-rized in Table 2. It can be noticed that both the widthand length of the process zone change with the increasein beam size.
4.3 Fitting approach for process zone data
In Sect. 2, it was suggested that the variation of widthand length of the process zone with specimen size canbe captured by Eqs. 1 and 2 and the four material con-stants (i.e. W∞, D0w, l∞ and D0l) in the equationsmust be obtained. The equations are rewritten in a lin-ear form:1
W=
(D0W
W∞
)1
D+ 1
W∞(12a)
1
l=
(D0l
l∞
)1
D+ 1
l∞(12b)
By plotting 1/W and 1/ l versus 1/D and findingthe slopes and Y -intercepts, the four material constantsfor Rockville granite are obtained directly:W∞ = 10.0mm, D0W = 43.7 mm, l∞ = 100.0 mm, D0l = 538.0mm. Note that the fitted curves in Fig. 9 are predictions
123
Scaling of the fracture process zone in rock 197
0
10
20
30
40
50
60
70
80
510 520 530 540 550
Num
ber
of A
E e
vent
s
X - direction [mm]
0
10
20
30
40
50
60
70
80
60 75 90 105 120 135 150
Num
ber
of A
E e
vent
s
Y - direction [mm]
(b) (a)
Fig. 7 Distribution of the AE events in the direction of a beam span and b beam height for beam size of 406.4 × 10¹⁶(depth × span) mm
0
20
40
60
80
100
120
140
460 480 500 520 540 560 580 600
Y [m
m]
X [mm]
NotchProcess ZoneAE locations
S=1016 mm D =
406
.4 m
m
L=1060 mm
0
5
10
15
20
25
30
460 480 500 520 540 560 580 600
Z [m
m]
X [mm]
AE locations
Mid span
(a) (b)
Fig. 8 Locations of acoustic emission events in the largest beam up to the peak load in a X−Y plane and b Z−X plane. The bottomside of the rectangular region to define the domain of the process zone is assumed to coincide with the notch tip
of the theoretical Eqs. (1, 2) based on the input of exper-imental data; the parameters of the Eqs. 1 and 2 wereobtained based on the experimental data using linearregression (Eqs. 12a, 12b).
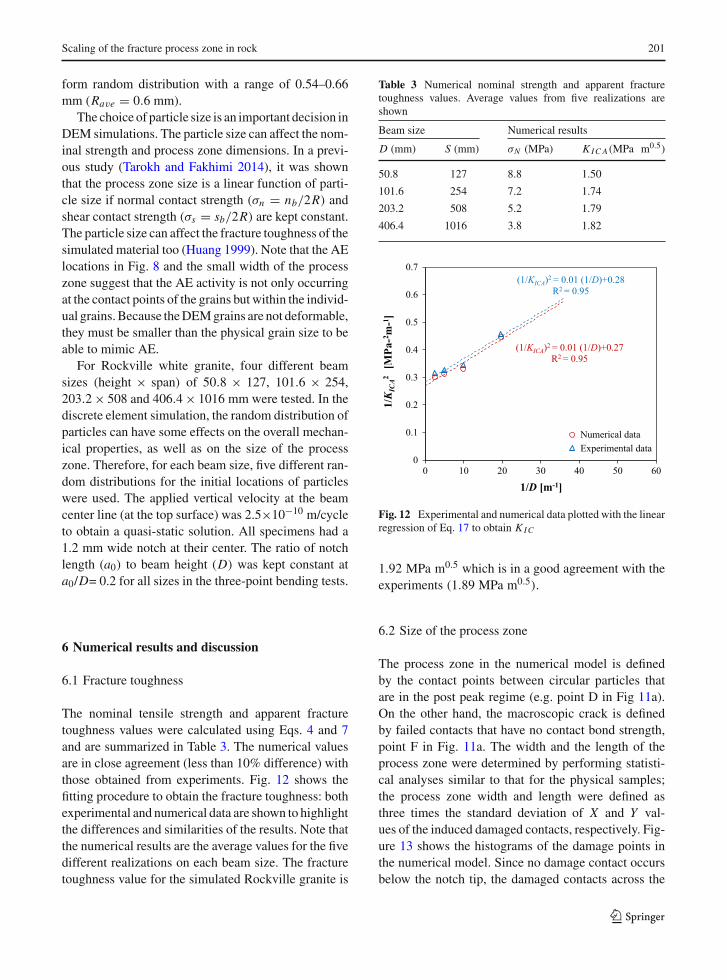
Using these material constants, the variations of thewidth and length of the process zone with the beamsize, along with the theoretical predictions (Eqs. 1, 2),are shown in Fig. 9. The predictions are in good agree-ment with the experimental data, suggesting that the
proposed equations can provide reasonable estimatesof the evolution of the process zone width and lengthas the beam size is changed.
Figure 9 demonstrates that the specimen size atwhich the width of the process zone (D0W ) can be con-sidered as a material property is significantly smallerthan that for the length of the process zone (D0l). Inother words, a larger minimum beam size is requiredat which the length of the process zone is a size inde-
123
198 A. Tarokh et al.
Table 2 Width and length of the process zones obtained fromtwo tests at each beam size
Beam size Fracture process zone size
D (mm) S (mm) W (mm) l (mm)
50.8 127 5.3, 5.7 8.1, 9.0
101.6 254 6.4, 6.7 13.3, 15.5
203.2 508 7.7, 8.4 26.0, 28.7
406.4 1016 9.4, 10.0 35.6, 42.8
pendent parameter. Consequently, in most beam sizestested in the lab, the length of the process zone canchange with size while this may not be case for thewidth. This may explain the controversy in the litera-ture (Otsuka and Date 2000; Le et al. 2014) regardingthe variation of the process zone size with the specimensize.
To reach to a conclusion,we consider the dimensionsof the process zone as amaterial property for specimensin which the width and length of the process zone areequal or greater than 95% ofW∞ and l∞, respectively.By rearranging Eqs. 1 and 2, we obtain:
W = W∞D
D0W
(1 + D
D0W
) =W∞
(D
D0W
)(1 + D
D0W
)
= W∞β
1 + β→ W
W∞= β
1 + β(13)
� = �∞D
D0l
(1 + D
D0l
) =�∞
(DD0l
)(1 + D
D0l
)
= �∞β ′
1 + β ′ → �
�∞= β ′
1 + β ′ (14)
in which β = D/D0W and β ′ = D/D0l are the brit-tleness numbers.
A brittleness number can be defined as the ratioof stored elastic energy to dissipated fracture energy,with size effect as the consequence from the competi-tion between stored energy per volume and dissipatedenergy per area (Palmer and Rice 1973; Bazant 1976).Other definitions of brittleness have been proposed forspecific loading conditions (Papanastasiou and Atkin-son 2015; Holt et al. 2015; Tarokh et al. 2016). Brit-tleness defined as β = D/Do, introduced by Bazant(1987), embodies the influence of material, geometry,and shape of the structure. The brittleness numbersβ = D/D0W and β ′ = D/D0l defined in this paperinclude the effect of the material and the size of thestructure; whether these brittleness numbers are sensi-tive to the applied boundary conditions needs furtherstudy.
ForW/W∞ = 0.95 and l/ l∞ = 0.95 in Eqs. 13 and14, the brittleness number is 19. Since the D0W valuefor Rockville granite is 43.7 mm, the size needed toobtain a brittleness number of 19 is Dw = 19×43.7 =830 mm. This implies that a beam with a minimumheight of 0.83 m is required, beyond which the width
0
2
4
6
8
10
12
W [
mm
]
D [mm]
Theory predictionExperimental dataAverage values
0
20
40
60
80
100
0 100 200 300 400 500 600 0 400 800 1200
l [m
m]
D [mm]
Theory predictionExperimental dataAverage values
(a) (b)
Fig. 9 Variation of process zone size with specimen size in terms of a width and b length
123

Scaling of the fracture process zone in rock 199
0
2
4
6
8
10
12
0 5 10 15 20
l/W
= D/D0
Rockville granite
l /W = 10
Fig. 10 Shape ratio (l/W ) versus brittleness number (β =D/D0). The D0 value was obtained from Eq. 6.
of the process zone is a size independent parameter.Applying the same procedure for the length of theprocess zone reveals that a Rockville granite beamwitha minimum height of Dl = 19 × 538 = 10, 200 mm(10.2 m) is needed, which is an unrealistic size for lab-oratory testing.
4.4 Effect of specimen size on the shape of theprocess zone
Inspecting the variation of width and length of processzone shows that specimen size not only influences thesize of the process zone, but it also has a direct impacton its shape, defined by the ratio of length to width(l/W ). From Fig. 10, it can be seen that l/W increaseswith specimen size and eventually it reaches its ultimatevalue of l∞/W∞, which is 10 forRockville granite. Theinfluence of specimen size on shape of the process zonehas also been reported byVesely andFrantik (2014) andGalouei and Fakhimi (2015).
4.5 Process zone and characteristic size
Bazant and Planas (1998) showed that the size of theprocess zone for a very large structure may be propor-tional to the characteristic size (lch):
W∞ = η�ch = η
(KIC
σt
)2
(15)
�∞ = η′�ch = η′(KIC
σt
)2
(16)
where η and η′ are dimensionless constants. To findthese constants, the fracture toughness KIC for a verylarge beam (size independent) was found by combiningEqs. 5 and 7 to obtain:
KICA = σN√D
√α
(1 + 2α)(1 − α)1.5PS/D(α)
= Bσt√1 + D
D0
√D f (α) (17)
Equation 17 is cast in a linear form Y = aX + bby assuming X = 1/D and Y = (1/KICA)2. Forvery large beams, 1/D will approach zero. There-fore, the Y -intercept will be equal to the inverse ofKIC squared. Hence, the fracture toughness for a verylarge beam (KIC ) is predicted to be 1.89 MPam0.5
for Rockville granite. Using KIC = 1.89 MPam0.5,l∞ = 100.0 mm, W∞ = 10.0 mm and σt = 8.1 MPa,constantsη andη′ are found to be equal to 0.18 and1.84,respectively. The constant η′ is reported to be between2 and 5 for concrete (Bazant and Planas 1998).
5 Discrete element modeling
Discrete element modeling (DEM) is a numericalapproach that has been proposed for simulating themechanical behavior of granular materials (Cundalland Strack 1979). In DEM, the domain (e.g. rock) isdiscretized into an assembly of particles that can inter-act at the contact points. In this study, the CA2 software(Fakhimi 2004; Fakhimi and Villegas 2007), a hybriddiscrete-finite element program for two-dimensionalanalysis of geomaterials, was used. The discrete par-ticles are assumed to be rigid and circular in shapeand can interact through normal and shear springs tosimulate elasticity. In order to withstand tensile anddeviatoric stresses, the rigid circular particles (disks)are bonded together at the contact points. The bonded-particle system has been used extensively for simulat-ing rock failure (Potyondy 2007; Schopfer and Childs2013).Thismodel has proven its capabilities in simulat-ing the mechanical response of granular media that arecomparable to many experimental observations (Haz-zard et al. 2002; Scholtes et al. 2011). The micro-mechanical parameters are Kn(normal stiffness), Ks
(shear stiffness), nb (normal bond), sb (shear bond),andμ (friction coefficient). In addition, the radius of theparticles (R) must be specified. The genesis pressure(σ0), which is the confining pressure during sample
123

200 A. Tarokh et al.
Fig. 11 Tensile softeningcontact bond model aNormal force and normaldisplacement. b Shear forceand shear displacement. Thepost-peak slope Knp is theparameter to control thesoftening (Fakhimi andTarokh 2013)
Fn
(Tension)
Fn
(Compression)
Un
C
D
F E B
nb
A
Kn 1
Knp1Kn
1
Kn
1
Fs (Shear)
Us
Q R
Psb
O
Fn
1Ks
(a) (b)
preparation (σ0 determines the small amount of initialoverlap of contacting particles) can affect the mater-ial behavior too. The significance of these parametershas been discussed in a previous study (Fakhimi andVillegas 2007).
Since quasi-brittle materials such as rock typicallyexhibit softening in mode I fracturing (Chong et al.1989), a tension softening contact bond feature wasimplemented in the discrete element model. In thistension softening model, the normal bond at a contactpoint is assumed to reduce linearly after the peak tensilecontact load (Fig. 11a). Therefore, a new microscopicparameter, the slope in the post peak region of the nor-mal force-normal displacement relation between twoparticles in contact (Knp) is introduced. The relationbetween shear force and relative shear displacement ofa contact (Fs − Us) is linear with a slope of Ks untilreaching the contact shear strength (sb). Following thepeak point P in Fig. 11b, the shear force is assumed todrop abruptly and follow Coulomb frictional behaviorunder a compressive normal contact force. Softening inshear is only relevant for loading under confined con-ditions (mean stress greater than 1/3× UCS). This isnot the case in the three point bending tests conductedin this study; no shear bonds fail in the simulation. Theloading and unloading paths for both normal and shearcontact forces are shown with arrows in Fig 11.
The assumption of a linear softening behavior inFig. 11a is a simplification and a contact point mayfollow a nonlinear path in the post-peak regime. Thissimple linear softening behavior facilitates the calibra-tion procedure of the discrete element model. Further,
the numerical results are comparable to the physicalexperiments with regard to process zone dimensions.
After sample preparation (i.e. creating denselypacked particles), the discrete element model was cal-ibrated for Young’s modulus, Poisson’s ratio, flex-ural strength, and uniaxial compressive strength ofRockville granite. For uniaxial compression tests, a40×80 mm rectangular samplewas used. For the bend-ing test, a beam with no notch, 50.8 mm in height and127 mm in span, was numerically tested to obtain theflexural strength. The model was also calibrated forboth the length and the width of the process zone at thepeak load for the notched beamwith 50.8 mm in heightand 127 mm in span. The ratio of Kn/Knp = 22 repro-duced approximately the process zone sizes observedusing the acoustic emission technique. Details on sam-ple preparation and calibration procedure of a bondedparticle model can be found in the work of Fakhimi andVillegas (2007). Following the calibration, numericaluniaxial compressive tests on a 40×80mm rectangularsample and three-point bending testswere performed toverify the accuracy of themodel. The following numer-ical mechanical properties were obtained for the simu-lated Rockville granite: E = 26.2 GPa, ν = 0.18,UCS= 106 MPa, and σN = 8.8 MPa (flexural strength for a50.8×127 mm beam), that are in close agreement withthe properties obtained in the experiments. The micro-mechanical parameters that were found from the cali-bration procedure are Kn = 42.4GPa, Ks = 10.6GPa,nb = 7.5 kN/m, sb = 40 kN/m, μ = 0.5, σ0 = 4.2GPa (genesis pressure), and Knp = 1.93 GPa. Thecircular particles radii (R)were assumed to have a uni-
123
Scaling of the fracture process zone in rock 201
form random distribution with a range of 0.54–0.66mm (Rave = 0.6 mm).
The choice of particle size is an important decision inDEM simulations. The particle size can affect the nom-inal strength and process zone dimensions. In a previ-ous study (Tarokh and Fakhimi 2014), it was shownthat the process zone size is a linear function of parti-cle size if normal contact strength (σn = nb/2R) andshear contact strength (σs = sb/2R) are kept constant.The particle size can affect the fracture toughness of thesimulated material too (Huang 1999). Note that the AElocations in Fig. 8 and the small width of the processzone suggest that the AE activity is not only occurringat the contact points of the grains but within the individ-ual grains.Because theDEMgrains are not deformable,they must be smaller than the physical grain size to beable to mimic AE.
For Rockville white granite, four different beamsizes (height × span) of 50.8 × 127, 101.6 × 254,203.2× 508 and 406.4× 1016 mm were tested. In thediscrete element simulation, the random distribution ofparticles can have some effects on the overall mechan-ical properties, as well as on the size of the processzone. Therefore, for each beam size, five different ran-dom distributions for the initial locations of particleswere used. The applied vertical velocity at the beamcenter line (at the top surface) was 2.5×10⁻¹⁰ m/cycleto obtain a quasi-static solution. All specimens had a1.2 mm wide notch at their center. The ratio of notchlength (a0) to beam height (D) was kept constant ata0/D= 0.2 for all sizes in the three-point bending tests.
6 Numerical results and discussion
6.1 Fracture toughness
The nominal tensile strength and apparent fracturetoughness values were calculated using Eqs. 4 and 7and are summarized in Table 3. The numerical valuesare in close agreement (less than 10% difference) withthose obtained from experiments. Fig. 12 shows thefitting procedure to obtain the fracture toughness: bothexperimental and numerical data are shown to highlightthe differences and similarities of the results. Note thatthe numerical results are the average values for the fivedifferent realizations on each beam size. The fracturetoughness value for the simulated Rockville granite is
Table 3 Numerical nominal strength and apparent fracturetoughness values. Average values from five realizations areshown
Beam size Numerical results
D (mm) S (mm) σN (MPa) KICA(MPa m0.5)
50.8 127 8.8 1.50
101.6 254 7.2 1.74
203.2 508 5.2 1.79
406.4 1016 3.8 1.82
0
0.1
0.2
0.3
0.4
0.5
0.6
0.7
0 10 20 30 40 50 60
1/K I
CA2
[MPa
-2 m-1 ]
1/D [m-1]
Numerical dataExperimental data
(1/KICA)2 = 0.01 (1/D)+0.27 R2 = 0.95
(1/KICA)2 = 0.01 (1/D)+0.28 R2 = 0.95
Fig. 12 Experimental and numerical data plotted with the linearregression of Eq. 17 to obtain KIC
1.92 MPa m0.5 which is in a good agreement with theexperiments (1.89 MPa m0.5).
6.2 Size of the process zone
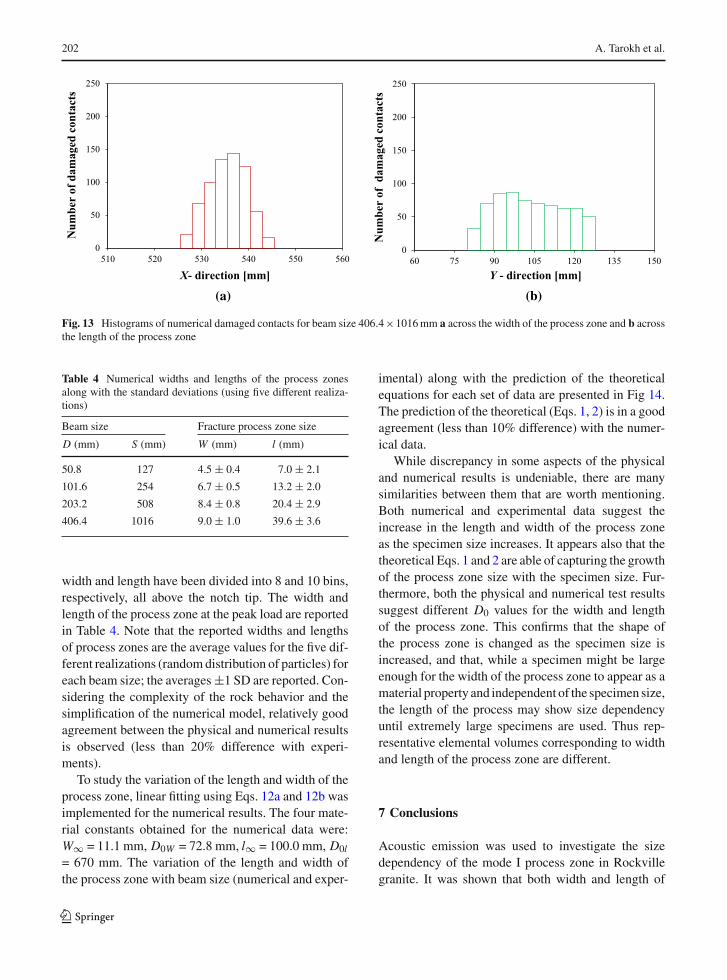
The process zone in the numerical model is definedby the contact points between circular particles thatare in the post peak regime (e.g. point D in Fig 11a).On the other hand, the macroscopic crack is definedby failed contacts that have no contact bond strength,point F in Fig. 11a. The width and the length of theprocess zone were determined by performing statisti-cal analyses similar to that for the physical samples;the process zone width and length were defined asthree times the standard deviation of X and Y val-ues of the induced damaged contacts, respectively. Fig-ure 13 shows the histograms of the damage points inthe numerical model. Since no damage contact occursbelow the notch tip, the damaged contacts across the
123
202 A. Tarokh et al.
0
50
100
150
200
250
510 520 530 540 550 560
Num
ber
of d
amag
ed c
onta
cts
X- direction [mm]
0
50
100
150
200
250
60 75 90 105 120 135 150
Num
ber
of d
amag
ed c
onta
cts
Y - direction [mm]
(a) (b)
Fig. 13 Histograms of numerical damaged contacts for beam size 406.4×1016mm a across the width of the process zone and b acrossthe length of the process zone
Table 4 Numerical widths and lengths of the process zonesalong with the standard deviations (using five different realiza-tions)
Beam size Fracture process zone size
D (mm) S (mm) W (mm) l (mm)
50.8 127 4.5 ± 0.4 7.0 ± 2.1
101.6 254 6.7 ± 0.5 13.2 ± 2.0
203.2 508 8.4 ± 0.8 20.4 ± 2.9
406.4 1016 9.0 ± 1.0 39.6 ± 3.6
width and length have been divided into 8 and 10 bins,respectively, all above the notch tip. The width andlength of the process zone at the peak load are reportedin Table 4. Note that the reported widths and lengthsof process zones are the average values for the five dif-ferent realizations (randomdistribution of particles) foreach beam size; the averages±1 SD are reported. Con-sidering the complexity of the rock behavior and thesimplification of the numerical model, relatively goodagreement between the physical and numerical resultsis observed (less than 20% difference with experi-ments).
To study the variation of the length and width of theprocess zone, linear fitting using Eqs. 12a and 12b wasimplemented for the numerical results. The four mate-rial constants obtained for the numerical data were:W∞ = 11.1 mm, D0W = 72.8 mm, l∞ = 100.0 mm, D0l
= 670 mm. The variation of the length and width ofthe process zone with beam size (numerical and exper-
imental) along with the prediction of the theoreticalequations for each set of data are presented in Fig 14.The prediction of the theoretical (Eqs. 1, 2) is in a goodagreement (less than 10% difference) with the numer-ical data.
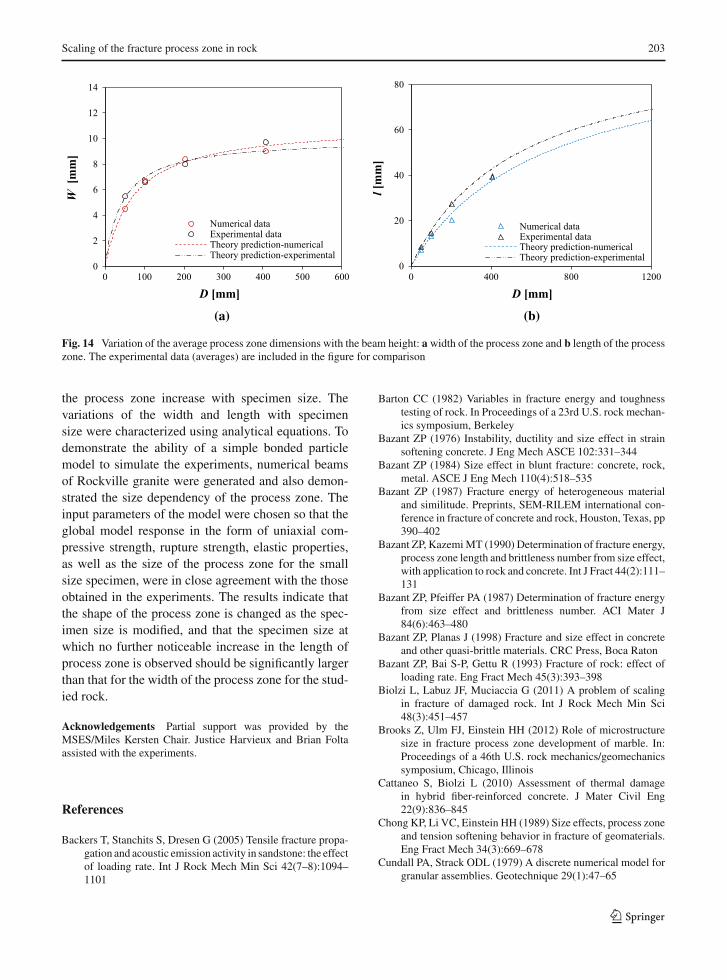
While discrepancy in some aspects of the physicaland numerical results is undeniable, there are manysimilarities between them that are worth mentioning.Both numerical and experimental data suggest theincrease in the length and width of the process zoneas the specimen size increases. It appears also that thetheoretical Eqs. 1 and 2 are able of capturing the growthof the process zone size with the specimen size. Fur-thermore, both the physical and numerical test resultssuggest different D0 values for the width and lengthof the process zone. This confirms that the shape ofthe process zone is changed as the specimen size isincreased, and that, while a specimen might be largeenough for the width of the process zone to appear as amaterial property and independent of the specimen size,the length of the process may show size dependencyuntil extremely large specimens are used. Thus rep-resentative elemental volumes corresponding to widthand length of the process zone are different.
7 Conclusions
Acoustic emission was used to investigate the sizedependency of the mode I process zone in Rockvillegranite. It was shown that both width and length of
123
Scaling of the fracture process zone in rock 203
0
2
4
6
8
10
12
14
0 100 200 300 400 500 600
W [
mm
]
D [mm]
Numerical dataExperimental dataTheory prediction-numericalTheory prediction-experimental
0
20
40
60
80
0 400 800 1200
l [m
m]
D [mm]
Numerical dataExperimental dataTheory prediction-numericalTheory prediction-experimental
(a) (b)
Fig. 14 Variation of the average process zone dimensions with the beam height: a width of the process zone and b length of the processzone. The experimental data (averages) are included in the figure for comparison
the process zone increase with specimen size. Thevariations of the width and length with specimensize were characterized using analytical equations. Todemonstrate the ability of a simple bonded particlemodel to simulate the experiments, numerical beamsof Rockville granite were generated and also demon-strated the size dependency of the process zone. Theinput parameters of the model were chosen so that theglobal model response in the form of uniaxial com-pressive strength, rupture strength, elastic properties,as well as the size of the process zone for the smallsize specimen, were in close agreement with the thoseobtained in the experiments. The results indicate thatthe shape of the process zone is changed as the spec-imen size is modified, and that the specimen size atwhich no further noticeable increase in the length ofprocess zone is observed should be significantly largerthan that for the width of the process zone for the stud-ied rock.
Acknowledgements Partial support was provided by theMSES/Miles Kersten Chair. Justice Harvieux and Brian Foltaassisted with the experiments.
References
Backers T, Stanchits S, Dresen G (2005) Tensile fracture propa-gation and acoustic emission activity in sandstone: the effectof loading rate. Int J Rock Mech Min Sci 42(7–8):1094–1101
Barton CC (1982) Variables in fracture energy and toughnesstesting of rock. In Proceedings of a 23rd U.S. rock mechan-ics symposium, Berkeley
Bazant ZP (1976) Instability, ductility and size effect in strainsoftening concrete. J Eng Mech ASCE 102:331–344
Bazant ZP (1984) Size effect in blunt fracture: concrete, rock,metal. ASCE J Eng Mech 110(4):518–535
Bazant ZP (1987) Fracture energy of heterogeneous materialand similitude. Preprints, SEM-RILEM international con-ference in fracture of concrete and rock, Houston, Texas, pp390–402
Bazant ZP, KazemiMT (1990) Determination of fracture energy,process zone length and brittleness number from size effect,with application to rock and concrete. Int J Fract 44(2):111–131
Bazant ZP, Pfeiffer PA (1987) Determination of fracture energyfrom size effect and brittleness number. ACI Mater J84(6):463–480
Bazant ZP, Planas J (1998) Fracture and size effect in concreteand other quasi-brittle materials. CRC Press, Boca Raton
Bazant ZP, Bai S-P, Gettu R (1993) Fracture of rock: effect ofloading rate. Eng Fract Mech 45(3):393–398
Biolzi L, Labuz JF, Muciaccia G (2011) A problem of scalingin fracture of damaged rock. Int J Rock Mech Min Sci48(3):451–457
Brooks Z, Ulm FJ, Einstein HH (2012) Role of microstructuresize in fracture process zone development of marble. In:Proceedings of a 46th U.S. rock mechanics/geomechanicssymposium, Chicago, Illinois
Cattaneo S, Biolzi L (2010) Assessment of thermal damagein hybrid fiber-reinforced concrete. J Mater Civil Eng22(9):836–845
Chong KP, Li VC, Einstein HH (1989) Size effects, process zoneand tension softening behavior in fracture of geomaterials.Eng Fract Mech 34(3):669–678
Cundall PA, Strack ODL (1979) A discrete numerical model forgranular assemblies. Geotechnique 29(1):47–65
123

204 A. Tarokh et al.
De Borst R (2003) Numerical aspects of cohesive zone models.Eng Fract Mech 70(14):1743–1757
Evans AG (1976) On the formation of a crack tip microcrackzone. Scr Metal 10(1):93–97
Fakhimi A (2004) Application of slightly overlapped circularparticles assembly in numerical simulation of rocks withhigh friction angle. Eng Geol 74(1–2):129–138
Fakhimi A, Tarokh A (2013) Process zone and size effect infracture testing of rock. Int J Rock Mech Min Sci 60:95–102
Fakhimi A, Villegas T (2007) Application of dimensional analy-sis in calibration of a discrete element model for rock defor-mation and fracture. Rock Mech Rock Eng 40(2):193–211
Galouei M, Fakhimi A (2015) Size effect, material ductility andshape of fracture process zone in quasi-brittle materials.Comput Geotech 65:126–135
HaggertyM, Lin Q, Labuz JF (2010) Observing deformation andfracture of rockwith speckle patterns. RockMechRockEng43(4):417–426
Hazzard JF, Collins DA, Pettitt WS, Young RP (2002) Simula-tion of unstable fault slip in granite using a bonded-particlemodel. Pure Appl Geophys 159:221–245
Hillerborg A,ModeerM, Petersson P-E (1976) Analysis of crackformation and crack growth in concrete bymeans of fracturemechanics and finite elements. Cem Concr Res 6(6):773–781
Holt RM, Fjaer E, Stenebraten JF, Nes OM (2015) Brittleness ofshales: relevance to borehole collapse and hydraulic frac-turing. J Petrol Sci Eng 131:200–209
Huang H. (1999) Discrete element modeling of tool–rock inter-action, Ph.D. dissertation,Department of Civil Engineering,University of Minnesota, USA
Jankowski LJ, Stys DJ (1990) Formation of the fracture processzone in concrete. Eng Fract Mech 36(2):245–253
Knott JF (1973) Fundamentals of fracture mechanics. Butter-worths, London
Labuz JF, Dai ST, Shah KR (1996) Identifying failurethrough locations of acoustic emission. Transp Res Rec1526:104–111
Le J-L, Manning J, Labuz JF (2014) Scaling of fatigue crackgrowth in rock. Int J Rock Mech Min Sci 72:71–79
Lin Q, Yuan H, Biolzi L, Labuz JF (2014) Opening and mixedmode fracture processes in a quasi-brittlematerial via digitalimaging. Eng Fract Mech 131:176–193
Mihashi H, Nomura N, Niiseki S (1991) Influence of aggregatesize on fracture process zone of concrete detectedwith threedimensional acoustic emission technique. Cem Concr Res21(5):737–744
Ohno K, Uji K, Ueno A, Ohtsu M (2014) Fracture process zonein notched concrete beam under three-point bending byacoustic emission. Constr Build Mater 67:139–145
Otsuka K, Date H (2000) Fracture process zone in concrete ten-sion specimen. Eng Fract Mech 65(2–3):111–131
Palmer AC, Rice JR (1973) The growth of slip surfaces in theprogressive failure of over-consolidated clay. Proc R SocLond A332:527–548
Papanastasiou P, Atkinson C (2015) The brittleness index inhydraulic fracturing. In: Proceedings of a 49th U.S. rockmechanics symposium, San Francisco, California
Pastor JY, Guinea G, Planas J, Elices M (1995) Nueva expres-sion del factor de intensidad de tensiones para la probeta deflexion en tres puntos. Anales de Mecanica de la Fractura12:85–90
Potyondy DO (2007) Simulating stress corrosion with a bonded-particlemodel for rock. Int JRockMechMinSci 44(5):677–691
Scholtes L, Donze FV, KhanalM (2011) Scale effects on strengthof geomaterials, case study: coal. J Mech Phys Solids59(5):1131–1146
Schopfer MPJ, Childs C (2013) The orientation and dilatancy ofshear bands in a bonded particle model for rock. Int J RockMech Min Sci 57:75–88
Tarokh A, Fakhimi A (2014) Discrete element simulation of theeffect of particle size on the size of fracture process zone inquasi-brittle materials. Comput Geotech 62:51–60
Tarokh A, Kao C-S, Fakhimi A, Labuz JF (2016) Spalling andbrittleness in surface instability failure of rock. Géotech-nique 66(2):161–166
Vesely V, Frantik P (2014) An application for the fracture char-acterization of quasi-brittle materials taking into accountfracture process zone influence. Adv Eng Soft 72:66–76
Wang CY, Liu PD, Hu R, Sun XT (1990) Study of the fractureprocess zone in rock by laser speckle interferometry. Int JRock Mech Min Sci 27(1):65–69
Zang A, Wagner FC, Stanchits S, Janssen C, Dresen G(2000) Fracture process zone in granite. J Geophys Res105(B10):23651–23661
Zhang D, Wu K (1999) Fracture process zone of notchedthree-point bending concrete beams. Cem Concr Res29(12):1887–1892
Zietlow WK, Labuz JF (1998) Measurement of the intrinsicprocess zone in rock using acoustic emission. Int J RockMech Min Sci 35(3):291–299
123