scaling law of permeability and porosity for fluid
TRANSCRIPT

J. Appl. Comput. Mech., 7(1) (2021) 84-92 DOI: 10.22055/JACM.2020.35136.2577
ISSN: 2383-4536 jacm.scu.ac.ir
Published online: November 11 2020
Scaling Law of Permeability and Porosity for Fluid Transport
Phenomena in Porous PCM Media
Yassine Hariti1 , Ahmed Hader1,2 , Hamza Faraji3 Yahia Boughaleb1,4
1 LBGIM, Ecole Normale Supérieure, University Hassan II. Casablanca, Morocco
2 Centre régional des métiers d’éducation et de formation Casablanca- Settat/ établissement Settat, Morocco
3 Physics Department, LPMMAT Laboratory, Faculty of Sciences Ain Chock, Hassan II University, Casablanca, Morocco
4 LPMC, University Chouaib Doukkali. El Jadida, Morocco
Received September 23 2020; Revised November 10 2020; Accepted for publication November 10 2020.
Corresponding authors: Hamza Faraji ([email protected]); Yassine Hariti ([email protected])
© 2020 Published by Shahid Chamran University of Ahvaz
Abstract. The present paper reports the numerical results of fluid flow in porous phase change materials (PCM) media. This is an important topic in potential scientific, technological and engineering field’s especially latent heat storage. In this paper, we are only interested in the correlation between permeability and porosity of the porous media and not in latent storage. Fluid flow is characterized by many parameters mainly permeability and porosity. Many models have been proposed for the study of this phenomenon over the years. However, it can be modeled using the complex model that studies the characteristics of pore microstructure and fluid flow in porous media. This model is more accurate and realistic compared to previous models. It predicts permeability and porosity with a good agreement with experimental data. In this paper, the complex model is used to determine the impact of the tortuosity and the density of capillary distribution on the relation between permeability and porosity and check their scaling laws with universal exponents independently of other parameters. The results show that the permeability-porosity relation is proportional to the standard deviation of capillary distribution and its density. The tortuosity affects porosity proportionally, and permeability inversely. The relation between porosity and permeability follows a power law with universal exponents = 4.06 0.12 for different values of the expectation of distribution, the density of capillaries and the tortuosity; and = 1.69 0.01 for different values of the standard deviation, density of capillaries and tortuosity. The universality of these exponents further validates the complex model with various previous experimental and numerical studies.
Keywords: Scaling law, Permeability, Porosity, Porous media, Complex model, Fluid flow.
1. Introduction
In the last decades, various researches were done to understand the fluid transport process in different media especially through porous media. This process is used in diverse areas and presents a promising opportunity in scientific, industrial and technological fields [1], petroleum and oil engineering [2, 3] and hydrology [4–6]. Porous media were embarked in various fields of crucial necessity such as gas storage, oils manufacturing from reservoirs and contaminant recovery. Owing to their internal construction and their important surface to volume ratio giving rise to crucial characteristics of mass [7] and heat distribution mechanisms [8-9], they were developed in various industry processes such as filtration, manufacturing of fuel cells, wiping of mash paper, etc.
Recent investigation attempts were furnished to study the complexity of fluid flow in porous media structure continually [10–11]. Hence, various approaches have been embarked for the purpose of modeling and simulating fluid transport in porous media. For example, it could predict the effect of earthquakes caused in oil storage [12]. Moreover, this process of fluid transport in a stationary failure repartition was adopted for seismic attenuation. This could be observed if waves run via a fluid damaged pebble. If mechanical waves move across alike this media, the fluid pressure gradients are enhanced due to the heterogeneity of the damaged medium. The pressure gradients are stabilized via repartition of fluid in the damaged medium. This mechanism is dissipated and directed by pressure diffusion over the damages. Hence, studying fluid transport through porous media is not a new research concept. The concept producing mechanical reinforcement of fluid flow in porous media is that when the energy is transmitted into a porous medium, it could induce a sequence of impacts, enhance effective permeability, improve gravity segregation, droplets amalgamation, and change the characteristics of fluid and decrease networking during miscible floods. Other processes could also produce maladaptation and transient particle rearrangement, which may generate a momentary modification in pore sizes [13]. Various fundamental physics are associated to mechanical excitation mechanisms like emulsification, cavitation, coagulation and streaming [13].
A porous medium is an assemblage of a solid matrix holding vacant spaces called pores where fluid flow takes place. This qualification eliminates the unoccupied parts that are surrounded by solid material because they do not participate in fluid flow

Scaling Law of Permeability and Porosity for Fluid Transport Phenomena in Porous PCM Media
Journal of Applied and Computational Mechanics, Vol. 7, No. 1, (2021), 84-92
85
[10]. The important influence that pore pressure has on the deformation behavior of fluid saturated porous rocks was widely recognized. The pressure of pores produces a much known deformation behavior of fluid in porous media. The temporal and spatial evolution of pore pressure directed not only the fluid transport but also the field of effective applied load in the system mass, where it was jointed, pore pressure repartition may effectively provoke if sliding will happen alongside pre-remaining voids. A coherent theory, which clearly expressed the interaction between the matrix and pore fluid [14]. By analogy to composite materials, fibers are in interaction with a matrix. This interaction improves the material resistance as proved in references [15, 16].
In practice, the failures involve a Darcy-type fluid transport by a supplementary permeability quantity where, in series, and at the extremity of damage, the fluid pressure launches the failure process. These conceptions were protracted concerning failure propagation in various heterogeneous systems and especially for saturated porous media. Moreover, Stokes-type transport, breakdown phase field conception and diffuse interface expressions were integrated in the porous media theory [10]. However, quantitative conceptions for the problem by stimulation were difficult to evaluate, if existent at all. This permits us to identify hydro-mechanical proprieties of fluid transport in porous media, attained via the diffuse interface algorithm, and compared to appropriate numerical, analytical, or experimental results [10].
Although the fundamental concepts that drive the motion of fluid in porous media were well studied by engineers, a few details were not identified about the flow proprieties in low-permeable porous media (shale, clays, etc.). For motion considerations, the principal factors were gradients of fluid potential, permeability and porosity. For shales and clays, these factors were unwell recognized. For example, the hydrocarbons transport coincides with the following petrol motion subsequently ejection from the origin pebble via the basins of water or failures and voids via permeability [14].
The importance of the problem of fluid flow in porous PCM media stems from its various important application in the framework of crucial fields such as the latent energy storage with PCMs. Thus, the capacity to identify and to recognize the fluid transport process allows experts whether the medium is appropriate for utilization. Otherwise, during exploitation, a device is delivered for observing the fluid transport, namely the creation and the propagation of fluid flow. Additionally there are well proved expressions presented which consider the void as pointed interfaces and which may be developed to compare, quantitatively, the approach of phase field [12]. In this paper, the main novelty is the usage of the complex model to determine the impact of the tortuosity and the density of the capillaries distribution on the relation between permeability and porosity, and check their scaling laws for the different parameters: the standard deviation of the pores distribution, and the distribution expectation, for this model and previous ones.
2. Mathematical Modelling
Fluid flow in porous media is still not well understood. Because of the complexity and disordered porous media microstructures, it is complicated to characterize the flow process clearly according to the transport parameters: porosity [17–19], thermal conductivity [20, 21], mechanical proprieties [22, 23] and permeability [18, 19]. The permeability and porosity of such media -crucial parameters in fluid flow- are generally studied numerically, analytically and experimentally. Various models have been established to describe transport phenomena in porous media and to compare numerical results with experiments analysis [24, 25].
Diverse scales may be encountered when studying fluid flow in a porous media. At the pore scale (microscopic scale), the characteristic sizes are in the order of the pores. Hence, variables like disposition of packages or roughness of pore walls are measured via imaging techniques and tools (Scanning Electron Microscopy, tomography, …). The second scale is the macroscopic scale that matches the size of a porous medium core. Characteristics like porosity and permeability are studied with macroscopic scale to be used as tools for simulations to predict fluid flow. Supplementary intermediate or larger scales may be established in hydrology and fluid engineering. Moving from a scale to another is reached via methods of volume averaging or homogenization. The importance of describing a porous medium at the pore scale is to control, recognize and simulate its behavior at the macroscopic level. To be precise, it permits simulating fluid flow and distribution inside the pore [10].
The complex model considers porous media as a set of tortuous capillaries with random diameters distributed randomly in a solid frame, see Fig. 1. The fluid flow is Newtonian. To facilitate the calculations, we saturate the studied porous medium with a fluid in a single phase. The capillaries are assumed to be smooth. For simulation purposes, the isothermal flow obeys Darcy’s law while ignoring the load applied on capillaries and gravity influence.
The porous medium flow rate is the sum of all the capillaries flow rates, which may be formulated as follows:
max
min
2
2(2 ).
r
rQ q r dN= ∫ (1)
where Q is the porous medium flow rate, N is its capillaries total number, and 2rmin and 2rmax are, respectively, the minimal and maximal capillaries radii, and q(2r) presents the function of the flow rate, via a capillary. Based on statistical principles, dN can be given as:
PCM Matrix
Fig. 1. The representative image of the complex porous PCM media on the left and a cross-section of it on the right (the green cylinders represents the random diameter pores).

Yassine Hariti et. al., Vol. 7, No. 1, 2021
Journal of Applied and Computational Mechanics, Vol. 7, No. 1, (2021), 84-92
86
2 . (2 ).dN N f r dr= (2)
where f(2r) is the probability density function of capillaries in the porous medium sectional area [26]. Through pivotal experiences in relation to porous media transport, Henry Darcy emphasized in 1856 a linear law existing
between the fluid flow rate Q in a porous medium and the pressure gradient applied amid the entry and withdrawal of medium faces [14]. According to the law of Darcy [11], the porous medium permeability is given by:
QLK
A P
µ=∆
(3)
where A and L are the specific area and the length of the porous medium, respectively. L is the distance, which the fluid traverses, A is the porous medium area, µ is the fluid viscosity, ΔP is the pressure gradient and K is the permeability of the porous material, which shows the ability of a porous medium to let a fluid flow without changing its interior structure. This material intrinsic characteristic does not depend on the flowing fluid type but merely on the porous medium geometry. The parameter K is generally named the medium absolute permeability. There is no clear relation between this parameter and porosity. Moreover, various models focus on the pore size importance [26].
Combining equations (1), (2) and (3), the permeability formula of the adopted model is given by:
max
min
2
2
2(2 ). (2 ).
r
r
L NK q r f r dr
A P
µ=∆ ∫ (4)
Moreover, the pore volume is defined by the fractal theory [27] as:
max max
min min
2 22 2
2 2. (2 ). 2 (2 ). (2 )
r r
p P t P tr r
V F r L r dN F N L r f r r dr= =∫ ∫ (5)
where Vp is the volume of the capillary, Lt(2r) is its length function and Fp is its shape factor. It is important to mention that a circular section capillary must be equal to [26].
The porous medium porosity is expressed by:
pVS
V= (6)
where S is the medium porosity and V = L3 is the medium volume. When substituting equation (5) in (6), the porosity formulation of the adopted model is given by:
max
min
22
2
2(2 ). (2 )
rP
tr
F NS L r f r r dr
V= ∫ (7)
The flow rate for a fluid flowing through a capillary is established in [34] and expressed by:
416.(2 )
128K
t
F r pq r
Lµ
∆= (8)
where q(2r) is the function of flow rate for a solitary tortuous capillary with a radius r. It shows the fluid flow characteristics in a capillary. q(2r) contains the main function, which is the permeability factor of a capillary that equals for circular capillaries [26].
Tortuosity presents the ratio of the current length of a tortuous capillary and the length of a straight one with the same ends, see Fig. 2. These parameters are related by the equation below:
.tL Lτ= (9)
with τ is the tortuosity of a capillary. The probability density function of a normal distribution can be written as:
2
2
(2 )
21(2 , , )
2
n
n
r
n n
n
f r e
µ
σµ σσ π
− −
= (10)
Fig. 2. A schematic representing straight and tortuous capillary.

Scaling Law of Permeability and Porosity for Fluid Transport Phenomena in Porous PCM Media
Journal of Applied and Computational Mechanics, Vol. 7, No. 1, (2021), 84-92
87
0,00 0,05 0,10 0,15 0,20 0,25 0,30 0,35 0,40 0,45
0
10
20
30
40
50
60
70
80
90
100
110
K*1
0-1
5m
2
S
t=1 sn=0,2
sn=0,3
sn=0,4
sn=0,5
sn=0,6
sn=0,7
0,000 0,005 0,010 0,015 0,020 0,025 0,030 0,035 0,040 0,045
-100
0
100
200
300
400
500
600
700
800
900
1000
1100
S
K*1
0-1
5m
2
t=0,1 sn=0,2
sn=0,3
sn=0,4
sn=0,5
sn=0,6
sn=0,7
0,00 0,05 0,10 0,15 0,20 0,25 0,30
0
5
10
15
20
25
30
35
40
45
50
55
K1
0-1
5m
2
S
120.05.10
Nm
A
=
sn=0,2
sn=0,3
sn=0,4
sn=0,5
sn=0,6
sn=0,7
0,0 0,1 0,2 0,3 0,4 0,5
0
5
10
15
20
25
30
35
40
45
50
55
120.08116.10N
mA
=
K1
0-1
5m
2
S
sn=0,2
sn=0,3
sn=0,4
sn=0,5
sn=0,6
sn=0,7
(a) (b)
(d)(c)
Fig. 3. The relation between permeability and porosity versus standard deviation nσ , tortuosity τ and density of capillaries N/A.
where nµ is the distribution expectation and nσ represents the standard deviation [26].
By substituting equations (8), (9), and (10) in equation (4), the permeability formula becomes:
2
2max
min
(2 )422
24 2
n
n
rr
K
rn
NF rK e dr
A
µ
σ
τ σ π
− −
= ∫ (11)
By considering all capillaries in porous media are circular and injecting the equations (9) and (10) in equation (7), the porosity formula becomes:
2
2max
min
(2 )222
2
2
2
n
n
rr
P
rn
LNF rS e dr
V
µ
στ
σ π
− −
= ∫ (12)
Thus, equation (12) can be rewritten as:
2
2max
min
(2 )222
2
2
2
n
n
rr
P
rn
NF rS e dr
A
µ
στ
σ π
− −
= ∫ (13)
In this study, we investigate the relation between porosity and permeability of porous media using the complex model
proposed by Xiao-Hua Tan et al. [26]. This model assumes porous media to be composed of capillary bundles with random radii
distributed following a normal distribution in a solid frame. They validated the theoretical results with experimental data that
proved the accuracy and realism of this complex model. However, those results did not show the scaling behavior of permeability
and porosity with respect to the model parameters, which is the aim of this paper. First, we focus on the relation between
permeability and porosity versus the tortuosity of the capillaries, their density, the standard deviation of their distribution
throughout the solid frame and the expectation of the distribution that gives an idea about the mean diameter of the capillaries.
Then, we check the scaling laws for permeability-porosity relation according to the aforementioned quantities. This relation
presents a power law with two universal exponents comparable to previously calculated values by different models [28–32].

Yassine Hariti et. al., Vol. 7, No. 1, 2021
Journal of Applied and Computational Mechanics, Vol. 7, No. 1, (2021), 84-92
88
(a) (b)
(d)(c)
-5,0 -4,5 -4,0 -3,5 -3,0 -2,5 -2,0 -1,5 -1,0 -0,5
-3
-2
-1
0
1
2
3
4
5
slope =1,69
ln(S)
ln(K
10-1
5m
2)
t=1 sn=0,7
sn=0,6
sn=0,5
sn=0,4
sn=0,3
sn=0,2
-7,5 -7,0 -6,5 -6,0 -5,5 -5,0 -4,5 -4,0 -3,5 -3,0
-1
0
1
2
3
4
5
6
7
ln(S)
ln(K
10
-15
m2)
slope =1,69
t=0,1 sn=0,2
sn=0,3
sn=0,4
sn=0,5
sn=0,6
sn=0,7
-5,5 -5,0 -4,5 -4,0 -3,5 -3,0 -2,5 -2,0 -1,5 -1,0
-4
-3
-2
-1
0
1
2
3
4
ln(K
10-1
5m
2)
ln(S)
120.05.10
Nm
A
=
sn=0,7
sn=0,6
sn=0,5
sn=0,4
sn=0,3
sn=0,2
slope =1,69
-5,0 -4,5 -4,0 -3,5 -3,0 -2,5 -2,0 -1,5 -1,0 -0,5
-4
-3
-2
-1
0
1
2
3
4
ln(K
10-1
5m
2)
ln(S)
120.08116.10N
mA
=
slope =1,69
sn=0,2
sn=0,3
sn=0,4
sn=0,5
sn=0,6
sn=0,7
Fig. 4. The log-log of the permeability and porosity versus standard deviation nσ , tortuosity τ and density of capillaries N/A.
3. Results and Discussions
The objective of this study is to analyze the impact of the tortuosity and the density of the capillaries distribution on the
relation between permeability and porosity and check their scaling laws with universal exponents independently of the
parameters. Numerical simulations were made using the standard deviation nσ and the expectation of distribution nµ as control
parameters. The standard deviation nσ varies from 0.2.10-6 m to 0.7.10-6 m and the expectation of distribution nµ varies from 0.3.10-6
m to 2.4.10-6 m. The computational results of this study are presented in terms of permeability variation according to the porosity.
3.1 The effect of tortuosity, standard deviation of the capillaries distribution and density of capillaries on the relation between the permeability and porosity
Figures 3a and 3b represent the effect of the standard deviation nσ on the relation between permeability and porosity in porous
media. With the increase of the standard deviation nσ from 0.2.10-6 m to 0.7.10-6 m, a slow evolution of the curve is shown upwards.
Accordingly, the porosity increases from 0.018–0.029 to 0.383-0.398. Furthermore, the permeability increases from 0.611-1.703 10-15
m2 to 83.651-101.231 10-15 m2 for τ =1 (straight capillaries in the complex model). The porosity increases from 0.003 to 0.039, and
the permeability increases from 22.378 10-15 m2 to 1016.9 10-15 m2 for τ = 0.1 (tortuous capillaries in the complex model)
and 60.7.10 mnσ−= . Figures 3c and 3d demonstrate the effect of the standard deviation nσ on the relation between permeability
and porosity in porous media. The curve moves slowly upwards with the increase of standard deviation nσ from 0.2 10-6 m to 0.7
10-6 m. Accordingly, the porosity increases from 0.005–0.274 to 0.021-0.294. The permeability increases from 0.034-35.374 10-15 m2 to
0.874-51.970 10-15 m2 for 12/ 0.05.10N A m−= . The porosity increases from 0.043 to 0.481 and the permeability increases from 1.118
10-15 m2 to 50.845 10-15 m2 for 12/ 0.08116.10N A m−= and 60.7.10 mnσ−= . Thus, both quantities are proportional to nσ and the
density of capillaries N/A. On the other hand, τ influences porosity proportionally and permeability inversely.
Figure 3 shows the effect of the standard deviation and tortuosity on the permeability and porosity, to clarify the relationship
between porosity and permeability even more, figure 4 plots the log-log of the permeability and porosity versus standard
deviation nσ and tortuosity τ (Figs. 4a and 4b), and density of capillaries (Figs. 4c and 4d). The plots show that the variation
of 15ln(10 . )K− versus ln( )S is fitted with a linear function such that: 15ln(10 . ) ln( )K S Cβ− = + where β is the slope and C is the
intercept. Therefore, the permeability increases as a power law with porosity as:

Scaling Law of Permeability and Porosity for Fluid Transport Phenomena in Porous PCM Media
Journal of Applied and Computational Mechanics, Vol. 7, No. 1, (2021), 84-92
89
(a) (b)
(d)(c)
0,00 0,05 0,10 0,15 0,20 0,25 0,30 0,35 0,40
0
20
40
60
80
100
K*1
0-1
5m
2
S
mn=0,3
mn=0,6
mn=0,9
mn=1,2
mn=1,5
mn=1,8
mn=2,1
mn=2,4
t=1
0,000 0,005 0,010 0,015 0,020 0,025 0,030 0,035 0,040
0
200
400
600
800
1000
K1
0-1
5 m
2
S
t=0,1
mn=0,3
mn=0,6
mn=0,9
mn=1,2
mn=1,5
mn=1,8
mn=2,1
mn=2,4
0,00 0,05 0,10 0,15 0,20 0,25 0,30
0
10
20
30
40
50
S
K1
0-1
5m
2
120.05.10N
mA
= mn=0,3
mn=0,6
mn=0,9
mn=1,2
mn=1,5
mn=1,8
mn=2,1
mn=2,4
0,0 0,1 0,2 0,3 0,4 0,5
0
10
20
30
40
50
K1
0-1
5m
2
S
120.08116.10N
mA
= mn=0,3
mn=0,6
mn=0,9
mn=1,2
mn=1,5
mn=1,8
mn=2,1
mn=2,4
Fig. 5. The relation between permeability and porosity versus the expectation of distribution nµ , tortuosity τ and density of capillaries N/A.
1510K Sβ+≈ (14)
where the exponent 1.69 0.01β = ± for different values of standard deviation, density of capillaries and tortuosity. This scaling law
holds true for each value of these parameters, which proves its universal character.
This power law has been established based on the Kozeny-Carman equation (Dastidar et al. [28], Kolodzie [29], Pittman [30]
and Hariti et al. [31]). The obtained result for the β exponent in this case is close to that found by Kolodzie [29].
3.2 The effect of tortuosity, expectation of distribution and density of capillaries on the relation between the permeability and porosity
Figures 5a and 5b represent the influence of the expectation of distribution nµ on the relation between permeability and
porosity in porous media. The curve moves slowly upwards with the increase of the expectation of distribution nµ from 0.3.10-6 m
to 2.4.10-6 m, accordingly. The porosity increases from 0.008 – 0.029 to 0.370-0.398, and the permeability increases from 0.066-1.703
10-15 m2 to 68.904-101.231 10-15 m2 for τ = 1 (straight capillaries in complex model). The porosity increases from 0.037 to 0.039, and
the permeability increases from 692.169 10-15 m2 to 1016.9 10-15 m2 for τ = 0.1 (tortuous capillaries in complex model) and 62.4.10n mµ −= .
Figures 5c and 5d show the impact of the expectation of distribution nµ on the relation between permeability and porosity in
porous media. The curve moves slowly upwards with the increase of the expectation of distribution nµ from 0.3.10-6m to 2.4.10-6m.
The porosity increases from 0.005 – 0.021 to 0.274- 0.294, and the permeability increases from 0.034-0.874 10-15 m2 to 35.374-51.970
10-15 m2 for 12/ 0.05.10N A m−= . The porosity increases from 0.448 to 0.481, and the permeability increases from 34.608 10-15 m2 to
50.845 10-15 m2 for 12/ 0.08116.10N A m−= and 62.4.10n mµ −= .
These results can be explained by the theory of probability density function. The belief of distribution nµ characterizes the
average capillary diameter of porous media in the normal distribution function. The more the average capillary diameter becomes
higher, the more nµ increases. The permeability and porosity both increase by increasing the average capillary diameter [26]. Thus,
both quantities are proportional to nµ , and density of capillaries N/A. On the other hand, τ influences the porosity proportionally
and permeability inversely. In addition, the larger the capillary diameter, the less friction there is between the fluid and the inner
section of the capillary. This facilitates the flow of fluid through the capillaries and increases the permeability and porosity of the
porous medium.
Yassine Hariti et. al., Vol. 7, No. 1, 2021
Journal of Applied and Computational Mechanics, Vol. 7, No. 1, (2021), 84-92
90
(a) (b)
(d)(c)
-5,0 -4,5 -4,0 -3,5 -3,0 -2,5 -2,0 -1,5 -1,0
-3,0
-2,5
-2,0
-1,5
-1,0
-0,5
0,0
0,5
1,0
1,5
2,0
2,5
3,0
3,5
4,0
4,5
ln(S)
ln(K
10-1
5 m
2)
slope =4,06
t=1 mn=0,3
mn=0,6
mn=0,9
mn=1,2
mn=1,5
mn=1,8
mn=2,1
mn=2,4
-7,0 -6,5 -6,0 -5,5 -5,0 -4,5 -4,0 -3,5 -3,0
-0,5
0,0
0,5
1,0
1,5
2,0
2,5
3,0
3,5
4,0
4,5
5,0
5,5
6,0
6,5
7,0
ln(S)
ln(K
10
-15
m2)
slope =4,06
t=0,1 mn=0,3
mn=0,6
mn=0,9
mn=1,2
mn=1,5
mn=1,8
mn=2,1
mn=2,4
-5,5 -5,0 -4,5 -4,0 -3,5 -3,0 -2,5 -2,0 -1,5 -1,0
-3,5
-3,0
-2,5
-2,0
-1,5
-1,0
-0,5
0,0
0,5
1,0
1,5
2,0
2,5
3,0
3,5
4,0
ln(K
10-1
5m
2)
ln(S)
120.05.10
Nm
A
=
mn=0,3
mn=0,6
mn=0,9
mn=1,2
mn=1,5
mn=1,8
mn=2,1
mn=2,4
slope =4,06
-4,5 -4,0 -3,5 -3,0 -2,5 -2,0 -1,5 -1,0 -0,5
-3,5
-3,0
-2,5
-2,0
-1,5
-1,0
-0,5
0,0
0,5
1,0
1,5
2,0
2,5
3,0
3,5
4,0
4,5
ln(K
10-1
5m
2)
ln(S)
120.08116.10N
mA
=
slope =4,06
mn=2,4
mn=2,1
mn=1,8
mn=1,5
mn=1,2
mn=0,9
mn=0,6
mn=0,3
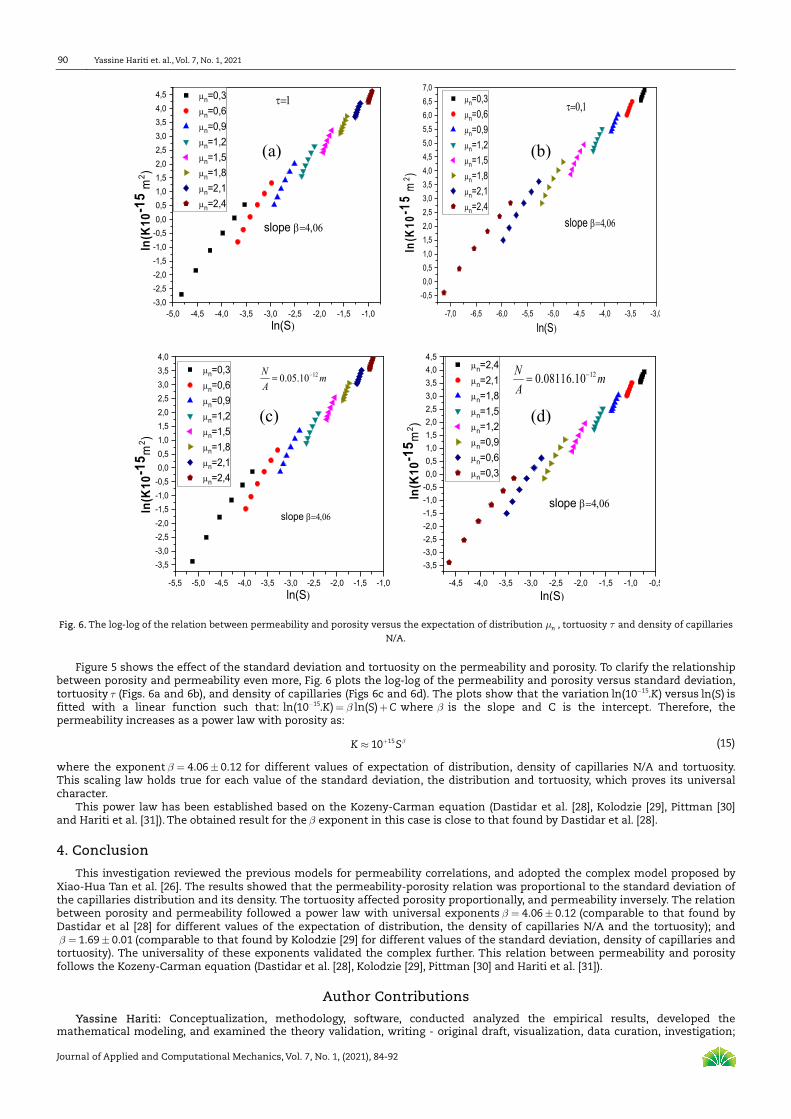
Fig. 6. The log-log of the relation between permeability and porosity versus the expectation of distribution nµ , tortuosity τ and density of capillaries
N/A.
Figure 5 shows the effect of the standard deviation and tortuosity on the permeability and porosity. To clarify the relationship between porosity and permeability even more, Fig. 6 plots the log-log of the permeability and porosity versus standard deviation, tortuosity τ (Figs. 6a and 6b), and density of capillaries (Figs 6c and 6d). The plots show that the variation 15ln(10 . )K− versus ln( )S is fitted with a linear function such that: 15ln(10 . ) ln( )K S Cβ− = + where β is the slope and C is the intercept. Therefore, the permeability increases as a power law with porosity as:
1510K Sβ+≈ (15)
where the exponent 4.06 0.12β = ± for different values of expectation of distribution, density of capillaries N/A and tortuosity. This scaling law holds true for each value of the standard deviation, the distribution and tortuosity, which proves its universal character.
This power law has been established based on the Kozeny-Carman equation (Dastidar et al. [28], Kolodzie [29], Pittman [30] and Hariti et al. [31]). The obtained result for the β exponent in this case is close to that found by Dastidar et al. [28].
4. Conclusion
This investigation reviewed the previous models for permeability correlations, and adopted the complex model proposed by Xiao-Hua Tan et al. [26]. The results showed that the permeability-porosity relation was proportional to the standard deviation of the capillaries distribution and its density. The tortuosity affected porosity proportionally, and permeability inversely. The relation between porosity and permeability followed a power law with universal exponents 4.06 0.12β = ± (comparable to that found by Dastidar et al [28] for different values of the expectation of distribution, the density of capillaries N/A and the tortuosity); and
1.69 0.01β = ± (comparable to that found by Kolodzie [29] for different values of the standard deviation, density of capillaries and tortuosity). The universality of these exponents validated the complex further. This relation between permeability and porosity follows the Kozeny-Carman equation (Dastidar et al. [28], Kolodzie [29], Pittman [30] and Hariti et al. [31]).
Author Contributions
Yassine Hariti: Conceptualization, methodology, software, conducted analyzed the empirical results, developed the mathematical modeling, and examined the theory validation, writing - original draft, visualization, data curation, investigation;

Scaling Law of Permeability and Porosity for Fluid Transport Phenomena in Porous PCM Media
Journal of Applied and Computational Mechanics, Vol. 7, No. 1, (2021), 84-92
91
Ahmed Hader: Supervision, validation, conceptualization, methodology, software, writing - original draft, visualization, data curation, investigation. Hamza Faraji: Conceptualization, Writing - review & editing, investigation. Yahia Boughaleb: Supervision, validation, conceptualization, methodology, software, writing - original draft, visualization, data curation, investigation. The manuscript was written through the contribution of all authors. All authors discussed the results, reviewed, and approved the final version of the manuscript.
Conflict of Interest
The authors declared no potential conflicts of interest with respect to the research, authorship, and publication of this article.
Funding
The authors received no financial support for the research, authorship, and publication of this article.
Nomenclature
Q Porous medium flow rate [m3/s] μ Fluid viscosity [Pa.s]
q(2r) Function of the flow rate, through a capillary Lt(2r) Length function of the capillary
f(2r) Probability density function of capillaries in the Porous medium sectional area Fp Shape factor
A Cross-section area of micro-channel [m2] S Medium porosity
L Distance which the fluid traverses [m] τ Tortuosity
ΔP Pressure gradient [Pa] μn Distribution expectation [m]
K Permeability of a porous medium [ m2] σn Standard deviation [m]
References
[1] Cai, J., Hu, X., Standnes, D.C., You, L., An analytical model for spontaneous imbibition in fractal porous media including gravity, Colloids and Surfaces A: Physicochemical and Engineering Aspects, 414, 2012, 228-233. [2] Dong, M., Dullien, F.A., Dai, L., Li, D., Immiscible displacement in the interacting capillary bundle model part I. Development of interacting capillary bundle model, Transport in Porous Media, 59, 2005, 1–18. [3] Xu, C., Kang, Y., You, L., You, Z., Lost-circulation control for formation-damage prevention in naturally fractured reservoir: Mathematical model and experimental study, SPE Journal, 22(05), 2017, 1-17. [4] Pia, G., Sassoni, E., Franzoni, E., Sanna, U., Predicting capillary absorption of porous stones by a procedure based on an intermingled fractal units model, International Journal of Engineering Science, 82, 2014, 196-204. [5] Pia, G., Sanna, U., An intermingled fractal units model and method to predict permeability in porous rock, International Journal of Engineering Science, 75, 2014, 31-39. [6] Escobar, F.-H., Zambrano, A.-P., Giraldo, D.-V., Cantillo-Silva, J.-H., Pressure and pressure derivative analysis for non-newtonian pseudoplastic fluids, CT&F - Ciencia, Tecnología y Futuro, 4(3), 2011, 47-59. [7] Yang, S., Fu, H., Yu, B., Fractal analysis of flow resistance in tree-like branching networks with roughened microchannels, Fractals, 25(1), 2017, 1750008. [8] Faraji, H., Benkaddour, A., Oudaoui, K., El Alami, M., Faraji, M., Emerging Applications of Phase Change Materials: A Concise Review of Recent Advances, Heat Transfer-Asian Research, 2020, https://doi.org/10.1002/htj.21938. [9] Sheikholeslami, M., Jafaryar ,M., Shafee, A., Babazadeh, H., Acceleration of discharge process of clean energy storage unit with insertion of porous foam considering nanoparticle enhanced paraffin, Journal of Cleaner Production, 261, 2020, 121206. [10] Shojaei, M.J., Rodríguez de Castro, A., Méheust, Y., Shokri, N., Dynamics of foam flow in a rock fracture: Effects of aperture variation on apparent shear viscosity and bubble morphology, Journal of Colloid and Interface Science, 552, 2019, 464–475. [11] Rodríguez de Castro, A., Extending Darcy’s law to the flow of yield stress fluids in packed beds: method and experiments, Advances in Water Resources, 126, 2019, 55–64. [12] Pollmann, N., Larsson, F., Runesson, K., Jänicke, R., Diffuse interface modeling and Variationally Consistent Homogenization of fluid transport in fractured porous media, European Journal of Mechanics - A/Solids, 84, 2020, 104067. [13] Moradi, P.M., Kantzas, A., Visualization of acoustically-assisted fluid flow in unconsolidated confined porous media, Results in Engineering, 6, 2020, 4–8. [14] Curran, J., Carvalho, J.L., A displacement discontinuity model for fluid-saturated porous media, in: 6th ISRM Congress 1987, International Society for Rock Mechanics and Rock Engineering, 1987, 73–78. [15] Boddeti, N., Tang, Y., Maute, K., Rosen, D.W., Dunn, M.L., Optimal Design and Manufacture of Variable Stiffness Laminated Continuous Fiber Reinforced Composites, Scientific Reports, 10(1), 2020, 1–15. [16] Creighton, R. L., Phan, J., Woodrow, K.A., In Situs 3D-Patterning of Electrospun Fibers Using Two-Layer Composite Materials, Scientific Reports, 10(1), 2020, 1–14. [17] Xu, P., Sasmito, A.P., Yu, B., Mujumdar, A.S., Transport Phenomena and Properties in Treelike Networks, Applied Mechanics Reviews, 68(4), 2016, 040802. [18] Liu, R., Li, B., Jiang, Y., A fractal model based on a new governing equation of fluid flow in fractures for characterizing hydraulic properties of rock fracture networks, Computers and Geotechnics, 75, 2016, 57-68. [19] Guarracino, L., Rötting, T., Carrera, J., A fractal model to describe the evolution of multiphase flow properties during mineral dissolution, Advances in Water Resources, 67, 2014, 78-86. [20] Huai, X., Wang, W., Li, Z., Analysis of the effective thermal conductivity of fractal porous media, Applied Thermal Engineering, 27(17-18), 2007, 2815-2821. [21] Pia, G., Sanna, U., An intermingled fractal units model to evaluate pore size distribution influence on thermal conductivity values in porous materials, Applied Thermal Engineering, 65(1-2), 2014, 330-336. [22] Gou, X., Schwartz, J., Fractal analysis of the role of the rough interface between Bi 2Sr2CaCu2Ox filaments and the Ag matrix in the mechanical behavior of composite round wires, Superconductor Science and Technology, 26(5), 2013, 055016. [23] Hariti, Y., Hader, A., Amallah, L., Achik, I., Boughaleb, Y., Langevin dynamics study of the mean flow rate-energy stochastic fluid intrusion process in porous media, International Review on Modelling and Simulations, 12(6), 2019, 398. [24] Cao, L.N., Li, X.P., Luo, C., Yuan, L., Zhang, J.Q., Tan, X.H., Horizontal well transient rate decline analysis in low permeability gas reservoirs employing an orthogonal transformation method, Journal of Natural Gas Science and Engineering, 33, 2016, 703-716. [25] Yang, S., Liang, M., Yu, B., Zou, M., Permeability model for fractal porous media with rough surfaces, Microfluidics and Nanofluidics, 18, 2015, 1085–1093. [26] Tan, X.H., Jiang, L., Li, X.P., Li, Y.Y., Zhang, K., A complex model for the permeability and porosity of porous media, Chemical Engineering Science, 172, 2017, 230-238. [27] Tan, X.H., Li, X.P., Liu, J.Y., Zhang, G.D., Zhang, L.H., Analysis of permeability for transient two-phase flow in fractal porous media, Journal of Applied Physics, 115, 2014, 113502.

Yassine Hariti et. al., Vol. 7, No. 1, 2021
Journal of Applied and Computational Mechanics, Vol. 7, No. 1, (2021), 84-92
92
[28] Dastidar, R., Sondergeld, C.H., Rai, C.S., An improved empirical permeability estimator from mercury injection for tight clastic rocks, Petrophysics, 48 (3), 2007. [29] Kolodzie, S., Analysis of pore throat size and use of the waxman-smits equation to determine OOIP in spindle field, Colorado, in: Proceedings - SPE Annual Technical Conference and Exhibition, 1980. [30] Pittman, E.D., Relationship of porosity and permeability to various parameters derived from mercury injection-capillary pressure curves for sandstone, American Association of Petroleum Geologists Bulletin, 76(2), 1992, 191-198. [31] Hariti, Y., Hajji, Y., Hader, A., Faraji, H., Boughaleb, Y., Faraji, M., Saifaoui, D., Modelling of fluid flow in porous media and filtering water process: Langevin dynamics and Darcy’s law based approach, Materials Today: Proceedings, 30(4), 2020, 870-875. [32] Hader, A., Sbiaai, H., Tanasehte, M., Amallah, L., Boughaleb, Y., Scaling law in avalanche breaking of composite materials, Multidiscipline Modeling in Materials and Structures, 2020, https://doi.org/10.1108/MMMS-05-2020-0111.
ORCID iD
Yassine Hariti https://orcid.org/0000-0002-7308-8467 Ahmed Hader https://orcid.org/ 0000-0002-0597-2576 Hamza Faraji https://orcid.org/0000-0003-2792-4986 Yahia Boughaleb https://orcid.org/ 0000-0002-1572-0401
© 2020 by the authors. Licensee SCU, Ahvaz, Iran. This article is an open access article distributed under the terms and conditions of the Creative Commons Attribution-NonCommercial 4.0 International (CC BY-NC 4.0 license) (http://creativecommons.org/licenses/by-nc/4.0/).
How to cite this article: Hariti Y., Hader A., Faraji H., Boughaleb Y. Scaling Law of Permeability and Porosity for Fluid Transport Phenomena in Porous PCM Media, J. Appl. Comput. Mech., 7(1), 2021, 84–92. https://doi.org/10.22055/JACM.2020.35136.2577