scaling for speed - boat design
TRANSCRIPT

http://arxiv.org/abs/1602.00900
Scaling for Speed on the Water
Joseph L. McCauley Physics Dept.
University of Houston Houston, Tx. 77204 [email protected]
Abstract
Hydrodynamic scaling laws and extensive experimental data for the performance of fully submerged propellers have existed and have been used to advantage since the 1950s and earlier. Modern high performance boats require surface piercing propellers. I present three new hydrodynamic scale-free predictions for the relative performance of both submerged and surface-piercing propellers and boats. For the surface piercing case I compare my scaling predictions with official APBA OPC kilo records, using a single class record in each case as a baseline for my predictions. One scaling law allows propeller diameter to be predicted from an established baseline where shaft hp and shaft RPM are the variables. The second scale-free prediction is inferred from Froude nr. scaling and allows boat speed to be predicted based on shaft hp and weight, given a known baseline in the same class of drag coefficient and submerged depth of boat. The third scaling law accurately predicts the speed loss when the gear ratio is lowered.

I also discuss the existing available data on surface piercing propellers and compare the data with both typical competition data and speed records. I state a basic requirement for setting the leading edge camber of surface piercing propellers for optimal acceleration and top speed. I end by using the ideas of circulation conservation and vortex stretching to provide a qualitative picture of the physics of blade ventilation in surface piercing via the tip vortices. Keywords: Hydrodynamic scaling, vortices, propellers, ventilation, supercavitation, circulation conservation, vortex stretching 1. Introduction I begin with the scaling laws for thrust, torque and efficiency and show how they can be used to predict performance. The predictions are scale-free, they apply to planing boats of any size, weight, and power. In the first case I use a known baseline to predict the required propeller diameter based on shaft hp and shaft RPM. In the second case I show directly how a reduction in gear ratio reduces the top speed. In the third, based on Froude nr. scaling, I show how to predict the speed change when weight and shaft hp are varied. The derivation of the first two results is simple. They follow from the scaling laws for thrust, torque and mechanical efficiency of propellers1,2. Boats and

gearcases are divided into classes based on similar dimensionless drag coefficients. Within a class there is a scaling law for power, shaft RPM, and prop diameter. Predictions within but not across classes are made. While the results are general and are not restricted to high performance boats I illustrate the power of the predictions by testing the scaling laws against known data from official APBA OPC kilo speed records1,2. 2. Torque, thrust and efficiency of propellers
A hydrofoil or airfoil experiences lift due to circulation about the foil3,4. For small angles of attack relative to the inflow the ratio of lift to drag is large. A propeller has a pitch rather than a fixed attack angle. A propeller blade is a rotating, twisted hydrofoil3,5, hence also works via circulation with a high thrust to drag ratio at high efficiencies. The propeller blade is twisted in order to maintain constant pitch; every point on a blade traces out a helical path as the propeller advances. The thinner the helical wake, the smaller the drag. Thin blades can make the wake thinner. Speed requires low drag hence thin blades. We need the standard hydrodynamic scaling laws for thrust, torque and efficiency. Let L be the propeller diameter, n the shaft RPM, U the speed of the boat, and ρ is the water density. The motor’s crankshaft RPM is no=n/gr where gr is the gear ratio. The thrust developed by the propeller is denoted by T, and the
torque provided by the motor at the propeller shaft is denoted by N. Dimensional analysis3,6 yields T =ρκT (J)L
4n2 (1) and N =ρκN (J)L
5n2 (2) where J=U/nL is the dimensionless advance coefficient, κT is the dimensionless thrust coefficient and κN is the dimensionless torque coefficient. These coefficients depend on J and also on other dimensionless parameters: the blade area ratio (b.a.r.)6 and blade camber are two obvious choices. The b.a.r. is the projection of the blade area onto the plane perpendicular to the propeller shaft and then divided by the area of a disc of diameter L. With pact=U/n the pitch of the helical path traced out by a blade tip it follows that
€
J =pact
n. (3)
We can think roughly of pact as the pitch of the wake left by the blade tip. The relation of blade pitch to wake pitch is pact=(1-s)p where s is called ‘slip’. Slip is not the same as efficiency and slip is necessary. An auto tire experiences slip when the driver breaks traction. Otherwise the tire has zero slip. A propeller without slip is impossible because of shear in a fluid.

The power supplied by the motor at the propeller shaft (shp, or shaft horsepower) follows from Pin=Nn and is Pin =ρκN (J)L
5n3 . (4) Typical outboards and stern drives have a shaft hp that is roughly 90% the hp developed by the motor at the crankshaft. The 10% loss is due to the gears and waterpump. The power delivered to the boat by the propeller is Pout=TU or Pout =ρκT (J)L
4n2U . (5) The difference between the power input and the power output is due to the wake created by the propeller and gearcase (or propeller and appendages, in the case of inboards). The wake represents pure drag. The mechanical efficiency of a propeller is therefore
η=PoutPin
=J2π
κT (J)κN (J) . (6)
Useful tables of efficiencies, torque and thrust coefficients for fully submerged propellers for different p/L and B.A.R. were produced in the 1950s
by Gawn6,7. The data were taken for propellers with a flat high pressure blade side and cambered low pressure side, a design that was common for marine propellers in the 1950s and earlier. Note that maximum efficiency corresponds roughly to s≈.05 or about 5% slip. High performance hulls run near maximum efficiency for a given p/L ratio where J=pwake/L=(1-s)p/L. We see that the peak efficiency increases as p/L increases, but increasing p/L is not the path to speed. Race and other high performance boats run high gear ratios (from 2:1 to 1:1) at high RPM (6000 to 9000 RPM) with p and L both small. Note that J=0 corresponds to maximum thrust. This reflects the case of a boat tied fast to a dock or a trailer with the motor running at full throttle merely pushing water backward with zero boat speed. In naval architecture or marine engineering the main focus is generally in designing a propeller is often to push a certain load5, e.g., to propel a ship or other non-planing hull. The marine engineer can fix T, U, and n and determine L. In high performance applications the problem is completely different: there is no interest in fixing the thrust to push a certain load. One doesn’t know the thrust in advance and need not know it. Instead, top

speed and acceleration are to be optimized. Therefore we do not use the tables in the same way as a marine engineer. Here’s an example of how one can use fig. 1 in a high performance application. This is from a case that I know personally. Suppose that we want to run U=46 mph @ 6600 RPM with a 12:29 gear ratio and a 13” diameter propeller. Then J=1.5. The rig in this case is a classic 1968 Glastron v153, a V-bottom runabout of 550 lb dry weight when empty powered by a 1991 Johnson outboard with 70 shp. The prop used has p/L=19/13=1.46. The curves in fig. 1 don’t give us exactly that case. A rough estimate can be obtained if we use a curve with p/L=1.6. We choose curve (a) with the lowest b.a.r. With J= 1.5 we get η=.72 and κT≈.08. This yields a thrust T=392 lb and a required power of P=TU/η=76.2 shp. This prediction is for full submersion of the propeller. The 1991 Johnson 70 is set up for mild surface-piercing (the blade tips exit the water once per revolution). Surface piercing lowers the gearcase drag and reduces the power needed. So by raising the motor and ventilating the propeller we need 6-7 shp less than is predicted for full submersion. We cannot use the curve for p/L=1.4 because in that case η<0 for J=1.5.


Fig. 1 Efficiency, torque and thrust coefficients for fully submerged propellers. The graphs tell us nothing about the requirements on the boat, but there is an implicit assumption. The boat weight and bottom (running surface) must be designed so as to permit the speed desired. Minimal requirements are a firm, straight bottom. A boat bottom that flexes permits ‘power hooking’ and results in speed loss. A bottom with a rocker yields ‘porpoising’ and speed loss. The transom should meet the bottom as a sharp edge (this is a Kutta condition3 for sharp separation of the flow). Otherwise there is the tendency of the boat to sink a bit aft and may even generate a rocker effect at the transom.
3. Diameter, power and RPM scaling Consider two different motors with the same gearcase design, hence the same drag characteristics, and roughly the same gear ratios. Then the torque, thrust and drag coefficients should be more or less the same. The same requirement is made on the class of boat to which the power is applied. It follows that
ρκN (J) =PELE5 nE
3=PDLD5 nD
3 (7)

so that, given a known baseline, we can use scaling to predict the propeller diameter needed to absorb the power in a different case
LD = LE
nEnD
!
"#
$
%&
3PDPE
'
())
*
+,,
1/5
(8)
where the subscripts D and E refer to two different
motors or simply two different gear ratios on the
same motor. The torque coefficients depend on J. If
the coefficients are different then the above result will
be modified by their ratio raised to the power 1/5,
and this generally will be near enough to unity to
ignore the factor. Fig. 2 illustrates the gearcase of an
SST60 Class motor.

Fig. 2. SST60 Class motor and gearcase.
We can test this scaling law by using established
APBA OPC speed records. I use the 1984 APBA speed
record book1,2 because the records from that era
include two sets of two different classes where the
same gearcase design was used on motors of different
power but with gear ratios. I know the propellers and
their diameters used in the different racing classes in
that era, as well as the motors.

The motor RPM is denoted as no, shaft RPM is n=(gr)no. Remember that shp is 90 % of hp. I know the motor RPM for E and J classes. For the other cases where I do not know the RPM I estimated it from no =1056 ⋅U /gr ⋅ (1− s) ⋅p , with pitch p given in inches. I know the pitches that were used for kilo records in the various classes. Slip was then taken to be s≈.1 in accordance with high mechanical propeller efficiency. Here’s a table including the pitches and diameters used in kilo record runs. Class P(hp) p(in) U(mph) no (RPM) gr Lpred (in) Lact (in)
DP 60 27 53.89 5800 13 : 29 13.5 13.5EP 75 25 70.56 6800 15 : 28 _ 12GP 85 30 73.19 6200 13 :30 14.9 14JP 150 30 86.87 7000 14 : 28 13.9 14VP 235 28 84.8 6500 14 : 28 15.7 14.5
Table 1 Lpred is the diameter predicted by scaling, taking EP Class as the baseline, and Lact is the actual diameter used. The worst lack of agreement is for VP Class. Classes GP, JP and VP were splined to run the same Mercury propellers. The VP Class OMC motor was also splined for the Mercury props. Classes DP and EP ran the same OMC props. The props were sold as 13” to 13 1/2” dia. blanks to be thinned, trimmed and recambered.

For the tunnel boat classes I take the SE diameter of 13” as the baseline for predicting the other diameters in table 2. Class P(hp) p(in) U(mph) no (RPM) gr Lpred (in) Lact (in)
SD 60 27 69.77 7400 13 : 29 14.7 13SE 75 27 91.75 7500 15 : 28 _ 13SG 75 27? 86.87 7100 15 : 28 13.2 13SJ 150 30 102.44 8000 14 : 28 14.9 14
Table 2 Had the baseline for SE been D=12.5”, the typical diameter used in competition, then we’d have gotten the predictions of table 2b instead. Class Lpred Lact
SD 14.1 13SE _ 12.5SG 12.7 13SJ 14.3 14
Table 2b However, had we taken SJ’s L=14” as the baseline we’d have predicted LE=12.2” for SE, which is much too small. Typical competition speeds for SE were 80 mph using L=12 ½” and p=23”.
The records designated as _P (P for ‘production’ boat)
are for stock motors on monohulls (pad V-bottom
design) so those records form one class. The records
designated S_ (S for ‘sport’) are for tunnel
boats/catamarans. On a catamaran there is nothing in
front of the propeller to disturb the inflow. In that
case the motors are run in an extreme surface-piercing
configuration where not only the entire propeller
shaft but also the gearcase hub is above the
waterline.For production records the motors were run
with the blades less than 50% surface piercing. On the
tunnels the amount of submerged blade area is much
less.
There are also two current APBA OPC classes that can be compared with each other: SST45 and SST200. Both are tunnel classes with either 1:1 or near 1:1 geared motors with small, very low drag racing gearcases. SST45. Taking SST45 as the standard, table 3 shows the result.

Class P(hp) no (RPM) gr Lpred (in)
SST45 60 7000 1 _SST200 250 8000 .93 10.73
Lact (in)8.410.25
Table 3 In constructing all of the tables I systematically assumed 10 % slip where an assumption was necessary. 4. Speed, power, weight scaling We can express the net force on an object due to fluid flowing past it. The free stream speed of the fluid is U. The net drag force on a boat is due to both water and wind. Wind drag is negligible at low speeds. Water drag breaks down into skin friction and form/shape drag. Skin friction is important for boats that plow through the water but matters little for boats with smooth, straight bottoms that ride high and dry. Form drag includes the wake and waves, the main cost of power for high performance hulls. The lift force that causes planing is due to the pressure of the water pushing upward on the boat. The formula for the net force, including both lift and drag, is derived in hydrodynamics texts4,
€
F = P n dS
S∫∫ +ρν n x ω dS
S∫∫ (9)

for flow past a fully submerged object. The first term (P is the pressure) represents both the form drag and the lift. The second term (
€
ω is the vorticity) is the skin
friction. You can get a feeling for form drag and lift (thrust for a propeller) vs. skin friction by splashing a paddle into the water. If you ‘knife’ the paddle into the water parallel to the blade then it slices in easily. That motion generates pure skin friction. If you instead splash it in at an angle to the blade then eddies are formed on both sides of the paddle and it takes much more effort to move the paddle through the water. That’s form drag combined with lift, skin friction is negligible. Water is shoved out of the way by the flat surface of the paddle and flows in behind the edges forming the eddies, or ‘backflow’. This example is qualitatively important for surface-piercing propellers, where each blade must either slice or splash into the water each revolution. We can estimate the skin friction8. With on the order of one sq. ft. of area surface, the flow over the bottom of a boat running 60 mph (with ν=10-5ft2/s for water) has a Reynolds nr. R=UL/ν ≈107 so the boundary layer is turbulent. For turbulent flow past a flat plate the skin friction coefficient is cf=.072R-1/5 so the skin friction on a square foot of running surface is Df≈21 lb. The total drag equals the total thrust at constant speed U so that the total drag force is D=ηPin/U. With pout=.9(75hp) providing the shp the table gives us η≈.6

and D≈260 lb >>21 lb, so form drag dominates skin friction by more than a factor of 10.
The Froude nr. F=U2/gd1,2, with d the depth of
submerged boat bottom, measures the kinetic energy
vs. gravitational potential energy and comes into play
for planing hulls. A ship plows through the water
with both large skin friction and large form drag. All
high performance boats plan high and dry, the slin
friction is very small compared with the form drag.
Above a certain speed a high performance boat plans
on the water with relatively little submerged surface
area. The volume of displaced water is dA where A is
the wetted surface area. The volume dA is very small
compared with the total boat volume in our case. The
smaller the wet surface area and the smaller the
submerged depth, the less the form drag and the
higher the speed. Racing boats run on a wet surface
on the order of magnitude of A≈1 ft2 or a few sq, ft.
regardless of boat length. Typical lengths can be 12’-

16’ for tunnels, 30’ for unlimited class inboard
hydroplanes, or 40-60’ for offshore boats with
multiple engines.
This section is motivated by a practical question. If we know how much power is required to push a given boat a given speed, then how will the speed change if we change the power input, the weight, or both? Crouch and Wyman have attempted to answer this question but their results can’t be derived from hydrodynamics: the coefficients in their predictions are scale-dependent. Our prediction is scale-free. Crouch9 proposed an empirical rule
€
U = c Pin /w. The coefficient c has dimensions, the formula does not follow from any form of hydrodynamic scaling. Wyman10 proposed that U=cL1/2(Pin/wd)1/3 where L represents a wetted length of boat and wd is the weight of displaced water at speed U. The guesswork behind this formula is not clear. It cannot be derived from a Froude nr.
€
F = U/ gL and is not correct: (i) it doesn’t reflect hydrodynamic scaling since c has dimensions, and (ii) the speed of a planing hull does not increase with boat length, all other things being equal. At the water-air interface waves are created as well. Creating waves costs energy/sec. A boat always creates a small ‘bow wave’, even if it’s a tunnel or V-

bottom running on only a foot or less of wetted surface. It’s easy to see the bow wave of a boat plowing through the water, but the ‘bow wave’ is always there at the forward contact area of bottom with water even if the boat is planing at 60-150 mph or more. Now for the scaling law. A boat at rest is supported by buoyancy. Well above planing speed buoyancy is negligible because the wet surface area of the boat is small compared with the dry area. In that limit dynamic pressure against the wet surface area carries the full weight of the boat. With a tunnel at high speeds, both water pressure on the sponsons and air lift on the tunnel floor enclosed by the sponsons carry the weight. The dimensionless nr. of interest for the submerged part of the boat is the Froude nr. F =U / gd where g is the acceleration due to gravity (9.8 m/s2=32ft/s2) and d is the submerged depth of boat. In order to plane, the kinetic energy must be great enough to overcome gravity and drag due to the bow wave. The dynamic pressure against the boat bottom must lift the boat on top of the water so that F>1 roughly reflects for planning. The drag force on a boat moving at speed U is
€
D = ρcDAU2. (10) We know that drag depends on weight. Writing

ρAU2 =ρcDAF2gd = cDwdF
2
(11) where wd is the weight of the displaced water, we get drag D proportional to the weight of the water displaced by the boat. This can be replaced by the boat weight w only if the boat is moving slowly, but not while planing. A necessary but insufficient condition for planing is the Kutta condition generalized to an air-water interface, that there is no backflow up the transom: the water must separate cleanly from the bottom at the transom. I have checked this condition with a 15.3’ 950 lb runabout (a Glastron v153 powered by a 70 shp Johnson). The water breaks free from the transom at about 8 mph but the boat doesn’t plan cleanly on top of the water until 16-20 mph. When the boat plans then the weight of the displaced water is smaller than boat weight. We assume that the weight of the displaced water is proportional to the boat weight w even when planing. Without some assumption it’s impossible to go forward. Combining the unknown dimensionless proportionality factor with the drag coefficient, we can write D =w !cDU
2 / gd (12) with a modified dimensionless drag coefficient so that (with drag equal to thrust at any constant speed U) we have as the power required to overcome the drag

Pout =w !cDU
3 / gd . (13) This predicts, for comparable boats with comparable set- ups, comparable gear ratios, and comparable submerged depth that
€
U2 = U1P2
P1
w1
w2
"
# $
%
& '
1/3
, (14)
and answers the question ‘how much speed should I get for a different rig comparable to one where I know the power, weight and speed’. Since we’ve derived the equation for the power transmitted by the propeller to the boat, we must interpret the P’s as shaft hp (Pin). The formula applies only to classes of motorboats where the efficiency η, the thrust and torque coefficients are roughly the same. E.g., fully submerged props on flat bottom fishing boats form one class, reasonably well-ventilated (moderately surface-piercing) props on V-bottoms form another class, and the case of surface-piercing on tunnels forms a third class. Three point hydroplanes form a different class.
We can test this scaling prediction by using known
speed records1,2. Table 4 shows the predictions of the
scaling law vs. the actual speed records, where the EP
record was taken as the baseline.

Class w(lb) P(hp) Upred (mph) Uact (mph)DP 800 60 66 53.89EP 840 75 _ 70.56VP 1500 235 84.8 83.81
Table 4 The VP speed prediction is close. The DP prediction is not. Accurate predictions require that the gear ratios are nearly the same. The EP gear ratio is 15:28 =.536, the VP ratio is 1:2 = .50. However, the DP gear ratio is 14:29 = .414. All these motors were run on pad-V-bottom boats and turned 6500-7000 RPM. To understand the effect of gear ratio we take J to be the same for DP and EP because they use exactly the same gearcase housings and propellers. With roughly the same motor RPM but differing only in gear ratio and holding J=constant we find that
J = UD
grDLD
=UE
grELE
. (15)
This yields (with LD/LE=12.5/12=1.04)
€
UD ≈ UEgrD
grE
1.04 (16)
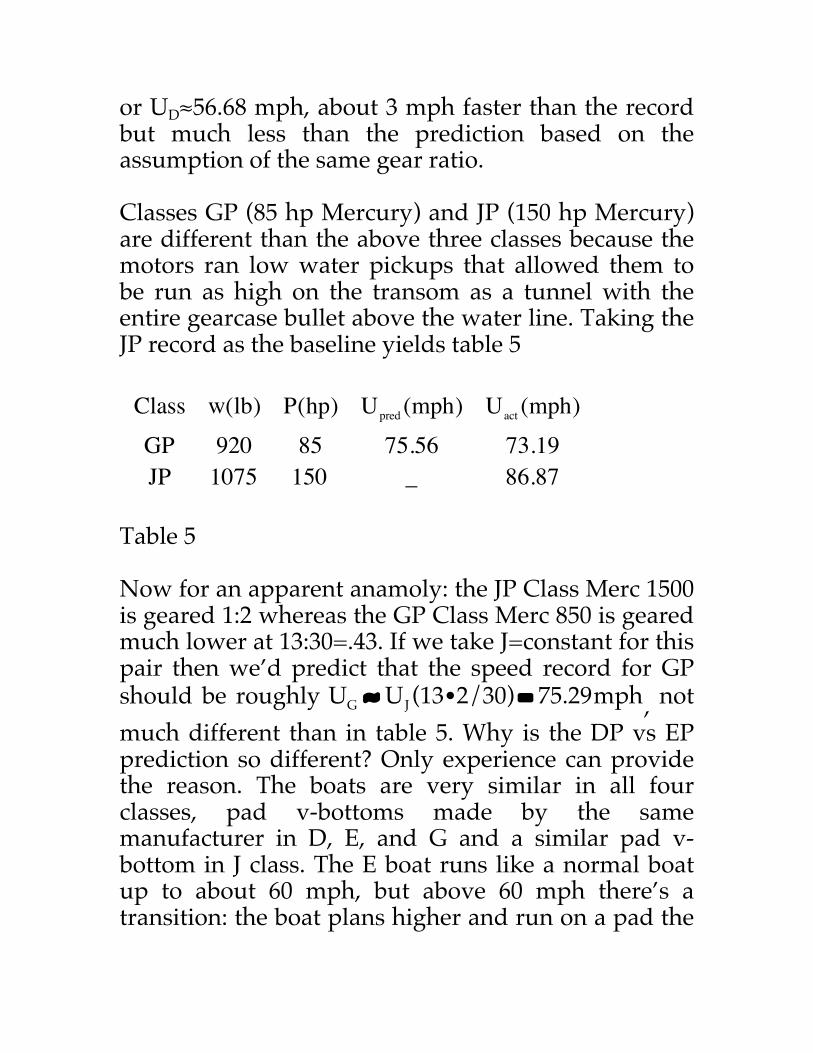
or UD≈56.68 mph, about 3 mph faster than the record but much less than the prediction based on the assumption of the same gear ratio. Classes GP (85 hp Mercury) and JP (150 hp Mercury) are different than the above three classes because the motors ran low water pickups that allowed them to be run as high on the transom as a tunnel with the entire gearcase bullet above the water line. Taking the JP record as the baseline yields table 5 Class w(lb) P(hp) Upred (mph) Uact (mph)GP 920 85 75.56 73.19JP 1075 150 _ 86.87
Table 5 Now for an apparent anamoly: the JP Class Merc 1500 is geared 1:2 whereas the GP Class Merc 850 is geared much lower at 13:30=.43. If we take J=constant for this pair then we’d predict that the speed record for GP should be roughly
€
UG ≈ UJ (13 ⋅2/30) = 75.29mph, not much different than in table 5. Why is the DP vs EP prediction so different? Only experience can provide the reason. The boats are very similar in all four classes, pad v-bottoms made by the same manufacturer in D, E, and G and a similar pad v-bottom in J class. The E boat runs like a normal boat up to about 60 mph, but above 60 mph there’s a transition: the boat plans higher and run on a pad the

width of a waterski. This requires a balancing act via the steering wheel much like riding a bicycle. That is, the drag coefficients and wet surface area of the E, G, and J boats are comparable while the D boat sits deeper in the water, runs like a normal boat, and experiences higher drag. The D motor has enough shp to run above the 60 mph transition speed, but the low gear ratio prevents that. Next come the tunnel (‘sport’) classes where all records were set using extreme surface-piercing with much less than 50% submergence of the propeller blades. The gearcase bullet drag was eliminated completely by running the bullet above the waterline. The inflow to the propeller is disturbed only by the gearcase skeg, the rudder. Here, we take SE as the baseline for scaling and the results are shown as Table 6. Class w(lb) P(hp) Upred (mph) Uact (mph)SD 625 60 87.18 69.77SE 675 75 _ 91.75SG 750 85 92.79 86.87SJ 950 150 103.34 102.44
Table 6 Again, Class SD ran with a gear ratio much less than SE so the correct prediction for the SD speed is via holding J=constant,

UD ≈ UE
grDgrE
≈ 70mph (17)
which is very close to the actual record speed. If we make the same calculation for SG vs SJ class we get
€
UG = UJ (26/30) = 88.8mph which is also closer to the actual speed record. For pure gear ratio changes at the same motor RPM and prop diameter, holding J=constant provides the more reliable relative performance prediction. The SST45 and SST200 kilo records were set in the 1990s and are available on the APBA OPC website. Here’s a prediction made by taking SST45 as the baseline
€
Class P(shp) w(lb) Upred (mph) Uact (mph)SST45 55 700 _ 87.54SST200 225 1150 118.62 128.43
Table 7 Summarizing our results, some are good predictions, others less so. The important thing is that, given a baseline, the predictions are in all cases exact. There are no ‘adjustable parameters’ (also called fudge factors) to finagle to bring the predictions closer to the actual results. This paper shows for the first time the power of scale-free results in hydrodynamics for predicting relative performance of boats.

5. Efficiency of surface piercing propellers Surface piercing requires as thin a leading edge as material strength will permit without cracking a blade under stress. The thinner the prop the faster it runs. Slam-free entry also helps to avoid leading edge cracks. The farther aft the center of pressure from the leading edge, the less chance of a leading edge crack. The thickness of the trailing edge is less important for performance. Cleavers are relatively thick at the trailing edge. The old and very effective Mercury chopper, as well as the newer Turbo and Stiletto props are relatively thin at the trailing edge. Hadler and Heckler11 were the first to collect data on partially submerged propellers12. The data were obtained for several different propellers under the following conditions. In some cases U=12 ft/s was held constant with the RPM varied. In other cases the RPM was held constant while the speed was varied from 0 to 12 ft/s.

Fig. 3. Efficiency, torque and thrust coefficients for p/L=1.18 with 37.5 % blade submersion. Figure 3 shows data from Hadler and Heckler for a prop 37.5% submerged, roughly equivalent in motor height to a tunnel boat set up for racing. The pitch to diameter ratio is p/L=1.18, close to an SST45 class tunnel where p/L≈1.17-1.25. The maximum efficiency is still over 60% but the thrust and torque coefficient curves are fairly flat in contrast with the fully-submerged case (in racing, high thrust is not the main factor). The slip at maximum efficiency is about 17%. The data were taken using propellers with blade profiles like cleavers but with a flat high pressure side. We have no information about the camber of the low pressure sides except that all propellers used were of

similar camber. Presumably, the props were not cupped. Lack of cup (a very sudden small camber concentrated at the trailing edge, like the flap on an airfoil) reduces the acceleration and low speed performance. The data were taken for props with diameters ranging from 12” to 16”.
Fig. 4. Efficiency, torque and thrust coefficients for p/L=1.6 and 35.9% blade submersion. Here’s an example that we can test against the data of fig. 3. In SST45 Class we have p/L≈1.2 with L=8.4” and p≈10” so we’ll use the data of fig. 3 for p/L=1.18
and 37.5 % submersion. With n≈7000 RPM (1:1 gearing) and U≈65 mph (a typical top speed in short course competition) we have J=1.17. The efficiency is η≈.51. Reading off κT≈.04 from the graph we use
€
T = ρκTL4n2 to get a thrust T=278 lb. Using the formula for shaft hp P=TU/η we get P=94.5 shp, which is about 50% too large. The motor used develops 54 shp. However, reading the data from the graph is not accurate and a small error in the thrust can make a big difference in the shp estimate. We can test against another class. Fig. 4 shows data from Hadler and Heckler for surface-piercing props with 35.9% submergence for a pitch to diameter ratio p/L=1.63. We can test this data for F200, tunnels powered by 250 hp V-6 outboards (225 shp) running over 100 mph on a short course. With diameter L=10” and mid-chord pitch p=17” we have p/L=1.7. The best we can do is to use the data for p/L=1.63, with 35.9% prop blade submersion. Estimating U≈110 mph in competition with a .93 gear ratio at 8300 RPM yields J≈1.5. From the graph we get η≈.48 and κT≈.02 so the predicted thrust is T=338 lb, and the predicted power is 206 shp which is smaller than the actual 225 hp. Again, this estimate must be taken with a grain of salt because the publically available graphs are not clear. However, the shp assumed above represents the peak that these motors would develop at 5500-6000 RPM. To achieve the speeds discussed at 7000-8000 RPM we therefore would need much less than the advertises peak shp so the prediction of 206 shp

might be in the right ballpark. The prediction of 90 shp for SST45 is not. It seems strange that test data taken below planing speed and at F≈0 yield results that may correspond at all to reality. F>40 would be typical for a race boat running 60 mpg. We cannot compare the data with the mildly surface piercing case considered in part 1 of the Glastron v153 and Johnson 70 (roughly 80% submersion). There, p/L=1.6 and if we use Hadler and Heckler’s graphs for 50 % submersion then η<0 at J=1.5. Clearly, more data are needed. So far, I have found very little data in the public domain13,14,15 on surface piercing propellers other than the pioneering Hadler-Heckler paper. In the paper by Ferrando et al13 the trim angle is negative 6 degrees. That doesn’t apply well to outboards, stern drives, or surface drives where the trim angle is from neutral to positive (0 to 3-6 degrees) except in extremely rough water or high wind conditions. Prop-riding inboard hydroplanes do run surface piercing props with negative trim. The Rolla Propeller (Switzerland) website states that they use data from the Potsdam, Germany, water tunnel to calculate efficiencies, torque and thrust coefficients. Some data are available from Rolla on the internet but not enough to test the data here. The graphs are presented partly unlabeled, I was not able

to obtain the thrust coefficient as a function of advance ratio. The data are again presented for the limit F≈0 and for negative trim. Simulations will not be not useful for making surface-piercing predictions. There are water tunnel tests at low Froude nr., but open water tests are preferred. OMC (Outboard Marine Corp.) performed open water tests. The OMC successor BRP Evinrude performs open water tests. OMC made the following modifications on a specific motor. First, the swivel bracket was reconstructed by replacing the normal cheap bushings by very low friction bearings. That modification allowed thrust to be measured accurately at the transom of a boat. Next, the gearcase was modified so that a measuring device was built into the gearcase. This permits the torque to be measured at the propeller shaft. In this way accurate thrust and torque measurements were made with the boat underway at a given speed U and RPM n. The method is expensive, the set up would have to be built for each model of outboard or stern drive, but the method produces reliable results. Those results are not in the public domain. 6. Physics of surface piercing propellers The scaling laws stated above apply to both fully submerged and surface piercing propellers. The speed records used above were set while running surface piercing (‘partially submerged’) propellers. A propeller is surface piercing even if only the blade tip

exits and reenters the water one time per revolution. Surface piercing changes the physics of blade circulation in interesting ways. Fully submerged propellers are limited by cavitation: the propeller’s tip speed must be low enough that the water doesn’t vaporize into bubbles on the blade surface due to the Bernoulli effect. Cavitation leads to a loss of power and to prop damage. Since tip speed goes like nL/2, then either the RPM or the diameter must be kept small, or both. Low shaft RPM requires low gearing, but low gearing requires larger prop diameter. The only way to eliminate cavitation and achieve higher speeds is via running the propeller partially submerged. Leaving and re-entering the water once per revolution does not provide enough time for water vaporization and bubble formation at high shaft RPM. For fully submerged marine propellers the low-pressure blade side is cambered while the high pressure side may be flat. For high performance (speeds of 40 to 200 mph, e.g.) both the low and high-pressure sides of the blades should be cambered for surface piercing. The camber of the high-pressure side increases from the leading to the trailing edge just as on the low-pressure side. Blade thickness increases drag by causing a thicker wake and thereby costs speed. For a thin propeller blade the mean camber line3 is near to the shape of either blade surface. In contrast with airplane wings, where the camber is opposite sign on the two sides of a wing, positive

camber on both the high and low pressure blade sides is critical for performance. The airfoil shapes sometimes used in the 1950s are wrong for marine propellers. Airfoils have a large aspect ratio; marine propellers are necessarily of very low aspect ratio. An airfoil section has thickness increasing from the leading edge aft to about mid-chord or less, and then decreases toward a sharp trailing edge. Marine propeller blade camber should never increase and then decrease from leading to trailing edge. Propeller blades can only generate thrust as lift due to circulation. The Kutta condition3,4 is approximately but well-satisfied on marine propellers even though the trailing edge is not sharp (the trailing edge of a cleaver is generally blunt). Physically, the main point of the Kutta condition is that the fluid leaves the trailing edge sharply, there should be no backflow onto the low pressure side of the blade. The next point is new insofar as publication goes, as are the formulae in sections 3 and 4 above. In surface piercing the sharp leading edge should be set for ‘slam-free’ entry. Namely, the ideal camber is roughly equivalent to s=0 over a small chord at the leading edge. The blade angle at the leading edge then produces no thrust locally and very little form drag, and the camber of that small section compensates for the reduced leading edge attack angle. Simple hydrofoil (wing) theory3 shows how lift is generated on a cambered hydrofoil running even at a small negative attack angle. Correctly set, slam-free camber produces propellers that yield exceptional

acceleration with no loss of top speed. Propeller drag is reduced, and camber increases thrust, too much camber will overload the propeller and bog the motor. The application of the slam-free condition depends on the RPM and is applied at the maximum RPM of the motor. For two-stroke racing motors this is typically 7000-9000 RPM. With leading edge camber set correctly, the acceleration from rest can be compared somewhat with the smoothness of an automatic transmission in a car. Except, in the case of the propeller one should never experience a jump like an automatic gear change: the acceleration should be completely smooth from a dead start to top speed with no sudden transition at any speed. When the camber condition is applied to underpowered boats the top speed may be optimized but one loses the smooth transition during acceleration, and may experience supercavitation when trying to plan the boat and even for a period of time afterward. The main question for physics is: how does a blade recreate circulation as it reenters the water? The circulation conservation theorem4 demands that the tip vortex must end on the water’s surface after both reentry and exit during each revolution. So the wake from a blade that completely exits the water is made up of discontinuous sections of a helical tip vortex. Surface piercing propellers are called ‘ventilated’. The vortex-helices are the wake, and the ventilation is via the hollow vortex cores ending at the air-water interface.

Marine engineers recognize three different performance regimes for partially submerged propellers16. I will deviate from their terminology and will label regimes (ii) and (iii) according to my understanding of vortices. (i) Base ventilated, where the cavity starts on the trailing edge and extends aft to the reentry point of the blade in the water. The propeller develops its highest thrust-to-drag ratio here for a reason explained below. The cavity is simply the hollow-cored (air-filled) tip vortex caused by reentry of the blade, and the vortex stretches as the propeller rotates under water. (ii) Incompletely supercavitating, between base ventilated and fully supercavitating (or ‘fully ventilated’). Here, the cavity extends from the air-water interface fore onto the blade’s suction side but doesn’t extend completely to the leading edge. A sharp transition to the fully ventilated regime would produce a performance drop. (iii) Fully ventilated is the same as supercavitating, an air-filled cavity at atmospheric pressure covers the entire suction side of the blade, starting at the leading edge and ending on the water surface at the points of reentry of the blade. The textbook case3 of supercavitation is for fully submerged hydrofoils where the cavity extends infinitely far aft of the foil. In the fully ventilated case the thrust is dramatically lower than in the base ventilated case. There must also a sudden performance drop when case (ii) occurs. A supercavitating/fully ventilated blade operates in a big air cavity and may lose 70-80% of its thrust16. This is easy to understand: consider a two dimensional
hydrofoil section. The lift coefficient of a supercavitating foil at the same attack angle as a flat plate is only ¼ that of the flat plate2. This alone predicts a 75% loss of thrust due to supercavitation. Also, with infinite wingspan the flat plate theoretically has no drag (because there are no tip vortices) whereas a two dimensional supercavitating foil section of infinite wingspan has a finite lift to drag ratio that goes as the inverse of the angle of attack. Supercavitation dramatically reduces the lift (thrust coefficient, for a propeller blade) while increasing the drag. In the supercavitating regime the advance ratio J is small with low boat speed and high motor RPM (case (ii) is similar). The first problem is getting the boat to plan, and incomplete supercavitation may continue even after the boat manages with great difficulty to plan. Once on a plan, by suddenly reducing and then increasing the RPM while jerkily changing the motor direction there may be a sudden transition to the base ventilated regime. In the so-called ‘base ventilated regime’ the blades are not ventilated at all, only the tip vortex is ventilated. With the propeller properly cambered, and with enough power, supercavitation should not occur in surface piercing applications. Either complete or partial supercavitation destroys performance. Cupping the prop plays a role in avoiding supercavitation, which we may regard as excessive ventilation of the blade. All other things being equal, the blade tip is the most important region because that’s where the water speed over the blade is greatest.
Cup increases the pressure at the trailing edge by moving the center of pressure aft. For a hydrofoil with a flat mean camber line it’s an easy calculation of a standard integral to show that a flap on a hydrofoil can add about 30% more lift. Supercavitation may sometimes be avoided by a dramatic increase in cup, but too much cup will overload the propeller and will correspondingly reduce the top speed. Higher pressure at the trailing edge prevents the formation of the blade-covering cavity. The tendency to supercavitation may also be reduced by correctly cambering the leading edge of the blade. The remedy is to set the leading edge camber so as to avoid both full and partial ventilation, otherwise a boat will not accelerate smoothly from a dead stop and may even fall off a plan in a sharp turn with high motor RPM and low boat speed. The physics of base ventilation can be understood qualitatively by using the ideas of circulation conservation and vortex stretching. For the case where the blades remain partly submerged from the nine to three o’clock positions the physics of so-called base ventilation is qualitatively simple. The propeller develops adequate thrust and efficiency, peak efficiencies of surface-piercing props are about as high as for fully submerged ones, 60-70%. When a blade section exits the water then the circulation and tip vortex must end at the air-water interface, and the circulation about the submerged part of the blade continues. The submerged section of blade is the vortex core. The circulation ends at the air-water interface on the

partly submerged blade, so as a blade rotates from 12 o’clock toward reentry the circulation grows radially over the previously above-water blade section until, at complete blade submersion, the circulation continues off the blade tip with the tip vortex ending on the water’s surface at the reentry point. Circulation conservation demands this, and as the propeller blade leaves the interface then the tip vortex is stretched into a helical shape as the propeller rotates and advances. We can regard the entire dynamics of circulation after reentry as vortex stretching. There’s a velocity gradient along the blade span, which is the direction of the vorticity in the thin, turbulent boundary layer on the submerged portion of blade. For a fully submerged blade operating efficiently, the only air-filled cavity is simply the blade’s wake: there is the hollow tip vortex and also the vortex sheet from the trailing edge (which is unstable, and tends to roll up into a vortex line that combines with the tip vortex, given enough time) just as on a hydrofoil. Air is sucked into the hollow vortex core as the blade reenters the water and the tip vortex stretches, but the air in the vortex core doesn’t interfere with the propeller performance because both sides of the blade are fully wet with full circulation after reentry in the ‘base-ventilated’ case. The air-filled tip vortex is itself is a vortex sheet in the form of a tube, the circulation is necessarily the same about the tube as about the blade. The pressure is constant across a tube, and of course the vortex tube will tend to drag the entrained air into solid body rotation. Both blade surfaces are fully wet when submerged and produce normal propeller

efficiency. A quantitative approach to this problem would be difficult. The vorticity is confined to the thin, turbulent boundary layer on the blade where we can hope for little more than scaling for quantitative predictions of vortex stretching, if that much. Here’s evidence for base-ventilation and against supercavitation in high performance applications. Fig. 5 shows the low pressure sides of a 12x23 cleaver run on a 75 hp OMC motor on an EP Class race boat at 67 mph with most of the gearcase hub submerged. The exhaust exits the gearcase through the hub, as in fig. 2, but without the removable hub shown on the propeller in fig. 2. That is, the exhaust gas is not confined and is allowed to exit directly onto the entire blade surfaces, water pressure permitting. The restriction of the exhaust deposits to the region near the hub indicate that the blades run wet, not in an air-gas cavity. There is no supercavitation, and this type of exhaust deposit is typical for high performance boats powered by motors with through-hub exhaust (Classes D, E, G, J, and V). Beyond where the carbon deposits end aftward on the hub the gas is mixed with water in the vortex coming off the hub of the propeller. Louis Baumann, observed a case in the 1970s where the low pressure side of the blades emerged from a test run with exhaust streaks. Performance was not up to par. With the SST60 prop in fig. 2 the gearcase hub runs above the waterline. The reason for the slip-on hub on the prop is that the exhaust can ventilate into the vortex core where the blade near the hub protrudes through the water

surface and cause supercavitation, known in the pits as ‘blow out’.
Fig. 5 EP Class prop showing no exhaust deposits where the blades were wet. The physics of restarting the circulation is somewhat different when the propeller shaft and hub are completely above the water line. Figures 1 and 6 represent this case. Here, the circulation must be started anew with each reentry of a blade. The trailing edge must be submerged to obtain the thrust from circulation. The blade is the vortex core with one end of the vortex ending where the blade pierces the water near the hub. Once started, the tip vortex

stretches as the prop rotates and should end at some reentry point of the blade on the water’s surface. In this case both ends of the vortex provide opportunities for ventilation. We know from circulation conservation17 that to restart the circulation upon reentry, a trailing vortex of opposite circulation must be shed once per revolution. Upon reentry of the trailing edge the starting vortex should end on the air-water interface near the end of the blade and becomes the tip vortex. This is qualitatively like part of the ‘horseshoe vortex’ formed by both tips of an airplane wing3. Propellers built to run with small submerged fraction of blade area have three or four (or more) blades, so that one blade is always working while the next is reentering. Cupping the trailing edge helps to form the trailing vortex, hence helps to restart the circulation just as dropping the wing flaps helps an airplane to climb. Mathematically, we know that for a thin hydrofoil the lifting problem can be divided3 into a thickness problem with no lift, and a mean camber line as vortex sheet where all of the lift is generated. So, upon reentry of the leading edge, the thin blade can be approximated as a vortex sheet that develops increasing thrust with as it grows in extent until finally full circulation is obtained with trailing edge reentry. Fig. 6 shows an F200 Class boat with much less than 50% submersion of the blades. Note the helical wakes coming off the four blades upon exit of each blade. Propeller shaft RPM≈.93x motor RPM =7700, U≈100-110 mph on a short course. The starboard sponson is

slightly off the water’s surface with the motor trimmed under (the angle of attack of the propeller shaft is negative), reflecting rough water conditions.
Fig. 6 High shutter speed photo by David Alaniz. Acknowledgement I’m very grateful to Edgar Rose and Jim Booe for informative discussions and much encouragement, to Louis Baumann for allowing me to learn propeller work in his shop (Baumann Propeller, Houston, Tx.) in 1978-9, and to Louis Collins, Jeff Titus, and Carlton Callahan for help with some of the data, and to Bodo Bäckmo and John Calley for stimulating discussions. Thanks to Jim Nerstrom for the estimate of hp eaten
up by gears and the waterpump. Kevin Bassler encouraged me to write up the scaling results as a paper. References 1. APBA, American Power Boat Association Reference Book, 1985. 2. APBA, American Power Boat Association, Rules for Outboard Performance Craft and Drag Racing, 1982. 3. Newman, J. N., Marine Hydrodynamics, M.I.T., Cambridge, Mass., 1977. 4. Landau, L. D. and Lifshitz, E.M., Hydrodynamics, Pergamon, 1959. 5. Breslin, J. P. and Andersen, P, Hydrodynamics of Ship Propellers, Cambridge Univ. Pr., Cambridge, 2001 6. Du Cane, P., High Speed Small Craft, Temple Pr., London, 1956. 7. Gawn, R.W.L., Effect of Pitch and Blade Width on Propeller Performance, Trans, Inst. Of Naval Architects, 1952. 8. Schlichting, H., Boundary Layer Theory, McGraw-Hill, N.Y., 1955.

9. Gerr, Dave, Propeller Handbook, International Marine, 2001. 10. Wyman, D., Prof. Boat Builder Magazine, Aug./Sept. 1998. 11. Hadler, J.B. and Hecker, R., Performance of Partially Submerged Propellers, Naval Ship Research and Development Center Washington DC, 1968. 12. Kaman, P., Surface Piercing Propellers, Professional Boatbuilder Magazine, 1995; see also http://www.simplicity-marine.com/surfprop.htm. 13. Ferrando, M., Crotti, S., and Viviani, M., Performance of a Family of surface Piercing Propellers, http://www.icmrt07.unina.it/Proceedings/Papers/c/44.pdf. 14. Peterson, D., Sept. 2005. Surface Piercing Propeller Performance, Naval Postgrad. School, Sept. 2005. 15. Olofsson, N., Force and Flow characteristics of a Partially Submerged Propeller, Ph.D. dissertation, Chalmers Univ., 1996. 16. Califano,A., Dynamic loads on marine propellers due to intermittent ventilation, Ph.D. Thesis, NTNU, 2010:252. 17. Prandtl, L., Tragflügeltheorie, Königliche Gesellschaft der Wissenschaften zu Göttingen, 1918.
