scale formation in a walking-beam steel reheat...
TRANSCRIPT

Scale Formation in a Walking-Beam
Steel Reheat Furnace
Husein Abuluwefa
Mining and Metal1urgical Engineering
McGill University
February 1992
A thesis submitted to the Faculty of Graduate Studies
and Research in partial fuI fil ment of the requirements for
the Degree of Masters of Engineering
@ H. Abuluwefa, 1992

i
Abstract
In hot strip mills, in the steel industry, reheat fumaces are utilized to reheat slabs, billets,
blooms, etc., to uniform 1 :>lling temperatures prior to hot working.
During this reheating operation, hot steel surfaces react with the in-fumace oxidizing atmosphere
resulting in the formation of an iron oxides layer (scale). The yield loss due to this phenomenon
depends on fumace operating conditions, Le. steel temperature, excess combustion air, steel
residence time in the fumace, etc., and ranges between 1.5 to 3% of reheated steel.
In this research, the oxidation of a mild steel during reheating cycles as a function of fumace
atmosphere, steel residence time in the fumace and steel temperature was investigated.
ft has been found that scale formation was most sensitive to oxygen levels in the furnace, steel
residence time and temperature. A saving of up to 35 % of steel lost to scale was achieved by
reducing the excess air in the fumace from 70% to 20%. Also, longer residence time and
higher temperatures of the steel in the fumace resulted in the formation of excessive amounts
of scale.

,
Il
En sidérurgie, des fournaises sont utilisées pour réchauffer des brames, des lingots et des
billettes, avant le laminage à chaud, afin de porter l'acier à la température de travail à chaud.
Au cours de J'opération de chauffage, les surfaces chaudes de l'acier réagissent avec
l'atmosphère de la fournaise pour former une couche d'oxyde de fer (calamine). Les pertes de
produC"tion dues à ce phénomène dépendent des conditions d'opération de la fournaise (Le. la
température de l'ader, l'excès d'air de combustion, le temps de résidence dans la fournaise,
etc.) et varies entre 1.5 et 3% de l'acier réchauffé.
Dans la présente étude, l'oxydation d'acier doux dUP.m des cycles de chauffage a été étudié en
fonction de l'atmosphère de la fournaise, du temps de résidence de l'acier dans la fournaise et
de la température de l'ac..ler.
Il a été démontré que la formation de calamine était particuHèrement sensible au niveau
d'oxygène dans la fournaise, au temps de résidence et à la température de l'acier. Les pertes
d'aciers dues à la calamine ont pu ~\"e réduites jusqu'à 35% en diminuant l'excès d'air de
combustion dans la fournaise de 70 à 20%. De plus, les temps de résidence plus long ainsi que
des températures plus élev~.es ont résulté en des formations importantes de calamine.

1
iü
Acknowledgements
1 would like to express my gratitude to my supervisor, Professor R. 1. L. Guthrie for his
encouragement, guidance and support of ail kinds. 1 would aIso like to take this opportunity to
give my special thanks to my team mates whom without this work would have been impossible.
Thanks go to F. Dallaire, Dr. J. Kozinski and V. Lee, for their tremendous help in conducting
the industrial experiments and for their willingness to go the extra mile. ,'~lso thanks go to Prof.
F. Mucciardi for his guidance and support and his availability and openness to discussions at all
times, Prof. G. Caraynnis for his helpful suggestions, help and advice. 1 am also grateful to J.
Peace for her considerations and good administrative work. 1 would also like to thank L.
Meissenheimer for her help with the departmentaJ. aspects.
Also 1 would like to express myappreciations to the workers of Dofasco Steel Company for
their allowance and immeasurable help of ail kinds to do the work at their company and to use
their facilities. These people are, S. Olynyk for her support, encouragement and good ideas to
conduct the industnal experiments, D. Jones and T. Kerr for their permission to interact with
the mdustrial world, P. Moligan for his patience and hard work in conducting the industrial
experiments, D. Diluca for his arrangements and organisations of the experiments, D. Miller
for his helpful suggestions and his design of sample retriever, B. Kent for his good talent in
fumace control and providing required fumace operating conditions, P. Linkert for his help in
getting things done, B. Nelson for his help at the Dofasco Research and Development Centre,
M. Creechan for her good guidance and instructions on the use of Dofasco's laboratory
equipment, M. Burke for his good work on the Scanning Electron Microscope (SEM).
Also, thanks go to my fellow students at the Depanment of Mining and Metallurgical
Engineering for their helpful discussions and ideas.
1

1
IV
TABLE OF CONTENTS
1. INTRODUCTION . .. ................... .................. 1
2. LITERA TURE REVIEW . . . . . . . . . . . . . . . . . . . . . . . . . . . . . . . . . . . . .. 4
2.1 INTRODUCTION . . .. . . . . . . . . . . . . . . . . . . . . . . . . . . . . . . . . .. 4
2.2 THERMODYNAMICS AND CHARACTERISTICS OF IRON OXIDES . .. 5
1.2. 1 Wustite , . . . . . . . . . . . . . . . . . . . . . . . . . . . . . . . . . . . .. 5
2.2.2 Magnetite .................. ................. 9
2.2.3 Hematite . . . . . . . . . . . . . . . . . . . . . . . . . . . . . . . . . . . .. 9
2.3 THE OXIDATION OF METALS .......................... 10
2.3.1 Simplified Trealtment of Diffusion Controlled Oxidation . . . . . .. 10
2.3.3 Wagners Theory of Oxidation ..................... " 12
2.4 THE OXIDA TION OF PURE IRON . . . . . . . . . . . . . . . . . . . . . . .. 18
2.4. 1 Oxidation Mech.anism ........................... 18
2.4.2 Effeet of Temperature ............................. " 22
2.4.3 Effeet of Oxidizing Atmosphere . . . . . . . . . . . . . . . . . . . . .. 2S
2.4.3.1 Effeet of Oxygen .. . . . . . . . . . . . . . . . . . . . . . .. 25
2.4.3.2 Effeet of Water Vapour and Carbon Dioxide . . . . . . .. 25
2.5 OXIDA TION OF STEELS .............................. 27
2.5.1 Effeet of Alloying Elements on the
Oxidation Rate of Steel . . . . . . . . . . . . . . . . . . . . . . . . . . . . . .. 18
2.5.1.1 Effeet of Carbon ......................... 28
2.5.1.2 Effeet of Other Alloying Elements .............. 29
2.6 SCALE FORMATION IN REHEAT FURNACES .............. " 31
2.6.1 Rl"4ctions and Heating in a Reheating Process ....... . . . . .. 32

1
1
v
2.6.2 Oxidation of Steel in Combustion Products . . . . . . . . . . . . . .. 35
2.6.3 Scale Free Heating . . . . . . . . . . . . . . . . . . . . . . . . . . . . .. 40
3. EQUIPMENf ........................................... 42
3.1 INTRODUCTION . . . . . . . . . . . . . . . . . . . . . . . . . . . . . . . . . . .. 42
3.2 OBJECTIVES ...................................... 43
3.3 FURNACE DESCRIPTION. . . . . . . . . . . . . . . . . . . . . . . . . . . . .. 43
3.4 EXPERIMENTAL SET-UP . . . . . . . . . . . . . . . . . . . . . . . . . . . . .. 45
3.5 SAMPLE AND SLAB TEMPERATURE MEASUREMENTS 50
3.5.1 Thermophil-Stor Type 4468 ................. ,...... 50
3.6 PLANIMETER ..................................... 50
3.7 SCANNING ELECTRON MICROSCOPE (SEM) ................ 51
3.8 EXPERIMENTAL PROCEDURE ......................... 52
4. PRE-TRIALS AND MONITORING OF EXPERIMENTAL PARAMETERS . . . .. 56
4.1 INTRODUCTION . . . . . . . . . . . . . . . . . . . . . . . . . . . . . . . . . . .. 56
4.2 PRE-TRIAI..S . . . . . . . . . . . . . . . . . . . . . . . . . . . . . . . . . . . . . .. 57
4.2.1 Sample Retrieval from the Furnace . . . . . . . . . . . . . . . . . . .. 57
4.2.2 Sample Size . . . . . . . . . . . . . . . . . . . . . . . . . . . . . . . . .. 58
4.2.3 Sample Preparation ............................. 59
4.2.3.1 Methods of Sam pie Cutting .................. 59
4.2.3.2 Sample Surface Grinding . . . . . . . . . . . . . . . . . . .. 61
4.2.3.3 Sample Insulation . . . . . . . . . . . . . . . . . . . . . . . .. 63
4.2.3.5 Sample Contact With Test Slab ................ 64
4.3 FULL TRIALS ..................................... 64
4.4 MONITORED EXPERIMENTAL PARAMETERS ............... 64
4.4.1 Fuel Composition .............................. 65
4.4.2 In-Fumace Atmosphere . . . . . . . . . . . . . . . . . . . . . . . . . .. 65
4.4.3 Air and Fuel Flow Rates . . . . . . . . . . . . . . . . . . . . . . . . .. 65
4.4.4 Sample and Slab Temperature .... . . . . . . . . . . . . . . . . . .. 65

VI
5. DATA PROCESSING ...................................... 67
5.1INTRODl.JCTION . . . . . . . . . . . . . . . . . . . . . . . . . . . . . . . . . . .. 67
5.2 CALCULATIONS OF THE EFFECTIVE AIR RATIOS . . . . . . . . . . .. 68
5.3 METRODS FOR EVALUATING SCALING RATES ..... " ...... 71
5.3.1 Oxygen Weight Gain ............................ 71
5.3.2 Reaction Parabolic Rate Constant . . . . . . . . . . . . . . . . . . . .. 71
5.3.3 Calculatlons of the Arrhemus plot .................... 73
5.3.4 Oxidized Steel D':pth ., . . . . . . . . . . . . . . . . . . . . . . . . .. 74
5.3 5 Percent Steel Loss Due to Scaling .................... 75
6. DISCUSSION OF EXPERIMENTAL CONDITIONS AND RESULTS ........ 78
6.1 INTRODUCTION . . . . . . . . . . . . . . . . . . . . . . . . . . . . . . . . . . .. 78
6.2 CONDITIONS OF TRIALS . . . . . . . . . . . . . . . . . . . . . . . . . . . . .. 79
6.2.1 Air and Fuel Flow rates .......................... 79
6.2.2 Fuel Composition .............................. 80
6.2.3 Furnace Atmosphere . . . . . . . . . . . . . . . . . . . . . . . . . . . .. 80
6.3 DISCUSSION OF THE OXIDATION OF MILO STEEL FOR
INOIVIDUAL TRIALS ............ ,........ 85
6.3.1 Gas Components in the Furnace . . . . . . . . . . . . . . . . . . . . .. 85
6.3.2 Temperature and Oxidation Rates . . . . . . . . . . . . . . . . . . . .. 92
6.3.2.1 Oxidation Temperatures . . . . . . . . . . . . . . . . . . . .. 92
6.3.2.2 Parabolic Rate Constants and ArrhenIUS
Plots ...................................... 96
6.3.2.3 Oxidation Rates . . . . . . . . . . . . . . . . . . . . . . . . .. 96
6.3.2.4 Sample's Residence Time in the Furnlce .. "...... lOI
6.4 COMPARISON OF OXIDATION RATES. . . . . . . . . . . . . . . . . . .. lOI
6.4.1 Oxygen Weight Gain and Steelloss .................. lOI
6.4.3 Parabolic Rate Constants ....................... " 106
J 6.5 SCALE STRUCTURE . . . . . . . . . . . . . . . . . . . . . . . . . . . . . . .. 110
6.5.1 General Characteristics of Scale .... , . . . . . . . . . . . . . . .. 110

1
1
6.5.1.1 Development of Scale Cracks ............... .
6.5.1.2 Development of Scale Voids and Microchannels
vu
112
115
7. CONCLUSIONS AND SUGGESTIONS FOR FUTURE WORK ........... 118
7.1 INTRODUCTION. . . . . . . . . . . . . . . . . . . . . . . . . . . . . . . . . .. 118
7.2 CONCLUSIONS. . . . . . . . . . . . . . . . . . . . . . . . . . . . . . . . . . .. 119
7.3 SUGGESTED FUTURE WORK . . . . . . . . . . . . . . . . . . . . . . . . .. 121

1
:"
FIGURE
(2.1)
(2.2)
(2.3)
(2.4)
(2.5)
(2.6)
(2.7)
(2.8)
PAGE
(6)
(7)
(8)
(9)
(11)
(13)
(19)
(21)
VIii
LIST OF FIGURE...'i
Ellingham/Richardson diagram for sorne oXldes of Importance ln
in the high temperature oxidatton of metals and alloys. Per
KofS(Q(i,
Approximate percentages of FeO, Fe20 1 and FeIO~, Sachs
and Tuck',
The iron-oxygen dmgram, Per KofSIa(l.
NonstOichlometry ln wustlte, y m Fel yO, as a functlon of
temperature and partIal pressure of oxygen, Per Kofwad and
Zeev Hec!.
Simplified model for diffusion control oXldatIon, Birks and Meler
Diagram of scale formation according to Wagner's m-xlel, Blrh
and Meler
Metal 10ss of pure Iron In oxygen at 1100 oC, Sach\'
and TucJc1.
Oxidauon mechanism of iron to form a three-layereJ scale of FeO,
~---------------------------

(2.9) (23)
(2.10) (24)
(2.11 ) (27)
(2.12) (29)
. (2.13) (32)
(2.14) (34)
(2.15) (35)
(2.16) (36)
(2.17) (37)
IX
F~04 and F~03 above 570 oC, showmg diffusion steps and
interfacial reactions, from B"ks and Meier
lsothermal curves for the rate of increase in weigh t of irclO o)jdized
in oxygen, taken from Da v/es , Simand and Birchenalf/.
Relation between rate-constant and temperature for the oxidation
of high-punty Iron. x Davles. Slmand and Blrchenall; 0 Schmahl,
Baumann and Henck. Taken from Kubaschewski and Hopldnl
OXldation of pure iron, from Sachs and Tuc/é
Effect of increasing amounts of carbon on sca1ing rates, From Cook
and Rasmussen:!o.
EqUllibrium products of combustIOn of natural gas related to
percentage theoretical combustIon au, From Cook and Rasmussen20•
Theoretlcal adlabatlc flame temperature wlth alr/gas ratio, From
Cook and Rasmussen:o.
Adlabatic flame temperature for combustion of natural gas in
preheated alr, From Hemsarhe and Vereecke 22•
Equilibrium temperature at which various gas ratios of CO/CO and
H20/H2 are neutraI to iron, From Cook and Rasmussen20
Influence of aIr combustion coefficient on amount of scale
formed at specimen temperature, oC, of: a 1200, b 1100, c 1000,

(2.18) (38)
(2.19) (39)
(2.20) (41)
(3.1) (46)
(3.2) (47)
(3.3) (51)
(3.4) (52)
(3.5) (52)
(3.6) (53)
J (4.1) (56)
x
d 900, figures on curves give grade of steel, from Minaev,
OZ'Shanskii, VoZkova and Shurova15•
Influence of different gaseous fuels on amount of scale formed at:
a T=1250 oC, b T= 1200 oC, c T= 1100 oC, d T= 1000 "~Co
Quantitative effeet of aIr/gas ratto on the scaling rates of AISI 1030
carbon steel, at constant temperatures, from Cook and Rasmussen10•
Heating stages to produce scale-free heating of steel, From Cook
and Rasmuss1!n10•
Schematic illust.ration of five zone walking-beam reheat fumace.
Schematic illustration of expenmental set-up.
The Allbrit Planimeter instrument used to measure the irregular
scale surface area.
A water cooled sampling probe inserted through the fumace side
wall.
Six insulated steel samples placed on top of a test slab just before
charging into the furnace.
A picture showing the sam pie retriever through the fumace side
window.
Sample retriever design utilized to extract steel sampI es from the

(4.2) (58)
(4.3) (60)
(6.1) (79)
(6.2) (80)
(6.3) (81)
(6.4) (82)
(6.5) (84)
(6.6) (85)
(6.7) (86)
(6.8) (88)
1 (6.9) (89)
xi
fumace, by Don Miller.
The difference in the amount of scale formed on the actual slab
and samples of different sizes.
Scaling rates for samples of normal and ground surfaces.
Air and fuel flow rates (Nm3/hr) for (a) the charge zone, and (b)
the intermediate zone.
Air and fuel flow rates (Nm3/hr) for (a) the soak zone, and (h) the
entire fumace.
On line analysis of fuel mixture gas composition.
In-fumace measurements of O2, CO2 and CO.
Effective stoichiometric/actual air ratios for all the experiments
In-fumace measurements of O2, CO2 and CO for the lowair/fuel
ratio experiments in the intermediate zone.
In-fumace measurements of O2, CO2 and CO for the lowair/fuel
ratio experiments in the soak zone.
In-fumace measurements of O2, CO2 and CO for the high air/fuel
ratio experiments in the intermediate zone.
In-fumace measurements of O2, CO2 and CO for the high air/fuel
ratio experiments in the soak zone.

(6.10) (91)
(6.11) (92)
(6.12) (93)
(6.13) (95)
(6.14) (96)
(6.15) (100)
(6.16) (101)
(6.17) (102)
(6.18) (103)
(6.19) (105)
(6.20) (106)
(6.21) (107)
XII
Thennophil-Stor temperature measurements of sample and test slab
going through the reheat fumace.
Oxidation rates and temperatures for low oxygen experiments.
Oxidation rates and temperatures for high oxygen experiments.
Arrhenius plots for low oxygen experiments.
Arrhenius plots for high oxygen experiments.
Calculated values of H20, O2 and CO2 for 10% and 50% excess
air, using in the calculatIons the actuaI fuel composition values for
low oxygen and high oxygen experiments.
Samples waIking rate through the fumace for the low oxygen
experiments.
Samples waIking rate through the fumace for the hlgh oxygen
experiments.
Comparison of oxidation rates among low and h igh ox ygen
experiments.
Oxidized steel depth for low and high oxygen experiments.
Percent steelloss for low and high oxygen experiments.
The parabo1ic rate constants for aIl low and high oxygen
experiments.

1 (6.22)
(6.23)
(6.24)
(6.25)
(6.26)
1
(109)
(111)
(112)
(114)
(115)
xiii
A typical scale microstructure with its three phases, wustite (FeO),
magnetite (Fe304) and hematite (Fez03)'
Scale microstructure for low oxygen experiment.
Scale microstructure for high oxygen experiment.
Schematic representation of the formation of scale porosity at the
metal-oxide interface, from G. B. Gibbs and R. Hales.
Schematic illustration of the model for formation of microchannels
in oxide scale by preferential outward diffusion of metal iD mv grain boundaries, from Per Kofstad

TABLE
(2.1)
(2.2)
(2.3)
(2.4)
(5.1)
(5.2)
(5.3)
1
(20)
(26)
(30)
(40)
(68)
(68)
(70)
XIV
LIST OF TABI ... FS
Rate constants obtained experimentally for the self-diffusion of iron
in FeO, FCJ04 and F~03, taken from Kubaschwaski and Hopkins?
Rate constants for the oxidation of iron in oxygen obtained
experimentally by Rahmel and Engell16
Composition of steels considered.
Composition of fumace atmosphere used in the ex peri mental
oxidation of iron and mild, En 8, En 16 steels, From Sachs and
Tuclè'.
Typical five minute sample of air and fuel flow rates collected from
the industrial fumace (flow rates are in Nm1/h).
Five minute sample calculations of air ratios, (flow rates are
in Nm3/h).
Sample calculation of weight gain per surface area.
Note: For calculations in column number 5, it is assumed that
scale composition is 95 % FeO, 5 % Fe]04 and that the two oxidf's
consist of the stoichiometric value of oxygen, i.e., 22.26% atOlTn:;
oxygen in FeO and 27.64% atomic oxygen in FfJ04'

1
(5.4)
(5.5)
(5.6)
(6.1)
(72)
(74)
(75)
(P3)
xv
Sample calculation of the parabolic rate constant.
Measurement of scaIe density and the conversion factor, F.
Calculations of percent loss of steel due to scaling for a trial.
Chemical composition of steel.

1
CHAPTER
ONE
INTRODUCTION
Reheat furnaces and soaking pits, in steel plants, are used to heat slabs, bloom~, billets and
ingots to a uniform rolling temperature pnor to hot workmg. Nowadays, soaking pib, wlw .. :h ,m:
batch units, are being constantly replaced by reheat fumaces, especmlly In steel plants wlth hlgh
production rates. Reheat furnaces can be classified as batch type or contInlluu,) type ('OIl!lllliOll)
type include pusher, rotary~hearth, walkmg-b(;am and roller-hearth type fllrnaces. In ,dl of tht:<ic,
walking~beam reheat fumaces are consldered "state of the art". These fumaces are omx:t-tïrcd
with the fuel bemg eaher natural gas, coke oven gas, synthetlc gas ( a mixture of methanc gas,
air and coke oven gas), blast fumace gas or fuel 011.
The walking-beam reheat furnace under investIgation, described in detail in Chapter Thrcc, I~
used to reheat slabs of different sizes. The steel slabs can be charged at di ffcrcnt tcmperatures,
Le., warm (directly from the continuous caster), ambient temperature (from the ~Iab yard)
or/and mixed. The thickness of the slabs in most cases is constant. A wlde vanctv of ')t'~el .,

1
1
1 IN I1tOU!;C'110:'li 2
grades IS also common.
As the slabs are walked through the furnace, their temperatures rise. However, the rate of
temperalure increase depends on the firing rates in the individual 70nes of the fumace. In the
carly stages of rcheating, the slabs are exposed to low heating rates to avoid the development
of thermal stresses. The slabs are then exposed to intense heatmg up to the soak zone, where
soaking temperatures are maintained to achieve a uniform slab temperature for subsequent
rolling.
As the steel surface temperature rises, it reacts with the fumace oxidizing atmosphere (02, CO2,
H20, etc.) producing an oxide layer (scale layer). The thickness of the scale layer depends on
slab resldcnce lime ln the furnace, its surface temperalure, the aggressiverless of the oxidizing
atmosphere, etc .. The loss of steel due to scaling typically ranges between 1 and 3 % of
approxlmately 27 cm thlck slabs being reheated, dependmg on the above parameters.
There are a number of advantages and disadvantages to scale formation on slabs. The advantages
ar\!: (1) scale eliminates surface defects such as impunties of mou Id powder embedded in the
surface from the contll1uous caster, oxides and surface cracks, and hence results 111 ~mooth and
c1ean steel surfaœ, (2) the heat glven-off to the steel dunng the oxidation process (exothermic
reactions), wlllch accounts for about 2 to 3% of total heat input and (3) the scale layer reduces
the heat flux from the slab to the envIron ment (due to its lower thermal conduclIvity) when the
slabs are transported to the rolling mill. The disadvantages of scale formation include: (1) steel
10ss representing a mass 10ss between 1 to 3 % of the slab depending of furnace operating
conditIons and slab thickness, (2) scale pile-ups lnslde the fumace and slab transporc path whlch
reqlllfcs a furnace shut-down pcnod for clealllng and (3) hindered heat transfer from the fumace
cnvlronmcnt IIHO the steel. ncœssltatlng longer heatll1g cycles.
It is important then to minllTIlZe scale formatIOn during reheating to a level to which it is
advantageolls. ThiS of course reqllires a full investigation of all relevant parameters in the
operation of the fumace. However, because of the complexity of the process, Le., industrial

,
1. INTRODlICTION
conditions, and time constraints, a thorough investigation of ail parameters was not possIble 111
the present work. Consequently, in this thesls. the work was limited to the followlllg. (1) .ur/fuel
ratio and its effect on scale formatIon and (2) slab resldence time in the fumace ,1t dlfferent
furnace locations. The work also involved a number of pre-trIals 111 order to develop ,1 procL\dllr~
for the full trials.
In summary, the objective of this research was to IOvestigatc scalc formatIon of a partlcular :-.teel
grade in an industrial steel reheat fumace. The aim was to gaIn knowledge on the Important
parameters affecting scale formation In practlcc and hence ta control its form~tlon to a Icvcl
where it is advantageous.
In thlS thesls, Chapter Two presents a literaturc review on the oXldatlOn of Iron and somc stecls
of interest with the aid of sorne general mathematical treatments for the oXldation of m~tal'i, The
emphasis IS put on the work that relates directly or indirectly to steel oXldatlon III rcheat
fumaces. Chapter Three presents the objectIves of thls work In more dctalls. pWl'cdures and
equipment for the trials. Chapter Four presents the cxpcnrncntal mcthoJology ,lIld u..,c of
equipment. In Chapter Five, the analytlcal techl11ques and data rrocclislllg arc con'lldered The
discussion of the results are presented In Chapter SIX. followed by conClllSlOn'i alld )lIggc'Itl'd
future work In Charter Seven,

1 CHAPTER
TWO
LITERA TURE REVIEW
2.1 INTRODUCTION
Thcre has been no shortage of research into the isothermal oxidation of iron and steel since the
1920's. The kind of work conducted can be divided into three parts, (1) the study of the
properties of iran oxides, in particular wustite (FeO), (2) oxidation mechanisms under isothermal
conditIons and constant oXldlzing atmospheres and (3) the effect of alloying elements on the
oxidation of steel. However, very httle work has been done on the oxidation of iron and steel
ln cornplex atmospheres and at dlfferent heating rates approximating those in a reheat furnace.
ln thl ... chapter, a Ilterature review on the charactenstics of iron oxides and their properties, the
mathcmatlcal Ircatmcnt of rnetal oXIdatlon, especIalIy Iron, and the high temperature oxidatIon
charactenstics of Iron and sorne steels under tixed conditions, such as temperature and oxidizing
atmosphcre, IS presented.
BCCJlISC of the wide range of studies undertaken on various steels, only work on those steels
of interest was considered. The emphasls was placed on work that related, directly or indirectly,
to the oxidatlon of stcels III industrial reheat flIrnaces.
4

1
1
2 LITERA TURE REVIEW 5
2.2 THERMODYNAMICS AND CHARACTERISTICS OF IRON OXIDES
When the surface of pure iron is in contact with an oxidizing atmosphere at high temperature.
an oxide layer cOJJsisting of wustite, magnetite and hematlte, forms. This can be bt'st I1111~trLlted
by the weIl known Ellingham/Richardson dlagram, Figure (2.1), Per KofsllId'. The stable oXHks
of iron form, respectively with increasmg temperature and oxygcn partial pressure, a(conhng
to the reactions:
(2.1)
2 Fe + Oz ::; 2 FeO (2.2)
(2.3)
(2.4)
It can be seen that iron oxidlzes at very low oxygen partial pressures. e.g. at a tClllperature of
800 oC, equation (2.2) io:; at equihbriu1l1 wlth an oxygen partial pressure of 2 x 10- 1'1 atlll.
At temperatures higher than approximately 600 oC, the percent compositIon of the thrcc oXldcs,
wustite, magnetite and hematite are about 95, 4 and 1 % respectively, Figure (2.2), Tylecoll! and
Mitchell2, Sachs and Tuc!!.
2.2.1 Wustite
Wustite is the inner most phase of the scale which forms next to the metal and IS the mmt lf('n
rich. Wustite, nominally represented as FeO, is a p-type conductor and is not stable bclow

approximately 570 oC, Himmel, Mehl and Birchenall". The density of wustite is about
5.87 g/cm3, Samsonov.
10 • 10'" ~ ~l 'Poo.a ----------~ ....... -.,..----~-------8rO/;JCO~
1 1
-so 10"
, 10' -
102
10"
H c
~
"
..... 10" 2
cr " Ir/' " ~
~ 10.1•
Po~: 10 atm.
TEMPERATURE, ·C 10'2(
500 1000 1500 2000 ·OK
°CC/PCCI IOl~ 10 20 lOIS
PHzlP"zO-, 10 10 10 " 10
lOlO lOlO IO'~ Pol,·'m, 10.100 lO'~O 10' lD 10- 24
Figure (2.1) Ellingham/Richardson diagram for some oxides of importance
in the high temperature oxidation of metals and alloys, Per Kofstad1•
6

•
J
2 LITERA IUR!: RLVILW 7
The wllstite phase IS highly metal deficlent. Fel )0. with Its defect structur~ ~nl11mo!ll\'
interpreted in terms of dOUbly charged iron ion vacancies wlth an cqulvalcnt n1ll11b~r uf ~kctroll
defects.
As a consequence, diffusion is essentmlly cationlc via vacant cation sites. l'l'r KI!!'!(/d iI"d 7('1'\'
Heet. Kubaschewskl and Hopkl11s 7, Blrks and Meler~. WustIte CXIstS as a thcrnllldynallll~ally
stable. smgle phase structure, over a \VIde range of composItIOn. The non-"tolL'hllllll\~try 01
wustite 1I1creases with increas1I1g temperature and docs not scem to rcach thc '.tl1lL'hllllllctrIl'
composition FeO, Figure (2.3).
jO~
1
1
~Ol-
1 !O~
1 :01-
ri 1 ~Ol-
1 1
101-
1 401-
loL zoL
1
10
r-----__________ F~û
Figure (2.2) Approximate percentages of FeO, Fe20 J and Fe30 .. , Sachs und TIICkl •

1
1
8 l Lrrl.RA 11JRI, lU VII,W
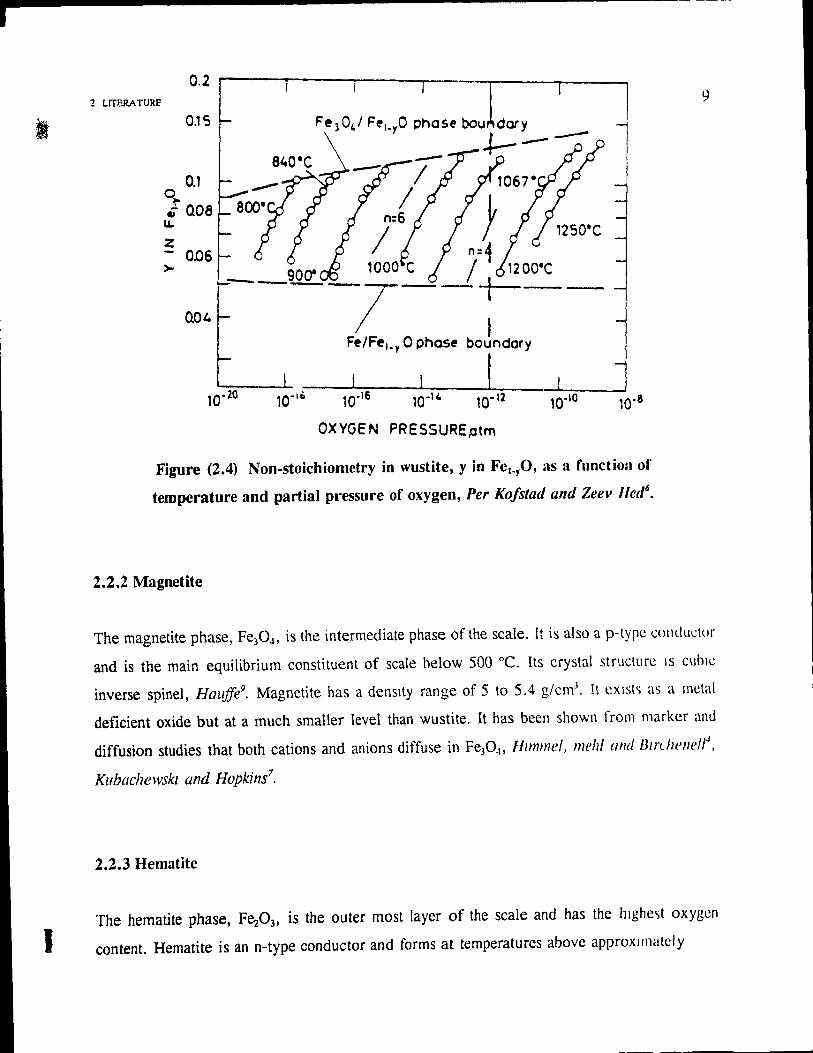
The non-stoichîometry as a function of temperature and oxygen partial pressure has been the
subJect of several investigators, and the results of various studies are in good agreement,
Figure (2.4), Per Kofstad and Zeev Hecf.
10
'1600 ~IqUld. Iron ltquld oXlde -~:lIL""":--=-"":"~ Clqu/d ox/de
u • • ~ Magnetite w • "-cr Wust/te "-::> " r- " 4: --------cr 1000
f w Magnet/te Q..
l: •
-12 HematIte UJ P02 = 10 atm r-
800 a-Fe
-------
600
a,- Fe. MagnetIte
400 22 28
WEIGHT el. OXYGEN
Figure (2.3) The iron-oxygen diagram, Per Kofstad1•
1
1
2 LITBRA TURE
0.2 I--r--,------,.---'ï--~----..
F.,O" F.,.,O phaso boJdary 1 II O.1S
0.1 0,.. t a08
IL
z 0.06
>-
.+------840·C ----
Il 1067'
/ } 1250'C
n:4 _ 900- 1000 C / 1200·C --- +-
004 - 7-- 1 --Ft/Fei_Y 0 phast boundary
OXYGEN PRESSUREptm
Figure (2.4) Non-stoichiometry in wustite, y in Fet_yO, as a l'unctioll of
temperature and partial pl4essure of oxygen, Per Kofstad and Zeev lIed6
•
2.2.2 Magnetite
9
The magnetite phase, Fe304' is the intermediate phase of the scale. It is also a p-lype I.:onductor
and is the main equilibrium constituent of scale below 500 oC. Hs crystal structure IS cublc
inverse spinel, Hauffe9• Magnetite has a denslty range of 5 to 5.4 gl cm3• ft ex lst<; as a mctal
deficient oxide but at a much smaller level than wustite. It has been shown from markcr and
diffusion studies that both cations and anions diffuse in Fe30.l! Hunmel, meh! (lml Blnhellefr,
Klibache~vski and Hopkins 7.
2.2.3 Hematite
The hematite phase, F~03' is the outer most layer of the scale and has the hlghe5t oxygcn
content. Hematite is an n-type conductor and forms at temperatures above approxlJllatcl y

1 2 LITI:RA'/I/RE REVIEW 10
800 oc. It exists in two forms, (1. -J-eZU3 which has a rhombohedral structure, and y -Fe2U3 ,
which is cu bic, Birks and Meier. The density of hematite is about 5.24 g/cm3• Diffusion in
hematlte iJ mainly by the migration of anions, Kubachewski and Hopldns7, Rimmel, Mèhl and
Birchenelt, Giryburg/O.
2.3 THE OXIDATION OF METALS
Before considering the oxidation of iron and steel, it is worthwhile presenting a general review
of the mat~elllaticai developments in the oxidation of metaIs.
When an oxide layer forms on a metal surface, its growth, in the absence of any porosity,
microchannels or cracks, continues by the inward or outward migration of anions, cations or
both. This is Independent of whether the controlling step of the growlh is the chemicaI reaction
at one of the reaction interfaces, i.e., metal-oxide or oxide-gas, or the rate of the diffusing
species through the oxide Juyer. Wagner presented in 1933, what has now become a widely
accepted theory on the oxidation of Illetals. In his theory, which is applicable to the oxidation
of any metal, he assumed that oxide growth is strictly controlled by the diffusion of one IOn,
anion or catIOn, with the transport of electrons in the opposite direction to keep electonelltrality
through the growing oxide layer. Before summarizing Wagner' s theory, a simplified treatment
is givcn for the diffusion controlled lllecha!1lsm of oxidation.
2.3.1 Simplified Treatment of Diffusion Controlled Oxidation
With the assulllption that transport of ions through the oxide layer is the controlling mechanism
for oXldatlon and that chemical equilibrium i~ ';.)lablished at reaction interfaces, the process can
be analyzed as follows, Blrks and Meier. ;'he outward cationic t1ux, j M2" , must be eqllal and

2 LITERATURE REVIEW
opposite in direction to the inward vacancy flux, i VIl ' Figure (2.5).
Thus
,.. .... Sa •• G ..
<:'110"'
ClllOn wlCIIIC'"
M. MJ· .2.- Electrone MJ' .2.- • ; 0, • MO or Of
M .02-. MO • 2.-AnION ,OJ • 2.-· 0 2-
•
Figure (2.5) Simplified model for diffusion control
oxidation, 8irks and Meier.
11
(2.5)
Where Dy" ' .x , Cil v. and C' v" are the diffusion coefficient, oxide layer thickncss and
vacancy concentrations at scale-gas and scale-metal interfaces respectivel y.
Since thermodynamic equilibrium is assumed at the interfaces, the value ( Cil Vu - Cl V,II) is
constant and thus
f

1 2 l.I1l!RA fURI! RHVIEW 12
(Cil - Cl ) . dx D VII VAl Jy = COnst. - = V -----''---....:;...
AI dl AI X (2.6)
Taking , Le.
dx kl
dt x (2.7) -=-
Integrating the above equation from x=O at t=O to x=X at t=t, we get
x2 = 2klt (2.8)
Which is the common parabolic rate constant.
2.3.3 Wagner's Theory of Oxidation
Wagner's theory provides a mathematical treatment for the oxidation of metals. Even though it
is one of the more famous theories, it is nonetheless relatively simple. The conditions for which
the theory applies, Figure (2.6), 8irks and Meier~, are as follows:
(1) Oxidation proceeds only by the transport of one ion, cation or anion, with the transport of
an equivalent number of electrons in the opposite direction, through the oxide layer.
(2) Chemical equilibrillm is established throughout the scale and at reaction interfaces.
(3) The oXlde phase shows negligible deviation From stoichiometry.
(~) Oxygen Solllbllny in the metal is neghgible.
(5) The thickness of the scale does not alter the effectiveness of space charge.
(6) The oxide phase is compact and does not contain any porosity, microchannels or cracks.
1 (7) The oxide layer IS perfectly adherent.

1
2 LITERATURE REVr.::W
"'~I o •• G .. .. MO 0, c.ltOM _
A,,!Ont
ElectlOM
.... -1 ........ ".
'''''''' /-/ ......
p • 0,
(A". ) 1_./· ...........
p' ~"O 1"'" .. 1 O,) .. .,-"P If'
.. -.. ,. ·2.or
... 0"· MO. 2,-
.. 2 •• 2,- • ,°1 • MO , or ,0,.2'-·0'-
0-... ,.-chon: 2M • 0, • 2MO. 6G:'0
Figure (2.6) Diagram of scale formation according
to Wagner's model, Birks and Meier.
Since equilibrium is established at the reaction interfaces, metal ions and oxygcn ions will tend
to migrate across the oxide layer in opposite directions and because of the charge of ions, an
electric field will be set up across the scale resulting in the migration of electrons from the mctal
to the atmosphere to provide neutrality in the oxide phase.
Chemical and electrical potential gradients across the sc ale will exist as a result of the charged
ions providing the driving force for ionic migration.
The force acting upon a charged partic1e, i, (joules particle-! cm-!) at any location in the scalc
where chemical and electrical potentials are present is expres'icd by

1
1
2 LITHRATUIΠREvmW 14
(2.9)
h"" a~i ~ w \O;re - , - , N. , Z , F ax Ox " 1 are the chemical potential, electric potentiaI,
Avogadro's number, particle charge and Faraday constant respectively.
Moving through an ionic lattice under a constant force, an ion rapidly assumes a constant
velocity known as the terminal drift velocity. The value of the terminal drift velocity when the
ion is acled on by unit force is known as the mobility, B., of the species. Therefore, the flux of
i (particle cm-2 S-I), acted on by the force given in equation (2.9), is
. c,B, a"" LZFa4» Ji= -(- r
NA ax 1 ax
where c, is the concentration of i in particle cm-).
The mobility and partial conductivities of particles, i, are related by
a. cB = --'
" 2 2 Z,e
(2.10)
(2.11)
Where 0 l ' e are the partial electrical conductivity and electronic charge respectively.
Hcnce
. _ (Ji (a"" ZF a4» J-----+ -1 Z2F2 ax 1 ax
1
(2.12)

J
2 LITERA TURE REVœW 15
Equation (2.12) describes the flux of cations, anions, or electrons through the oXlde layer. Due
to their different mobilities, different species would tend to move at different rates, however,
this would set up an dectric field tending to oppose this independence. The rates of migration
are dictated by the necessity to maintain electroneutrality throughout the scale. The predominant
mobile species in oxides are catIons and electrons. Takmg Ze' Z~ and je as the cation
charge, electron charge and cation flux respectively and knowing that for clectroneutrality the
condition
(2.13)
must be met, the cationic flux is expressed as
(2.14)
The ionization of a Metal, M, is represented by , and hencc at eqllllibrium
(2.15)
From equations (2.14) and (2.15)
(2.16)
Equation ~2.16) gïves the cationic flux at any position in the scale. It is necessary to express the
flux of cations in terms of scale thickness and the measurable metal chemlcal potential al the
metal/scale, J.l.1 M ,and scale/gas, Il II M ,interfaces, i.e.

1
•
1 1.1 fLRA /UR" Rh V/I:W 16
Il'',,, . 1 f CJ ca e
J = - -- dlJM C Z2F2 a + a
c X "'II C •
(2.17)
If the concentration of metal in the oxide scale is CM (mol cm,3) then the flux may also be
ex pressed by
(2.18)
where x is the oxide scale thickness.
From equation (2.7), the parabolic rate constant is expressed as
dx k' -=-dt x
comparing equations 2.17, 2.18 and 2.7, the parabolic rate constant is expressed as
(2.19)
The mobility, B" and diffusion coefficient, DI' of a specles are related by the Nernst-Einstein
cquation as
(2.20)
where k is Boltzmann's constant and T is absolute temperature.
From Equations 2.11,2.20 we have
(2.21)

2. LITERATURE REVIEW 17
where CI is the concentration in particles cm-3, Thus
D = RT 1 Z2 F 2 C
1 1
( ", .., ..... ) ..........
where CI is the concentration in mols cm-J
From Equations 2.19, 2.20 and 2.21 we have
(2.23)
and
(2.24)
for the parabolic rate constant, where DM and Dx are the diffusIon coefficients for metal, M, and
non-metal, X, through the scale respectively.
Equations 2.23 and 2.24 are written in terms of variables that can be measured relatively easlly,
although it is assumed that the diffusion coefficient is a function of the chemical potential of the
species involved. Thus, in order to be able to calculate values of the parabolic rate constant, the
relative diffusion coefficients must be known as a function of the chemical potcntlal of the
mobile species. Such data are frequently not available or are IOcomplete. Furthcr more, Il I~
usually casier to measure the parabolic rate constant directly than to carry out cxpcnments 10
measure the diffusion data. Thus the real valu~ of Wagner's analysis lies ln provlding a complete
mechamstic understanding of the process of hi~h temperature oXldation undcr the conditiOn) ~ct
l out.

1
2 umRA TUItE REVII!W 18
2.4 THE OXIDATION OF PURE IRON
The oXldation of pure iron in oxygen environments will be considered first to serve as a basis
for studying the oxidation behaviour of steels.
2.4.1 Oxidation Mechanism
The oxidation of pure iron over a wide range of temperatures has been studied extensivel y. The
results of that research has revealed that the controlling mechanism is by the diffusion of ions
through the oxide layer and hence the parabolic behaviour, Figure (2.7), Davies, Simand and
Birchenallll , Paiaassi/ 2, Schmahl, Baumann and SchenckIJ
, Stanley, Hoene and Huroon14, Sacks
and TucP.
The oxidation process is controlled namely by cation transport through wustite and magnetite,
Tylecote and Mitchelf. In the hematite phase, diffusion is mainly by anions, Sachs and Tuclé.
However, oxygen diffusion through wustite and magnetite cannot be ruled out, in fact studies
by Engill and Wever5, DaVies. Simana and Birchellll seem to indicate that oxygen transport
through these two phases exist. The growth rates of the three oxides, wustlte, magnetite and
hematite, as a functIon of temperature have been studied by Pwdassi' 2, and the results agree weil
with the work of Simand, Davies and BirchenalllJ, Kubaschewskl and Hopkins7
• These rates are
expresscd as;
FeO: -40~OO
kt p = S.75 e Jrr
-40~OO
k' p = 1.05 e RT
(cm2/sec.)

1 2 LITERATURE REVIEW
-40500
k' -54e RT p - •
where R is 8.314 (joules/K. mole) .
.. E ... ~
E
lOI ... -< ... & \J
75
~ho
10 lO ~o 40 ~o 60 70 TIM(, "'",
Figure (2.7) Metal loss of pure iron in
oxygen at 1100 oC, Sachs and Tuclê.
19
The parabolic growth rates of the three oxides of iron are knOWI1 from the measurcment') of
1 Himmel, Mehl and Birchenalr, Kubaschewaski and Hopkins7, and are presented ln Table (2.1).

2 LrI ERA JURT! RI, VIEW 20
Table (2.1) Parabolic rate constants obtained experimentally for the growth of FeO, Fe30"
and FeZ0 3, taken from Kubasclzewski and Hopkins7•
Reaction Temperature k" oC (g2/cm4.sec)
983 6.7 x 10⁻⁷
Fe + 1/2 O2 = FeO 897 2.5 x 10⁻⁷
800 5.3 X 10⁻⁸
1100 3.2 X 10⁻⁸
3FeO + 1/2 O2 = F~04 1050 1. 7 x 10⁻⁸
1000 8.1 x 10⁻⁹
2F~04 + O2 = 3F~03 1100 1.0 x 10⁻⁸
1000 2.3 x 10⁻⁹
On the basis of our present knowledge of the diffusional properties of iron oxides, Birks and
Meief! have proposed a simple mechanism for the oxidation of iron, Figure (2.8).
1 - The iron iomzes at the iron-wustite interface according to
Fe = Fez. + 2e- (2.25)
1

•
1
2 LITERA TURE REV lEw
flO 1 f.,O. ,.2. ,,,J.
F.'· . • . •
/
'.JO, 0, ,.,. --•
0 2. -•
-;0, • 2.- ·0'· 1 2f.'. JOJ. • Fe,O,
f ... • .,.. • • '.,0) . lf.JO.
Figure (2.8) Oxidation mechanism of ÏfOI1 to form a thrcc-Iayered scale of FcO, Ft.·})~ and
FeZOJ above 570 oC showing diffusion steps and interracial reactions. Fl'oll1 llirks
and Meier.
2 - Due to the presence of cation vacancies and electron holes ln wustlle, Iron cations and
electrons are transported to the wustite/magnetItc Interface. Therc, the magm:tlle I~ reduced
to wustite according to the reaction
(2.26)
Iron ions and electrons surplus to this reaction are transported through magnctitc 10 the
magnetlte/hematite interface to form magnetlte by the reduction of hematlte
according to

Z 1111 RAIIJRI. Rf Vif W 22
(2.27)
The value of n being 2 or 3 for Fe2 + or Fe3+ ions respectively.
At the hemattte/gas interface, oxygen lOnizes according to
10 2 - - 0 2 -- + e -2 2 (2.28)
Hematite is formed at the magnetite/hematite interface by ionized oxygen and metal ions in
exccss of equatlOn (2.22) according to
(2.29)
If Iron Ions are mobile in hematite, hematite will form according to
(2.30)
2.~.2 Em~ct of Temperature
The effcct of temperature on the oxidation of pure iron is very weIl known. Davies, Simand and
[JLrc:henall" l11vestlgated the effeet of a wide range of temperatures on the oxidation rate of pure
Iron .11 normal oxygen pressures, Figure (2.9).
rhe par.lbolIc raie comlant Illcreases exponentlally with temperature according to the following
:\rrh~l1ll1s equatlon

1
2 LITERA TURE REVŒW
-Q
k =k eKl' p 0
Where ko is a constant that is a function of oxide composition and gas pressure.
,
t'>O'e
'Q
~ · '1 · l! i ! 1:: : E
!! à • · • !!
;;
~ · 2 i : · , .
i : · ~ : ~ •
~ ;: ~ .. j ~ .
i
ICI ., ~ • )0 0 10 D IQ n r_1' &- 1 r_t c-.,~,+
(2.31)
tso· Co
a~·~
100' ..
1 ,JJ ~o·c.
,~.~ 1
ISC- C.
-=-=-.l JO
Figure (2.9) Isothermal curves for the rate of increase of weight of iron oxidized in oxygcn,
taken from Davies, Simand and Birchena/fI,

1
1
2 L1IUU\II)R(,R[,VILW 24
The dependence of the parabolic rate constant on temperature is given in Figure (2.10). The
distinct break in the curve between about 560 to 600 oC is obviously due to the fact that wustitc
is unstable below
570 oC, Kubaschewski and Hopkins7• Stanley and Hutoon7 have expressed the Arrhenius
equation by
log lep - g2 cm·4 s~c·l
• • • . • • • ~ ~ - - Co 0\ ln
(:) - (:)
0\
(:) .
"1 ./ <:) OD-
e Co
è:) 6-,"" -..
J ~
-f\)--~
. - / ~
- . VI
FigUl"e (2.10) Relation between rate-constant and temperature for the oxidation
of high-PlIl'ity irolt. x Davies, Simand and Birchenall; 0 Schmahl, Baumann and
Schenck. Taken from Kubaschewski and Hopkins7

2 LlTERATURE REVIEW
-33000
kp = 0.37 e lU
where R is the gas constant and T the absolute temperature.
2.4.3 Effect of Oxidizing Atmosphere
25
(2.32)
The effects of oxygen, steam and carbon dioxlde on the oxidation of pure iroll has bccll studl\:'d
by Rahmcl and Engelll6, SmeltzerJ7
, Sachs and TlIc~.
2.4.3.1 Effect of Oxygen
Rahmell and Engelll6 studied the eftèct of oxygen levels on the rates of oxidation of iron at 700.
800 and 950 oC, respectively. The results of their work suggested that the parabolic oXldation
rate
increases with increasing oxygen percentage, especially at hlgher tcmperatllres. The mo~t
significant increase was found to be between 0.4 and 2 % oxygen al 950 "C. The paraholic rate
constants are given in Table (2.2).
2.4.3.2 Effect of Water Vapour and Carbon Dioxide
The effect of water vapour and carbon dioxide on the oxidation of iron has becn studil!d by
Rahmel and Tobolskil8• They found that the scaling rate of iron is not mfluenced by water
vapour at 750 oC, but at 850 and 950 oC, the rate increases by factors of 1.2 and 1.6
respectively. They aIso stated that carbon dioxide produces a smaller increasc than water vapour.
1 Smeltzer7 has studied the effect of carbon dioxide on the scaling rate of iron in the

J
2 I.In:RAltJREIŒVmW 26
temperature range 600 to 1100 oC. The results ir.dicate that the sca!ing rates obeyed linear and
parabolic time laws for short and long exposure times respectively.
The oxidation curves for pure iron in oxygen, steam, air and carbon dioxide at 1000 and
1100 oC are given in Figure (2.11), Sachs and Tuc!!.
Table (2.2) Parabolic rate const.mts for the oxidation of iron in oxygen
obtained experimentally by Rahmel and Engeœ6•
Temperature Percent kp
Oxygen (g2/cm4• sec.)
700 oC 100 7.8 X 10⁻⁹
49.2 7.5 x 10⁻⁹
10.3 8.5 x 10⁻⁹
1.0 8.3 X 10⁻⁹
800 OC 100 5.5 X 10⁻⁸
21.0 5.8 x 10⁻⁸
10.6 6.5 x 10⁻⁸
1.1 5.2 x 10⁻⁸
950 oC 100 5.8 X 10⁻⁷
37.5 5.7 x 10⁻⁷
15.8 5.2 x 10⁻⁷
4.4 5.2 x 10⁻⁷
2.0 4.8 X 10⁻⁷
0.4

1
'2 LITERA TURE RBVIEW '27
Figure (2.11) Oxidation of pure iron, from Sachs alld Ttlclr.
2.5 OXIDATION OF STEELS
The oxidation of steels is far more complex than that of pure iran. The complications anse from
the fact that different elements with different properties are interacting sirnultancoll'lly. It thcn
becomes difficult to give the cause and effect of the behaviour of an clement 111 the alloy. Thil)
complexity is a result of sorne, or aH, of the following;
(1) The different affinities of alloying elements for oxygen,

1 2 UTERATURE REVIEW
(2) The different mobilities of metal ions in the oxide phases,
(3) The different diffusivities of different metaIs in the alloy
(4) Internai oxidation of one or more alloying elements,
(5) A solid solubility between oxides may exist,
(6) Ternary and higher oxides may be formed,
28
The literature available on the oxidation of steels is tremendous and it is not practieal to provide
an extensive review of it. Therefore, only limited work, specifie to sorne steels of interest, will
ne revicwed.
2.5.1 Effect of Alloying Elements on the Oxidation Rate of Steel
As the ingredients of steels can comprise of many elements, it becomes far more complicated
to determJl1e the effect of any of these in the presence of others.
2.5.1.1 Effect of Carbon
The effect of carbon on the oxidation of steel has been studied by many researchers, MU/phy,
Wood and Jominylfl, Cook and Rasmussenzo, Schurmann, Beek, Rahm, Brand and Mlilheim ZI• In
the majority of these studies. carbon has shown to decrease the scaling rate of steel. This
decrease is believed to be a resliIt of carbon oxidation to CO, which would have the tendency
to retard the oxidizing action. One of the reasons for this behaviour is sliggested by Grinzburg lV•
He explained that pores tilled with CO develop at the scale/metal interface, and hence hinder
the diffusion process of ions from the metaI to the oxidizing atmosphere. Figure (2.12) shows
the effect of carbon on the oxidation of different steels (refer to Table (2.3) for composition).

1
2. LITERATURE REVIEW
1 AISI TYPE 1030 CARBON STEEL Z AISI TYPE 1090 CARBON STEEL
3 AISI TYPE 302 STAINLESS STEEL
4 AISI TYPE 430 STAINLESS STEEL
5 AISI TYPE 310 STAINLESS STEEL
5
1200 1400 1600 1800 2000 2200 2400
TEMPERATURE _eF
Figure (2.12) Erfect of increasing amounts of carbon
on scaling rates, From Cook and Rasmllssenz(J.
2.5.1.2 Erfect of Other Alloying Elements
:29
GrinzburglO has considered the effect of sorne other alloying clements on the oXldation of steel;
Manganese does not contribute to any major effect on the oxidatlOn of steel.

2 LITERATURP. RP.VIr:W 30
Table (2.3) Compositions of steels considered.
Steel %C %Si %S %P %Mn %Ni %Cr %Mo %Al %Cu -
1030 steel .28- .05 .04 .60-
.34 .90
1090 steel .85- .05 .04 .60-
.98 .90 .
302 steel .15 1 .03 .045 2 6-8 16-
18
430 steel .12 1 .03 .04 1 16-
18
310 steel .25 2 1.5 24-
26
Mild steel .065 .01 .017 .0]7 .29 .049 .01 .023
En 8 steel .425 .21 .027 .021 .77 .28 .20 n.d. n.d .
En 16 steel .4 . 24 .031 .017 .95 . 14 .13 .28 n.d. n.d .

1 2 I.ITliRATURfi RIlVmW .H
Chromium and aluminum, when present at residual levels in the steel, have negligible effeets
on its oxidation properties. At higher levels, ehromium fonns a protee live layer of Cr10, whieh
provides oxidation resistance. Similarly, aluminum forms a hard proteetive layer, AllO" which
reduces the oxidation rate.
Silicon reacts with oxygen diffusing into the steel below the oxide/metal interface to forms
silica, SiC),. Silica forms a separa te phase, Fayalite 2FeO.Si02, whieh has a rnelting point of
1171 oC. When this phase melts, the oxidation rate increases due to the acccleration of the
diffusion process through the metten phase.
Nickel diffusion in steel is low and hence it is coneentrated at the steel/oxide interface which
lowers the oxidation rate. The resulting nickel alloy has the tendeney to increase scale adhesion
to the substrate. The problem becomes more severe when nickel is present at high
1 concentrations.
r •
Copper, like nickel, is concentrated at the metal/oxide interface but docs not cause scale
stickiness as in the case of nickel.
2.6 SCALE FORMATION IN REHEAT FURNACFS
Scaling of steel in the presence of gaseous products of combustion add to the cornplexity of the
oxidation process. Limited studies have becn reported by sorne au th ors such as Cook and
Rasmussen22, Hemsalh and Vereecke 22
, Sachs and TucJ?-1, Selenz and OetenU, Minaev,
Ol'Shanskii and ShurovaZ5, on various aspects of scaling in complex environments.
A major clement in the cornplexity of scale formation in reheat fumaces js ils inconsistency,
which again, is a result of interacting parameters in the fumace, Blazevic26 •

1 2 1.ITERA TURE REVIEW 32
Only some of those elements contributing to the inconsistency of scale formation have been
considered by researchers.
2.6.1 Reactions and Heating in a Reheating Process
Reheat fumaces are direct fired type fumaces with the fuel heing, depending on bumer design
and fuel type availability, natural gas, coke oven gas, blast fumace gas, fuel oil, etc .. Many
reactions can take place during reheating; however the main reactions that provide heat to the
system are as follows:
Methane, CH~, wlllch is the ma1l1 constituent of natural gas burns, according to the reaction
(2.33)

2 LITERA TURE REVIEW 33
t Hydrogen, H2' which is the main constituent of coke oyen gas burns according to
1
(2.34)
Sulphur, S, from fuel oH, at higher temperatures burns aC'cording to
(2.35)
Carbon monoxide, CO, bums according to
(2.36)
The levels of combustion products depend on the percent combustion air uscd InCllmplctc
combustion gives rise to combustibles in the combustion products. Cook and R(Js"IlI.\.'I!I/~/) studlt!d
the equilibrium products of the combustion of naturaI gas related to perccntagc thcorcltcal
combustion air and these are shown 10 FIgure (2.13).
Note that as the percent combustion air decreases, the oxidants H20 and CO2 dccrcasl', wlllle
those of reducers, CO and H2. increase.
The air/gas ratio also has a big impact on the adiabatic flame temperature. FIgures (2.14.2.15)
give the theoretical adiabatic flame t\!lTlperature as a function of percent combustIon aIT and
combustion air temperature. It can also be seen that high combustion aIr temperaturcs rcsult 111
dramatic increases in flame temperatures.

1
1
2 LrrmtA flJRI! REvmW
o CH. (MU
50 fO :30
Figure (2.13) Equilibrium products oC combustion oC natural gas related
to percent age theoretical combustion air9 From Cook and Rasmllssen20•
1030 BTU/CF NATURAL GI.S
2'~Orf--y--"""t-.,--+--...p.~-+_-4_~
2400r-~-r--~----t---~--~ ____ +-~~~~ "ICM--"--I.E" ....
2000~--~ __ -t.,-~~ __ ~ __ ~~~~ __ ~ __ -J 40 60 eo '00 120 140 160 180 200
PERCENi COY.S\,ISTION AIR
Figure (2.14) Theoretical adiabatic fla me temperature
with air/gas ratio, From Cook and Rasmussen10•
34

1
2 LITERA TURE IœVIEW
-, PREHEAT 71-F
500· G
1000
AlA/G"S 5
1500° R~T'O ...
3
2 l 2000 2.200 2400 2600 2&00 3000 3200
TEMPER"TURE (OF)
Figure (2.15) Adiabatic flame temperature for combll.!ttion of
natural gas in preheated air, From Hemsatlze and Vereeckel1.
2.6.2 Oxidation of Steel in Combustion Products
35
Iron and other alloying elements in steel react with various gases in the furnacc rC~lIltlng :n
complex products. Sorne of the lrnportant reactions of iron in additIOn to tho~e III equatlom
(2.1), (2.2), (2.3) and (2.4) are;

2 LrfERATIJRE REVIEW 36
t The oxidizing reactions
(2.37)
Fe + CO2 = FeO + CO (2.38)
The reducing reactions
FeO + co = Fe + CO2 (2.39)
(2.40)
Cook and Rasmussenzo have presented the wûrk of Jominy, Murphy and Marshall to provide the
equilibrium ternperature at which iron and iron oxide are stable at different CO/CO and H20/H
2
ratios, as shown in Figure (2.16). Thus for any oxidation temperature, if both ratios are held
to the left of the curves, the entire work-atrnosphere relationship will rernain on the reducing
side.
~ • 1
101 a: ::l
~ a::
220011--"-"'~,
w '1001---1--0.. 2 w ~
1200,~-t--+---+--"~--1r--;
1000l,,--+_-+---t--:-~~'i\ o RATIO COzICO
220011---t-+---t--t-~r-'"
~OOOII---+_.t--t-t'"t---t-.,
120011---t--#--+--+-~r-..,
IOOO~~...L.-:--=_7-~:'-~ oz. RATIO HzO/Hz
Figure (2.16) Equilibrium temperature at which various gas ratios of
CO!/CO and Il:O/H: are neutral to iron, From Cook and Rasmussen20

1
2 LITERATUREREVœw 37
Minaev, OI'ShanskiP, et al have studied the oxidation of steels 35, 45, 60, 80 and USA. 111
combustion products from natural gas at different temperatures with varying air consumptlon
coefficients. The results of their work are given in Figure (2.17).
• 1 1
1 ~J' / 6IJ ...
-~ ~6IJ ~
V 1
1 (al
1
o
.!. -~'~~~~~~~--4-~
41 0.1 U I,IJ 1,1 1,1 cr tJ,1 a9 I,Q 1,1 1.1 cr
1
i"ooo.. -- 'f Il ~-~ ~ !
...... , U'A
MI Cd)
Figure (2.17) Influence of air combustion coefficient on amount of
scale formed at specimen temperature, oC, of: a 1200, b 1100,
c 1000, d 900, figures on curves give grade of steel, from
Minaev, OI'SIzanskii, Volkova ami Slwl'Ova15•
With all the investigated steels, a change in the air consumption coefficient from 1.1 tu 0.9 al
high temperatures results in a marked drop in the oxidation rate, while a furthcr dccrca~c in thiç;

2 I.J1ERAllJIUlIWVlhW 38
, coefficient from 0.9 to 0.7 has very little effect on it. Thelr work aIso mcluded the oxidation of
steel 35 in gaseous fuels naturaI gas, co~~ oven gas and blast fumace gas combustion products,
Figure (2.18). ft can be seen that the oxidizing potentiaI of naturaI gas differs only slightly from
that of blast furnace gas.
6
5
f
Jr--V ~ ;.- ...
V
1/
HG jl'
V1~ ,
1
4
5
J
2
f
1 (.) () 0
1 1", ~ 85
ru-l? V
i'"""
1 1 (c)
0.7 OJ a,g f,0 1,1 rr 47 0,6 @ 1.0 f,f «
r ~~I V / ~.,
j .-IV ·S_ l
1 ~ ., -f Cb) V / " (dl () 0
0. 7 0.8 0.9 1,0 1.1 « 0.7 0.6 0.9 1.0 1,1 «
Figure (2.18) Influence of different gaseous fuels on amount of scale
fonned at: a T= 1250 oC, b T= 1200 oC, c T= 1100 oC, d T= 1000 oC.
Cook and Ras/1lllssen:o have studied the oxidation of AISI 1030 carbon steel at different
tcmperatures as a function of percent combustion air, Figure (2.19). It indicates that aU higher
tempcratures require deticlencies in the air-gas ratio approaching 50 percent to heat steel in a
, scalc-frce manner.
1
\
r ,

2. L,TERATURE REVIEW 39
1 Sachs and Tuclr have studied the oxidation of iron, mild steel, En 8 steel and En 16 steel.
(refer to Table (2.3) for compositions), in single and synthetic atmospher\!s at constant
1
temperature and two heating rates.
~
'" o en "
AISI TYPE 1030 CARBON STEEl. 8r-__ ïAT~T~EM~P~ErR~AT~U~R~E~F~O~R~ON~E~H~OU~R
STEEL SURFACE 7r-__ ~ ____ ~T~E~M~P~ER~A~TU~R~E~~
1
d Sr---~----r---~--~--~ lAI ... en
~ 4~==~==~~~~~J)~~ ~ , en en ~ ~~~~~--~~4---~~~
'" ~ ~ 2r----r, ----~--~--~~~
1900· F
.Ir---+-----~--+-~--
o ·~IO~O~~~~--~8~O--~70~--6~O----l~O PERCENT COMBUSTION AIA
Figure (2.19) Quantitative errect of air/gus rutio on the
scaling rates of AISI 1030 carbon steel, at con~tant
temperatures, from Cook and Rasmussen20•
The compositions of the atmospheres used in their work are givcn in Table (2.4). From thclr
work it was observed that an increase in steam at higher oxygen lcycls had no el'ft:ct on the
scaling rates of pure iron and mild steel but that at low oxygcn, an inçrca~c of ~lcal11 rC'lultcd

1
1
2 1.1 rl!M TURE RI!VIL'W 40
in an increase of scaling rates especially above 1000 oC. An increase in oxygen content resulted
in higher scaling rates than in the case of an increasing steam ratio.
No
1
2
3
4
5a
5b
Table (2.4) Composition of furnaee atmosphere used in the
experimental oxidation of iron and mild, En 8, En 16
steels, From Sachs and TllCJè3.
N2 CO2 O2 H20 Designation
78.30 10.8 0.90 10.1 low oxygen/low steam
69.60 9.60 0.80 20.0 low oxygen/high steam
74.7 11.7 3.6 10.0 medium oxygen/low steam
67.6 7.6 4.8 20.0 high oxyg~n/high steam
74.6 8.55 5.4 7.2 high oxygen/low steam
76.05 12.1 6.1 10
2.6.3 Senle Fr'ce Henting
Cook and Rasmussen.!o have developed a strategy for scale-free heating, Figure (2.20). During
the illltiai heating period. steel 1S heated at stoichiometric air/gas ratios utilizing preheated
combustion air until the surface temperature of the steel reaches about !400 OF (760 OC). Percent
combustion air is thcn reduced to 50% of stoichiometry from 1400 to 1900 OF (760 to 1040 oC)
surface tcmperaturc. The steel is then heated to 2300 OF (1260 OC) while maintaining 50%
combustion air at this tempcrature.

2 LITERA TURE REVIEW
~ • 1 lU II: ;:) ~ C II: lU Q.. :1 lU 1-
lU U C ~ II: :::1 en :II: II: 0 ~
2300 .,...,--- 100 WORI< SURFACE ./ - ~ -- !II: TEMPERATURE,... ~., II: MEAT FROM 1900 TO 2300-F
64-4 HEATlNG TIME 1900
.., 0 I~------~~ / ~
){.PERCENT TOTAL MEAT 80 0 30% TOTAL MEAT INPUT TO WORI< 50,._ COMBUSTION AIR
, INPUT Ta WORI< 1-70 1-
:::1
~ 60 ~ ~
~ 1 ,'WORI< CENTER
W :I:
1 TEMPERATURE .0 ~
:! 30 0 1-
20 ~ w u II: w
~~ __ ~ __ ~3~6~ ____ ~ ____ ~~ __ ~0 Q.. ~ ~ ~ ~ I~
PERCENT TOTAL HEATING TIME or
FURNACE LENGTH
MEAT FROM 1400 Ta 1900-F 26'1. HEATING TIME 40'1. TOTAL MEAT INPUT TO WORI< 100'1. TO 50'1. COMBUSTION
AiR TRANSITION
MEAT TO I.OO-F 10% HEATING TlME 30". TOTAL HEAT INPUT TO WORK 100% COMBUSTION AIR
Figure (2.20) Heating stages to produce a scale-free heating
of steel, From Cook and Ra~mllssen10.
.tl

1
3.1 INTRODUCTION
CHAPTER
THREE
OBJECTrvES,EQUlPNUENT
AND EXPERIMENTAL PROCEDURE
To investigate a certain phenornenon taking place in large industrial units such as steel reheat
fumaces, it IS often the case that laboratory experiments are set up to sJn1Ulate some aspect of
the proccss taking place in the industnal unit. Although thls approach is necesc;ary to provide
sClentific tindmgs undcr controllable conditIOns, difticulties are usually encountered in applymg
thesc laboratory tindll1gs to industrial units. Moreover. a lack of understanding of the exact
operation and of the different parameters in an industrial unit causes sorne of these diftïeulties.
Thus, it is important to conduct as many industrial experirnents as possible in order to identify
thcse paral11ctcrs and th us devclop a strategie procedure for investigating them 1Il t:le iaboratory.
The ai III of th IS work \Vas to stlldy the phcnomcnon of scale formation of steel lakmg place 111
,\ 350 ton/hollr dlrcct tircd ~teel rcheat fllrnace. The large number of parameters affectlllg this
proccss nccc~~it.llcs ,\ trcmcndolls amount ofpreparatory work in order to come up with the most
practical procedure.
The paramctl!rs dircctly intluencing scale formation are slab temperature, in-fllmace atmosphere
42

1
3. OBJECTIVES. EQUlI'MJo:''i r A.'iD ~:'XI'ER(MF~'iT'\L l'ROCEBl'RE
(02, CO2, H20, CO), steel grade and steel residence time in the furnaœ. Howl!ver. 10 monitor
thes(: parameters, furnace controls and measurement points must be knowï1.
3.2 OBJECTIVES
The objectives of the scale work were to:
1 - Develop an experimental procedure to allow for scale sampling. dming passage of slabs
through the industnal reheat furnace.
2 - Assess scale losses assoclated with eXlsting furnace operatIon.
3 - Identify parameters int1uencmg scale formation In the furnace.
4 - Alter such paramet\..rs, whenever possible, to milllllllse scale formaLIon 111 the furnaœ.
5 - Investigate scale adhesioll to the ~ubstrate, surface quality and quality of dcscalcd 'ilah, 1 f
deemed problematic.
In order to give an ovcrvlcw of the expenmental set up adopted for this work, thl! l!qulpment
lay out together wlth a deScriptIOn are tirst L'onSldcred 111 the followlIlg 'icctlons
3.3 FURNACE DESCRIPTION
The walking-beam steel reheat fumace under investigation can be divided illto twelve zones, (sec
Figure (3.1». The design is that of a double row, top and bottom tïrcd walklllg hc.lIn t'lIrnace.
It consists of twelve zones of combustion control arrangement r\ total of 121 burner) an:
installed in ail the zones exccpt In the untïred zone. The~c Includc longltutllnal or .,Idc bllrner~
10 aIl the zones \\ ith the exception of the top ~oak zone whcre radiant roof burner) are ll\ed. The
preheat and charge zones (top and bottom) burners are fired clther wlth coke oven ga), Illlxl!d
gas, or with No 6 fuel oil. AIl other zones are tircd with coke oven gas or mixcd ga., and ;ur.

e' 1
44
The combustion system is of the rccuperative type, with air preheatcd to about 500 "C. The
products of combustion in the furnace, depending on fuel type, are COz, HzO (steam), N2, Oz
(in the case of exccss air), sulphur oxides, NO. and traces of combustibles (in the case of , incomplete combustion). The fumace combustion control was by means of a microprocessor type
instrumentation system. A programmable controller directs movements of the walking beams for
moving slabs through the furnace at pre-designated rates.
The walking mechanism is split at the mid of the fumace length to allow for indepcndent
charging and diseharging speeds. Thus, slabs walk through the fumace by means of stationary
and moving beams. The moving beams lift up the slabs, ad vance them a certain distance, lower
the slabs in the ncw position and return to their initial position. This cycle is repeated for each
walk.
ln the furnace, steel slabs of different grades are charged at different initial temperatures for
varying residence times. The fumace operation depends on many factors such as initial slab
temperature, mill delays, slab dimensions, gaps between slabs, production rates, etc ..
Therefore, a considerable amount of time was spent in controlling the furnace 50 as to a1low for
the variability of the influencing parameters.
Since taking scale samples from actual slabs in the furnace was not possible, small steel samples
of identicaJ sizes were used to monitor sca1e formation. Much work went into the sample
preparation and insulation to obtain seale formation which is representative of scale formation
on actual slabs. The other challenging aspect is extracting scale samples from different positions
along the fumace and hence to allow for time-scaling curves. Fortunately, the fumace was
equipped with side ports which were used to retrieve the steel sample. Ail of thes;c details will
be discussed in later sections.

1
45
3.4 EXPERIMENTAL SET -UP
During the experiments, a large number of fumaee operating data was monitorcd on-tine. This
data inc1uded fuel ard air flow rates for individual zones, fuel composition (H2t CH., CO, Co,. 02)' sIab data (sIab temperature and slab walking rates through the fllmace) and fumace
atmosphere (oxygen, carbon dioxide and carbon monoxide). The hardware for data conection
can be categorized Into two parts, the fumace equipment (HoneyweII and Vax), and the McGiI1
data acquisition system equipment. The Honeywell TDC-3000 is used as the Level 1 fumace
control computer, white the Level Il (Vax System) provides calculatcd slab tempcratures. The
McGiU equipment was Iimited, sinee most of the data that was requirc.d from the furnace can
he accessed from the two fumace control systems. The McGill data acquisition system,
manufactured by Schlumberger, is based on a number of Isolated Measurcment Pods (lMPs),
distributed across the plant and Iinked to an IBM AT compatible computer located in the fumace
control pulpit via a twisted pair cable.
A schematic illustration of the arrangement of the individual units used in the collection of data
from the reheat furnace,is given in Figure (3.2). These units include data acquisition equipment
and fumace control equipment and are described below:
Water Cooled Sampling Probes, [2], [3]
Water cooled probes were used to aspirate in-fumace gases for on-line analysis. The probes were
assembled from internai and externat stainless steel tubes. Water flows through the inner tube
and exits from the outer one. This cooling water was needed to quench the hot gases aspirated
so as to prevent possible reactions among them and also to protect the probe from over-heating.
The water flow rate required depended on zone temperature, probe location, and depth of
insertion into the fumace. The flow rate was adjusted by monitoring the exit water temperature.

1 J. Oll.IEC'/lVE.", EQUII'~n~"'T A.'lf) K,(IJEiU~n.~ fAl.l'lWCEIJURE
UNFIRED PAEHEAT CHARGE
SLA8
SlAB MOVEMENT DIRECTION
HEAT SOAK
46
TOP HEATING
ZONE
BOT TOM HEATING
ZONE
Fipre (3.1) Scbematic illustration of live zone walking-beam steel rebeat furnace
(not to scale).

3. OBJECTIVES. EQut~IL"'IT "''ID E.XI'ERL\tE.'1TAL PROCF.DU1Œ
A
3
15
16
FURNACE
.J
13
Figure (3.2) Schematic illustration of experimental set-up.
[1] Reheat Furnace [2] [3] Water Cooled Sampling Probes
B
(4] Nova 370 (Portable Combustion Analyzer) [5] ANARAD Model AR-205 (Combustion Efficiency Monitor) [6] Nova Model 7S00P5 (Fuel Gas Analyzer) [7] Anarad Model AR-411 ( CH4 Analyzer)
2
12
[8] [9] [10] [11] Model160T DC Volts/Process Current Transmitters [12] 3595 Series Isolated Measurement Pods (lMPs) [13] IB~ r Compatible with IMP Adapter Card [14] Honeywell Control System [IS] Vax system
T [16] Data Processing ,
~7

48
NOVA 370 (Portable Combustion Analyzer). [4]
A Nova 370 was used to measure the levels of O2, CO2 and CO in the soak zone. It has a built
in sam pIe pump which draws in flue gases through a stainless steel probe. The oxygen and CO
sensors are of the electrochemical "fuel cell" type producing small electrical signais proportional
to the gas being detected. A thermal conductivity sensor was used to measure the rate at which
the sample gas conducts heat from a heated thermistor, by reference to a similar thermistor
surrounded by air.
ANARAD Model AR-205 (Combustion Efficiency Monitor), [5]
The Anarad ar.alyzer was used to measure CO2, CO and O2 in the combustIOn products. This
particular instrument was used in the intermediate zone. This is a non-dispersive infrared (NDIR)
gas analyzer. It measures the concentration of a selected gas species in a muIti-component gas
mixture by measuring the infrared adsorption of the selected component in the gas mixture.
NOV A Model 7500P5 (Fuel Gas Analyzer), [6]
TllIS analyzer was uscd to measure fuel composItion. The ranges of fuel components. Oz. H2
•
CO, CO] and CH, arc, 0-2%,0-100%,0-10%.0-5% and 0-30%, respectlvely.
Oxygen is dctectcd by a custùmer replaceable electrochemical sensor, hydrogen by a thermal
conductl\'Jty sensor (compensated for temperature, CO2 il .. ": CH4 effects), CO, CO2
and CH" by
an in fra-red dctector.

,
3. OBJECTIVES. EQUlP:\IE.'\'T A.:~D E.xI'ERI~IE:IiT'\L l'ROrEIll'R}o,
ANARAD l\tlodel AR-411 ( CH~ Analyzer), [7]
Because of a limit in the range over which mcthane can be l11easllr~d by the Nova l\todd
7500P5, (0-40%) this additional analyzer was reqlllred. This instrument IS capable of ll1eaSllnn~
CH4 in the fuel in the range of 0 to 100%. It is a non-dIspersIve Infrarcd. sIngle l'hannl'l, ~ll1gJe
ceU analyzer.
Model160T DC Volts/Curre"t Transmittel's. [8], [9], [lO), [11)
This model type accepts a DC voltage. either umpolar or bipolar, from 100 mY to 100 Y span~,
or current mput signal and con verts it to a 4 to 20 mA or 10 to 50 mA proce~s l'tlrrent output.
The input impedance is 5 megohms mInlmum.
3595 Series Isolated ~Iea::mrement Pods (lMPs). [(2)
The 3595 series ofIsolated Mcasurement Pod~ (ll\lPs) are multl-channel d,li.! collecllng \1,1110/1"',
designed to be operated remotely by a host compu1tr or data Jogger. The ho~t 1) !tnh'lI 10 the
IMPs by one simple 2-wire cable, up to 1 km long. ThIS link. eallcd S-Net. IS lI'iCU to powcr
the IMPs, as weil as for bi-directional data to and from the host.
IBM Compatible, [13]
An IBM Compatible AT personal computer was lIsed to colleet the data ~cnt by the 1 M !l'l. It wa '1
equipped wlth an lMP adapter cardo

, 3. OILnX lin ..... M)U"~Œ:"T ANI> ~.xl'ERJME:-;TAL PROCEDt:RE 50
3 • .5 SAMPLE AND SLAB TEMPERATURE MEASUREMENTS
The tempcrature of one sample and a test slab was measured for comparison utilizing a
ThcrmophiI-Stor mstrument. This instrument is ideal for monitoring temperatures in high
temperature cnvironments.
3 • .5.1 Thc.'mphil-Stor Type 4468
The Thcrmophil-Stor type 4468 rode with the test slab through the fumace. It \\-as powered with
an rntegrated ~ct of NI-Cd cell~, ensuring 10 hours of service in the case of contll1l1OUS
opc:ratlon. The e1ectnc {Mm, COIl~lstlng of a l11~aSllnng CIrCUIt, an amplIfier, an A/D transducer
and a I11ca~ll ri ng value storage are buIl t Into Dewar vessels wl1lch 111 tum are surrollnded by high
temperature-msulatmg material. Resistance thermometers (Pt 100 DIN) of insulated jacket
thermocouples were used as temperature probes.
3,6 PLANIl\IETER
The rrrcgular surface arCJ of the scale pieces was measllred using a Planimeter. This Instrument
\Vas extrcmely accurate, Figure (3.3), consistently yield1l1g good results with ordinary, careful
t rc.lt men t.
Scalc picccs to he measured were drawn on a plece of paper llsmg a sharp pointed pencil tracing
the 1 rrcgular edgc of the scale plcee In measunng an area, the instrument is placed on the area
III ~llch .1 way that \\-llh th~ tracer pOInt In the ITIlddle of the area, the pole arm 15 approxIl11ately
.lt nght .mgks to the traL'~r .trln. The arl?l IS clrculllscnbed, after takll1g a reading of the wheel
.11 the ~t,\rt11lg pOlllt. In a clock\\'lsc dIrection by mcans of the tracer point, and the measuring
\V hl?cl 15 rcad. The second read mg is then subtracted from the tirst and the surface area deduced.
1

T
3. OBJECTIVES, EQlIIPME."iT ""'D E.XPERIMF~"T AL PROCEIW1Π51
3.7 SCANNING ELECTRON MICROSCOPE (SEM)
The scanning electron microscope was used for scale composition analysi.l. The ba~k-scattcr
technique was employed to provide good contrast between the various iron oxide phases on the
basis of differences of their densities. The SEM consists basica1Jy of four main Systl'IllS;
Measuriug Wheel
4
Tracer' Ann
Figure (3.3) The Allbrit Plallimeter illstl'llmcllt used to mca~ul'e
the irregular scale surface area,
1 - The iIIuminating/imaging system which produces the electron beam and directs it onto thl.!
sample. It comprises an electron gun and several magnetic Ienses that serve to produœ a
collimated, CO;lcn3 nt beam of electrons which can be focused onto the specimen.
2 - The information system wlllch includes the data rcleased by the sam pie dunng elcctron
bombardment and detectors which discriminate among, and analyze, these information
signaIs.

1
1
J. ()1U1·.eI1V~~". I-:QL11·MI.Yf A. .... n EX .. ERIME. .... TAI.I·ROCEDlJRE
3 - The display system which conslsts of one or two cathode-ray tubes for observing and
photographing the surface of interest.
4 - The vacuum system which removes gases from the microscope columns which would
otherwise interfere with high-resolution imaging.
3.8 EXPERIMENTAL PROCEDURE
For each expcrimcnt the following ~teps were taken;
1 - A test slab to carry the samples through the fumace was inserted in the heating line-up.
52
2 - The water cooling system for the sampling probes was started and the sampling probes were
inscrtcd in the fumace through the side wall, both in the soak and lntermedlate zones.
Figure (3.4) shows a water cooled probe mserted in the fumace to measure m-fumace
atmosphcre.
3 - The gas analyzers were tumed on and connected to the sampling probes, whlle starting the
McGiIl data acquisition ~j tem, Vax system, for data collection.
4 - Six samples were placed on top of the test slab, on the side closest to the furndce side wall,
as shown in FIgure (3.5).
5 - The test slab and samp!es were charged into the fumace and the charge time was recorded.
() - The SI.lb':3 mon:11lcnt throll~h the fllrnaœ was continuollsly monitored from the fumace ~ .
monitOrIng scrcens in the control pllipit.
7 - \\'hcl1 the test slab .lrn\'cd at a giwn side wlndow, a sample was retrieved using the sample

1
1
3. OIlJEC11VES. EQ\JII'MENT AND EXPF.RlMENTAL PROCIDURE 53
retriever shown in Figure (4.1) and the time was recorded. A walkie-talkIe was used for
communication with the furnace operator.
8 - Immediately after a sample was retrieved, it was placed in an air-tight box that was
continuously flushed by a flow of nitrogen.
9 - Steps six to eight were repeated for the remainder of the scale samples riding through the
fumace.
10 - Once the test slab had been discharged from the fumace, the data acquisition system was
stopped.
11 - The sampling probes were removed from the fumace and the water cooling system was
disconnected .
12 - AlI required data from the Honeywell and the Vax Systems were down-Ioaded to the PC
for further analysis.

J OHJr,cllVr-S. r..QUI~It:'.'~T ANf) r.xPElUMf~TAI.I'ROCmL'RE 54
Figure (3.4) A water cooled sampling probe inserted throup the tumace side waU.

1
3. OlUECnVF.s. F.QlllPMF..NT A.~D F~~PI'JtIMFJl/T,U PROCEDlIRE
Figure (3.5) Six insulated st~1 samples placed on top of a test
slab just berore charaio& ioto the rumace.
Figure (3.6) A picture showing the sample retriever through
the rurnace side window.
55

1
1
4.1 INTRODUCTION
CHAPTER
FOUR
PRE-TRIALS AND MONITORING
OF EXPERIMENTAL PARAMETERS
The industrial scale work was divided into two main parts, pre-trials and full trials. The pre
trials were undertaken to provide information needed to set up a corn mon procedure for the full
trials.
Since it was not possible to retrieve scale samples from actual slabs passing through the fumace,
steel samples of manageable size had to be prepared so that they can he individually extracted
from the fumace side wmdows. The main requirement was that the scale forming on the steel
samples (ridin~ on a test slab through the fumace) was representative of scale forming on the
test slab. The other requirernent was that aIl the steel sampi es use<! for all the trials be identical.
As discussed in Chapter Two. temperature has a pronounced effect on scaling rates. This
necessitates testing the effects of sample size, insulation and contact of the samples with the test
56

l
•• ntE-11UALS "'''0 MONITORING OF E.~PERIMF..NTÂL PARA\tETERS 57
slab, so as to achieve identical surface temperatures of the rider slab and the riding samples and,
as a result, similar scaling rates.
Ail the samples used for this work were prepared from a signal slab and were therefore of
identical composition.
The full trials were then conducted on the basis of the findings of the pre-trails, in parallel with
the measurement of aIl parameters needed for scale data analysis. These measurements included
in-furnace atmosphere:, fuel composition and slab temperature profiles.
In this chapter, details of the pre-trials a10ng with the measurement of parameters of the full
trials are considered.
4.2 PRE-TRIALS
The pre-trials were conducted to investigate sam pIe retrieval from the fumace. sample size and
preparation, sample insulation and sample contact with the rider slab. The duration of the pre
trials took approxlmately one third of the time for the total work.
4.2.1 Sample Retrieval from the Furnace
Two approaches were investigated for sample retrieval. In the tirst, a simple long steel bar with
a thinner curved end in the shape of a semi-hook was designed. The samples were then prepared
with hooks welded onto them to accommodate this method. ThiS approach was not uscd for
subsequent work, mainly to avoid the influence of the weld on scale formation of the sample's
top surface. The second approach was the design of a retnever resembling a long shovel with
a hollowed arm. A rake was then passed through the hollow arm with its forked end at the flat
end of the shovel. The design is shown in Figure (4.1). This approach was adopted for the
subsequent trial.

1 4 ..... ;..T1UALS AND MONITOIUNG Ot' tJCI'F.JUMF.NTAL PAKAMETERS 58
Figure (4.1) Sam pie retriever design utilized to
extract steel samples from the rumace, by D. Miller, Dorasco.
4.2.2 Sam pie Size
One of the important sample requirements is that the scale fonning on the samples is
representative. qualitatively and quantltatively, of the scale forming on the actual slab.
Therefore. this pre-trial focused on determining the influence of sample size on scale formation.
A set of two sam pie sizes were investigated (8x8x1.5 cm and 12x12x1.5 cm). The two samples
were sent through the fumace and retrieved at the same lime.

1
4. J'RE.11UALS AND MONITORING OF DPERlMElliTAL 'AIU.~ 59
It was observed that the temperature of the samples increased with decreasing sam pie size.
Figure (4.2) gives the scaling curves of this pre-trial. The samples and the slab in this pre-trial
had the same thermal history, that is, the samples were left on top of the test slab after being
discharged and left to cool ovemight.
From the figure, it can be seen that the small sample has about 21 % more scale than the slab,
while the large sample has about 6.8% more scale than the slab. The difference in scaling of
different sample sizes can only be attributed to difference in their temperature-time heating
profiles. The small sample will heat up at a much faster rate than the large sample, with the slab
being the slowest. Because of the very similar conditions for ail the samples in this pre-trial, no
other parameter is suspected to cause this effect. Due to the large sam pie size, edge effects are
not expected to alter the scaling rate.
Based on this finding, the larger sample size was chosen for the full trials.
4.2.3 Sample Preparation
The purpose of this set of pre-trials was to investigate the effect of sam pIe preparation on the
scaling of the steel samples. It has been divided into two parts, method of sample cutting and
method of top surface grinding.
4.2.3.1 Methods of Sam pie Cutting
Since the samples originate from actual slabs, methods of cutting these samples were
investigated. A set of samples was prepared as flame-slab-cut, saw-slab-cut, transfer bar-flame
cut and transfer bar-saw-cut. The flame and saw cut methods are investigated for the rcason that
in the case of flame eut, sample edges are exposed to very high temperatures and there eXlst a
thermal gradient, during cutting, across the sample width. This would result ln variations in the
microstructure across the sam pIe width and might alter the kinetics of the reactions.

1
1
•• PRF,TRJALS A.'III) MONITORJN(; 0'" EX"':RJMENTAL PAIL\ME1TJlS
N (
E ~ m
2.5
2
0.5
o
· .. · ~ , · , . · , . · " . • , <. ~ ",X' '", "1. •• _ t\ .. _ l.+
Slab 1 2 3
~~\< 1 • 12x12x2.5 cm (uninsulated) , ,,'\ ......
\.">~\. 2 • 12x12x2.5 cm (Insulated) ~:'~:~:~: 3 • 7x7x2.5 cm (unlnsulated) ~. ::.:.<.' 4 • 7x7x2.5 cm (Insulated)
4
Figure (4.2) The difference in the amount of scale fonned on the actual
slab and samples of different siz~.
60

1
•• PRE-TRlALS AlliD MONITORING OF E.~~MF..NTAL ,AIlA,\Œ:Œ.RS 61
The differently cut samples, aIl of the same size, were placed on a test slab and charged through
the fumace and were left to cool over night on top of the test slab.
The results from this pre-triaI did not indicate any major difference of scaling for the different
samples. The choice was th en made based on the easiest method of preparation which is transfer
bar-flame-cut. Also, this method was adopted to provide sampi es of the same thlckness as
opposed to slab-cut samples.
4.2.3.2 Sample Surface Grinding
Only the scaIe forming on the sample top surface was considered to simulate the scale forming
on the slab top surface. The amount of seale forming on the slab bottom and side surfaces was
assumed to be directly proportion al to that forming on Hie top surface. Since the top surface of
the samples contains surface defects such as oxides, which may alrer, ln one way or another,
the oxidation kinetics of the samples, a pre-trial was conducted ln order to compare the scaling
of normal samples and surface ground samples.
Figure (4.3) gives the scaling rates of sampi es with ground and normal surfaces.
It can be seen that the normal surface formed more scale than the ground surface. ft IS probable
that the presence of an imtial scale on the sam pie surface, results ln the formation of less
compact subsequent scale that contains cracks and channels through whlch the oxidizmg
atmosphere can pass to the steel surface and, therefore, the hi~her oxidizing rates. On the other
hand, on the clean surface, the nucleation of scale is uniform and hence a smooth and compact
film is produced. This will limit oxidant transport to the steel surface. In this case, it IS likely
that the transport of atomic oxygen inward from the gas/oxide interface to the oxide/steel
interface and the counter transport of iron cations outward from the steelloxide interfàce to the
oxide/gas interface is the predominant transport mechanism in the oXldation process. The slower
oxidation rates in lhis case are due to the fact that the rate of transport of amons and cations
through the scale is much slower than the rate of transport of molecular gases such as oxygen,
water vapour, carbon dioxide, etc., through cracks existing in the scale.

•• PIlt;.nuALS A.'liD MONITORING OF F..XPF.JUMENTAL PARA.\Œ1T.RS 62
1
034
- .- --.... ~t::1"'\1 Il::U Jv,r ~ - ~
tORfli AL~ URF ~CE 1 1
0.32 -- . 1
, ~ ,
,', 03
o _ 028
C\J
< E o 026
---
ri 1
j , Cl ~J
024 ! 1
022
02 o 50 100 150 200 250 300
TIME (min.)
Figure (4.3) Scaling rates for samples of nonnal and ground surfaces.
1
•

l
•• l'RE-TRIALS AND MONITORING OF E.'<PFJUl\ŒNTAL PAIlAMEll:RS 63
To insure the similarity of steel samples used for all the trials, the surfaces of ail samples were
ground with a hand grinder.
4.2.3.3 Sample Insulation
To altain similar sample and top rider slab temperatures, sample sides insulation was considercd.
This is based on the idea that If a rectangular piece of the top surface of a slab (far from its
edges), is considered, the predominant heat transfer taking place is from the furnace environment
vertically down across this piece. Renee, by side insulating the samples, um-directional heat
transfer can be achieved.
The samples were wrapped by kaowool around the sides and held with a steel strap and then
placed firmly on top of the slab to eliminate any gaps between the side insulatlon and the slab
surface.
The results of this pre-trial are shown in Figure (4.2). ft can be seen from the tigure that for the
large sample size, the insulated samples had 21 % more scale than the unmsulated ones. For the
sm aller samples, the insulated had 12.5% more scale than the unmsulated ones.
The observed results contradict the theoretical expectation. This behavlour can be a rcsuIt of one
or both of the following reasons. First, the kaowool acts as a less insulatmg material than that
of the scale that would have formed on the sample sides. This of coarse is a function of
compactness of the material. Second, that the steel strap holding the kaowool simply opened up
in the fumace and the unscaled sides allowed for greater heat transfer and hence the increase in
sample temperature.
Because of the uncertainty of the insulation technique, the full trials were conducted with no
sample insulation.

1 •• PRE-TRIALS AND MONITORING O.' F..xPF.RIMESTAL p.~ 64
4.2.3.5 Sample Contact With Test Slab
To improve the thermal conductivity between the sampI es and rider slab and hence obtain similar
temperature profiles, the surface of the rider slab where sampI es were placed was ground. The
set was then sent through the fumace.
During sample retrieval towards the end of the fumace the sampI es tended to stick to the slab
surface and difficulties were encountered in removing them. Therefore, in the subsequent trials,
samples were placed on the "as is" slab surface.
4.3 FULL TRIALS
Based on the findings of the pre-trials, a procedure was developed in order to conduct the full
trials. These trials were mainly to determine the effect of various fumace parameters, such as
slab resldence time in the furnace, temperature profiles, and fumace atmosphere, on the scaling
rates and the characteristics of scale forming 011 selected steels.
4.4 MONITORED EXPERIMENTAL PARAMETERS
A number of parameters were monitored during the course of each experiment. These
parameters included fuel composition (CH4, H2' CO, O;J, in-fumace gaseous components (02,
COz and CO), fuel and combustion air flow rates, and slab data such as predicted slab
temperatures and slab walking rates through the fumace.. The methodology of these
measurements is discussed as follows;

J
1
•• f'RE.11UALS AND MONITORING OF EXPERIMENTAL PARAMETERS 65
4.4.1 Fuel Composition
It was necessary to analyze fuel composition in Nder to be able to calculate actual/stoichiometric
air ratios. The analyses were done utilizing the two fuel analyzers described in Section (3.4).
The fuel delivered to the bu mers was homogeneous in composition. This is because the fuel was
mixed in the gas mixing station located before the main fuel delivery pipe, where natural gas
and coke oven gas were mixed. The point of measurement was at a pipe leading to one of the
bumers at the intermediate zone. Water vapour was filtered out to protect the analyzer, using
a silica absorption mixture boule locate<! near the analyzer inlet line.
4.4.2 In-Fumace Atmospbere
The gas components inside the fumace were monitored with the sampling probes and the flue
gas analyzer described in Section (3.4). The two water cooled sampling probes were inserted
about one meter distance through the side walls of the soak and intermediate zones. The points
of measurement remained the same for all the trials. The data was acquired by the McGill data
acquisition system.
The water cooled sampling probes deliver the cooled gas by suction applied by a built-in
analyzer pump at a rate of about 1.S litres per minute.
4.4.3 Air and Fuel Flow Rates
Air and fuel flow rates were collected every minute by the Honeywell system and are reported
in Nm~/".
4.4.4 Sample and Slab Temperature
The Thermophil-Stor, Section (3.5.1), was an independent unit used ta meas.ure temperatures

1
•• PlŒ .. 11UAI.'i Al\/O MONITORJ!l/G o.- FJePF.RJM.:''IITAL PARAMEn:RS 66
in a very high temperature environment, e.g., moving slabs in a reheat furnace. The unit was
placed on the slab and passed through the fumace. Holes were drilled at selected points in the
steel sample and slab, and K-type thermocouples were inserted tightly in the holes and connected
to the measuring circuit of the Thermophil-Stor. After leaving the fumace, the instrument was
connected to a compensation recorder and the stored information was retrieved.

J
.......... _~~~ ................................................ -
5.1 INTRODUCTION
CHAPTER
FI"E
DAT A PROCESSING
Severa! calculations were applied to the raw data collected during the experiments. The collected
data from the fumace such as air and fuel flow rates, fuel composition, in-furnace atmosphere
and sIab data were all down loaded in separate ASeI files, the largest files bemg the air and fuel
flow rates, which were collected every minute. In order to do the caIculatlOns, e.g., air ratios,
the appropriate files were imported to a Lotus work sheet.
The sample's scaling rates were evaluated by different means such as oxygen welght gain per
steel surface area, percent steel loss due to scaling and steel oxidized depth. The scaling rates
as a function of temperature, Le., the parabolic rate constants, were aIso evaluated. Mos~ of the
graphica! representations were processed using FreeLance soft ware.
In this chapter, the methods of calculations of the above mentioned parameters are provided.
67

1
1
----- ---------
4. DATA PROCESSING 68
S.2 CALCULATIONS OF THE EFFECTIVE AIR RATIOS
For each experiment the actuallstoichiometric air ratio was calculated for each of the individual
zones of the furnace. However, the effective air fuel ratio is the ratio which samples actually
meel as they lravel lhrough the fumace. Thus, as the samples are walked through the fumace,
the total air ratio for ail the subsequent zones of the fumace ahead of the samples (except for
the preheat zone) must be averaged according to net air and gas flows.
The calculations of the effective air ratios start with the collection of the air and fuel flow rates
for the individual zones. A sample of the raw data for air and fuel flow rates for one of the
trials. from the Honeywell system, is given in Table(5.1).
The stoichiometric air, QSk>lcb.au (Nm3/h), is calculated by the equation;
Where QtoIaI.fuel and X are, respectively, the total fuel flow rate (Nm3/ hour) and the percent gilS
composition in fuel.
The above equation is based on stoichiometric gas reactions with combustion air,
Section (2.6.1).

1
•• DATA PROCESSING 69
Table(S.1) Typical five minute samples of air and fuel now rates collected from the industrial fumace (flow rates are in Nm3/h).
TlME (minutel) 1 2 J 4 5
AJR(TOP,CHARGE ZONE) 6051 58 60J3879 6159.32 6493 143 6900 45
AJR(B01TOM,CHARGE ZONE) 29156.16 28972 41 28759 JI 287W K6 21109162
FUEl(TOP,CHARGE ZONE) 710.26 72781 70772 '148 SS 741 fIS
FUEL(BOTrOM,CHARGE ZONE) 416656 4117 60 4072.10 41011 48 4030 16
AJR(TOP NORTH,INTERMEDIATE) 6538.59 6521 92 6458.09 647690 6446 Sil
AJR(BOTTOM NORTH,INTERMEDIATE) 488789 4796 19 S5804S 64~1I 73 732017
AIR(TOP SOUTH.lNTF.RMEDlATE) 6774 13 6644 85 651357 M9~ 26 b546 78
AIR(BOTTOM SOUTH,INTERMEDIATE) 1341.92 \3385S 1461 IS 155321 1736 43
FUEL(TOP NORTH,INTERMEDIA TE) 109265 107647 105386 106472 1045 ~~
FUEL(BOT1'OM NORTH,INTERMEDIATE) 68695 708.65 7354S 76910 77904
FUEL(TOP SOUTH,INTERMEDIATE) 1115.53 1102 88 107536 1011014 1061 011
FUEL(BOTrOM SOUTH,INTERMEDIATE) 21982 21966 21740 27893 24993
AIR(TOP NORTH,SOAK) 371434 367032 359034 3504 ~4 342037
AIR(80'ITOM NORTH,SOAl<) 2940.79 298090 298923 300746 306017
AIR(TOP SOUTH,SOAK) 415518 412028 4085 14 4094 Il 411374
A.IR(8O'ITOM SOUTH,SOAl<) 362844 3740 15 3112062 311M3 18 3961 113
FUEL(TOP NORTH,SOAl<) 605.09 58630 56639 546 lfi 53070
FUEL(BOTTOM NORTH ,SOAl<) 477 27 49442 47856 498 12 506 16
FUEL(TOP SOUTH,SOAl<) 673.37 67865 65689 667 15 M3611
FUEL(BOTTOM SOUTH,SOAK) 58926 62908 63104 636113 632 611
FUllNACE TOT AL AIR 6918904 6881947 69477 24 70112712 72204 liS
FURNACE TOT AL FUEL 1033676 10341 52 1019477 10398 711 10241 03

1
J
•. DATA PltOCF..sSING 70
The dimensionless air ratio,R, is then computed as;
(5.2) =
where QfllCb Q.ctual •• ., are the fuel flow rate and actual air flow rate given to the system,
respectivel y.
Table(5.2) gives the fuel composition monitored on Hne and a1so calculations for the air ratio
using equation (5.2).
Table (5.2) Five minute sarnple calculations of air ratios (flow rates are in Nm3/h).
TIME %CH4 %H2 %02 QIllIaI,fuel QSlDK:b • .., Qactual.81r RATIO
(min.) Table(5.1) Eqt. (5.1) Table (5.1) (R)
Eqt. (5.2)
1 38.2 21.4 2.5 10336.76 41625.71 69189.04 1.66
2 38.4 20.8 2.6 10341.52 41644.88 68819.47 1.65
3 38.2 21.6 2.5 10194.77 41102.45 69477.24 1.69
4 38.3 22.0 2.5 10398.78 42122.96 70827.72 1.68
5 38.0 22.3 2.5 10241.03 41264.59 72204.85 1.75

l
4. DATA PROCESSL"IiG 71
5.3 METHODS FOR THE EVALUATION OF SCALING RATES
Scale forming on the steel samples can be recorded and characterized in at least three ways,
(1) oxygen weight gain per steel surface area per time and temperature, (2) oxidised steel depth.
and (3) weight of steel oxidized per weight of steel reheated (percent loss).
5.3.1 Oxygen Weigbt Gain
As discussed in Chapter Two, the composition of the scale is about 95 % FeO, 4 % Fe30 .. and
1 %F~03' Based on this assumption the scaling rate was measured. A sample calculation is given
in Table (5.3).
5.3.2 Reaction Parabolic Rate Constant
Based on the experiments and literature, the oxidation of iron follows the parabolic rate law.
As has been derived in Chapter Two, the parabolic behaviour can be expressed as
(5.3)
Where k\ x and t represent the parabolic rate constant, the scale th ickness , and time
respectively.
Integrating the above equation;
(5.4)

•• DATA l'ROCESSING 72
Table (5.3) Sample Calculation of weight gain per surface area.
Note: For calculations of column number S, it is assumed that scale composition is 9S%
FeO,5% Fe;,O. and that the two oxides consi~ of the stoichiometric value of oxygen, i.e.,
22.26% atomic oxygen in FeO and 27.64% atomic oxygen in Fe;,O ••
TIME AVERAGE THICKNESS SCALE OXYGEN gOllYlm/cm2
(min.) SURFACE (mm) WEIGHT WEIGHT
AREA (g) (g)
(cm2) See assumption
50 3.61 0.3 0.5232 0.1179 0.03266
88 11.91 1.0 6.1536 1.3868 0.11644
110 17.26 1.6 13.0369 2.9381 0.17022
132 17.35 2.0 17.2060 3.8777 0.2235
189 17.56 3.0 24.8431 5.5989 0.3188
Where Xi and x( are the initial and final scale thickness at ~ and ft, the initial and final time of
measurement respectively.
and hence
(5.S)
1 The above equation can be expressed in terms of weight gain per surface area (g./cm4.s) as;

'J 1
4. DATA PROCF,SSING 73
(.5.6)
Where ~, ~, mr and A represent the parabolic rate constant used in conjunctlOn with the
weight gain, the initial and final oxygen weight in measured scale, and the oxidized steel surface
area, respectively.
Equation (5.6) was used to evaluate the weight gain as a function of time. A sam pie ca\culation
for the parabolic rate constant is given in Table (5.4) .
.5.3.3 CalculatioDS of the Arrhenius plot
From reported previous work, Section (2.4.2), the paraboIic rate constant increascd
exponentially with temperature according to the Arrhenius equation;
-(2
k =ke 7tT p 0
Where ko is a constant dependent on gas composition, steel grade, etc ..
Q is the activation energy of the reaction (Joules or calories)
Ris the gas constant (8.314 joulesl K.mo)e or 1.987 calories/K. mole.)
T is the temperature (Kelvin).
Taking the logarithms of both sides of the above equation gives;
(5.7)
(5.8)

1 •• DATA PRO($SSING 74
Table (5.4) Sample calculations of the parabolic rate constants for ex periment No. 7.
TEMPERA TURE (m,! A)2 (m,lA)2 t, ~ Je.,
(K) (s) (s) (g2/cm4 s)
600 0 0.00117 0 2634 4.44xlO-7
650 0.00117 0.0016 2634 2963 1.31xlO~
750 0.0016 0.0025 2963 3292 2.74xlO~
850 0.0025 0.0052 3292 4170 3.08xlO~
950 0.0052 0.01 4170 4800 7.62xlO~
1050 0.01 0.0153 4800 5268 1. 13x10-5
1150 0.0153 0.0307 5268 6584 1. 17xlO-5
1200 0.0307 0.0827 6584 9878 1.58xlO-5
Hence a plot of In(k..> vs (lIT) gives a straight line with a sI ope equal to (-Q/R) and an
intercept, In(~). a constant.
5.3.4 Oxidized Steel Depth
ln determining the oxidized depth of mild steel, the following assumptions were made;
1 - The density of mild steel is similar to that for pure iron, 7.86 (g/cm3).
1 2 - Scale composition is 95% FeO and 5% Fe30 4 •

1
1
•• DATA PROCESSING 75
Knowing that there is 77.4% Fe in FeO, the oxidized depth of steel, d.lftf (mm), is determined
by the equation;
(5.9)
where F and XwcaJe represent a conversion factor and scale thickness (millimetres), respectively.
The conversion factor, F, is expressed as;
F = (Ds(GI~) •. (%FefWJ)
(Dst,,/)
Where Dlelle and Dsltcl are the densities of scale and steel, respectively.
The density of scale can be expressed as;
where WtleaJe is the weight of scale.
(5.10)
(5.11)
Five samples were used to determine the scale density as shown in Table (5.5). Thesc tive
samples are of different thicknesses, Le., different residence times in the furnace.
5.3.5 Percent Steel Loss Due to Scaling
For industrial evaluations it is practical to report steel loss due to scaling in terms of a percent
loss. This approach is specifically based on actuaI slab wp.ight and dimensions which are
available at the level II computer (Vax System). The weight loss of steel by scaling per unit
weight of steel
reheated is determined from the equation;

1 •• DATA l'ROCESSING
Table (S.5) Measurement of seale density and the conversion factor, F.
SURFACE THICKNESS WEIGHT DENSITY
AREA (cm) (grarns) (g/cm~
(cm2)
sample 1 12.7 0.35 19.26 4.34
sam pie 2 10.0 0.32 13.49 4.22
sample 3 8.3 0.22 7.21 3.9
sample 4 8.3 0.1 3.57 4.3
sample 5 3.8 0.08 1.07 3.5
AVERAGE 4.1
w = S. W, . (%Fescaù) • 100
where W = % loss (mass of steel scaled (g) / mass of steel reheated (g»
S = (surface area of steel (cm2l/mass of steel (g»
W. = weight gain (mass of scale (g)/ surface area of steel (cm2)
%Fe = percent iron content in the scale.
76
FACTOR
(F)
0.427
0.416
0.384
0.423
0.345
0.400
(S. 12)
The value S is determined from the weight and dimensions of actuallong and short sIabs. The
value was averaged to 0.01221 (cm2slre/gslreJ.
1 In the calculations. it was assumed that

•• DATA PROCESSING 77
1 . Steel is 100% Fe .
. Scale consists of 95 % FeO and 5 % F~04'
A sample calculation of percent steel loss is given in Table (5.6).
Table (5.6) Calculations of percent loss of steel due to scaling for a trial.
TIME Wc W. W
(minutes) (gSCa1el cm2) (g,ltc.J cm 2) (%Ioss)
53 0.149 0.1149 0.14
--85 0.318 0.2465 0.30
111 0.468 0.3610 0.44
161 0.743 0.5732 0.69
281 1.353 1.0438 1.27
,

I
6.1 INTRODUCTION
CHAPTER
SIX
DISCUSSION OF EXPERIMENTAL
CONDITIONS AND RESULTS
The scalc trials undertaken in this work require a consideration of the different parameters being
monitored and of their behaviour. For industrial trials, unlike weIl control1ed laboratory
conditions. paramctcrs sllch as oxidizing atrnosphere, temperature. samples residence time in the
(umaœ. clt: .. lllffcr from one experiment ta another. Moreover, sorne of these parameters
IllKtuatc ewn WIl11l1l c'<pcrimcnts. Thlls. one of the major diftïculties experienced III executing
Ihls WOI h.. wa,> to atlalll slmrIar experimental conditions and hence good repeatability. This was
duc 10 lite compk"!xlty and many control variables in the reheating process. During a heatIllg
I:Yclc. paramctcrs ~JlIch as mllI dclays, charge type, gaps between slabs in the fumace, etc .. ,
rc~ultcd III ll11ctuations ln t'limace operating conditions. However, the most critical vanable for
our tnals was mill Jelays. It is qUlte common for things to go wrong with the rolling mill,
thcreby Ilccessitatlllg a hold up of fumace discharging, i.e., an immediate change in fumace
tinng rates.
In this work, the full trials have been divided into two segments, corresponding to low and hlgh
alr/fucl ratios. A set of four experiments for each was conducted. This nurnber does not
78
1

6. DISCUSSION OF RXI'ERlMI-:''iTALCONDI110:\'S AND RESULTS 79
represent the total trials undertaken, in total, about 30 trials were undertaken. Howevcr, it was
only for the last eight that OUf team succeeded in bringing the fumace under satisfaclory control
as problems were encountered along the way.
In this chapter, a discussion of trial conditions, scaling, and scale characteristlcs, arc prcsented.
6.2 CONDITIONS FOR TRIALS
Because of the size of the reheat furnace and the large number of variables involved 111 the
control system, practlcally every parameter in the l'limace sllch as air and fuel tlow rates, and
hence fumace atmosphere were constantly changing. Tnals \Vere thell conductcd lI~lng the
strategy of maintaming ail set parameters constant 50 as to achlcve a rcasonably good
repeatability. In this section, the different parameters such as air and fue! tlow rates, fuel
composition, fumace atmosphere and slab and sample temperature are considered.
6.2.1 Air and Fuel Flow rates
Air and fuel tlow rates are controlled by the fumace control system whlch 'l~es the computcd
slab temperature in the furnace as the basis for Its control algorithm. When the ~lab tcmperaturc,
calculated by the fllrnace model, 1S lower than the set pOInt at a particular zone ln the furnace,
the Level II control, Vax system, demands more heat tlux from the Level 1 control ~y~tcm. The
Level l control system then responds by openl11g the fuel and aIr valves tu provlde hlghcr Ileatlng
rates and visa versa The telllperature set point also varies wlth steel grade, slab "Î7t:, c:tc . I:ach
individual zone in the furnace operates independently and hcnce, when C0I1)ltJcnng thl~ total
fllrnace operation, tluctuations anse. These flLlctuatlons ln heatlllg rates arc a\<'o a fUIlctIon 01
a nllmber of other parameters, such as initial temperatures of chargcd ~Iabs, gap'> bl'twel:tl .,Iab-;,
mill delays, production rates, etc. AlI of these factors make Il almost Împ()~~lble to n:producc
exactly the same conditions between the different trials.

1
6. DISCUSSION OF E.XPERll\ŒNTAL CONDI110NS AI'ID RF..slll.TS 80
Figures (6.1 a&b) and Figure (6.2 a&b) present typical air and fuel tlow rates for the charge.
intermediate, soak zones and for the entire furnace. It can be seen from these figures that the
response of fuel flows to changes in air fk)ws exhibits a time lag and also that at sOllle periods.
the air/fuel ratio approaches a minimum, while at other times it is very high. ft is this
mechanical behaviour of the air and fuel valves that introduce tluctuations in the oxidizing
gases within the furnace. It can also be seen from these figures, that the behaviour of the
individual zones is independent. Because of the heating requirements, the amount of air and fuel
injected into the individual zones changes with time. It is only the soak zone that cxhibits a less
fluctuating behaviour. Considcring the behaviour of the entire fllmace, it can he secn that
constant conditions are relatively short lived.
For repeat trials, aillled at achieving simllar conditions, specified furnace operations were
practiced, by choosing clear runs with no scheduled mill delays, choosing similar steel line-ups,
and setting the furnace to manllal control. Further discussion of sorne of these clements arc
presented below.
6.2.2 Fuel Composition
The fllmace uses a mixture of naturai gas and coke oyen gas and fuel oi 1 as the combustion fucl.
Fueloil was not used in any of the trials. Further, the leve]s of gas components, rnainly CH4
and H2' are inversely proportional. The proportir)lls of coke oyen gas (mainly H2) and natural
gas (mainly CH4), depend on their availability, and also on gas distribution withi n the steel plant.
Figure (6.3) gives a typical on-Hne analysis of the fuel.
6.2.3 Furnace Atmosphere
A multi-component gas exists in the reheat fumace. Thesc components can be divldcd into two
categories, those that are products of combustion such as CO2 , H20 and those

1
6. VlSCUSSION (n' EXI'J.:RlMENTALCONDl1l0NS AND RESULTS
60000
54000
4.0001
42000
------- -------------------,1 -~
~Ii ~
36000 J: - 30000 ct)
E i
Z 24000 !
18000
12000 , '" o' \ ; ........ " .... ,... ." " ..
6000 ! ..., .. 0. •••• • o •• •
1 ' ....... fI' ..
(a)
o 50 100 150 200 250 300
TIME (minutes)
60000 '
54000 AIR -1
48000
420001
1
36000 !
..r::. 30000 ;;- 1
E'24000 i
Z 18000 i 1
12000 :
6000 ~.o_o\ •• ' •••••••• ,. ,.0 ...... • 1 ••••• ---'. • ' .... -_ ••••
.. ". -.. " (b)
o 50 100 1 !Ct) 200 250 300
TIME (minutes)
Figure (6.1) Air and fuel flow rates in Nonnal cubic meters per hour for
(a) the charge zone, and (b) the intennediate zone.
81

1
1
6. DISCUSSION OF E.XPERL"1E.~TAL CONDITIONS AND RESUI.TS
60000 --------------------
I;~II 540001
48000 '
42000
€. 36000 C")
E 30000 Z 24000~: 18000
12000
6000
---"----"
,. .... -... \ ..... -_._ ... ~.----._ ..... -............. _--_ ............ , ..
o
117000
108000
99000 i
90000 '
81000
:E. 72000 C")
E 63000,
Z 54000;
45000 : i
36000 !
270001
50 100 150 200
TIME (minutes)
18000 ; ..... '\ .......... , ," .,-.. .1-'. • ' ........ 1, ....... ·... ..#,.,.
9000 1 ' •• "
o 50 100 150 200
TIME (minutes)
1 ,
(a)
250 300
(b)
250 300
Figure (6.2) Air and fuel flow rates in nonnal cubic meters per hour for
(a) the soak zone, and (b) the entire furnace.
82

1
6. OISCUl>SroN OF EXPERJ:\tE.'l/TAL CO~DITIONS 1\.'11) RESULTS
... Z W Z 0 Q. :e 0 (J
'#.
80 76 72 68 64 -60 56 -
52 48 44 40 36 32 28 24 -
20 -16 -
12 8
4
o o
CH4 i-l
H2 1 ___ .. _
02 -'" #\
I, C02 '. " ... l'
1 1 , ... ' 1., li' ' 1 , 1 , 1
1
CO l" _._. - J .' , ' 1 • , ,
"
'1 , '-,\ :
" "
" .. '., ',. ' ..
50 100 150 200 250 300
TIME (minutes)
Figure (6.3) On hoe analysis of fuel mixture gas composition.
83
resliiting from mcomplete combustion slIch, as CO, O2 and hydrocarbons together with N2• The
levels of these gases depend on a number of factors such as fuel composition, air and fuel ratio,
and infiltrated air (especially from furnace door openings). During the trials only O2, COz and

,
1
1
6. DISCUSSION OF EXPERL\ŒNTAL CONDITIONS AND RESUL TS 84
CO were monitored. Monitoring of water vapour was not possible at the time of the trials. A
typical ; l-fumace gas measurement is given in Figure (6.4) from which it can be seen that the
concentrations of CO2 and CO are invcrsely proportion al to the concentration of O2, The more
important observation from the figure, is that the concentration levels of these gases are far from
stable. More discussion of these will be given below.
::rT! ~ 10 Z
1 1 1 1 1 1 1
1 1 1 ~ Iii LU Z o 0.. :E o (J
cf?
8 1 l , 1 1 1 1
6 " 1 Vl.,"-'[I ,,·LI 1 1 ~ i 1 1 1 \,- "1 1\\ l' d Il l' 1 ~ 1 1 d l,VI \,' ,T' .",' 'fi" j',,' • ", I~ () 1
1\ 1 1) , ' "VI \ , :< ,,1 " , 'II 1 1
, 1 , i' 1 1
4' '~:I
1 .; ~ i 2
OI~'~I~ (2)
o ~~~~------~--~~I~ 40 80 120 160 200 240 280 20 60 100 140 180 220 260 300
TIME (minutes)
Figure (6.4) In-furnace measurements of 0 1• COI and CO.

1 6. mSCUSSION OF rJeW..RIMENTAL CONDITIONS AND RESUI.1'S
6.3 DISCUSSION OF m~ OXIDATION OF MlLD STEEL FOR INDIVIDUAL
TRIAlS
85
To be able to investigate and compare the oxidation rates,it is important to discuss individual
parameters such as temperature, fumace atmosphere, samples residence time in the fumace, etc.
The chemical composition of the tested steel is given in Table (6.1).
Table (6.1) Chemical COOl position Gl teste. steel.
C Mn P S Si Cu Ni Cr Sn Al N:z Mo ~ ,
Min. 0.025 0.15 0.000 0.000 0.000 0.00 0.00 0.00 0.000 0.020 .003 0.00
Alm 0.040 0.20 0.040
Max 0.055 0.25 0.012 0.010 0.025 0.10 0.04 0.06 0.010 0.060 .007 0.02
6.3.1 Gas Components in the Fumace
As mentioned earlier, the trials were divided into high and low air/fuel ratios A set of four for
each condition, was undcrtaken in order to investigate the repeatability of the trials. Effective
air ratios. as calculated in section (4.3) are given in Figure (6.5). There, it can be seen that the
low effective air ratios ranges between 10 to 30% excess air. This ratio was the minimum that
can be achieved by the fumace control system. Most of the low oxygen trials feU in this lange,
except for one experiment where this ratio rose to about 60% excess air for a time period of
about 80 minutes. On the other hand, the high effective air/fuel ratio ranged between 40 ta 90%
excess air for the most part. These ratios are, of course, considered to be extremely high for
, such a fumace.

6. DlSCl!SSION OF E.,,(PERI~tE.'I1T'\1. CONDI110NS ,\''\'u RESUL TS 86
~ As mentioned earlier, the in-furnace gas components. 02' CO2 and CO in the lIHcrmcdiate .md
soak zones for the 10\ 1 2J'1 high air/fuel ratios, were momtorcd. These measurcmcnls arc glvcn
in Flg~res (6.6, 6.7, 6.8 & 6.9) respectively. From Figure (6.6), it can be seen that the Gy.ygen
levels achieved are reasonably low, for the most part. lt can also be seen that the levcJ of CO!
is inversely proportional to the O2 levels. This behaviour can be explained by considcnng the
fact that there IS just not enough excess oxygen to dllute the combustion prodUC'lS
3 ~ 1
2.9 - E~pt. 5 Expt. n F.xptb ~pt. 13 ' "-'0: 2 8 _1 .... - - J i r -:- - ....
• , 1 l '1 ! <ë 2.7 1; Expt. 4 Expt. ~ Expt. ~ 1 1
l) 2.6 -:- -! ___ et 1
a: 2.5 1
1- 2.4 1
~ 2.3 1
o 2.2 1
- 2.1 11 5 2 I~i\ - 1.9 IL , il "l • ~ 1.8 1- , , , n ; \n ~1 Cf) 1. 7 :. 1 • '; ~J f"V \ ~ 1. 6 ~- '. ! ~ il; : -- • 1 « 1.5 , 1 \ :
..J 1.4 ! 1 • 1 ,~ I~ ~ « 1 3 Il , : , Il!, r \', r.1\(}. 1 \ lI..."i ~ . • - r ~ ""~J .... ~:- 1 )~" "'I~~.. \1" 1" /,' t \'J:'
:JI- 1.2 !:.'t:;·~ ... ~,\-:",~.~"i .. / •• (.," \~/~,.".!l/~}~;'~ ~ ,\ '-J.r.1 \ 1 ~ ..... v." .\1.,01.,. " ,J: 1 )1,' ""1'
~ 1.1 ' ,,- i ; "", 1 l' • !: 1
___ 1
0.9 0.8 OL-1-4-1.0-~A-0 ---L-1...:...20------l-16L.0--L-2....!..00--24-0--'--2~80---J
20 60 100 140 180 220 260 300
TIME (minutes)
J Figure (6.S) Effective stoichiometric/actual air ratios for ail the experiments

1
1
12 1 i
~ 10 "("r J, ,"'\j, L'~' ,II. ''',\
Z li ,~I , ,~'Jr l '. ~r ,~ 1
W 8 '/1 i z 1<1"
~ ft 1 1
~ ~I' '1 ' 1 1
~~: a --r----- 1 1 ~---+-+---r-'----t-1
(2) 0 -20---;0-;--;-;00-';0 -~--;ëO-;Sëi2;; 2~O 240 2150 280 300
TIME (minutes) (Expt 1)
14
2 "l' 1 \ l ' " , \-1 l' d' ~~-'-~ ,
(2: -- _L~_~ ___ . __ ~ ___ _
o .0 40 60 80 100 120 ,~o 160 'BO 200 220 240 260 280 300
TIME (minutes) (Expt 3)
(2) L-~ __ -,-__ ~~L-_______ --.J
o 20 40 80 80 ,00,20 ~'O ,80 ,10 200 220 <:.0 Z80 280 300
TI ME (mir,utes)
14
!z w Z 8
ft 6 ~
~ 4
2
(Expt. 2)
1 1
l '
40 ao 120 160 200 240 2ao 20 60 100 140 180 220 260 300
TIME (minutes)
(Expt. 4)
Figu.·e (6.6) In-furnace measuremel1ts of O2 , CO: and CO for the low air/fuel ratio
experiments in the intel'mediate zone.
-------------------------------------
87

I
,. DlSCl:SSION OF EXPEIU~IE.'IiTAL CO!ll1>lll0SS AND RESl'LTS
--------------~ 40 60 80 100 120 140 160 '80 200 220 240 260 280 300
TIME (minutes) (Expt 1)
14[ \"
12} 11-. _________________ -' a 20 40 60 ao 100 120 "0 \ 60 , 80 200 220 240 260 280 300
TI ME (minutes) (Elt.pt 3)
~-------~ ---~--- ~~- ~----
12
(2) L-___ ~ ___ ~ __ ._ -. - - -.
a 20 40 80 80 100 120 UO 1110 1110 200 220 240 280 2110 300
TIME (minutes) (Expt 2)
14
21 o~-~ . ~ .
(2) ~------- -----o 40 80 120 160 200 240 280
20 60 1 00 140 180 <'20 260 300
TIME (minutes)
(Expt 4)
Figure (6.7) In-furnace measurements of Oz, COz and CO for the low air/rucl ratio
experiments in the soak zone.
This can be supported by the fact that CO is present in small concentratIons and that the rcactlon

1
6. I)JSCU~S'OS cU' U' .. :JlIME. ... TAI. CONDITIONS ",'\ID RF.sULTS 89
(6.1)
did not go to completion, hence the presence of CO. This can be seen from the graphs, such that
when oxygen lcvels me, carbon monoxide declines instantaneously. This observation is common
for ail four low al rtfuel ratio trials.
ln the ~oak zone, O2 and CO2 concentrations tluctuated qUlte rapldly. This behaviour
corresponded to openings of the dlscharge door. Each time a slab was dlscharged, a draft of air
entcred the fumace and hence 1I1creased the concentration of oxygen in the soak zone, with an
accordlllg declIll~ III CO] lcvcls. It has been seen From the intermediate and soak zones
mea~urCl11ents, that whcn the oxygen levels attall1 a mll11mUJ11 of about 0.5 %, the CO2 level
rcachcd a maXlIl1um of between 10 to Il %. Unfortunately, CO concentrations in the soak zone
were not measured, owing to a damaged CO cell in the analyzer.
In the case of high air/fuel ratio tnals, Figure (6.8), the intermediate zone oxygen levels
avcr?gcd about 3 % oxygen wlth concurrent levels of 6 to 7% CO2• Again, an inverse
proportlonality bctwcen O2 and CO2 was ob~erved. As a result of the high levels of oxygen, no
carbon 1110noxHIe could be dctcctcd Tlm supports the assumption that when oxygen IS not
prc..,cnl III ~uftïLlcnt aJllOllllt~, CO 15 prl.~cnt, and visa versa.
High alr/fllel ratios resulted l!1 extremely hlgh O2 levels 111 the soak zone, Figure (6.9). This is
bchcved to l'le the re~ult l)f the 11Igh exce~s aIr introduced in this zone due to air infiltration
through l'limace dl~charge doors, winch correspond to the high peaks in the graphs. It can also
l'le scen t'rom the graphs that CO2 levels were lower than O2 levels. High O2 levels were
mcasurrd in ail the high aIr/fuel ratIo experiments.
ln gcneral. the two pomts of measurements (intermediate and soak zones), can by no means be
consldcrcd as l'lcmg representative of the ent're furnace atmosphere.

1
,
6. DISCUSSION OF E-XPE:.RJME.'l/TAL CONDI110:-'S ,\.'iJ) RJo:"\l'l.TS
14
12 ~ :' l l ,
(2) a 20 4Cl 50 SA 100 120 140 160 180 200 220 240 260 260 300 TIME (minutes)
lJ 1
(Expt 5)
~ ~ ID 1
~ 8 1
o -- 1 CL. \. , ... , l """~ ~ 1 .. 1,
~ : 'l " "," ,.",,, .... ',,,'." '~' d-___ ~I~------~~
(2) a 20 ~o 60 ao 100 120 140 160 180 200 220 240 260 260 300
TIME (minutes) (Expt 1)
90
U - l
12
, ,
(2) 0 20 --;'60 B~-'-OO-;;o -;-~O-,;,o ';0200 220 ~~o 250 260 JOO
TIME (minutes) (Exp! 6)
14
12
(2' L-.~ ___ ~ __ ~_ ----- ~--
o 40 80 120 160 200 2~0 280 20 60 100 140 180 220 ?60 300
TIME (minutes)
(Expt. 8)
-o/~2 %Ç02 %CO 1
Figure (6.8) In-furnace rneasurements of O2, CO;! dnd CO for the high air/fuel natin
experiments in the intermediate zone.

1
1
6. UlSCIJSMON OF EXPf:JU~U:''IIT AL CO:'ODl1l0:'OS A. ... O RESULTS
o -.
12) 0 20 ~ii 60-6'0 ~ ! 20 ! 40 ',60--;-;0;00 220 2~0 2eO 280 300
TIME (minutes) (Expt 5)
14· !
1 i 12
1- ,0
~ B i '
~ ~ e-o ~ .
, 1
(2) 0 20 40 SO 80 100 120 140 ,80 180200220240 280 290 300
TIME (mInutes)
~ w Z o
14
12
0.. 6 ~
8 4 '#
(Exp!. 6)
1 1
(2) L~ _____ ~ ___ -=-_::::--, o 40 BO 120 160 200 240 280
20 60 100 140 180 220 260 300
TIME (minutes)
(Expt. 8)
Figure (6.9) In-furnace measurements of Oz, CO;! and CO for the high air/fuel ratio
experiments in the soak zone.
1
91

1
6. DISCUSSION OF EXI'FJUMENTAL CONDITIONS AND RF.St.rLTS 92
6.3.2 Temperature and Oxidation Rates
Temperature is known to be one of the most important parameters affecting rates of oxidation.
Higher temperatures accelerate the kinetics of oxidation in an exponentially increasing manner.
6.3.2.1 Oxidation Temperatures
As mentioned earlier, the temperatures used in this work are those predicted by the fumace
model for the top :;lab surface. However, from Thermophil-Stor trials, it was found that the
temperatures of the sarnples in the early stages of oxidation exceeded those predicted for of the
slab's top surface temperatures. At later stages, the temperature of the samples, and those of tl'le
top rider slab surface, were very similar. Figure (6.10) presents measured temperdtures of the
top and centre of the steel sample, along with temperatures for the top surface of the rider slab.
From this figure, it can be seen that the maximum temperature difference between the sample
and slab surface reached about 600 OC. This difference is a result of the size effeet as the slab
which aets as a much greater heat sink than the small sample. As a result, the slab surface
experiences a much slower heating rates versus the sarnple. In the later stages of reheatmg
however, the slab's top surface and the samples reach thermal equilibrium, resulting ID the
attainment of similar temperatures. However, during the trial, thermocouples failed, and
temperatures in the later stages of reheating were not measured.
Predicted temperature profiles for the low and high oxygen experiments are given in
Figures (6.11 & 6.12) respectively. From these figures, it can be seen that the temperature
behaviour is quite similar. That is, the samples are exposed to low initial temperatures at the
beginning of the oxidation period. A sharp increase in temperature is ,')hserved for the most part
of the trial duration. Near the end of the fumace, in the soak zone, temperatures

6. J)JSCUS~ION 011 .;Xl'ERJM.~"'ITAL CONDrnONS AND JŒ.SULTS
1,600
TOP RIDER
1,400 BOTTOM RIDER . ..... .. . SLBSURFACE
1,200
() , . , . . ,- # . . W 1,000 1- . . , . CI:
. , . . :J 1 . , . ~
. . 800 -
. . CI: . . W . . a.. . . ~ 600 W . 1-
. . . . 400 . . . . . . . . . 200 . . . . . . .
0 0 20 40 60 80 100 120
TIME (minutes)
Figure (6.10) Thennophil-Stor temperature measurements of sample and test slab
going through the reheat furnace.
93

1
" .
6. DISCUSSION OF EXPERJMEl\/TAL CONDITIONS A."D RESUJ.TS 94
04 04 1,300 1,300
036 -N 1,200 036 1,200
< 032 C'II
1 1,100 < 032 1 1,100
E ~ 028
~ 1,000 U E 1 ~ 028
1,000 Ü 1
900 W·
~ 024 a: 800 :J é 02 1 1 700 i , 1
;. 600 ~ 018
UJ 1 ' 1 500 0-
en 012 -1 ~ 1 400 W
~ ;. ~ 008
1-
!. : 300
t!l 1 1 200 004 - ,
t 100
0 0 0 50 100 150 200 250 300
25 75 125 175 22S 275
TIME (minutes) (Expt. 1)
04r----------------
Z ~ 024 a 02
IL. 0 16 0 Cf) 012
~ 008 ~
004 -
0
036 N
a 50 25
1
.1 AI/
1 1 1
1 • 1
1 1 i 1 i , 1
--"-, 1
100 150 200 75 12$ 175
TIME (minutes) (Expt. 2)
1
900 W·
800 a:
r :J
700 ~ 600 W 0-500 ~
i 400 ~ 1 300 1 2flO
ID_ 100
0 250 300
225 275
~ 1,300 1
1,200
1,100 ~::r l::;~~ ~ 028 _ 1,000 U UJ - ~o W
< 032 E ~ 028 Z
1,000 Ü
C!J 0 24 • 800 Il: g 02 • 700 ~ LI. 016 _ 600 W o i. -sooQ. en 012 1 - 400 ~ 1008 1 300 ~ C!J 004 1 - 200
! 100
~ 024
~ 02
15 016
Cf) 0 12 -
iooa C!'
004 6.
:. ' 900
800
100
~ 800
500
1 AI
1
400
.; 300
200
100 o .0r---50---'--~---------.I 0 100 150 200 250 300 OA--------·.:..-~-~---'--.J 0
25 75 125 175 225 275 a 50 100 150 200 250 300
TI ME (minutes) 75 125 115 225 215
TIME (minutes) 2S
(Expt. 3) (Expt. 4) - ----. --- --
TEMPEliATUAE W, 'iAIN J
Figure (6.11) Oxidation rates and temperatures for low oxygen experiments.
W Il: :J
~ W 0-~
~

1 6. DISCUSSION OF EXPERIMENTAL CONDITIONS AND RESULTS
04 1,300
036 1,200
'" < 0 32 1,100
E 0
1,000 C.) Z 0.28 900
~ 024 - 1100
~ 02 1 Ai 700 1 1 600
~ 018 t - 500
th 012
~00ll 400
1 1
300
(!) 200 004 -
1 100 t o~~~~~c~~~~~~~o
o 50 100 150 200 250 300 25 75 125 175 225 275
TIME (minutes) (Expt. 5)
04r;~11-,-,-,~-T~~~~ 1,300
N 036 (
1 1
l ,,1 1,200
- 1,100
W a::
i ~ ~
~
E 032 o Z 028 W
l , 1 1,000 C.)
o 024
S 02
LI.. 016 o (1)0 12-
~008 0004
• '. , .. ' 1 1
1 1
1
1 :
, ,
:
,
,
900 - 800
700
600
500
400
300
200 - 100
o ~_.L-=-..L-._~L-L-~-i--l---1--.J 0 o 50 100 150 200 250 300
25 75 125 115 225 215
TIME (minutes)
u.i a::
i W Cl. :i w 1-
o .4
N 0.38
( 032
~ 02 Z
Il
~ 0.24
S 0.2
~ 0.111
~ 0.12
iX 0.011 (!)
0.04
o
0.4
N 0.311
< 032 E ~ 028
~ 0:: ~ 0.16 ! 0.12
0.08 (!)
0.04
0
9.5
.. 1,300 ........ V ',200
1,100 V 1 1 1
1,000 C.)
• 1
V l · II A
i 1
1 1 / 1 -
900 w" IlOO
a:: 700 i ISOO
~ 500 ~ 400 ~ 300
200
100
o o 50 100 150 200 250 300
25 75 125 175 225 275
TIME (minutes) (Expt: 6)
1,300
1,200
1,100
1,000 C.)
900
800
700
600 500
• 400
300
• 200
100 A-~.L-.L-~..L-..L-~~~~~o 0 50 100 150 200 250 300
25 75 125 175 225 275
TIME (minutes)
w' a::
~ LU a. :1 ~
(Expt. 7) TEMPEB,ATURE W. ÇAIN 1
(Expt. 8)
Figure (6.12) Oxidation rates and temperatures for high oxygen experiments.

1
,. DISCUSSION OF EXI'FJUMENTAL CONDITIONS AND RESUL 1'5 96
gradually levelled off to a constant value of about 1250 oc. This observation was common for
all trials.
6.3.2.2 Parabolic Rate Constants and Arrhenius Plots
The parabolic rate constants for the individual experiments are calculated in section (5.3.2) and
prese"lted in Figure (6.21). The Arrherbs plot provides an indication of the parabolic fit for the
oxidation curves. It also serves as an educated guess for the classification of reaction kinetics,
i.e., chemical and/or diffusion controlled reactions. Although reactions detailed information will
need to be weIl known before a serious consideration of this method, one can nonetheless state
that in generaI, if the activation energy of a reaction is less than about 10 kJ, the reaction is
Iikely to be a chemically controlled reaction. On the other hand, if the activation energy of the
reaction is over 50 kI, the reaction is likely to be diffusion controlled, Rosenqvisf'. Between
these two ranges, the reaction is Iikely to be of mixed control. Figure (6.13 & 6.14) present the
Arrhenius plots for the low and high oxygen trials. From these figures, it can be seen that the
data exhibit fairly straight lines of In(k) vs. l\T. However, in the case of the low oxygen trials,
the activation energies were somehow lower than that for the high oxygen trials. In general, the
activation energies for ail the experiments were within the range of 40 to 60 kJ. This can be
taken as a rough indication that the controlling mechanisms are Iikely to be of the mixed
chemical and diffusion control.
6.3.2.3 Oxidation Rates
The oxidation curves for ail the experiments, Figures (6.11 & 6.12), can be characterized as
follows: the initial state of the samples is that there was no scale on the surface prior to
oxidation in the fumace. As the samples enter the fumace, scale nucleates at the clean surface.
The initial rates of oxidation, up to about 60 to 70 minutes, exhibit exponential behaviour, in
which a sharp increase in the rate of scaling observed. However, as the scale grows thicker, the

6. mSCUS!>ION 0)0' EXI'ERI;\IE:'liTAI.CONJ)l110NS A.~1l ~.sUI.TS 97
1
1/1)1 (11.5)
• (expt 3) (12) • (12) • ActIvatIon en erg y = 61 kJ
• (12.5) - • ~ (13) 1
• i (13) • • • • - • .s (14) .s (13.5) • • (14) (15) • • (Expt. 4)
(14.5) Activation energy = 38 kJ • (16) L-
5 6 7 8 9 10 11 12 13 (15)
5 6 7 • 9 10 11 12 13 (1/T,K) J{ 10000 (1/T,1C) If 10000
1 Figure (6.13) Arrhenius Plots for low oxygen experiments.

1
1
6. DISCUSSION OF EXPERIMENTAL CONDITIONS AND RESULTS
.. (10.5)
(11) • (11.5) • • (12) --t (12.5) • •
(13) • (13.5) •
(14) (Expt. 5) • Activation energy = 49 kJ (14.5)
6 7 8 5 9 10 11 12 13 (1/T,1O x 10000
(10) ..----------__ ---.
(11)
_ (12)
~ S (13) -
(14)
• •• •
• •
(Expt. 7) •
Activation en erg y = 59 kJ •
(15)S 6 7 8 9 10 11 12 13
(1/T,K) 110000
9%
(10.5' --- ~-----------
(11' .. (11.5)
• - (12' t • S (12.5)
• • (13) • (13.5) - (Expt. 6)
• Activation e~ergy ." 45 kJ (14) ~-...l--,"_J- __
5 6 7 8 9 10 11 12 (1/T,K) x 10000
(10.5) r------____ ___ _
(11) -
(11.5)
.... (12)
~ (12.5) -
(13) -
• • •
• • •
(13.5) • (Expt. 8)
(14) - Activation energy == 49 kJ •
13
(14.5) 5 , 7 8 9 10 --,-,-----,2-·-,3 (1/T,K) 110000
Figure (6.14) Arrhenius Plots for high oxygen experiments.

, 6. DISCVSSION OF EX ... :RIMENTAL CONDITIONS ~D RF.8ULTS 99
oxidation rate becomes more or less linear with time. The parabolic behaviour observed during
the initial oxidation was not observed owing to the fact that the increase in the sample's
temperature compensates for the deerease in scaling rates owing to diffusion limitations of iron
cations to the scale-gas interface or/and oxygen ions to the metal-oxide interface. The effeet of
these two factors seem to balance out on the basis of the present results. Owing to the pre~nce
of a complex gas environ ment within the fumace, the number of reactions taking place among
the various gaseous species and oxidants with steel are difticult to mode!. In general, it appears
that the initial rates of oxidation are so fast, that dissociation and adsorption of oxidant on the
metal surface are rate limiting. In the case of low oxygen, where carbon monoxide is in
abundance, il is reasonable to emphasise CO2 and water vapour reactions with steel. Smeltzerl7
has considered the mechanism of iron oxidation in CO2 to FeO. He explained these reactions as
follow;
Carbon dioxide dissociates on the metal surface as
(6.2)
Where ED(O) is a positive hole in the oxide-gas interface.
The oxygen adsorbed at the surface reacts with an iron cation creating an iron cation vacancy r:;o +. re D(D~ as;
(6.3)
The exchange of vacancies between the oxide-gas and metal-oxide interfaces, Le. the rate
controlling step, can be expressed according to :
(6.4)
-1 where Fe·· 0(1) and €a(,) are the cation vacancy and the positive hole at the m~tal-oxide

6. DISCUSSION OF EX'DUMENTAL CONDI110NS AND REStrLTS 100
interf&ce respectively.
At the metal-oxide interface, the following condition exist,
Fe + Fe" O(i) + 2$(i) i=! Null (6.5)
Adsorbed oxygen at the scale-gas interface fiUs the positive holes to produce molecular oxygen
as follows
(6.6)
Oxidation would obey a parabolic law if the concentrations of vacancies and positive holes in
equations (6.2, 6.3 & 6.6) were of sufficient magnitude to cause vacancy diffusion via its
gradient across the oxide scale, equation (6.4), to detennine the reaction rate. Since a tinear law
is assumed during the initial oxidation, equations (6.2, 6.3 & 6.6) are the rate determining
reactions during this initial period.
It is weil known that the oxidation oi most technical steels above 750 oC is, in the presence of
water vapour, faster than that for steel oxidation in oxygen or dry air, Per Kofstadl. The
reasons for this are poorly understood. Moreover, the presence of water vapour ln the
combustion products introduces different scale characteristics, such as poroslty and
microchannels, as will be discussed below.
The main water vapour reaction with iron that need to be considered here is as follows;
(6.7)
There is a disagreement among researchers whether water vapour oxidizes steel faster than
1 oxygen. In our case, oxygen certainly appears to have a more pronounced effect on the scaling

..... 1
•. mSCUSSION o.' U ... .ltI~U~"TAI.CONJ)l1l0Il1S ANI> RF.8UI.TS 101
rate of this particular steel. This is based on the faet that in the low air/fuel ratios, the water
vapour content was higher th an in the case of high air/fuel ratio experiments. This was obtained
by calculations of water vapour, using the F* A *C*T system, from actual fuel composition
values, Figure (6.15). The calculations were carried out for 10% and 50% excess air. One point
to note in this case is that the fuel compo!lition is not similar in the two experiments and hence
sorne of the differences in water vapour level can be attributed to this facto
6.3.2.4 Sam pIe Residence Time in Furnace
Sample's residence time in the fumace is extremely critical on the amount of seale formed. The
sample's walking rates through the fumaee for the high and low oxygen I!xperiments are
presented in Figures (6.16 & 6.17) respectively.
Sorne minor mill delays are observed in experiments number 3, 6, 7 and 8 whieh, however, did
not result in any major differences on the slopes of scaling curves. In general, as secn from
Figllres (tj. Il & 6. 12), longer residence limes in the fumace produced more scale, especially
when the hold-up was in the high temperature zones (heating and soak zones) of the fumace.
6.4 COMPARISON OF OXIDATION RATES
Having discussed the va.nous individual parameters influencing scale formation for the different
expcriments, a comparison of their scaling rates is considered.
6.4.1 Oxygen Weight Gain and Steel Loss
Figure (6.18) shows the scaling curves for aIl the experiments. ft can be seen from the figure
that a major difference in the oxidation curves exist between the low and high oxygen

1
1
6. DISCUSSION OF EXPf..RIME1'IJTAJ, CO:'llDITIO:'llS AND RESllLTS
60
55-
50
45 . ,
~.a .... - -1- - ... - - - - .... - -1 .....
W 35
230 ~ 25
~ 20
15
la 5
ai 0 la
20 30 40 50 60 70 80 90 100 110 120 130 140 150 160 17Q 180
TIME (minutes) 10% Excess Air
: I---------------·--.--~--~---l
~:i l.IJ Z 36
~ 30
~ 25
~ 20
15
1 1\
\ 1 \ _ ,_ _ -t _ _',
'\ l , ,'\ - ....... - ... 1 l' , , \ , \ " .... "
1 ( ~/,\ \~_-_1 ... _-ï-_,--li'" - - - - .... ____ . " ,,/ -, __ ..... _
1
1 , 1 \ 1 \ '" /
\ 1 \
., ',I ,
~----------------~~-------------------la' si :---:. , .... --:-.-: ... ;---:. __ : .• _;- __ ~ ___ : ___ ;- __ ~ __ -: oL.~~~_~~~~.~~~_~~ __ ~_~~ ___
a 10 20 30 40 sa 60 70 80 90 100 110 120 130 140 150 160 170 180
TlME (minutes) 50% Excess Air
t02
Figure (6.15) Calculated values of H10, 0 1 and COI for 10% and 50% exccss air tlsing in
t~'f! calculations the actual fuel composition values for low oxygen and high oxygen
experiments.

,
1
50
45
1
1
1
i
o ____ ~______JI
o 40 80 120 160 200 240 280 20 60 100 140 1110 220
TIME (mm utes) (Expt 1)
50 1 --- --- - ----
45
/ 40
ê 35
;; 30
~ 25 -< , ta 20
1
o 151
10 ! s' o L ________ -
o 40 80 • 20 160 200 240 20 60 100 140 180 220
TIME (minutes) (Expt 3)
260 300
J 280
260 300
45
_35 -E ~30
~ 25
t; 20 -
ES 15
10
5
103
o~--~--------~~--~--------~ 04080 280 120 160 200 240
50
45 -
40
ê 35
;; 30 (.) Z 25 --< t; 20
ë 15
10
5 -
0 0
20 60
40 20 60
100 140 180 220
TIME (minutes) (Expt. 2)
260 300
80 120 160 200 240 280 100 140 180 220 260 300
TIME (minutes) (Expt. 4)
Figure (6.16) Samples walking rate through the furnace for the low oxygen experiments.

1
li, DlSCt'O;:SION 01" E,"<I'ERI1\IE:'l/TAL CONDI110NS A."\ID RESl'I.TS
50,------ ~--~-~------ -------------,
:: i _35 ~ E ~30 -
~ 25 -< t; 20
ëS IS 1
1
1
1°1 ~ 51 O~I---------------------a 40 BO 120 160 200 240 280
20 60 100 140 180 220 260 300
TIME (minutes) (Expt 5)
50 --------- ------------ --_ -__ -,
45
40
35 '
::f ~ 20 t
15,
101 5
0:.....--------o 20 40 60 80 100 120 140 160 180200 220 240 260260300
TIME (minutes)
(Expt 7)
104
'7'1'; l , t 1
, , 1
1 1 1 1 1
" 1 1
l ' 1 1 : , ' 1 1
1 1 1 J 1
l " " 1 1 1
a 40 80 120 160 200 240 280 20 60 100 140 180 220 260 300
50'1---
45 1
40 :
1
§: 35
1 w JO
~ 25 < t; 20
15 15
10
5
TIME (mm utes) (Expt. 6)
1
o '------------~ ___ ~ __ J o 40 80 120 160 200 240 280
20 60 100 140 180 220 260 300
TIME (minutes)
(Expt 8)
Figure (6.17) Samples walking rate through the furnace for the high oxygcn expcl'imcnls.

----------------------------- ----- - ---
1 105
Figm'e (6 ... 8) Compéll'ison of oxidation rates among low and high oxygen experiments.
Note: dark points are for high oxygen experiments, hollow
points are for low oxygen experiments.

1
,. DISCUSSION OF EXPERIMENTAL CONDITIONS AND RESULTS 106
experiments. The low oxygen experiments produced 35 % less scale than those for the high
oxygen experiments. Although the slopes are almost equivalent, being slightly lower for the low
oxygen experiments, the main difference seems to exist during the initial time period within the
fumace. That is, in the low oxygen experiments, the initial scale formed was of less thickness.
This thinner scale served as a base for the growth of subsequent scale. This may indicate that
the initial mechanism controlling scale formation was the rate of reaction of oxygen reaction with
the clean metal surface, and because of the lower oxygen levels available for reaction, a
thinner, more coherent, layer of scale was formed. The low oxygen presence in this case was
supported by the fact that carbon monoxide, which is inversely proportional to oxygen, was
present, as discussed earlier.
On the other hand, the t, gh oxygen experiments initially formed much thicker scale, again
because of the presence of higher levels of oxygen. The oxidized depths and loss of steel, as
calculated in sections (3.5.4 & 5.3.5), for all the experiments are presented in Figures (6.19 &
6.20), respectively.
6.5.3 Parabolic Rate Constants
The other important parameter to be considered is the effect of temperature on the scaling rates
and whether this observed difference in scaling rates was because of the temperature factor. This
is considered by calculating the paraboIic rate constants for all of tht" experiments, section
(5.3.2). Figure (6.21) gives the parabolic rate constants for the low and high oxygen expcriments
as a function of temperature.
It can be clearly seen from the figure that the high oxygen experiments do in fact have high
oxidation rates. This faet supports the argument that oxygen in the fumaee is the key player in
determining the oxidation rates of the tested steel.

---------------------- -
1 fi. mSCUSSION 01; E.1CPFJUM.:'''''TAL CONIlITlONS AND RESULTS
:t: lll. W C C W N -C ->< o ...1 W w 1-en
2
1.8 1-
1.6 ~-
1.4 --
1.2 -
1 -
0.8
0.6 -
0.4 -
0.2 -
0 ... 0
-----Expt. 5 • Exp't. 1
:6
Expt. 2 0
Expt.3 * • Expt.4 0
Exp.t.6 1 A
Expt.7 •• 6. -• -Â Expt.8 •• 0*
1- - *0
•• Ô ('\ --'
•• ,\
Q-tJ -• * • ,\ U
0 1 1 i 1 1 1 1 1 1 1 1
50 100 150 200 25 75 125 175
TI ME (minutes)
0
* 0
1 L 1
250 225 275
Figure (6.19) Oxidizcd steel depth for low and higt~ oxygen experiments.
Note: d~U'k points are fOI' high oxygen expel'iments, hollow
points al'e fol' low oxygen expel"Ïrnents.
107
300

1
6. DISCUSSION OF E.XPF..RlME. .... TAL CONDIl10NS ,"'1/0 RESUL1S
'" '*' ~ U) U)
0 ..J ..J W W 1-fi)
1-Z W 0 Œ: W Q.
2
Expt.5 • Exp.t. 1
1.6 - :6
E~~t. 2 u
Expt.3 . -1.2 * -
Expt.4 0
lJ
* Expt. 6 • A 6. 0
0.8 Expt.7 •• * • .- D Expt. 8 • * - 0
tt..& L 0 0.4 • ~tn _.&
DL • 0
0 50 100 150 200 250 300 25 75 125 175 225 275
TIME (minutes)
Figure (6.20) Pel'cent steelloss for low and high oxygen experiments.
Note: dark points are for bigh oxygen experiments, hollow
points are for low oxygen experiments.
108

6. DISCUSSION OF EXPFJlIMJo:NTAI, CONDITIONS,\,."I> RF.sULTS
~ 2E-05 • ~
Exp_f. 1 (
.1 E 1 _J i 1
~ Expt.2 i • L_\ 1
( 1.5E-05 - EXllt.3 i
~ , ,
..... Expt.4 2 ~
~ Exp..t. 6 1 • • ~ 1E-05 • • 0 EXil. 7 (J
EXR,t.8 • ,--,
~ Â -~ • • ~ Expt.5 t: ( ) - • (J 5E-OB " ----- ____ --------.J L.. /; .... • tf} ..... • -
0 • • CD 1 ID • • ~
~ 0 1
'*' 1 ~ ,~
1 ,~
~ li ~
400 600 BOO 1,000 1,200 1,400 TEMPERATURE, C
Figure (6.21) The parabolic rate constants for alilow and high oxygen experimellts.
Note : clark points are for high oxygen experiments, hoUo"
points are for 10" oxygen experiments.
109

1
1
6. DISCUSSION OF EXPERIMENTAL CONDITIONS "''IID RESULTS liO
6.S SCALE STRUCTURE
The scale samples were subjected to an examination of their microstructure. Scanning Electron
Microscopy (SEM) was used to reveal the oxide phases present in the scale, using thc back
scatter technique. The various phases observed were identified using a microprobc.
6.5.1 General Cbaracteristics of Scale
In general, the scale consists of three solid phases, wustite (FeO), magnetite (F'cj 0 4) and
hematite (Fe:z03). The wustite phase being located adjacent to the metal substrate, was also the
thickest, and contained rnany voids of various sizes, together with cracks and tÏssur\!s, and
exhibits a rough interface with the steel. The voids and cracks in thi~ ph2.se were concentratcd
closer to the metal substrate where their concentration and size was largest. Figure (6.22) shows
a typical scale structure of the three oxides. It can also be seen from the tigure that thcrc arc
deep longer cracks, running parallel to the steel/scale interfacc. A hypothesls tor the ongllls of
the~,e cracks is discussed later.
Moving through the wustite phase, away from the steel side, one encounters an in<.:rcasing
number of magnetite crystals dispersed in the wushie. The magnetite phase present wllhm the
wustite varies in its concentration. In the areas near the pure wustlte, il is weil dlstnblltcd ln
small arnounts. Further away from the wustite phase, it had formed in larger amounts whlch arc
still well spread in the magnetite phase. Sorne of the cracks present in these arcas are sllrrpundcd
by magnetite. This suggests that rnolecular oxygen had penetrated these cracks, oxidizing the
wustite to magnetite. This is in accordance with the iron-oxygen phase diagram given in
Figure (2.3). These observations are comrnon to ail scales produced in this work.
The pure magnetite phase follows the wustite-magnetite matrix at a smooth lIltcrfaœ. lts relative
thickness , which grows proportional to wllstite, amounts to about 5 % of the total scalc 1/1 Illost
cases. Magnetite was not seen in the very early stages of oxidation. The lcvels of voids and

6. l)JSCU~"ION 01· .~Xl'EKIMJ:.N 1 AI. CONIlI110'l1"i ANII HESUI.l S
OXIDE/GAS ----
MAGNETITE -
w f-fen ::::> 5 + w f--f-w Z (!) <l: ~
WUSTITE
METAL/OXIDE ~.-~---~
Figure (6.22) A typical scate microstructure with its three phases, wustite (FeO),
mngnctitc (Fc30,J and hematite (Fel 0 3).
111

• •
1
,
6. DISCUSSION OF EXPERJMJo~TAI. CONDITIONS AlliO RESVI.I'S 112
cracks are much lower in magnetite than those for wustite.
Hematite, the riche st in oxygen content, was only secn in scale formed over longer periods of
oxidation. ft had formed at the outer surface of the scale with its relative thickncss amollntcd to
about 1 to 2 % of the total scale.
Considering the scales for the low and high oxygen experiments, sorne dllTcrenccs were found.
Figures (6.23 & 6.24) present the scale microstructure for the low and high oxygcll expcriments
respectively. In the low oxygen case, the scale contained practtcally no hemalite whereas in that
formed at high oxygen levels, hematite was present. Further. for the low oxygen cnvironments,
the magnetite layer was thinner. Il can also be seen that the wLlstlle-magnctite mterface is not
very smooth for the low oxygen case, and that veins of wustlte eXlst through Il. The wllstite
magnetite matrix for the low oxygen case is less th an that for the case of high oxygen. These
observations again support the belief that oxygen, in the low oxygcn cxpcnmcnts. is not
available in sufficient amollnts for oxidizing reactions.
6.S.1.1 Developmellt of Scale Cracks
A common feature of the scales is that they contains cracks of various sizes, al various lœations.
Crack development in no doubt caused by stress generation reslilting from the growing scale.
This phenomenon can be explained by considerifl'! the kir:etics of oxidatJon. ft IS suggested by
many researchers that scale growth takes place at various locations within the scale. One of these
locations is the scale-metal interface. Oxidants penetrate the scale to the metal Interface where
a new oxide is formcd. If the volume of the oxide is larger than the volume of metal from which
it is formed (Le., the Pilling-Bedworth Ratio,PBR), compressive stresses will develop within the
scale. The PBR in the case of iron is larger th an one and hence compressive stresses are
expected to develop in the oxide scale. On the other hand, if supposedly the ~cale grows only
by iron cation diffusion towards the gas interface, where the scale is secmingly stress free,
stresses in the scale will still develop due to the tendency of the scale to adhere to the metal

• / ------; -----::-.:.....:.-/
OXIDE/GAS
/ /
/
MAGNETITE
1
MAGNFTITE + WUSTITE i
WUSTITE
MET AL/OXIDE
----,
1
1
1
---J
--
1
1
1
L--~----~-
Figure (6.23) Sc~tlc microstructure for low oxygen experiment.
113

1 ~. DISCUSSION OF F.xI'F.RIMF..NTAL CONDITIONS AND RrSllLTS 114
OXIDE/GAS
MAGNETITE
WUSTITE
METAL/OXIDE
Figure (6.24) Scale microstructure for high oxygen experiment.

r t
,. I)JSCUS~IOS u .. · ":X"'JUM"::~iTAI. CONDITIONS A.'lil) ItJo:SUI.TS 115
surface while the meta) core volume decreases owing to cation diffusi ~. The stresses developed
can again result in the formation of cracks in the scale.
ln our case, most of the cracks observed were due to stresses developed in the scale during
coohng. When the metal and scale cool together, the volume of the metal contracts at a faster
rate th an that for the oxide, due to the higher coefficient of thermal expansion coefficient of the
metal. Because of this, shear stresses develop and introduced the cracks observed in the scale.
This explanation is supported by the fact that for most of these cracks, higher oxides around
their edges were not observed which woulct have been caused the penetration of oxygen gas
through them.
6.5.1.2 Development or Seale Void~ and Microchannels
A model for the continuous production of a porous inner layer is given by G. B. Gibbs and R.
lIalt~J. and is presented in Figure (6.25). Metal ions diffusing outward through different paths
in the scale will leave vacancies in the metal surface. These vacancies will condense at the
nearest area of exposed metal, undercutting the new oxide crystals as they grow. Because of the
low oxygen environment, these new crystals will grow at much slower rates than the rates of
vacancies condensation, causing an undercut of these crystal. This process will he repeated after
the nucleation of newer crystals.
Kofstad" has presented the work of Buckman and Mrowec of the proposed model for the
development of microchannels in growing scale, Figure (6.26). In their model, it is assumed that
the scale grows by outwald diffusion of meta: ions and, as a result, voids eventually develop at
the scale metal interface. ft was assumed that metal ion diffusion along grain boundaries is much
faster than lattice diffusion, and as a result of this, the grain boundary above the void opens up
and gradually forms a microchannel. The channel remains open as long as the chemical

"
1. DISCUSSION o.- .:X .. ::RIM.:NT AI, CONmnONS AND R.:"'iVI,TS
' .. ".r La,.,
METAL
////# :& ',e,"', '0'''''''' oald,
Figure (6.25) Schematic representation or the ronnation or sale porosity at the
metal-oxide interface, rrom G. B. Gibbs and R. HalesQ •
116

,
, •
O,(g) -...,---"f'--,
O • .... n· ROPld m.loi dl'fllslon ·"u n. .... ,'-...,. ,f- olon; grOin baundary COYlty, Y'
M.tQI/~' ,//////"
Op.nlng of grOin boundOry
MlCrocrOCIi. InwOrd 01 Ironscorl
StObllaZQllOn of ~Icro. croCll Il''IWOrd 0" IranSDOrl Out.arC ~IOI Iranse
117
Figure (6.26) Schematic illustration of the model for fonnation of microchannels in oxlde
scale by preferential out ward diffusion of metal ions along grain boundaries, from Kofstadl
potential of oxygen is equal at the interface of the channel to the inner part of the scale.
ln this chapter, most of the work presented bns been based entirely on industrial trials and data
collected during these trials. The c~mplexity and size of the furnace investigilted did not allow
for any comparisons with laboratory work conducted by sorne researchers. which was directly
or indirectly related to the oxidation of steel in reheating cycles. Howe"er, the consistency of
the results collected from the 350 ton/hour steel reheat fumace, was quite llcceptable.

1
7.1 INTRODUCTION
eflAPfER
SEVEN
CONCLUSIONS AND
SUGGESTION FOR .'UTURE WORK
The oxidation of a metal is usually studied undcr extremely weil control1cd expcrimental
conditions. Very sensitive equipment is used for this purpose sllch as Thermogravirnetric
Analyzers which can teet extremely small weight gains in the order of micrograms. Even
under these specified conditions, sorne of the experimental pararneters arc slIbJect to change from
one experiment to another, and hence good repredllcibllity is quite often hard to achievc.
In the case of our work, where we were dealing with a 350 ton/hour rchcat fumace, with a total
of 121 bumers installed in different locations and a huge nllmbcr of van ables that werc changing
minute by minute, expectations of reasonable expenment repeatability were low. Howcver, it
was expected that "bail park" information could be acquired for typical "industrial conditions".
Having these thoughts in mind, the re!lults obtained from this work were very consistent.
118

1
1
7. CO!llCI.UMONS AN" SUG(;"~"110NS "'OR nrn.:D. WORK 119
Consistent oxidation trends were obtained with excellent repeatability. On the other hand, this
work has raised more questions than answers regarding the mechanisms of the observed effects
and the rcasons behind them.
ln this chapter, the conc1u~ions to this scale work are stated, along with sorne recommendations
regarding the rcheat fumace. Also, suggestions for future work are outlined.
7.2 CONCLUSIONS
1 - Lirnited test results are available in the Iiterature on the oxidation of steel under conditions
approximating those of the reheat fumace.
The majority of the work described in the literature is Iimited to the oxidation of iron and steel
under weIl defined and constant experimental conditions. Conditions such as those that exist in
typical reheat fumaces are quite difficult to achieve in the laboratory. Therein lies the difficulty
of simulating reheat fumace conditions in a laboratory setting.
2 - A decreased amount of ex cess air for combustion, from about 70% to about 20%, resulted
in 35 % reduction in scale formation.
From the analysis of the fumace air and fuel flow rates and fuel composition, it was found that
the furnace typically operated with an average of about 70% excess air. After many attempts,
the excess air was lowered to about 20%. This adjustment in furnace control resulted in the
lowering of the oxygen levels in the furnace. The experiments were carried out at these two
extreme conditions and hence allowed us to attain a 35 % reduction in the amount of scale
formed.

1 7. CONCI.USIONS AND SUGGESTIONS FOR ."UnJRE WORK 120
This finding, although c1early due to the lower oxygen potential, docs not indicatc the way by
which this reduction was achieved. It may be a resuIt of many factors, such as the increasc in
CO, the lack of available oxygen to rcact with the metal, or/and other unknown factors. Thesl~
questions require detailed experiments under weil controlled conditions, simlilating industrial
fumace atmospheres and specific grades of steel.
3 - Longer residence times of steel in the furnace at higher temperatures resulted in the
formation of excessive amounts of scale.
This finding was of no surprise. It is weil known that longer exposllres at higher tempcratllres
result in the formation of more scale. Therefore, if the samplcs arc locatcd III the intermediatc
or soak zone of the fumace, scale was secn to be forming in excessive amounts. The fact that
when the scale is thicker, especially in these zones, this thtckness has very Itttic cffeet on the
rate of scale growth, and scaling was seen to proceed with little parabolic bchaviour, suggesting
that cracks and channels exist in the scale, through whtch the oxtdizl11g gases can penetrate. On
the other hand, when the steel is !l(lsitioned in zones of low temperatllres, such as the preheat
and charge zones, longer times at these zones had very little effeet on the amollnt of scale
formed.
4 - The fumace is operating with excessive amounts of combustion air.
As discussed in (1), al the time of these tests, the fumace was opcrating with an excess air of
about 70% average. This, of course is not desirable in many way~, such as a lower the adiabatic
fla me temperature plus excess oxygen and nitrogen are mtroduced in the furnace.

t
7. CO~CI.USIONS AND SUGGESll0~S FOR JolJ11JRE WORK 121
7.3 SUGGESTED FUTURE WORK
To be able to answer the many questions raised in this work regarding the effeet of the different
parameters on seale formation, a wide variety of laboratory work is suggested. This includes;
1 - Isothermal OXldatlOn experiments to determine the effeet of single oxidizing gases such as
O2, CO2 and H20 at different temperatures on the oxidation of selected steel.
2 - Isothermal oxidation experiments to determine the effeet of multi-component gases, and their
levels, and at different temperatures, on the oxidation of a selected steel.
3 - Experiments under time varying temperatures (Le., heating rates) approximating those in the
reheat furnace.
4 - Investigate the effeet of steel chemistry (Le., different steel grades) on oxidation rates.
5 - Investigate depth of decarburization zones vs sealing conditions.
6 - Investigate, or develop, an antl-oxldation material for steel coati~ ..: as an option.
7 - Apply the laboratory findings to the industrial reheat furnace.
8 - Develop a comprehensive scale formation model, based on the laboratory experiments, to
be tested with the industrial reheat furnace.
9 - Condllct a thorollgh investigatio:i on scale adhesion to the sllbstrate.

1 122
REFERENCES
1

1
123
1 - Per Kofstad, "High Temperature Corrosion", University of Oslo, Norway, 1988.
2 - R. F. Tyecote and T. E. Mitchell, "Marker Movement in the Oxidation of Iron and Sorne
Other Metals", Journal of The IroTt and Steellnsûtute, December 1969, pp. 445.
3 .. K. Sachs and C. W. Tuck, "Surface Oxidation of Steel in Industrial Furnaces", Iron and
Steellnstitute, Publication No. 111, London, 1968, pp. 1-17.
4 - L. Himmel, R. F. Mehl, and C. E. Birchenall, "Self-Diffusion of Iron in Iron Oxides and
the Wagner's Theory of Oxidation", Transactions AIME, Journal of Metals, June 1953.
5 - G. V. Samsonov, The Oxidation Handbook, Second edition, Institute of Problems in
Materials Science, Academy of Science of the Ukrainian SSR, Kiev, USSR.
6 - J. Kofstad and A. Zeev Hed, "Defect Structure Model for Wustite", E/ectrochem. Soc., Vol.
115. No. l, January 1968, pp 102-104.
7 - Kubaschewski and Hopkins, "Oxidation of Metals and Alloys", Second Edition, London,
Bl'tterworths. 1962.
8 - N. Blrks and G. H. Meier, "Introduction to High Temperature Oxidation of Metals" , 1983.
9 - Karl Hauffe, Oxidation of Metals, Based on the German edition of Oxidation von Metallen
und Metallegierungen, Translated, 1965.
10 . "Scaling of Steel in Hot Strip Mill", Steel-Rolling Technology, Theory and Practice, 1989,
Chapter 27.
Il - M. H. Davies, M. T. SlIlland and C. E. Blrchenall, "On the Mechanism and Kinetics of
the Scaling of Iron", Journal (~l Mewls, Transacriol1 A/ME, 1951.

1 124
12 - 1. Paidassi, "The Kinetics of the Air Oxidation of Iron in the Range 700-1200 Oc", Actll
Metallurgica, 1985, pp 184.
13 - Schmahl, N. G., H. Baumann u. H. Schenck, "Archiv Fur Das Eisenhuttenwesen, 29,
1958.
14 - J. K. Stanley, Miss J. von Hoene and R. T. Huntoon, "The Oxidation of Pure Iron",
Transaction of The A. S. M., Vol. 43, 1951, pp. 426.
15 - H. Engell und F. Weyer, "Uber Eineige Grundfragen Der Bildung Und Der Hartung Von
Zunder Auf Eisen, Acta Metallurgica, Vol. 5, 1957
16 Rahmel and Engell, "Uber Den Einflub Des Sa:Jcrstoffdruckcs Auf
Dieoxydationsgeschwindeitn Reinem Eisen", Archiv fur das Eisenllllltemvesen, 1959, pp. 743.
17 - W. W. Smeltzer, "The Kinetics of wustite Scale Formation on Iron", Aera Merallurgica,
Volume 8, 1960, pp. 377.
18 - A. Rahmel and J. Tobolski, "Einfluss Von Wasserdampf Und Kohlend:oxyd Auf Die
Oxidation Von Eisen in Sauerstoff Dei Hohen Temperaturen"·.
19 - D. W. Murphy, W. P. Wood and W. E. JOlTIlIly, "Scalmg of Steel al Elcvatcd
Temperatures by Reaction with Gases and the Propertie'i of the Rcsulting Oxidcs, Tnlll,W(,fiolls
of The A. S. S. T., January 1932, pp. 193.
20 - E. A. Cook and K. E. Rasmussen, "Scale-Free Heating of Slabs and Billets", fion allli
Steel Engineer Year Book, 1970, pp 175.
22 - Klaus H. Hemsath F. 1. Vereecke, "Methods of Minimum Scalc Rcheatlng" ,Mldland Ro,,~
Corporation, Toledo, Ohio. Mech. Working & Steel Processing XII, AIME, January 1974, pp

t
1
125
217-235.
23 - K. Sachs and C. W. Tuck, "Scale Growth During-Heating Cycles" , WerkstojJe und
Korrosion, 1970, pp. 945-954.
24 - Hans-Joachim Selenz and Franz Oeters, Il A Contribution to the Scaling of Steel in Technical
Flue Gases", Report from Institute for Metallurgy (Ferrous Metallurgy) of Berlin Technical
University.
25 - A. N. Minnev, V. M. Ol'Shanskii, M. M. Volkova, and N. 1. Shurova, "Scale Formation
on Steel Exposed to Gaseous Fuel Combustion Products", Steel in The USSR, December 1983,
pp. 576.
26 - David T. Blasevic, "Rolled in Scale - The Consistent problem", Homewood, Illinois, USA,
4'11 International Steel Rolling Conf. Vol. 1, Deauville, France, 1-3 June 1987.
27 - N. T. Ferguson, "Minimum Scale Reheating Application", Iron and steel Engineer Year
Book, 1973. pp. 254.
28 - C. R. Grigg and B. G. Sexton et al, "1420 mm Hot Strip Mill Control of Rolled-In-Scale" ,
4'h International Steel Rolling Conf.. Vol.}, Deauville, France, 1-3 June 1987.
29 - Clarence A. Siebert and Clair Upthegrove, "Ox;dation of Low Carbon Steel in The
Temperature Range 1650 to 2100 Degrees Fahr", Transactions of The A. S. M., March 1935.
30 - M. F. Taylor, "The Application of Thermodynamics to the Oxidation Behaviour of Mild
Steel in Carbon Dioxide-Based Atmospheres", Oxùlation ofMerals. Vol. 16, Nos. 112. 1981.
31 - D. P. Whittle. Spalling of Protective Oxide Scales", Oxidation of Metals. Vol. 4, No. 3,
1972.

1 126
32 - G. M. Raynaud and R. A. Rapp, "In Situ Observation of Whiskers, Pyral1l1ds and Pits
During the High-Temperature Oxidation of Metals" , Oxidation of Metals, Vol. 21, Nos. 1/2,
1984.
33 - G. B. Gibbs, "Model for Mild Steel OXldation In CO2, OxidalÎoll af Meral.\', Vol. 7, No.
3, 1973.
34 - S. Mrowec and A. Stoklosa, "Calculations of Parabolie Rate Constamts for Melal
Oxidation", Oxidation of Metals, Vol. 8, No. 6, 1974.
35 - C. A. Siebert, "The Effeet of Carbon Content on the Rate of Oxidation of Steel in air at
High Temperatures", Transactions of The A. S. M., September 1939.
36 - J. E. Antill, K. A. Peakall and J. B. Warburton, "Oxidation of Mild and Low-Alloy Steel
in CO2 Based Atmospheres", Corrflsiùn Science, Vol. 8, 1968, pp 689-701.
37 - Gregory J. Yurek, John P. Hlrth and Robert A. Rapp,"The FormatIon of Two-Phasc
Layered Scales on Pure Metals", OxhlatlUll of Meta/s. Vol. 8, No. 5. 197-l.
38 - F. S. Pettit and J. B. Wagner, "Transition from the Linear to Parabolic Rate Law During
the Oxidation of Iron to Wustite in CO-C02 Mixtures", Acta Meralllll~~/C({, VO/UII/(, 12, 1964.
pp 35.
39 - D. A. Vermilyea, "On the Mechanism of the Oxidation of Metals", Acta Ml'flJlIlII:~I('(l.
Vol. 5, 1957, pp 492-495.
40 - B. Pieraggi, "Calculations of Parabolic Reaction Rate Constants", Oxidatiol/ of Ml'W/.\.
Vol. 27, Nos. 3/4, 1987.
41 - Per Kofstad, "On The FormatIon of PoroSlty and Mlcrochannels 111 GrowlI1g Scalcs",

127
Oxidalion of Metals, Vol. 24, ;.Jos. 5/6, 1985.
42 - J. Robertson and M. 1. Manning, "Criteria for Formation of Single Layer, Duplex, and
Breakaway Scales on steels", The Inslilule of Metals
43 - G. B. Gibbs and R. Hales, "The Influence of Metal Lattice Vacancies on the Oxidation of
High Temperature Materials", Corrosion Science, Vol. 17, pp. 487 - 507, 1977.
44 - Book #3, Iron and Steel Institute of Japan, Handbook of Iron and Steel Making, Volume
3.
1 ,