scag tdm strategic plan final report with …...s a g tdm strategic plan and inal report 4 scag has...
TRANSCRIPT

SCAG TDM Strategic Plan and Final Report
A ugust, 2 0 1 9

SCAG TDM Strategic Plan and Final Report
Prepared b y :
Steer 8 0 0 W ilshire B lvd, Suite 1 3 2 0 ,L os A ngeles, C A 9 0 0 1 7
+ 1 (2 1 3 ) 42 5 0 9 9 0www.steergroup.com
Prepared for:
Southern California Association of G overnments9 0 0 W ilshire B lvd, Suite 1 7 0 0L os A ngeles, C A 9 0 0 1 7
Steer ref: 2 3 2 7 2 9 0 1
A ugust, 2 0 1 9
The contents of this report re ect the views of the author who is responsib le for the facts and accuracy of the data presented herein. The contents do not necessarily re ect the official views or policies of SCAG. This report does not constitute a standard, specification or regulation.
SC A G TDM Strategic Plan and F inal Report
3
1 .............. r ucti
1.1. Strategic Plan Process 5
1.2. Structure 5
1.3. Overview 5
2 .............. a ective a er rma ce ea ure
2.1. Alignment with 2016/2020 RTP/SCS Goals 8
2.2. SCAG TDM Goals, Objectives and Performance Measures 9
3 ............... TDM Toolbox 14
3.1. Purpose of the Toolbox 14
3.2. Framework for the Toolbox 14
3.3. Accessing the Toolbox 14
4 ............... e tia cati x S ra e e
4.1. Example Application on 10 Corridors in the SCAG Region 16
............... ec mme ati crea e e ective e
5.1. Knowledge Sharing 20
5.2. Policy and Regulation 21
5.3. Partnerships 23
5.4. Programming 27
5.5. Measurement 31
Appendix A . TDM Strategic Plan TAC Members
Appendix B . Commonly Used Terms
Appendix C . Literature Review
Appendix D. Existing Conditions Report and SWOT Analysis
Appendix E. TDM Technology Memo
Appendix F. Goals, Objectives and Performance Measures Memo
Appendix G. TDM Toolbox
Appendix H. Potential Application of TDM Toolbox Strategies
a e e

SC A G TDM Strategic Plan and F inal Report
4
SCAG has set out to deliver a long-range Transportation Demand Management (TDM) Strategic Plan for the Region that provides an objective-driven, performance-based planning framework for identifying TDM strategies and programs that increase the efficiency of the transportation system through alternative modes of travel.
Existing conditions established through stakeholder outreach and additional research revealed that the SCAG Region is home to an abundance of TDM strategy and delivery, most of which has been shaped by the region’s regulation. In particular, the South Coast Air Quality Management District’s (South Coast AQMD) Rule 2202 has set in place TDM programming for commuters on the county-wide, municipal and site levels. In contrast to the large amount of TDM programming in the region, there is very little data collection that ties directly to it, meaning that implementers may not be able to demonstrate the success of their programs in actually changing travel behavior. However, the technology available to SCAG region TDM practitioners is advancing quickly, and in addition to improving user experience, new mobility and technology services increasingly provide opportunities for better data collection.
An in-depth look at TDM technology and innovation internationally established both opportunities and challenges in incorporating new and innovative practices into SCAG Region TDM delivery. While providing improved access to alternative modes and opportunity for collection of additional and more complete data, integration of new technology is accompanied by the challenges of maneuvering privacy and data sharing requirements and added safety concerns. It also requires significant partnership between the public and private sectors, which can present additional challenges. When carried out at a municipal or sub-regional level, service across city or county lines may be inconsistent for users, discouraging use of the services altogether. Once these challenges are addressed however, even greater benefits from TDM delivery in the region will be recognized.
Formal goals, objectives and performance measures can help to shape TDM-related planning and policy on municipal, county and regional levels. Aligned with goals from past and future Regional Transportation Plans/Sustainable Communities Studies, SCAG’s TDM goals focus on improving air quality, public health and quality of life through improved mobility, access to alternative modes, and better information sharing. Each goal is tied to specific objectives and performance measures, with recommendations for data collection processes and resources, allowing SCAG to track progress against each objective.
In addition to the TDM goals and objectives, the exploration of existing conditions, international best practices, and the future of mobility helped to establish a set of recommendations for SCAG and SCAG Region implementors as they approach TDM moving forward. The recommendations address the challenges in TDM implementation region-wide across the following categories: knowledge sharing, policy, partnerships, programming and measurement.
Recommendations focus on specific actions that can be taken by SCAG and other agencies in the SCAG Region. Many recommendations build off the work that has already been undertaken by municipalities, county transportation commissions, and the South Coast AQMD to help the entire region move toward a system of TDM delivery that is up to date and impact driven. The highest priority recommendations include:• Developing a SCAG TDM web page.• Delivering training workshops to help
municipalities develop and successfully orchestrate TDM policy.
• Developing a formal regional TDM group.• Conducting a study aimed at better understanding
the success of incentives and other TDM strategies in changing travel behavior.
• Developing a regional clearing-house for TDM-related data.
Executive Summary

SC A G TDM Strategic Plan and F inal Report
5
To deliver this project, outreach was completed throughout the region through in person and phone interviews with major stakeholders, a survey delivered to TDM implementors, and coordination with a Technical Advisory Committee representing both the public and private sectors. est practices nationwide were examined, and a comprehensive overview completed of new mobility and technology services relating to TDM.
These elements were used to inform the development of a set of TDM goals, objectives and performance measures for the SCAG Region and to update the pre-existing TDM Toolbox of Strategies. The pre-existing Toolbox was focused more specifically on TDM strategies, and was reformatted to b ecome a more user-friendly and accessib le document for potential TDM stakeholders and implementors. The updated TDM Toolbox strategies were applied to ten corridors across the SCAG Region to demonstrate the manner in which they could be used to address real congestion and air quality concerns in the region.
Finally, a set of recommendations was developed for the SCAG Region, based on the existing conditions and strengths, weaknesses, opportunities and threats found within the region. Within each category one recommendation has been prioritized, based on its ability to be implemented successfully and have a lasting impact on the TDM landscape in the SCAG Region. It is intended that this report be distributed to a broad audience in the SC A G Region to help shape TDM strategy and implementation moving forward.
1 Introduction
1.1. Strategic Plan Process
1.2. Structure
This report presents a synthesis of the work undertaken through the development of the Transportation Demand Management (TDM) Strategic Plan Proj ect.
• Section provides an overview of key steps in the strategic analysis, including best practices, existing conditions, and technological advancements in TDM. It also summarizes data collection methods and key findings.
• Section 2 provides Steer’s recommendations for Goals, Objectives and Performance Metrics informed by a review of international best practice and alignment with SCAG planning documents.
• Section discusses the updated TDM Toolbox, explaining the purpose of this resource and the rationale for a revised framework given the changing nature of the TDM landscape.
• Section offers a high-level summary of Steer’s Potential Application of TDM Toolbox Strategies, wherein strategies from the updated TDM Toolbox were applied to ten congested corridors within the region.
• Section provides recommendations to improve the provision and effectiveness of TDM programming in the region with a focus on Policy, Partnerships, Programming and Measurement.
1.3. OverviewThe project team worked closely with SCAG staff and a panel of advisors to deliver this strategic analy sis. To assist in the development of the initial stakeholder database, SCAG convened a Technical Advisory Committee (TAC) representing agencies, local governments, advocacy organizations, mobility service providers, and transportation professionals throughout the region. The TAC provided essential feedback on deliverab les through each stage of proj ect delivery . A list of participating TAC members is included in Appendix A. This document references various acronyms relating to TDM and local agencies, which are all defined in Appendix .

SC A G TDM Strategic Plan and F inal Report
6
ra e ractice
The proj ect team completed a comprehensive literature review to understand TDM best practice within the SCAG Region and nationwide. The analysis included TDM funding sources, key legislation, performance measurement, and existing and future TDM strategies to in uence travel behavior. The review highlighted specific TDM programs throughout the country to demonstrate best practices in each of these categories and provide ideas that could help further TDM implementation in the SCAG Region. The iterature Review is included in Appendix C.
Ex ti ti e S e
The Existing Conditions Report (included in Appendix D) gathered information from stakeholder interviews, surveys and the literature review to present a aseline A ssessment, including a summary of TDM programs detailed b y each C ounty in the SC A G Region, and a Strengths, Weaknesses, Opportunities, Threats (SWOT) analysis of TDM implementation region-wide.
Baseline AssessmentThe report found that TDM programming in the SC A G region is most commonly deployed at worksites and universities in the SCAG Region by employers who are subject to the South Coast Air Quality Management District’s (South Coast AQMDs) Rule 2202 regulations on mobile source emissions. Through programming subject to this rule, and otherwise, an array of public and private-sector entities is involved in implementing TDM programs and services to reduce single-occupancy vehicle trips. The most common ty pes of TDM programming are carpooling, ridematching, and marketing. Regional Rideshare Programs offered by County Transportation Commissions offer ridematching assistance, guaranteed ride home, and employ er outreach prevalent in employ er-b ased programs. Parking pricing was the least common strategy used in the SCAG Region to in uence travel behavior, indicating that TDM stakeholders in the region in general favor the provision of incentives over the regulation, pricing or requirement approach to encouraging vehicle trip reduction.
Strengths, Weaknesses, Opportunities, Threats (SWOT)The SW O T analy sis ex amined internal and ex ternal factors of the TDM industry in the SCAG Region. In general, the SCAG region benefits from formally established practices and thought leadership in TDM. L ocal and regional policies have long supported trip reduction efforts as a way to improve air quality and reduce congestion. In addition, local climate and prevalence of traffic congestion encourage people to seek alternatives to driving alone.
The predominant weaknesses in the regional TDM landscape include characteristics that create barriers to transit use: variab ility in transit service, a confusing sy stem of transit passes and fares, and land use policy that favors lower-density land uses. F rom a policy standpoint, TDM programming has less political support than infrastructure. In addition, the policy that does ex ist targets developers during the entitlement process, but there is little enforcement to ensure that TDM is implemented by future owners or tenants a erwards.
Developments in the legal and political landscape in Southern California present the greatest opportunities for improved TDM provision. In general, the region has funding as a result of local b allot measures to dedicate sales tax revenue towards transportation projects. TDM policies at the state and municipal level are b ecoming more prevalent, providing regulations and guidance to formally institute TDM practices in the development review process. The proliferation of new mob ility companies and advancements in technologies also allow TDM programs to leverage new partnerships and better sources of data to connect people with a wider range of transportation options.
evertheless, the relative low cost of driving alone and parking remains the biggest threat to TDM implementation. and use practices still commonly favor low-density
development, which encourages car use. In addition, new sources of trips and added V ehicle Miles Traveled (V MT), from growth in the region’s goods movement sector to ridehailing services like ber and y , may cancel out progress in vehicle trip reduction.

SC A G TDM Strategic Plan and F inal Report
7
ec ca va ceme
The project team researched areas of innovation in ridesourcing, microtransit, multimodal traveler information, parking management and related areas. ew mobility services, such as ridehailing technology or on-demand microtransit expand access to alternative modes and offer rich data sources which can be used by planners to improve existing services. Many technology improvements blend with existing programs and offer ways to make traditional TDM delivery more seamless. The b iggest challenge for planners in harnessing this new technology is securing operating and data sharing agreements that adequately address concerns about public safety, equity, and unpredictability in the ever-changing mobility services market. These agreements are o en navigated by policymakers who may not have skills or training to assess each new piece of technology. Recommendations b ased on this research include:
. Provide Innovation Grant funding. This will allow pub lic agencies in the SC A G Region to operate innovative pilot programs making use of available technology .
2. Explore the creation of boilerplate agreements with MOD providers. The work involved with developing formal partnerships between public and private agencies can prove to b e a b arrier in many cases. If this process can be facilitated, more agencies may b e interested in developing partnerships.
- . Harmonize policies within the SCAG Region and provide use of data standards and require data sharing. W hile many agencies in the region have begun to partner with private providers, partnerships o en agree to different terms, which may present inconsistent levels of service for users, and inconsistent collection of data among the agencies.
. Evaluate new mobility initiatives on a regional basis: Regional roll outs of new mobility programs would also address the concerns outlined in recommendations - .
. Create a forum for cities and counties to share experiences: etter communication between agencies will facilitate more successful programs.
The ew Mobility and Technology Innovation Memo is included in A ppendix E .
• E stab lished local TDM best practice and thought leadership
• C limate suitab le for active modes
• Traffic congestion provides deterrant to driving alone
• Poor first/last mile connections
• Difficulty in gaining political support
• Disconnect between TDM regulation and those who implement
• Size of region and diversity in land use
• ariation in transit service provision and confusion in fares and rates
• ack of performance standards
• egal and political landscape
• Prevalence of mob ility service providers
• sing big data to better understand b ehavior needs
• Relative low cost of driving and parking
• and use practices favor low-density development
S re Weaknesses r u tie reaFigure - : SCAG Region TDM SWOT Analysis Overview

SC A G TDM Strategic Plan and F inal Report
8
Throughout the country local and regional governments have begun to utilize TDM delivery to support long-range planning goals addressing sustainab ility , pub lic health, congestion, transportation access and economic development. In the SCAG Region, the 20 Regional Transportation Plan/Sustainable Communities Strategy (RTP/SCS) committed . b illion to TDM strategies.
ecause TDM continues to be featured more prominently in the planning process, it is important that municipalities and regional governments understand the goals and objectives TDM strategies can address, and how best to predict and measure the success of suggested programs and policies against those goals. Agencies implementing TDM have historically chosen to measure performance and usage of programs, while overall impacts have been historically difficult to measure. et, with changes in the federal performance measure requirements to report on a regional level, TDM program performance monitoring continues to evolve.
SCAG seeks to establish TDM-specific goals, objectives and performance measures that are aligned with higher-level regional goals. This will help ensure that TDM programs prioritize activities that assist the region with meeting those goals, and communicating the overall costs, benefits, and impacts. This will also inform Connect SoCal (the forthcoming 2020 RTP/SCS) and future TDM-related planning efforts at SC A G .
The Goals, Objectives and Performance Measures Memo (included in full in Appendix F) provides recommendations for goals, objectives and performance measures that are aligned with the goals and objectives outlined in both the 20 Regional Transportation Plan Sustainable Communities Strategy (RTP/SCS) and Connect SoCal.
2 Goals, Objectives & Performance Measures
2.1. Alignment with 2016/2020 RTP/SCS Goals
Strategic goals, objectives and performance measures for the SCAG region should align with broader policy frameworks to assist local programs to prioritize program services and achieve regional and federal goals.
The 20 -20 0 Regional Transportation Plan/Sustainable Communities Strategy (RTP/SCS), adopted in 20 , identifies three main areas of focus for TDM strategy in C hapter 5 The Road to Greater Mobility & Sustainable Growth:
1 . Reducing the numb er of single occupancy vehicle (SO V ) trips and overall vehicle miles traveled (V MT) through ridesharing, which includes carpooling, vanpooling, and in certain cases, supportive policies for shared ride services such as ber and y when they are specific to connections to transit or pooled rides.2. Redistributing or eliminating vehicle trips from peak demand periods through incentives for telecommuting and alternative work schedules.3 . Reducing the numb er of SO V trips using other modes of travel such as transit, rail, bicycling and walking.
Additionally, other sections of the RTP/SCS, such as Chapter 8 Measuring Our Progress, and the What We Will Accomplish section of the interactive Executive Summary identify goals and objectives that relate to TDM and can help further define TDM-specific goals and objectives for the TDM Strategic Plan.

SC A G TDM Strategic Plan and F inal Report
9
2.2. SCAG TDM Goals, Objectives and Performance Measures
The TDM-Specific goals are described below. Each goal is presented along with a list of relevant goals from SCAG’s 20 RTP/SCS and forthcoming 2020 Connect SoCal, as well as a list of proposed objectives.
a m r ve ua y a er ec m c eve me r u e r v e a e ra r ati e e
Related RTP/SCS Goals• Align the plan investments and policies with improving
regional economic development and competitiveness. (2 0 1 6 )
• E ncourage regional economic prosperity and glob al competitiveness. (2020)
Proposed Objectives• Increase the number of worksites, residential buildings
and entertainment hubs that offer benefits, incentives and amenities to employees and visitors for non-SO travel.
• Encourage job growth around high frequency transit corridors through land use planning.
a m r ve m y re e r u e er acce S rave m e
Related RTP/SCS Goals• Maximize mobility and accessibility for all people and
goods in the region. (2 0 1 6 )• Improve mobility, accessibility, reliability and travel safety
for people and goods. (2 0 2 0 )• Increase person and goods throughput and travel choices
within the transportation system. (2020)Proposed Objectives• Encourage employer-based programs to offer pre-tax
benefits, discounts, and other financial incentives to reduce commute costs.
• Encourage transit agencies to offer subsidies to a wider range of potential users.
a crea e e um er u e a ca e m e u c ra
Related RTP/SCS Goals• Maximize mobility and accessibility for all people and
goods in the region. (2 0 1 6 )• A dapt to a changing climate and support an integrated
regional development pattern and transportation network. (2020)
• E ncourage development of diverse housing ty pes in areas well supported by multiple transportation options. (2020)
Proposed Objectives• Encourage residential development along high frequency
transit corridors through land use planning.
a E c ura e mu c a tie c r ra e local plans and policies
Related RTP/SCS Goals • Encourage land use and growth patterns that facilitate
transit and non-motorized transportation. (20 )Proposed Objectives• Increase the number of new or updated TDM ordinances
in the region.• Increase the number of specific or master plans with TDM
elements.
a e uce ra c c e ti e re m congested corridors
Related RTP/SCS Goals• E nsure travel safety and reliab ility for all people and
goods in the region. (2 0 1 6 )• Increase person and goods throughput and travel choices
within the transportation system. (2020)Proposed Objectives• Reduce delay per capita and heavy-duty truck delay on
highways over baseline.

SC A G TDM Strategic Plan and F inal Report
1 0
a m r ve a r ua y y re uc ve c e m e rave e r u crea e u e S rave m e
Related RTP/SCS Goals• Preserve and ensure a sustainable regional transportation
sy stem. (2 0 1 6 )• Maximize the productivity of our transportation system.
(2 0 1 6 )• Actively encourage and create incentives for energy
efficiency, where possible. (20 )• Reduce greenhouse gas emissions and improve air quality.
(2 0 2 0 )• Increase person and goods throughput and travel choices
across the transportation system. (2020)Proposed Objectives• Increase sustainable (non-SO ) mode share use over
b aseline.• Reduce V MT per capita over b aseline.• Reduce G H G emissions per capita over b aseline.• Determine the reduction of criteria pollutant co-benefit
over b aseline.
a m r ve u c ea a e e r u crea e u a e cyc a a
Related RTP/SCS Goals• Protect the environment and health of our residents
by improving air quality and encouraging active transportation (non-motorized transportation, such as bicycling or walking). (20 )
• Support healthy and equitable communities. (2020)Proposed Objectives• Increase walking and biking mode share. • Reduce V MT per capita over b aseline.
a E c ura e ra e e emer e cyc ti e cy ra r ati a
Related RTP/SCS Goals• Maximize the security of the regional transportation
sy stem through improved sy stem monitoring, rapid recovery planning and coordination with other security agencies. (2 0 1 6 )
• Enhance the preservation, security and resilience of the regional transportation system. (2020)
Proposed Objectives• Increase number of emergency/contingency
transportation plans that incorporate TDM strategies.
a m r ve e c e cy y e a a evera rmati r m ec ca vati
Related RTP/SCS Goals• everage new transportation technologies and data-
driven solutions that result in more efficient travel. (2020)Proposed Objectives• Increase number of shared trips.• Improve process of planning, accessing and paying for
service.• Encourage partnerships between the public and private
sectors.
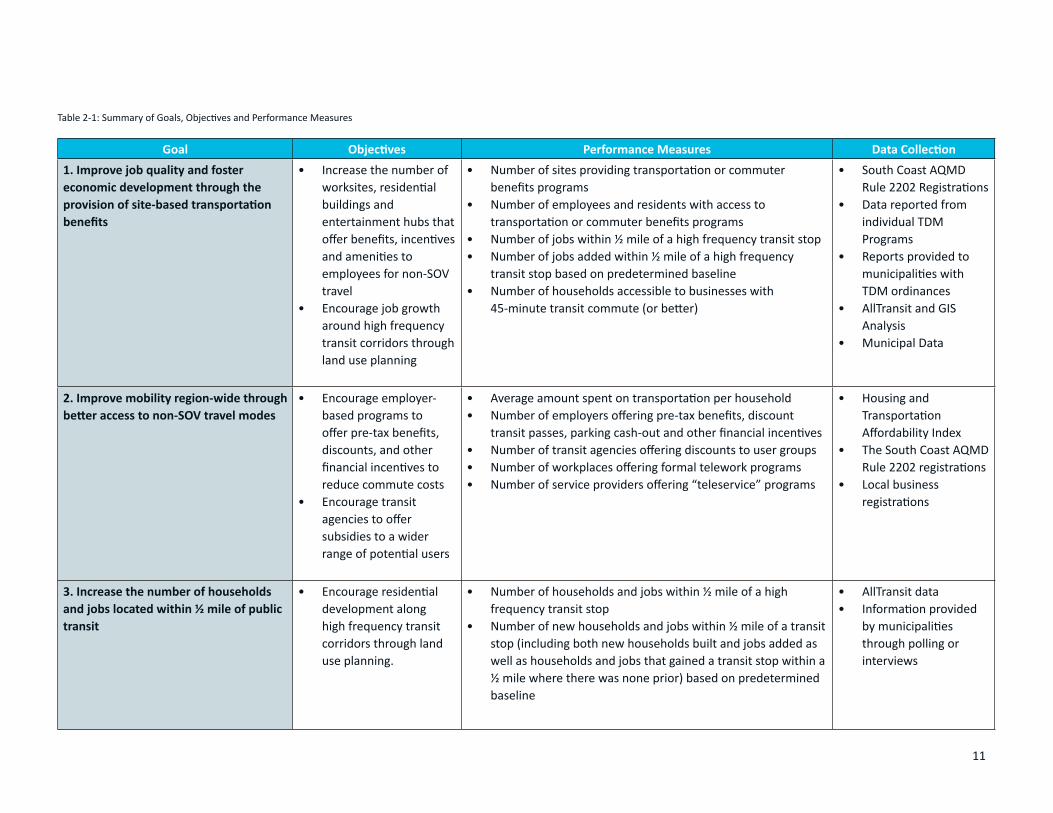
Goal ective er rma ce ea ure a a ecti m r ve ua y a er
ec m c eve me r u e r v e a e ra r ati e e
• Increase the number of worksites, residential b uildings and entertainment hub s that offer benefits, incentives and amenities to employ ees for non-SO V travel
• Encourage job growth around high frequency transit corridors through land use planning
• umber of sites providing transportation or commuter benefits programs
• umber of employees and residents with access to transportation or commuter benefits programs
• umber of jobs within mile of a high frequency transit stop• umber of jobs added within mile of a high frequency
transit stop b ased on predetermined b aseline• umber of households accessible to businesses with
-minute transit commute (or better)
• South Coast AQMD Rule 2202 Registrations
• Data reported from individual TDM Programs
• Reports provided to municipalities with TDM ordinances
• AllTransit and GIS A naly sis
• Municipal Data
m r ve m y re e r u e er acce S rave m e
• E ncourage employ er-b ased programs to offer pre-tax benefits, discounts, and other financial incentives to reduce commute costs
• E ncourage transit agencies to offer subsidies to a wider range of potential users
• Average amount spent on transportation per household• umber of employers offering pre-tax benefits, discount
transit passes, parking cash-out and other financial incentives• umber of transit agencies offering discounts to user groups• umber of workplaces offering formal telework programs• umber of service providers offering teleservice programs
• H ousing and Transportation Affordability Index
• The South Coast AQMD Rule 2202 registrations
• L ocal b usiness registrations
crea e e um er u e a ca e m e u c transit
• Encourage residential development along high frequency transit corridors through land use planning.
• umber of households and jobs within mile of a high frequency transit stop
• umber of new households and jobs within mile of a transit stop (including both new households built and jobs added as well as households and jobs that gained a transit stop within a
mile where there was none prior) based on predetermined b aseline
• A llTransit data• Information provided
by municipalities through polling or interviews
Table 2- : Summary of Goals, Objectives and Performance Measures
1 1

Goal ective er rma ce ea ure a a ecti E c ura e mu c a tie
incorporate TDM into local plans and policies
• Increase the number of new or updated TDM ordinances in the region
• Increase the number of specific or master plans with TDM elements
• umber of municipalities that have adopted and are actively promoting and enforcing TDM ordinances
• umber of municipalities that have adopted specific or master plans with TDM elements
• umber of municipalities that have adopted policies surrounding parking pricing or unbundled parking (the separation of monthly or annual cost of parking from the cost to lease space)
• umber of TMAs/TMOs in the Region
• Information provided by municipalities and other local governments through polling or interviews
e uce ra c c e ti e re m c e e c rr r
• Reduce delay per capita and heavy-duty truck delay on highways over b aseline
• Person delay per capita• Person delay b y facility ty pe • Truck delay by facility type• Travel time distribution for transit, SO and HO modes for
work and non-work trips
• Travel Time Data Set in the ational Performance Management Research Data Set (N PMRDS)
• Information provided b y goods movement companies
m r ve a r ua y y re uc ve c e m e rave e r u
crea e u e S rave m e
• Increase sustainable (non-SO V ) mode share use over b aseline
• Reduce V MT per capita over b aseline
• Reduce G H G emissions per capita over b aseline
• Sustainab le (non-SO V ) mode share • V MT per capita
• A merican C ommunity Survey ourney to Work Data on Modeshare
• Total emissions reductions reported by the South Coast AQMD and Pollution Control B oards
• Direct reports from TDM programs
1 2

Goal ective er rma ce ea ure a a ecti m r ve u c ea a e e r u crea e u a e cyc a
walking
• Increase walking and biking mode share
• Reduce V MT per capita over b aseline
• Walking and biking mode share • V MT per capita
• A merican C ommunity Survey , J ourney to Work Data on Modeshare
• Total emissions reductions from the South Coast AQMD and Pollution Control B oards
• Direct reports from TDM programs
E c ura e ra e e emer e cy c ti e cy ra r ati planning
• Increase number of emergency/contingency transportation plans that incorporate TDM strategies
• umber of employers, hospitals, universities, and commuters provided with information in the event of an emergency
• umber of employers, universities, hospitals, and other organizations who adopt contingency transportation plans for their employ ees and customers
• umber of contingency plans that address first responder access to sites
• umber of public agencies with emergency response plans that address transportation and encourage multi-modal travel where appropriate
• Information from municipalities or agencies through polling or informational requests
m r ve e c e cy y e a a evera rmati r m ec ca vati
• Increase number of shared trips
• Improve process of planning, accessing and pay ing for service
• E ncourage partnerships between the public and private sectors
• N umb er of shared trips (ex cluding single-rider TN C trips)• umber of private transportation service providers providing
trip-level data to pub lic agencies• umber of multimodal trips planned or paid for on a single
pla orm• N umb er of trips reserved in advance through mob ile
pla orms
• Information provided b y private providers
• Information from municipalities on their partnerships
1 3
SC A G TDM Strategic Plan and F inal Report
1 4
3 TDM Toolbox
3.1. Purpose of the Toolbox
The TDM Toolb ox of strategies is an update of the TDM Toolbox, included in the Congestion Management Appendix in the 20 RTP/SCS intended to inform local governments, agencies and other interested parties about different types of TDM strategies, their practical application and their benefits to
MT and trip reduction. This revised TDM Toolbox is intended to update the previous toolb ox to include advancements in new mobility and technology.
3.2. Framework for the Toolbox
The revised TDM Toolbox framework was designed to clearly describe each strategy, provide an example for its application in the SCAG region, identify target audiences and key implementors, and offer a high-level summary of benefits and challenges.
The TDM Toolb ox contains 3 2 TDM strategies grouped into the following categories:• E ucati a ar eti strategies include various
means of distributing important information about transportation options either through public/web forums or through wayfinding.
• ce tive a ac ati strategies encourage people to use alternative modes by providing financial benefits and exible work schedules or by assisting with rideshare matching.
• ra ruc ure Sy em ra e strategies include physical or systems improvements designed to make alternative modes more competitive with driving.
• Parking strategies ty pically involve pricing strategies to control demand for parking and increase costs to driving alone.
• Su rtive cy includes congestion pricing, land use and other regulations.
F igure 3 -1 provides a sample entry from the TDM Toolb ox . The numbers shown in blue circles depict the various sections that exist for each strategy, and are described in the list below.
1 . Strategy C ategory2 . Strategy Title
. Strategy Description
. ist of implementors and estimation of success in reducing V MT
. ist of other stakeholders
. enefits of implementing the strategy
. Challenges associated with implementing the strategy
8 . Methods of measuring success of the strategy. Higher level impacts on congestion as a result of the
strategy0. Tips for implementing the strategy
. Costs associated with implementing the strategy1 2 . C omplimentary TDM strategies from the Toolb ox
. Examples of the strategy as implemented within the SC A G Region
3.3. Accessing the Toolbox
The revised TDM Toolbox will be available as a web interactive tool or for download as a PDF. The TDM Toolbox can be found in Appendix G of this document, and will be available in the Congestion Management Appendix of the 2020 Connect SoC al.

Education & Marketing
Safe Routes to School Programs
Implementors
Other stakeholders
Education & Marketing
Safe Routes to School Programs (SRTS) involve working with schools and school districts to promote safe active transportation modes for students in order to reduce the number of parent drop-offs.
Implementation tips
Employers / Property Managers / TMAs
• TMAs/TMOs
• Educational institutions
• Property managers – residential
Public Agencies / Transportation Providers
• School districts
• Municipalities
• Transit agencies
• Regional government/MPOs
• Can require involvement from law enforcement
• Requires ongoing funding for modal change and effectiveness
• Coordination required among school districts, cities, and transit providers
• Reduces congestion during peak periods
• Increases safety for students
• Increases health/fitness
Safe Routes to School Programs can be implemented through events such as group bicycle or walking trips or bicycle safety workshops. Programs can also provide rewards to students or their parents for traveling by foot, bike, or in a carpool, and can leverage technology for trip tracking and incentive provision.
Benefits →
Challenges →
VMT Reduction:
VMT Reduction:
Impact varies based on number of students and parents interacting with TMAs, schools and property managers.
Impact varies based on size of school district and active transportation infrastructure.
1 5
Students School administration
Bicycle education organizations
Congestion impacts
Parents dropping off children at school represents a significant level of morning local congestion (10 to 15%). Increasing the number of students walking or bicycling can reduce local congestion.
Measurement
Outcomes Impacts Methods
• Number of students participating in SRTS-related activities and events
• Drop-off time
• Mode split among students
• Survey results
• Congestion monitoring on roadways surrounding schools Durfee Elementary School in El
Monte operates “walking school buses,” and uses the opportunity to teach students about environmental issues along the way.
SRTS-style programs can also be expanded to support non-school populations. Los Angeles Walks operates Safe Routes for Seniors program that helps seniors get around safely on foot.
As seen in the SCAG region
Complementary strategies
• Sidewalk improvements
• Bicycle infrastructure and parking
• ADA compliance
• Traffic signal upgrades
• Traffic calming
Costs
Typically funded through Federal and State grants specific to Safe Routes to School and Active Transportation. Additional costs may be incurred from associated events or promotional material.
Law enforcement Parents Teachers
Residents / businesses
Planning and engineering departments
Public Health Departments
4
12 3
7
10
11
12
13
F igure 3 -1 : Sample TDM Toolb ox E ntry
1 5

SC A G TDM Strategic Plan and F inal Report
1 6
4 Potential Application of TDM Toolbox Strategies
4.1. Example Application on Ten Corridors in the SCAG Region
As stakeholders in the SCAG Region seek to manage congestion and address air quality concerns, TDM strategies can b e used to remove vehicles from our congested corridors, mitigate the impacts of construction of infrastructure upgrades, and facilitate a long-term shi to alternative ways of traveling. The proj ect team ex amined the strategies put forth in the TDM Toolbox, and demonstrated how they could be applied in ten corridors in the SC A G Region that are currently dealing with congestion issues to reduce MT, and therefore greenhouse gas emissions, in the region.
The ten corridors were chosen with assistance from SCAG’s TDM Technical Advisory Committee. The corridors were not selected b ecause they are the most congested corridors in the SC A G Region, b ut instead to demonstrate the b road range of potential for implementing TDM strategies in a variety of situations. The corridors span all six counties in the region and provide solutions aimed to tackle congestion related to unique situations. The Potential Application of TDM Toolbox Strategies Memo explores the ten corridors’ existing conditions and needs, and describes how five strategies from the TDM Toolb ox could provide value to each in the short, medium and long term.
Table - shows the application of strategies as they have b een suggested in the short-term (ST), medium-term (MT) and long-term (L T), and the memo can b e found in A ppendix H .

Intl. Border
Crossing
SR-1 1 1
Eve e a e
e ti
I- 0/I- 0
r rave
r u
I- 0
ructi
SR- /SR- 0
Local
Corridors
W ilshire
B lvd.
ce ar
Commute
SR-5 5
Long
Distance
Commute
SR-9 1
E ucati
ea
I- 0
Goods
veme
e a e
I-
Agricultural
Trip
e ucti
SR-1 1 8
Education and MarketingSafe Routes to School ProgramsMarketing Campaigns ST STEducational eventsWayfinding pgrades MTIndividualized Marketing MT MT STIncentives and FacilitationCarpool Coordination ST ST ST
anpool Coordination ST MTTelecommuting and Remote Services MT MTAlternative Work Schedules STDirect Incentives for on-SO Travel LTSubsidization of on-SO TravelG uaranteed Ride H ome ProgramMob ility as a Service Provision MT LTC arshare Provision MTProvision of on-site amenities or inclusion of complementary usesDevelopment of E mploy ee C ommute Programs
ST ST ST ST
Development of TMAs/TMOs ST MT ST STProvision of C ommuter C hoice Programs Infrastructure and System pgradesPedestrian Improvements MT LT
icycle Improvements LT MTMotor ehicle Restriction ones
icycle Transit Integration STDockless/Micromobility/ ew Mobility ST MT MTPrivate Shared Transportation/Shuttles ST MT STTransit Improvements LT LT LT MT LT
Table - : Potential Application of TDM Toolbox Strategies Summary
1 7

Intl. Border
Crossing
SR-1 1 1
Eve e a e
e ti
I- 0/I- 0
r rave
r u
I- 0
ructi
SR- /SR- 0
Local
Corridors
W ilshire
B lvd.
ce ar
Commute
SR-5 5
Long
Distance
Commute
SR-9 1
E ucati
ea
I- 0
Goods
veme
e a e
I-
Agricultural
Trip
e ucti
SR-1 1 8
Parking StrategiesParking Pricing LT MTParking nbundlingParking Cash OutParking Facility Design and Curbside Management TDM-Supportive Policy
arious Congestion Pricing Methods LT LTTOD and on-SO Supportive and se LT LTTDM O rdinance and Policy Developments ST LT MT
1 8

SC A G TDM Strategic Plan and F inal Report
1 9
5 Recommendations to Increase TDM EffectivenessThis section outlines the ways in which SCAG, its regional partners, stakeholders and the County Transportation Commissions (CTCs) can expand the effectiveness and use of TDM strategies to achieve regional goals. TDM is a cost-effective means of reducing MT and greenhouse gas emissions and should play a more prominent role in achieving those goals in the future.
The existing conditions assessment of TDM delivery within the SCAG region identified areas for improvement, including:• Regulation, when enforced, is a major driver in shaping
TDM strategy and investment put forth b y b oth the pub lic and private sectors.
• A lack of sufficient standardized data collection makes evaluation of program effectiveness very difficult.
• Technological advances provide an opportunity to collect better data and improve user experience for TDM programs in the SC A G region.
Recommendations have been developed that address these opportunities, drawing on best practice from elsewhere and input from the TAC and stakeholders in the region. In addition, recommendations also relate to dissemination of the considerable work that has formed during this project, so that TDM can be more effectively implemented across the region. The recommendations are organized into five key themes.
In addition, one strategy from each category is prioritized b ased on ex pected level of impact, cost, and ab ility to b e implemented within a short timeline.
Knowledge S ar
cy Programmingar er Measurement
Figure - : TDM Recommendation Categories

SC A G TDM Strategic Plan and F inal Report
2 0
5.1. Knowledge Sharing
S ra e y e e ar y E tima e Outcome m eme ati me rame
Development of TDM page on SCAG website
SC A G 00,000 Provision of a clearing house and one-stop-shop’ of TDM information for agencies in the SC A G Region
Short-term: < 1 y ear
Six county-wide TDM training sessions, tailored to each county’s existing conditions
SC A G , in partnership with CTCs
00,000 Introduction of TDM as a tool to agencies that have little to no ex perience using it.
Short-term: < 1 y ear
The TDM Strategic Plan has created a set of deliverab les that should be of real value to many stakeholders across the region who are addressing challenges including reducing congestion and greenhouse gas emissions. There is a short-term opportunity to ensure the proj ect deliverab les are made widely available and understood by the relevant stakeholders, including:• TDM iterature Review: demonstrating best practice in
TDM from around the nation.• TDM Toolbox: a set of 2 effective TDM strategies with
descriptions about when they might best be employed and what they can achieve.
• Application of TDM Toolbox Strategies: demonstrated on corridors throughout the Region, each chosen to represent a different type of condition and congestion scenario in the region.
eve me a a e e S e e Prioritized recommendation
A simple priority is to make these materials available on SCAG’s website on a dedicated TDM page, with proactive outreach employ ed to ensure the resources are shared across the region to appropriate agencies and staff members.
S x u y e ra e
G iven the need for more partnerships, and for more opportunities to share experience, a series of training workshops could also be held, possibly one in each of the six counties in the SCAG region, tailored to their existing conditions and their most relevant TDM strategies. Each training workshop could be held in coordination with the CTCs and be open to city and agency staff, as well as representatives of employers/ destinations, and elected officials.

SC A G TDM Strategic Plan and F inal Report
2 1
5.2. Policy and Regulation
TDM supportive policy in the SCAG Region takes many forms. I ncreasingly , local governments are including ex plicit TDM requirements in formal planning processes. This gives cities more leverage over how TDM is implemented within their jurisdictions and provides the opportunity to align with other planning initiatives, such as climate action planning, changes to the CEQA approval process, smart growth strategies, and first/last mile planning, among others.
E x amples in Southern C alifornia include:• Warner Center Specific Plan (City of os Angeles), which
requires new developments to either participate in a TMO or implement a site-specific TDM Plan.
• ew or updated TDM Ordinances in the City of os Angeles, Glendale and West Hollywood that require site-specific TDM plans, use of city-approved TDM strategies, memb ership in a TMA or TMO and monitoring and enforcement for the life-cy cle of that development.
• Memoranda of understanding (MO ) in combination with local ordinance in the City of Santa Monica that gives the City delegation authority over South Coast AQMD’s Rule 2202 implementation, whereby they can enforce more stringent TDM requirements for new and existing b usinesses.
Many municipalities within the region have TDM ordinances or TDM-related language in General and Specific Plans, however, only a handful of these uphold and enforce regulations, or have the resources dedicated to support education and participation.
ey opportunities for policy to support more TDM delivery in the region include:• Encouraging cities that have an existing policy to
encourage/require TDM to enforce it.• Where appropriate, supporting cities who do not have
policies to design and implement them.• Engaging with developers, property managers, and
businesses who are required to comply with new policies to facilitate a more seamless process for administrators.
Of note, stricter regulation on employers or development may not be sensible in every se ng, and thus these recommendations may be more applicable in some parts of the region than others. In particular, areas with more concern over congestion may find more value from TDM-related policy, than those with more concern over attracting business and industry .
When policy involves data collection, those developing and implementing TDM regulation should consider regional data-standards and the ability for their requirements to be satisfied with the help of pre-existing resources provided by the CTCs or other regional agencies.
e ver ra r cy eve me a Management Prioritized Recommendation
SCAG should plan and lead a series of workshops at the county level to share local, regional and national best practices with respect to TDM policy development and implementation. These workshops would be held as short (one-hour) seminars, with the goal of introducing participants to TDM related policy. In-person workshops should be recorded so that they can be viewed as webinars by those who are unable to attend.
Representatives from local governments should be invited to share lessons learned. Workshop take-aways would include sample ordinances used in other cities, as well as knowledge about the process the city went through to get it incorporated into policy. Across the series, the focus should be on how TDM could be incorporated into different policy instruments, such as General Plans, Specific Plans, Special Districts and Overlays, or specific TDM Ordinances. Discussion should include:• Applicability to different land uses• Applicability to existing employers• Alignment with state and regional policy (South Coast
AQMD’s Rule 2202, Senate ill )• Flexible or fixed TDM requirements and ve ng TDM
strategies• alance between compliance and education/engagement• F unding mechanisms• Administration, code enforcement and coordination with
other TDM implementors, among others

SC A G TDM Strategic Plan and F inal Report
2 2
As policy development and implementation should not be applied in a one-size fits all’ approach across the Region, each workshop would be set up to address specific concerns. For example, one workshop/webinar may focus on more requirement’ focused policy, while another may lean more
specifically toward policy that encourages TDM among employers or developers through incentives. This way, audiences can attend only workshops that are applicable to their needs.
r v e Su r r a E rceme r ca cy
I n order to promote the long-term success of TDM policy throughout the region, SCAG could provide targeted financial and advisory support for a small group of agencies interested in developing or updating their TDM policy with stronger monitoring and enforcement practices. This process could involve the provision of funds to each agency to support their staff time or development of any necessary tools or resources, b ut SC A G should also remain involved in the process throughout planning and initial implementation, providing advisory support. Successful policy solutions will likely look different for different agencies, so SCAG should aim to support a selection of agencies with varying needs (potentially one agency per county ).
SCAG should assist in the process of developing or updating local policies, to ensure they have clearly defined practices for enforcement. In many cases, this means agencies will need to have:• Dedication of agency staff time.• Physical tools or so ware needed for required reporting.• L egal tools needed to address non-compliance.• Informational support for those who fall under
requirements.
C oncern should b e given to ongoing enforcement of policy that is realistic and implementable for agencies, and so should consider preexisting tools such as available CTC programming and survey support resources.
Additionally, policy monitoring and enforcement requires cooperation and input from different departments and roles within local government, including but not limited to:• ong range planning teams tasked with updating and
implementing General Plans, Specific Plans, Climate Action Plans and others.
• Transportation planners and engineers responsible for understanding traffic impacts and mitigations at the citywide and site levels.
• Short-term planners who review and approve applications for new development.
• Economic development staff who engage with the local b usiness community .
• Communications departments who cra messages for the public and understand elected officials’ needs and preferences.
• City attorneys or legal staff who review and approve formal policy and regulatory language.
To ensure that these parties work seamlessly to implement the policy , it is recommended that SC A G and partnering agencies include representatives from each team in this process. O nce this process has b een carried out successfully among a small selection of agencies, lessons learned and best practices can be shared with neighboring municipalities or other local agencies who may want to implement similar policy .
Su r e eve me S a e a ati a cy
As a representative of Southern California, SCAG can propose and advocate for policy that encourages TDM delivery . SC A G should also seek opportunities to support policy presented b y others, such as the Metro sponsored C alifornia A ssemb ly
ill 2 , which, when implemented in 2020, will require employers of fi y or more employees in os Angeles County to provide pre-tax benefits covering transit or vanpool costs, to their employees. The bill will also encourage other MPOs and CTCs statewide to work with employers to adopt policies that support non-drive alone travel.

SC A G TDM Strategic Plan and F inal Report
2 3
S ra e y Responsible ar y
E tima e Outcome m eme ati me rame
Deliver Training Workshops on Policy Development and E nforcement
SC A G , in partnership with CTCs
00,000 I ndirect support of development of 3 new or updated TDM policies within the SC A G Region
Medium-term: 1 -2 y ears
Provide Support on Monitoring and E nforcement
SC A G 00,000-,000,000
Direct support of development of 5 new or updated TDM policies in the SCAG Region, with well-thought out enforcement and monitoring plans
L ong-term: 2 + y ears
Support the Development of State and ational TDM Policy
SC A G , in partnership with CTCs and others
00,000 Additional TDM-related policy on a statewide and national scale
L ong-term: 2 + y ears
5.3. Partnerships
TDM services are delivered throughout the SC A G Region, from the site-level all the way up to the county-level, and regular communication and partnership among these groups is crucial. This helps create better services through knowledge-sharing and peer learning, and avoids duplicative services offered to the public or work completed by TDM professionals.
etween the county agencies and SCAG, a coordinated effort should be put into connecting groups and individuals who implement TDM in the region through:• The development of regular meetings at the county level
and occasional meetings at the regional level.• Integrated tools, resources and applications across
regional TDM programs. • Facilitation of stronger partnerships between the public
and private sector.
ve e e a a u y e rum Prioritized Recommendation
TDM L eaders across the SC A G Region have b egun to convene at the city, county and regional levels to share knowledge and support the development of relevant TDM opportunities:• C ity level: The C ity of L os A ngeles has convened a
technical advisory committee to guide its update of the citywide TDM ordinance.
• County level: os Angeles Metro has hosted meetings for both TMAs and city representatives who implement TDM.
• Regional level: SCAG convened a TDM Technical Advisory Group to support the agency’s TDM Strategic Plan, Future Communities Pilot Program, and Future of the Workplace Study. CTCs in the SCAG Region also convene to discuss TDM strategy through their rideshare programs.
While some of these groups were brought together to advise on specific studies or processes, all provide a forum for TDM implementors from various backgrounds to network, learn from each other, and help guide future TDM implementation and impact measurement within their area. SCAG’s TAC members have expressed that they value these meetings and it is recommended that regular meetings continue to be held.
The regional level is the most appropriate for these, as it will allow TDM implementors to convene with others from a wider network and learn from those with similar issues and those who may face different challenges. TDM implementors throughout the region should b e convened at least b i-annually for knowledge-sharing purposes. This should be organized by SCAG, but can be conducted in coordination with other forums such as the Mobility 2 conference or the Association for Commuter Transportation (ACT) SoCal Chapter. Additionally, county representatives may want to convene even more frequently to discuss local issues.

SC A G TDM Strategic Plan and F inal Report
2 4
a e u y ema c a a a e a ev e u y e are r ram
SCAG should provide support to transportation agencies in the region, who are currently working on consolidating their ride matching datab ases.
Metro, O C TA , SB C TA and RC TC , and V C TC currently run Rideshare Programs that include carpool and vanpool ridematching assistance. These agencies already coordinate their vanpool programs to allow for inter-county travel and destination-based subsidy disbursements. However, county rideshare program operators have ex pressed that the ab sence of a single database makes the process of finding rideshare opportunities more difficult for commuters and administrators alike, and are in the process of developing one consolidated database. Ideally, this database would allow agencies to access better information about who is coming to/leaving their county for work, and will also provide municipalities with a dashboard to manage their own individual rideshare programs.
Though the county transportation agencies will be primarily responsible for carrying out this task, SCAG can support this effort. The coordination of all county rideshare databases provides an opportunity for review of the ridematching programs themselves. C urrently , though the programs provide a valuable service in matching commuters who take similar trips, they are not able to collect data on how many matches result in a new carpool or how many fewer trips are taken and V MT reduced as a result of the programs. SC A G can assist the counties by developing data standards that they can work towards in the review of their ridematching programs. It is likely that this may include the provision that ridematching programs can undertake some follow-up with registrants, either through b rief survey s or something more ex tensive. This will mean that the region has consistent data for who is interested in carpooling where (across counties), and also information such as current vs. previous travel behavior which can better demonstrate the value and impact of the programs themselves.
ac a e e eve me ra r ati a a eme c ati r a ati
TMAs/TMOs work with both the public and private sectors to facilitate TDM for employees, residents and visitors within a defined area. The nature of their relationships between pub lic agencies and private developers, property managers and employers puts them in a unique position to be able to disseminate information and encourage non-SO travel, advocate for community transportation needs, and collect data on travel habits. If well implemented and resourced, TMA s and TMO s can b e instrumental in reducing SO V trips and vehicle miles traveled.
Currently, only 0 TMAs exist within the SCAG Region, covering a relatively small footprint within the region (depicted in F igure 1 -1 ). Some, such as the G o G lendale TMA, provide support to entire cities, while others such as Compass Playa ista are focused on a specific local area or development. As agencies consider the initiation of TMAs/TMOs they may want to consider whether areas:• Have a specific need that a TMA/TMO could fill (i.e.
coordination of shuttle service, marketing of new transit options, or assistance with regulatory compliance).
• Have a group of developers or employers who want to or are required to invest in congestion reduction or air quality improvement measures in their communities.
• Have a defined population of commuters, residents or visitors that could benefit from improved transportation options, outreach and engagement.
SCAG should help cities develop TMAs/TMOs that provide reports of area-wide travel behavior, support municipal TDM policy, and provide services and programs geared specifically at their local audiences. They can do this b y providing guidelines for cities and private entities who are interested in starting a TMA or TMO to explain:• The cost of developing and maintaining a TMA/TMO.• TMA/TMO must have services.• Structural options (i.e. nonprofit organization vs.
municipal-run organization) and the benefits and challenges associated with each.
• SCAG Region-specific resources.

SC A G TDM Strategic Plan and F inal Report
2 5
Guidelines could take the form of a short user-guide that can base itself off ACT’s TMA Handbook, which is due to b e updated in 2 0 1 9 . The user guide should b e accessib le on SCAG’s TDM webpage, and can be communicated at training sessions identified in previous recommendations.
ac a e ar er e ee e u c Sec r a r va e Serv ce r v er
The nature of mobility services and TDM is changing with increasing opportunities for local governments and agencies to work collaboratively with the private sector. In the SCAG region, cities are developing and implementing pilot programs with ridehailing, bikeshare and scootershare, microtransit and so ware companies to solve first/last mile problems, improve transportation options in low-density areas, and better serve user groups with limited mobility. evertheless, the fast pace of technology deployment and volatility in the market make it more difficult for cities and agencies to keep up with the latest in best practices. SC A G has the opportunity to help gather and disseminate information related to public-private partnerships, both lessons learned and best practices. SCAG could convene a
forum and develop associated training and templates to better prepare local jurisdictions for the opportunities and challenges that may arise when partnering with private sector firms.
Topics may include:• egal mechanisms required that allow private sector
companies to operate within certain parameters.• Data sharing agreements explaining what should be
provided by private operators and how to interpret and apply new sources of data to improve planning processes.
• Infrastructure readiness and dealing with increased demand for ridehailing, bike/scooter parking.
• Safety and liab ility concerns.• Common problems and ways to avoid or resolve them.• Funding sources and ways to create longevity in the
program. • Public outreach and education to help people understand
the program and its impacts. • Encouraging providers to operate in new areas, such
as areas that may be less densely populated but would benefit from first/last mile service.
Figure - : SCAG Region TMAs/TMOs

SC A G TDM Strategic Plan and F inal Report
2 6
S ra e y e e ar y E tima e Outcome m eme ati me rame
C onvene Regional and C ounty forums
SC A G , C ounty Transportation C ommissions
00,000 Improved communication within and between counties
Short-term: < 1 y ear
C onsolidate C ounty Ridematching Datab ases and Review County Programs
SC A G , C ounty Transportation C ommissions
00,000-00,000
O ne datab ase that lists home and work locations of all registered commuters in the C ounty , the ab ility for rideshare programs to collect better data and demonstrate value
Medium-term: 1 -2 y ears
F acilitate Development of TMAs/TMOs
SCAG, with support from C ounty Transportation C ommissions and Cities
00,000 (TMA development guide)
00,000-,000,000 (TMA
development financial start-up support)
A n improved understanding among cities and other agencies of the benefits of TMAs and resources necessary to develop and maintain them.
F inancial support to b ring the region new TMAs which can sustain
themselves long-term without SCAG’s support
Medium-term: 1 -2 y ears (TMA development guide)
L ong-term: 2 + y ears (TMA development financial start-up support)
F acilitate Partnerships between the Public Sector and Private Service Providers (Trainings and Templates)
SCAG, with support from C ounty Transportation C ommissions
00,000 - 00,000
I mproved understanding of nature of public/private service partnerships, facilitation of partnerships themselves through use of common contracting templates
Medium-term: 1 -2 y ears
Service agreement templates can help with provision of cohesive service across the region, as they will facilitate the process of negotiating partnership agreements for municipalities. If municipalities are using the same or similar terms for their partnerships, it will make service across municipal lines more consistent and ensure that each partnership results in data that can b e compiled across the region.
SCAG should work with service providers and agencies that already partner with them to develop a set of template agreements that can be used by municipalities in their contracting process. When carrying out this process it is important to keep in mind that service models may differ
throughout the region due to density , access to transit, and infrastructure conducive to various ty pes of trips.

SC A G TDM Strategic Plan and F inal Report
2 7
5.4. Programming
etween the long list of TDM implementors that have been identified throughout the TDM Strategic Plan, there is a good deal of TDM programming that is currently offered in the SCAG Region. However, many services and programs are implemented without an accurate means of demonstrating their value and impact on trip and MT reduction in the region.
SCAG should help refine TDM programming in the region by supporting research and innovative programs that help to determine strategies and methods that will be most impac ul in reducing regional MT, and then supporting those types of programs. This can b e done through: • Providing the region with a better understanding of the
impact of non-SO travel incentives.• Recognizing successful programs, policies and services.• H elping to fund TDM proj ects and programs through
grants and partnerships that show innovation or prove to be effective in reducing regional MT.
• Encouraging telework throughout the region.• Addressing an un-met issue of growing freight-related
V MT through support for employ er-led TDM aimed at site deliveries.
e ver S u y e erm e Succe ce tive a er S ra e e a e av r Prioritized Recommendation
Incentives of various forms are o en provided to those involved in TDM programs in order to encourage non-SO travel. In some cases these are provided as start-up incentives, meant to change behavior of current SO drivers, and in others they are provided long-term, rewarding those who use non-SO modes regardless of the choices available to them (or lack thereof). Other strategies aim to change behavior through making non-SO travel more accessible or working with individuals to understand their motivations and facilitating a change in travel behavior to suit their lifestyle.
In order to truly understand the impact of incentives and other strategies on mode choice and b ehavior change, and make best use of the money spent on all types of TDM programming, the SCAG Region would benefit from an extended study that examines various strategies offered to SC A G Region commuters or travelers and measures their success in changing travel b ehavior.
This study could be carried out in a variety of manners. Size of the study, amount of incentives provided and other controls (i.e. provision of marketing and education) will likely depend on project budget. Regardless of those aspects however, it is recommended that the study :• Take place over the duration of at least six months to
determine the long-term effect on travel behavior.• C onsider use of an app or another program that can sense
travel mode through mobile phone activity. This may provide concerns with privacy or equity for populations without smart phones, but otherwise requirements to log or report trips daily may prove to b e a hinderance to study participants and may ultimately affect the quality of data collected otherwise.
• Adjust incentives or strategies offered periodically to understand where choice-making thresholds lie.
• Analyze various demographic groups and the in uence of incentives on their travel behavior. For example, lower-income populations may be more likely to change behavior at a lower threshold than higher-income populations.
Depending on available budget and time-frame, the study should consider analyzing the impact of the following strategies:• Direct incentives (financial) or significant discounts to
local retailers• Provision of a pre-paid’ Guaranteed Ride Home program
vs. a reimbursement’ program• tilization of nudge theory or other behavioral science
strategies aimed at communicating with individuals either through one-on-one conversations or through media and marketing
• Access to validated parking in areas where parking may be costly otherwise
• Access to park and ride facilities

SC A G TDM Strategic Plan and F inal Report
2 8
ec e Succe u r ramm r u ua TDM Award
TDM delivery that proves it has changed b ehavior or reduced MT in the region should be recognized and placed on
display as an ex ample for others hoping to implement similar programs or proj ects in the region. SC A G can further this b y developing an Annual TDM Award that is distributed to TDM implementors in the region at the Regional C onference and General Assembly. This award can be included as part of the Sustainability Awards that are currently in the agenda, or on its own.
Officially incorporating TDM into the Awards presented at the Regional Conference and General Assembly will raise its visibility among elected officials and draw attention to TDM as a low-cost but high-impact solution to congestion and air quality issues. If it is received well, SCAG could consider working with the CTCs to develop a larger scale program that recognizes employers or agencies that hit certain predetermined targets for level of service offered or A R.
r v e a r m e ra r u tie r r ec
There are limited numb er of sources for federal, state and local funding for cities, agencies and other proponents to fund TDM programs and proj ects. SC A G currently provides funding and partnering opportunities for cities to create active transportation plans and ordinances through the Sustainable Communities Grant program. However, TDM projects are not included in the accepted list of Integrated and se or Active Transportation Project Types. In order to encourage TDM, which is related to and supportive of the goals of this program, SCAG should consider funding and supporting cities interested in developing TDM programs the same way.
Though SCAG cannot fund ongoing project implementation, they could support municipalities as they develop TDM plans or during ex ploratory TMA development stages. SC A G could add TDM to the acceptable project list or create a new grant program to address TDM specifically. While SCAG cannot fund the development of infrastructure, they could potentially provide grant funding for studies of where park and ride facilities might be most successful.
There are several important benefits to funding TDM programs through a competitive grant process: • It provides opportunities for implementors and
policymakers to refine their concept and prepare a better-defined program.
• It allows SCAG to require collection of data and monitor the performance of that project whether or not the TDM program itself resulted in a meaningful change in behavior. This supports other recommendations to improve data collection in the region and measure performance of TDM programs in the SC A G regional contex t.
• It encourages innovation by making available funds for pilot proj ects to help implementors develop their service further.
E c ura e e e r cy r u u e
Telework and remote travel opportunities can provide a direct reduction in SO trips and MT. SCAG is in the process of completing its Future of the Workplace which examines the nature of telecommuting habits of those who work from home and those who travel to remote worksites. SCAG can follow the knowledge it has gained throughout this process by becoming a resource for employers who are interested in learning more about or instituting telework programs, and work with CTCs to help them generate additional interest from employers. In particular, SCAG can be a useful resource for public agencies and large employers, who should consider leading by example in implementing their own formal
telework programs.
ased on the results of the Future of the Workplace Study, SCAG can work with employers to provide suggestions for working situations that will be most impac ul in reducing MT. Most likely, this will include the provision of opportunities for employees to work from home, eliminating the need for them to travel to the office or worksite. SCAG can develop reference material, housed on its TDM webpage, that ex amines the steps needed in order for an employ er to provide a successful telework program.

SC A G TDM Strategic Plan and F inal Report
2 9
This material may include:• Estimated upfront cost per employee of se ng up a
program.• Estimated savings per employee by no longer requiring
office attendance.• Potential challenges for both public and private-sector
employers, and how to address those challenges.• enefits of telework programs for both public and private-
sector employ ers.• An evaluation of allowing employees to work from home
vs. remote telework centers.• Tips for working with employees remotely, including
hardware and so ware required for successful set-ups and programmatic suggestions.
SC A G should then ensure this material is put to good use in educating and encouraging employers who may be skeptical about starting programs. The CTCs can be instrumental in this process through the relationships they already have with employers. Partnering with large employers who already implement successful programs may help to encourage the development of programs elsewhere.
Subsequent to the distribution of the telework-focused reference material, SCAG also may want to consider developing similar material focused on delivering other types of remote services, such as health or education, by videoconference.
c r ra e veme e ver ati r Em yer a r er y a a er
Employers are already required or encouraged to consider the commute trips they generate, and how to minimize emissions and congestion associated with those. In some other countries, businesses are also required to consider the delivery and servicing associated with their worksite and o en this is a planning requirement.
In the , a Delivery and Servicing Plan (DSP) is a logistics management tool that can b e used to manage freight delivery and servicing activity that takes place at a site or a collection of sites within a local area. A DSP is likely to focus on activities such as parcel, package delivery and collection, and servicing trips such as waste collection, maintenance of office machinery, heating, air conditioning and lighting. It may also cover general repairs, cleaning and catering provision.
If the DSP is implemented correctly, it can assist organizations in reducing operational costs and vehicle activity at their site. This could be achieved by adopting changes to the way an organization manages various aspects of its business, including:• Implementing a sustainable procurement approach to
improve suppliers’ performance.• Developing new approaches to the management of
deliveries and servicing through facilities management operations.
• Coordinating delivery and servicing activities across the organization as well as between other organizations in the locality .
• Encouraging or requiring delivery through bicycle couriers, when applicable.
• Inclusion of parcel lockers or centralized delivery locations on or near development sites.
SCAG could consider how to incorporate DSPs within the region by encouraging jurisdictions to consider adding DSPs to Developer Agreements. Guidance on how to prepare DSPs, or something similar could also be developed, with support from port and warehouse operators in the region.

SC A G TDM Strategic Plan and F inal Report
3 0
S ra e y e e ar y E tima e Outcome m eme ati me rame
Deliver Study to Determine Success of Incentives and O ther Strategies in C hanging B ehavior
SCAG, with support from C ounty Transportation Commissions and/or Cities
00,000-,000,000
A comprehensive understanding of select SCAG region populations’ motivators, and the ability to develop future programs b ased on that knowledge
L ong-term: 2 + y ears
Recognize Successful TDM Programming through A nnual Award
SC A G 00,000 Increased awareness of TDM in general and of specific successful programming
Short-term: < 1 y ear
Provide and Promote G rant Opportunities for TDM Proj ects
SCAG, with support from C ounty Transportation C ommissions
,000,000 The addition of projects that are innovative and/or can show proven
MT or trip reduction within the SC A G Region
Medium-term: 1 -2 y ears
E ncourage Telework Policy throughout Region
SC A G 00,000 - 00,000
Provision of reference material for employers in the SCAG Region who are interested in implementing telework programs at their sites
Short-term: < 1 y ear
I ncorporate G oods Movement into TDM Conversation
SC A G 00,000 - 00,000
G oods movement and site delivery considered as alongside traditional TDM metrics for worksites and developments sites
Medium-term: 1 -2 y ears

SC A G TDM Strategic Plan and F inal Report
3 1
5.5. Measurement
I n order to plan and implement successful TDM programming in the SC A G Region, implementors must estab lish b aseline travel b ehavior, and monitor changes to travel b ehavior b ased on changes in programming or services. The Region would benefit from standardized methods and collection of data across a wider range of travelers in the region.
Recommendations for improvements to measurement and data collection in the SCAG Region include:• A central resource for all data to b e compiled, collated
and reported.• Encouragement of data collection among those already
required to comply with regional TDM regulation.• A push for standardized data collection based on pre-
existing programs.
eve e a ear u e r a aPrioritized Recommendation
As municipalities and counties begin to collect more data, SCAG should act as the region’s clearing-house, collecting, compiling, and reporting on travel behavior data in the region. Through the forums recommended in the tab le ab ove, they should have knowledge of who within the region is collecting travel data, and should ask contacts from those agencies for data sub missions at least annually . SC A G should then present an annual report detailing travel b ehavior in the region, highlighting the impact of new TDM programming or new infrastructure and where possible, presenting information about specific areas or corridors.
As the South Coast AQMD holds data for those who fall under its Rule 2202 requirement in the South Coast Air asin (which includes four out of the SCAG Region’s six counties), SCAG can take ownership of data coordination for the entire six-county region and align it with national standards. This is done well in the Washington, D.C. metropolitan area, where the Commuter Connections program offers many TDM services, which it calls
Transportation Emissions Reduction Measures .
Commuter Connections has conducted extensive TDM evaluation and has been on the leading front of the development of new/refined methodologies for monitoring, evaluating, and quantifying the impacts of its TDM services since . It uses a combination of evaluation methodologies to report total program results in terms of Trip, V MT, and emissions reductions. Other impacts are also quantified, based on MT reductions.
The Commuter Connections program registers commuters and other individuals in their multi-modal/trip tracking system and other tracking databases, and then conducts program participant surveys based on the individual services for which they registered (e.g. GRH participant survey, telework participant survey, etc.). The program participant surveys assess whether/how the individual changed their commute habits a er registering and receiving services. They also conduct a retention survey to determine the length of time that participants remain using sustainable commutes as in uenced by the program.
The Commuter Connections program also maintains a region-wide database of employers/partners and tracks the individual transportation programs offered. They conduct employee commute surveys and the EPA Commuter Model to quantify the likely change in employee/student/individual commuting behavior based on the individual transportation program offered.
With this data, SCAG and other implementors can better position themselves and their programs for funding opportunities.
r v e Su r r u e E ti
While the South Coast AQMD’s Rule 2202 encourages collection of travel behavior data through their Employee Commute Reduction Program (ECRP) option, only about 0 of employers registering annually choose to comply with that option, the rest opting for the Air Quality Investment Program (AQIP) or Emission Reduction Strategy (ERS) options which, while sometimes more expensive, are less time consuming and easier for site contacts who don’t have experience with TDM implementation.

SC A G TDM Strategic Plan and F inal Report
3 2
Though a large-scale overhaul of Rule 2 2 0 2 that changes the nature of the three options would be difficult and would likely see push back from employers, SCAG can support slight adjustments to the process of registering with the ECRP option to encourage employers to use this option to meet their average vehicle ridership targets. SC A G should b e in charge of this process, with support from the South Coast AQMD and the CTCs in the form of communication with employers.
The South Coast AQMD is currently working on improvements to make this process easier for example registering (including completing the ECRP form) and paying online. SCAG can supplement that effort through help with:• The development of an online guide that is more user-
friendly than the current ECRP Guidelines document. The guide would use links and search functionality to provide more information (including examples of successful strategy options) without requiring the user to scroll through long sections of text.
• F ormal guidelines presented to employ ers that help them calculate MT using the Miles to work one way question on the survey form. This will not change the current Rule 2202 survey form itself, but will guide sites that need to calculate V MT for SB 7 43 compliance. The South Coast AQMD could include this process in their ETC trainings and on their website.
Additionally, the South Coast AQMD allows certified survey providers to add additional questions to its survey. SCAG should work with those who have certified surveys to coordinate asking of the same questions, including:• The option to select new micromobility modes such
as scooter and bikeshare (South Coast AQMD has plans to potentially include this in the general survey in the future).
• Questions about whether carpools were scheduled organically or through apps like Scoop or Waze Carpool.
• Allowing commuters to indicate the mode of the second-longest leg of their trip.
• Including motivator’ questions to understand why SO drivers did not choose other modes, or why those who did commute using alternative modes chose to do so.
Consideration must be made to the length of the survey and its impact on response rate, b ut as the survey process becomes automated and is undertaken through online services (offered for free through the County rideshare programs) this b ecomes less of a concern. O nce standards are set, the South Coast AQMD can help to facilitate standard collection of additional data by providing a list of these extra’ questions as an option to those requesting to certify a survey.
e e a S a ar Se y u e Se er rma ce Metric Goals Across Region
Rule 2 2 0 2 solicits travel data from over 5 0 0 employ ers annually through the ECRP survey process which is used to calculate Average ehicle Ridership (A R). This calculation has set the standard for other municipalities who wish to collect data with a lower threshold:• The City of Santa Monica, through its MO with South
Coast AQMD, requires, among other things, employers of 3 0 or more to survey and calculate their A V R annually .
• The City of urbank and the urbank TMO recently adjusted their reporting process to require TMO members with 2 or more employees to calculate A R.
oth cities make use of survey forms that are very similar to the one used for Rule 2 2 0 2 , so data collected b y these municipalities can be compared to regional data. As municipalities develop policy that requires surveying and data collection, they should consider adhering to the regional standard set b y Rule 2 2 0 2 so that data across the region can be compiled and compared. Ideally, as data continues to be collected through AQMD Rule 2202, the region will be able to demonstrate more complete data on a larger scale.
SCAG could take a lead on this, with support and consultation from South Coast AQMD and the CTCs, by formalizing a regional set of performance metrics that counties and municipalities can collect and demonstrate how the metrics can b e reached through survey tools similar to the one used by South Coast AQMD and the cities of Santa Monica and
urbank. These metrics will be able to be collected at both a small (site-level) and large (county-level) scale, so SCAG will have data from across the region to compile and report on.

SC A G TDM Strategic Plan and F inal Report
3 3
S ra e y e e ar y E tima e Outcome m eme ati me rame
Develop Regional C learing-house for TDM Data
SCAG, with support from C ounty Transportation C ommissions and Cities
00,000 - 00,000
Cohesive regional TDM reporting Medium-term: 1 -2 y ears
Provide Support for Rule 2202’s ECRP Option
SC A G 00,000-,000,000 to
develop online sub mission capab ility and adj ust survey process
E ncouragement of more employ ers to utilize ECRP option, and collection of more complete data from those employ ers
L ong-term: 2 + y ears
se Regional Standard from Rule 2 2 0 2 to E ncourage Data Collection Throughout the Region
SCAG, with support from C ounty Transportation C ommissions and Cities
V aries Additional survey processes that result in comparab le data across the SC A G Region
Short-term: < 1 y ear

Policy
Standardization
Communication
& Partnership
Results-Driven
Programming
Data
CollectionResponsib le Party Estimated Cost O utcome Timeframe
e e S ar
Development of TDM page on SCAG website (p. 2 0 )
Y SC A G 00,000 One-stop-shop’ of TDM information
ST: < 1 y ear
Six County-wide TDM Training Sessions, tailored to Existing Conditions (p. 20)
Y Y SC A G , C TC s 00,000 Introducing TDM to agencies as a key tool
ST: < 1 y ear
cy a e u ati
Deliver Training Workshops on Policy Development and E nforcement (p. 2 1 )
Y Y SC A G , C TC s 00,000 Three new or updated TDM policies
MT: 1 -2 y ears
Provide Support on Monitoring and E nforcement(p. 2 2 )
Y Y SC A G 00,000-,000,000
Five new or updated TDM policies with enforcement /
monitoring
L T: 2 + y ears
Support the Development of State and ational TDM Policy (p. 2 2 )
Y Y SC A G , C TC s, others 00,000 ew TDM- policy at the state level
L T: 2 + y ears
ar er
C onvene Regional and C ounty forums (p. 2 3 ) Y SC A G , C TC s 00,000 Improved communication within and between counties
ST: < 1 y ear
C onsolidate C ounty Ridematching Datab ases and Review County Programs (p. 2 )
Y Y C TC s, SC A G 00,000-00,000
Single datab ase for the region
MT: 1 -2 y ears
Facilitate Development of TMAs/TMOs (p. 2 ) Y Y Y SC A G , C TC s 00,000 (TMA guide)
00,000-,000,000
(start-ups)
More knowledge of TMAs/TMO s
Three new TMAs start-ups
MT: 1 -2 y ears (TMA
guide)
L T: 2 + y ears (start-ups)
Facilitate Partnerships between the Public Sector and Private Service Providers (Trainings and Templates) (p. 2 5 )
Y Y Y SC A G , C TC s 00,000 - 00,000
etter knowledge and expertise of how to partner
MT: 1 -2 y ears
Programming
Deliver Study to Determine Success of Incentives in C hanging B ehavior (p. 2 7 )
Y Y SCAG, CTCs, cities 00,000-1 , 0 0 0 , 0 0 0
nowledge of motivators and program development
L T: 2 + y ears
Recognize Successful TDM Programming through Annual Award (p. 2 )
Y Y SC A G 00,000 Increased awareness of TDM ST: < 1 y ear
Provide and Promote Grant Opportunities for TDM Proj ects (p. 2 8 )
Y Y Y SC A G , C TC s ,000,000 ew innovative projects MT: 1 -2 y ears
Encouragement of Telework Policy throughout Region (p. 2 8 )
Y Y SC A G 00,000-1 , 0 0 0 , 0 0 0
ew reference material for employ ers
ST: < 1 y ear
Incorporate Goods Movement into TDM Conversation (p. 2 )
Y Y SC A G 00,000 - 00,000
F reight and delivery integrated into TDM
MT: 1 -2 y ears
Measurement
Develop Regional C learing-house for TDM Data (p. 3 1 )
Y Y SCAG, CTCs, cities 00,000 - 00,000
C ohesive regional TDM reporting
MT: 1 -2 y ears
Provide Support for Rule 2202’s ECRP Option(p. 3 1 )
Y SC A G 00,000-,000,000
More employ ers use E C RP L T: 2 + y ears
se Regional Standard from Rule 2202 to Encourage Data Collection Throughout the Region (p. 3 2 )
Y SCAG, CTCs, cities V aries More survey s that provide comparab le data
ST: < 1 y ear
Table - : SCAG Region TDM Recommendations Overview
3 4

SC A G TDM Strategic Plan and F inal Report
A TDM Strategic Plan TAC Members
Michael B oehm – L A E DC Marlon Regisford – C altrans
acquilyne rooks de Camarillo ACMTA Mark Roberts Caltrans
Martin uford ACMTA Dolores Roy b al Saltereli – L A C MTA
B rian C unanan – RC TC Sandy Sanchez Five Points Development Corp.
Steve DeG eorge – V C TC W ally Seimb ab – SB C C O G
Ray Gorski MSRC Sam Sharvini – O C TA
Carol Gomez South Coast AQMD ily Shoup y
Drew ent CTC Mott Smith Civic Enterprise
Dan opulsky Caltrans David Somers – C ity of L os A ngeles
Pamela L ee – C ity of L os A ngeles N icole Soto – SB C TA
uan Matute C A C olleen Stoll – C ity of Santa Monica
Antoinette Meier SA DAG J ulia Thay ne – Siemens
irginia Mendoza ICTC C hris Tseng – W RC O G
G reg N ord – O C TA Chelsea rsaner CityFi
H ilary N orton – F A ST erard Wright A County usiness Federation

SC A G TDM Strategic Plan and F inal Report
B Commonly Used Terms
cr y m ameA C T Association for Commuter Transportation A V R A verage V ehicle Ridership C O G C ouncil of G overnments C TC County Transportation CommissionE C RP Employee Commute Reduction Program ICTC Imperial County Transportation Commission L A Metro os Angeles County Metropolitan Transportation Authority A I os Angeles eighborhood Initiative
O C TA Orange County Transportation Authority RC TC Riverside County Transportation Commission RTA Riverside Transit A gency RTP/SCS Regional Transportation Plan/Sustainable Communities Strategy SA N DA G San Diego Association of Governments SB C TA San ernardino County Transportation Authority SC A G Southern California Association of Governments South Coast AQMD South Coast Air Quality Management District SO V Single O ccupant V ehiclesTDM Transportation Demand Management TMA/TMO Transportation Management Association/Organization TN C Transportation etwork Company V C TC entura County Transportation Commission V MT V ehicle Miles Traveled V V TA V ictor V alley Transit A uthority W RC O G W estern Riverside C ouncil of G overnments

SC A G TDM Strategic Plan and F inal Report
C Literature Review

SCAG Transportation Demand Management (TDM) Strategic Plan TDM Literature Review
March 15, 2019
Submitted to: Steer as prime consultant to SCAG
Submitted by: ICF

Table of Contents I. Objectives of Transportation Demand Management................................................................... 1 II. Organizational and Institutional Arrangements ........................................................................... 2 III. Funding for TDM Programs ............................................................................................................ 4
Federal Funding ................................................................................................................................ 4 California ........................................................................................................................................... 5 Other Sources of Funding ................................................................................................................. 5
V. TDM-Related Legislation and Regulation ..................................................................................... 6 VI. Performance Measures for TDM programs .................................................................................. 9
Program Effectiveness and Outcomes ............................................................................................. 9 Program Impacts ............................................................................................................................. 11 Sample Performance Metrics .......................................................................................................... 12
VII. TDM Strategies .......................................................................................................................... 24 Existing Strategies ........................................................................................................................... 24 Future Strategies ............................................................................................................................. 46
VIII. Summary of Strategies .......................................................................................................... 48 IX. Best Practices Summary .............................................................................................................. 54 Appendix A – List of Reviewed Agencies ....................................................................................... 58
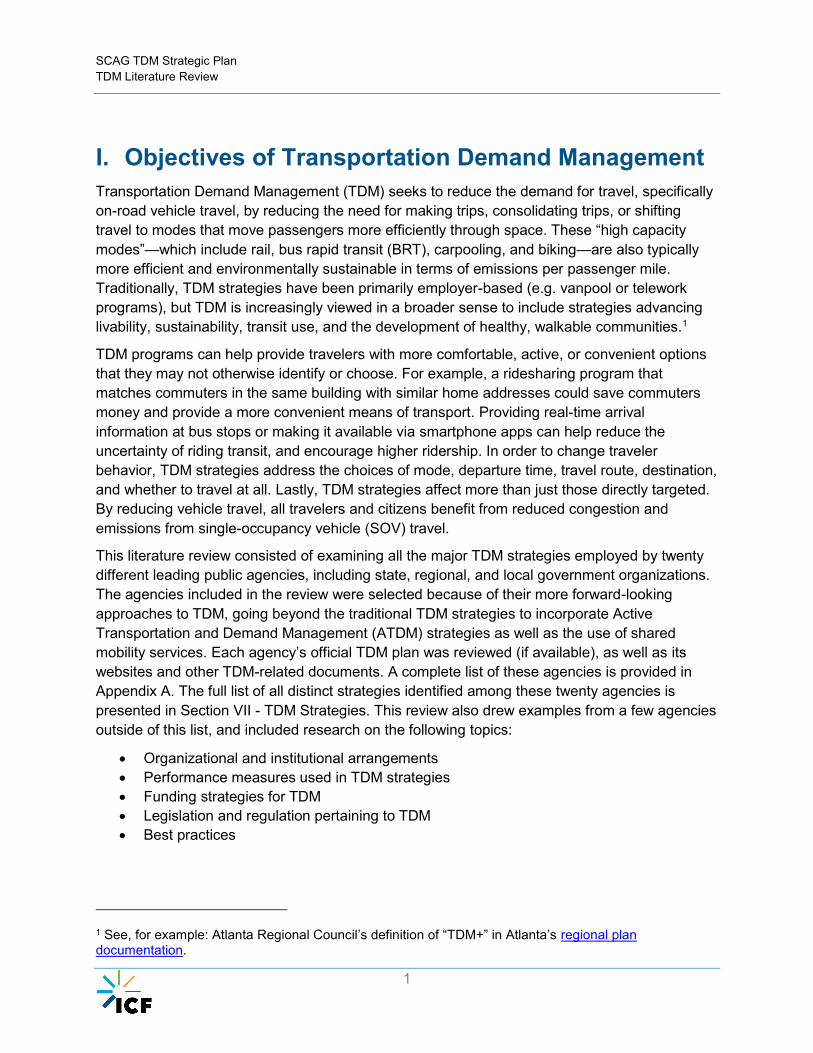
SCAG TDM Strategic Plan TDM Literature Review
1
I. Objectives of Transportation Demand Management Transportation Demand Management (TDM) seeks to reduce the demand for travel, specifically on-road vehicle travel, by reducing the need for making trips, consolidating trips, or shifting travel to modes that move passengers more efficiently through space. These “high capacity modes”—which include rail, bus rapid transit (BRT), carpooling, and biking—are also typically more efficient and environmentally sustainable in terms of emissions per passenger mile. Traditionally, TDM strategies have been primarily employer-based (e.g. vanpool or telework programs), but TDM is increasingly viewed in a broader sense to include strategies advancing livability, sustainability, transit use, and the development of healthy, walkable communities.1
TDM programs can help provide travelers with more comfortable, active, or convenient options that they may not otherwise identify or choose. For example, a ridesharing program that matches commuters in the same building with similar home addresses could save commuters money and provide a more convenient means of transport. Providing real-time arrival information at bus stops or making it available via smartphone apps can help reduce the uncertainty of riding transit, and encourage higher ridership. In order to change traveler behavior, TDM strategies address the choices of mode, departure time, travel route, destination, and whether to travel at all. Lastly, TDM strategies affect more than just those directly targeted. By reducing vehicle travel, all travelers and citizens benefit from reduced congestion and emissions from single-occupancy vehicle (SOV) travel.
This literature review consisted of examining all the major TDM strategies employed by twenty different leading public agencies, including state, regional, and local government organizations. The agencies included in the review were selected because of their more forward-looking approaches to TDM, going beyond the traditional TDM strategies to incorporate Active Transportation and Demand Management (ATDM) strategies as well as the use of shared mobility services. Each agency’s official TDM plan was reviewed (if available), as well as its websites and other TDM-related documents. A complete list of these agencies is provided in Appendix A. The full list of all distinct strategies identified among these twenty agencies is presented in Section VII - TDM Strategies. This review also drew examples from a few agencies outside of this list, and included research on the following topics:
• Organizational and institutional arrangements • Performance measures used in TDM strategies • Funding strategies for TDM • Legislation and regulation pertaining to TDM • Best practices
1 See, for example: Atlanta Regional Council’s definition of “TDM+” in Atlanta’s regional plan documentation.

SCAG TDM Strategic Plan TDM Literature Review
2
II. Organizational and Institutional Arrangements A variety of agencies have roles in creating TDM policy and programming, including state DOTs, MPOs, local/city governments, transit agencies, and transportation management associations (TMAs)/transportation management organizations (TMOs).
State DOT involvement in TDM varies by state, but can involve the distribution of funds, enactment of legislation, or state-wide program measures. DOTs can determine Congestion Mitigation and Air Quality (CMAQ) funding allocation, such as in Tennessee, where the state DOT has set aside several million dollars to “help encourage the advancement of specific initiatives related to new or expanded transit service and park and ride lots.”2 More information about CMAQ funding can be found in Section III - Funding for TDM Programs.
State DOTs can also be direct owners of various state level programs. In the case of Washington State, the DOT (WSDOT) is the governing body of a statewide Commute Trip Reduction (CTR) program, which was enacted by legislators in 2006 as part of the CTR Law. WSDOT’s role is to provide resources and accounting of local government agency efforts to reduce commute trips, as is required of them by the law. New York State Department of Transportation (NYSDOT) also operates several statewide efforts, such as the commute ridematching system and the Guaranteed Ride Home (GRH) program.
City government provides critical support for many TDM strategies. One of the primary roles of local/city government is to create land-use and development policy, and to provide guidance to developers and employers to help them meet TDM requirements. For example, the City of Los Angeles is in the process of updating its city TDM ordinance to more closely align with the measurement of vehicle miles traveled as a mitigated impact. Along with this mandate, the city is also developing a calculator tool to help developers measure benefits3 . Santa Monica’s TDM ordinance requires employers to submit detailed reporting on the transportation habits of employees; employers with less than 30 employees must submit a Worksite Transportation plan that includes education materials and amenities offered and distributed to employees while employers with more than 30 employees must submit an Emission Reduction Plan which includes the certification of an employee as an Employee Transportation Coordinator (ETC).4
MPOs work mostly as research and assistance organizations with regards to TDM, providing analysis of system weaknesses and trends, guidance to other organizations, or funding support to smaller organizations. For example, Sacramento Area Council of Governments (SACOG) is responsible for TDM studies and analysis of ongoing efforts in the region, and funds several small-level projects throughout its jurisdiction such as subsidized Uber rides to a light rail station (administered via a TMA), bike safety courses for youth, and transit marketing.5 To coordinate 2 State of Tennessee. Statewide Transportation Demand Management (TDM) Plan for Tennessee Nonattainment and Maintenance Areas 3 City of Los Angeles. Modernizing Transportation in Los Angeles. February 7, 2018. 4 Santa Monica Municipal Code Chapter 9.53 5 Sacramento Area Council of Governments. Recently Funded Projects. Accessed November 2018.
SCAG TDM Strategic Plan TDM Literature Review
3
these programs with their associated groups, SACOG facilitates a TDM Task Force within the six-county region. “The TDM Task Force meets monthly, and is charged with advising and assisting SACOG on its TDM programs, including plans, budgeting, guidelines for the TDM regional funding program, marketing activities, materials, incentive programs and websites.” Other MPOs organize themselves differently, such as the Atlanta Regional Council (ARC), which has no specific TDM sub-committee, but does have mode-specific and program-specific groups that focus on TDM strategies.6
Boston’s MPO, Metropolitan Area Planning Council (MAPC), also exists primarily as a resource and assistance-giving organization, advertising itself to municipal governments and transit agencies as a resource for undertaking new initiatives or conducting analyses. MAPC issued a compendium of TDM case studies from local agencies throughout Massachusetts. Case studies spanned a variety of measures, and were provided after giving context of state regulations pertaining to TDM. The agency also discussed best practices gleaned from its review,7 and has a very detailed website outlining the theory and observed benefits from a variety of TDM practices.8 MAPC has also conducted analyses of transit-oriented development (TOD) funding gaps9 and of Transportation Network Company (TNC) usage patterns in the Boston area.10
MPOs are well-positioned to spur action at a more local level via funding choices. For example, the Livable Centers Initiative (LCI) by the ARC awards planning grants to local governments and non-profits to “prepare plans consistent with regional development policies for the enhancement of existing centers and corridors.”11 In the Bay Area, the Metropolitan Transportation Commission (MTC) funds a variety of projects for other agencies (TMAs, transit agencies, city government) such as county rideshare programs, and San Francisco Municipal Transportation Agency’s (SFMTA) integration of private modes with their fixed route service.12
TMAs/TMOs typically are formed by representatives from local stakeholders, and are well-positioned to deal with the most local programs. Because of their local focus and their relationships with area stakeholders they are often well suited for TDM implementation. MPOs, cities, and counties sometimes fund programs that are implemented though TMAs, such as in the aforementioned case of SFMTA’s subsidization of Uber rides to and from stations.
Transit Agencies are largely responsible for adjusting transit service, schedules, and fares to maximize public goals. They are well positioned to provide free passes for certain groups, incentives for transit use at different times of day, or service quality improvements (e.g. amenities, real-time vehicle tracking APIs, etc).
6 ARC. Regional TDM Inventory Baseline Report. December 28, 2012. 7 MAPC. TDM Case Studies and Regulations. July 2015. 8 MAPC. Parking and Transportation Demand Management. February 24, 2017. 9 MAPC. Gap Analysis for TOD Financing. December 2012. 10 MAPC. Transportation. Accessed November 2018. 11 Ibid see 6. 12 MTC. Cities Initiatives Program: Evaluation Summary Report. July 2015.

SCAG TDM Strategic Plan TDM Literature Review
4
III. Funding for TDM Programs TDM programs can be supported through federal, state, and local funds. Some of the sources for TDM funding are discussed below.
Federal Funding Congestion Mitigation and Air Quality Improvement (CMAQ) Program Funding for many TDM programs nationally comes from the Congestion Mitigation and Air Quality (CMAQ) program, which supports surface transportation projects and related efforts that contribute air quality benefits via traffic reduction. These funds are distributed both to state DOTs and qualified large MPOs. The passage of the Moving Ahead for Progress in the 21st Century Act (otherwise referred to as “MAP‐21”) redefined CMAQ eligibility to include telecommuting, ridesharing, car‐sharing, alternative work hours, and pricing projects.
FTA Grants The Federal Transit Administration (FTA) provides grants to urbanized areas and governors for transit assistance, known as the Urbanized Area Formula Grants (49 USC section 5307). These grants are available to all urban areas and awarded to designated applicants in the region, who are then responsible for distributing to local organizations. In addition to funding transit studies and capital improvements, the grants can also be used to fund mobility management programs.13 FTA also provides formula grants for rural areas (49 USC section 5311) that can be used for job access and reverse commute projects. ARC uses FTA 5307 funds to support vanpools in the Atlanta region, while FTA 5311 funds are used to support vanpools in rural areas of the state.”14
Surface Transportation Program (STP) Surface Transportation Program (STP) funds are also being used to support TDM and are considered the most flexible of the funding streams included in this memo because they can supplement CMAQ and FTA funds. This program “provides flexible funding that may be used by States and localities for projects to preserve and improve the conditions and performance on any Federal-aid highway, bridge and tunnel projects on any public road, pedestrian and bicycle infrastructure, and transit capital projects, including intercity bus terminals.”
State Planning and Research Funds State Planning and Research (SPR) funds can be used to conduct studies and evaluations of TDM programs.15 For example, the Houston-Galveston Area Council received SPR funds from
13 FTA. Urbanized Area Formula Grants- 5307. Accessed November 2018. 14 ARC. Regional TDM Inventory Baseline Report. December 28, 2012. 15 FHWA. Integrating Demand Management into the Transportation Planning Process. August 2012.

SCAG TDM Strategic Plan TDM Literature Review
5
Texas DOT to conduct a public survey which established baseline levels of commuting practices, including use of alternative options such as transit, vanpool, carpool, and telecommuting, and to analyze the impact of financial incentives and service enhancements on the use of such alternative options.16
California
Sustainable Communities Grants California’s Sustainable Communities Grants can be used to fund the planning of TDM strategies. For FY2019-20, the state will be issuing $29.5 million of grants under this program. These grants are intended to “fund local and regional multimodal transportation and land use planning projects that … contribute to the State’s greenhouse gas reduction targets” among other objectives, and specifically call out strategies such as mode shift and demand management in their application criteria.17
Revenue from California’s Cap-and-Trade program Revenues from the program go to the Greenhouse Gas Reduction Fund (GGRF), which then allocates funding awards to projects throughout the state that advance goals outlined in the Global Warming Solutions Act. The GGRF has provided funding to over 330 transit agency projects since its creation.18 Most awards are focused on promoting alternative fuel vehicle usage, though any funding dedicated towards transit improvements—such as new, clean buses and light rail—can be considered as a TDM strategy as it encourages transit use.
Other Sources of Funding Other sources of funding for TDM-related programs include local sales taxes, developer impact fees, special grants for liveability (such as Smart Cities grants), congestion pricing revenue and parking revenues.19
16 AMPO. Commuter and Employer Transportation Preferences in Greater Houston. October 2015. 17 Caltrans. FY 2019-20 Transportation Planning Grants. October 2018. 18 CCI. Annual Report: Cap and Trade Auction Proceeds. 2018. 19 FHWA. Integrating Demand Management into the Transportation Planning Process. August 2012.

SCAG TDM Strategic Plan TDM Literature Review
6
V. TDM-Related Legislation and Regulation Several policies and mandates within California, along with federal regulation, affect the implementation of TDM programs in the state.
Federal Regulation 23 CFR 450.322 Federal regulation 23 CFR 450.322 speaks to the congestion management process in transportation management areas. In non-attainment areas, federal funds cannot be programmed for projects that significantly increase single occupancy vehicle (SOV) capacity unless the project is addressed through the congestion management process, including an appropriate analysis of reasonable (including multimodal) travel demand reduction and operational management strategies for the corridor.
Congestion Management Program (Section 65089 (b)(3) of the California Government Code) TDM is a statutorily required component of the Congestion Management Program (Section 65089 (b)(3) of the California Government Code), which directs agencies to include “a travel demand element that promotes alternative transportation methods, including, but not limited to, carpools, vanpools, transit, bicycles, and park-and-ride lots; improvements in the balance between jobs and housing; and other strategies, including, but not limited to, flexible work hours, telecommuting, and parking management programs. The agency shall consider parking cash-out programs during the development and update of the travel demand element.”20 Counties can opt out of the Congestion Management Program; Los Angeles County has just initiated the process to do so.
California Environmental Quality Act (CEQA) / SB 743 The California Environmental Quality Act (CEQA) is a statute that “requires state and local agencies to identify the significant environmental impacts of their actions and to avoid or mitigate those impacts, if feasible.”21 Activities that garner TDM impacts, which often correlate with environmental impacts, can be included as proposed mitigations under the scope of CEQA.
The California state government recently updated existing CEQA regulations to change the allowable accounting methods for transportation impacts. Under Senate Bill SB 743, regions will be required to measure VMT impacts rather than Level-of-Service (LOS) impacts from projects when evaluating transportation impacts as part of CEQA compliance. Specifically, transportation impacts may be measured in terms of “vehicle miles traveled, vehicle miles traveled per capita, automobile trip generation rates, or automobile trips generated.”22 VMT impacts more closely
20 Cal. Gov't. Code §65089.5 21 State of California. CEQA Frequently Asked Questions. Accessed November 2018. 22 State of California. Transportation Impacts (SB 743). Accessed November 2018.

SCAG TDM Strategic Plan TDM Literature Review
7
relate to emissions and environmental impact, whereas LOS, which is a measure of automobile delay relative to ideal conditions on a roadway, less closely correlates.
Parking Cash Out Law A 1992 California state law (AB 2109, also known as the Parking Cash-Out Law) requires employers with 50 or more workers who are located in an area designated as non-attainment for air quality standards and who lease individual parking spaces for their employees to offer employees a cash payment in lieu of the parking space, which is intended to promote transit, biking, or walking. However, since the law only applies to certain employers, and has no enforcement provisions, it is limited in practice.
Air Quality Management Districts Several air quality management districts (AQMDs) have regulations establishing commuter programs. The South Coast AQMD enforces Rule 2022, which applies to employers with more than 250 employees and is designed to reduce emissions from employee commutes. It requires employers to offset these emissions by paying into a regional fund, purchasing emission reduction credits, or submitting annual Employee Commute Reduction Programs (ECRPs) which allows them to select from a list of TDM strategies to provide at their worksites.23 Similarly, the Bay Area AQMD has a Commuter Benefits Program that requires all employers with 50 or more full-time employees to offer commuter benefits.24
TDM Ordinances/Mandates Many cities have implemented ordinances and/or incentives for developments to encourage transportation options and further TDM goals. For example:
• In Pasadena, a citywide trip reduction ordinance mandates that owners and developers include the provision of carpool/vanpool spaces equivalent to 10% of employee parking, and bicycle parking among other strategies.25
• The city of Cambridge, MA has a “Parking and TDM” ordinance governing project requirements for both small (5-19 parking spaces) and large (20 or more spaces) projects. Small projects require a set of three TDM measures, and large ones require an SOV mode share commitment, a comprehensive set of TDM measures, and annual monitoring and reporting.26
• In San Francisco, most large new developments are subject to Planning Code Section 169.3 and must submit a TDM plan demonstrating plans to reduce VMT. In conjunction
23 AQMD. Rule 2202. Accessed November 2018. 24 BAAQMD. Commuter Benefits Program. Accessed November 2018. 25 City of Pasadena. Transportation Demand Management. Accessed November 2018. 26 City of Cambridge. Parking and Transportation Demand Management Ordinance. Accessed November 2018.

SCAG TDM Strategic Plan TDM Literature Review
8
with this rulemaking, the city has a program to assist developers in creating these plans.27 The program received 86 plans for review as of March 2018.28
27 SF Planning. TDM Program. Accessed November 2018. 28 City and County of San Francisco. TDM Program First-Year Monitoring Report. May 2018.

SCAG TDM Strategic Plan TDM Literature Review
9
VI. Performance Measures for TDM programs This section describes some of the metrics used in each category and provides examples for some of these metrics. Robust and detailed performance measurements of TDM programs are expensive to develop, collect, and analyze. The few organizations included in this section are statewide and well-funded. Many programs that operate on a smaller scale or budget primarily track program participation, as measured by registration numbers, but do not have the resources to collect program maintenance data to analyze more indicative outcomes and impacts. It should be noted that there is very little publicly available data on actual performance measurements from TDM programs for the reasons outlined above. Though agencies may not have the data on performance measures to conduct full cost-benefit analyses, they are able to, and certainly do, analyze programs based upon the qualitative and quantitative information that they do have, in order to compare with data collected from previous efforts within the same program. For example, Oregon DOT transitioned marketing and advertising for a TDM corridor-based congestion mitigation campaign through their Transportation Options program from traditional digital strategies to non-traditional marketing strategies, such as social media geofencing techniques. The new approach cost $20,000 less than Transportation Options campaigns that previously used regular digital advertising, with only 100 fewer registrants for the incentive program. The decrease in participants was minimal compared to the campaign’s cost savings. In another example, NYSDOT hosted a Long Island Expressway HOV Lane Challenge using mailers, emails, and employee outreach to encourage mode shift to vanpools. The challenge was poorly received because, according to NYSDOT, participation required paper tracking sheets, which were time consuming and perceived to not be worth the effort of possible incentives.
TDM performance measures generally fall into two broad categories:
1. Program Effectiveness and Outcomes 2. Program Impacts
Program Effectiveness and Outcomes Many TDM programs have performance metrics for evaluating the effectiveness based on engagement or participation. The purpose of measuring users’ interactions with individual TDM activities is to learn which services, tools, or tactics yield the most participation, so that they can be replicated. Examples include the evaluation of program tools such as rideshare matching systems and trip tracking features, or services like employer outreach and marketing efforts. Program outcome measures are those that demonstrate the results of individual TDM activities, and many TDM programs have quantified and reported on such outcomes. Since program services and tools differ slightly from region to region to accommodate individual regions’ needs, so do the specific performance measures used to estimate their effectiveness. Below are some examples that measure TDM program effectiveness:

SCAG TDM Strategic Plan TDM Literature Review
10
Program Activity or Effort
Program Engagement - Example Measures
TDM Systems, Rideshare Matching Systems
Growth in total database or membership size over time Complete vs Incomplete Registrations Growth in trips tracked over time Average number of matches per matchlist generated Number of transit itineraries generated
Marketing Promotions Participation in events
Participation in promotional events such as Bike to Work, Earth Month, Rideshare Month, etc. Growth in program registrations during specific periods of time or throughout promotional events Increase/decrease in website visits or social media during specific periods of time or throughout promotional events
Outreach
Growth in number of employee transportation coordinators trained over a specific period of time (monthly, quarterly, annually, etc.) Number and growth in number of employers who are provided with technical assistance Number of tabling events, number of new members obtained per event
Outreach to Prospective Program Participants
New program registrants or new active registrants Growth in new and total program registrants over a specific period of time New program participants from events
Support to (Existing) Program Participants
Number of employees/commuters with access to transportation programs or benefits Number of program participants who have signed up for individual services such as
• Ride-matching, • Carsharing, • GRH, • Commute reduction information, • Transit passes for qualifying travelers • Telework
Number of program participants who have increased their level of engagement by way of signing up for additional services or services with more trip reduction potential
Outreach to (Existing) Program Participants
Number of passenger boardings on transit, shuttles, or vanpools. Agencies commonly have specific ridership goals for future years.29
Outreach to Prospective Employers/Organizations
Number of new employers or organizations who begin offering a transportation program or benefit
Support to Existing Employers/Organizations
Number of organizations served Number of employers who offer transportation programs or benefits, Commute reduction programs
29 See, for example: LA County Metropolitan Transportation Authority First Last Mile Strategic Plan

SCAG TDM Strategic Plan TDM Literature Review
11
Program Impacts Program impacts are the measures that demonstrate how TDM programs are impacting the larger community. Most programs evaluate their impacts in terms of congestion reduction (e.g., trips reduced, vehicle miles traveled reduced, emissions reduced), largely because these metrics are of interest to the CMAQ program—the funding source most commonly used for TDM programs.
Many TDM Programs have also identified the desire to measure the impact of TDM activities on economic development and overall mobility. Increasingly, local business communities request assistance with improving access to jobs, especially in rural areas or other areas underserved by public transportation. Other TDM programs are being asked to support human services programs with transportation information and mobility options for veterans and others with mobility challenges. As such, opportunities exist for TDM programs to demonstrate impacts on economic development efforts and overall mobility.
Program Activity or Effort
Program Outcomes - Example Measures
Facility usage for active transportation
Bike and pedestrian counters can track usage of sidewalks and bike/scooter lanes30
Park & Ride Lot occupancy
VMT reduction
• Per capita
• Total
• Per tenant
• Per employee
• Per affected employment
• Per mode or TDM program element or service
VMT reduction is an end-goal of all TDM programs. For activities with a scope that could affect all travelers within a region, VMT reductions can be set to that full geographic scope. In other cases, such as building or facility-specific improvement, VMT reductions might be per tenant or per employee. When analyzing regional TDM plans that are targeted at office employee commute change, VMT impacts should be measured relative to “affected employment,” a measure of the population working at office locations in the program geography.31
User experience in using alternative modes
User experience information can be gleaned from surveys.
Mode shift (change in percent of population commuting by mode)
The encompassed population may vary by program, but the measure functions the same: a change in the percentage of the total studied population that is commuting by a certain mode.
Traveler cost savings
• Total
• Per commuter
Since TDM programs are generally encouraging usage of less expensive modes (walking, biking, carpooling, transit), impacts on cost savings can be calculated per affected commuter or in total amongst all affected commuters.
30 Recommended in LA County Metropolitan Transportation Authority’s First Last Mile Strategic Plan 31 For guidance on this metric, see Procedures Manual for Estimating Emission Reductions from Voluntary Measure and Commuter Choice Incentive Programs . For an example of it being used by an organization, see: Hillsborough County Long-Range TDM Plan

SCAG TDM Strategic Plan TDM Literature Review
12
Emissions reductions (total or per capita)
Many agencies calculate VMT and emissions impacts of their teleworking assistance efforts based on assumptions of trip lengths and total trip reduction counts from the program.
Traffic delay time change One goal of commute reduction is to alleviate traffic. For example, WSDOT calculated that its CTR program had cut traffic delays by eight percent.32
Sample Performance Metrics Many TDM programs do not formally document their performance measurement methodologies and metrics due to the expense of time and staff resources in developing and analyzing them. This section provides an overview of performance metrics that we have been able to collect through interviews with the following TDM programs:
• Commuter Assistance Program, Florida Department of Transportation
• 511NY Rideshare, New York State Department of Transportation
• Transportation Options, Oregon State Department of Transportation
• Commuter Connections, Washington, D.C. Council of Governments
There are many variables and differences in the peer agencies reviewed, including the jurisdictions served, population sizes, transportation options available, types of program services offered, and how program services are structured.
The Florida Department of Transportation has six regional Commuter Assistance Programs (TDM programs) throughout the state. Some functions and services, such as TDM program performance monitoring and evaluation for all of the local/regional TDM programs, is coordinated and conducted statewide. Other services, such as employer and commuter outreach, is conducted at the local/regional level.
The New York Department of Transportation operates a statewide TDM program. Some services are not offered statewide, such as commuter outreach and vanpool formation services, offered at the local/regional level only in the major urban areas. But to the extent possible, TDM services such as employer outreach, marketing/communications, rideshare platform, and program performance monitoring and evaluation, are coordinated and conducted statewide.
Oregon Department of Transportation also operates a statewide TDM program, called Transportation Options. The Transportation Options program is also coordinated and managed statewide, but services are offered at the local level. Program monitoring and evaluation is coordinated and conducted at the statewide level, with minor differences at the regional level to account for differences in TDM strategies implemented.
Finally, the Washington, D.C. Commuter Connections program is a regional TDM program, offering services in the Washington, D.C. metropolitan region, which includes areas in Maryland and Virginia. Services are offered consistently throughout the region, including the regional
32 WSDOT. CTR Overview. Accessed November 2018.

SCAG TDM Strategic Plan TDM Literature Review
13
rideshare and trip tracking, employer and commuter outreach, and marketing. Some services (such as the Guaranteed Ride Home program) are offered more widely – beyond the metropolitan region and throughout the state of Maryland and Virginia, due to long commute distances.
Florida Department of Transportation, Commuter Assistance Program The Florida Department of Transportation Commuter Assistance Program tracks various program participant data, such as the number of commuters registering for rideshare matches, and also conducts program participant surveys to determine whether and how their commuting habits changed after registering. The Commuter Assistance Program also uses the Trip Reduction Impacts of Mobility Management Strategies (TRIMMS) model to estimate the impacts of TDM on various societal benefits, such as CO2 emissions reductions, which are based on VMT reductions.
Florida DOT’s Performance Metrics Monitoring and Evaluating the Effectiveness of TDM Activities
TDM Systems, Rideshare Matching Systems
▪ Customers receiving names of potential ride matches who contacted others ▪ Customers receiving names to pool and contacted other who actually formed a pool ▪ Customers receiving names of potential ride matches who contacted others ▪ Customers receiving names to pool and contacted other who actually formed a pool ▪ Overall share of customers who were successful in forming a pool with assistance of
CAP
Support and Outreach to (Existing) Program Participants
▪ Customer Round-Trip Commutes Avoided by Use of Telework ▪ Customer Round-Trip Commutes Avoided by Use of Alternative Work Schedules ▪ Annual current carpool and vanpool person trips
Florida DOT’s Performance Metrics Monitoring and Evaluating TDM Program Impacts
VMT reduction: total and per capita, tenant, employee, mode/TDM program
▪ Vehicle miles of travel reduced ▪ Vehicle trips reduced ▪ Air Pollution ▪ GHG ▪ Congestion ▪ Excess Fuel consumption ▪ Noise Pollution ▪ Health & Safety (costs associated with crashes) ▪ Annual current carpool and vanpool person miles of travel ▪ Customer round-trip commutes avoided by use of telework

SCAG TDM Strategic Plan TDM Literature Review
14
▪ Customer round-trip commutes avoided by use of alternative work schedules
User experience in using alternative modes
▪ Customer satisfaction ▪ Customer satisfaction – would recommend
Mode shift (change in percent of population commuting per mode)
▪ Percent of drive-alone customers switching to a commute alternative (the most restrictive definition)
▪ Percent of drive-alone customers switching to a commute alternative (a more generous definition)
Traveler cost savings: total and per commuter
▪ Cost savings to commuters (saving based on only fuel, tire, maintenance and reduced depreciation costs)
Emissions reductions: total and per capita
▪ Gasoline consumption reduced ▪ Carbon Dioxide ▪ Carbon footprint (CO2 Equivalent)
The following table summarizes Florida DOT’s results from the program year 2011/2012, and is the most recent report that summarizes the methodology used and results achieved on a statewide level.

SCAG TDM Strategic Plan TDM Literature Review
15
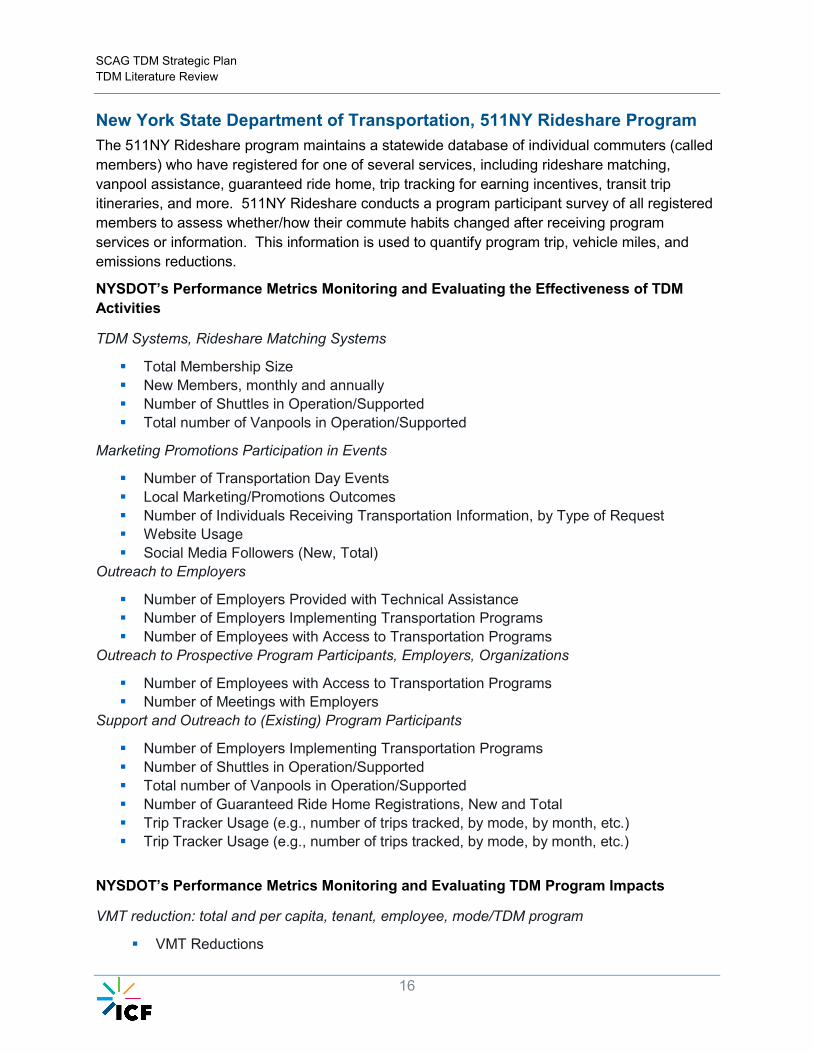
SCAG TDM Strategic Plan TDM Literature Review
16
New York State Department of Transportation, 511NY Rideshare Program The 511NY Rideshare program maintains a statewide database of individual commuters (called members) who have registered for one of several services, including rideshare matching, vanpool assistance, guaranteed ride home, trip tracking for earning incentives, transit trip itineraries, and more. 511NY Rideshare conducts a program participant survey of all registered members to assess whether/how their commute habits changed after receiving program services or information. This information is used to quantify program trip, vehicle miles, and emissions reductions.
NYSDOT’s Performance Metrics Monitoring and Evaluating the Effectiveness of TDM Activities
TDM Systems, Rideshare Matching Systems
▪ Total Membership Size ▪ New Members, monthly and annually ▪ Number of Shuttles in Operation/Supported ▪ Total number of Vanpools in Operation/Supported
Marketing Promotions Participation in Events
▪ Number of Transportation Day Events ▪ Local Marketing/Promotions Outcomes ▪ Number of Individuals Receiving Transportation Information, by Type of Request ▪ Website Usage ▪ Social Media Followers (New, Total)
Outreach to Employers
▪ Number of Employers Provided with Technical Assistance ▪ Number of Employers Implementing Transportation Programs ▪ Number of Employees with Access to Transportation Programs
Outreach to Prospective Program Participants, Employers, Organizations
▪ Number of Employees with Access to Transportation Programs ▪ Number of Meetings with Employers
Support and Outreach to (Existing) Program Participants
▪ Number of Employers Implementing Transportation Programs ▪ Number of Shuttles in Operation/Supported ▪ Total number of Vanpools in Operation/Supported ▪ Number of Guaranteed Ride Home Registrations, New and Total ▪ Trip Tracker Usage (e.g., number of trips tracked, by mode, by month, etc.) ▪ Trip Tracker Usage (e.g., number of trips tracked, by mode, by month, etc.)
NYSDOT’s Performance Metrics Monitoring and Evaluating TDM Program Impacts
VMT reduction: total and per capita, tenant, employee, mode/TDM program
▪ VMT Reductions

SCAG TDM Strategic Plan TDM Literature Review
17
▪ Trip Reductions ▪ GHG Emissions reductions
Other impacts that NYSDOT measures include emergency preparedness and support in response to roadway and transit construction projects, and unplanned emergencies such as severe winter storms or hurricanes.
The program has also implemented new measures for the program year 2018/2019, in response to large corporations and local business communities requesting assistance with improving access to jobs. These new performance metrics are intended to measure the impacts on economic development and overall mobility, based on the number of transportation programs implemented at worksites/universities, and the number of employees/students/commuters who have access to those programs and services. To accomplish this level of detailed tracking, the 511NY Rideshare program launched a statewide customer relations management (CRM) platform to track and organize employer/program partner contacts, activity, and communications (e.g., technical assistance and worksite transportation programs offered by the employer).
Unlike other regions, 511NY Rideshare also tracks emergency preparedness and support offered to employers during or in advance of roadway and transit construction projects, and unplanned emergencies such as severe winter storms or hurricanes.
511NY Rideshare’s Program Impacts for the program year 2017/2018 are listed below.
• 448,104 SOV trips reduced • 14,854,942 miles reduced • 5,942 metric tons of greenhouse gases avoided (currently only CO2 is quantified)
The Program Outcomes include:
• 109,488 total members (17% increase over previous year) • 12,187 new rideshare members • 5,340 new transit members • 41 vanpools in operation • 4,169 total employers/partners • 9,757 total guaranteed ride home participants • 898 program partner meetings to provide technical assistance • 467 transportation day events hosted • 23 new portals launched • Emergency Response Support Provided:
o 2 roadway construction events o 1 transit construction event o 3 weather events
• 4 seasonal promotions supported • 38,986 website visitors • 670 social media followers • 35,145 social media views

SCAG TDM Strategic Plan TDM Literature Review
18
Oregon Department of Transportation, Transportation Options Program The Oregon Department of Transportation (ODOT) Transportation Options program offers many of the same TDM services as the other programs, including employer and commuter outreach, a statewide rideshare and trip tracking system for commuters called Drive Less Connect, and marketing and communications. The Transportation Options program recently developed a new program evaluation methodology, which will include an annual survey of program participants. The Oregon DOT has also just released an RFP for a new rideshare/TDM/trip tracking system to replace the Drive Less Connect system, and as such, program participant data tracking will be enhanced. Oregon DOT has acknowledged that access to jobs, goods, and services is a key goal, and established three statewide TDM performance measures for their statewide TDM Program, Transportation Options.33
• Number of transportation options staff per capita: Tracking the number of staff per capita is a useful measure given the importance of transportation options staff to conduct outreach, deliver information, and manage programs.
• Motor vehicle miles traveled (VMT) per capita: As VMT per capita declines, more people are able to use the transportation system and system reliability is improved for freight. VMT can also be translated into environmental measures, such as carbon dioxide emissions or air pollutants and may inform future travel time measures.
• Percent of trips that use a mode other than driving alone during the peak hour: Tracking mode share during the peak hour documents congestion and system efficiency benefits.
Results reported in their 2018 Annual Snapshot are listed below:
• Program Participation is “TBD” until the local Transportation Options providers produce their first quarter progress report.
• 18% of respondents statewide reported that they drive alone less because of TO programs
• Respondents reporting driving alone less often were most commonly participants in Drive Less Connect, Valley VanPool, and the Bike More Challenge
• 7% of Drive Less Connect participants joined a carpool or vanpool
Washington, D.C. Commuter Connections Program The Washington, D.C. Commuter Connections program offers many TDM services, which it calls “Transportation Emissions Reduction Measures” or TERMs. Commuter Connections has conducted extensive TDM evaluation and been on the leading front of the development of new/refined methodologies for monitoring, evaluating, and quantifying the impacts of its TERMs (TDM services) since 1997, and uses a combination of evaluation methodologies to report total program results in terms of Trip, VMT, and emissions reductions. Other impacts are also quantified, based on VMT reductions. 33 ODOT, Oregon Transportation Options Program 2018 Annual Snapshot, Accessed December 2018.

SCAG TDM Strategic Plan TDM Literature Review
19
The Commuter Connections program registers commuters and other individuals in their multi-modal/trip tracking system and other tracking databases, and then conducts program participant surveys based on the individual services for which they registered (e.g., GRH participant survey, telework participant survey, etc.). The program participant surveys assess whether/how the individual changed their commute habits after registering and receiving services. They also conduct a retention survey to determine the length of time that participants remain using sustainable commutes as influenced by the program. The Commuter Connections program also maintains a region-wide database of employers/partners and tracks the individual transportation programs offered. They conduct employee commute surveys and the EPA Commuter Model to quantify the likely change in employee/student/individual commuting behavior based on the individual transportation program offered. Washington, D.C.’s Performance Metrics Monitoring and Evaluating the Effectiveness of TDM Activities
TDM Systems, Rideshare Matching Systems
▪ Number of commuters participating in ‘Pool Rewards’ ▪ Number of GRH applicants ▪ Number of one-time exception users ▪ Percentage of GRH participants who take a GRH trip ▪ Mode Utilization: number of commuters placed into alternative modes, including
carpooling, vanpooling, walking, bicycling, public transportation, or teleworking ▪ Online system placement rate ▪ GRH placement rate ▪ Telework placement rate ▪ Alternative mode use at worksites with commuter assistance programs (placements) ▪ Direct change placement rates from mass marketing (temporary and continued change)
Marketing Promotions Participation in Events
▪ Number of riders participating in Bike to Work ▪ Participants’ frequency of bike commuting before and after the Bike to Work Day event ▪ Number of commuters participating in Car Free Day ▪ Participants’ frequency of alternative mode use before and after Car Free Day ▪ Participants’ frequency of bike commuting before and after the Bike to Work Day event ▪ Number of commuters participating in Car Free Day ▪ Participants’ frequency of alternative mode use before and after Car Free Day ▪ Participants’ frequency of alternative mode use before, during, and after ‘Pool Rewards
Outreach to Employers
▪ Program Awareness: portion of respondents who recognize the program brand and who are aware of their transportation options

SCAG TDM Strategic Plan TDM Literature Review
20
▪ Percentage of regional commuters aware of Commuter Connections programs/services
▪ Percentage of regional commuters who are aware of ad campaign and messages ▪ Number of employers that receive telework assistance from Commuter Connections ▪ Number of employers that implement/expand telework programs after receiving
assistance Outreach to Prospective Program Participants, Employers, Organizations
▪ Number of commuters who receive telework information from Commuter Connections ▪ Number of commuters who begin teleworking after receiving assistance ▪ Number of new teleworkers – home-based and non-home based ▪ Participants’ frequency of alternative mode use before, during, and after ‘Pool
Rewards Support and Outreach to (Existing) Program Participants
▪ Number of employer clients (employers with commuter assistance programs and employers with bicycle programs) – total and new/expanded
▪ Number of employees at client worksites (worksites with commuter assistance programs and bicycle pro-grams) – total and new/expanded
▪ Level/extent of employers’ commuter assistance programs ▪ Number of employers that receive telework assistance from Commuter Connections ▪ Number of employers that implement/expand telework programs after receiving
assistance
Washington, D.C.’s Performance Metrics Monitoring and Evaluating TDM Program Impacts
1. Vehicle trips reduced 2. Vehicle miles of travel (VMT) reduced 3. Emissions reduced: Volatile Organic Compounds (VOC), Oxides of Nitrogen (NOx),
Particulate Matter (PM2.5), and Carbon Dioxide (CO2) and other associated greenhouse gases
4. Energy reduction (fuel saving) 5. Consumer saving (commuting cost saving)
In addition, they measure impacts of their programs through:
Facility Usage for Active Transportation
▪ Program Satisfaction: primarily qualitative measures to assess whether program services are meeting customer needs and expectations
▪ Applicant satisfaction with online service ▪ Satisfaction of GRH users with the service ▪ Employer satisfaction with outreach assistance and services
VMT Reduction: total and per capita, tenant, employee, mode/TDM program
▪ Vehicle trips reduced ▪ Vehicle miles of travel (VMT) reduced
SCAG TDM Strategic Plan TDM Literature Review
21
▪ Emissions reduced: Volatile Organic Compounds (VOC), Oxides of Nitrogen (NOx), Particulate Matter (PM2.5), and Carbon Dioxide (CO2) and other associated greenhouse gases
▪ Energy reduction (fuel saving) ▪ Consumer saving (commuting cost saving)
User Experience in Using Alternative Modes
▪ Attitudes: changes in attitudes and behavior as a direct result of mass marketing campaigns, measured via general population surveys
▪ Percentage of commuters with positive attitudes toward alt modes (e.g., willingness to try)
Commuter Connections also conducts a region-wide general population survey to assess the number of individuals who became aware of and registered for one of the services based on marketing and advertising campaigns. Additional surveys are conducted to assess the number of individuals who changed their commuting habits based on individual promotional events, such as Bike to Work or Car Free Days. The results of the TERMs for FY2015-2017 are reported below:34
34 MWCOG Commuter Connections, Transportation Emission Reduction Measure (TERM) Analysis Report FY 2015-2017, Accessed December 2018.

SCAG TDM Strategic Plan TDM Literature Review
22
The impacts in terms of greenhouse gas reductions are shown below:

SCAG TDM Strategic Plan TDM Literature Review
23

SCAG TDM Strategic Plan TDM Literature Review
24
VII. TDM Strategies This section provides a topical overview of the range of activities and programs that fall under the umbrella of TDM. It focuses on a discussion of existing strategies that have been positively identified as being enacted by at least one agency by introducing each individual strategy and outlining use cases that exist within the list of agencies that were studied; it should be noted that the list is not an exhaustive list of all possible TDM strategies. Each example details the regional level of implementation as well as any outcomes that have been reported upon and links to more information. Of note, there are many examples of strategy implementation with no reported outcomes or results, pointing to the difficulty of measuring success of TDM strategies and heightening the importance of determining ways to do so. This section also includes a brief discussion of more aspirational strategies that agencies are discussing for the future.
Existing Strategies
Encouraging Multimodal Travel
Traveler Information Simply providing users with more information on non-SOV travel, thereby reducing the barriers to actually using non-SOV modes, is in itself a valuable TDM strategy. Many agencies provide traveler information in a variety of forms. Commonly, metropolitan planning organizations (MPOs) or state departments of transportation (State DOTs) will offer multimodal information in a one-stop-shop fashion on a website. Information can also be provided in a searchable database, allowing users to search for relevant options and resources in their area, such as transit schedules, maps, and directories of park-and-ride lots.

SCAG TDM Strategic Plan TDM Literature Review
25
Strategy Level Description Agency Source
Public awareness and encouragement campaigns for multimodal travel
MPO SACOG’s website offers information on all available modes, including “traffic conditions and updates for commuters; information on public transit services, including paratransit services for the elderly and disabled; ridesharing information; and information on commuting by bike.
SACOG SACOG TDM Strategic Plan
Searchable web resources
State NYSDOT presents multimodal information in a searchable database, allowing users to search for relevant options and resources in their area. They also offer maps and directories of park and ride lots.
NYSDOT NYSDOT TransLinks webtool
Trip Planning Traveler information sites can go beyond providing information in lists, maps, and schedules by actually helping to facilitate user-specific trips. Users can access customer-tailored and multi-modal trip recommendations via either web interfaces or mobile apps. Because some travelers may have trouble navigating online resources, some agencies also provide free travel assistance training programs to disabled or elderly customers who are unsure of how and where to find buses and organize transit trips. Agencies can also invest in hub signage to provide information mid-trip while passengers are on-the-go and may not have easy access to online resources. Lastly, agencies can also provide targeted information to key audiences and organizations through pointed consultations on trip planning.
Related to this is the emerging concept of Mobility-as-a-Service (MaaS) or Mobility on Demand (MOD). Definitions vary, but typically MaaS or MOD refers to an on-demand service that provides convenient access to multiple transportation modes or services, resulting in a user-friendly and streamlined experience. MaaS includes the ability to plan and pay for trips utilizing multiple modes and services through a single platform. The platform would include functions such as trip planning based on preferences, a single payment method (possibly subscription-based), modal option comparisons, real-time updates, and customizable features. Collectively, these components of MaaS are intended to provide a value proposition competitive with personal car ownership. The ability to link modes into a near-seamless, single-payment experience can encourage users to shift from using single occupancy vehicles to a mixture of modes (including multi-modal trips as well as a mixture of modal types depending on day, time, trip purpose). The primary benefit of MaaS to the traveler is a reduction in logistical hurdles, complexity, and stress associated with planning and paying for multi-modal trips.

SCAG TDM Strategic Plan TDM Literature Review
26
Strategy Level Description Agency Source
Multi-modal trip planners via webtool
State or City
NYSDOT and Metropolitan Transportation Commission (MTC) provide multimodal trip planning tools that allow travelers to chart possible trips across many modes. These capabilities can exceed those of private services, such as Google Maps, in some cases, by allowing for a mixture of driving/carpooling and public transit, or by showing road blockages, construction, or other filters.
NYSDOT; MTC
511 NY Website; MTC 511 website
Mobile apps for travelers to track trip habits and benefits
State DOT
NYSDOT also created a “Trip Tracker” mobile app that allows travelers to track and share the cost and emissions benefits of their trip choices.
NYSDOT NYSDOT Trip Tracker
Travel assistance to elderly or disabled travelers
Transit Agency
Riverside Transit Agency (RTA) in Riverside, CA provides a free travel assistance training program to disabled or elderly customers who are unsure of how and where to find buses or organize transit trips. The training is provided by instructors over the phone to allow for a personalized experience and to help individuals with their specific needs.
RTA RTA Training Program Website
Visible transit hub signage
City or Region
MTC has a “hub signage program” where major transit hubs are each outfitted with matching sets of readable transit schedule signage and maps.
MTC MTC Hub Signage program website
Consultation with major stakeholders on travel options
City or Region
San Francisco Municipal Transportation Agency (SFMTA) has designated staff responsible to be available for free consultations with external stakeholders – such as employers, neighborhoods, residential buildings, schools, and hospitals – to provide input on possible transportation
SFMTA SFMTA TDM Plan

SCAG TDM Strategic Plan TDM Literature Review
27
options for visitors. SFMTA staff visit stakeholders in person to discuss site-specific options.
Mobile apps for travelers to see possible trip routes and benefits
City or Region
The ConnectSmart program, through the Houston district of Texas Department of Transportation (TxDOT), goal is to leverage a third-party platform, Metropia, which provides a one-stop-shop for all local modes, linking trip information and payment. The app aims to allow users to shop for multi-modal rides in a simple manner, and also serves as a platform for implementing dynamic pricing strategies to manage traffic demand. This pilot further embodies MaaS by creating user-customized features such as suggested routes and targeted deals.
TxDOT Notification of funding award for ConnectSmart
Strategies for Bicycles and Pedestrians
Outreach
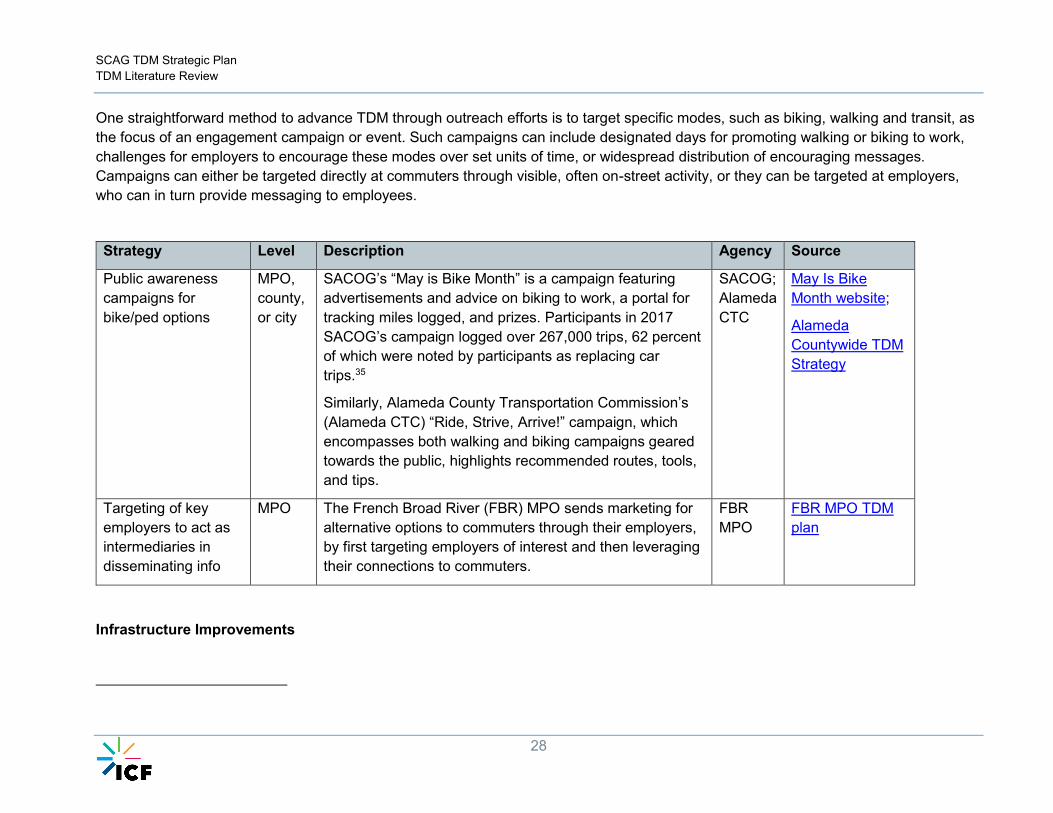
SCAG TDM Strategic Plan TDM Literature Review
28
One straightforward method to advance TDM through outreach efforts is to target specific modes, such as biking, walking and transit, as the focus of an engagement campaign or event. Such campaigns can include designated days for promoting walking or biking to work, challenges for employers to encourage these modes over set units of time, or widespread distribution of encouraging messages. Campaigns can either be targeted directly at commuters through visible, often on-street activity, or they can be targeted at employers, who can in turn provide messaging to employees.
Strategy Level Description Agency Source
Public awareness campaigns for bike/ped options
MPO, county, or city
SACOG’s “May is Bike Month” is a campaign featuring advertisements and advice on biking to work, a portal for tracking miles logged, and prizes. Participants in 2017 SACOG’s campaign logged over 267,000 trips, 62 percent of which were noted by participants as replacing car trips.35
Similarly, Alameda County Transportation Commission’s (Alameda CTC) “Ride, Strive, Arrive!” campaign, which encompasses both walking and biking campaigns geared towards the public, highlights recommended routes, tools, and tips.
SACOG; Alameda CTC
May Is Bike Month website;
Alameda Countywide TDM Strategy
Targeting of key employers to act as intermediaries in disseminating info
MPO The French Broad River (FBR) MPO sends marketing for alternative options to commuters through their employers, by first targeting employers of interest and then leveraging their connections to commuters.
FBR MPO
FBR MPO TDM plan
Infrastructure Improvements

SCAG TDM Strategic Plan TDM Literature Review
29
Any improvements in the infrastructure, information, or equipment availability for biking or walking can help increase its mode share and advance TDM goals. These efforts can involve working with property owners or local governments. Biking infrastructure can include bike lanes, parking stations, or lockers. Even in cases where such infrastructure already exists, certain improvements can still add value, such as widening and more clearly striping bike lanes.
Strategy Level Description and Examples Agency Source
Reduction of bike parking facility costs via joint-purchase agreements
MPO Boston’s Metropolitan Area Planning Council (MAPC) facilitates a joint-purchasing program for bike parking equipment, thereby offering discounted rates to buyers and typically reducing costs by 20-40 percent. All city and town governments are eligible under the program.
MAPC MAPC Regional Bike Parking website
Directly funded bike lockers at park-and-ride lots and transit stations
State or MPO
The Virginia Department of Transportation (VDOT) has funded over 160 bicycle locker installations at park-and-ride lots around the state, allowing cyclists to purchase year-long access for a set price of approximately $60 per year.
VDOT Northern Virginia TDM Study
Added bike lanes, or improvements to existing ones
City SFMTA has several projects underway to improve bike accessibility and safety through infrastructure changes. Some examples include swapping bike lane space with parking spaces to create a buffer for cyclists, adding lighting to crosswalks, removing parking spaces for improved visibility, painting bike lanes green, giving cyclists a head start at some signals, and expanding bike parking spaces.
SFMTA SFMTA Bike Vision and Program website

SCAG TDM Strategic Plan TDM Literature Review
30
Bikeshare and Scooter Share Systems Other agencies develop and manage their own bikesharing systems to encourage biking. Historically, these have been docked bikeshare systems, in which users can pick up and drop off bikes only at set stations throughout the program area. However, with the advent of cheap tracking technology and mobile apps, newer dockless systems of bikes and scooters are proliferating quickly in the private sector and are being pushed by some public agencies. Dockless systems have the advantage of flexibility in trip-making, but also pose challenges related to user error and rebalancing vehicles. For both docked and dockless systems, it is valuable for agencies/providers to provide station and/or vehicle location data via an application programming interface (API) to trip aggregators and planning apps, so users can most easily identify available vehicles. Some cities and companies are also introducing e-assist vehicles (both bikes and scooters), which provide some power when going uphill and allow easy cruising speed on scooters.
Strategy Level Description Agency Source
City-wide bikeshare marketplaces
City Seattle has created an open contract where multiple private bikeshare providers can enter into agreement with the city and provide dockless services, on the condition that they share data with the city and meet certain standards of service and regulations. Nearly 3,000 rides per day were ordered during the pilot phase of the project, which has since been extended.
City of Seattle
Seattle Bikeshare Evaluation Report
Docked or “dock optional” bikeshare systems
City The City of Santa Monica has 500 bikes at roughly 80 stations, with each bike being trackable through GPS technology, with locations available via API. Santa Monica’s system is “dock optional,” providing docks to make bike location easy, while allowing for bikes to be locked and trips ended outside of docks as well.
The City has also allowed for the use of completely dock-less bikeshare and shared scooter options.
City of Santa Monica
Santa Monica Bikeshare website

SCAG TDM Strategic Plan TDM Literature Review
31
Scooter sharing systems
City The cities of Long Beach, Santa Monica, and Washington, DC are running pilots of scooter sharing systems. These pilots limit the number of scooters available on city streets and require data sharing with agencies to help with program evaluation. Washington, DC has announced that the pilot program will be converted to a permanent program in 2019.
Cities of Santa Monica, Long Beach, Washington, DC
Santa Monica scooter pilot
Use of public-private partnerships for bikeshare funding
MPO MAPC “serves as the regional coordinator for the Blue Bikes bike share system (formerly known as Hubway Bikes), negotiating and overseeing a regional agreement” between Motivate, the bikeshare operator, and the four municipalities with stations.36 The Blue Bikes system has over 190 stations with a planned expansion in the near future.
MAPC
Parking Policy Parking can be an important lever for TDM programs. Managing demand for parking can encourage people to seek out other modes of transportation aside from driving.
Strategy Level Description and Examples Agency Source
Offer of a cash payment instead of a subsidized parking space for employees (“parking cash-out”)
City/State Many employers offer employees subsidized or free parking. Employers can offer the option of taking a cash payment instead of the parking space, thereby encouraging carpooling or the use of alternative modes. The California Air Resource Board has passed a law requiring employers with 50 or more employees to offer
State of CA
Overview of California’s Parking Cash Out Law
36 MAPC. Transportation. Accessed November 2018.
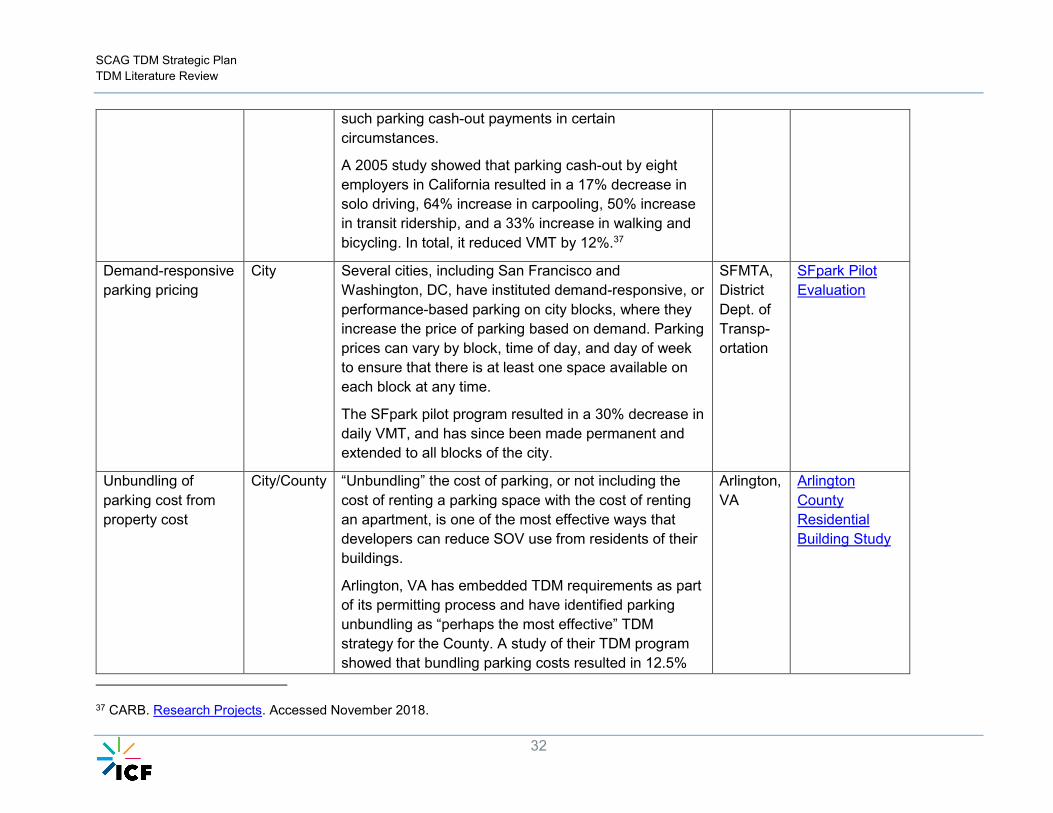
SCAG TDM Strategic Plan TDM Literature Review
32
such parking cash-out payments in certain circumstances.
A 2005 study showed that parking cash-out by eight employers in California resulted in a 17% decrease in solo driving, 64% increase in carpooling, 50% increase in transit ridership, and a 33% increase in walking and bicycling. In total, it reduced VMT by 12%.37
Demand-responsive parking pricing
City Several cities, including San Francisco and Washington, DC, have instituted demand-responsive, or performance-based parking on city blocks, where they increase the price of parking based on demand. Parking prices can vary by block, time of day, and day of week to ensure that there is at least one space available on each block at any time.
The SFpark pilot program resulted in a 30% decrease in daily VMT, and has since been made permanent and extended to all blocks of the city.
SFMTA, District Dept. of Transp-ortation
SFpark Pilot Evaluation
Unbundling of parking cost from property cost
City/County “Unbundling” the cost of parking, or not including the cost of renting a parking space with the cost of renting an apartment, is one of the most effective ways that developers can reduce SOV use from residents of their buildings.
Arlington, VA has embedded TDM requirements as part of its permitting process and have identified parking unbundling as “perhaps the most effective” TDM strategy for the County. A study of their TDM program showed that bundling parking costs resulted in 12.5%
Arlington, VA
Arlington County Residential Building Study
37 CARB. Research Projects. Accessed November 2018.

SCAG TDM Strategic Plan TDM Literature Review
33
more SOV-driving for commutes, and 40% more SOV-driving for non-commute trips.
Preferred parking for carpools/carshare
City Some cities, transit agencies and employers create preferred parking spots for carpools/vanpools and carshare vehicles.
Portland, OR; Washington, DC; and Pittsburgh, PA are some of the growing number of cities that allocate on-street parking spaces to carsharing agencies. Each city uses a different business model: DC auctions its spots to carshare companies, while Portland designates spots based on demand, which companies can apply for at no cost.38 Similarly, parking spots can be designated for carpools or vanpools. In the Bay Area, San Francisco and Oakland offer discounted parking passes for street parking to vanpools.39 and BART is offering guaranteed parking spots at 12 transit park-and-ride lots to those who carpool using the Scoop carpooling app.40
Various SFTMA Vanpool Parking Permits
Limiting of Parking Supply
City Eliminating parking minimums in new development can also incentivize the use of public transit, walking and biking. Cincinnati, Buffalo, and Santa Monica have eliminated parking minimums from their developer requirements.
Various Buffalo Green Code Unified Development Ordinance
38 FHWA. Contemporary Approaches to Parking Pricing: A Primer. Accessed November 2018. 39 511 SF Bay. Discounted Parking Permits. Accessed November 2018. 40 BART. Scoop to BART Carpool Program. Accessed December 2018.

SCAG TDM Strategic Plan TDM Literature Review
34
Commute Reduction Programs
Ridematching for Carpools/Vanpools One of the most common TDM strategies is to help facilitate carpooling or vanpooling by providing ride-matching tools to commuters who might otherwise struggle to identify a viable carpool partner. Typically programs allow travelers to enter information about their commutes into a system, which can then provide users with recommendations on potential carpool/vanpool partners with similar commute geographies and schedules. Beyond facilitating carpooling/vanpooling, some organizations have implemented financial incentives for commuters who start a new carpool or vanpool. Subsidies can also be offered by employers, either voluntarily or in compliance with local requirements.
Strategy Level Description and Examples Agency Source
Facilitation of carpooling or vanpooling by providing ride-matching tools to commuters
State or MPO
Typically, as is the case in the NYSDOT ridesharing program, it is incumbent upon the riders to negotiate the details of payment, who is driving, and the exact times of pickup. Some agencies provide additional details in these systems: for example, MTC also offers a carpool benefits calculator, which allows users to see cost and emissions savings from carpooling.
Recently, “dynamic carpooling” apps have been developed that help travelers connect on a per-trip basis, eliminating some of the barriers to carpool commuting such as the need for a regular schedule.
NYSDOT, Washington State DOT (WSDOT), SACOG, the Atlanta Regional Commission (ARC), MTC, and FRB MPO
NYSDOT rideshare
Incentive programs to subsidize newly-formed vanpools.
MPO As a part of SACOG’s Vanpool Incentive Program, for each qualifying vanpool, the MPO provides $300/month for six consecutive months, and stipulates that the savings must be passed on to the vanpool members. The incentives are offered on a first-come, first-served basis to any vanpool
SACOG SACOG Three-Party Vanpool Incentive Program Agreement

SCAG TDM Strategic Plan TDM Literature Review
35
meeting the requirements that has signed agreements with SACOG and an authorized vanpool vendor.
The program creates 10-15 new vanpools each year.41 While overall impacts are estimated to be small compared to larger programs, SACOG can receive a clear picture of VMT reduction from each vanpool.
Incentive programs to subsidize newly-formed carpools.
MPO The Metropolitan Washington Council of Governments (MWCOG), the MPO for the Washington, D.C. area, has a Pool Rewards program which offers financial incentives to commuters for forming a new carpool or joining an existing one for the first time. Commuters can earn $1 in each direction per day, for each day of carpooling in a 90-day period, for a maximum of $130.
The majority of participants (93%) continued carpooling after their incentives expired, and even in the longer term or multiple years, 65% of participants were still using an alternative mode.42
MWCOG MWCOG Press Release: Pool Rewards Commuters Earn Cash for Carpooling
Requirements for large employers to provide commuter benefits for alternative modes
MPO or air quality districts
MTC and the Bay Area Air Quality Management District (BAAQMD) require employers with 50+ employees to offer one of four commuter benefit options: pre-tax benefit, subsidy of transit costs, transit provided to employees directly, or an alternate solution deemed equally or more effective in reducing SOV travel as the other three options.
MTC Bay Area Commuter Benefits Program flyer
41 SACOG. Proposal for Next Generation TDM Program. Accessed November 2018. 42 Metropolitan Washington Council of Governments. Transportation Emission Reduction Measure Analysis Report. November 2014.

SCAG TDM Strategic Plan TDM Literature Review
36
Guaranteed Ride Home Organizations provide guaranteed ride home (GRH) programs (sometimes referred to as Guaranteed Return Trip) to ensure that the implications from missed connections of a transit or carpool commute are mitigated, and that commuters on these modes have a form of insurance for their travel. Unseen life events, such as medical needs, issues with kids or family, etc., can also pose a challenge to those who choose to travel by carpool, vanpool or transit and may be forced to miss their scheduled ride home. Under a typical GRH program, commuters receive either up-front payment or reimbursement for substitutes, such as taxis or transportation network companies (TNCs) if an emergency arises and they are unable to travel by their typical mode. GRH programs are administered by a range of different authorities, such as cities, states, counties, MPOs, and Transportation Management Associations (TMAs).
Strategy Level Description Agency Source
GRH programs maintained within ridematching programs
State or MPO
NYSDOT and ARC43 maintain GRH offerings as part of their ridematching programs: when users register in the matching system, they can also apply to be covered under the GRH program, allowing them to be reimbursed for their trip cost withmore expensive mode replacements (typically for-hire vehicles).
NYSDOT; ARC
NYSDOT 511 site; ARC Inventory Report
Partnerships with employers to offer GRH
County or City
In addition to offering reimbursements directly to travelers, LA Metro partners with employers, who then help to fulfill employee GRH claims, thereby streamlining the reimbursement process.
LA Metro LA Metro GRH Program Handbook
GRH programs funded through TMAs
MPO and TMA
SACOG provides funding to Transportation Management Associations (TMAs) which allows them to implement GRH programs. The programs are administered by the individual TMAs, which have the advantage of working more closely with local employers.
SACOG, TMAs
SACOG TDM Strategic Plan
43 ARC. Regional TDM Inventory Baseline Report. December 28, 2012

SCAG TDM Strategic Plan TDM Literature Review
37
Telework Teleworking offers one of the most concrete and effective means to reduce total trips, and can be especially impactful on a system if targeted at SOV commuters. Many agencies try to encourage teleworking through advisories, campaigns, and financial assistance to either employers or commuters. State agencies also work to allow telework for their own employees.
Strategy Level Description Agency Source
Resources to help businesses start or expand telework programs
State DOT VDOT and Maryland DOT provide online resources including telework examples, components, benefits, and technical strategies.
The telework assistance programs have reached a combined 46,000 commuters between 2014 and 2017, well exceeding the program goals, and have been attributed to a reduction of over 15,000 daily vehicle trips and 125,000 daily VMT.44
VDOT and MDOT
Commuter Connections TERM Report FY 2015-2017
Technical help in setting up teleworking systems
State DOT VDOT offers technical assistance training to new teleworkers on how to setup at-home office equipment and improve connectivity between offices and homes.
VDOT Northern Virginia TDM Study
Requirement of state government offices to allow telework
State government
The State of Maryland provides telework allowance and assistance to state employees. All state agencies are expected to allow 15% of eligible employees to telework.
MDOT Maryland Teleworking website
44 Metropolitan Washington Council of Governments. Transportation Emission Reduction Measure Analysis Report FY 2015-2017. November 2017.

SCAG TDM Strategic Plan TDM Literature Review
38
Flex-Time and Staggered Work Schedules Shifting travel times to off-peak hours does not reduce overall trip-making, but it can reduce congestion on roads and overcrowding on transit, which can improve system efficiency and traveler experience on alternative modes, both of which are often seen as goals of TDM practitioners. Commuters can be encouraged to travel at off-peak times either through time-sensitive road pricing, mobile app gamification, or rewards programs where commuters can earn points for changing behavior. Compressed work schedules, such as nine days over two weeks or four, 10-hour days in one week are flexible work schedules that could reduce overall trip-making.
Strategy Level Description Agency Source
Create a rewards program to earn redeemable points for shifting commutes
City, County, or Transit agency
San Francisco County Transportation Authority (SFCTA) and BART teamed up to create a rewards program in which commuters earn redeemable points in exchange for using BART at off-peak times. The program completed its test phase in mid-2018 with approximately 18,000 participants, and it is currently being evaluated for expansion.
SFCTA reported a sustained change in commute times; 10% of commutes shifted to off-peak depending on commute length.
SFCTA and BART
SFCTA Lessons From Perks Report
Transit Improvements Improvements to the reach, accessibility, usability, and pricing of transit can all work towards boosting its appeal; these improvements themselves function as a TDM strategy by encouraging transit use.
First-Mile/Last-Mile Access In addition to building more transit, many agencies are focusing on first-last mile connectivity and in reducing the barriers to access transit. First-last mile connectivity has been a longstanding barrier to public transit reach and usage, but several agencies are developing new and innovative means to improve transit access, and streamlining these strategies into long-term plans. Public agencies can also help their constituents achieve first-last mile connections by providing specific services, such as connecting shuttles or bikeshare. Cities can also encourage the first-last mile connecting modes through policies that encourage their use and allow them to use valuable street and parking space.

SCAG TDM Strategic Plan TDM Literature Review
39
Strategy Level Description Agency Source
Multi-strategy plans for first-last mile connectivity within a region
County or MPO
Los Angeles County Metropolitan Transportation Authority (“LA Metro”) commissioned a First Last Mile Strategic Plan to help coordinate efforts and provide resources for all the various organizations in the region. The plan focuses on bike/ped improvements near transit hubs, such as easier wayfinding signage, bike lanes, and better-marked crosswalks. The plan also includes connections to vehicles, such as bus lanes and bus pull-out areas.
LA Metro
LA Metro First Last Mile Strategic Plan
Targeted shuttle services to connect to high-capacity transit routes
City, transit agency
The West Berkeley Shuttle is a free shuttle service provided to employees across West Berkeley, and is designed to act as a last-mile connection to a BART station. The shuttle is funded and overseen by the West Berkeley TMA, which consists of local business representatives.
City of West Berkeley
West Berkeley Shuttle website
Access for private shuttles to space designated for bus pickups
City SFMTA allows for qualifying private shuttles to use 125 designated Muni bus stops in exchange for a fee and the provision of data to SFMTA. 45
Program evaluations found that shuttle operator behavior improved and minimized shuttle impacts on the rest of the network.46
SFMTA MTC CIP Summary Evaluation Report
45 MTC. Cities Initiatives Program: Evaluation Summary Report. July 2015. 46 SFMTA. Commuter Shuttle Program. Accessed November 2018.

SCAG TDM Strategic Plan TDM Literature Review
40
Payment Integration Multi-service payment synchronization is a classic example of a strategy designed to boost the appeal of multimodal services and public transit. By creating linkages between various services, travelers can more easily chart multimodal routes, and the effective reach and appeal of any individual mode increases.
Strategy Level Description Agency Source
Development of single payment systems for all public transit services in a region
MPO, City, or County
MTC has a single Clipper Card, which can be used for 17 different operators throughout the Bay Area. There are plans to expand Clipper’s coverage, improve transaction speeds, and improve user experience by making it easier to manage payments in a user’s account.
MTC MTC Clipper website
Integrated payment across public and private services
MPO, City, or County
LA Metro’s TAP card plays a similar role in the SCAG region, and is in the process of transitioning to a hybrid card-based/account-based payment system which will allow payment integration with various private modes by providing TAP card data via API.
LA Metro
Metro Magazine Press Release

SCAG TDM Strategic Plan TDM Literature Review
41
Transit Passes and Discounts Transit use can also be encouraged via free or discounted transit passes for certain populations, such as students or city employees. Other cities have sought to provide subsidies according to income level, thereby addressing both equity goals and TDM goals.
Strategy Level Description Agency Source
Free passes for students
Transit agency
RTA’s student U-Pass and Go-Pass programs allow students at seven participating universities to use their student IDs or pre-registered mobile passes to board buses for free.
RTA U-Pass and Go-Pass program website
Free passes for city employees
Transit agency
RTA also allows all city employees to travel for free on certain transit lines as part of a “City Pass” program.
RTA City Pass website
Discounts for low-income riders
Transit agency
Muni and SFMTA partner for a “LifeLine Pass,” which provides a 50% discount on monthly bus passes to qualifying low-income riders.
SFMTA and Muni
LifeLine Pass website
Free passes for residents of Transit Oriented Development (TOD) units
Transit agency
The MacArthur Transit Village includes a 90 unit affordable housing community, where residents receive monthly transit passes to encourage ridership.
BART Transit-Oriented Development (TOD)- MacArthur website

SCAG TDM Strategic Plan TDM Literature Review
42
System and Service Improvements Improving transit service quality and headways can also spur mode shift to more sustainable choices. Efforts to improve quality can include provision of accurate real-time estimates or adherence to an available and consistent schedule. This schedule and real-time accuracy is valuable for transit travelers, but especially so for those that are trying to manage multi-modal travel that requires making connections. To enhance reliability, agencies can aim to reduce headways or implement transit signal priority. Service quality can also include measures to increase passenger comfort or productivity, such as by providing Wi-Fi, USB chargers, or enhanced lighting at stations. Collectively, these strategies are expected to improve travel times and customer experience.
Strategy Level Description Agency Source
Leveraging of private sector analytics platforms to improve real-time arrival estimates and data capability
Transit agency
Boston’s MBTA has partnered with Swiftly to provide real-time arrival information for its subway and bus system. The partnership also allows the real-time data to be available in an easily sharable format for other developers. The MBTA’s real-time predictions improved in accuracy from 76% to 84%.
MBTA MBTA “Better bus predictions” Medium post
Amenities included on transit
Transit Agency
RTA RapidLink buses provide Wi-Fi and USB chargers.47 RTA RapidLink website
Improvement of transit headways
City or transit agency
The Alameda CTC is currently constructing a bus-rapid-transit (BRT) service that will feature dedicated lanes, transit signal priority, and extra lighting over stations.
Alameda CTC
East Bay BRT Overview
47 RTA. Rapid Link. Accessed November 2018.
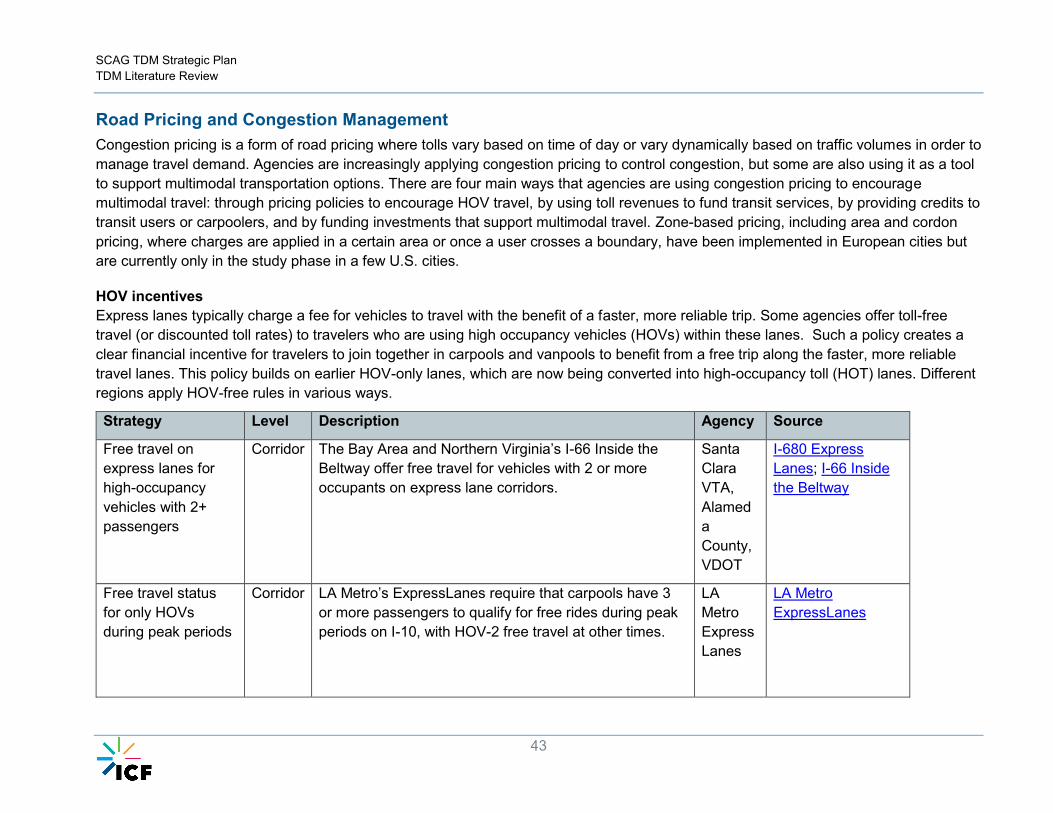
SCAG TDM Strategic Plan TDM Literature Review
43
Road Pricing and Congestion Management Congestion pricing is a form of road pricing where tolls vary based on time of day or vary dynamically based on traffic volumes in order to manage travel demand. Agencies are increasingly applying congestion pricing to control congestion, but some are also using it as a tool to support multimodal transportation options. There are four main ways that agencies are using congestion pricing to encourage multimodal travel: through pricing policies to encourage HOV travel, by using toll revenues to fund transit services, by providing credits to transit users or carpoolers, and by funding investments that support multimodal travel. Zone-based pricing, including area and cordon pricing, where charges are applied in a certain area or once a user crosses a boundary, have been implemented in European cities but are currently only in the study phase in a few U.S. cities.
HOV incentives Express lanes typically charge a fee for vehicles to travel with the benefit of a faster, more reliable trip. Some agencies offer toll-free travel (or discounted toll rates) to travelers who are using high occupancy vehicles (HOVs) within these lanes. Such a policy creates a clear financial incentive for travelers to join together in carpools and vanpools to benefit from a free trip along the faster, more reliable travel lanes. This policy builds on earlier HOV-only lanes, which are now being converted into high-occupancy toll (HOT) lanes. Different regions apply HOV-free rules in various ways.
Strategy Level Description Agency Source
Free travel on express lanes for high-occupancy vehicles with 2+ passengers
Corridor The Bay Area and Northern Virginia’s I-66 Inside the Beltway offer free travel for vehicles with 2 or more occupants on express lane corridors.
Santa Clara VTA, Alameda County, VDOT
I-680 Express Lanes; I-66 Inside the Beltway
Free travel status for only HOVs during peak periods
Corridor LA Metro’s ExpressLanes require that carpools have 3 or more passengers to qualify for free rides during peak periods on I-10, with HOV-2 free travel at other times.
LA Metro ExpressLanes
LA Metro ExpressLanes

SCAG TDM Strategic Plan TDM Literature Review
44
HOV-only status on express lanes
Corridor LA Metro ExpressLanes go into HOV-only status when travel speeds reduce below 45 mph; at these times, no SOVs are allowed to enter the lanes.
LA Metro ExpressLanes
LA Metro FY2017 Performance Report
Gift card drawings for HOV users
Corridor LA Metro also enters HOV-2 and HOV-3 users in a monthly gift card drawing. Through FY2017, the program gave out $33,000 in gift cards. Overall, approximately 53% of ExpressLanes users are in carpools.
LA Metro
LA Metro FY2017 Performance Report
Credits for Shifting Travel Times or Modes Agencies also offer toll credits to encourage travelers to take transit rather than drive in express lanes.
Strategy Level Description Agency Source
Toll credits for using transit
Corridor LA Metro offers travelers a $5 toll credit for every 16 one-way express bus trips on the I-10 and I-110 corridors. 578,000 qualifying transit trips had been taken through FY2017, resulting in $126,549 toll credits issued. Silver Line ridership on the ExpressLanes has increased by 6% since the opening of the ExpressLanes.
LA Metro
LA Metro FY2017 Performance Report
Toll credits for shifting travel time
Corridor Georgia’s State Road and Tollway Authority (SRTA) ran a pilot program called Commuter Credits where they offered heavy express lane users a $3 toll credit per week if they did not travel in the express lanes during peak period for 2 days in that week. Out of 34 users who signed up, 80% said they signed up to save money, and 44% saw a reduced commute time due to traveling off-peak. The program paid out $1,446 in toll credits.
SRTA Georgia’s Commuter Credits Pilot Program

SCAG TDM Strategic Plan TDM Literature Review
45
Funding Transit Service or Multimodal Improvements Another approach to improving multimodal travel options involves use of toll revenues to directly support transit services. A few agencies are pioneering the use of multimodal grants, whereby toll revenues are invested in capital projects that support multimodal travel.
Strategy Level Description Agency Source
Use of toll revenues to fund transit services
Corridor Alameda County’s I-680 Express Lanes fund bus service as part of the operating expenses of the toll lanes, as do Express Lanes in Minneapolis, Miami, and Atlanta. Tolls on I-35W in Minneapolis provided $3.8 million of funding for transit services between 2011 and 2017.
Alameda CTC, Minnesota DOT, Florida DOT, SRTA
MnPass Express Lane Financial Report
Use of toll revenues to fund grants to support multimodal travel
Corridor Toll revenues are used to fund competitive grant programs for multimodal improvements within the toll corridor.
LA Metro’s Net Toll Reinvestment Grant Program has funded 43 projects to the tune of approximately $49 million using congestion pricing revenues from I-10 and I-110. These projects included a bike hub in Union Station, clean fuel buses, improved transit service, a dedicated bus to Dodger Stadium, and various bicycle and pedestrian improvements throughout the corridor.
LA Metro, VDOT
ExpressLanes Net Toll Reinvestment Grant Program

SCAG TDM Strategic Plan TDM Literature Review
46
Future Strategies There are several strategies that have been considered by agencies, but go beyond what any U.S. local government agency currently implements. To varying degrees, all of these future strategies are buoyed by emerging technologies, like the increasing ubiquity of smartphones or the advent of automated vehicles. Technology could also be involved in creating entirely new TDM strategies, such as the ongoing experiments with dock-less bikes and scooters. As new long-distance travel modes such as Hyperloop and high-speed rail are considered in the U.S., TDM strategies will likely play a role in creating connections to and from these potential stations as well.
In a perspective paper on futuristic, long-term strategies to reduce emissions in the Bay Area, MTC considered the following strategies:48
1. Multi-Service Trip Planner and Transportation Wallet (Mobility as a Service), featuring a trip planner and integrated payment covering all modes, thereby synthesizing all available options into one cohesive experience. This strategy builds upon existing efforts, such as the Whim service offered in Helsinki, Finland.
2. Free Feeder Services to High-Capacity Transit, using automated vehicles. These shuttles would have flexible routing, and allow for easier first/last mile access to key transit routes. Similar first/last mile shuttle programs exist today, but not with a fully automated system, and not free to riders.
3. Ridesharing and Teleworking, implemented with high incentives, such as tax credits for telework-allowing employers, reimbursements for telework-enabling hardware, and road pricing directly tailored to vehicle occupancy levels. In the context of shared-automated vehicles, road pricing could be implemented based upon the number of riders in the same vehicle at a given moment.
4. Tolling All Highways and Bridges, in accordance with real-time conditions and with varying fees depending on occupancy. MTC’s hypothetical strategy would involve a universal tolling system that was demand-responsive and reflective of vehicle occupancy rates. This builds on the extant concepts of HOV lanes and dynamic tolls by making them more adjustable and widespread.
5. Cordon Pricing, around downtown areas will charge vehicles to enter the central business districts. This has been implemented in London, Singapore, and Stockholm, but has yet to be tried in the U.S.
6. Parking Tax, applied dynamically according to demand and including both garages and lots. Several cities, including San Francisco, already have local taxes on major parking facilities. This strategy would expand the parking tax beyond the city to the broader Bay Area, and also impose new, on-street parking taxes to prevent a price discrepancy that could encourage more circling around the block for parking.
48 MTC. Toward A Shared Future: Strategies to Manage Travel Demand. September 2018.

SCAG TDM Strategic Plan TDM Literature Review
47
7. Vehicle Trip Reduction Requirements on Development, requiring developers to implement strategies to reduce SOV trips by requiring mode split. Development requirements of various kinds are already common, but requiring a precise modal split of residents is a stronger mechanism than alternatives, such as requirements to create a TDM plan or offer bike infrastructure.
8. Parcel Lockers and Freight Consolidation Centers, incentivized through guidance, incentives for property owners (parcel lockers), and requirements for developers. Parcel lockers have been heralded as a mechanism for streamlining urban deliveries, but a wide-spread application remains to be tested.
Other examples of forward-thinking strategies can be found in LA Metro’s First Last Mile Strategic Plan, which includes several strategies pertaining to transit connectivity and multi-modalism. The plan includes a recommendation for creating “green zones” immediately adjacent to transit stations. These zones would be reserved for access by clean modes, such as shared rides, vanpools, car share parking, buses, or pickup/dropoff of electric vehicles.49
9. 10. Figure 1. A “Green Zone” concept created by LA Metro. Source: First Last Mile Strategic Plan
LA Metro’s plan also includes creation of “rolling lanes,” which are essentially wider bike lanes that allow for a mixture of active transportation modes and speeds (includes scooters). The array of active transportation vehicles continues to grow, with a mixture of electric, e-assist, and manual power backing scooters, bikes, skateboards, and more. The debate over how to best allocate and designate road space for this increasingly broad range of devices is not yet settled. However, the designation of lanes that are meant to encompass these types of vehicles, not just bikes—as is the case in LA Metro’s “rolling lanes”—might help to encourage innovation in active transportation services.
49 LA County Metropolitan Transportation Authority First Last Mile Strategic Plan

SCAG TDM Strategic Plan TDM Literature Review
48
VIII. Summary of Strategies Error! Reference source not found. lists all of the distinct strategies employed by the agencies investigated as part of this literature review. In many cases, multiple agencies used the same, or similar, TDM strategies. In these cases, multiple agencies are noted in the table. Table 1. List of Strategies Identified Among Reviewed Agencies
Topic Area Strategy Example Agencies Level of
Implementation Source(s)
Bik
e /
Ped
estr
ian
imp
rove
men
ts
Additional bike parking and infrastructure SACOG MPO or City SACOG, 2016 Final
TDM Strategic Plan
Reduce bike parking equipment costs with a
collective purchasing program MAPC MPO
MAPC Bike Parking
program website
Operate a public (docked) bikesharing
program
MAPC, City of Santa
Monica MPO or City
MAPC Hubway
program site
Create bike lockers at park-and-ride facilities
(can be purchased for an annual pass) VDOT State DOT
Northern Virginia TDM
study
Start a program to provide assistance to
localities and citizens in creating safe walking
and biking routes to schools
VDOT, Alameda CTC State DOT or TMA VDOT Safe Routes to
School website
Create additional bike lanes SFMTA, City of Santa
Monica
Local/city
government
SFMTA Bike Program
website; Santa Monica
Bike Action Plan

SCAG TDM Strategic Plan TDM Literature Review
49
Topic Area Strategy Example Agencies Level of
Implementation Source(s)
Emp
loye
r-b
ased
Mandate allowance of alternative hours
and/or teleworking for government
employees
Georgia Governor’s
office (executive
order)
State Governor ARC TDM Inventory
Provide assistance to employers interested in
starting a telework program VDOT State DOT
Northern Virginia TDM
study
Create an “Employer Solutions Team” to help
employers find commuting solutions in
response to large-scale construction projects
VDOT State DOT Northern Virginia TDM
study
Create a rewards program for employers who
have voluntarily implemented impactful TDM
strategies
MWCOG MPO MWCOG Commuter
Connections website
Lan
d-U
se/
Dev
elo
pm
ent
Create a citywide ordinance mandating TDM
measures for certain developments City of Los Angeles Local government
City of Los Angeles
TDM ordinance
presentation
Create an on-street shared-vehicle parking
permit program SFMTA
Local/city
government
SFMTA On-Street
Shared Vehicle Parking
Permit Program
website
Creation of city-wide TDM ordinances for
developers, mandating issuance of TDM
plans and/or meeting TDM-related
requirements
San Francisco,
Cambridge, Pasadena
Local/city
government
Cambridge Parking and
TDM Ordinance
website

SCAG TDM Strategic Plan TDM Literature Review
50
Topic Area Strategy Example Agencies Level of
Implementation Source(s)
Oth
er
Award competitive grants to local
governments and NGOs for making plans
supporting TOD and TDM principles
ARC (Livable Centers
Initiative) MPO ARC TDM Inventory
Value TDM in the distribution of CMAQ funds Tennessee DOT State DOT TnDOT Statewide TDM
Plan
Implement demand-based parking pricing via
electronic meters SFMTA, MAPC MPO
SFMTA Demand-
Responsive parking
website; MAPC Parking
Management Planning
flyer
Rid
esh
arin
g, c
arp
oo
ling,
an
d v
anp
oo
ling
Ridematching assistance services
(vanpool/carpool)
SACOG, NYSDOT,
MTC, ARC, FRB MPO,
WSDOT, MWCOG
MPO or State SACOG, 2016 Final
TDM Strategic Plan
Guaranteed Ride Home (GRH) programs
NYSDOT, ARC,
Alameda CTC,
MWCOG, SACOG
State, MPO or TMA NYSDOT GRH Program
website
Provide temporary financial assistance to
vanpools starting up or struggling with
waning ridership
VDOT State DOT Fairfax County Van
Start Van Save website
Provide financial rewards to for starting a
new carpool to work MWCOG MPO
MWCOG Commuter
Connections website

SCAG TDM Strategic Plan TDM Literature Review
51
Topic Area Strategy Example Agencies Level of
Implementation Source(s)
Pri
cin
g
Restricting roadway and transit capacity
expansion funding to key corridors ARC (RSTS funding) MPO ARC TDM Inventory
HOV express lanes MTC, WSDOT, VDOT MPO or State Bay Area Express Lanes
Tolled, managed lanes VDOT State Northern Virginia TDM
study
Fund direct access ramps for HOV lanes on
major freeways WSDOT
State DOT and local
government
WSDOT direct access
ramps website
Treasure Island mobility management and
congestion pricing program (toll for vehicles
entering/exiting the island)
SFCTA/TIMMA TMA
Treasure Island
Transportation Plan
Fact Sheet
Tran
sit
imp
rove
men
ts
Create and manage a multi-modal payment
card MTC (Clipper) MPO Clipper card website
Signage program for major transit hubs
MTC, LA Metro
(highlighted in F-L
Mile Plan)
MPO MTC Hub Signage
Program
Allow/encourage linkages between fixed
route systems and flexible (typically private)
shuttles and last-mile options
SFMTA Transit agency MTC Climate Initiatives
Program Report
Provide park-and-ride lots, and have them in
a searchable directory
VDOT, WSDOT,
NYSDOT State DOT
VDOT Park-and-Ride
website
Free transit passes for students Riverside Transit
Agency, Alameda CTC Transit agency, TMA
Go Pass and U-Pass
website
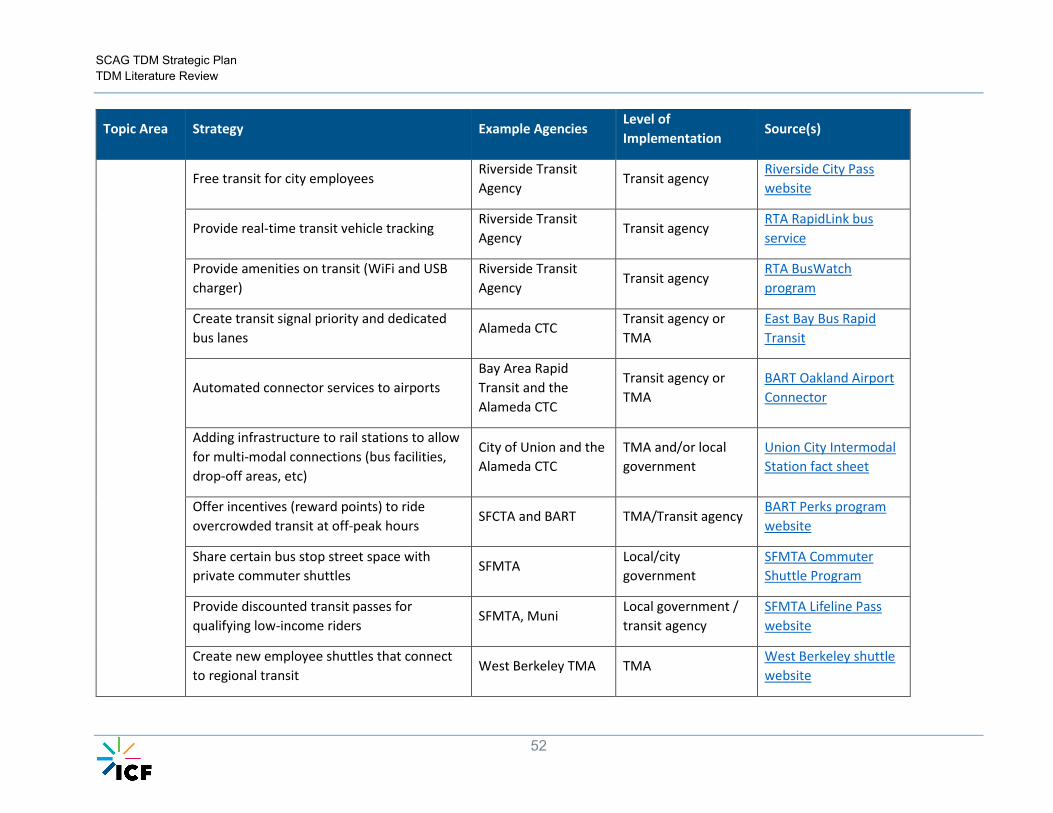
SCAG TDM Strategic Plan TDM Literature Review
52
Topic Area Strategy Example Agencies Level of
Implementation Source(s)
Free transit for city employees Riverside Transit
Agency Transit agency
Riverside City Pass
website
Provide real-time transit vehicle tracking Riverside Transit
Agency Transit agency
RTA RapidLink bus
service
Provide amenities on transit (WiFi and USB
charger)
Riverside Transit
Agency Transit agency
RTA BusWatch
program
Create transit signal priority and dedicated
bus lanes Alameda CTC
Transit agency or
TMA
East Bay Bus Rapid
Transit
Automated connector services to airports
Bay Area Rapid
Transit and the
Alameda CTC
Transit agency or
TMA
BART Oakland Airport
Connector
Adding infrastructure to rail stations to allow
for multi-modal connections (bus facilities,
drop-off areas, etc)
City of Union and the
Alameda CTC
TMA and/or local
government
Union City Intermodal
Station fact sheet
Offer incentives (reward points) to ride
overcrowded transit at off-peak hours SFCTA and BART TMA/Transit agency
BART Perks program
website
Share certain bus stop street space with
private commuter shuttles SFMTA
Local/city
government
SFMTA Commuter
Shuttle Program
Provide discounted transit passes for
qualifying low-income riders SFMTA, Muni
Local government /
transit agency
SFMTA Lifeline Pass
website
Create new employee shuttles that connect
to regional transit West Berkeley TMA TMA
West Berkeley shuttle
website

SCAG TDM Strategic Plan TDM Literature Review
53
Topic Area Strategy Example Agencies Level of
Implementation Source(s)
Trav
el In
form
atio
n
Multi-modal travel information website and
call center for trip planning
SACOG, NYSDOT, FBR
MPO, VDOT MPO or State
SACOG, 2016 Final
TDM Strategic Plan;
VDOT 511 Trip Planner
Public Awareness and Encouragement
campaigns for active transportation
SACOG, ARC,
FBRMPO MPO
SACOG, 2016 Final
TDM Strategic Plan
Provide a transit trip-making assistance
program to elderly and disabled customers
Riverside Transit
Agency Transit agency
Riverside Travel
Training program
website
Designate staff to consult with a mixture of
audiences (large residential buildings,
schools, hospitals, employers, etc) on
available transportation options and TDM
SFMTA, City of
Cambridge, MWCOG,
TMAs
Local/city
government
San Francisco TDM
Plan; Cambridge
Employee Commute
Information website
Disseminate information on TDM programs
and multi-modal options to commuters Tysons TMA TMA Tysons TMA
Create a trip tracking tool to allow travelers
to calculate and track the emissions and
costs of their travel
NYSDOT State DOT or MPO NYSDOT Trip Tracker
website
Create a searchable directory for transit,
bike, paratransit, and carpool resources NYSDOT State DOT
NYSDOT TransLinks
webtool

SCAG TDM Strategic Plan TDM Literature Review
54
IX. Best Practices Summary This section discusses overall best practices that span multiple types of specific strategies. These practices are a consolidation of insights, both stated and implied, that were gleaned from the previously detailed strategies.
1. Ensure that TDM is a priority/objective in the metropolitan transportation planning process, making it a priority across all activities to enable development of a supportive set of policies and companion programs.
TDM actions often work better in conjunction with one another since they can have supportive effects. Single actions pertaining to a specific mode —such as adding a bike lane, implementing bike lockers at transit stops, or mandating bike storage facilities at developments— may not make a noticeable impact on mode choice.50 However, the summation of several actions are more likely to collectively tip the scale in favor of a new mode in the minds of commuters. This effect also exists for multi-modal travel. Certain commuter needs may not be met by bikes, carpools, scooters, or transit individually, but collectively, these modes and others may provide new options to them. Agencies need to think of TDM strategies in union, and enact several supportive measures simultaneously to achieve maximum impact. For an example of multi-strategy, goal-oriented planning, see LA Metro’s First Last Mile Strategic Plan.
2. Provide services that are tailored to regional, local, and corridor-level needs.
Segmenting the TDM markets will enable development of customized services, promotions, and communications. Four primary questions that should be asked when considering a TDM program’s elements and scope are:
a. What are the strengths of the local system? b. What are the weaknesses of the local system? c. What are the missing links, and how can they be filled without major
infrastructure improvements? d. What are the major barriers to using transit? e. Are there key employers that would make for logical partners?
Different TDM outreach strategies can be implemented in urban and rural areas, and other strategies may be appropriate to implement at the corridor level. For example, in urban areas, the benefits of time savings may resonate with commuters. Conversely, in rural areas, where transportation demand management can be viewed as a solution only to congestion issues that do not exist there, outreach staff may coordinate with employers to demonstrate how transportation programs also enhance mobility options and contribute to jobs access through reduced transportation costs for non-SOV travel and local economic development strategies. Furthermore, TDM services can be implemented at a corridor level to support the launch of a new public transit line or particularly congested corridors. Pursuing Integrated Corridor Management (ICM) and Active Transportation & Demand Management (ATDM) connections can lead to actively linking TDM operations on a corridor level.
50 CAPCOA. Quantifying Greenhouse Gas Mitigation Measures. August 2010.

SCAG TDM Strategic Plan TDM Literature Review
55
3. Continuously market TDM programs, integrating behavior change theory models into program marketing and operations.
Transportation habits can stick: if only convinced to try an alternative once, someone can be inclined to maintain that habit, as shown in an MWCOG-led carpooling incentive program in which 93% of users continued carpooling after incentives expired (63% in the long-term). By this logic, it is intuitive then to work consistently to incentivize first-time switches amongst travelers, and to keep marketing programs active even after they have existed for some time. The FBR MPO explicitly highlighted the importance of continuity in their goals for the Ashville region, citing the importance of keeping their brand fresh in the minds of commuters, employers, and business groups.51 Furthermore, the Atlanta Regional Commission, through their Georgia Commute Options program, has integrated various behavior change theories into their marketing strategies, acknowledging that continued communications and marketing to existing and prospective program participants encouraging smaller incremental changes over time will lead to longer term commitments in sustainable modes.
4. Make alternative mode support and incentives visible.
In order for policies or investments to manifest in real travel changes, the public needs to be aware of those changes. Below are some examples of how to ensure that a TDM strategy is visible and well-understood:
a. Put bike parking in a visible location. b. Make clear, visible signage on parking or lane restrictions for shared modes. c. Make wayfinding signage and transit routing information as obvious as possible.
5. Consider safety and mobility together for active transportation.
Improving the accessibility or usability of a mode may not be effective unless it is also made safer. For example, when adding new bike lanes or docking stations, also consider making the lanes wide, painting them green, and adding bike-detection sensors at intersections.52 For other examples of improvements spanning both safety and accessibility, see the list of bike/ped improvements underway by SFMTA.
6. Coordinate with and leverage private sector technologies such as dockless
bike/scooter share companies, TNCs (e.g., Uber/Lyft) and other carpool mobile apps.
These technologies are developing rapidly, and it is typically seen as a mistake to try to out-compete the private sector and for agencies to champion technology service development.53
51 FBRMPO. Long-Range Transportation Demand Plan. March 2013. 52 For an example of this kind of active transportation infrastructure, see Santa Monica’s Bike Lane, Facilities, and Parking webpage. 53 As an example of such tactics, see LA Metro’s development of a GoLA mobile app, which was developed by a consultant team in 2016, but has since been discontinued in favor of open-API policies geared at encouraging private sector investment to a similar end.

SCAG TDM Strategic Plan TDM Literature Review
56
Instead, agencies should create policy to encourage innovation in these modes, and to steer their applications in ways that advance public sector goals. For example, many agencies are experimenting with subsidizing certain TNC rides, such as those to and from transit stations, or those in areas currently lacking transit options.54
7. Identify sustainable fund sources for TDM to ensure implementation can occur.
It is important for TDM programs to be able to remain consistent and thus important for funding streams to be steady so that users can rely upon programs. Thus, dedicated funding streams often have more value to TDM practitioners than competitive grant funding.
8. Build TDM strategies into other active transportation projects, such as special events
and incident management, as part of the transportation solution.
In addition to everyday travel, multimodal solutions can be extremely valuable in reducing congestion surrounding concerts, sporting events, or construction hotbeds. TDM can often be used as a low-cost solution and should be incorporated in planning for these types of events.
9. Enforce local adoption of TDM program services and strategies – having local
communities ensure supportive land use.
On the local level, land use designations often dictate where, and in turn, how people travel. TDM should be included in land use policy discussion, ensuring that there are safe and easy ways for residents, employees and visitors to travel without the use of their single occupancy vehicles.
10. Measuring the impacts of TDM programs can provide valuable data to determine cost effectiveness of measures.
Determining robust performance measures can help agencies determine where to focus their investments by categorizing the cost savings of TDM benefits. DDOT in the Washington, DC region measures the societal benefits of travel and emission impacts from its TDM measures, using the TRIMMS model to calculate cost savings. These calculations are used by the TDM subcommittee to gauge the effectiveness of various TDM measures. The results of this evaluation for the years 2015-2017 are shown below.
54 NYPTA. Transit and TNCs. Accessed November 2018.

SCAG TDM Strategic Plan TDM Literature Review
57

SCAG TDM Strategic Plan TDM Literature Review
58
Appendix A – List of Reviewed Agencies The following agencies were reviewed for TDM strategies. This included review of any official TDM plans, as well as website materials and other documents pertaining to TDM that are available to the public. Additional research through interviews or the receipt of non-public literature was not included in this review. The literature review also mentions some agencies outside of this list, but the following agencies were reviewed holistically.
State DOTs:
• New York State DOT • Tennessee DOT • Washington State DOT • Virginia DOT • Maryland DOT
MPOs:
• Sacramento Area Council of Governments (SACOG) • Atlanta Regional Commission (ARC) • Metropolitan Area Planning Council (MAPC) • French Broad River MPO (FBR MPO) • Metropolitan Transportation Commission (MTC) • Metropolitan Washington Council of Governments (MWCOG)
Other:
• Alameda County Transportation Commission (Alameda CTC) • City of Santa Monica • City of Pasadena • City of Cambridge • City of West Berkeley • Hillsborough County • Los Angeles County Metropolitan Transportation Authority (LA Metro)

SCAG TDM Strategic Plan TDM Literature Review
59
• Riverside Transit Agency (RTA) • San Francisco Municipal Transportation Agency (SFMTA) • Tysons Transportation Management Association (Tysons TMA)

SC A G TDM Strategic Plan and F inal Report
D Existing Conditions Report and SWOT Analysis

Existing Conditions Report
January 2019
Existing Conditions: SCAG TDM Strategic Plan
SCAG
Our ref: 23272901
Client ref: 18-015-C01

The contents of this report reflect the views of the author who is responsible for the facts and accuracy of the data presented herein. The contents do not necessarily reflect the official views or policies of SCAG. This report does not constitute a standard, specification or regulation.
Steer has prepared this material for SCAG. This material may only be used within the context and scope for which Steer has prepared it and may not be relied upon in part or whole by any third party or be used for any other purpose. Any person choosing to use any part of this material without the express and written permission of Steer shall be deemed to confirm their agreement to indemnify Steer for all loss or damage resulting therefrom. Steer has prepared this material using professional practices and procedures using information available to it at the time and as such any new information could alter the validity of the results and conclusions made.
Existing Conditions Report
January 2019
SCAG TDM Strategic Plan
Prepared by: Prepared for:
Steer
523 West 6th Street, Suite 741,
Los Angeles, CA 90014
SCAG
900 Wilshire Blvd.
Ste. 1700
Los Angeles, CA 90017
+1 (213) 425 0990
www.steergroup.com
Client ref: 18-015-C01
Our ref: 23272901

SCAG TDM Strategic Plan | Existing Conditions Report
January 2019
Contents
1 Introduction ..................................................................................................................... i
Technical Advisory Committee.........................................................................................i
Stakeholder Interviews ....................................................................................................i
TDM Survey ......................................................................................................................i
Literature Review ............................................................................................................ ii
2 TDM Roles and Responsibilities ....................................................................................... 1
TDM Stakeholders .......................................................................................................... 1
3 Programs and Policies ..................................................................................................... 7
Program and Policy Overview ........................................................................................ 7
TDM Program Matrix ..................................................................................................... 9
4 Implementation by County ............................................................................................ 13
Imperial County ...................................................................................................................... 14
Los Angeles County................................................................................................................. 15
Orange County ........................................................................................................................ 16
Riverside County ..................................................................................................................... 17
San Bernardino County ........................................................................................................... 17
Ventura County ...................................................................................................................... 19
5 TDM Performance ......................................................................................................... 20
TDM Measurement ...................................................................................................... 20
TDM Effectiveness ........................................................................................................ 27
References ............................................................................................................................. 40

SCAG TDM Strategic Plan | Existing Conditions Report
January 2019
Figures Figure 2-1 County Transportation Commission Programs ................................................................ 3
Figure 2-2 Regional Rideshare Programs in the SCAG Region .............. Error! Bookmark not defined.
Figure 2-3 TMAs/TMOs in the SCAG Region ....................................................................................... 6
Figure 3-1 TDM Programs in the SCAG Region (% of Total Responses) ............................................. 8
Figure 3-2 Percentage of programs implemented at site, corridor, city, country or regional level. .. 9
Figure 5-1 Common TDM Performance Metrics (Stakeholder Survey Results) ............................... 22
Tables Table 2-1 Match Lists and Matches Received through Ridematch.info ............................................. 2
Table 3-1 TDM Program Matrix .......................................................................................................... 9
Table 5-1 Methods of TDM Data Collection ..................................................................................... 20
Appendices
A Commonly Used Acronyms

SCAG TDM Strategic Plan
January 2019 | i
This report provides an existing conditions analysis and baseline assessment of the current state of
TDM practice, activity and effectiveness in the SCAG Region. It first provides an overview of the
organizations involved in TDM delivery within the SCAG Region, categorizing them by their level of
delivery and summarizing their roles and responsibilities in a matrix. It then describes the
programs and policies they deliver and their coordination efforts.
This report was developed through engagement with TDM stakeholders across Southern California
and a review of publicly available literature on TDM delivery and measurement nationwide.
Technical Advisory Committee To develop their TDM Strategic Plan, SCAG convened a Technical Advisory Committee (TAC) made
up of TDM implementers, advocates and policy makers. The TAC consists of representatives from
both the public and private sectors throughout the SCAG Region. They assisted with the
development of a stakeholder database and the TDM survey. They will continue to be involved in
the remainder of the TDM Strategic Plan process.
Stakeholder Interviews As part of the stakeholder outreach process for the TDM Strategic Plan, the project team
conducted thirty interviews with a wide variety of stakeholders. The goal of the interview process
was to gain an understanding of how SCAG Region stakeholders plan, implement, and measure
the effectiveness of TDM strategies. Interviewees represented all six Counties in the SCAG Region,
from a variety of organizations such as municipalities, County Transportation Commissions, transit
agencies and operators, non-profit organizations and private employers.
TDM Survey Extending beyond the stakeholder interviews to capture feedback from a larger audience, the
project team developed an online TDM survey. The survey aimed to cast a wide net, pulling from a
variety of practitioners who utilize TDM programs and strategies for different purposes. Thus, the
survey was structured to gather meaningful quantitative data from user groups whose approaches
to TDM delivery might be difficult to compare. It relied on qualifying questions to categorize
responses by industry, geography and size. Two versions were developed to capture the expected
variety in reach and budget of programs between the public and private sectors. The survey
received over 100 responses from TDM practitioners throughout the SCAG Region, though
responses were more prevalent in Los Angeles, Orange, Riverside and San Bernardino Counties.
Introduction

SCAG TDM Strategic Plan
January 2019 | ii
Literature Review In order to provide a true baseline assessment and understand opportunities for improvement of
TDM delivery within the SCAG Region, the project team completed a review of TDM programs and
literature nationwide. The Literature Review categorized various types of TDM strategies
(including traditional strategies and those that have become available due to more recent
technology innovations), explored various partnerships, available funding streams, and explored
data collection and performance measurement.
SCAG TDM Strategic Plan
1
This section provides an overview of the organizations that plan for and implement TDM in the
SCAG Region, highlighting the differences in TDM delivery across the regional, county and sub
regional, and corridor and community levels. Both private and governmental agencies
representing and serving travelers in the SCAG Region are involved in TDM delivery, though some
are more responsible for policy that supports TDM programming, and others are involved directly
in implementation.
TDM Stakeholders 2.1.1 Regional Level
SCAG
SCAG represents six adjoining counties in Southern California: Imperial, Los Angeles, Orange,
Riverside, San Bernardino and Ventura. As the Region’s Metropolitan Planning Organization, SCAG
is responsible for developing a long range Regional Transportation Plan/Sustainable Communities
Strategy (RTP/SCS) which helps guide the Region in meeting its state imposed emission reduction
goals. As SCAG prepares their next RTP/SCS, they plan to utilize TDM strategies as a solution for
reducing vehicle miles traveled.
SCAG has also supported other organizations, such as the City of Los Angeles in recommending
TDM strategy best practices, and providing grant funding for TDM related projects, and is
currently developing a TDM Strategic Plan for the entire region (supported by this document).
Air Quality Districts
The South Coast Air Quality Management District (SCAQMD) is integrally involved in TDM
operations in the SCAG Region through the presence of their Rule 2202 regulations, which require
companies of more than 250 employees to mitigate mobile source emissions by purchasing
credits, paying into a fund, or implementing an employee commute trip reduction program
(ECRP), the latter which aligns with TDM programming. SCAQMD’s jurisdiction overlaps with four
counties in the SCAG Region, covering the non-desert portion of Los Angeles, Riverside, and San
Bernardino Counties as well as all of Orange County. Approximately 540 companies choose to
commit to surveying their employees each year and devising worksite specific ECRPs to meet
specific average vehicle occupancy targets.
The Ventura County Air Pollution Control District implements various programs to monitor air
pollution and reduce emissions in Ventura County. The District implements compliance programs
to assure that air pollution-emitting facilities comply with State regulations. Their Rule 211 is a
voluntary “Transportation Outreach Program” that encourages employers to utilize TDM
strategies at their worksites.
TDM Roles and Responsibilities

SCAG TDM Strategic Plan
2
Caltrans
Caltrans does not implement any employer-based or public-facing TDM programs, however, the
agency implements policies which encourage and support TDM efforts and funds transportation
programs through state gas taxes. Notably, Senate Bill 743 will alter the CEQA review process such
that traffic impacts are measured by Vehicle Miles Traveled (VMT) rather than traditional level-of-
service models. This will have far-reaching effects on TDM planning, as development projects will
have an incentive to reduce vehicle trips.
2.1.2 County and Subregional Level
Transportation Agencies
Transportation agencies in the SCAG Region implement a range of employer-based and public-
facing TDM programs which support organization goals to improve air quality, reduce congestion,
and provide quality multimodal service. Several large agencies, Metro, OCTA, SBCTA, RCTC and
VCTC, have rideshare and vanpool programs to assist employers with Rule 2202 compliance and
help provide information about multimodal options.
These agencies have formed a consortium to coordinate their program delivery and marketing
through the Go511 service. Go511 provides visitors to their website or mobile app with traffic
information as well as multimodal trip planning and resources for travelers in Los Angeles, Orange,
Riverside, San Bernardino and Ventura Counties. The service also provides a newsletter for
employee transportation coordinators called “On the Go.”
Ridematch.info (supporting Ventura, Los Angeles and Orange Counties) and IECommuter
(supporting Western Riverside and San Bernardino Counties) each allow commuters to create
profiles that are kept in databases. Profiles indicate home and work locations, as well as typical
commute time, and match users with others who have similar travel habits. These programs allow
both employers and commuters to register and are widely used throughout the region.
Ridematch.info has a database of over 400,000 registered users between the three Counties, and
in San Bernardino alone IE Commuter works with 200 employers.
Table 2-1 Match Lists and Matches Received through Ridematch.info
County Received Match Lists Received Match Lists with Matches
Percent of New Commuters with Matches
Mixed Counties 2,137 1,392 65%
Los Angeles 48,855 45,085 92%
Orange 8,275 7,288 88%
Ventura 1,164 915 78%
The table above indicates the number of users from Los Angeles, Orange and Ventura Counties
who received Match Lists from Ridematch.info, and those whose lists included matches.
Unsurprisingly, the counties with more registered users have higher percentages of matches
provided.

SCAG TDM Strategic Plan
3
The Counties each have their own portals to the Rideshare Programs where some offer financial
incentives to employers and employees, such as discount employer transit passes and raffle
prizes, to encourage use of alternative modes.
Figure 2-1 County Transportation Commission Programs
Agency Rideshare Vanpool Commuter Incentives LA Metro
OCTA
SBCTA
RCTC
VCTC
ICTC
Smaller agencies typically coordinate with sub-regional rideshare programs and may also operate
their own vanpool or related TDM programs. The Victor Valley Transit Authority (VVTA), for
example, offers TRIP transit pass incentives, a neighbor to neighbor ride service for rural areas, a
vanpool program and travel training programs.
High Occupancy Vehicle and Express Lanes are also operated at the County level (and sometimes
as a partnership between counties as is the case with the 91 Express Lanes in Orange and
Riverside Counties). Counties use lane control as a way to encourage carpooling and solicit
funding. Throughout the SCAG Region and the rest of California, the FastTrak system allows
drivers to pay their tolls through one transponder which allows them to indicate the number of
travelers in the vehicle.
Ventura County Rideshare
LA Metro Rideshare
OCTA Rideshare
IE Commuter
Figure 2-2 Regional Rideshare Programs in the SCAG Region

SCAG TDM Strategic Plan
4
Councils of Governments
The SCAG Region encompasses multiple Councils of Governments (COGs) including the Western
Riverside COG, the South Bay Cities COG, and the Coachella Valley COG among others. The COGs
interviewed and surveyed during the assessment demonstrate a range of activities with respect to
TDM programming or implementation, but nevertheless all provide support for TDM through
communication and supportive policymaking.
Examples of planning efforts relevant to TDM include:
• Climate Action Plans
• Active Transportation Plans
• Hosting symposia on transportation and mobility topics
• Research and guidelines for new mobility services and technologies
• Grant writing and funding resources
• Advocacy and planning support for TDM, multimodal infrastructure, and complete streets
policies
• Pilot projects to showcase new TDM strategies
Nonprofit Organizations
Nonprofits in the SCAG Region promote, develop and implement TDM policy or programs to
varying degrees in the region. The Association for Commuter Transportation (ACT) is a national
organization with local chapters (including Southern California) dedicated to TDM research,
education, communication, networking and advocacy. Some nonprofits are involved in advocacy
to improve multimodal access and connectivity, encourage active transportation, or promote
integrated land use. For example, the Los Angeles County Bicycle Coalition, which is one of several
chapters operating at the county/sub-regional level in California, advocates for better, safer, more
equitable and accessible active transportation facilities and policies. In contrast, the Urban Land
Institute (ULI), which convenes real estate professionals, city planners and architects, is a
professional organization and explicitly not involved in advocacy. Nevertheless, the ULI regularly
convenes symposia related to transportation and land-use topics that relate to TDM.
2.1.3 Municipal Level and Below
City Governments
City governments play both a direct and supportive role in TDM in the SCAG Region. Through the
state’s Congestion Management Program (CMP) most cities in the SCAG Region have enacted
TDM Ordinances that apply to new development, requiring that developers implement TDM
programs to control or reduce employee, resident or visitor drive-alone travel. The CMP leaves
monitoring and enforcement plans up to jurisdictions themselves, though, so ordinances are often
unmonitored and unenforced (Los Angeles County Metropolitan Transportation Authority, 2010).
Managing monitoring and enforcement of ordinances requires regular reporting from those who
need to comply, and administrative work and site auditing from the jurisdiction in charge of the

SCAG TDM Strategic Plan
5
ordinance, so even when non-infrastructure TDM elements are incorporated in the development
of a project, they are often discontinued as site ownership changes.
Cities including Santa Monica, Glendale and Los Angeles have developed TDM ordinances
requiring developers or employers to implement trip mitigation plans to reduce congestion either
on a citywide level or in smaller areas through Specific Plans, and have plans to require
compliance even after a site receives its entitlements. The City of Los Angeles is hoping to
streamline the reporting process making monitoring and enforcement less of an administrative
strain on their staff in order to maintain enforcement of their ordinance long term.
Since the availability of public transportation varies greatly even within individual counties, first
and last mile solutions (connecting travelers between their origins or destinations and a fixed
route transportation service) are often implemented at the municipal level. In denser areas such
as the City of LA and the municipalities in close proximity to it, options such as docked or dockless
bikeshare or electric scooters allow travelers to take advantage of rail service and quickly and
easily get between a station and their destinations. For those who aren’t able to use these
micromobility options or need to travel further than a mile or two, shuttle or rideshare service can
connect specific sites or can be used on-demand within a pre-designated area. Recently,
municipalities have begun to experiment with providing or subsidizing on-demand first/last mile
service. The City of LA currently operates a microtransit pilot program through a partnership with
the FASTLink TMA in Downtown Los Angeles, and the City of Monrovia is subsidizing trips on Lyft
and Lime Bike within their service area.
Other cities support TDM with complete streets policies, active transportation plans,
bike/scootershare guidelines, and by investing in multimodal infrastructure. Increasingly, cities are
finding TDM to be a cost-effective approach to manage growth and improve transportation
options.
TMAs/TMOs
There are 11 transportation management agencies/organizations registered with SCAQMD in the
SCAG Region. These organizations, which vary in size and scope, develop and implement
commuter programs in a specific city, commercial district, or subregion. TMAs/TMOs are
concentrated in Los Angeles and Orange Counties and tend to focus predominantly, although not
exclusively, on outreach to employers to assist with AQMD Rule 2202 compliance. Notably, both
Santa Monica and Warner Center have expanded their local TMA/TMO’s mission to include
engagement with residents and visitors.
There are also a few examples of TMAs/TMOs active at the community or corridor level in the
SCAG Region, including Commute 90067 (the Century City TMO) and Spectrumotion in Irvine, both
organizations that serve smaller corporate parks within Los Angeles and Irvine respectively. These
organizations are member-based and run similar commuter programs to those that operate at the
city level.

SCAG TDM Strategic Plan
6
Figure 2-3 TMAs/TMOs in the SCAG Region
Nonprofit Organizations
At the municipal and community or corridor level, nonprofits in the SCAG Region also focus on
initiatives that improve multimodal access and facilities. The Los Angeles Neighborhood Initiative
(LANI), for example, works closely with local jurisdictions on smaller “secondary projects” such as
transit stop improvements, tactical urbanism and education campaigns. Organizations like Walk
Bike Burbank focus on advocacy specifically for active transportation.
Employers
Employers in the SCAG Region are actively involved in the development and implementation of
TDM through commuter benefits programs, particularly those that are subject to SCAQMD’s Rule
2202 and/or a city ordinance. Typical TDM strategies include financial incentives, discounts on
transit passes, carpool programs, teleworking or compressed work weeks, and on-site amenities
to reduce employee trips to/from their worksite. Aside from regulatory compliance, the major
motivations for employers are corporate responsibility, parking management, and employee
wellness/quality of life.
SCAG Region TMAs/TMOs:
1.Warner Connects
2. Go SaMo TMO
3. Compass Playa Vista
4. Century City TMO
5. South Bay Westside TMA
6. Burbank TMO (BTMO)
7. Go Glendale TMA
8. Pasadena TMA
9. FAST DTLA
10. Anaheim Transportation
Network
11. Spectrumotion
1
2
3
4
5
6 7 8
9
10
11
SCAG TDM Strategic Plan
7
Program and Policy Overview The stakeholder TDM survey collected data about what types of TDM programs are being
implemented in the SCAG Region. Approximately 75% of the stakeholders surveyed answered
questions related to the types of programs implemented at the regional, county/subregional,
community/corridor or site-specific level.
Results indicate that carpooling, ridematching, and outreach and marketing are the most common
TDM programs. This is consistent with statements from our stakeholder interviews. Many regional
rideshare programs offer ridematching assistance, guaranteed ride home, and outreach to
participating employers. Carpool matching has historically been a cornerstone of many TDM
programs at various geographic levels. Recently, dynamic carpool matching programs operated by
private companies such as Scoop and Waze have begun to help users find one-time matches and
provide payment coordination and travel direction directly through mobile applications. While
both Waze Carpool and Scoop typically market their programs on a site-specific level, they may be
supported by a larger jurisdiction or organization. The Burbank TMO, the City of Santa Monica and
OCTA have all conducted pilot programs with Waze Carpool by subsidizing the cost of carpool trips
for riders.
Parking pricing, the only real “stick” or discouraging measure included as an option for survey
respondents, was the least commonly used program. This may be because TDM practitioners at all
levels are hesitant to charge money to travelers, particularly for something they have previously
received for free. The parking cash-out option could provide an alternative to those who are
interested in utilizing pricing to try to change behavior but want to incentivize multimodal travel
rather than disincentivize driving. Employers who lease parking spaces individually for their
employees are required to offer a parking cash out in the state of California, though this is not well
enforced.
The following figures summarize the programs run by the survey respondents. The first figure
(Figure 3-1) shows the programs that were reported the most often, and the second (Figure 3-2)
shows the proportion of respondents by organization type for each program. As described above,
carpooling is the most popular strategy, utilized by over three quarters of respondents. Parking
pricing is the least popular, and is utilized by less than 15% of all survey respondents.
Programs and Policies

SCAG TDM Strategic Plan
8
Figure 3-1 TDM Programs in the SCAG Region (% of Total Responses)
Source: Public and Private Stakeholder Survey (80 Responses)
Based on the survey results, the majority of TDM programs are implemented at the site-specific
level. During the stakeholder interviews, several participants remarked that most TDM
implementation occurred at worksites or universities. Despite the relatively small survey sample,
these results support those observations. This is consistent with what might be expected given the
impact that SCAQMD’s Rule 2202 has on TDM programming in the SCAG Region. Excluding the
broad categories of “other” and “employee/employer support,” most strategies or programs that
are included as Good Faith Efforts in the Rule 2202 Employee Commute Reduction Program (ECRP)
form are implemented primarily at a site-specific level, whereas the strategies from the survey not
explicitly included in the ECRP (Safe Routes to School, Programming with TNCs and 511
Information Systems) are reported to be implemented more commonly on a corridor level or
beyond.
0% 10% 20% 30% 40% 50% 60% 70% 80% 90%
511 Information/Trip Planning
Bike/Scooter shared options
Carpooling
Employee/Employer support programs
First/Last Mile Strategies
Guaranteed Ride Home
Other
Outreach and Marketing
Parking Cash Out
Parking Pricing
Private shuttles
Programming with TNCs
Ridematching
Safe Routes to School
Subsidies and Incentives
Telecommute/Compressed Work Week
Vanpooling
Site Specific Corridor/Community City County/Sub-regional Regional

SCAG TDM Strategic Plan
9
Figure 3-2 Percentage of programs implemented at site, corridor, city, country or regional level
Source: Public and Private Stakeholder Surveys (80 Total Responses)
TDM Program Matrix Table 3-1 provides an overview of the TDM strategies that are commonly used within the SCAG
Region. It provides examples of each type of strategy from within the SCAG Region and describes
the geography levels where the strategies are most commonly implemented within the Region.
The list of example agencies and programs links to more information about each example.
Table 3-1 TDM Program Matrix
Topic Area Strategy Example Agencies and Programs Level of
Implementation
Bik
e /
Ped
imp
rove
men
ts
Operate a public docked or
semi-docked bikesharing
program
Los Angeles Metro: Docked bike share system County/Subregional,
Municipal City of Santa Monica: Semi-docked bike share system
Support or partner with
dockless bike or scooter systems
City of Santa Monica: Shared Mobility Pilot
Municipal
0% 10% 20% 30% 40% 50% 60% 70% 80% 90% 100%
511 Information/Trip Planning
Bike/Scooter shared options
Carpooling
Employer support programs
First/Last Mile Strategies
Guaranteed Ride Home
Other
Outreach and Marketing
Parking Cash Out
Parking Pricing
Private shuttles
Programming with TNCs
Ridematching
Safe Routes to School
Subsidies and Incentives
Telecommute/Flexible or Compressed Work Week
Vanpooling
Site Specific Corridor/Community City County/Sub-regional Regional

SCAG TDM Strategic Plan
10
Topic Area Strategy Example Agencies and Programs Level of
Implementation
Provide Safe Routes to School
program
City of Thousand Oaks: Safe Routes to School programs
County/Subregional,
Municipal
Create additional bike lanes,
undertake sidewalk and
streetscape improvements
OCTA: Bicycle infrastructure improvements
County/Subregional,
Municipal,
Corridor/Community
Emp
loye
r-b
ased
Pro
gram
s
Help employers interested in
starting a telework program
SCAG: Future of the Workplace
Study Regional,
County/Subregional LA Metro: Employer information on telework programs
Help employers find commuting
solutions in response to large-
scale construction projects
LA Metro: Approach to Blue Line shut down County/Subregional,
Municipal Burbank TMO: Bi-weekly construction updates
Guaranteed Ride Home (GRH)
programs
Ridematch.info: Guaranteed Ride
Home
County/Subregional,
Site specific
Ridematching assistance
services (vanpool/carpool)
Ridematch.info and IE Commuter: Regional ridematching databases
County/Subregional;
Corridor/Community
Commute 90067 TMO: Ridematching database
Provide rewards to for starting a
new carpool to work
IE Commuter: Carpool Incentives
County/Subregional,
Municipal OCTA: Waze Carpool subsidy

SCAG TDM Strategic Plan
11
Topic Area Strategy Example Agencies and Programs Level of
Implementation
Lan
d-U
se/
Dev
elo
pm
ent
Create an ordinance mandating
TDM measures for certain
developments
City of Glendale: TDM Ordinance Municipal,
Corridor/Community City of Los Angeles: Warner Center Specific Plan TDM Requirement
Create an on-street shared-
vehicle program
City of Los Angeles: Blue LA Program
Municipal
Creation of TDM ordinances for
developers, mandating issuance
of TDM plans and/or meeting
TDM-related requirements
SCAQMD: Rule 2202
Regional, Municipal City of Santa Monica: TDM Ordinance
Award competitive grants to
local governments and NGOs for
making plans supporting TOD
and TDM principles
SCAG: Future Communities Pilot Program Regional,
County/Subregional
LA Metro: Go Verdugo Program
Pri
cin
g
HOV express lanes LA Metro: ExpressLanes County/Subregional
Tolled, managed lanes OCTA: Tolls County/Subregional
Tran
sit
Fare
Pro
gram
s
Create and manage a multi-
modal payment system
LA Metro: TAP Wallet (in
production) County/Subregional
Provide operational continuity
between fixed route systems
and last-mile options
Social Bikes (used in Santa Monica, Beverly Hills, West Hollywood, UCLA & Long Beach) TAP Card interoperability
Municipal
Provide park-and-ride lots, and
have them in a searchable
directory
LA Metro: Supportive Transit Parking Program
County/Subregional

SCAG TDM Strategic Plan
12
Topic Area Strategy Example Agencies and Programs Level of
Implementation
Free or discounted transit
passes for students or
employees
LA Metro: U-Pass and E-Pass
County/Subregional,
Municipal, Site
Specific
Provide discounted transit
passes for qualifying low-income
riders
LA Metro: LIFE Program County/Subregional,
Municipal
Tran
sit
imp
rove
men
ts
Provide real-time transit vehicle
tracking Riverside Transit Agency Transit agency
Provide amenities on transit
(WiFi and USB charger)
Thousand Oaks Transit: Wifi on buses
County/Subregional,
Municipal
Adding infrastructure to rail
stations to allow for multi-
modal connections (bus
facilities, drop-off areas, etc)
SBCTA: Transit Hub County/Subregional,
Municipal
Allow/encourage linkages
between fixed route systems
and flexible (typically private)
shuttles and last-mile options
City of Los Angeles and FASTLink TMO: Flex LA microtransit
Municipal
Info
rmat
ion
Multi-modal travel information
website
LA Metro: Rideshare Website County/Subregional,
Municipal,
Corridor/Community,
Site Specific Go SaMo TMO: Website
Public Awareness and
Encouragement campaigns for
active transportation
SCAG: Go Human Campaign
Regional,
County/Subregional,
Municipal
Provide a transit trip-making
assistance program to elderly
and disabled customers
Riverside Transit Agency and
Santa Monica Big Blue Bus: Senior
Rider travel training
County/Subregional;
Municipal
Provide a trip tracking tool to
allow travelers to calculate and
track the emissions and costs of
their travel
IE Commuter and Playa Vista Compass TMA: Trip logging
platforms/incentive programs
County/Subregional,
Corridor/Community

SCAG TDM Strategic Plan
13
Implementation by County

SCAG TDM Strategic Plan
14
Imperial County
Participating Stakeholders
Metrics Collected
Programs: Imperial County’s transportation services are implemented primarily through Imperial County
Transportation Commission (ICTC). ICTC operates Imperial Valley Transit (IVT) the County’s fixed route
transit service, as well as its Access and Dial-A-Ride services. The California Vanpool Authority (CalVans)
operates 40-60 vans within Imperial County, many supporting seasonal agricultural workers.
Policies: While no official TDM policies exist, Imperial County has policies that support TDM delivery. Their
Measure D brings tax dollars into a variety of transportation projects throughout the County, and some
local specific plans such as the Mesquite Lake Specific Plan include Transportation Demand elements.
Challenges: Imperial County faces unique challenges related to their location along the United States-
Mexico border. ICTC’s recent study California/Baja California Pedestrian and Bicycle Access Study helped
to improve entry point travel for cyclists and pedestrians. The County has physical space for and
anticipates residential and economic growth, but considers transportation access and potential
congestion as major challenges that will need to be addressed.
County Level TDM Programs
5 - 20 weekly staff hours
$50,000-$250,000 annual budget
Transit Ridership, Average Vehicle Ridership
14

SCAG TDM Strategic Plan
15
Los Angeles County
Participating Stakeholders
Metrics Collected
Programs: Los Angeles County TDM programming is implemented at all levels. At the County level, LA
Metro takes the lead in coordinating TDM services through their management of the Regional Rideshare
Program, their vanpool program and their employer and student pass programs. They have also recently
taken a more involved role in coordinating TDM services throughout the County by hosting focus groups
for Cities and working groups for TMAs (who operate on the municipal level). LA Metro operates a
bikeshare program, as do many municipalities within the County. Similarly, both LA Metro and individual
cities have begun to experiment with offering microtransit pilots.
Policies: The non-desert portion of LA County is covered under SCAQMD, which means large employers
must mitigate the emissions caused by employee commutes through Rule 2202. For smaller employers,
LA Metro is in the process of instituting Assembly Bill 2548 which will require employers to provide pre-
tax transportation benefits.
Challenges: The diversity of LA County poses challenges related to TDM delivery. Cities differ greatly in
demographics, access to public transportation and parking availability. A severe lack of affordable housing
makes it difficult for County employees to live in areas where a commute by transit is feasible. Where
public transportation is prevalent, some riders have discussed concerns about safety.
County Level TDM Programs
80+ weekly staff hours
$500,000+ annual budget
15
Transit and Bikeshare Ridership, VMT, Program Sign Ups
Event/Program Registration, AVR
AVR
AVR

SCAG TDM Strategic Plan
16
Orange County
Participating Stakeholders
Metrics Collected
Programs: OCTA leads Orange County’s Regional Rideshare Program management and vanpool subsidy
program. They offer fixed route bus service throughout the region for which they provide discounted
transit passes to certain groups and have begun implementing a microtransit pilot to help support first
and last mile connections. They also operate a pilot program with Waze Carpool, subsidizing trips for
riders. Other major TDM implementers in the County include UC Irvine which has a robust TDM program,
and TMAs Spectrumotion and Anaheim Transportation Network.
Policies: Orange falls under SCAQMD and its large employers must comply with Rule 2202. Some
municipalities within Orange County, such as Anaheim, have TDM ordinances tied to new development.
Cycling is popular within the County, which supports cyclists and pedestrians through active
transportation plans and programs. Below the municipal level, policies such as UC Irvine’s student and
staff housing policy encourage commuters to live within walking or biking access of their work and school.
Challenges: Though rail does travel through Orange County, first and last mile connections are often
difficult, making it impractical for many daily commuters. Transit is not a competitive option in the County
by price or time, where buses don’t have dedicated lanes and free parking is prevalent.
County Level TDM Programs
Transit Ridership, Program Sign Ups
AVR, Program Sign Ups
AVR
80+ weekly staff hours
$500,000+ annual budget

SCAG TDM Strategic Plan
17
Riverside County
Participating Stakeholders
Metrics Collected
Programs: Riverside County participates in IE Commuter through RCTC. In May 2018 they started a new
vanpool program which has been successful, recruiting over 70 vans in the program’s first six months of
operation. Many vanpoolers are agricultural workers. RCTC also provides TDM marketing, with physical
marketing at bus stops and through events, as well as online.
Policies: Riverside County has various policies that support TDM delivery, such as Climate Action Plans,
Complete Streets and Safe Routes to School policies. Riverside Transit Agency (RTA) also supports TDM
through policies such as their discounted pass programs, and through transit enhancement such as Wifi
and bike racks on their vehicles.
Challenges: Riverside faces some unique challenges in that more residents commute out of the county
than the number of workers commuting into the county each day. TDM regulation or requirements can
be seen as contradictory to job creation as the County attempts to attract a more diverse industry. There
is also a disconnect between the various TDM implementers in the County, and a lack of experienced
ETCs. Even among public agencies, Western Riverside is much more active in TDM delivery than the
eastern side of the County.
County Level TDM Programs
Mode Share, Passenger Miles, VMT
AVR
17
80+ weekly staff hours
$500,000+ annual budget

SCAG TDM Strategic Plan
18
San Bernardino County
Participating Stakeholders
Metrics Collected
Programs: SBCTA uses the IE Commuter Rideshare Program along with Western Riverside County. IE
Commuter promotes and provides incentives for alternative modes, matches carpoolers and assists
employers with surveying for Rule 2202. San Bernardino has also just begun a new vanpool subsidy
program. Most of their marketing is done in collaboration with the other counties. Victor Valley Transit
Agency also implements community based programs.
Policies: SCAQMD’s Rule 2202 applies to large employers within the non-desert portion of San
Bernardino County. SBCTA also implements policies that close gaps in the transportation network such as
the Redlands Rail Project, and transit agencies such as OmniTrans have created new service routes to
connect to a new Transit Center.
Challenges: As the largest county in the SCAG Region, San Bernardino faces challenges related to its size.
Service areas for transit agencies span both urban and rural environments, making it difficult to
implement TDM programs across service areas. San Bernardino is also home to shipping and fulfillment
centers and other industry that often attracts seasonal work, which creates high amounts of turnover in
vanpool participants.
County Level TDM Programs (San Bernardino County Transportation Authority , 2017)
80+ weekly staff hours
$500,000+ annual budget
Program Sign Ups
AVR
Transit Ridership
Participating

SCAG TDM Strategic Plan
19
Ventura County
Participating Stakeholders
Metrics Collected
Programs: Ventura County operates the Regional Rideshare Program through VCTC, who also operates
their own transit service. The Rideshare Program uses ridematch.info to match carpool trips, helps
commuters plan trips and provides information on multimodal trips. VCTC also offers support for
employers who need to comply with TDM Regulation through their Air Pollution Control District’s Rule
211 by providing survey support, Ride Guides and a Guaranteed Ride Home program. Though not
implemented at the County level, municipalities often operate Safe Routes to School Programs.
Policies: Ventura County falls under their own Air Pollution Control District, which provides Rule 211, asking
employers with over 100 employees to collect information about their employees’ travel habits. The rule
does not require that emissions are mitigated. Municipalities like City of Thousand Oaks do have TDM
policies listed officially, but they are not often enforced.
Challenges: Ventura County is the only county within the SCAG Region without a self-help transportation
tax, meaning funding issues are prevalent. Projects such as the addition of an HOV lane to an increasingly
congested area of the 101 highway are often placed on the backburner. Ventura County’s lack of land use
regulation also encourages sprawl, making transit routing more difficult.
County Level TDM Programs
Program Sign ups
Transit Ridership
Program Sign upsRidership Data
$250,000 - $500,000 annual budget
<5 weekly staff hours
Transit Ridership, Program Sign Ups

SCAG TDM Strategic Plan
20
Presently, there is no standard practice for how to quantify TDM program performance in the
SCAG Region, a fact noted by many stakeholders from local agencies and advocacy groups. More
than 70 percent of the survey respondents do measure TDM performance with one or more
metrics, but the variety in measurement processes and metrics calculated make it difficult to
compare data region-wide. Performance measurement was more common in the private than the
public sector, likely a result of the SCAQMD Rule 2202 regulations, which applies to employers in
four of the six SCAG Region-counties with 250 or more employees and requires travel diary-style
surveys. Notably, about one third of survey respondents from the public sector indicated that they
do not collect any TDM data or measure performance. Reported metrics include average vehicle
ridership (AVR), mode share, VMT, program registrations/enrollment, ridership, and financial
results (sales receipts).
TDM Measurement 5.1.1 Data Collection
Effectiveness of TDM programs can be extracted through various means of data collection each
with its own advantages and drawbacks.
Table 5-1 Methods of TDM Data Collection
Method Advantages Disadvantages Used in SCAG Region by Travel Diary Surveys
Reported data is typically accurate because surveys ask about travel during a recent block of time. If information about trip origins and destinations is collected, it can be used to calculate a variety of metrics.
Surveys can be time intensive for respondents and often require a good deal of administrative work to distribute and obtain responses. These types of surveys are less feasible for geographic levels larger than specific sites or for specific sites without regular travelers (i.e. employees).
Employers complying with SCAQMD’s Rule 2202, City of Santa Monica or City of Burbank’s TDM Ordinances; Employers who use Ridematch.info or IE Commuter to administer surveys.
TDM Performance
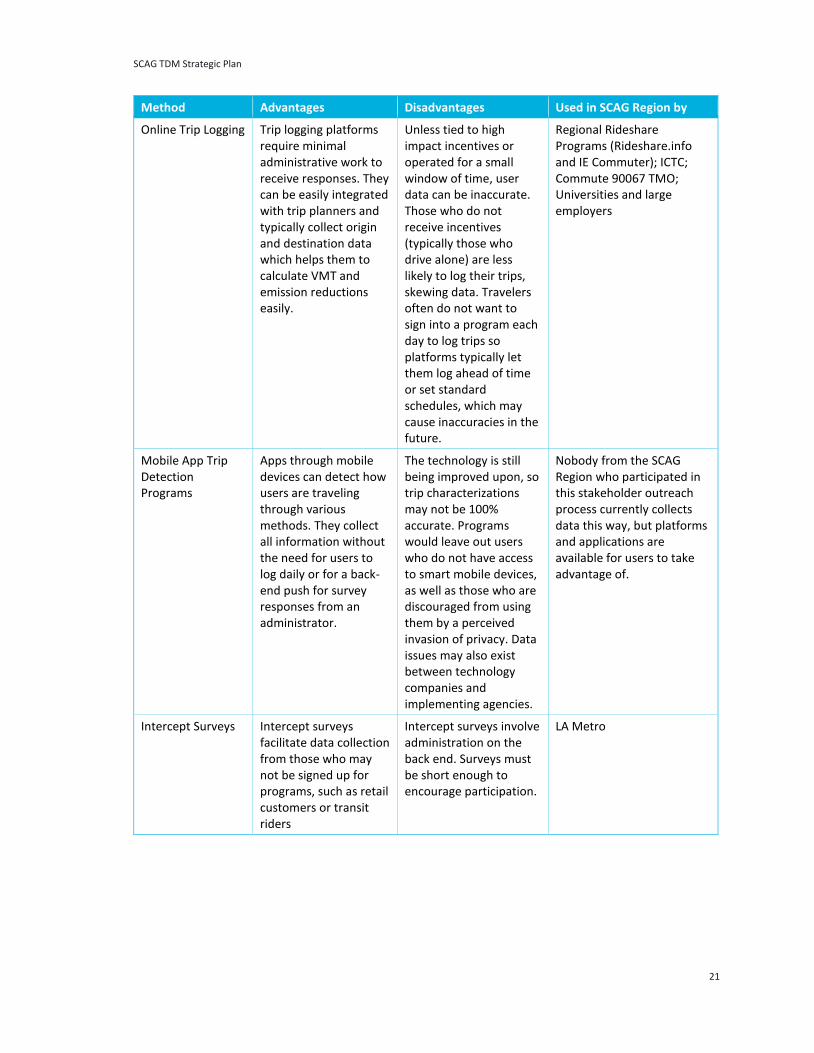
SCAG TDM Strategic Plan
21
Method Advantages Disadvantages Used in SCAG Region by Online Trip Logging Trip logging platforms
require minimal administrative work to receive responses. They can be easily integrated with trip planners and typically collect origin and destination data which helps them to calculate VMT and emission reductions easily.
Unless tied to high impact incentives or operated for a small window of time, user data can be inaccurate. Those who do not receive incentives (typically those who drive alone) are less likely to log their trips, skewing data. Travelers often do not want to sign into a program each day to log trips so platforms typically let them log ahead of time or set standard schedules, which may cause inaccuracies in the future.
Regional Rideshare Programs (Rideshare.info and IE Commuter); ICTC; Commute 90067 TMO; Universities and large employers
Mobile App Trip Detection Programs
Apps through mobile devices can detect how users are traveling through various methods. They collect all information without the need for users to log daily or for a back-end push for survey responses from an administrator.
The technology is still being improved upon, so trip characterizations may not be 100% accurate. Programs would leave out users who do not have access to smart mobile devices, as well as those who are discouraged from using them by a perceived invasion of privacy. Data issues may also exist between technology companies and implementing agencies.
Nobody from the SCAG Region who participated in this stakeholder outreach process currently collects data this way, but platforms and applications are available for users to take advantage of.
Intercept Surveys Intercept surveys facilitate data collection from those who may not be signed up for programs, such as retail customers or transit riders
Intercept surveys involve administration on the back end. Surveys must be short enough to encourage participation.
LA Metro
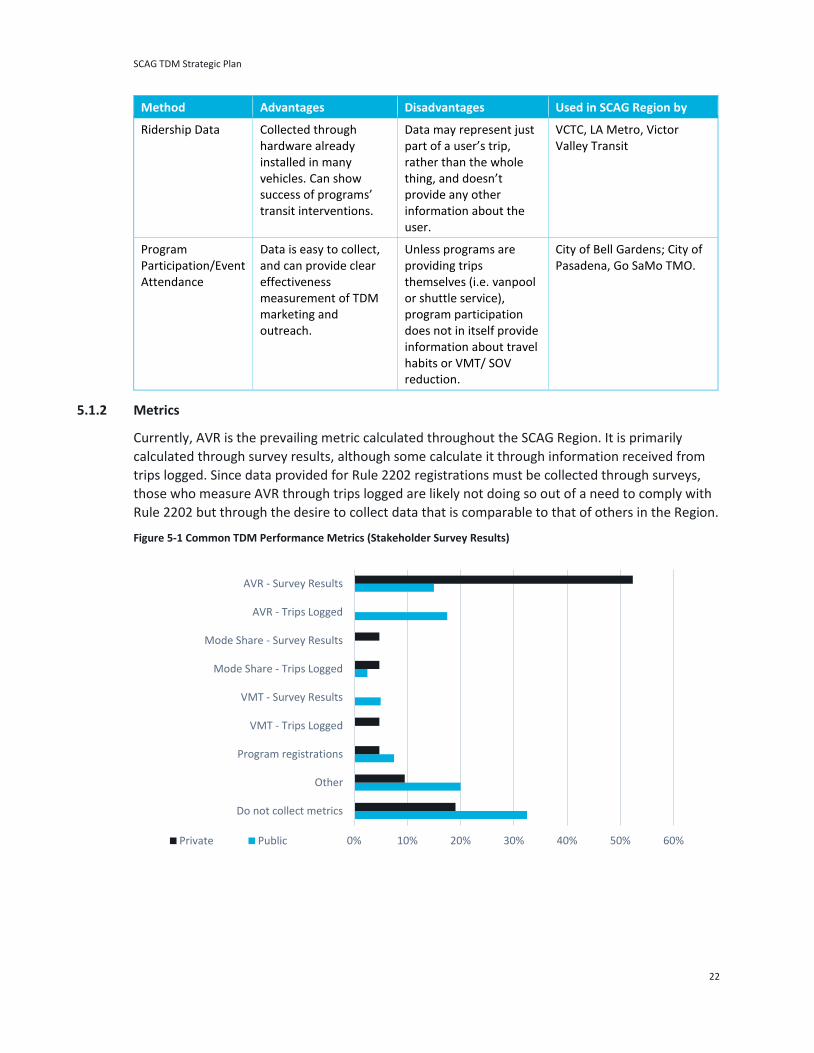
SCAG TDM Strategic Plan
22
Method Advantages Disadvantages Used in SCAG Region by Ridership Data Collected through
hardware already installed in many vehicles. Can show success of programs’ transit interventions.
Data may represent just part of a user’s trip, rather than the whole thing, and doesn’t provide any other information about the user.
VCTC, LA Metro, Victor Valley Transit
Program Participation/Event Attendance
Data is easy to collect, and can provide clear effectiveness measurement of TDM marketing and outreach.
Unless programs are providing trips themselves (i.e. vanpool or shuttle service), program participation does not in itself provide information about travel habits or VMT/ SOV reduction.
City of Bell Gardens; City of Pasadena, Go SaMo TMO.
5.1.2 Metrics
Currently, AVR is the prevailing metric calculated throughout the SCAG Region. It is primarily
calculated through survey results, although some calculate it through information received from
trips logged. Since data provided for Rule 2202 registrations must be collected through surveys,
those who measure AVR through trips logged are likely not doing so out of a need to comply with
Rule 2202 but through the desire to collect data that is comparable to that of others in the Region.
Figure 5-1 Common TDM Performance Metrics (Stakeholder Survey Results)
0% 10% 20% 30% 40% 50% 60%
Do not collect metrics
Other
Program registrations
VMT - Trips Logged
VMT - Survey Results
Mode Share - Trips Logged
Mode Share - Survey Results
AVR - Trips Logged
AVR - Survey Results
Private Public

SCAG TDM Strategic Plan
23
The survey results also indicated that respondents from the private sector believe their TDM
programs to be more effective than those from the public sector. This likely speaks less specifically
to the effectiveness of those respondents’ programs over others, but more to the importance of
an established metric to better understand the effectiveness of all programs Region wide.
Different metrics used in the SCAG Region are described below:
Average Vehicle Ridership
The most common metric used to measure TDM performance is average vehicle ridership (AVR),
the convention set by SCAQMD for Rule 2202. Roughly speaking, AVR is the number of people
divided by the number of vehicles arriving at a site within the peak period. Within the SCAG
Region AVR is typically used as a measure of commute trip reduction. Data used to calculate AVR
is collected either through trips logged or a commuter survey. Although associated with Rule
2202, it is also used by employers and agencies who are not subject to regulations. Most of the
regional rideshare programs offered by major transportation agencies assist employers in
conducting their annual surveys and calculating their AVR, which undoubtedly contributes to the
prevalence of its use in the SCAG Region. While AVR does not provide information on VMT
reduction and is thus difficult to convert into greenhouse gas emission reductions, the methods
currently used to calculate AVR could be altered to calculate VMT as well.
0% 20% 40% 60% 80%
Very Effective
ModeratelyEffective
Not effective
I don't know
Public
Private
Used by: SCAQMD and employers complying with Rule 2202
Best for: Providing an easy comparison of travel data without
need for origin and destination information, avoids potential
privacy issues associated with requesting zip code or location
information

SCAG TDM Strategic Plan
24
Mode Share
Mode share is a measure of the percentage of single occupancy vehicle (SOV) trips, typically
established through travel surveys or trip logs. SANDAG, which falls outside of the SCAQMD Rule
2202 jurisdiction, uses this metric to measure performance among employers involved in the
iCommute regional TDM program. The American Community Survey also measures mode share
for the commute to work among surveyed residents.
Vehicle Miles Travelled (VMT)
Several city and regional governments calculate VMT. With the passage of SB 743, VMT will
become a more prevalent measure of vehicle trip reduction during the development review
process. Thus, groups like the City of Los Angeles are hoping to align their updated TDM Ordinance
requirements with strategies that have measurable VMT reductions attached to them. VMT is
easily calculated from trip logs indicating origin and destination, such as those required by many
vanpool programs at local transportation agencies. It can be calculated through travel diary data
(through surveys or trips logged) though some individuals and organizations may be cautious
about sharing information such as home zip codes.
Program Registrations/Enrollment
Public and private organizations frequently measure their program successes by number of
registered users or enrollees. This is frequently reported by TMAs/TMOs, rideshare programs, and
employers. While this data does not provide an understanding of how programs contribute to
travel changes, it can still be valuable in that it helps organizations better understand the outreach
practices that are successful with their audiences, thus allowing them to run more efficient
campaigns going forward.
Used by: Pierce College, City of Arcadia
Best for: Providing information on travel habits surrounding
specific modes
Used by: Los Angeles Metro; City of Highland; SCAG Region
Developers
Best for: Providing data that can be easily converted into
emission reductions
Used by: City of Riverside, City of Pasadena, Private
Employers/Property Managers, TMAs, County Rideshare
Programs
Best for: Demonstrating direct success of marketing and
outreach efforts

SCAG TDM Strategic Plan
25
Through the Ridematch.info platform Los Angeles, Orange and Ventura Counties are able to
constantly monitor the number of commuters who sign up to find a carpool match, as well as the
number of those commuters who were successfully able to find matches.
Ridership
Ridership data is used to gauge the success of transit services, public and private shuttles, and
micro-transit services throughout the region. If baselines are established, change in ridership data
can be used to measure the effects of TDM programs. Data collectors should be cautious, though,
to consider separate factors that may cause changes in ridership. Thus, ridership data is more
valuable when evaluating impacts of TDM programs on smaller service such as one local bus route
or a private shuttle system, than it would be on LA Metro’s rail.
5.1.3 Best Practices Outside of the SCAG Region
Although the SCAG Region has not developed a standardized method of data collection, nor has
the nation as a whole, regions throughout North America have been able to collect standardized
data across different programs at varying levels of geographic implementation. This has helped
them better quantify and compare the success of programs operated by agencies and
organizations at across geographic levels.
SANDAG: iCommute Program
iCommute, SANDAG’s TDM program for the San Diego region, is an excellent example of employer
engagement at the regional level working to facilitate TDM efforts at the local and site level. The
iCommute Program offers a range of widely used TDM tools and incentives for commuters
including commuter survey assistance, guaranteed ride home, vanpool subsidies, and carpool
promotions, among others. The iCommute team, consisting of roughly 5.5 FTE staff members,
uses a commute survey tool to understand baseline travel behavior at an employer site, the
results of which are used to develop site-specific TDM recommendations. Unlike the SCAQMD AVR
survey, this commute survey includes questions about employees’ commute preferences, barriers
to trying new modes, and other qualitative information that helps to identify individuals’
susceptibility to behavior change and focus future action on the most effective opportunities.
Almost 200 employers across San Diego County, representing over 300,000 employees, participate
voluntarily in the program. Employers who conduct the commuter survey have shown a 9%
reduction in drive-alone trips and a 6% lower SOV mode share than the regional average.
The iCommute survey, TDM plan templates, and general service offerings have also served as
resources to local jurisdictions in the process of developing municipal TDM ordinances. The City of
Used by: City of San Juan Capistrano, VCTC
Best for: Providing data on user change as a result of TDM
strategies

SCAG TDM Strategic Plan
26
Carlsbad, for example, is presently developing their own TDM Ordinance and voluntary Business
Program, using iCommute survey and monitoring tools.
One important feature of the iCommute program is the Diamond Awards, which recognize
businesses for their achievements in promoting alternative options and reducing SOV mode share.
In 2018, there were 94 employers that received Diamond Awards (almost triple the number in
2015), representing almost 50% of the program’s participants. The recognition program is directly
tied to performance metrics such as mode share, infrastructure and policies, and awareness-
raising activities. The tiered system is also linked to the program’s internal process for employer
engagement. In other words, iCommute accounts are monitored for levels of participation linked
to the awards system. Companies who are less engaged receive different engagement approaches
than those who are meeting or exceeding targets and maintaining high levels of engagement.
Florida DOT: Commuter Assistance Program
Outside of Southern California, agencies sometimes measure impacts of their programs through
models such as the Trip Reduction Impacts of Mobility Management Systems (TRIMMS) model
developed by the National Center for Transit Research and the Center for Urban Transportation.
The TRIMMS model estimates the impacts (mode share and vehicle miles traveled) of TDM
programs and provides cost effectiveness estimates for strategies based on implementation
scenarios such as whether a program is implemented at an employer level or region-wide.
The Florida Department of Transportation’s Commuter Assistance Program has used this model to
calculate the impacts of their statewide programs (TRIMMS, n.d.). Though the most recent data is
from the year of 2011-2012, the TRIMMS model showed that their program resulted in a
reduction of over 845,000 trips and over 28 million vehicle miles traveled. The model also showed
that during the one year period the program had a net of between 3% and 16% of participants
switching from drive alone travel to a commute alternative. As California developers are now
required to quantify the emissions reductions tied to their VMT mitigation measures through SB
743, models like TRIMMS will likely be used more regularly.
San Francisco Bay Area: 511 Regional Rideshare Program
While measuring registration in TDM programs can provide data to help track success of program-
related marketing, it may not provide an accurate depiction of actual programmatic impacts, as it
is unclear how registrants were traveling before they signed up. Rather than assume each
registration results in a reduction of a trip or a set amount of VMT, the 511 Regional Rideshare
program in the San Francisco Bay Area acknowledges that many new registrants were likely
already using alternative modes before signing up, and therefore their registrations don’t actually
impact VMT or trip reduction data. To account for this they discount their projected impacts
through registrations by 55%-60%. Even with that discount, their 2008-2009 year saw a reduction
in over 45 million vehicle miles traveled (Metropolitan Council, UrbanTrans, 2010).

SCAG TDM Strategic Plan
27
TDM Effectiveness According to stakeholder survey results, the private sector was more confident about the
effectiveness of their TDM programming. More than three quarters of the private sector
respondents reported their TDM programs to be at least moderately effective in reducing single
occupancy vehicle trips. In contrast, less than half of public sector respondents reported that their
TDM programs were moderately or very effective at reducing SOV trips.
This does not necessarily mean that programs operated by the private sector are more effective in
reducing SOV trips. In fact, more than 40 percent of public sector stakeholders were unsure of
their program effectiveness while only 5 percent of private respondents felt the same. This is
consistent with the imbalance in data collection and performance metrics observed in Section 5.1.
5.2.1 Direct Effects of TDM Programs on Travel Data
Without standard Regional data, it is impossible to quantify the effectiveness of TDM
programming throughout the region as a whole. There are examples within the region, however,
of organizations seeing success by using different approaches:
High Level of Incentives
Unsurprisingly, reducing the cost of travel coupled with rewarding car-free travel can have a
significant impact on travel modes. This is most easily accomplished in a site-specific setting with
individualized support and administration. A private employer in Los Angeles County has begun
operating a pilot program that fully subsidizes employee transit trips, and allows users to redeem
points for non-SOV trips logged that can be traded in for rewards. The program has been very
popular in its first six months, with 650 of 1,200 eligible employees registering for the program
and 500 registering for free transit passes. The program measures mode share and has seen a 39%
increase in sustainable mode share. Additionally, 155 users reported a switch from SOV travel to
transit or other modes. While this information has not been reported publicly, the program’s
administrators could use employee home data to calculate reductions in VMT or greenhouse gas
emissions.
Filling System Gaps
While many commuters do not want to drive long distances to work, some do not have another
option. Therefore TDM strategies that can provide direct alternatives to potential users are likely
to see success quickly. In Riverside County transit is less prevalent and many commuters are
driving long distances to reach their worksites. In May of 2018 RCTC started up a county-wide
vanpool program to address intercounty travel. RCTC works with CalVans to manage the program
and subsidizes $400 per month for new vans. In the program’s first six months it launched over 70
vanpools. To receive the subsidy riders must report detailed information regularly, which means
RCTC is able to collect strong data that can support VMT and emission reduction numbers. The
success of the program has also spurred RCTC to do more research into park and ride station
location planning, which can help provide access to an even larger group of people, likely further
accentuating the program’s results, albeit indirectly.

SCAG TDM Strategic Plan
28
Carrot and Stick Approach
The success of SOV travel disincentives coupled with multimodal incentives and strong supportive
policies demonstrate that a comprehensive approach to TDM planning can be more effective than
individual aspects alone. The University of California, Irvine (UCI), takes advantage of all three
approaches by limiting and pricing parking, offering programs, events and giveaways for non-SOV
travelers, and providing a significant amount of housing for both students and staff/faculty with
good proximity to campus. UCI collects mode share data which indicates that 75% of students and
staff use alternative modes to get to campus. The mode share for active transportation is
impressive, with 32% of students and staff walking and 10% biking to get to campus.
5.2.2 Indirect Effects of TDM Programs
During interviews with transportation agencies, stakeholders involved in Regional Rideshare
Programs reported their programs to be highly effective and integral to TDM delivery in the
region. Stakeholders said that agency sponsored employer programs, in particular assistance with
the annual commuter survey and AVR calculations, were critical to employer participation in TDM
programs. The interviews and surveys also showed that large amounts of funding and staff time
are dedicated on rideshare programs in the region. Despite this, it is difficult to infer a direct
causal relationship between the rideshare programs’ support for employers and measurable
effects on travel data in the Region. Similarly, while the SCAG Region has two multi-County
commuter ridematching databases, they measure program participation but are not able to show
directly how that translates to VMT reduction or mode shift because while the Counties are able
to monitor the number of commuters who were able to find matches through their systems, they
do not have a way of knowing how many of those matches turn into actual carpool trips.
SCAG TDM Strategic Plan
29
This section outlines the strengths, weaknesses, opportunities and threats associated with the
implementation and advancement of transportation demand management (TDM) in the SCAG
Region. This analysis examines the TDM industry in the SCAG Region and the internal and external
factors that affect it through strengths, weaknesses, opportunities and threats.
Strengths Current TDM Implementation
TDM has existed formally in the SCAG Region for a long time
The SCAG Region is home to some of the nation’s most comprehensive regional TDM regulation
through the South Coast Air Quality Management District’s Rule 2202 (adopted in 1996) and its
predecessor Rule 15 (adopted in 1987). Rule 2202 requires that large employers mitigate the
emissions from their employees’ commute trips, and provides them the option of implementing
TDM programs to do so. Though not all employers choose to implement TDM, the rule has
exposed a large portion of the region to the topic, familiarizing employers with TDM strategies,
and setting a standard for TDM regulation that is enforced on an ongoing basis. The state
Congestion Management Plan (CMP) and through it Los Angeles Metro’s CMP, require that
municipalities institute their own TDM regulation. The current TDM regulation and its longevity
can set an example for others in the region as they consider instituting their own policies.
The SCAG Region is home to premier TDM thought leaders
As the stakeholders in the SCAG Region develop strategies to deliver TDM projects and programs,
they do not need to look far to find helpful examples. The region is home to dozens of TDM
planners and implementers in both the public and private sectors who deliver TDM on scales as
small as the single worksite level and as large as multiple counties. Many of the TDM practitioners
in the SCAG Region have worked in the TDM industry for a number of years, some since the
industry’s inception in the late 1980s, and others are new to the field. Forums such as the
Association for Commuter Transportation’s Southern California chapter provide opportunities for
this group of thought leaders to interact and learn from each other.
SWOT Analysis

SCAG TDM Strategic Plan
30
Environmental factors conducive to multimodal travel
Weather is not usually a barrier for active transportation
In many parts of the country, active transportation options are often less attractive to travelers
who wish to avoid being outside for extended periods of time due to cold temperatures and
inclement weather. In the SCAG Region the weather is generally pleasant and people enjoy being
outside. While travelers may not be familiar with the concept of walking or cycling to complete
trips, they are accustomed to doing so for recreation. This may make them more open to changing
behavior toward an active mode or one that requires waiting for transit outside.
Traffic congestion can encourage travelers to choose non-SOV modes
While it may seem counterintuitive to think of traffic congestion as a strength, the congestion in
the SCAG Region does provide benefits for TDM delivery. In some parts of the region, roads are
often congested during peak hours, costing drivers time and money. Drivers who want to avoid
traffic may be more likely to change their behavior by traveling outside of peak hours, choosing a
different mode of travel, or choosing not to travel at all.
Weaknesses Barriers to transit use
One of the region’s biggest weaknesses is the lack of viable alternatives to driving. Although
transportation agencies continue to build rail and light rail infrastructure and improve transit
service throughout the region, there remain many barriers that prevent travel by transit from
being cost and time competitive with driving.
The SCAG Region lacks first/last mile connections to transit
First/last mile problems are common in virtually every county in the SCAG region, particularly in
San Bernardino, Riverside and Ventura County where land use patterns have resulted in more
dispersed suburban communities. However, even in relatively dense areas of Los Angeles County,
first/last mile connections are lacking with few transit connections, poor quality sidewalks and
nonexistent bike facilities.
There is no bulk or bundled transit pass for the region as a whole
Transit is not properly incentivized via bundled or bulk transit passes in the region. There are more
than 60 transit operators in the SCAG region, using different fare structures and payment systems.
In some cases, agencies have worked together to provide passes that are transferable from one
service to another, but the process is cumbersome. Metrolink, for example, uses paper tickets
purchased through kiosks and a mobile ticketing app. Through arrangements with other
operators, both types of tickets allow passengers free transfers to Metro and some local bus
service but not all of them.
Metro Transit Passes are not valid on municipal bus services. While the EZ Pass system does
incentivize transit usage in Los Angeles County, to transfer from a Metro service to a local service
(or between two local services), the passenger must purchase the correct EZ Pass, as well as
SCAG TDM Strategic Plan
31
passes for any additional “zone” or must pre-load their TAP card with fifty cents of additional
“stored value,”. Notably, stored value cannot be added onboard a bus, so riders must have access
to a TAP Vending Machine to load money for a transfer. The process is not transparent and is
challenging for new riders to figure out without some assistance. This type of barrier to transit use
makes it more difficult to encourage travelers to choose transit.
Legal and political difficulties of TDM delivery
TDM doesn’t have the political backing that major infrastructure projects do
Political support for TDM measures varies among local governments. Notably, several cities have
TDM ordinances that require some degree of mitigation during the development review process
(Glendale, City of Los Angeles). However, based on the interview reports, it is far more common
that city officials are hesitant to add burdens for developers or employers in the form of TDM
regulations. In Riverside County, for example, cities and councils of governments are more
focused on economic development and job creation than traffic mitigation, and therefore do not
want to deter companies from locating there. TDM requirements, parking limits, fees and other
“sticks” are therefore unpopular.
TDM requirements are often tied to developers but reliant on property managers and tenants to
carry out
TDM ordinances often link TDM-related traffic mitigations to the entitlement process, which
places responsibility on developers for fulfilling these requirements. However, to be effective,
TDM programming must be implemented by property managers or tenants in the buildings.
Developers therefore need to meet the TDM requirements before securing project approvals, and
then must ensure that these requirements are maintained through the building’s life cycle,
including transfer of ownership and changes in property management. Naturally, this is not a
simple process or easily enforceable by local government. There is often a communication breach
that results in less than intended TDM programming on site.
Environmental factors that deter multimodal travel
Size of Region
The size and diversity of land use in the SCAG region is a deterrent to multimodal trips. As was
mentioned in multiple stakeholder interviews, there is considerable inter-county travel for work
trips, which results in very long commutes. Several counties have recognized the need for better
relationships and alternatives to address this and are focusing on coordinated vanpool and
carpool programs for people traveling from exurban areas into job centers in Orange, Los Angeles,
and San Diego County, and transit providers such as LADOT provide express point-to-point service
for commuters. In Riverside County, they are emphasizing telecommute options and shared
workspace solutions. However, in many cases, the car is best suited for long-distance point to
point travel, particularly where first/last mile connections are lacking.
SCAG TDM Strategic Plan
32
Variety in transit access
Transportation infrastructure is planned and implemented by multiple agencies and jurisdictions
with very different planning priorities and funding mechanisms, which causes variation in transit
access throughout the region. Some areas have excellent multimodal infrastructure, particularly in
the central urban core of the region’s larger cities. Others have very limited access to commuter
bus and rail networks.
Ineffective TDM results measurement
TDM has no standard measurement
There is no common measurement for TDM program effectiveness in the region. Due to the
requirements of SCAQMD’s Rule 2202, many employers in both the public and private sectors use
Average Vehicle Ridership (AVR) to track employee commute behavior. The City of Santa Monica
has adopted this metric as well to track performance of its citywide TDM ordinance and associated
outreach efforts. However, most cities and governments use vehicle trips or vehicle miles
travelled (the new convention) to measure traffic mitigation efforts. The absence of a common
measurement or set of measurements makes it difficult to compare projects or to discuss TDM
successes in broader contexts.
There is not enough measurement of TDM in general
Many organizations in the public and private sectors who implement TDM programs do not
measure performance at all. Most survey respondents from the public sector either did not track
or did not know if they tracked TDM program performance through one of several metrics.
Naturally, without data, it is impossible to determine whether site specific or regional TDM
interventions are successful in reducing SOV trips.
Opportunities Legal and Political Landscape
The SCAG Region generally has funding for transportation projects
According to the California Association of Councils of Governments (CALCOG), local sales taxes
account for half the state’s transportation funds. San Bernardino, Riverside, Los Angeles, Orange
and Imperial Counties are Self Help Counties who have passed ballot measures to collect sales tax
for transportation projects. The 2016 RTP/SCS estimates $6.9 billion in TDM spending alone in the
SCAG region, in addition to $56.1 billion in transit capital, $38.6 billion in passenger rail capital,
and $8.1 billion in active transportation.

SCAG TDM Strategic Plan
33
Upcoming policies will make TDM measures more common
Various legal mechanisms at the state and municipal level are likely to make TDM measures more
common as a strategy to reduce demand on roadways.
• SB743 will require all cities to measure traffic mitigation by VMT instead of level of service.
This means that new development will be required to reduce demand in lieu of building
capacity.
• AB2548 will allow Metro to institute a commute benefits ordinance, requiring employers of a
certain size to implement commute benefits programs for their employees. This will not apply
to employers already subject to Rule 2202, but will likely expand the group of employers
implementing TDM in Los Angeles County.
• TDM ordinances will likely become more common in areas focused on traffic mitigation and
growth management. The City of Los Angeles is updating their ordinance to include SOV
reduction targets for residential and commercial developments. West Hollywood and Culver
City are also in planning stages to develop or update TDM ordinances.
Prevalence of mobility companies and advancement of technology
The proliferation of new mobility companies and technologies creates new transportation options
for people looking for drive-alone alternatives and new opportunities for partnerships and data
collection.
Pilot projects and partnerships with the private sector are being implemented
Many organizations implementing TDM programs have initiated pilot programs and partnerships
with mobility companies to test new services and technologies. These pilots fall outside of the
traditional TDM toolbox but are used to solve transportation challenges common to the SCAG
region, such as long-distance trips, gaps in first/last mile, and accessibility.
• Waze Carpool and SANDAG iCommute partnership to offer discount rides for commuters
traveling to/from San Diego County.
• Microtransit pilots in downtown Los Angeles (through LADOT’s contract with the FASTLink
DTLA TMO), multiple locations in Orange County (OCTA), and in development in various
locations across Los Angeles County through Los Angeles Metro.
• Dockless bike/scooter share pilot programs in Santa Monica, Monrovia, and other cities.
• Corporate, municipality and transit agency-led partnerships with ride hailing companies (e.g.
Lyft) to solve first/last mile and paratransit challenges, such as OCTA’s partnership with Lyft
and the City of San Clemente to provide discounted rides along the corridors of two of their
bus routes.
Ability to use technology to get getter data
Advances in technology have also brought better access to big data that can be used to
understand travel behavior and in some cases program performance. Jurisdictions that regulate
shared mobility, for example, have demonstrated best practice by requiring data sharing
agreements with private companies that allow governments to see how and where services are
being used, and the demographic profiles of those users. The availability of personal user data

SCAG TDM Strategic Plan
34
introduces necessary concerns over privacy. Companies may be reluctant to share their data for
this reason. Nevertheless, trip level data stripped of user details can have many useful applications
for TDM purposes. For example, origin/destination information can be used to calculate VMT and
actual trip miles reduced.
Threats The cost of driving and parking in SCAG Region
Parking is cheap and prevalent
Particularly outside of the urban core, parking in the SCAG region is plentiful. Free parking is
offered to drivers in most of the region, ensuring that traveling by car will not induce any
immediate costs to drivers. Drivers are conditioned to expect free parking and thus even at venues
where parking capacity is an issue, parking pricing is seldom utilized. It was the least common
strategy used by the SCAG Region stakeholders who participated in the TDM survey for the TDM
Strategic Plan project.
When parking is priced, it is often done so in a manner that still encourages driving. Residential
buildings often “bundle” parking, attaching it to the cost of renting a unit. This means that
residents pay for a parking space regardless of whether or not they make use of it which
encourages them to own cars. In many places, bulk parking is heavily subsidized and a monthly
pass is much cheaper than the equivalent number of daily passes. This encourages regular driving
as drivers essentially have a “free” space, whereas if they were paying daily they could potentially
save money by traveling a different way.
Car ownership has risen
Recent studies indicate that car ownership/accessibility is the most likely factor contributing to
declines in transit ridership in the SCAG region.i Car sales have risen as they have become more
accessible and affordable for a greater number of people (particularly low-income and foreign-
born people). This is bolstered by falling gas prices. And supported by parking policies that create
an oversupply of free on- and off-street parking.
Land use practices in SCAG Region
Housing cost and low-density development
Housing affordability in the SCAG Region has an effect on transportation access, as expensive
housing in urban areas pushes renters and homeowners further away from the urban core and the
bulk of the public transit system. Commuters are less likely to have the option to use public transit
or active transportation modes to get to work, and car trips are longer increasing VMT, congestion
and greenhouse gas emissions. The sprawling land use most often seen outside of urban areas in
the SCAG Region create fewer options for long distance commuters.
SCAG TDM Strategic Plan
35
Added trips and VMT from sources not commonly thought of in TDM
Freight and goods movement poses a challenge
Historically, much of the focus of TDM strategy and implementation has been on commuters.
While they are a group whose behavior may more easily be changed, any reduction in vehicle trips
or miles traveled may be offset by the increase in trips and VMT associated with goods movement
in recent years. This is a particular concern in the Inland Empire which is home to large
warehouses and the origin of many of these types of vehicle trips to the rest of the Region.
Vehicle travel may change substantially
TDM strategy often focuses on changing current travel behavior. The future of vehicle travel,
however, will likely alter not only travelers’ mode preferences but also the types of trips they are
taking. If TDM practitioners are not able to adjust their methods to keep up with changing
technology and infrastructure, their strategies and programs will have little impact.
Transportation network companies (TNCs) may contribute to an increase in VTM and congestion
Since they have gained popularity, TNCs have changed the way people travel in the SCAG Region
and beyond. They can help support or encourage car free lifestyles by providing flexibility to those
who take transit or use active modes regularly, and in recent years they have begun to promote
shared ride service which decreases vehicle trips and potentially vehicle miles traveled by
grouping two or more travelers together in single vehicles. TNCs also may encourage trips that
otherwise would not be taken, and contribute to VMT in between passenger drop offs and pick
ups. According to a draft report recently completed by San Francisco County Transportation
Authority, TNCs account for 47% of the increase in vehicle miles traveled in the San Francisco
between 2010 and 2016 (San Francisco County Transportation Authority , 2018). If the TDM
industry does not work with TNCs and riders to promote shared and transit supportive trips and
discourage trips that could be taken through alternate modes, TNC use may continue to increase
VMT and add to greenhouse gas emissions.

SCAG TDM Strategic Plan
36
Conclusions Based on the existing conditions research and stakeholder outreach completed, three major
conclusions can be drawn about the current state of TDM delivery in the SCAG region at this stage
of the project:
1. Regulation, when enforced, is a major driver in shaping TDM strategy and investment put
forth by both the public and private sectors.
TDM regulation is prevalent in the SCAG Region, where many cities have official TDM
Ordinances and the SCAQMD’s Rule 2202 provides TDM delivery as an option for large
employers who are required to mitigate emissions from their employee commutes. Most of
the local ordinances are not enforced and therefore have little impact on TDM delivery, but
some have resulted in the development of TMAs/TMOs which help guide local TDM
programming. Rule 2202 is extremely influential in shaping TDM delivery in the counties it
impacts. Many individual employers base their commuter benefits programs off of the
strategies suggested as Good Faith Efforts through Rule 2202. Additionally, the County
Transportation Commissions in each of the counties affected by Rule 2202 invest substantially
in programs that are also shaped by Rule 2202, with a major focus on assisting employers
with their compliance.
2. Lack of sufficient or standardized data collection makes evaluation of program effectiveness
very difficult.
In order for SCAG to guide its stakeholders through continued and expanded investment in
TDM strategies, current programming must be able to demonstrate its success through data
collection. Aside from the AVR metrics collected by a portion of the SCAG Region’s largest
employers, the region has no set standard or metric used to evaluate TDM programming, and
in many cases data is not collected at all. Unsurprisingly, many individuals who implement
TDM in the public sector are unsure of whether or not their programs have been successful,
despite the fact that the region has invested in TDM for over thirty years. With insufficient
data and multiple styles of data collection leading to metrics that themselves are
incomparable, there is no way to understand programmatic successes or fallbacks. In a Region
as broad as this, this type of comparison is important because it allows regional stakeholders
to understand whether certain strategies or programs are more successful in certain areas
than they are in others.
Conclusions and Recommendations

SCAG TDM Strategic Plan
37
3. Technological advances provide an opportunity to collect better data and improve user
experience for TDM programs in the SCAG Region.
From collecting trip data through mobile phones to providing new modes of travel altogether,
the TDM industry has seen an influx in innovative solutions to traditional delivery-related
problems. The industry in general and the SCAG Region specifically, due to its popularity as a
test bed, has the opportunity to work with, help improve, and benefit from these innovations.
Recommendations In order to deliver TDM effectively and successfully in the SCAG Region, TDM stakeholders must
be able to build upon the strengths and opportunities listed in the previous section and, minimize
the weaknesses and threats.
The SCAG Region is home to six counties, each with its own advantages, disadvantages and
priorities surrounding transportation and TDM delivery. Because of this it is not recommended
that any individual strategy or set of strategies be implemented region-wide. Instead,
recommendations for SCAG include actions that foster standardization, coordination and
collaboration in the region on a higher level.
Set a regional standard for VMT measurement and help agencies collect useful data
Though Average Vehicle Ridership (AVR) is the clear standard of measurement for many
employers in the SCAG Region, the public sector lacks any common measurement practices.
Without a standard metric it is impossible to compare success of programs, particularly in a region
with such broad focuses. Given the passage of Senate Bill 743 and the impending focus on VMT
statewide, it is likely that both the public and private sectors will be more eager to quantify the
effects of their TDM efforts. VMT is a more commonly used metric nationwide, and as SCAG’s
RTP/SCS needs to address VMT reduction, it is natural that VMT be considered the standard for
TDM stakeholders in the SCAG Region.
It is unlikely, however, that all SCAG Region stakeholders will be able to calculate VMT in the same
way. Instead, SCAG should provide its own recommendations for VMT measurement that may
work best for various stakeholders. For example, employers who currently need to comply with
SCAQMD’s Rule 2202 likely will not have the bandwidth to undertake any large data collection
process on top of their annual survey. Since SCAQMD’s employee survey form already asks about
distance from home to work, SCAG could help employers calculate their VMT in a manner similar
to their calculation of AVR, where a “drive alone” trip counts as the number of miles between
home and work, a two-person carpool trip counts as half of the number of miles between home
and work, etc.
SCAG should study the various methods of data collection that have been used throughout the
country (as described in the forthcoming Performance Measures Memorandum) to determine a
list of 3-5 methods they can suggest to regional stakeholders.

SCAG TDM Strategic Plan
38
Provide guidance to municipalities and transit agencies who want to partner with the private sector
As the TDM and transportation industries in the private sector continue to grow, many public
sector agencies have seen promise in their offering for efficient service and more complete data
collection. The SCAG Region has seen successful partnerships between public and private agencies
along this line. The organization of partnerships between public and private agencies is often
tricky, however, requiring a lengthy legal and contracting process, resulting in different outcomes
in terms of data shared and costs incurred.
SCAG should designate best practices for working with private organizations such as TNCs,
micromobility companies and dynamic carpooling companies that help public agencies understand
what the standards have been and what these partnerships have entailed in other places
throughout the region. In particular, SCAG should encourage public agencies to request the same
level of data from private operators which will allow for the facilitation of regional studies in the
future.
Support updates to municipal programs that require regular monitoring and enforcement of TDM requirements
While the state’s CMP has helped to encourage the development of TDM ordinances throughout
the SCAG region, most of these ordinances are unenforced. In urban areas with healthy economic
bases, SCAG should encourage municipalities to update their regulation to provide for long term
monitoring and enforcement of TDM programs, requiring developers, but also tenants and
property managers after occupancy, to mitigate the VMT contributed to by their projects.
In areas where enforcement of TDM requirements may discourage economic development, SCAG
should instead support the provision of public support for TDM projects. This can be done through
the creation of TMAs and TMOs which may initially be funded publicly but ultimately can provide a
non-mandated service that developers and occupants will find useful and worth investing in.

SCAG TDM Strategic Plan
39
Acronym Name ACT Association for Commuter Transportation
AVR Average Vehicle Ridership
COG Council of Governments
ECRP Employee Commute Reduction Program
ICTC Imperial County Transportation Commission
LA Metro Los Angeles County Metropolitan Transportation Authority
LANI Los Angeles Neighborhood Initiative
OCTA Orange County Transportation Authority
RCTC Riverside County Transportation Commission
RTA Riverside Transit Agency
RTP/SCS Regional Transportation Plan/Sustainable Communities Strategy
SANDAG San Diego Association of Governments
SBCTA San Bernardino County Transportation Authority
SCAG Southern California Association of Governments
SCAQMD South Coast Air Quality Management District
SOV Single Occupant Vehicles
TDM Transportation Demand Management
TMA/TMO Transportation Management Association/Organization
TNC Transportation Network Company
VCTC Ventura County Transportation Commission
VMT Vehicle Miles Traveled
VVTA Victor Valley Transit Authority
WRCOG Western Riverside Council of Governments
A SCAG Region TDM Acronyms
SCAG TDM Strategic Plan
40
Commission, R. C. (2018). Fiscal Year 2018/2019 Budget. Riverside.
Los Angeles County Metropolitan Transportation Authority. (2010). 2010 Congestion Management
Program. Los Angeles: Los Angeles County Metropolitan Transportation Authority.
Metropolitan Council, UrbanTrans. (2010). Metropolitan Council TDM Evaluation and
Implementation Study. Metropolitan Council.
San Bernardino County Transportation Authority . (2017). Financial Report.
San Francisco County Transportation Authority . (2018). TNCs & Congestion: Draft Report. San
Francisco: San Francisco County Transportation Authority.
TRIMMS. (n.d.). Home. Retrieved from TRIMMS Trip Reduction Impacts of Mobility Management
Strategies: http://trimms.com/
References

SC A G TDM Strategic Plan and F inal Report
E TDM Technology Memo

SCAG Transportation Demand Management (TDM) Strategic Plan New Mobility and Technology Innovations Memo REVISED
July 16, 2019
Submitted to: SCAG
Submitted by: ICF and Steer

Table of Contents I. Introduction to New Mobility Technologies ................................................................................. 3 II. Categories of Innovations .............................................................................................................. 6
Ridesourcing/Transportation Network Companies (TNCs) .............................................................. 6 Carsharing and Personal Vehicle Sharing ........................................................................................ 9 Microtransit ........................................................................................................................................ 9 Micromobility.................................................................................................................................... 12 Multimodal Traveler Information Apps ............................................................................................ 13 Fare Payment .................................................................................................................................. 14 Parking Management ...................................................................................................................... 15 Others .............................................................................................................................................. 16
III. Matrix of Transportation Innovations ......................................................................................... 18 IV. Incorporating Innovation into TDM in the SCAG Region .......................................................... 19
Using Technology to Augment TDM ............................................................................................... 19 Recommended Actions for SCAG................................................................................................... 22
Appendix A ......................................................................................................................................... 24 Note: “The contents of this report reflect the views of the author who is responsible for the facts and accuracy of the data presented herein. The contents do not necessarily reflect the official views or policies of SCAG. This report does not constitute a standard, specification or regulation.”

I. Introduction to New Mobility Technologies The transportation industry has been disrupted in the past several years by an explosion of mobile application-based innovations which have created new modes of travel and new expectations from the public about what it means to be truly mobile. Travelers now have access to multiple transportation options in the palm of their hands, and the use of alternative modes is increasing, especially in congested cities. Transportation demand management (TDM) programs can capitalize on this wave by incorporating new modes into their TDM strategies, for example by using Uber or Lyft as part of a Guaranteed Ride Home program, and by drawing on the data generated by these modes to help inform policies and incentives to reduce SOV travel.
This memo provides an overview of new mobility innovations that are impacting the world of TDM (and transportation in general), illustrating through case studies how partnerships with private service providers have proven beneficial in encouraging mode shift. It also discusses some methods by which SCAG can incorporate some of these innovations in the TDM Strategic Plan for the region. Note on terminology: Much of the literature discussing transportation innovations refers to shared mobility, mobility-as-a-service, and Mobility on Demand interchangeably. Where definitions are used in this memo, they are drawn from the Society of Automotive Engineers (SAE) J3163 standard. Under this standard, shared mobility is defined as “the shared use of a vehicle, motorcycle, scooter, bicycle or other travel mode; it provides users with short-term access to a travel mode on an as-needed basis.” Mobility on Demand (MOD) is the U.S. Department of Transportation’s (USDOT) vision of an integrated system encompassing public transit as well as new mobility modes, allowing seamless travel and goods delivery, while enabling agencies to manage demand using real-time data streams. Mobility-as-a-Service (MaaS) is a similar concept, but focuses solely on travel rather than movement of people and goods; it is also often associated with the concept of an integrated, subscription-based payment for mobility services. In this memo, providers of shared mobility services will often be referred to as MOD service providers.

SCAG TDM Strategic Plan New Mobility and Technology Innovations Memo
4
II. Contributors In addition to the general research conducted to develop this Memorandum, interviews were conducted with six technology companies.
Overview Six technology firms were interviewed as part of the project. The purpose of the interviews was to explore:
• Their understanding of TDM a as strategy or concept to reduce vehicle trips; • How they might support TDM policies and programs in the SCAG region; • The role they play in reducing SOV trips; • Existing public private partnerships; and • Mobile ticketing or integrated payments. The tech firms included both new mobility operators and platforms. Interviewees included individuals from Bird (shared escooters), Lime (shared bikes, ebikes and escooters), Padam (microtransit platform), Populous (new mobility data platform), Ride Amigos (Commuter Management & Ridesharing Solutions) and Transit (multi-modal trip planner).
Understanding of TDM Tech companies’ understanding of TDM varied considerably. Some individuals were very familiar with the concept, others quite familiar and some not familiar at all. This largely depended on the individual’s background, rather specific organizational knowledge.
How to support TDM policies and programs Tech firms varied in their response in how to support TDM policies and programs. Support which the companies discussed they provide included informing users about alternatives to car travel, provision of alternative modes to car use, first and last mile solutions, a TDM toolkit for cities and access to data about use of new mobility services for cities.
Role in reducing SOV trips Tech firms provided similar responses in how their services reduce SOV trips. Their role includes informing users about alternatives to SOV travel, facilitating reductions in SOV trips by providing a realistic, convenient and cost-effective alternative for both complete trips and first/last mile trips, considering the impact of policy changes for new mobility on mode choice through data.
Public private partnerships All tech firms we spoke with talked about the importance of working with local municipalities and in some cases transit agencies. To a lesser extent firms have worked with regional government, although most recognised a need to work with regional governments in the future.
Tech firms talked about a range of successes in partnering with governments and agencies including air quality challenges, leveraging data from APIs to present trip planning to users, helping cities to understand mobility travel patterns, supplementing public transit with on-demand services and helping designate parking areas for micromobility.

SCAG TDM Strategic Plan New Mobility and Technology Innovations Memo
5
There were also a number of challenges which were highlighted including finding the right people to talk to, a lack of internal communication within municipalities, arbitrary vehicle caps, slow speed of negotiations due to bureaucracy and red-tape. Infrastructure, or rather a lack of infrastructure was also noted as a challenge for micromobility operators.
Tech firms suggested that one role of regional government could be to coordinate data at a regional level, potentially providing an ability to analyse and make sense of data, which may not be possible on a city level. Regional government could also provide some coordination or guidance in terms of policy development, permitting and consideration of vehicle numbers.
Examples of mobile ticketing or integrated payments Although integration of payment with transit was agreed to be important, only a minority of tech companies had explored integrating payments with transit and where this has been implemented it has been on a city by city basis.
Integration with other modes Integration with other modes was noted to be important by all tech companies, with individual companies mostly early in their journey of integrating with other modes, and some doing this by adding modes to their own platforms, rather than integrating existing services. There was a general comment that it is important for the public sector to be involved in facilitating this integration.

III. Categories of Innovations
Ridesourcing/Transportation Network Companies (TNCs)
Ridesourcing—in the form of transportation network companies (TNCs) such as Uber and Lyft—has been the single largest disruptor of the transportation industry. Ridesourcing refers to a single rider using a TNC, while ridesplitting refers to shared rides, such as those offered by UberPool or Shared Lyft rides. Pooled rides are cheaper than single rides, and can help offset any increase in VMT caused by ridesourcing. While there are several studies showing that TNCs contribute to congestion and may be a cause of a decline in transit ridership,1 TNCs are also playing a valuable role in complementing transit service through partnerships with transit agencies and municipalities.
Partnerships with mobility services can help transit agencies provide trips that are low-frequency, high-cost, and/or low-ridership, and are difficult to serve with high-capacity modes (bus or rail) in a cost-effective manner. These partnerships have largely been formed around the following goals:
First-mile/last-mile connections
On-demand, door-to-door solution providers help solve the long-standing issue of how to get passengers to and from transit stations to their ultimate destination. Examples of this include Pinellas Suncoast Transit Authority, which subsidizes half the fare (up to $3) of rides to and from local bus stops using Uber and a local taxi provider under its Direct Connect program, and King County Metro, which uses Uber and Lyft for its Guaranteed Ride Home program.
Guaranteed Ride Home
Some TDM programs have added TNCs to their Guaranteed Ride Home (GRH) programs. Guaranteed Ride Home programs provide reimbursement for carpoolers, vanpoolers, or people who take transit, walk or bike to work to access a free ride home in case of an emergency. Traditionally GRH programs have reimbursed the cost of a taxi or rental car; however, some areas are now including TNCs in their GRH programs. King County Metro and LA Metro, for example, use both Uber and Lyft in their GRH program.
1 See for example, UC Davis’ 2017 working paper Disruptive Transportation: The Adoption, Utilization, and Impacts of Ride-Hailing in the United States or SFCTA’s 2018 report on TNCs & Congestion.
Ridesourcing services are prearranged and on-demand transportation services for compensation in which drivers and passengers connect via digital applications. Digital applications are typically used for booking, electronic payment, and ratings.
Ridesplitting refers to ridesourcing services offering shared rides for more than one traveler.
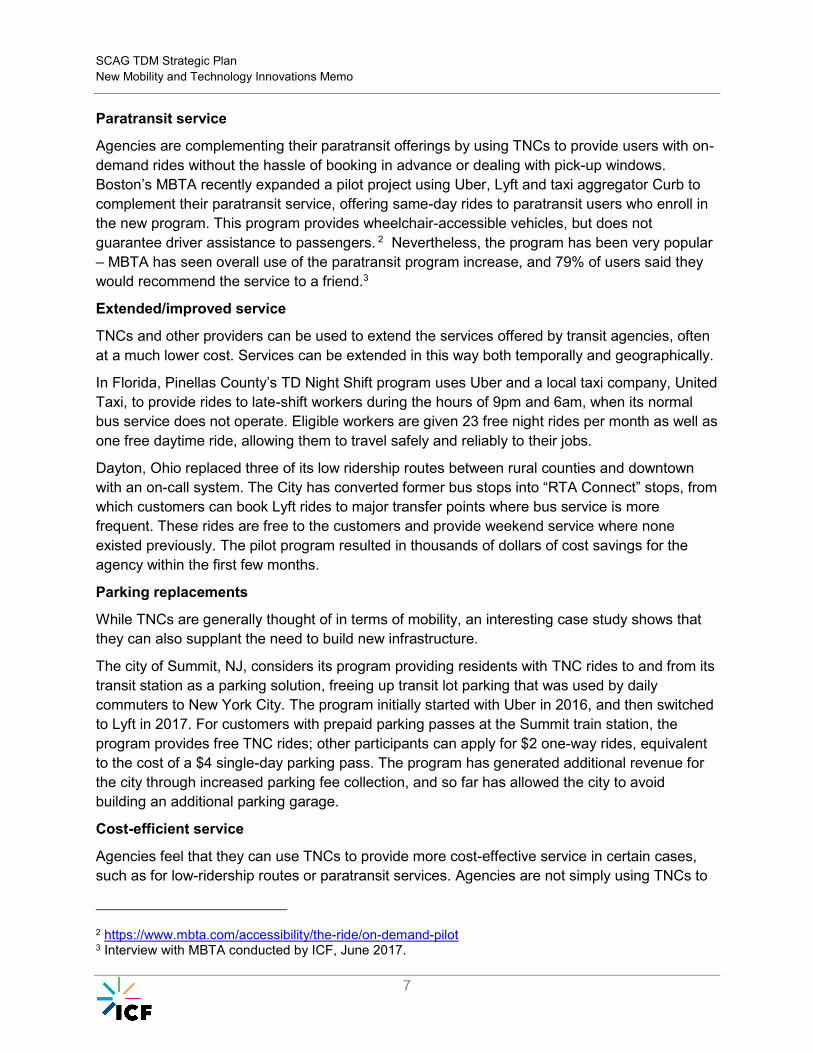
SCAG TDM Strategic Plan New Mobility and Technology Innovations Memo
7
Paratransit service
Agencies are complementing their paratransit offerings by using TNCs to provide users with on-demand rides without the hassle of booking in advance or dealing with pick-up windows. Boston’s MBTA recently expanded a pilot project using Uber, Lyft and taxi aggregator Curb to complement their paratransit service, offering same-day rides to paratransit users who enroll in the new program. This program provides wheelchair-accessible vehicles, but does not guarantee driver assistance to passengers. 2 Nevertheless, the program has been very popular – MBTA has seen overall use of the paratransit program increase, and 79% of users said they would recommend the service to a friend.3
Extended/improved service
TNCs and other providers can be used to extend the services offered by transit agencies, often at a much lower cost. Services can be extended in this way both temporally and geographically.
In Florida, Pinellas County’s TD Night Shift program uses Uber and a local taxi company, United Taxi, to provide rides to late-shift workers during the hours of 9pm and 6am, when its normal bus service does not operate. Eligible workers are given 23 free night rides per month as well as one free daytime ride, allowing them to travel safely and reliably to their jobs.
Dayton, Ohio replaced three of its low ridership routes between rural counties and downtown with an on-call system. The City has converted former bus stops into “RTA Connect” stops, from which customers can book Lyft rides to major transfer points where bus service is more frequent. These rides are free to the customers and provide weekend service where none existed previously. The pilot program resulted in thousands of dollars of cost savings for the agency within the first few months.
Parking replacements
While TNCs are generally thought of in terms of mobility, an interesting case study shows that they can also supplant the need to build new infrastructure.
The city of Summit, NJ, considers its program providing residents with TNC rides to and from its transit station as a parking solution, freeing up transit lot parking that was used by daily commuters to New York City. The program initially started with Uber in 2016, and then switched to Lyft in 2017. For customers with prepaid parking passes at the Summit train station, the program provides free TNC rides; other participants can apply for $2 one-way rides, equivalent to the cost of a $4 single-day parking pass. The program has generated additional revenue for the city through increased parking fee collection, and so far has allowed the city to avoid building an additional parking garage.
Cost-efficient service
Agencies feel that they can use TNCs to provide more cost-effective service in certain cases, such as for low-ridership routes or paratransit services. Agencies are not simply using TNCs to
2 https://www.mbta.com/accessibility/the-ride/on-demand-pilot 3 Interview with MBTA conducted by ICF, June 2017.

SCAG TDM Strategic Plan New Mobility and Technology Innovations Memo
8
replace service and save money – rather, they are channeling those cost savings into improving service elsewhere to improve the quality of their core services and routes. In some cases, the partnerships augment service rather than replace it. This can result in cost savings, but can also lead to an increase in the number of trips, as illustrated by MBTA’s on-demand paratransit program. While the average subsidy per ride using TNC partners is $9 as opposed to $31 for traditional paratransit (a 70% decrease), customers have embraced the ability to make spontaneous trips and are in fact taking 28% more trips than they used to, resulting in overall program savings of only 3%.
Case Study: Marin County’s first-mile/last-mile partnership with Lyft Marin County, California offers a case study of a first-mile/last-mile partnership that is achieving its goals of encouraging carpooling to provide first-mile/last mile access to the Sonoma-Marin Area Rail Transit (SMART) rail service. When the SMART service launched, the Transportation Authority of Marin (TAM) began receiving requests to provide shuttles to major employment locations. As the County is low-density, shuttle costs were being estimated at $2,500/hour, so TAM hired a TDM consultant to look for alternatives.
TAM created the “GETSMART17” Lyft Pilot Program, which was launched to coincide with the opening of the SMART system. The program provided $5 off all LyftLine rides to and from SMART stations, and was funded by a $10 annual Vehicle Registration Fee passed by Marin County Voters in 2010 to "maintain local streets and pathways, improve transit for seniors and persons with disabilities and reduce congestion and pollution". The program budget was $70,000, which was under the federal threshold requiring formal procurement. ADA rides were provided through a partnership with a non-profit, Whistlestop, but had to be booked in advance.
TAM marketed the program online and through social media, elected official newsletters, email chains, and city newsletters. A news story in the local paper received traction as well. TAM also put up banners in the SMART stations advertising the program, and Lyft send out reminders to users in Marin County every month (coinciding with a new promo code every month).
The program has been considered an overall success. Data from the pilot program showed that 95% of the riders were repeat riders, and the majority of rides were less than 5 miles and between 5-10 minutes in duration, indicating that they were being used for first-mile/last-mile service. The program also found that the cost of the LyftLine subsidies was significantly less than the cost of providing a traditional shuttle, although the ADA rides, which were not provided by TNCs, cost more than the remaining rides even though they accounted for only 8% of the total rides. Switching the ADA rides also to TNCs could result in substantial cost savings as demonstrated by MBTA’s pilot program using TNCs to offer paratransit service.
TAM’s program has been successful as a first-mile/last-mile measure since it acted as an extender of the SMART rail line (and by extension, connections to San Francisco). Other areas that have implemented first-mile/last-mile subsidies for TNCs have seen that riders are often able to bypass transit stations and use the service to go straight to their destinations. This anecdotal evidence shows that program design and geofencing are very important in these

SCAG TDM Strategic Plan New Mobility and Technology Innovations Memo
9
types of partnerships in order to ensure that they are used as first-mile/last-mile rides rather than as a substitute for public transit.
Carsharing and Personal Vehicle Sharing
Carsharing can help encourage a car-free lifestyle by allowing users access to a vehicle when it is needed. Business-to-consumer carsharing, where the fleet of vehicles is owned and maintained by a business, consists of both roundtrip carsharing, where the vehicle must be returned to the same place it was picked up, and free-floating one-way carsharing, where the vehicle can be returned anywhere within a given geographic area. Recently, another model known as peer-to-peer (P2P) carsharing has emerged, in which privately-owned vehicles are temporarily shared with other members of the P2P company. Getaround and Turo are examples of the P2P carsharing model.
Municipalities can support carsharing by providing on-street carsharing parking as well as parking spots in transit park-and-ride lots. BART in San Francisco converted monthly permitted parking spaces in its stations to carshare parking spaces. Portland, OR allocated on-street parking to carsharing companies through an auction system, while Austin, TX provides both on-street parking as well as allowing carsharing vehicles to park at city meters for free. New York City recently began a two-year pilot program which has dedicated both on street and municipal lot parking spaces to car share vehicles.
Microtransit
Microtransit is a form of demand-responsive transit, typically using minibuses. Some providers, such as Via, determine routes dynamically based on the origins and destinations of the riders. Other providers, like Chariot, run on fixed routes, which are added based on crowdsourcing – users are able to vote for routes they would like to see. Microtransit offers several benefits for
Carsharing offers members access to vehicles by joining an organization that provides and maintains a fleet of cars and/or light trucks. These vehicles may be located in neighborhoods, public transit stations, employment centers, etc. The carsharing organization typically provides insurance, gasoline, parking, and maintenance. Members who join a carsharing organization typically pay a fee each time they use a vehicle.
Personal vehicle sharing is defined as the sharing of privately owned vehicles, where companies broker transactions between vehicle hosts and guests by providing the organizational resources needed to make the exchange possible (e.g. technology, customer support, driver and motor vehicle safety certification, auto insurance).
Microtransit is defined as a privately or publicly operated, technology-enabled transit service that typically uses multi-passenger/pooled shuttles or vans to provide on-demand or fixed-schedule services with either dynamic or fixed routing.

SCAG TDM Strategic Plan New Mobility and Technology Innovations Memo
10
TDM programs: it can be used to complement transit, by replacing low-ridership, high-cost routes or offering first-mile/last-mile service, and it can also be used by employers in the place of traditional shuttles, allowing dynamic routing and more features for users (such as tracking vehicle location). Microtransit services are also often eligible for commuter benefits.
The major players in the microtransit arena tend to offer customer-facing services (akin to pooled rides offered by TNCs) but they also offer business-to-business services, wherein they work with employers to set up routes that can act as first-mile/last-mile service to transit hubs for employees. Microtransit providers are also working with transit agencies, as in Via’s partnership with LA Metro as part of the MOD Sandbox grant – this program will allow customers to book rides with Via from three LA Metro stations, and will include payment integration with LA Metro’s TAP card. Finally, cities have been looking at microtransit as a way to create or expand public transit, as described in the case study below.
Case Study: Via and Arlington, TX Arlington, TX, a commuter suburb of Dallas and Fort Worth, launched a pilot program with Via in December 2017 to replace the Metro ArlingtonXPress, a commuter bus service that ended on December 31, 2017. The pilot was funded through a $600,000 FTA 5307 Urbanized Formula Grant along with $322,500 of local funds; Via charges the city per vehicle hour of service. Under the program, the bus service was replaced with a Via geofence, within which users can travel for a $3 flat fare. The geofence expanded the service area of the previous commuter service. Via used 10-passenger vans along with a few paratransit vehicles. Rides could be ordered via smartphone, but there was also a call center available to book rides for people without smartphone access. While the rides could not be paid for with cash, there was an option given for riders to get reloadable credit cards that were accepted by Via.
This program has been extremely successful, seeing around 5000 rides per month with a 97% customer approval rating. Data shows that almost half of the rides are going to the Centreport Station, which is

SCAG TDM Strategic Plan New Mobility and Technology Innovations Memo
11
outside of the geofence but still within the bounds of the program, from where they are able to connect to the Trinity Railway Express with service to Dallas and Fort Worth.
Notably, Via provided Arlington with a detailed data dashboard, with multiple updates per day. Some of the metrics provided include:
• number of completed rides
• number of active drivers
• gross hours of service
• net hours
• net utilization of vehicles
• average duration of rides
• average speed of rides
• percent of rides completed
• percent of proposed rides that were accepted
• average estimated time of arrival (ETA) given to passengers upon querying rides
• average error of the ETA initially given
• average trip duration
• number of rides to/from center station
• utilization by area
• heat maps of where ride proposals and rejections are
• heat maps of where vehicles were filled up
• heat maps of where there are empty vehicles
• average ETA by area
Based on this data, Arlington, TX is showing higher farebox recovery for the Via service than the previous transit service, and is able to provide access where there was none before.

SCAG TDM Strategic Plan New Mobility and Technology Innovations Memo
12
Micromobility
Bikesharing and scooter sharing together are increasingly being referred to as “micromobility”. Micromobility has seen tremendous growth in the last few years. In fact, adoption rates for micromobility are outpacing the rates seen for TNC adoption in the early years. Electric bikes and scooters reduce the effort required to use these modes and may improve accessibility to persons unable to use manual modes. Electric scooters, in particular, are proving very popular, even as cities are experimenting with regulations and policies to govern them. Micromobility options provide a convenient way to undertake short trips. The explosion of micromobility underscores the need for more bicycle- and scooter-friendly infrastructure such as bike lanes, and the data from these modes can help planners understand where to locate bike lanes as well as how to provide access in traditionally underserved areas. A recent study indicates that scooters are being adopted by lower-income groups, a demographic that has not benefitted from docked bikeshare systems.4 Station-Based Bikeshare Station-based bikesharing allows users to access bicycles on an as-needed basis for roundtrip or one-way point-to-point mobility. Station-based bikesharing kiosks are typically unattended, concentrated in urban settings, and offer one-way station-based service (bicycles can be returned to any kiosk). The majority of bikesharing operators cover the costs of bicycle maintenance, storage, and parking. Generally, trips of less than 30 minutes are included within the membership fees.
Dockless Bikeshare and Scooter Share Dockless modes (bikesharing and scooter sharing) are relatively new and many cities are actively implementing pilots and policies in response to the rapid growth of these services in the public right-of-way. As such, many policies and implementation practices emphasize curb space management and capping the number of bicycles and scooters. Notable dockless bikesharing and scooter sharing implementations include pilot programs in Portland, San Francisco, Santa Monica, and Washington, DC. Dockless providers have shown themselves to be more open to
4 https://medium.com/populus-ai/the-micro-mobility-revolution-95e396db3754
Bikesharing provides users with on-demand access to bicycles at a variety of pick-up and drop-off locations for one-way (point-to-point) or roundtrip travel. Bikesharing fleets are commonly deployed in a network within a metropolitan region, city, neighborhood, employment center, and/or university campus.
Scooter sharing allows individuals access to scooters by joining an organization that maintains a fleet of scooters at various locations. Scootersharing models can include a variety of motorized and non-motorized scooter types. The scooter service provider typically provides gasoline or charge (in the case of motorized scooters), maintenance, and may include parking as part of the service. Users typically pay a fee each time they use a scooter. Trips can be roundtrip or one-way.

SCAG TDM Strategic Plan New Mobility and Technology Innovations Memo
13
sharing data with municipalities than TNCs have been; furthermore, cities are requiring data sharing as part of these pilot programs.
Multimodal Traveler Information Apps
A key step in promoting alternative modes is to ensure that travelers have information about them, including location, cost, and real-time arrival information. While many travelers use trip planners to navigate their journeys, there is often a lack of integration with shared mobility options. Enhanced integration and traveler information can simplify modal connections and encourage the use of multiple transportation services. Transit App is a popular example of a multimodal traveler information app, showing real-time public transit arrival times and maps for both bus and rail, as well as locations of carsharing, docked and dockless bikes, and scooters. Free2Move is a mobile application developed by PSA Group that allows customers to access multiple shared mobility service providers and compare availability and prices within a single application. As of November 2018, Free2Move carsharing, car2go, Bird, Lime, Skip, Jump, and Capital Bikeshare were all available on the app. As the shared mobility market consolidates, previously single-mode apps are expanding to encompass more modes, although they are still restricted to their own proprietary systems. For example, the Uber app also shows JUMP dockless electric bikes, which were purchased by Uber in April 2018. Lyft has expanded into scooters, which are visible on its app.
Beyond just displaying location and availability information, multimodal apps are steadily adding features, including:
• The ability to book a trip, either by launching the appropriate app, or through deep linking (booking within the app) – Transit App has a partnership with Masabi that allows users to purchase mobile tickets for public transit directly through the app.5
• Multimodal trip planning, both providing trip options on different modes, and trip options with multiple modes for the same trip – As part of the MOD Sandbox program, the Tri-County Metropolitan Transportation District of Oregon (TriMet) is developing an Open Trip Planner project that creates a platform integrating transit and shared mobility services. TriMet is building on its existing trip planning app to incorporate shared mobility and data sharing. By integrating data from multiple providers, the project will allow users to plan multimodal trips that bridge first/last mile gaps to public transportation.
5 http://www.masabi.com/2017/10/09/transit-app-integrate-masabis-justride-sdk-to-offer-integrated-ticketing-to-agencies-in-north-america/
Mobility applications include an array of services that assist users in planning or understanding their transportation choices and may increase their access to alternative travel modes. There are several subcategories of mobility apps.
Those discussed below fall into the categories of public transit apps, real-time information apps and trip aggregator apps.

SCAG TDM Strategic Plan New Mobility and Technology Innovations Memo
14
Case Study: Transit App Transit App is a multimodal aggregator that aims to encourage travelers to use public transit and reduce SOV trips. Its default screen shows the user nearby public transit lines and real-time arrival information. Transit App works with transit agencies to integrate real-time data, but in some cases has also become the “official” app of the agency, in place of having the agency create its own app. Boston’s MBTA endorsed Transit App as its official app, and directs users to download the app for real-time information.
In addition to public transit info, Transit App also includes carsharing, bikesharing, scooters and TNCs , in some cases allowing booking completely within the app. Transit App is working on a partnership with Masabi to allow users to book public transit tickets directly from the app – this is being rolled out in January 2019 by St. Catharines Transit Association in Ontario. They also recently announced a trip planning function that will integrate real-time TNC information with public transit arrival times to create seamless first-mile/last-mile transfers.
Fare Payment Improving the fare payment experience for transit and alternative modes helps remove barriers to the usage of alternative travel modes. There have been many advances in fare payment in recent years.
Account-Based Systems Transit systems are moving away from traditional card-based systems, where value is stored on a card and deducted upon use, towards account-based systems, where the value is stored on an account in the backend system. This is the first step in implementing further innovations such as open fare payment, integrated fare payment, and ticketless travel.
Open Fare Payment Transport for London and Chicago’s CTA have implemented open fare payment systems. In these systems, travelers do not need to purchase a specific fare card to use the transit system; instead, they can use a device with near-field communication (NFC) such as a contactless credit card, or a wallet stored on an NFC-enabled smartphone, such as Apple Wallet or Android Pay. This type of system makes it easy for short-term visitors to use transit systems without worrying about buying a transit card, and reduces fare card-associated costs for the transit system. Open
Figure 1. Transit App screenshot showing Transit + Shared Mobility (Source: Transit App)

SCAG TDM Strategic Plan New Mobility and Technology Innovations Memo
15
fare payment systems can be set up to automatically apply monthly caps or special pricing on the backend.
Integrated Fare Payment Integrated fare payment is the ability to pay for multiple modes using the same payment mechanism. This is one of the keys to enabling seamless multimodal travel and mobility on demand. LA Metro just announced that the Metro Bike Share program will accept its Transit Accept Pass (TAP) card, now rebranded as TAPforce after its conversion to an account-based system.6 They are also working on integrated fare payment with Via as part of the MOD Sandbox grant. Similarly, Chicago is integrating its Divvy bikeshare system with the CTA app to enable users to book and pay for bikeshare the same way they book public transit. Uber and Masabi, which provides mobile ticketing services to several transit agencies including MTC in New York, announced a partnership in April 2018 whereby Uber users will be able to book and display Masabi customer agencies’ transit tickets through the Uber app.
Parking Management Parking can be an important lever for TDM programs. Managing demand for parking can encourage people to seek out modes of transportation aside from driving. Parking management can be done physically by changing parking supply (through eliminating parking minimums, for example) or by decoupling the price of parking from the price of rental properties.
Dynamic Parking Pricing Cities are also applying technology to manage parking through performance parking pricing initiatives. These programs rely on parking availability data to dynamically adjust parking pricing to manage demand, acquired either through sensors embedded in parking spaces, as in San Francisco’s SFpark project, or by using existing data sources such as meter payment data and CCTV coupled with data analytics, as in Washington, DC’s parkDC project. These projects aim to reduce congestion due to cruising for parking and encourage mode shift. Both SFpark and parkDC provide real-time parking information to customers via a mobile app, and are exploring ways to integrate this information into more widely used apps such as Google Maps and Waze.
Parking Apps Several parking apps are available that show real-time parking availability and allow users to compare options, reserve spots in advance, and pay for parking through the app. The apps give users detailed information about available parking spots such as price, hours, height restrictions, distance from chosen location, wheelchair accessibility, and amenities such as valet parking or EV charging. Users can search for hourly parking, daily parking, and monthly parking, with certain services providing online discounts at some locations. In some cases, the apps provide QR codes to scan to enter and exit the garages; in other cases, drivers still need to get
6 http://www.govtech.com/fs/transportation/LA-Metro-Payment-Card-Now-Accepts-Bike-Share-Service.htmll

SCAG TDM Strategic Plan New Mobility and Technology Innovations Memo
16
tickets from parking attendants but can show their app-based receipt while exiting. These services get their information through agreements with parking venues.
These apps typically cover only off-street parking, including parking garages, airports, train stations, and venues such as tourist attractions, stadiums, restaurants and hotels. On-street parking, which tends to be publicly operated, is not generally covered, although ParkMobile allows users to pay for on-street parking.
Others
Peer-to-Peer Ridesharing/Dynamic Carpooling Casual carpooling, or slugging, has been common in Washington, DC, San Francisco, and other cities for years. In this form of carpooling, drivers pick up riders at a designated gathering point in order to use an HOV lane or avoid tolls. With technology, casual carpooling has evolved into dynamic carpooling, also known as peer-to-peer ridesharing, which uses mobile apps to match drivers and passengers on a per-trip basis. The apps also include feedback and rating on drivers and passengers, as well as automatic payment systems whereby riders split the cost of the ride with the drivers. Some apps also provide coverage for a guaranteed ride home when someone has carpooled in the morning and is unable to find a match to get home in the evening.
Dynamic carpooling encourages carpooling by eliminating the barriers inherent in traditional carpooling, namely the need to schedule rides in advance and commit to a round-trip carpool so as not to strand the passenger. This is particularly useful in the context of daily commutes, when people may not have the same schedule in the mornings or evenings.
Dynamic carpooling apps such as Scoop and Metropia DUO have customer-facing apps as well as platforms to work with employers. In San Francisco, Bay Area Rapid Transit (BART) is partnering with Scoop to match drivers and passengers with similar BART commutes. By matching drivers and passengers, Scoop can provide carpool verification and help with the enforcement of reserved carpool parking. A project in Northern Texas is using Carma to verify the number of passengers in a vehicle to qualify for HOV toll credits.
TDM Tools and Platforms Web-based tools and platforms can help promote the use of alternative modes by helping commuters plan multimodal trips, matching people with other drivers or passengers, and providing incentives or gamification.
• CarFreeAtoZ is an Arlington, VA trip planner that displays multimodal trip options along with context such as money saved, calories burned, or CO2 emissions reduced.7
• Rideamigos is a cloud-based TDM toolkit, providing a platform to implement TDM programs on a regional, employer, or campus level. It also provides a community of
7 https://www.carfreeatoz.com/planner

SCAG TDM Strategic Plan New Mobility and Technology Innovations Memo
17
TDM experts that can share best practices and support the implementation of a robust TDM program. Rideamigos provides information to commuters on alternative commutes, including multimodal trip planning (including shuttles, microtransit, TNCs), rideshare matching, guaranteed ride home programs, etc. It offers tools for incentives, points-based programs, and commuter challenges as well as automatic trip logging for commuters.
• Metropia is an app that applies behavioral economics strategies to influence traveler behavior. Users of the app are offered reward points to shift their travel away from peak periods, with progressively higher rewards offered for more dramatic shifts. These rewards can be redeemed for gift cards to stores and local restaurants.8 Metropia has partnered with BART for phase II of the BART Perks program, which offers riders incentives to shift their travel away from peak morning rush hours.9
Historically, incentive platforms such as these relied on users logging their trips manually online or through the applications. More recently. technology companies such as Miles have begun exploring automatic trip logging that senses users’ travel modes and distances through their cell phones.
Connected and Automated Vehicles Connected vehicles (CVs) and automated vehicles (AVs) have the potential to radically alter how people travel, with impacts that are uncertain. AVs could result in an increase in VMT and possibly congestion, by facilitating routine long-distance trips, expanding the market for car travel to groups currently precluded from driving (such as people with disabilities, children, the elderly), and/or increasing the amount of empty or “deadhead” miles. On the other hand, CV technology could help mitigate any VMT gains by facilitating efficient routing, shared rides, and coordinated parking. If AVs are coordinated and centrally deployed, their travel patterns could be actively managed to reduce travel times, congestion, and total VMT. Further, if rides are “pooled” together such that independently ordered trips are efficiently grouped, VMT could be reduced even if total passenger trips increased— although the adoption rates of such pooled services versus luxury single-rider services are unknown. Finally, the impacts of AV usage on VMT and congestion depend on its effects on mode choice (e.g., the extent to which AV travel competes with public transit, bicycling, or walking). Many speak of the ideal future of vehicles as being “shared, connected, automated and electric” to account for these factors. Public agencies can play a role in shaping automated vehicle trajectories by putting into place policies to promote shared rides. These could include rebates for shared rides, congestion pricing for single riders, access to HOV lanes for pooled rides, and so on.
8 https://metropia.com/metropia-mobile-app 9 https://www.bart.gov/guide/perks

IV. Matrix of Transportation Innovations The table below summarizes the projects that have been mentioned in the section above along with which categories of innovations are being implemented in each project.
Project Multimodal Travel App
Fare Payment
TNCs Micro-transit
Carpool Micro-mobility
Parking Mgmt
GETSMART17 Lyft Pilot Project (Marin County)
PSTA’s TD Connect Program
Summit, NJ-TNC partnership
Via and Arlington, TX
Via and LA Metro
Santa Monica Shared Mobility Device Pilot Program
Washington, DC Dockless Pilot Program
Transit App and MBTA
Transit App and St. Catherine’s
Transit App and Masabi
Free2move
LA Metro and Metro Bike
CTA and DivvyBike
Uber and Masabi
parkDC
SFpark
Scoop and BART

SCAG TDM Strategic Plan New Mobility and Technology Innovations Memo
19
V. Incorporating Innovation into TDM in the SCAG Region
Using Technology to Augment TDM
Opportunities
Using Data for Planning Purposes The data generated by these new mobility services can provide a wealth of insight for municipalities to use for managing real-time travel and operations, as well as in transportation planning. Specifically, as shared mobility and micromobility services grow, usage data can help agencies better prioritize infrastructure projects (for example, more bike lanes and/or loading zones for TNCs) and make policy decisions considering new modes and travel behavior.
While cities were generally unsuccessful in forcing the early wave of TNCs to share data, the advent of micromobility services such as scooters and dockless bikes has given rise to a plethora of data sharing agreements. As a result, several third-party companies have emerged that are using mobility data and packaging it into analytical tools that help municipalities with their transportation planning. Remix and Populus Mobility Manager are two such tools. Remix provides a visualization platform, Remix for New Mobility, that incorporates shared mobility data to allow decision makers to understand how services are being used; it also has a separate component, Remix for Streets, which helps planners evaluate and model new infrastructure by considering usage patterns revealed by shared mobility data.10
Populous also provides two key data sources to planners. The first is accurate survey data that reflects how new services are influencing the behaviors of the end user. This data is powerful for not only informing TDM policies, but also monitoring the impacts of policy updates or amendments – especially those that could potentially shift people away from SOV to other modes. The second element, Mobility Manager, actively monitors live mobility data from mobility operators and allows cities to understand how they complement existing modes as well as where changes in provision/deployment need to be made.
Swiftly is another analytical platform that helps transit agencies make better fleet predictions and thereby improve operations. Boston’s MBTA recently selected Swiftly to power its real-time transit arrival predictions, improving their accuracy from 75% to 84%.11 In addition, Swiftly provides tools for transit planners to improve service.
These platforms allow cities and agencies to gain from the rich data being generated by new mobility services, without having to invest in costly software development or hire data scientists.
10 https://blog.remix.com/first-platform-to-manage-new-mobility-and-design-streets-4ff6e5b1cf39 11 https://medium.com/mbta-tech/the-t-just-launched-improved-bus-predictions-df17ecd27db

SCAG TDM Strategic Plan New Mobility and Technology Innovations Memo
20
Improving Access to Alternative Modes The innovations described above are largely smartphone-driven, providing real-time, reliable information on the location of modes, arrival times, and cost. Simply by making information available, technology is making it easier than ever for travelers to become aware of alternative modes. As traveler information apps, mobile ticketing, and fare payment integrations advance, more barriers to multimodal travel will be overcome, resulting in easier and more seamless mobility. Furthermore, the distributed nature of shared mobility can provide service in previously underserved areas and help advance transportation equity, although some challenges remain.
Challenges
Data Sharing Agreements with MOD Providers MOD providers have traditionally been reluctant to share data with municipalities. TNCs in particular are wary of providing data that may reveal a competitive advantage in routing algorithms, for example. While micromobility providers have shown themselves to be more willing to share data, and in fact this has been a requirement in their operating agreements with municipalities, accessing detailed trip-level data from shared mobility providers is a challenge that needs to be overcome. Aside from proprietary information, the other challenges include providing granular data without compromising the privacy of travelers or drivers.
Procurement Processes Analytics platform vendors flagged the procurement process as a potential risk to being able to use these tools for planning, stating that since these tools are more overarching in nature, rather than focused on a specific project, procurement is often a challenge. Similarly, shared mobility vendors have expressed a desire for streamlined procurement, as processes tend to be long and bureaucratic, and not flexible enough to accommodate the changes in this fast-developing field.
Social Equity and Environmental Justice Concerns with MOD Service Providers New mobility technologies, while offering an unprecedented level of choice for most travelers, also have some challenges when it comes to providing equitable service for underserved communities. Recent reports such as the Mobility on Demand Operational Concept Report have highlighted several key equity challenges associated with MOD service providers.12 The fact that most of these advances are dependent on smartphones, while proving convenience for much of the population, presents a challenge to low-income and elderly populations, who may not have access to smartphones or data connections. Additionally, many of these services require payment by credit card, an additional barrier for unbanked or underbanked populations, not to mention the fact that many shared mobility options tend to be more expensive than public transit. Providing access to people with limited mobility or disabilities can also be a challenge, as not all TNCs provide wheelchair-accessible vehicles, or when they do, these may have
12 Shaheen, Cohen, Yelchuru and Sarkhili, Mobility on Demand Operational Concept Report, USDOT ITS Joint Program Office, 2017.

SCAG TDM Strategic Plan New Mobility and Technology Innovations Memo
21
longer wait times than standard vehicles. Finally, there have been reports that some TNC customers face racial discrimination, with studies showing that African-American passengers are twice as likely to have their rides cancelled, or wait longer than others to be picked up.
As public agencies partner with shared mobility providers, many of them are required to ensure protection for underserved communities. As a result, solutions are emerging to combat some of these equity challenges. For example, lack of access to smartphones can be overcome by the use of call centers for ordering TNCs, or digital information kiosks in public spaces that show availability of different modes and allow booking. Some services also allow customers to pay using prepaid cards which can be recharged at retail outlets. As mentioned in a previous section, dockless modes are showing promise in reaching underserved communities, with uptake rates higher than even docked bikeshare. However, much remains to be done to ensure that all communities are able to access the benefits of shared mobility, and this remains a key challenge for agencies seeking to partner with MOD service providers.
Lack of Resources or Skills in Agencies Taking advantage of newer technologies often entails not only new skills on the part of agency employees, but time and labor for training, maintenance, and updating existing plans and processes. This can be a challenge for smaller agencies to implement, even when the technology itself might be free.
Safety With the growing popularity of micromobility comes the challenge to keep the roads safe for all users. Infrastructure should be modified to provide safe passage for pedestrians, bicycles and scooters – this includes expansion of bike lane networks as well as designated parking spots for dockless bikes and scooters to prevent obstacles for pedestrians. Awareness campaigns are also needed, both for motorists on how to share the road and be on the lookout for smaller vehicles, and for users of micromobility on the use of sidewalks, bike lanes, and helmets. Municipalities should take action to ensure that new modes improve both mobility and safety for users.
Uncertainty Around MOD Service Provider Business Models and Viability Many MOD service providers are startups, and may or may not be financially viable. There have been several instances where companies have gone out of business, such as Bridj, which closed its US operations in 2017, or Chariot, which was acquired by Ford in 2016 but announced in January 2019 that it was shutting down its service. Thus, there is some risk that public agencies may enter into agreements with private sector providers who are unable to provide the contracted service. Agencies should take into account business model risks while evaluating partnerships. However, most programs using these service providers provide additional and/or improved mobility options to commuters, rather than replacing core services. Therefore, even with this uncertainty, agencies may still experience a net benefit through these partnerships in the form of expanded mobility for customers, increased multimodal travel, and cost reductions for transit agencies.
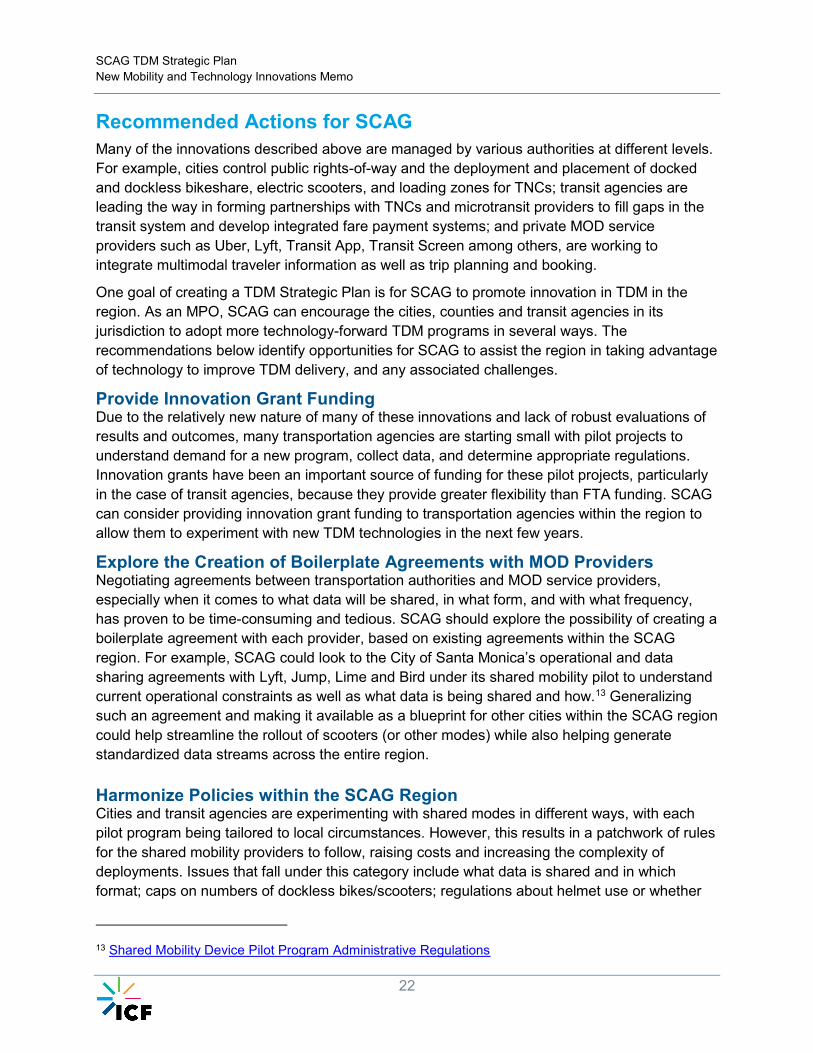
SCAG TDM Strategic Plan New Mobility and Technology Innovations Memo
22
Recommended Actions for SCAG Many of the innovations described above are managed by various authorities at different levels. For example, cities control public rights-of-way and the deployment and placement of docked and dockless bikeshare, electric scooters, and loading zones for TNCs; transit agencies are leading the way in forming partnerships with TNCs and microtransit providers to fill gaps in the transit system and develop integrated fare payment systems; and private MOD service providers such as Uber, Lyft, Transit App, Transit Screen among others, are working to integrate multimodal traveler information as well as trip planning and booking.
One goal of creating a TDM Strategic Plan is for SCAG to promote innovation in TDM in the region. As an MPO, SCAG can encourage the cities, counties and transit agencies in its jurisdiction to adopt more technology-forward TDM programs in several ways. The recommendations below identify opportunities for SCAG to assist the region in taking advantage of technology to improve TDM delivery, and any associated challenges.
Provide Innovation Grant Funding Due to the relatively new nature of many of these innovations and lack of robust evaluations of results and outcomes, many transportation agencies are starting small with pilot projects to understand demand for a new program, collect data, and determine appropriate regulations. Innovation grants have been an important source of funding for these pilot projects, particularly in the case of transit agencies, because they provide greater flexibility than FTA funding. SCAG can consider providing innovation grant funding to transportation agencies within the region to allow them to experiment with new TDM technologies in the next few years.
Explore the Creation of Boilerplate Agreements with MOD Providers Negotiating agreements between transportation authorities and MOD service providers, especially when it comes to what data will be shared, in what form, and with what frequency, has proven to be time-consuming and tedious. SCAG should explore the possibility of creating a boilerplate agreement with each provider, based on existing agreements within the SCAG region. For example, SCAG could look to the City of Santa Monica’s operational and data sharing agreements with Lyft, Jump, Lime and Bird under its shared mobility pilot to understand current operational constraints as well as what data is being shared and how.13 Generalizing such an agreement and making it available as a blueprint for other cities within the SCAG region could help streamline the rollout of scooters (or other modes) while also helping generate standardized data streams across the entire region. Harmonize Policies within the SCAG Region Cities and transit agencies are experimenting with shared modes in different ways, with each pilot program being tailored to local circumstances. However, this results in a patchwork of rules for the shared mobility providers to follow, raising costs and increasing the complexity of deployments. Issues that fall under this category include what data is shared and in which format; caps on numbers of dockless bikes/scooters; regulations about helmet use or whether
13 Shared Mobility Device Pilot Program Administrative Regulations

SCAG TDM Strategic Plan New Mobility and Technology Innovations Memo
23
bikes and scooters are allowed on sidewalks; and so on. SCAG can play a role in helping to harmonize policies and regulations across the region to enable better shared mobility offerings. Promote the Use of Data Standards and Require Data Sharing Incentivizing multimodal travel as a TDM strategy depends on making it easy for travelers to see where different modes are, know when they are arriving and departing, and pay for them easily. Similarly, incorporating shared mobility and new modes into the planning process will require that data be readily available. SCAG should promote the incorporation of data sharing regulations in all agreements with MOD providers, and should encourage the use of standards. Transit agencies have widely adopted the General Transit Feed Specification (GTFS). Other standards that are being adopted and should be encouraged include GTFS Real-Time to provide real-time arrival information; the General Bikeshare Feed Specification (GBFS); and Los Angeles’ Mobility Data Standard (MDS), which specifies both a provider API and an agency API. The provider API is to be implemented by the MOD service provider (e.g. dockless bikeshare, scooter share, TNCs) to allow municipalities access to operational data; the agency API is to be implemented by agencies, and will allow providers to integrate with agency operations.14 Evaluate New Mobility Initiatives on a Regional Basis Many mobility innovations are implemented locally, through agreements with cities or transit agencies, even though regional travel is extensive. SCAG can play a role in understanding the broader impact of new mobility initiatives on TDM by conducting evaluations on a larger scale to understand the regional impacts of these initiatives. In order to do so, SCAG should work with municipalities in the region to ensure that the data obtained from MOD providers is shared not just with the partnering agency, but also on a region-wide basis, which will enable regional performance measurement as well as regional evaluations of shared mobility. Create a Forum for Cities and Counties to Share Experiences Working groups have been an effective way for agencies to share their experiences implementing projects and overcoming obstacles. For example, the MOD Sandbox grantees participate in the MOD Innovation and Knowledge Accelerator, a forum where grantees seek input and advice from their fellow agencies on MOD deployments. A similar forum, in the form of monthly conference calls, for example, could allow cities and counties to learn from their peers within the SCAG region, and also identify areas for collaboration or expansion of localized programs into region-wide programs.
14 https://github.com/CityOfLosAngeles/mobility-data-specification
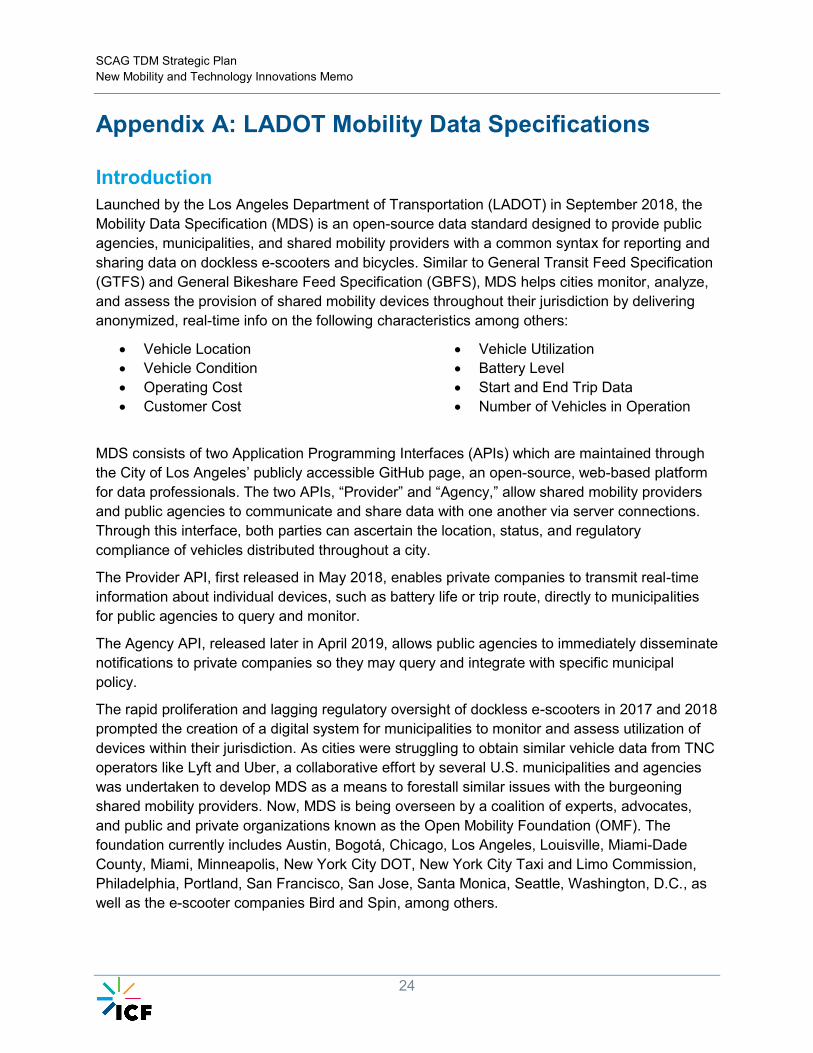
SCAG TDM Strategic Plan New Mobility and Technology Innovations Memo
24
Appendix A: LADOT Mobility Data Specifications
Introduction Launched by the Los Angeles Department of Transportation (LADOT) in September 2018, the Mobility Data Specification (MDS) is an open-source data standard designed to provide public agencies, municipalities, and shared mobility providers with a common syntax for reporting and sharing data on dockless e-scooters and bicycles. Similar to General Transit Feed Specification (GTFS) and General Bikeshare Feed Specification (GBFS), MDS helps cities monitor, analyze, and assess the provision of shared mobility devices throughout their jurisdiction by delivering anonymized, real-time info on the following characteristics among others:
• Vehicle Location • Vehicle Condition • Operating Cost • Customer Cost
• Vehicle Utilization • Battery Level • Start and End Trip Data • Number of Vehicles in Operation
MDS consists of two Application Programming Interfaces (APIs) which are maintained through the City of Los Angeles’ publicly accessible GitHub page, an open-source, web-based platform for data professionals. The two APIs, “Provider” and “Agency,” allow shared mobility providers and public agencies to communicate and share data with one another via server connections. Through this interface, both parties can ascertain the location, status, and regulatory compliance of vehicles distributed throughout a city.
The Provider API, first released in May 2018, enables private companies to transmit real-time information about individual devices, such as battery life or trip route, directly to municipalities for public agencies to query and monitor.
The Agency API, released later in April 2019, allows public agencies to immediately disseminate notifications to private companies so they may query and integrate with specific municipal policy.
The rapid proliferation and lagging regulatory oversight of dockless e-scooters in 2017 and 2018 prompted the creation of a digital system for municipalities to monitor and assess utilization of devices within their jurisdiction. As cities were struggling to obtain similar vehicle data from TNC operators like Lyft and Uber, a collaborative effort by several U.S. municipalities and agencies was undertaken to develop MDS as a means to forestall similar issues with the burgeoning shared mobility providers. Now, MDS is being overseen by a coalition of experts, advocates, and public and private organizations known as the Open Mobility Foundation (OMF). The foundation currently includes Austin, Bogotá, Chicago, Los Angeles, Louisville, Miami-Dade County, Miami, Minneapolis, New York City DOT, New York City Taxi and Limo Commission, Philadelphia, Portland, San Francisco, San Jose, Santa Monica, Seattle, Washington, D.C., as well as the e-scooter companies Bird and Spin, among others.

SCAG TDM Strategic Plan New Mobility and Technology Innovations Memo
25
By creating a common language for the collection and sharing of data, municipalities now have a tool to track and manage private fleets deployed within their borders. This allows agencies to ensure compliance with municipal codes and policies, and enables cities to incorporate shared mobility travel patterns into their transportation plans. Additionally, municipalities can use MDS to proactively address concerns about public safety, equitable distribution of devices, and overall system efficiency.
Current Application of MDS The data specification reduces friction and better aligns the operations of private providers with municipalities’ policy goals. By sharing mobility data in real-time, municipalities are able to monitor how vehicles are being used and ensure they are deployed equitably and operated lawfully. For instance, municipalities can track whether e-scooters are being operated on sidewalks or parked in illegal rights-of-way, as well as identify neighborhoods within their jurisdiction for enhanced service. With MDS, municipalities and service providers have direct, streamlined communication which improves regulatory compliance and fosters more cooperation and efficiency between sectors.
Cities MDS has already been adopted by over 50 U.S. cities, including Los Angeles, Seattle, Providence, Louisville, and Austin, as well as more than a dozen municipalities outside the country. Each city agency has the capacity to employ MDS for their specific needs and policy goals. Some examples of how MDS is being employed in the U.S. include:
• Los Angeles, CA – LADOT is using MDS to monitor the size of vehicle fleets and ensure providers’ compliance with mandated caps. According to the department’s Dockless Mobility Permit program, private companies are allowed to deploy a total of 2,500 devices in Disadvantaged Communities (DACs) and 5,000 devices in the San Fernando Valley. Using MDS, LADOT is monitoring and assessing the deployment of the devices within these specific areas, as well as analyzing their utilization patterns based on day of the week and time of day.
• Santa Monica, CA – MDS has been used to evaluate vehicle utilization for the purpose of identifying potential bike/scooter lanes and assessing the appropriateness of existing ones. Additionally, the shared data has been used to locate suitable areas for demarcated scooter parking areas along public roads.
• Austin, TX – City data specialists have created a publicly available dataset of more than 2 million e-scooter trips through MDS. The dataset is intended to be used by the public and third parties to provide further analysis of and insight into the city’s shared mobility options.
Service Providers Shared mobility companies partner with cities to develop, maintain, and improve MDS, and the private sector benefits from doing so. Prior to the implementation of MDS, service providers had to manually deliver PDF, CSV, and other formats of datasets to various municipalities according to the individual municipalities’ specifications. This system proved inefficient and cumbersome for companies and their employees to comply with on a day-to-day basis. With MDS, a

SCAG TDM Strategic Plan New Mobility and Technology Innovations Memo
26
standardized system for the delivery and sharing of data produces time and cost savings for private sector service providers. Additionally, MDS allows companies to work with cities to jointly identify vehicles which may have been abandoned, removed from service areas, or vandalized beyond repair.
Future Application in the SCAG Region MDS represents a coordinated and collaborative approach to data collection and management of private company partnerships, as without a standardized method for sharing mobility data, cities and agencies would be at a significant disadvantage with regards to ensuring devices are operated in the public interests of safety, equity, and privacy. Furthermore, the data standard and sharing procedure give private companies the ability to provide better, more consistent service while equipping public agencies with the tools necessary to have adequate regulatory oversight.
As the epicenter for the e-scooter boom, Southern California is uniquely positioned and has already taken proactive steps to maximize the welfare generated by the deployment of shared mobility devices. MDS already enables cities and agencies to monitor, design, and alter shared mobility infrastructure within the region. The shared data on e-scooters and bicycles helps inform where bike lanes should be added or removed, where parking areas might be appropriate, and which neighborhoods suffer from a lack of service. In the future, MDS can be scaled and applied to other transportation systems as well as other areas in the public interest.
Owing to its open-source nature, MDS can be requested for use and duplicated by any city or agency with an interest in monitoring and planning their shared mobility network. Experts and advocates from the public are able to flag issues and suggest adjustments to the system through its GitHub interface. These factors translate to the potential to expand and improve upon MDS as shared mobility options become increasingly more ubiquitous and future challenges arise.
Going forward, the data sharing standards established through the creation of MDS could be scaled to work with other types of mobility services such as ride-hail, carshare, autonomous vehicles, and drones. The City of Seattle has begun planning to use MDS to collect and analyze data on LimePod, the car-sharing service launched by shared mobility provider Lime in early 2019. The data will be used to validate on-street parking of LimePod vehicles throughout the city in a clear example of how MDS might be extended to other mobility arenas.
Potential Challenges and Considerations Although trip data is anonymized, cannot be accessed by police without a search warrant, and is not subject to public records requests, many privacy advocates (as well as representatives from Uber) have expressed concern about the disaggregated nature of the MDS data collected for shared mobility trips. The issue centers around the relative ease with which anonymized trip and GPS data might be hacked and/or linked to personal identifying data that could be used to pinpoint a specific person’s location or trace their habits. These very real concerns might be

SCAG TDM Strategic Plan New Mobility and Technology Innovations Memo
27
addressed through the aggregation of trip data and a privacy policy that mandates the deletion of trip data after a specified period of time.
On the other hand, a lack of personalized data and lack of communication with individual users mean that municipalities may not have access to the types of data that can help to better understand local travel behavior. While they can see where the vehicles travel, they don’t get information about trip purpose or whether the trip is replacing one that would otherwise be made by car.
A separate consideration is the extent to which smaller agencies and municipalities will be able to implement MDS for their shared mobility needs. Small to medium-sized cities such as Santa Monica, Providence, and Louisville have successfully adopted the data standards through collaboration with LADOT and the Open Mobility Foundation. The growing coalition of agencies which employ MDS and the collaborative nature of the digital platform mean that there are minimal technical barriers to implementation, management, and enforcement of MDS.

SC A G TDM Strategic Plan and F inal Report
F Goals, Objectives and Performance Measures Memo

SCAG Transportation Demand Management (TDM) Strategic Plan TDM Goals, Objectives, and Performance Measures
March 27, 2019
Submitted to: Steer as prime consultant to SCAG
Submitted by: ICF

2 of 32
Contents
1. Introduction ...................................................................................................................................... 3
2. TDM in the Planning Process .............................................................................................................. 4
2.1 National Performance Measures Management Rules ...................................................................... 4
2.2 RTP/SCS TDM-Related Goals and Objectives .................................................................................... 4
2.3 RTP/SCS TDM-Related Performance Measures ................................................................................ 8
3. Proposed Goals, Objectives & Performance Measures ...................................................................... 11
Appendix A ............................................................................................................................................... 24
Performance Measures in Peer Agencies .................................................................................................... 25
Monitoring & Evaluating the Effectiveness of TDM Activities .................................................................... 25
The contents of this report reflect the views of the author who is responsible for the facts and accuracy of the data presented herein. The contents do not necessarily reflect the official views or policies of SCAG. This report does not constitute a standard, specification or regulation.

3 of 32
1. Introduction Throughout the country local and regional governments have begun to utilize Transportation Demand Management (TDM) delivery to support long-range planning goals addressing sustainability, public health, congestion, transportation access and economic development.
In the SCAG Region, the 2016 Regional Transportation Plan/Sustainable Communities Strategy (RTP/SCS) committed $6.9 billion to TDM strategies. Chapter 5 of the long-range visioning plan outlines the TDM strategies:
▪ Rideshare incentives and rideshare matching. ▪ Parking management and parking cash-out policies. ▪ Preferential parking or parking subsidies for carpoolers. ▪ Intelligent parking programs. ▪ Promotion and expansion of Guaranteed Ride Home programs. ▪ Incentives for telecommuting and flexible work schedules. ▪ Integrated mobility hubs and first/last mile strategies. ▪ Incentives for employees who bike and walk to work. ▪ Investments in active transportation infrastructure. ▪ Investments in Safe Routes to School programs and infrastructure.
Because TDM continues to be featured more prominently in the planning process, it is important that municipalities and regional governments understand the goals and objectives TDM strategies can address, and how best to predict and measure the success of suggested programs and policies against those goals. Agencies implementing TDM have historically chosen to measure performance and usage of programs, while overall impacts have been historically difficult to measure. Yet, with changes in the federal performance measure requirements to report on a regional level, TDM program performance monitoring continues to evolve. As SCAG intends to further explore the use of TDM in its 2020 RTP/SCS, they must establish TDM-specific goals, objectives, and performance measures that are aligned with their higher level regional goals and ensure that TDM programs prioritize activities that assist the region with meeting those goals, and communicating the overall costs, benefits, and impacts.
This memo provides recommendations for goals, objectives and performance measures that are aligned with the goals and objectives outlined in the 2016 Regional Transportation Plan Sustainable Communities Strategy (RTP/SCS). The recommended performance measures also consider federal performance measure requirements under Fixing America’s Surface Transportation (FAST) Act. These goals and objectives have been developed based on information gleaned through national research as well as discussions and feedback from local stakeholders.

4 of 32
2. TDM in the Planning Process Strategic goals, objectives and performance measures for the SCAG region should align with broader policy frameworks to assist local programs to prioritize program services and achieve regional and federal goals.
2.1 National Performance Measures Management Rules The U.S. Department of Transportation, Federal Highway Administration (FHWA) established a set of three performance rules and associated measures for State Departments of Transportation (State DOTs) and Metropolitan Planning Organizations (MPOs) to use as required by the Moving Ahead for Progress in the 21st Century Act (MAP–21) and the Fixing America’s Surface Transportation (FAST) Act.” 1
The following performance measures support the Safety, Infrastructure, and System Performance Rules. While TDM programs and services may have an impact on measures in all three performance rules, the third and final rule on System Performance (released in 2017) directly applies to regions who receive Congestion Mitigation and Air Quality funding for TDM and other programs. This System Performance Rule establishes performance measures (Numbers 1-3) for assessing the CMAQ program, as well as requirements for data collection and calculations.
1. Annual Hours of Peak Hour Excessive Delay Per Capita (PHED) 2. Percent of Non-SOV Travel 3. Total Emissions Reductions for each applicable criteria pollutant 4. Percent of Person Miles (traveled on Interstates and National Highways that are reliable) 5. Percent Change in Tailpipe CO2 Emissions on the NHS Compared to the Calendar Year
2017 Level
2.2 RTP/SCS TDM-Related Goals and Objectives The SCAG Regional Council adopted the 2016-2040 Regional Transportation Plan/Sustainable Communities Strategy (RTP/SCS) in April of 2016. The Plan incorporated input from local governments, county transportation commissions, tribal governments, non-profit organizations, businesses and local stakeholders from the six SCAG member counties: Imperial, Los Angeles, Orange, Riverside, San Bernardino, and Ventura.
As SCAG looks to add TDM-specific goals and objectives to their upcoming plans, it is important that they correspond with these already established TDM-related goals and objectives.
The 2016 RTP/SCS discusses TDM in detail in Chapter 5 The Road to Greater Mobility & Sustainable Growth and identifies three main areas of focus:
1 Department of Transportation, Federal Highway Administration, 23 CFR Part 490, [Docket No. FHWA–2013–0054], RIN 2125–AF54, National Performance Management Measures; Assessing Performance of the National Highway System, Freight Movement on the Interstate System, and Congestion Mitigation and Air Quality Improvement Program, ACTION: Final rule.

5 of 32
• Reducing the number of single occupancy vehicle (SOV) trips and overall vehicle miles traveled (VMT) through ridesharing, which includes carpooling, vanpooling, and in certain cases, supportive policies for shared ride services such as Uber and Lyft when they are specific to connections to transit or “pooled” rides
• Redistributing or eliminating vehicle trips from peak demand periods through incentives for telecommuting and alternative work schedules.
• Reducing the number of SOV trips using other modes of travel such as transit, rail, bicycling and walking.
Additionally, other sections of the RTP/SCS, such as Chapter 8 Measuring Our Progress, and the What We Will Accomplish section of the interactive Executive Summary identify goals and objectives that relate to TDM and can help further define TDM-specific goals and objectives for the TDM Strategic Plan.

6 of 32
Table 1: 2016 RTP/SCS Goals, Objectives, and Federal Performance Measure Management Rules
2016 RTP/SCS Goals Plan Outcomes* Federal Performance Rule
Economic Opportunity
Align the plan investments and policies with improving regional economic development and competitiveness.
Create more than 351,000 additional new jobs annually, due to the region’s increased competitiveness and improved economic performance that would result from congestion reduction and improvements in regional amenities as a result of implementing the Plan. (144)
Environmental Justice
Maximize mobility and accessibility for all people and goods in the region
Combined percentage of work trips made by carpooling, active transportation and public transit would increase by about 4%, with a commensurate reduction in the share of commuters traveling by single occupant vehicle. (153)
Annual Hours of Peak Hour Excessive Delay Per Capita (PHED), Percent of Non-SOV Travel, Total Emissions Reduction
Transportation System Sustainability
Ensure travel safety and reliability for all people and goods in the region
Reduce delay per capita by 39% and heavy-duty truck delay on highways by more than 37%. (153)
Percent of person miles traveled on the interstates and national highways that are reliable, PHED
Preserve and ensure a sustainable regional transportation system
Reduce the amount of previously undeveloped (greenfield) lands converted to more urbanized uses by 23%. (153)
Percent of Non-SOV Travel, Total Emissions Reduction
Maximize the productivity of our transportation system
No corresponding objective found in the 2016 RTP/SCS. PHED, Percent of non-SOV Travel, Total Emissions Reduction
Maximize the security of the regional transportation system through improved system monitoring, rapid recovery planning, and coordination with other security agencies
No corresponding objective found in the 2016 RTP/SCS.
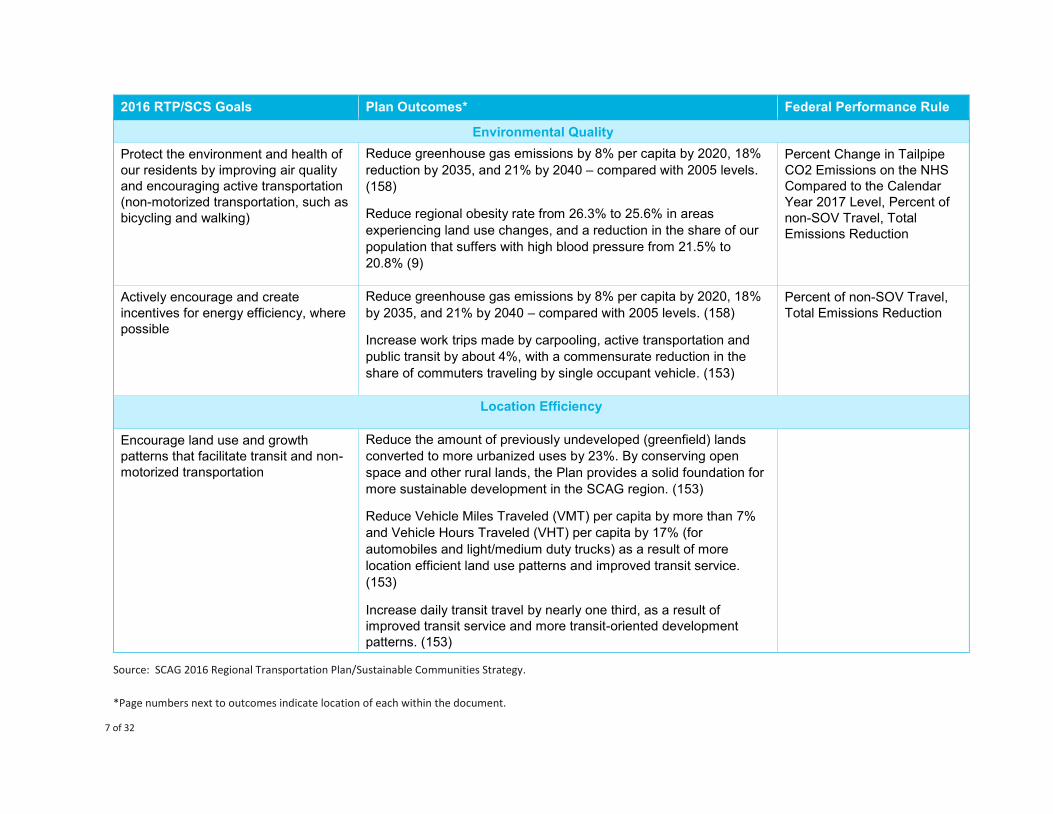
7 of 32
2016 RTP/SCS Goals Plan Outcomes* Federal Performance Rule
Environmental Quality Protect the environment and health of our residents by improving air quality and encouraging active transportation (non-motorized transportation, such as bicycling and walking)
Reduce greenhouse gas emissions by 8% per capita by 2020, 18% reduction by 2035, and 21% by 2040 – compared with 2005 levels. (158)
Reduce regional obesity rate from 26.3% to 25.6% in areas experiencing land use changes, and a reduction in the share of our population that suffers with high blood pressure from 21.5% to 20.8% (9)
Percent Change in Tailpipe CO2 Emissions on the NHS Compared to the Calendar Year 2017 Level, Percent of non-SOV Travel, Total Emissions Reduction
Actively encourage and create incentives for energy efficiency, where possible
Reduce greenhouse gas emissions by 8% per capita by 2020, 18% by 2035, and 21% by 2040 – compared with 2005 levels. (158)
Increase work trips made by carpooling, active transportation and public transit by about 4%, with a commensurate reduction in the share of commuters traveling by single occupant vehicle. (153)
Percent of non-SOV Travel, Total Emissions Reduction
Location Efficiency
Encourage land use and growth patterns that facilitate transit and non-motorized transportation
Reduce the amount of previously undeveloped (greenfield) lands converted to more urbanized uses by 23%. By conserving open space and other rural lands, the Plan provides a solid foundation for more sustainable development in the SCAG region. (153)
Reduce Vehicle Miles Traveled (VMT) per capita by more than 7% and Vehicle Hours Traveled (VHT) per capita by 17% (for automobiles and light/medium duty trucks) as a result of more location efficient land use patterns and improved transit service. (153)
Increase daily transit travel by nearly one third, as a result of improved transit service and more transit-oriented development patterns. (153)
Source: SCAG 2016 Regional Transportation Plan/Sustainable Communities Strategy.
*Page numbers next to outcomes indicate location of each within the document.

8 of 32
2.3 RTP/SCS TDM-Related Performance Measures In addition to the goals and objectives listed above the 2016 SCAG RTP/SCS includes performance measures, designed to guide and track progress toward meeting the regional goals. The performance measures relevant to TDM delivery are included below as sectioned within the RTP/SCS.
Location Efficiency Performance Measure Definition Share of growth in High Quality Transit Areas (HQTAs)
Share of the region’s growth in households and employment in HQTAs
Land Consumption Greenfield land consumed and refill land consumed Vehicle Miles Traveled Per Capita Average annual vehicle miles driven per person Transit Mode Share The share of total trips that use transit for work and non-
work trips Average distance for work or non-work trips The average distance traveled for work or non-work trips Percent of trips less than 3 miles The share of work and non-work trips which are fewer
than 3 miles Work trip length distribution The statistical distribution of work trip length in the
region
Mobility & Accessibility Performance Measure Definition Person delay per capita Delay per capita can be used as a supplemental
measure to account for population growth impacts on delay
Person delay by facility type (mixed flow, HOV, arterials)
Delay: Excess travel time resulting from the difference between a reference speed and actual speed
Truck delay by facility type (highways, arterials)
Delay: Excess travel time resulting from the difference between a reference speed and actual speed
Travel time distribution for transit, SOV, and HOV modes for work and non-work trips
Travel time distribution for transit, SOV, and HOV for work and non-work trips
Environmental Quality Performance Measure Definition Criteria pollutant and greenhouse gas emissions
CO, NOX, PM2.5, PM10, and VOC emissions; and per capita greenhouse gas emissions (CO2)

9 of 32
Economic Opportunity Performance Measure Definition Additional jobs supported by improving competitiveness
Number of jobs added to the economy as a result of improved transportation conditions which make the region more competitive
Additional jobs supported by transportation investment
Total number of jobs supported in the economy as a result of transportation expenditures.
Net contribution to Gross Regional Product Increase in Gross Regional Product due to transportation investments and increased competitiveness
Investment Effectiveness Performance Measure Definition Benefit/Cost Ratio Ratio of monetized user and societal benefits to the
agency transportation costs
Transportation System Sustainability Performance Measure Definition Cost per capita to preserve multimodal transportation system to current and state of good repair condition
Annual cost per capita required to preserve the regional multimodal transportation system to current conditions
State Highway System Pavement Condition Share of distressed State Highway System lane miles
Local Roads Pavement Condition Pavement Condition Index (PCI) for local roads
Environmental Justice Performance Measure Definition Share of Transportation System Usage Comparison of transportation system usage by mode for
low income and minority households vs each group's population share in the greater region
Distribution of travel time savings and travel distance reductions
Details what groups are overall benefiting as a result of the Plan in terms of travel time and distance savings
Accessibility to employment and services
Percentage of employment and shopping destinations within a one- and two-mile travel buffer from each neighborhood; also, share of employment and shopping destinations that can be reached within 30 minutes by auto or 45 minutes by bus or all transit modes during the evening peak period
Accessibility to Parks and Schools Share of population within a one- and two-mile travel buffer from a regional park or school; also, share of park acreage that can be reached within 30 minutes by auto or 45 minutes by bus or all transit modes during the evening peak period

10 of 32
Air Quality Health Impacts along Highways and Highly Traveled Corridors
Comparison of Plan and Baseline scenarios and demographic analysis of communities in close proximity to highways and highly traveled corridors
Roadway Noise Impacts Comparison of Plan and Baseline scenarios, identification of areas that are low performing as a result of the Plan; breakdown of population for these impacted areas by race/ethnicity and income
Active Transportation Hazard Breakdown of population by demographic group for areas that experience the highest rates of bicycle and pedestrian collisions
Public Health Analysis Historical emissions and health data summarized for areas that have high concentrations of minority and low-income Population
Proposed Mileage-Based User Impact Fees Examination of potential impacts from implementation of a mileage-based user fee on low income households in the region

11 of 32
3. Proposed Goals, Objectives & Performance Measures Through the TDM Strategic Plan, SCAG has the opportunity to explore in more detail the use of TDM to meet regional transportation goals. To develop these TDM goals and performance measures for the SCAG region, we examined the relevant 2016 RTP/SCS regional goals to evaluate how and where TDM strategies could contribute to achieving the relevant outcomes. We also drew on goals and performance measures created by peer agencies and how they have aligned those goals to broader regional or statewide transportation goals. A full description of the case studies used to develop this list is included in Appendix A.
This section introduces eight proposed TDM goals for the SCAG Region and relates each to the long-range goals included in the 2016 RTP/SCS outlined in Section 2. It also includes proposed objectives and performance measures for each goal.
Goal 1: Improve job quality and foster economic development through the provision of site-based transportation benefits
Related 2016 RTP/SCS Goals
Align the plan investments and policies with improving regional economic development and competitiveness.
Related 2020 RTP/SCS Goals
Encourage regional economic prosperity and global competitiveness.
Proposed Objectives • Increase the number of worksites, residential buildings and entertainment hubs that offer
benefits, incentives and amenities to employees for non-SOV travel. • Encourage job growth around high frequency transit corridors through land use planning.
Proposed Performance Measures • Number of sites providing transportation or commuter benefits programs • Number of employees and residents with access to transportation or commuter benefits
programs • Number of jobs within ½ mile of a high frequency transit stop • Number of jobs added within ½ mile of a high frequency transit stop based on
predetermined baseline • Number of households accessible to businesses with 45-minute transit commute (or better)
Data Collection
Through their annual registration with the South Coast Air Quality Management District’s (South Coast AQMD) Rule 2202, many large employers in Los Angeles, Orange, San Bernardino and Riverside Counties already provide a description of the TDM programs they offer their employees. While this group is not an exhaustive list of employers within the SCAG Region, SCAG can use the data collected by the South Coast AQMD as a base to build upon.

12 of 32
Throughout the region, various municipalities have implemented ordinances that require TDM programs for employers or for new development. In Los Angeles County for example, Metro will soon implement Assembly Bill 2548, which will require employers in the county who do not qualify for the South Coast AQMD’s Rule 2202 to provide pre-tax commute benefits for non-drivers.
SCAG likely would not want to support requirements for all employers and developers in the Region to fill out a form as in-depth as the ECRP (which includes an annual survey distributed to each employee) but they could support the requirement or encouragement of provision of a simple description of TDM programing submitted through preexisting municipal registrations such as business licenses or requests for information.
SCAG may also consider measuring the combined outcomes from all employer-based TDM programmatic efforts in the region, through the facilitation and provision of a regional Customer Relations Management (CRM) database, such as the New York State Department of Transportation and Washington, D.C. TDM programs utilize. One regional system that can generate reports on the outcomes of all the programs combined can streamline data collection processes and improve efficiencies for the TDM programs.
Information on employers and jobs located within ½ mile of a transit stop can likely be provided by municipalities. Additionally, were SCAG to develop a system as described above to receive information from all employers in the region, a question regarding distance to transit could be included.
Data collection resources: the South Coast AQMD Rule 2202 registrations and direct reports from TDM programs, reports provided to municipalities with TDM ordinances, AllTransit and GIS Analysis, municipal employment statistics
Goal 2: Improve mobility regionwide through better access to non-SOV travel modes
Related 2016 RTP/SCS Goals
Maximize mobility and accessibility for all people and goods in the region.
Related 2020 RTP/SCS Goals
Improve mobility, accessibility, reliability and travel safety for people and goods.
Increase person and goods throughput and travel choices within the transportation system.
Proposed Objectives • Encourage employer-based programs to offer pre-tax benefits, discounts, and other
financial incentives to reduce commute costs. • Encourage transit agencies to offer subsidies to a wider range of potential users
Proposed Performance Measures • Average amount spent on transportation per household

13 of 32
• Number of employers offering pre-tax benefits, discount transit passes, parking cash-out and other financial incentives
• Number of transit agencies offering discounts to user groups • Number of workplaces offering formal telework programs • Number of service providers offering “teleservice” programs
Data Collection
Amount spent on transportation per household could be captured from online resources, such as the Housing & Transportation Affordability Index, that collect and aggregate transit data on neighborhood and regional levels. All Transit is a project of the Center for Neighborhood Technology, a non-profit organization with a mission for promoting more livable and sustainable urban communities. SCAG may also elect to conduct its own GIS analysis using household travel data and other data, as appropriate and accessible.
SCAG can use data from the South Coast AQMD (which can provide data from employers who have chosen to submit an Employee Commute Reduction Plan and have not reached their Average Vehicle Ridership (AVR) target or increased their site-wide AVR in the past year) and other reported data (as described in more detail in Goal 1), to determine the number of employers offering financial incentives to employees and telework programs, and poll regional transit agencies to better understand their process of discounting or subsidizing transit passes.
Teleservices can be measured through business licenses for medical, educational, and other companies that typically provide these services remotely.
Data collection resources: Housing and Transportation Affordability Index, the South Coast AQMD Rule 2202 registrations, local business registrations
Goal 3: Increase the number of households and jobs located within ½ mile of public transit
Related 2016 RTP/SCS Goals
Maximize mobility and accessibility for all people and goods in the region.
Related 2020 RTP/SCS Goals
Adapt to a changing climate and support an integrated regional development pattern and transportation network.
Encourage development of diverse housing types in areas well supported by multiple transportation options.
Proposed Objectives • Encourage residential development along high frequency transit corridors through land use
planning.
Proposed Performance Measures • Number of households and jobs within ½ mile of a high frequency transit stop

14 of 32
• Number of new households and jobs within ½ mile of a transit stop (including both new households built and jobs added as well as households and jobs that gained a transit stop within a ½ mile where there was none prior) based on predetermined baseline
Data Collection
SCAG can utilize AllTransit or a similar resource to determine the number of households that exist within ¼ mile of a high frequency transit stop, and can revisit these numbers periodically within the entire region, or within specific municipalities that allow density bonuses or other benefits for residential development in transit-oriented districts to determine the success of individual policies.
Data collection resources: AllTransit, information provided by municipalities through polling or interviews Goal 4: Encourage municipalities to incorporate TDM into local plans and policies
Related 2016 RTP/SCS Goals
Encourage land use and growth patterns that facilitate transit and non-motorized transportation.
Proposed Objectives • Increase the number of new or updated TDM ordinances in the region • Increase the number of specific or master plans with TDM elements
Proposed Performance Measures • Number of municipalities that have adopted and are actively promoting and enforcing TDM
ordinances • Number of municipalities that have adopted specific or master plans with TDM elements • Number of municipalities that have adopted policies surrounding parking pricing or
unbundled parking • Number of TMAs/TMOs in the Region that provide a minimum level of service that includes
rideshare matching, a guaranteed ride home program, and at least quarterly communication to members.
Data Collection
Several municipalities in the SCAG Region already have TDM ordinances or TDM-related language included in their specific plans, and many are updating or are working toward passing new ordinances in response to SB 743 and similar initiatives. SCAG could encourage additional communities to pass similar ordinances, and encourage consistency throughout the region.
Data could be collected directly from municipalities who have implemented TDM in their planning processes through polling. Though not identified directly as performance measures, research could also be done regarding strength and reach of TDM-related policy, as well as the level of enforcement.
A count of TMAs and TMOs could be conducted through the municipalities or counties as well.

15 of 32
Data Collection Resources: Information provided by municipalities and other local governments through polling or interviews
Goal 5: Reduce traffic congestion on the region’s most congested corridors
Related 2016 RTP/SCS Goals
Ensure travel safety and reliability for all people and goods in the region.
Related 2020 RTP/SCS Goals
Increase person and goods throughput and travel choices within the transportation system.
Proposed Objectives • Reduce delay per capita and heavy-duty truck delay on highways over baseline
Proposed Performance Measures • Person delay per capita • Person delay by facility type • Truck delay by facility type • Travel time distribution for transit, SOV and HOV modes for work and non-work trips
Data Collection
TDM programs can assist a region with reducing traffic congestion delay, but it should be noted that they cannot be responsible for meeting this goal entirely. TDM programs, such as the county TDM programs that conduct commuter and employer outreach and promotions, can implement promotional campaigns targeted to employers, universities, hospitals, organizations, and individual commuters within a corridor to encourage the use of sustainable transportation options, and offer incentives for doing so. But other entities such as public transit agencies also play a role in reducing congestion along specific corridors, such as increased transit, integrated corridor management projects, etc. On a regional scale, SCAG can measure reduction in congestion delay by conducting its own travel time studies, or it could pull data from the National Performance Management Research Data Set, since this is the required data source in the federal performance measure management rule.
Data collection resources: Travel Time Data Set in the National Performance Management Research Data Set (NPMRDS), information provided by goods movement companies.

16 of 32
Goal 6: Improve air quality by reducing vehicle miles traveled, through increased use of non-SOV travel modes
Related 2016 RTP/SCS Goals
Preserve and ensure a sustainable regional transportation system.
Maximize the productivity of our transportation system.
Actively encourage and create incentives for energy efficiency, where possible.
Related 2020 RTP/SCS Goals
Reduce greenhouse gas emissions and improve air quality.
Increase person and goods throughput and travel choices across the transportation system.
Proposed Objectives • Increase sustainable (non-SOV) mode share use over baseline • Reduce VMT per capita over baseline • Reduce GHG emissions per capita over baseline • Determine the reduction of criteria pollutant co-benefit over baseline
Proposed Performance Measures • Sustainable (non-SOV) mode share • VMT per capita
Data Collection
As is the case with measuring delay (as described in Goal 5) changes in mode share and VMT may not be the direct effect of TDM strategies alone, particularly when they are measured region-wide. To determine a more direct causal impact from TDM delivery, these measures may be better examined on a smaller scale, at a municipal level or below. Regionally data can be collected through the American Community Survey or through reports from the South Coast AQMD and Pollution Control Boards. On a smaller level, it may be useful for SCAG to poll municipalities, employers or developers to learn more about the impacts of their specific programs. GHG emissions can be calculated from VMT metrics.
Data collection resources: American Community Survey, Journey to Work Data on Modeshare, total emissions reductions reported by the South Coast AQMD and Pollution Control Boards, direct reports from TDM programs.
Goal 7: Improve public health and wellbeing through increased usage of bicycling and walking
Related 2016 RTP/SCS Goals
Protect the environment and health of our residents by improving air quality and encouraging active transportation (non-motorized transportation, such as bicycling or walking).
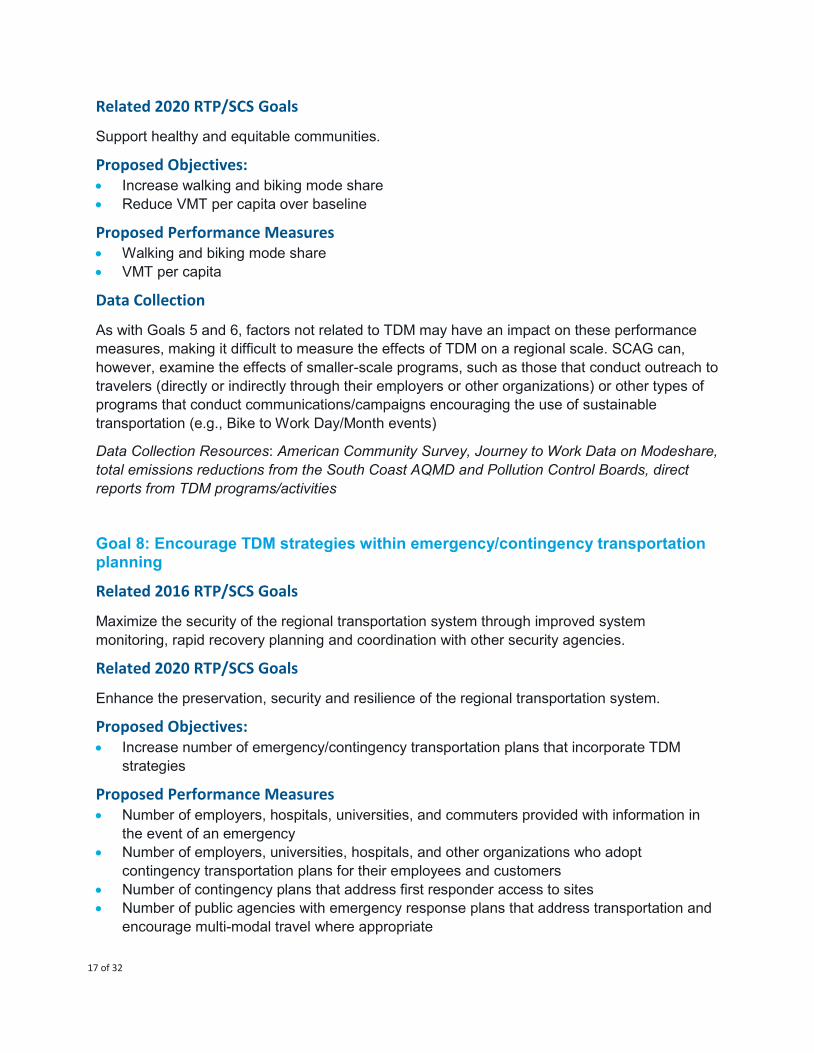
17 of 32
Related 2020 RTP/SCS Goals
Support healthy and equitable communities.
Proposed Objectives: • Increase walking and biking mode share • Reduce VMT per capita over baseline
Proposed Performance Measures • Walking and biking mode share • VMT per capita
Data Collection
As with Goals 5 and 6, factors not related to TDM may have an impact on these performance measures, making it difficult to measure the effects of TDM on a regional scale. SCAG can, however, examine the effects of smaller-scale programs, such as those that conduct outreach to travelers (directly or indirectly through their employers or other organizations) or other types of programs that conduct communications/campaigns encouraging the use of sustainable transportation (e.g., Bike to Work Day/Month events)
Data Collection Resources: American Community Survey, Journey to Work Data on Modeshare, total emissions reductions from the South Coast AQMD and Pollution Control Boards, direct reports from TDM programs/activities
Goal 8: Encourage TDM strategies within emergency/contingency transportation planning
Related 2016 RTP/SCS Goals
Maximize the security of the regional transportation system through improved system monitoring, rapid recovery planning and coordination with other security agencies.
Related 2020 RTP/SCS Goals
Enhance the preservation, security and resilience of the regional transportation system.
Proposed Objectives: • Increase number of emergency/contingency transportation plans that incorporate TDM
strategies
Proposed Performance Measures • Number of employers, hospitals, universities, and commuters provided with information in
the event of an emergency • Number of employers, universities, hospitals, and other organizations who adopt
contingency transportation plans for their employees and customers • Number of contingency plans that address first responder access to sites • Number of public agencies with emergency response plans that address transportation and
encourage multi-modal travel where appropriate

18 of 32
Data Collection
TDM programs can assist employers with developing contingency transportation plans, so that they are more prepared to assist their employees, students, and other customers in the event of an emergency – either planned (e.g., roadway or transit construction) or unplanned (e.g., earthquake or major traffic or transit disruption). Contingency transportation plans can include getting employees registered in the rideshare system to organize carpools in advance of an emergency and generating alternative transit trip itineraries if one line is disrupted or a roadway or bridge is impacted. Contingency transportation plans can also include working with an employer on a strategy for episodic telework arrangements for employees, so that they could work from home in an event of an emergency. As such, TDM programs, like the county TDM programs in the SCAG region, are well-suited to provide this service and likely already do so on a case-by-case basis. These services could be expanded and offered consistently to all organizations throughout the region. SCAG can collect data on the number of sites or organizations with TDM elements to their contingency plans through polling and discussions with municipalities.
Data collection resources: Information from municipalities or agencies through polling or informational requests.
Goal 9: Improve efficiency by enabling and leveraging information from technological innovation
Related 2020 RTP/SCS Goals
Leverage new transportation technologies and data-driven solutions that result in more efficient travel.
Proposed Objectives • Increase number of shared trips • Improve process of planning, accessing and paying for service • Encourage partnerships between the public and private sectors
Proposed Performance Measures • Number of shared trips (excluding single-rider TNC trips) • Number of private transportation service providers providing trip-level data to public
agencies • Number of multimodal trips planned or paid for on a single platform • Number of trips reserved in advance through mobile platforms
Data Collection
As the private sector continues to influence transportation through the provision of technology that helps users plan, pay for, and take more efficient trips, their ability or willingness to share data becomes crucial. Most mobile platforms collect data automatically, which can help both public and private agencies provide better informed transportation service and more successfully encourage non-SOV travel.

19 of 32
Data collection resources: Information provided by private providers, information from municipalities on their partnerships

20 of 32
Table 2 Summary of Proposed Goals, Objective, and Performance Measures
Goal Objectives Performance Measures Data Collection 1. Improve job quality and
foster economic development through the provision of site-based transportation benefits
• Increase the number of worksites, residential buildings and entertainment hubs that offer benefits, incentives and amenities to employees for non-SOV travel
• Encourage job growth around high frequency transit corridors through land use planning
• Number of sites providing transportation or commuter benefits programs
• Number of employees and residents with access to transportation or commuter benefits programs
• Number of jobs within ½ mile of a high frequency transit stop
• Number of jobs added within ½ mile of a high frequency transit stop based on predetermined baseline
• Number of households accessible to businesses with 45-minute transit commute (or better)
• ADQMD Rule 2202 Registrations
• Data reported from individual TDM Programs
• Reports provided to municipalities with TDM ordinances
• AllTransit and GIS Analysis
• Municipal Data
2. Improve mobility regionwide through better access to non-SOV travel modes
• Encourage employer-based programs to offer pre-tax benefits, discounts, and other financial incentives to reduce commute costs.
• Encourage transit agencies to offer subsidies to a wider range of potential users
• Average amount spent on transportation per household
• Number of employers offering pre-tax benefits, discount transit passes, parking cash-out and other financial incentives
• Number of transit agencies offering discounts to user groups
• Number of workplaces offering formal telework programs
• Number of service providers offering “teleservice” programs
• Housing and Transportation Affordability Index
• The South Coast AQMD Rule 2202 registrations
• Local business registrations

21 of 32
Goal Objectives Performance Measures Data Collection 3. Increase the number of
households and jobs located within ½ mile of public transit
• Encourage residential development along high frequency transit corridors through land use planning.
• Number of households and jobs within ½ mile of a high frequency transit stop
• Number of new households and jobs within ½ mile of a transit stop (including both new households built and jobs added as well as households and jobs that gained a transit stop within a ½ mile where there was none prior) based on predetermined baseline
• AllTransit • Information
provided by municipalities through polling or interviews
4. Encourage municipalities to incorporate TDM into local plans and policies
• Increase the number of new or updated TDM ordinances in the region
• Increase the number of specific or master plans with TDM elements
• Number of municipalities that have adopted and are actively promoting and enforcing TDM ordinances
• Number of municipalities that have adopted specific or master plans with TDM elements
• Number of municipalities that have adopted policies surrounding parking pricing or unbundled parking
• Number of TMAs/TMOs in the Region
• Information provided by municipalities and other local governments through polling or interviews
5. Reduce traffic congestion on the region’s most congested corridors
• Reduce delay per capita and heavy-duty truck delay on highways over baseline
• Person delay per capita • Person delay by facility type • Truck delay by facility type • Travel time distribution for transit,
SOV and HOV modes for work and non-work trips
• Travel Time Data Set in the National Performance Management Research Data Set (NPMRDS)
• Information provided by goods movement companies

22 of 32
Goal Objectives Performance Measures Data Collection 6. Improve air quality by
reducing vehicle miles traveled, through increased use of non-SOV travel modes
• Increase sustainable (non-SOV) mode share use over baseline
• Reduce VMT per capita over baseline
• Reduce GHG emissions per capita over baseline
• Sustainable (non-SOV) mode share • VMT per capita
• American Community Survey Journey to Work Data on Modeshare
• Total emissions reductions reported by the South Coast AQMD and Pollution Control Boards
• Direct reports from TDM programs.
7. Improve public health and wellbeing through increased usage of bicycling and walking
• Increase walking and biking mode share
• Reduce VMT per capita over baseline
• Walking and biking mode share • VMT per capita
• American Community Survey, Journey to Work Data on Modeshare
• Total emissions reductions from the South Coast AQMD and Pollution Control Boards
• Direct reports from TDM programs
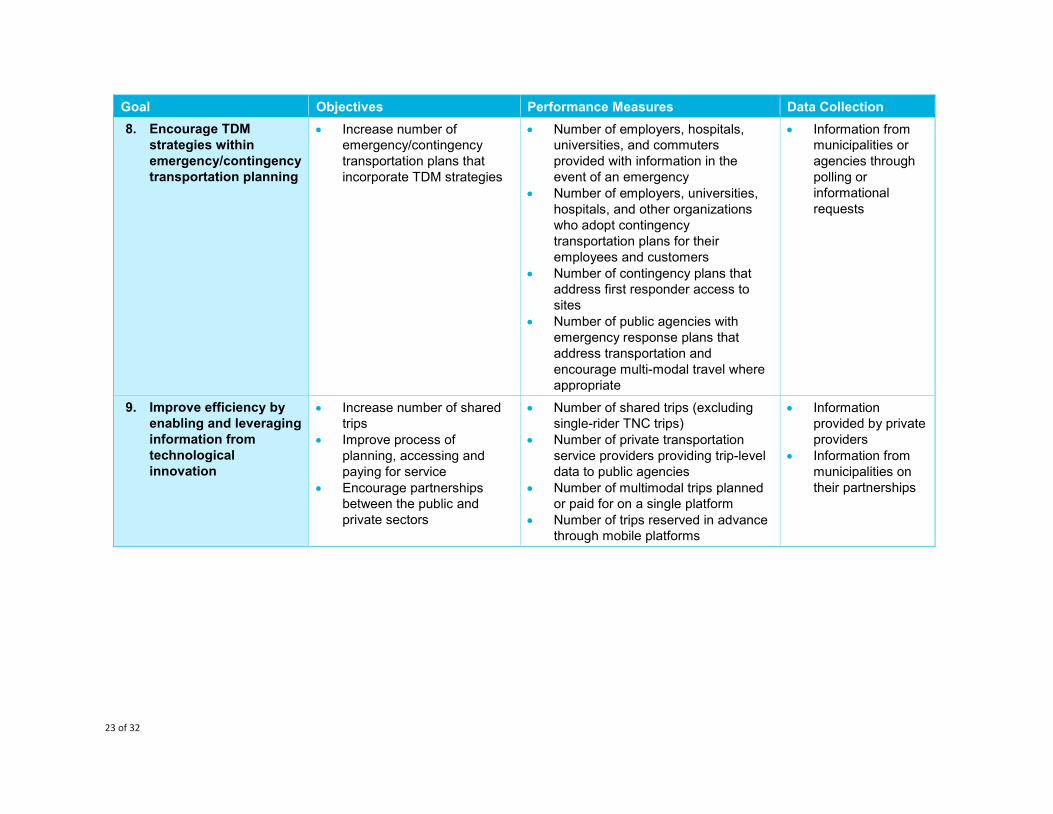
23 of 32
Goal Objectives Performance Measures Data Collection 8. Encourage TDM
strategies within emergency/contingency transportation planning
• Increase number of emergency/contingency transportation plans that incorporate TDM strategies
• Number of employers, hospitals, universities, and commuters provided with information in the event of an emergency
• Number of employers, universities, hospitals, and other organizations who adopt contingency transportation plans for their employees and customers
• Number of contingency plans that address first responder access to sites
• Number of public agencies with emergency response plans that address transportation and encourage multi-modal travel where appropriate
• Information from municipalities or agencies through polling or informational requests
9. Improve efficiency by enabling and leveraging information from technological innovation
• Increase number of shared trips
• Improve process of planning, accessing and paying for service
• Encourage partnerships between the public and private sectors
• Number of shared trips (excluding single-rider TNC trips)
• Number of private transportation service providers providing trip-level data to public agencies
• Number of multimodal trips planned or paid for on a single platform
• Number of trips reserved in advance through mobile platforms
• Information provided by private providers
• Information from municipalities on their partnerships

24 of 32
Appendix A

25 of 32
Performance Measures in Peer Agencies In order to develop performance measures for the SCAG region, TDM performance monitoring and evaluation efforts conducted in other TDM programs around the country were reviewed including:
Florida Department of Transportation Commuter Assistance Program: The Florida Department of Transportation has six regional Commuter Assistance Programs (TDM programs) throughout the state. TDM program performance monitoring and evaluation for all the TDM programs is coordinated and conducted statewide.
New York State Department of Transportation 511NY Rideshare TDM Program: The New York Department of Transportation operates a statewide TDM program. Some services are not offered statewide, but to the extent possible, TDM program performance monitoring and evaluation is coordinated and conducted statewide.
Oregon State Department of Transportation, Transportation Options Program: Oregon Department of Transportation also operates a statewide TDM program, called Transportation Options, and program monitoring and evaluation is coordinated and conducted statewide, with minor differences at the regional level to account for differences in TDM strategies implemented.
Metropolitan Washington Council of Governments Commuter Connections: The Commuter Connections program offers TDM services in the Washington, D.C. metropolitan area. The Commuter Connections program has conducted extensive TDM evaluation and has been on the leading edge of the development of new/refined methodologies for evaluating and quantifying the impacts of TDM strategies since 1997. Commuter Connections is often cited by other TDM programs as the premier example of how to conduct TDM performance evaluation.
These programs share similar objectives in their performance monitoring and evaluation programs. Monitoring and evaluation efforts are conducted in order to monitor and evaluate the effectiveness of individual TDM activities (e.g., services and tools), as well as to monitor and evaluate the impact of their entire programs. These programs also generally strive to align their program performance measures with regional, state, and federal performance measures, so that TDM programs can demonstrate contributions toward meeting broader regional, state, and federal goals.
Monitoring & Evaluating the Effectiveness of TDM Activities Most TDM programs surveyed have performance metrics for monitoring usage and evaluating the effectiveness of their individual TDM activities. Examples include the usage of program tools such as rideshare matching systems and trip tracking features, or services like employer outreach and marketing efforts. These are program-specific performance measures that do not necessarily translate directly to regional TDM performance measures. Since the individual program services and tools differ slightly from region to region to accommodate individual regions’ needs, so do the specific performance measures used to estimate their effectiveness.

26 of 32
Florida Department of Transportation Commuter Assistance Program
The Florida DOT Commuter Assistance Program performance measures include: 2
TDM Systems, Rideshare Matching Systems
▪ Customers receiving names of potential ride matches who contacted others ▪ Customers receiving names to pool and contacted other who actually formed a pool ▪ Customers receiving names of potential ride matches who contacted others ▪ Customers receiving names to pool and contacted other who formed a pool ▪ Overall share of customers who were successful in forming a pool with assistance of
CAP
Support and Outreach to (Existing) Program Participants
▪ Customer Round-Trip Commutes Avoided by Use of Telework ▪ Customer Round-Trip Commutes Avoided by Use of Alternative Work Schedules ▪ Annual current carpool and vanpool person trips
New York State Department of Transportation 511NY Rideshare TDM Program
The New York State DOT 511NY Rideshare TDM program performance measures include:
TDM Systems, Rideshare Matching Systems
▪ Total Membership Size ▪ New Members, monthly and annually ▪ Number of Shuttles in Operation/Supported
▪ Total number of Vanpools in Operation/Supported
Marketing Promotions Participation in Events
▪ Number of Transportation Day Events ▪ Local Marketing/Promotions Outcomes ▪ Number of Individuals Receiving Transportation Information, by Type of Request ▪ Website Usage ▪ Social Media Followers (New, Total)
Outreach to Employers
▪ Number of Employers Provided with Technical Assistance ▪ Number of Employers Implementing Transportation Programs ▪ Number of Employees with Access to Transportation Programs
2 Commuter Assistance Program Evaluation, 2012, Edward L. Hillsman and Philip Winters, Center for Urban Transportation Research, University of South Florida.

27 of 32
Outreach to Prospective Program Participants, Employers, Organizations
▪ Number of Employees with Access to Transportation Programs ▪ Number of Meetings with Employers
Support and Outreach to (Existing) Program Participants
▪ Number of Employers Implementing Transportation Programs ▪ Number of Shuttles in Operation/Supported ▪ Total number of Vanpools in Operation/Supported ▪ Number of Guaranteed Ride Home Registrations, New and Total ▪ Trip Tracker Usage (e.g., number of trips tracked, by mode, by month, etc.) ▪ Trip Tracker Usage (e.g., number of trips tracked, by mode, by month, etc.)
Metropolitan Washington Council of Governments Commuter Connections Program
The Commuter Connections TDM program measures are grouped into four categories, of which individual performance metrics will depend on specific strategies or tactics implemented in a given reporting period.3 The four categories and measures in each include:
TDM Systems, Rideshare Matching Systems
▪ Number of commuters participating in ‘Pool Rewards’ ▪ Number of GRH applicants ▪ Number of one-time exception users ▪ Percentage of GRH participants who take a GRH trip ▪ Mode Utilization: number of commuters placed into alternative modes, including
carpooling, vanpooling, walking, bicycling, public transportation, or teleworking ▪ Online system placement rate ▪ GRH placement rate ▪ Telework placement rate ▪ Alternative mode use at worksites with commuter assistance programs (placements) ▪ Direct change placement rates from mass marketing (temporary and continued change)
Marketing Promotions Participation in Events
▪ Number of riders participating in Bike to Work ▪ Participants’ frequency of bike commuting before and after the Bike to Work Day event ▪ Number of commuters participating in Car Free Day ▪ Participants’ frequency of alternative mode use before and after Car Free Day ▪ Participants’ frequency of bike commuting before and after the Bike to Work Day event ▪ Number of commuters participating in Car Free Day ▪ Participants’ frequency of alternative mode use before and after Car Free Day
3 Commuter Connections Transportation Demand Management Evaluation Project, Transportation Emission Reduction Measures Revised Evaluation Framework, 2017.

28 of 32
▪ Participants’ frequency of alternative mode use before, during, and after ‘Pool Rewards
Outreach to Employers
▪ Program Awareness: portion of respondents who recognize the program brand and who are aware of their transportation options
▪ Percentage of regional commuters aware of Commuter Connections programs/services
▪ Percentage of regional commuters who are aware of ad campaign and messages ▪ Number of employers that receive telework assistance from Commuter Connections ▪ Number of employers that implement/expand telework programs after receiving
assistance
Outreach to Prospective Program Participants, Employers, Organizations
▪ Number of commuters who receive telework information from Commuter Connections ▪ Number of commuters who begin teleworking after receiving assistance ▪ Number of new teleworkers – home-based and non-home based ▪ Participants’ frequency of alternative mode use before, during, and after ‘Pool
Rewards
Support and Outreach to (Existing) Program Participants
▪ Number of employer clients (employers with commuter assistance programs and employers with bicycle programs) – total and new/expanded
▪ Number of employees at client worksites (worksites with commuter assistance programs and bicycle pro-grams) – total and new/expanded
▪ Level/extent of employers’ commuter assistance programs ▪ Number of employers that receive telework assistance from Commuter Connections ▪ Number of employers that implement/expand telework programs after receiving
assistance
Monitoring & Evaluating TDM Program Impacts There are similarities among TDM programs’ evaluation of program impacts. Most programs evaluate their impacts in terms of congestion reduction and air quality improvements (such as trips reduced, vehicle miles traveled reduced or emissions reduced), largely because these metrics are of interest to the CMAQ program—the funding source most commonly used for TDM programs. Many of these impacts are calculated based on VMT reductions, which is in turn calculated through surveys, or models such as TRIMMS (described below).
Florida Department of Transportation Commuter Assistance Program
The Florida Department of Transportation Commuter Assistance Program uses the Trip Reduction Impacts of Mobility Management Strategies (TRIMMS) model (http://trimms.com) to estimate the impacts of TDM on various societal benefits based on VMT reductions.

29 of 32
The impacts they measure include:
VMT reduction: total and per capita, tenant, employee, mode/TDM program
▪ Vehicle miles of travel reduced ▪ Vehicle trips reduced ▪ Air Pollution ▪ GHG ▪ Congestion ▪ Excess Fuel consumption ▪ Noise Pollution ▪ Health & Safety (costs associated with crashes) ▪ Annual current carpool and vanpool person miles of travel ▪ Customer round-trip commutes avoided by use of telework ▪ Customer round-trip commutes avoided by use of alternative work schedules
User experience in using alternative modes
▪ Customer satisfaction ▪ Customer satisfaction – would recommend
Mode shift (change in percent of population commuting per mode)
▪ Percent of drive-alone customers switching to a commute alternative (the most restrictive definition)
▪ Percent of drive-alone customers switching to a commute alternative (a more generous definition)
Traveler cost savings: total and per commuter
▪ Cost savings to commuters (saving based on only fuel, tire, maintenance and reduced depreciation costs)
Emissions reductions: total and per capita
▪ Gasoline consumption reduced ▪ Carbon Dioxide ▪ Carbon footprint (CO2 Equivalent)
New York State Department of Transportation 511NY Rideshare TDM program
The New York State Department of Transportation 511NY Rideshare program measures the impacts of TDM activities in terms of reduction of VMT, vehicle trips and GHG emissions. Other impacts that NYSDOT measures include emergency preparedness and support in response to roadway and transit construction projects, and unplanned emergencies such as severe winter storms or hurricanes.
The 511NY Rideshare program has also implemented new measures for the program year 2018/2019, in response to large corporations and local business communities requesting

30 of 32
assistance with improving access to jobs. These new performance metrics are intended to measure the impacts on economic development and overall mobility, based on the number of transportation programs implemented at worksites/universities, and the number of employees/students/commuters who have access to those programs and services.
The impacts they measure include:
VMT reduction: total and per capita, tenant, employee, mode/TDM program
▪ VMT Reductions ▪ Trip Reductions ▪ GHG Emissions reductions
NYSDOT calculates those by conducting a placement survey for all program participants, asking them how they traveled before and after participating in the program. From that survey they develop a “placement rate” which describes how many people were placed into alternative modes as a result of their participation. Placement rates are determined for each region throughout the state, as well as for each mode, and applied to all new registrants each month. This rate is then entered into calculations (which NYSDOT has developed to be specific to each region and mode) to determine VMT reductions resulting from their program.
Other impacts that NYSDOT measures include emergency preparedness and support in response to roadway and transit construction projects, and unplanned emergencies such as severe winter storms or hurricanes.
Metropolitan Washington Council of Governments, Commuter Connections Program
The Commuter Connections TDM program has established five key impact measures, in support of the Washington metropolitan region’s efforts to meet the conformity requirements of federal transportation and clean air mandates:
1. Vehicle trips reduced 2. Vehicle miles of travel (VMT) reduced 3. Emissions reduced: Volatile Organic Compounds (VOC), Oxides of Nitrogen (NOx),
Particulate Matter (PM2.5), and Carbon Dioxide (CO2) and other associated greenhouse gases
4. Energy reduction (fuel saving) 5. Consumer saving (commuting cost saving)
They use the TRIMMS model to calculate the impact of their programs on trips and VMT reduced, and use their own factor specific to the regional vehicle fleet composition to calculate reductions in emissions. In addition, they measure the success of their programs through:
Facility Usage for Active Transportation
▪ Program Satisfaction: primarily qualitative measures to assess whether program services are meeting customer needs and expectations
▪ Applicant satisfaction with online service

31 of 32
▪ Satisfaction of GRH users with the service ▪ Employer satisfaction with outreach assistance and services
User Experience in Using Alternative Modes
▪ Attitudes: changes in attitudes and behavior as a direct result of mass marketing campaigns, measured via general population surveys
▪ Percentage of commuters with positive attitudes toward alt modes (e.g., willingness to try)
In addition to traditionally measured TDM program impacts, the Center for Regional Economic Competitiveness released a guidance document in July 2017 that includes recommendations that are directly applicable to the field of TDM, specifically the development of performance measures that could be used to evaluate the impacts of TDM on economic development and overall mobility. The Center recommends against measuring a region’s economic health only in terms of the number of jobs or wages. Instead, they recommend metrics that measure the improvement in “job quality.” Specifically, they suggest measuring job quality in terms of the number and types of benefits offered, such as flexibility and work-life balance (e.g., job sharing, alternative work schedules, and addressing barriers to work such as child care, housing, and transportation). A TDM program can be a critical component of job quality by delivering benefits such as information for employers on alternative work schedules (telework, compressed work weeks), and housing as they relate to transportation (first-mile/last-mile solutions).
Many TDM programs already collect these metrics, and communicating these outcomes and how they support economic development and overall mobility could be simply added to existing regional and statewide reports.
Alignment with Regional/State Transportation Goals The TDM programs surveyed generally align their performance measures with regional or state goals.
Florida Department of Transportation Commuter Assistance Program
The Florida Department of Transportation Commuter Assistance Programs continually strive to align TDM program performance measures with regional goals and acknowledge that the process will continue to evolve over time. For example, FDOT recognizes that the statewide goal for enhancing livable communities means “providing more choices for where Floridians can live requires more effective transportation options”. 4
4 Commuter Assistance Program Evaluation, 2012, Edward L. Hillsman and Philip Winters, Center for Urban Transportation Research, University of South Florida.

32 of 32
New York State Department of Transportation 511NY Rideshare TDM program
The New York State Department of Transportation 511NY Rideshare Program recently revised program performance metrics to be more closely aligned with state transportation goals, including support for Active Transportation Demand Management (ATDM), emergency preparedness and response. NYSDOT also includes key program impacts, such as VMT and GHG reductions, in their annual State Energy Plan.
Oregon State Department of Transportation, Transportation Options program
The Oregon Department of Transportation (ODOT) has acknowledged that access to jobs, goods, and services is a key goal, and established three statewide TDM performance measures for their statewide TDM Program, Transportation Options: 5
• Number of transportation options staff per capita: Tracking the number of staff per capita is a useful measure given the importance of transportation options staff to conduct outreach, deliver information, and manage programs.
• Motor vehicle miles traveled (VMT) per capita: As VMT per capita declines, more people are able to use the transportation system and system reliability is improved for freight. VMT can also be translated into environmental measures, such as carbon dioxide emissions or air pollutants and may inform future travel time measures.
• Percent of trips that use a mode other than driving alone during the peak hour: Tracking mode share during the peak hour documents congestion and system efficiency benefits.
Metropolitan Washington Council of Governments, Commuter Connections Program
The Metropolitan Washington Council of Governments National Capital Region Transportation Planning Board establishes transportation and air quality goals for the Commuter Connections program, considering the region’s long range transportation goals. 6 Commuter Connections’ performance evaluation methodology is specifically designed to quantify how the program is contributing to the regional goals, including reducing congestion, improving air quality, reducing energy consumption, and improving mobility and accessibility.
5 Oregon Transportation Options Program, 2018 Snapshot, Oregon Department of Transportation. 6 Washington, D.C. Commuter Connections Transportation Demand Management Evaluation Project, Transportation Emission Reduction Measures Revised Evaluation Framework, 2017.

SC A G TDM Strategic Plan and F inal Report
G TDM Toolbox

Education & Marketing
Safe Routes to School Programs
Implementors
Other stakeholders
Education & Marketing
Safe Routes to School Programs (SRTS) involve working with schools and school districts to promote safe active transportation modes for students in order to reduce the number of parent drop-offs.
Implementation tips
Employers / Property Managers / TMAs
• TMAs/TMOs
• Educational institutions
• Property managers – residential
Public Agencies / Transportation Providers
• School districts
• Municipalities
• Transit agencies
• Regional government/MPOs
• Can require involvement from law enforcement
• Requires ongoing funding for modal change and effectiveness
• Coordination required among school districts, cities, and transit providers
• Reduces congestion during peak periods
• Increases safety for students
• Increases health/fitness
Safe Routes to School Programs can be implemented through events such as group bicycle or walking trips or bicycle safety workshops. Programs can also provide rewards to students or their parents for traveling by foot, bike, or in a carpool, and can leverage technology for trip tracking and incentive provision.
Benefits →
Challenges →
VMT Reduction:
VMT Reduction:
Impact varies based on number of students and parents interacting with TMAs, schools and property managers.
Impact varies based on size of school district and active transportation infrastructure.
1
Students School administration
Bicycle education organizations
Congestion impacts
Parents dropping off children at school represents a significant level of morning local congestion (10 to 15%). Increasing the number of students walking or bicycling can reduce local congestion.
Measurement
Outcomes Impacts Methods
• Number of students participating in SRTS-related activities and events
• Drop-off time
• Mode split among students
• Survey results
• Congestion monitoring on roadways surrounding schools Durfee Elementary School in El
Monte operates “walking school buses,” and uses the opportunity to teach students about environmental issues along the way.
SRTS-style programs can also be expanded to support non-school populations. Los Angeles Walks operates Safe Routes for Seniors program that helps seniors get around safely on foot.
As seen in the SCAG region
Complementary strategies
• Bicycle infrastructure improvements
• Pedestrian infrastructure improvements
Costs
Typically funded through Federal and State grants specific to Safe Routes to School and Active Transportation. Additional costs may be incurred from associated events or promotional material.
Law enforcement Parents Teachers
Residents / businesses
Planning and engineering departments
Public Health Departments

Education & Marketing
Marketing Campaigns
Implementors
Other stakeholders
Education & Marketing
Marketing campaigns can promote other TDM programs, as well as non-SOV travel itself. They often include the dispersion of printed material and web promotion through email and social media.
Implementation tips
Employers / Property Managers / TMAs
• Large employers
• TMAs/TMOs
• Educational institutions
• Property managers – office, retail, residential
Public Agencies / Transportation Providers
• Municipalities
• Transit agencies
• Regional government/MPOs
• County transportation authorities
• Can be difficult to measure impacts on congestion or air quality
• Requires ability to reach target audiences
• Increases visibility of TDM programs and non-SOV modes
• Campaigns can be produced at a variety of price points
Some marketing campaigns target specific groups of travelers, such as tourists, cyclists or commuters from one community, or reach broader groups through platforms with high volumes of users such as 511 programs.
Benefits →
Challenges →
VMT Reduction:
VMT Reduction:
Impact varies by size and reach of campaigns.
Impact varies by size and reach of campaigns. Campaigns that target specific populations are more successful
2
Employees Visitors to TMA areas
Congestion impacts
Successful campaigns that result in behavior change will decrease congestion.
Measurement
Outcomes Impacts Methods
• Number of impressions or engagements
• Participation in TDM programs
• Transit ridership
• Participant lists
• Transit ridership data Orange County Transportation
Authority and IE Commuter in San Bernardino and Riverside counties develop marketing material for employee transportation coordinators (ETCs) in Orange County and the Inland Empire to present to their respective employees.
City of Santa Monica Big Blue Bus produced a video explaining how to ride bicycles on their buses.
As seen in the SCAG region
Complementary strategies
• Subsidization of non-SOV travel
• Mobility as a Service provision
• Employee commute programs
Costs
Cost varies by size and reach of the marketing campaign. Incurred costs may include graphic design, printing and ad space purchase, events or promotional material.
Transit riders
Residents ETCs
Students

Education & Marketing
Educational Events
Implementors
Other stakeholders
Education & Marketing
Educational events provide an opportunity for TDM implementors to interact directly with travelers to encourage behavior change.
Implementation tips
Employers / Property Managers / TMAs
• Large employers
• Small employers
• TMAs/TMOs
• Property managers - office, retail, residential
• Educational institutions
Public Agencies / Transportation Providers
• Municipalities
• Transit agencies
• County transportation authorities
• Can be difficult to measure impacts on congestion or air quality
• Increases the visibility of TDM programs and non-SOV modes
• Makes potential users more comfortable with new travel modes
Educational events can take many forms, including:
Tabling events: ETC or agency rep sets up a table in a high-traffic area (cafeteria, transit station) and provides resources about TDM programs and travel options.
‘Try Transit’ events: Sometimes people are hesitant to try new modes because they don’t know how to do it. Events that introduce them to taking the bus or riding bikes can help them feel more comfortable in the future.
Zip Code Parties: Help employees find others with whom they could carpool and vanpool by introducing them to others who live or work in the same zip code.
Benefits →
Challenges →
VMT Reduction:
VMT Reduction:
Impact varies by attendance and scope of event
Impact varies by attendance and scope of event.
3
Congestion impacts
Successful events that result in behavior change can decrease congestion.
Measurement
Outcomes Impacts Methods
• Number of event attendees or persons spoken to at events
• Satisfaction
• Mode split among attendees
• Survey results
National Bike Month is celebrated throughout the SCAG Region with events held by county organizations, municipalities, TMAs/TMOs, and individual employers.
SCAG hosts events throughout the region as a part of their Go Human campaign which encourages walking and biking.
As seen in the SCAG region
Complementary strategies
• Guaranteed ride home programs
• Carpool coordination
• Individualized/personalized marketing
Costs
Costs vary based on size and scope of event.
ETCs
Planning and engineering departments
Public Health Departments
Employees
Students
Commuters
Residents Bicycle education organizations

Education & Marketing
Wayfinding Upgrades
Implementors
Other stakeholders
Education & Marketing
Wayfinding is crucial to ensuring travelers can get where they need to go. It is particularly important to have thorough signage within transit stations and mobility hubs. On-street signage and mobile information can improve the visibility of transit, bicycle and pedestrian amenities.
Implementation tips
Public Agencies / Transportation Providers
• Municipalities
• Transit agencies
• Parking lot owners/operators
• County transportation authorities• May have trouble reaching travelers
who are vision impaired or cannot read the language used
• Impacts are difficult to measure
• Increases the visibility of TDM programs and non-SOV modes
• Makes potential users more comfortable with new travel modes
Wayfinding within a transit station can help encourage travelers to use alternative modes for their first and last mile. Bus stations and bicycle racks should be clearly marked and easy to access.
Benefits →
Challenges →
VMT Reduction:
Wayfinding can be impactful by increasing transit ridership, but may not show measureable impacts.
4
Transit agencies
Congestion impacts
Wayfinding that encourages repeat travelers on transit or other modes will reduce congestion.
Measurement
Outcomes Impacts Methods
• Inquiries to on-site personnel/security/staff
• User feedback
• Mode split
• Transit ridership
• Use of advertised first/last mile options
• Analysis of recorded feedback
The City of Santa Monica has provided window clings to local businesses highlighting the time required to reach major attractions by foot, reminding travelers they might be able to comfortably walk to their destinations.
As seen in the SCAG region
Complementary strategies
• Bicycle transit integration
• Transit improvements
• Pedestrian infrastructure improvements
Costs
Costs often include design as well as signage itself.
Graphic designers and sign vendors
Commuters

Education & Marketing
Individualized/Personalized Marketing
Implementors
Other stakeholders
Education & Marketing
Individualized Marketing involves targeting travelers who are most likely to change their behavior and encouraging them to participate in a program or use a mode to travel. Talking points or marketing geared specifically toward those groups are developed.
Implementation tips
Employers / Property Managers / TMAs
• Large employers
• Small employers
• TMAs/TMOs
• Educational institutions
• Property managers - office, residential
Public Agencies / Transportation Providers
• Municipalities
• Transit agencies
• County transportation authorities
• Regional government/MPOs
• Can be resource intensive to run and may require external support
• Can run into privacy issues with using personal data
• Likely to be more successful in changing behavior than other types of marketing
It can be beneficial to implement individualized marketing where infrastructure or service improvements have been made to ensure that potential users are aware of those improvements and how they can benefit from using them.
In an organizational setting it might be beneficial to target groups who have expressed an interest in trying out new modes of travel or those whose trips could be made easily with a non-SOV mode. These groups can be identified through survey results or personal data as it is available.
Benefits →
Challenges →
VMT Reduction:
VMT Reduction:
Individualized marketing can be quite successful, but requires resource to be impactful on a large scale.
Individualized marketing can be quite successful, but requires resource to be impactful on a large scale.
5
Congestion impacts
Successful campaigns that result in behavior change will decrease congestion.
Measurement
Outcomes Impacts Methods
• Number or percentage of engagements or individuals reached
• Number of individuals who changed their behavior
• Transit ridership
• VMT reduction
• Program registrations
• Survey results
A major employer in the SCAG Region used zip code data to target the employees who would pilot their new commute program, complete with fully subsidized transit passes. They invited employees who lived along a major transit line to participate, as those employees would likely benefit most from their transit subsidy.
As seen in the SCAG region
Complementary strategies
• Marketing campaigns
• Transit improvements
• Private shared transportation/shuttles
Costs
Costs for marketing campaigns may include staff time to speak to the target audience, as well as costs of information and incentives.
Transit agencies
Commuters
Employees
Students
Residents

ETCs
Carpooling is an effective way to reduce congestion by using the available seating capacity in personal vehicles. Employers and public agencies can facilitate carpool formation through the provision of online ridematching platforms.
Employers / Property Managers / TMAs
• Large employers
• Small employers
• TMAs/TMOs
• Educational institutions
• Property managers - office, residential
Public Agencies / Transportation Providers
• Municipalities
• Transit agencies
• County transportation authorities
• Regional governments/MPOs
• Carpool platform operators
• People may be hesitant to travel with those they do not know
• Pool of employees or residents to create carpools may be too small in some locations
• Travelers interested in carpooling are often regularly traveling to one central location
• Travelers using public, open systems to find matches have a larger pool of users, and a better chance of finding a match
Carpool rides can be established in two manners:
Traditional Carpooling: Carpool partners find each other organically or through a ridematching platform and agree to drive together. Passengers may pay drivers based on their individual agreements.
Dynamic Carpooling: Carpool partners find each other through mobile applications and schedule each ride individually. This allows for travelers with irregular schedules to carpool without committing to one person every day.
Benefits →
Challenges →
VMT Reduction:
VMT Reduction:
Carpool coordination can be more successful at the site level where commuters are familiar with each other.
Carpool coordination can be more difficult at an area-wide level where commuters are connected with strangers.
6
Congestion impacts
Outcomes Impacts Methods
• Number of participants who register for program or express interest in carpooling
• Number of carpool matches provided
• Number of carpools created
• Number of people carpooling over time
• Survey results
• Data collected from trips logged or recorded on platforms
Los Angeles, Orange, San Bernardino, Riverside and Ventura Counties provide ridematching platforms for commuters and employers in their counties.
As seen in the SCAG region
Complementary strategies
• Direct incentives for non-SOV travel
• Subsidization of non-SOV travel
• Parking facility design and curbside management (designated carpool parking spaces)
• Guaranteed Ride Home programs
Costs
Carpooling costs for riders usually offset the cost incurred by the driver. Agencies who wish to provide ridematching platforms may pay developers for access to their tools.
Incentives & Facilitation
Carpool Coordination
Measurement
Other stakeholders
Implementors
Implementation tips
Incentives & Facilitation
Successful campaigns that result in behavior change will decrease congestion.
Employees Students
Residents Parking lot owners/operators

ETCs
Vanpool coordination involves coordinating commuters who take similar trips and providing them access to a vehicle to travel together.
Employers / Property Managers / TMAs
• Large employers
• Small employers
• TMAs/TMOs
• Property managers – office
Public Agencies / Transportation Providers• School Districts
• Municipalities
• Transit Agencies
• County transportation authorities
• Regional Government/MPOs
• Requires agreements between the public and private sectors which may cause concerns with liability
• Limited park and ride capacity may be difficult to provide sufficient support for vanpool activity in some areas
• Vanpool riders and drivers save money they would otherwise spend on long commutes
• Riders can spend time on work or leisure instead of driving
Vanpooling provides a cost-effective means of travel for employees commuting long distances. Often, employers or public agencies will subsidize the cost of registered vanpools even further.
Benefits →
Challenges →
VMT Reduction:
VMT Reduction:
Vanpool coordination is impactful in reducing VMT as it works especially well for long-distance commuters.
Public agencies can play a central role in working with vanpool operators and providing subsidies for vanpool travel, thus increasing impact.
7
Congestion impacts
Vanpool travel that reduces SOV trips will result in decreased congestion.
Outcomes Impacts Methods
• Number of participants who register for program or express interest in vanpools
• Number of people riding in a vanpool
• Number of vanpools created
• Number of participants using vanpools
• Mode split over time
• Survey results
• Data collected from vanpool providers or subsidy programs
Imperial, Los Angeles, Orange, San Bernardino, Riverside and Ventura Counties provide subsidies to vanpools operating through various approved vendors.
As seen in the SCAG region
Complementary strategies
• Direct incentives for non-SOV travel
• Subsidization of non-SOV travel
• Parking facility design and curbside management (designated vanpool spaces)
• Guaranteed Ride Home programs
Costs
The cost of renting and operating a vanpool are split among users. Employers and public agencies often subsidize the cost of operating vanpools to make the mode more attractive to commuters
Vanpool providers
Incentives & Facilitation
Vanpool Coordination
Measurement
Other stakeholders
Implementors
Implementation tips
Incentives & Facilitation
Employees
Parking lot owners/operators

Telecommuting describes the process of an employee working from home or a satellite office close to their home, rather than commuting to their traditional workplace.
Employers / Property Managers / TMAs
• Large employers
• Small employers
• TMAs/TMOs
• Property managers - residential• Telecommuting is only appropriate
for some industries, may not work universally
• Can reduce VMT and congestion, particularly during peak periods
• Provides time savings for employees
The concept of telecommuting can be expanded beyond the virtual workplace. Remote options for appointment-based and educational services can cut back on daytime SOV travel, congestion and VMT.
Benefits →
Challenges →
VMT Reduction:
Telecommuting directly reduces trips and VMT.
8
Congestion impacts
Each trip not taken due to the ability to work or perform tasks remotely removes a car from the road.
Outcomes Impacts Methods
• Number of employees who telecommute
• Number of days employees telecommute
• Survey results
• Traffic data
In 2019, SCAG conducted a “Future of the Workplace” study to evaluate the nature of employment and the workplace and address its impact on greenhouse gas emissions in the Region.
As seen in the SCAG region
Complementary strategies
• Congestion pricing
• Parking pricing
• Employee commute programs
Costs
The cost of supporting telecommuting includes initial costs (such as remote computers) for employees but may reduce cost of office space, events or promotional material.
Developers/property managers
Incentives & Facilitation
Telecommuting
Measurement
Other stakeholders
Implementors
Implementation tips
Incentives & Facilitation
Employees
• Trips reduced as a result of telecommuting
• VMT reduced

Alternative work schedules can reduce the number of vehicles traveling during peak periods by allowing employees to arrive at and leave the workplace outside of peak hours every day, and reduce overall trips through compressed schedules.
Employers / Property Managers / TMAs
• Large employers
• Small employers
• TMAs/TMOs
• Property managers - residential • Minor employer costs to manage
• May not work universally
• Decreases peak period VMT
• Improves travel time for participants
Alternative work schedules can take various forms:
Flexible Work Schedules: Employees are able to choose hours that are convenient to them, allowing them to commute outside of peak travel times.
Staggered Shifts: Employers provide regular staggered shifts for employees, leading to workplace coverage for longer during the day and reducing trips taken during peak travel times.
Compressed Work Weeks: Employees work longer days, fewer days per week. Longer days increase the chances that commutes will take place outside of peak hours, and fewer work days per week mean fewer trips taken by employees overall.
Benefits →
Challenges →
VMT Reduction:
Alternative work schedules that allow for off-peak travel can reduce congestion. Compressed work weeks can reduce trips and VMT.
9
Congestion impacts
Peak hour VMT is improved and participants may see improved travel time.
Outcomes Impacts Methods
• Number of employees who travel off-peak
• Number of off-peak trips taken
• Number of employees who work compressed schedules
• Trips reduced as a result of alternative work schedules
• Peak hour trips reduced
• Survey results
• Traffic data
The South Coast Air Quality Management District operates its entire facility on a four-day per week schedule, decreasing commute trips among employees by 20%.
Other employesr throughout the region operate similar programs.
As seen in the SCAG region
Complementary strategies
• Telecommuting
• Congestion Pricing
Costs
There is little direct cost associated with alternative work schedules, but minor costs may be associated with managing work schedules.
Incentives & Facilitation
Alternative Work Schedules
Measurement
Other stakeholders
Implementors
Implementation tips
Incentives & Facilitation
Employees
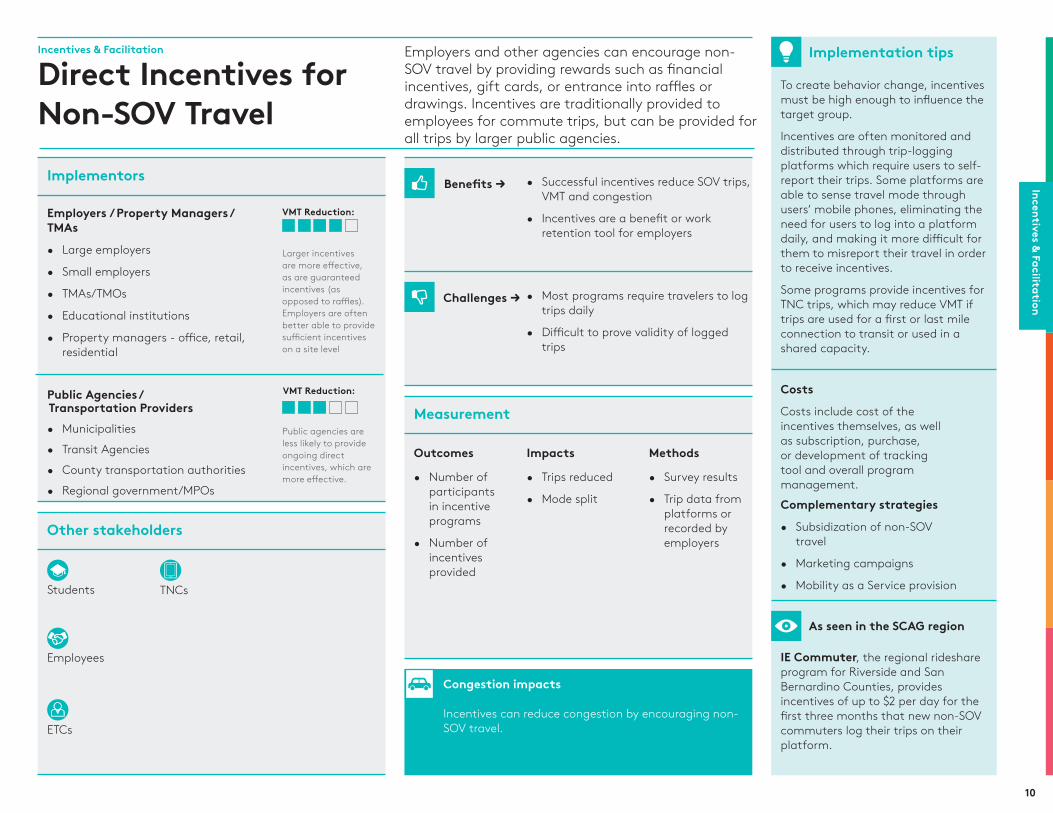
Employers and other agencies can encourage non-SOV travel by providing rewards such as financial incentives, gift cards, or entrance into raffles or drawings. Incentives are traditionally provided to employees for commute trips, but can be provided for all trips by larger public agencies.
Employers / Property Managers / TMAs
• Large employers
• Small employers
• TMAs/TMOs
• Educational institutions
• Property managers - office, retail, residential
Public Agencies / Transportation Providers• Municipalities
• Transit Agencies
• County transportation authorities
• Regional government/MPOs
• Most programs require travelers to log trips daily
• Difficult to prove validity of logged trips
• Successful incentives reduce SOV trips, VMT and congestion
• Incentives are a benefit or work retention tool for employers
To create behavior change, incentives must be high enough to influence the target group.
Incentives are often monitored and distributed through trip-logging platforms which require users to self-report their trips. Some platforms are able to sense travel mode through users’ mobile phones, eliminating the need for users to log into a platform daily, and making it more difficult for them to misreport their travel in order to receive incentives.
Some programs provide incentives for TNC trips, which may reduce VMT if trips are used for a first or last mile connection to transit or used in a shared capacity.
Benefits →
Challenges →
VMT Reduction:
VMT Reduction:
Larger incentives are more effective, as are guaranteed incentives (as opposed to raffles). Employers are often better able to provide sufficient incentives on a site level
Public agencies are less likely to provide ongoing direct incentives, which are more effective.
10
Congestion impacts
Incentives can reduce congestion by encouraging non-SOV travel.
Outcomes Impacts Methods
• Number of participants in incentive programs
• Number of incentives provided
• Trips reduced
• Mode split
• Survey results
• Trip data from platforms or recorded by employers
IE Commuter, the regional rideshare program for Riverside and San Bernardino Counties, provides incentives of up to $2 per day for the first three months that new non-SOV commuters log their trips on their platform.
As seen in the SCAG region
Complementary strategies
• Subsidization of non-SOV travel
• Marketing campaigns
• Mobility as a Service provision
Costs
Costs include cost of the incentives themselves, as well as subscription, purchase, or development of tracking tool and overall program management.
Students
Incentives & Facilitation
Direct Incentives for Non-SOV Travel
Measurement
Other stakeholders
Implementors
Implementation tips
Incentives & Facilitation
ETCs
TNCs
Employees

Employers and other agencies can encourage non-SOV travel by subsidizing the cost of carpooling, vanpooling, transit or first/last mile trips.
Employers / Property Managers / TMAs
• Large employers
• Small employers
• TMAs/TMOs
• Educational institutions
• Property managers - office, residential
Public Agencies / Transportation Providers
• Municipalities
• Transit agencies
• County transportation authorities
• Regional government/MPOs
• Subsidies provided by transit agencies can result in a decrease of revenue if not recaptured by increased ridership
• Programs can be costly, particularly for small employers
• Reduces SOV trips, VMT and congestion
• Subsidized travel is a benefit or work retention tool for employers
• Increases transit ridership (if targeted at transit)
Travel subsidies can take place through reimbursements or through formal programs reducing the cost of travel. Many transit agencies and TNCs (often used for first/last mile trips or to provide Guaranteed Rides Home) provide the option for employers to cover all or part of the cost of their service for their employees. Transit agencies often subsidize the cost of trips when provided to particular groups such as older adults or students.
Benefits →
Challenges →
VMT Reduction:
VMT Reduction:
Impact varies based on subsidy amount.
Impact varies based on subsidy amount and populations targeted.
11
Congestion impacts
Increased use of non-SOV modes through travel subsidization will reduce congestion.
Outcomes Impacts Methods
• Number of participants registered to receive subsidies
• Transit ridership
• VMT reduced
• Survey results
• Transit ridership data
• Data from first/last mile providers
Los Angeles Metro’s U-Pass Pilot Program subsidizes the cost of monthly transit passes for university students, and facilitates the process by allowing students to purchase passes through their universities.
As seen in the SCAG region
Complementary strategies
• Direct incentives for non-SOV travel
• Marketing campaigns
• Mobility as a Service provision
Costs
Costs include cost of the subsidies, as well as the cost of administering subsidy programs on both the employer/property manager/TMA side and the side of the transit provider.
Incentives & Facilitation
Subsidization of Non-SOV Travel
Measurement
Other stakeholders
Implementors
Implementation tips
Incentives & Facilitation
ETCsEmployees
Students
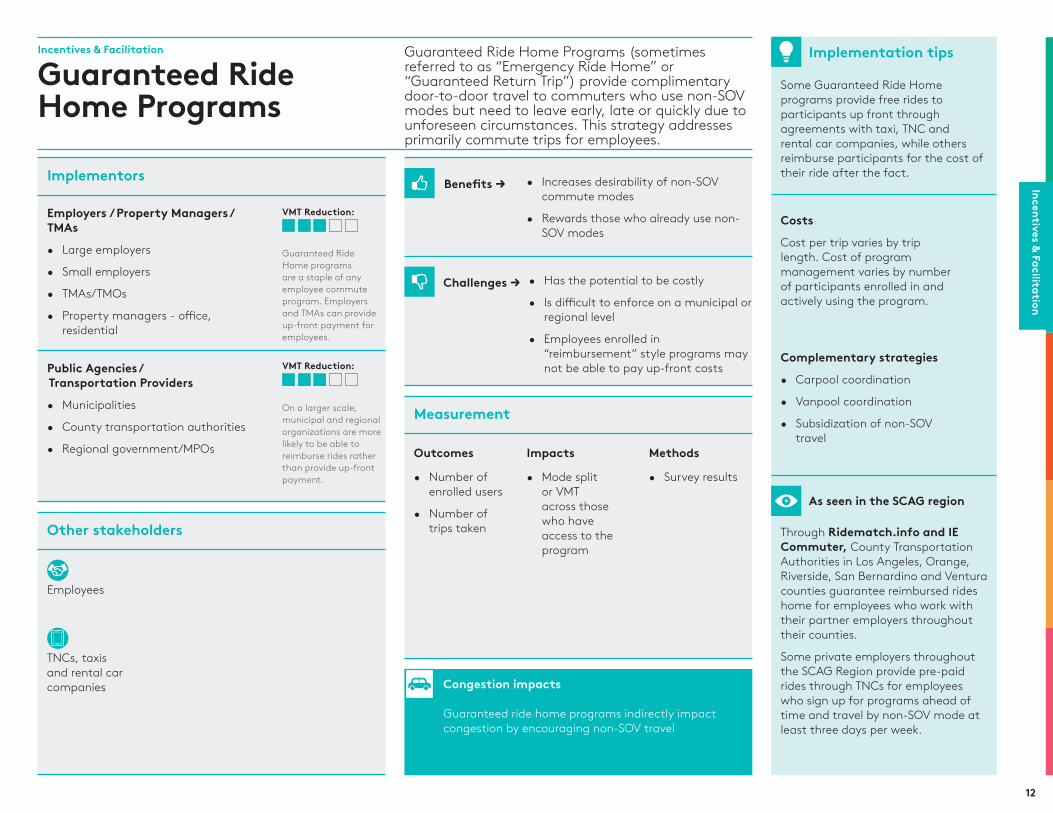
Guaranteed Ride Home Programs (sometimes referred to as “Emergency Ride Home” or “Guaranteed Return Trip”) provide complimentary door-to-door travel to commuters who use non-SOV modes but need to leave early, late or quickly due to unforeseen circumstances. This strategy addresses primarily commute trips for employees.
Employers / Property Managers / TMAs
• Large employers
• Small employers
• TMAs/TMOs
• Property managers - office, residential
Public Agencies / Transportation Providers
• Municipalities
• County transportation authorities
• Regional government/MPOs
• Has the potential to be costly
• Is difficult to enforce on a municipal or regional level
• Employees enrolled in “reimbursement” style programs may not be able to pay up-front costs
• Increases desirability of non-SOV commute modes
• Rewards those who already use non-SOV modes
Some Guaranteed Ride Home programs provide free rides to participants up front through agreements with taxi, TNC and rental car companies, while others reimburse participants for the cost of their ride after the fact.
Benefits →
Challenges →
VMT Reduction:
VMT Reduction:
Guaranteed Ride Home programs are a staple of any employee commute program. Employers and TMAs can provide up-front payment for employees.
On a larger scale, municipal and regional organizations are more likely to be able to reimburse rides rather than provide up-front payment.
12
Congestion impacts
Guaranteed ride home programs indirectly impact congestion by encouraging non-SOV travel
Outcomes Impacts Methods
• Number of enrolled users
• Number of trips taken
• Mode split or VMT across those who have access to the program
• Survey results
Through Ridematch.info and IE Commuter, County Transportation Authorities in Los Angeles, Orange, Riverside, San Bernardino and Ventura counties guarantee reimbursed rides home for employees who work with their partner employers throughout their counties.
Some private employers throughout the SCAG Region provide pre-paid rides through TNCs for employees who sign up for programs ahead of time and travel by non-SOV mode at least three days per week.
As seen in the SCAG region
Complementary strategies
• Carpool coordination
• Vanpool coordination
• Subsidization of non-SOV travel
Costs
Cost per trip varies by trip length. Cost of program management varies by number of participants enrolled in and actively using the program.
Incentives & Facilitation
Guaranteed Ride Home Programs
Measurement
Other stakeholders
Implementors
Implementation tips
Incentives & Facilitation
TNCs, taxis and rental car companies
Employees

Mobility as a Service describes the process of allowing users to consume multiple aspects of transportation service through a single platform. It facilitates trip planning, payment and multimodal travel, so users can plan, hail or access, and pay for trips all in one place.
Public Agencies / Transportation Providers
• Municipalities
• Transit agencies
• TNCs
• Private transportation providers
• Regional governments/MPOs
• County transportation authorities
• Public/private partnerships can be difficult to navigate
• Technology is evolving rapidly, and few industry standards have been set
• Increases visibility of non-SOV modes through inclusion in the trip planning process
• Facilitates multimodal travel, decreasing need for SOV trips
Mobility as a Service tools are being developed and expanded at a rapid pace. Groups like the MaaS Alliance in Europe are convening public and private agencies to make further advancements in the MaaS field.
MaaS often involves TNC trips, which may reduce VMT if trips are used for a first or last mile connection to transit or used in a shared capacity.
Benefits →
Challenges →
VMT Reduction:
MaaS has the potential to be very impactful as it will change the manner in which trips are planned, scheduled and paid for.
13
Congestion impacts
Mobility as a Service has the potential to significantly reduce congestion by facilitating easier multimodal and non-SOV travel.
Outcomes Impacts Methods
• Number of users
• Number of trips planned
• Number of non-SOV trips taken
• VMT reduced
• Data received from MaaS providers
Los Angeles Metro has announced their plan to develop a MaaS platform called “Tap Force,” which will be an account-based system allowing users to pay for various travel modes in addition to Metro’s current transit services.
As seen in the SCAG region
Complementary strategies
• Dockless/mobility/new mobility programs
• Bicycle transit integration
• Private shared transportation/shuttles
• Subsidization of non-SOV travel
Costs
Costs are difficult to predict as technology is constantly changing.
Web and app developers
Incentives & Facilitation
Mobility as a Service Provision (MaaS)
Measurement
Other stakeholders
Implementors
Implementation tips
Incentives & Facilitation
Transit riders
TNC riders
Micromobility users

Carshare, or vehicles that are available for shared use, allow users to access a vehicle when it is needed decreasing the necessity for them to own their own vehicles.
Employers / Property Managers / TMAs
• Large employers
• Small employers
• Educational institutions
• Property managers - office, residential, retail
Public Agencies / Transportation Providers
• Municipalities
• Regional government/MPOs
• May still contribute to SOV travel• May require dedicated curb space/
parking• Cars need to be fueled for
convenience• May cause security issues, such as
theft and vandalism
• Reduces need for car ownership• May reduce VMT from commuters who
use carshare for lunchtime errands• May reduce emissions if car fuel is
alternative fuel source• May be used as first, last mile strategy
Carshare can be provided by the private sector at specific sites such as office buildings, apartment complexes or retail centers, or on-street for public use by public agencies.
Benefits →
Challenges →
VMT Reduction:
VMT Reduction:
Carshare on a site should be combined with other TDM strategies to be successful.
Easy access to affordable carshare in public spaces may encourage car-free lifestyles.
14
Congestion impacts
A decrease in car ownership may result in decreased congestion.
Outcomes Impacts Methods
• Number of people registered to use service
• Number of vehicles available
• Rate of car ownership
• Mode split across all trips among users
• Survey results
The City of Los Angeles operates the “Blue LA” program, providing low- cost electric carshare vehicles in low-income neighborhoods within the City.
As seen in the SCAG region
Complementary strategies
• Marketing campaigns
• Educational events
• Guaranteed ride home programs
Costs
Carshare companies often have the ability to charge partnering agencies, consumers, or a combination of the two for use of their vehicles. Cost is typically based on the amount of time that vehicles are reserved or in use.
Carshare companies
Residents
Students
Incentives & Facilitation
Carshare Provision
Measurement
Other stakeholders
Implementors
Implementation tips
Incentives & Facilitation
Employees
Developers/property managers
Planning and engineering departments
Parking lot owners/operators

If employees have access to amenities on-site or within walking distance, they are less likely to use their vehicles to make a lunchtime trip, which reduces VMT, and may be less likely to need vehicles to make stops on their way to or from work, making non-SOV options more viable.
Employers / Property Managers / TMAs
• Large employers
• Small employers
• Educational institutions
• Property managers - office, retail, residential
Developers
• Developers - office, residential, retail
• Ability to provide amenities subject to municipal regulation and zoning code
• May be expensive, particularly for smaller employers
• Reduce need for SOV trips
• Increases attractiveness to potential tenants and employees
• Makes new development more marketable
This strategy can be implemented on many levels at many stages. Developers can build space for multiple uses, large employers can often provide amenities on-site, and small employers can choose to locate where amenities are easily accessible.
Benefits →
Challenges →
VMT Reduction:
VMT Reduction:
Impacts vary based on extent and accessibility of amenities.
Impacts vary based on extent and accessibility of amenities.
15
Congestion impacts
A decrease in SOV trips for lunchtime and peak hour travel will reduce congestion.
Outcomes Impacts Methods
• Number and quality/usefulness of amenities
• Use of amenities
• Rate of car ownership among tenants/employees
• Mode split across all trips among tenants/employees
• Results from walk audits
• Lease information from property managers
The Warner Center Towers office park in the San Fernando Valley provide on-site amenities for their tenants such as a cafeteria, restaurants, on-site banking, dry cleaning, and a gym. The property manager views these amenities as a tool to attract new tenants.
Riverside County hosts a weekly farmers market outside the County offices with fresh produce and lunch foods.
As seen in the SCAG region
Complementary strategies
• Pedestrian infrastructure improvements
• Marketing campaigns
• Direct incentives for non-SOV travel
Costs
Costs will vary extensively based on the manner in which this strategy is implemented.
Residents
Students
Incentives & Facilitation
Provision of or Proximity to Amenities
Measurement
Other stakeholders
Implementors
Implementation tips
Incentives & Facilitation
Employees
Developers
Planning and engineering departments

Employee Commute Programs are operated by employers, who utilize requirements and incentives to discourage SOV travel and encourage the use of alternate modes among their employees.
Employers / Property Managers / TMAs
• Large employers
• Small employers
• Property managers - office, retail
• TMAs/TMOs
Public Agencies / Transportation Providers
• Municipalities
• County transportation authorities
• Regional government/MPOs
• Requires administrative commitment
• Programs built to support all employers in municipality or region may be less effective than individual programs, and may discourage the development of individualized programs
• Encourages non-SOV travel
• Programs operated by municipalities or TMAs reduce administrative burden of ETCs and financial burden of employers
The most successful Employee Commute Programs utilize a variety of strategies to encourage non-SOV travel. It is helpful to promote the program heavily to new employees before they have built up a habit of driving alone.
Successful programs also make use of regular monitoring and evaluation to understand which services are successful in shifting behavior and which are not. This minimizes the risk of investing financially in unsuccessful strategies.
Benefits →
Challenges →
VMT Reduction:
VMT Reduction:
Employers can provide impactful programs that are tailored specifically to their worksites.
Employer programs can be difficult for public agencies to support in a large area since programs need to be customized to each individual site.
16
Congestion impacts
Employee Commute Programs encourage alternative modes and/or trip reduction during peak hours, resulting in decreased congestion.
Outcomes Impacts Methods
• Number of employers providing programs
• Number of employees participating in programs
• Average Vehicle Ridership among employers providing programs
• Commute mode split among employees
• Survey results
• Data reported to comply with TDM regulations affecting employers (i.e. SCAQMD’s Rule 2202) County Transportation Authorities
throughout the SCAG Region assist employers across their respective counties with their commute programs. They provide support to ETCs and directly to employees through tools like their commuter calculator and rideshare platform.
As seen in the SCAG region
Complementary strategies• Marketing campaigns
• Direct incentives for non-SOV travel
• Carpool coordination
• Vanpool coordination
• TMAs/TMOs
CostsCosts will vary depending on size and scope of the program. Participation in TMA or public agency provided programs can reduce costs for employers.
Incentives & Facilitation
Employee Commute Programs
Measurement
Other stakeholders
Implementors
Implementation tips
Incentives & Facilitation
Employees
ETCs

Transportation Management Associations or Organizations (TMAs/TMOs) are entities that promote and advocate for all forms of non-SOV travel. They are localized and provide service to a specific municipality, community, district or corridor.
Employers / Property Managers / TMAs
• Large employers
• Small employers
• Property managers - residential, office, retail
Public Agencies / Transportation Providers
• Municipalities
• Regional Government/MPOs
• It can be difficult to show direct impact on congestion and VMT reduction
• May require ongoing investment
• Success relies heavily on TMA/TMO programming
• Facilitates employee commute programs
• Assists with regulation compliance
• Helps to reduce congestion and improve air quality
• Advocates for improved transportation options and access to area
Traditionally, TMAs and TMOs worked exclusively with employers to reduce SOV commute trips. TMAs can take many forms, however, and now often work closely with residents and visitors in their service areas to promote non-SOV travel and provide information and education.
When developing programming and services for TMAs/TMOs, consideration should be given to current programs offered by employers or county agencies.
Benefits →
Challenges →
VMT Reduction:
VMT Reduction:
Impact varies based on budget and service offering.
17
Congestion impacts
TMAs can support congestion reduction through various forms of education and advocacy.
Outcomes Impacts Methods
• Number of TMAs in the region
• Number of TMA members
• Average Vehicle Ridership and mode split among TMA members
• Survey results
The SCAG Region is home to ten TMAs and TMOs, the majority of which are located in Los Angeles County. Los Angeles Metro convenes the Los Angeles County TMAs regularly to allow them to share knowledge and provide support to each other.
As seen in the SCAG region
Complementary strategies
• Marketing campaigns
• Educational events
Costs
Costs associated with developing a TMA or TMO often include research and data analysis to understand the most successful structure and programmatic offering for the organization. Once the organization has launched, costs vary by structure. Some TMAs are funded strictly through membership dues, and others through public subsidies. Many are funded with a combination of both.
Residents
Incentives & Facilitation
TMAs/TMOs
Measurement
Other stakeholders
Implementors
Implementation tips
Incentives & Facilitation
Developers
• Developers - office, residential, retail
VMT Reduction:
Partnerships between TMAs and developers can further TDM regulation.
Impact varies based on budget and service offering.
Employees Developers/property managers

Federal code (Section 132(f) of the Internal Revenue Code) allows employers to provide tax-exempt funds to commuters for parking, transit and vanpool. These are considered to be tax-free benefits rather than employee wages, so employers also save on payroll taxes.
Employers / Property Managers / TMAs
• Large employers
• Small employers
Public Agencies / Transportation Providers
• Federal Government
• Requires small administrative and financial commitment from employer
• Government is not receiving tax on funds used
• If parking benefit is provided, it may encourage SOV behavior
• Employers may not know how to implement programs
• Encourages transit and vanpool travel by reducing costs
• Employers save money by removing funds from payroll, employees save money by not paying taxes on those funds.
• Potential reduction in VMT
The regulation surrounding the Commuter Tax Benefit may change. The Association for Commuter Transportation is a valuable resource for employers who want more information.
Benefits →
Challenges →
VMT Reduction:
VMT Reduction:
Programs are more impactful when combined with other TDM strategies.
The program is more impactful in localities where employers are required to provide this benefit.
18
Congestion impacts
Reduced cost of using non-SOV modes should reduce congestion.
Outcomes Impacts Methods
• Number of employers enrolled in the program
• Number of employees receiving the benefit to purchase non-parking expenses
• Survey results
• Data from employers
Los Angeles Metro sponsored state Assembly Bill 2548 which requires Los Angeles County employers with 50-249 employees to provide a commuter benefit to their employees. This bill will likely increase the use of the Commuter Tax Benefit among employers in Los Angeles County.
As seen in the SCAG region
Complementary strategies
• Transit improvements
• Vanpool coordination
Costs
There are minimal costs involved for employers who wish to provide the benefit by partnering with a vendor.
Commuter benefit companies
Incentives & Facilitation
Commuter Tax Benefits
Measurement
Other stakeholders
Implementors
Implementation tips
Incentives & Facilitation
Employees

Developers
• Developers - office, retail, residential
• May not be effective for some communities
• Requires investment by developers or municipalities
• Improves public health for area
• Improves air quality for area
• Reduces congestion
• Improves access to development
• Contributes to neighborhood attractiveness
Pedestrian improvements should aim to make walking safer and more pleasant. They can take many forms, including:• Sidewalk widening• Traffic signal adjustments• Pedestrian scrambles• Leading Pedestrian Intervals (LPIs)• Planting of street trees and lights• Inclusion of ground level retail
Benefits →
Challenges →
VMT Reduction:
VMT Reduction:
It can be difficult to measure direct impact on VMT from pedestrian improvements, but SOV trips replaced will reduce VMT.
It can be difficult to measure direct impact on VMT from pedestrian improvements, but SOV trips replaced will reduce VMT.
19
Congestion impacts
An increased number of pedestrians can decrease congestion.
Outcomes Impacts Methods
• Decrease in accidents involving pedestrians
• Number of improvements made
• Dollars spent on improvements
• Mode split: number of pedestrians
• Results from walk audits
• Community feedback
• Volume counts In an effort to improve safety for
pedestrians, many cities in the SCAG region, including the City of Long Beach and the City of Riverside, have instituted pedestrian scrambles at heavily trafficked intersections.
As seen in the SCAG region
Complementary strategies• Safe Routes to School
programs
• Bicycle improvements
Costs
Costs vary by project, but include projects as extensive as sidewalk widening or ADA compliance, as well as smaller ones such as installation of amenities such as benches, lighting and foliage.
Infrastructure & System Upgrades
Pedestrian Infrastructure Improvements
Implementation tips
Implementors
Measurement
Other stakeholders
Infrastructure & System
Public Agencies / Transportation Providers
• Municipalities
• Regional government/MPOs
Pedestrian Infrastructure Improvements include developing pedestrian facilities to reduce motorized vehicle use for short (<1/2 mile) all–purpose trips, as well as connections to transit
Public Health Departments
Residents
Planning and engineering departments
Local pedestrian advocates

Bicycle Infrastructure Improvements include developing facilities that support trips by bicycle and personal mobility devices such as electric scooters to reduce motorized vehicle use for short (< 3 mile) and medium trips (<5 miles).
• Some roadways may require widening or innovative solutions to be effective
• May involve utility relocation• Requries investment by developers or
municipalities
• Improves public health for area• Improves air quality for area• Reduces congestion• Improves access to development
projects• Contributes to neighborhood
attractiveness• Improves safety of bicycle riders
Bicyclist safety should be considered when implementing bicycle infrastructure improvements. For example, bike lanes should be wider if they are located next to parking to avoid collisions between bicyclists and doors of parked cars.
Benefits →
Challenges →
VMT Reduction:
VMT Reduction:
It can be difficult to measure direct impact on VMT from bicycle improvements, but SOV trips replaced will reduce VMT.
It can be difficult to measure direct impact on VMT from bicycle improvements, but SOV trips replaced will reduce VMT.
20
Congestion impacts
Road diets can improve traffic flow, reduce collisions and reduce congestion.
Outcomes Impacts Methods
• Number of improvements made
• Dollars spent on improvement
• Miles of bike lanes
• Mode split: number of bicyclists
• Bicycle count data
The MyFigueroa project in Los Angeles has been designed to make a busy thoroughfare safer for bicyclists, pedestrians, transit riders and drivers. It includes a three-mile bikeway, as well as protected bicycle lanes in some areas.
In the Coachella Valley, the CV Link corridor provides a safe alternative to the 111 corridorfor pedestrians, cyclists and low-speed electric vehicles.
As seen in the SCAG region
Complementary strategies
• Wayfinding upgrades
• Safe Routes to School programs
• Pedestrian infrastructure improvements
• Bicycle transit integration
Costs
Cost may include road striping for bicycle lanes or more involved infrastructure changes such as separated bike lanes or bike paths.
Infrastructure & System Upgrades
Bicycle Infrastructure Improvements
Implementation tips
Implementors
Measurement
Other stakeholders
Infrastructure & System
Residents
Planning and engineering departments
Developers
• Developers - office, retail, residential
Public Agencies / Transportation Providers
• Municipalities
• Regional government/MPOs
Public Health Departments
Bicycle education organizations

Motor vehicle restriction zones limit motor vehicles in a certain place, either temporarily or permanently.
Public Agencies / Transportation Providers
• Municipalities
• Transit agencies
• Regional government/MPOs• Potential motorist and business
opposition• Can temporarily increase congestion
until confusion is resolved• Can have a negative impact on area
vitality if overall access is limited• May incur political opposition
• Enables other modes of transportation in the affected areas
• Defers vehicle trips
• Reduces local emissions
• Can increase safety
Most vehicle restrictions are implemented by local or regional governments, often as part of a downtown revitalization program or neighborhood traffic management plan, or during a period of exceptional traffic congestion or pollution.
Benefits →
Challenges →
VMT Reduction:
Impact varies by size, location and temporal extent of restriction zone but can be very effective in the long term.
21
Bicyclists
Congestion impacts
When effective, Motor Vehicle Restriction Zones can reduce traffic congestion, road and parking facility costs, crash risk, pollution emissions and local environmental impacts.
Outcomes Impacts Methods
• Number of restricted zones
• Length of restricted roadways
• Number of businesses affected
• VMT reduced
• Business earnings/success
• Survey results
• Traffic data
• Reports from local businesses
CicLAvia and Open Streets events are examples of temporary Motor Vehicle Restriction Zones, where major streets are closed down on the weekend for active transportation.
Permanent examples include the 3rd Street Promenade in Santa Monica and Main Street in Riverside.
As seen in the SCAG region
Complementary strategies
• Pedestrian infrastructure improvements
• Safe Routes to School programs
• Transit improvements
Costs
Costs for temporary events include set up and tear down, as well as security. Costs for permanent restriction zones include the cost of bollards or barriers.
Pedestrians
Local businesses
Infrastructure & System Upgrades
Motor Vehicle Restriction Zones
Implementation tips
Implementors
Measurement
Other stakeholders
Infrastructure & System
Planning and engineering departments

Bicycling, combined with transit, increases the effective range of transit users. Bicycle Transit Integration involves providing transit infrastructure (both aboard vehicles and at station areas) that support bicycling.
Public Agencies / Transportation Providers
• Municipalities
• Transit agencies
• Regional government/MPOs • More effective for longer distances that normally wouldn’t be traveled by bicycle alone
• Difficult to ride on rail with bicycles during peak hour transit
• Increases first/last mile connectivity within 3 miles
• Relatively low cost transportation enhancement to deploy
Bicycle Transit Integration includes bicycle infrastructure (e.g. bike racks, bike share options) at transit stations, as well as the ability to bring bicycles on transit through bus bike racks or bicycle areas on rail lines.
Benefits →
Challenges →
VMT Reduction:
Impacts of bicycle transit integration can be difficult to measure.
22
Congestion impacts
Bicycle Transit Integration should reduce vehicles on roadways, particularly during peak periods, as well as increase transit ridership.
Outcomes Impacts Methods
• Number of integration projects
• Number of transit stations with bicycle infrastructure
• Usage (bike hub parking, bicycle ridership)
• Mode split
• Survey results
• Bicycle traffic data
Los Angeles Metro provides Bike Hubs at five of their rail stations. Hubs provide secure bike parking and repair stations for bicyclists who want to ride their bikes to and from Metro rail.
Metrolink also provides integration for bicyclists by allowing bicycles on board their trains. Their regular cars can hold up to three bicycles, but most have one car that can hold up to nine.
As seen in the SCAG region
Complementary strategies
• Bicycle infrastructure improvements
• Transit improvements
• Dockless/micromobility/new mobility programs
Costs
Bus racks cost between $500–$1,000 to install. Dedicated spaces on rail cost between $500–$5,000.
Residents / businesses
Planning and engineering departments
Infrastructure & System Upgrades
Bicycle Transit Integration
Implementation tips
Implementors
Measurement
Other stakeholders
Infrastructure & System
Bicycle education organizations
Bicyclists
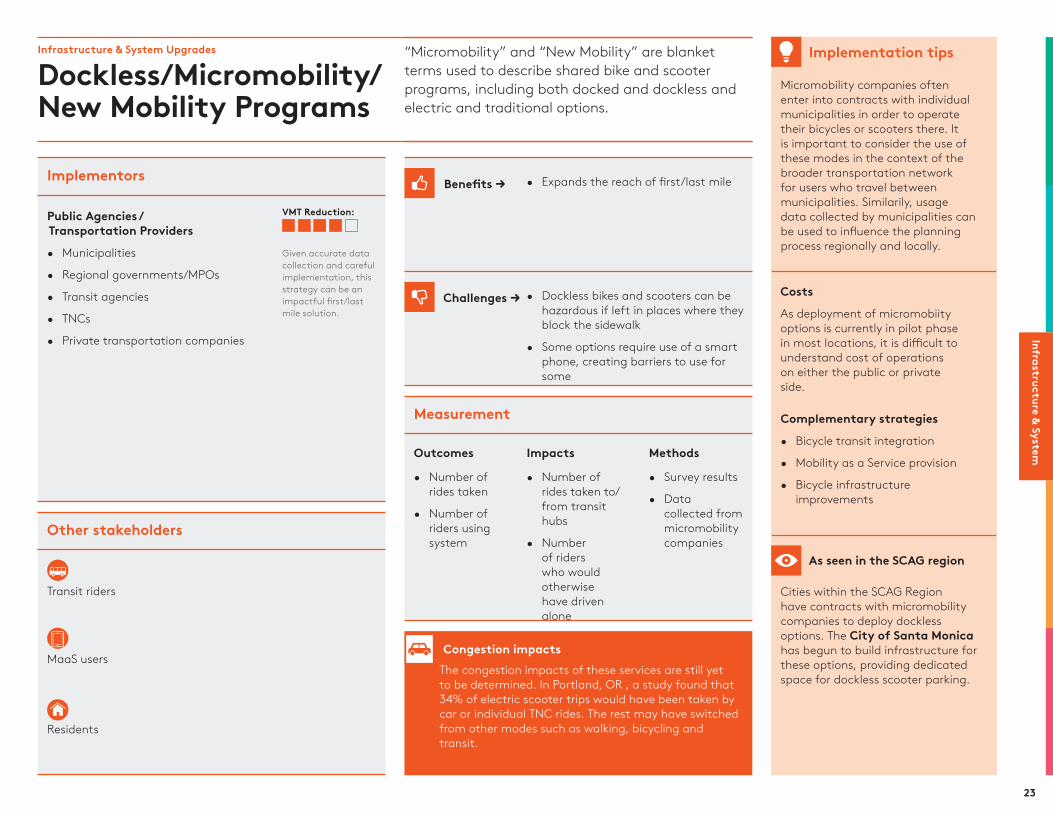
“Micromobility” and “New Mobility” are blanket terms used to describe shared bike and scooter programs, including both docked and dockless and electric and traditional options.
Public Agencies / Transportation Providers
• Municipalities
• Regional governments/MPOs
• Transit agencies
• TNCs
• Private transportation companies
• Dockless bikes and scooters can be hazardous if left in places where they block the sidewalk
• Some options require use of a smart phone, creating barriers to use for some
• Expands the reach of first/last mile
Micromobility companies often enter into contracts with individual municipalities in order to operate their bicycles or scooters there. It is important to consider the use of these modes in the context of the broader transportation network for users who travel between municipalities. Similarily, usage data collected by municipalities can be used to influence the planning process regionally and locally.
Benefits →
Challenges →
VMT Reduction:
Given accurate data collection and careful implementation, this strategy can be an impactful first/last mile solution.
23
Congestion impactsThe congestion impacts of these services are still yet to be determined. In Portland, OR , a study found that 34% of electric scooter trips would have been taken by car or individual TNC rides. The rest may have switched from other modes such as walking, bicycling and transit.
Outcomes Impacts Methods
• Number of rides taken
• Number of riders using system
• Number of rides taken to/from transit hubs
• Number of riders who would otherwise have driven alone
• Survey results
• Data collected from micromobility companies
Cities within the SCAG Region have contracts with micromobility companies to deploy dockless options. The City of Santa Monica has begun to build infrastructure for these options, providing dedicated space for dockless scooter parking.
As seen in the SCAG region
Complementary strategies
• Bicycle transit integration
• Mobility as a Service provision
• Bicycle infrastructure improvements
Costs
As deployment of micromobiity options is currently in pilot phase in most locations, it is difficult to understand cost of operations on either the public or private side.
Residents
Infrastructure & System Upgrades
Dockless/Micromobility/New Mobility Programs
Implementation tips
Implementors
Measurement
Other stakeholders
Infrastructure & System
Transit riders
MaaS users

Private transportation, such as employee or TMA operated shuttles, provide first/last mile solutions and fill in transit system gaps.
Employers / Property Managers / TMAs
• Large employers
• Small employers
• TMAs/TMOs
• Property managers - office, retail, residential
Public Agencies / Transportation Providers
• Municipalities
• Can be costly for employers
• If not developed correctly, can duplicate transit service
• Improves site access
• Pooled services, such as those run by TMAs, are cheaper than a private employer shuttle
Privately operated shuttles are typically managed by employers (connecting employees to their worksite) or by TMAs (connecting employees to multiple worksites in close proximity to each other). These options can be preferable to transit for some because they will provide service directly to a worksite, when the transit system may not. Sometimes, public agencies will also form partnerships with private operators to provide shuttle service.
Benefits →
Challenges →
VMT Reduction:
VMT Reduction:
Depending on the potential pool of employees, shuttles can be a very direct solution to first/last mile challenges and reduce the need for on-site parking.
Larger groups of employers can pool resources to create a shared shuttle, however they should be careful of duplicating exitsing transit sercvice.
24
Congestion impacts
Shuttle service contributes to non-SOV travel and directly reduces congestion.
Outcomes Impacts Methods
• Shuttle ridership
• Mode split among those who have access to the service
• Survey results
• Transit ridership data
Worthe Properties in Burbank operates a morning and evening shuttle between the Downtown Burbank Metrolink station and their office campus. The shuttle is free for tenants and their employees and facilitates their use of non-SOV travel through Metrolink.
As seen in the SCAG region
Complementary strategies
• Transit Improvements
• Mobility as a Service Provision
Costs
Cost of operating shuttle systems vary by size of the system.
Residents
Infrastructure & System Upgrades
Private Shared Transportation/Shuttles
Implementation tips
Implementors
Measurement
Other stakeholders
Infrastructure & System
Developers
• Developers - office, retail, residential
Employees
Tenants

Improvements to the transit system such as service expansion and capital infrastructure improvements encourage ridership growth.
Public Agencies / Transportation Providers
• Municipalities
• Transit agencies
• Regional government/MPOs • It may be difficult to guage the extent to which improvements will increase ridership
• Improvements may be costly and even with ridership increases, farebox recovery may not offset cost
• Increases transit ridership
• Improves overall network accessibility
Improvements to the transit system may include:
• optimized routing and increased coverage
• vehicle upgrades to improve comfort and safety
• improvements that contribute to ease of use such as electronic fare payment capabilities
• transit station upgrades, including provision of first/last mile options (e.g. Mobility Hubs)
Benefits →
Challenges →
VMT Reduction:
Depending on the magnitude of improvements, from increased frequency to new rail lines, impact can be very high on transit ridership.
25
Congestion impacts
Transit Improvements should reduce vehicles on roadways, particularly during peak periods, as well as increase transit ridership.
Outcomes Impacts Methods
• Number of improvements
• Transit ridership
• Mode split
• Survey results
• Transit ridership data
Los Angeles Metro is reviewing its entire bus network through their Next Generation Bus Study. The study will help their bus system better fit the needs of potential Metro riders.
As seen in the SCAG region
Complementary strategies
• Bicycle Transit Integration
• Subsidization of Non-SOV Travel
• Mobility as a Service Provision
• Dockless/Micromobility/ New Mobility Programs
Costs
Costs will vary depending on the type and scale of system upgrades.
Residents / businesses
Infrastructure & System Upgrades
Transit ImprovementsImplementation tips
Implementors
Measurement
Other stakeholders
Infrastructure & System
Developers/property managers
Transit riders Transit agencies
Employees

The price of parking can impact decisions about whether to drive. This strategy can be successful in decreasing congestion in areas with sufficient alternative options, but may decrease access for everyone if alternative options do not exist.
Employers / Property Managers / TMAs
• Large employers
• Small employers
• Property managers - office, retail, residential
• Parking lot owners/operators
Public Agencies / Transportation Providers
• Municipalities
• Transit agencies
• Increase in cost of public parking may be unpopular politically
• Payment systems must be reliable and easy to use
• Enforement can be challenging or costly
• Encourages non-SOV travel
• Reduced congestion from circling
Parking pricing can be used to curb congestion derived from circling and looking for parking spaces. “Dynamic” parking pricing involves raising the cost of parking based on demand, decreasing the likelihood that drivers will circle blocks waiting for the most in-demand spots, and instead encouraging them to travel further away to park for a smaller cost.
Benefits →
Challenges →
VMT Reduction:
VMT Reduction:
Parking pricing is one of the most efficient and effective methods to alter trip choice to non-SOV modes in areas where parking is constrained.
Impact varies based on surrounding context, areas with large amounts of free parking may not find this stragegy as effective.
26
Congestion impacts
Pricing can directly impact local congestion through removal of circling trips, and overall congestion through shift in travel mode.
Outcomes Impacts Methods
• Parking availability
• Mode split among travelers by site
• Congestion
• Survey results
• Traffic data
LA Express Park in Downtown Los Angeles and Hollywood uses demand-based pricing to better match the availability of parking spaces with their demand.
As seen in the SCAG region
Complementary strategies
• Transit improvements
• Mobility as a Service provision
• Parking cash out
• Parking unbundling
Costs
Costs of parking pricing include cost of parking infrastructure and administration involved in determining parking pricing and encorcing parking policies.
Implementation tips
Measurement
Other stakeholders
Implementors
Parking Strategies
Parking Pricing
Parking Strategies
VisitorsEmployees
Tenants

Parking Unbundling describes the process of charging for parking separately from a regular lease for office or residential tenants.
Employers / Property Managers / TMAs
• Large employers
• Small employers
• Property managers - office, retail, residential
• Parking lot owners/operators
Developers
• Developers - office, retail, residential
• Developers may need to purchase payment systems
• Requires additional administrative effort for property managers
• Can discourage car ownership and car trips
• Reduces employer costs
• For developers, may reduce need to build large amounts of parking
Parking is expensive to build and maintain, and the cost of that is often translated to those who use buildings indirectly through leases or cost of goods and services. Unbundling parking requires that users consider the cost involved and decide for themselves whether or not to take advantage of it. This encourages residents not to own cars, and employers to charge their employees to park.
Benefits →
Challenges →
VMT Reduction:
Similar to Parking Pricing, this strategy can be very impactful depending on the number of people affected by the unbundling policy.
27
Congestion impacts
Unbundling can discourage car ownership, reducing vehicle trips and congestion.
Outcomes Impacts Methods
• Reduction in parking spaces leased
• Rate of car ownership among residential tenants
• Mode split among employees
• Survey results from tenants
A study from UCLA determined that the provision of unbundled parking in Downtown Los Angeles allowed buildings to target individuals without access to cars, and provide housing for a lower cost.
As seen in the SCAG region
Complementary strategies
• Parking pricing
• Parking cash out
• Direct incentives for non-SOV travel
Costs
Developers and property managers should not incur costs for parking unbundling.
Implementation tips
Measurement
Other stakeholders
Implementors
Parking Strategies
Parking Unbundling
Parking Strategies
Employees
Tenants
VMT Reduction:
Similar to Parking Pricing, this strategy can be very impactful depending on the number of people affected by the unbundling policy.
Source: https://www.jtlu.org/index.php/jtlu/article/view/730

Employer-paid parking subsidizes the cost of driving. By separating the cost of parking from a business, people have incentives to use other modes. Parking Cash Out involves subsidizing non-SOV modes for employees in lieu of providing them access to a parking space.
• Other modes of transportation must be available in order for it to be effective
• Works best when employer leases parking spaces (vs. owning lot)
• Enforcement of policies is challenging
• Employees may park elsewhere
• Encourages non-SOV travel through provision of “extra” money for employees
• Can provide more area for development/business use if business owns parking lot/structure
Parking cash out rewards employees who choose non-SOV modes, and encourages others to do so. For employers who lease parking spaces individually, this program is essentially free.
Benefits →
Challenges →
VMT Reduction:
Parking Cash Out can be successful if marketed and implemented correctly. The state policy in California surrounding Parking Cash Out is not effective due to existence of loopholes and lack of enforcement.
28
Congestion impacts
Parking Cash Out can encourage non-SOV travel. A 2017 study by the Virginia Transport Policy Institute states that parking cash out affects employees’ automobile commuting by 10-30%.
Outcomes Impacts Methods
• Cash outs provided (number of employees not using parking spaces)
• Mode split among employees
• Survey results
• Parking Data
Parking Cash Out is required of all employers in the SCAG Region with the following attributes:
• Over 50 employees
• Have worksites in a nonattainment air basin for any state air quality standard
• Subsidizes employee parking that they don’t own
• Can calculate out-of-pocket expense of parking subsidies provided
• Can reduce number of parking spaces without penalty in lease agreements
As seen in the SCAG region
Complementary strategies
• Parking pricing
• Parking unbundling
• Direct incentives for non-SOV travel
Costs
Employers who lease individual parking spaces incur no cost from Parking Cash Out programs. Those who lease spaces in bulk may save money by not being required to purchase additional parking, or may incur the cost of paying out employees who would otherwise have spaces available.
Students
Implementation tips
Measurement
Other stakeholders
Implementors
Parking Strategies
Parking Cash Out
Parking Strategies
Employers / Property Managers / TMAs
• Large employers
• Small employers
• Educational institutions
• Property managers - office, retail, residential
Employees
Residents / businesses
Developers/property managers

The design of parking facilities and management of curb space can influence travel behavior through designating space to non-SOV travel modes rather than personal vehicles.
Employers / Property Managers / TMAs
• Large employers
• Property managers - office, retail, residential
Public Agencies / Transportation Providers
• Municipalities
• Transit agencies
• May decrease ease of access for drivers
• Decrease of individual parking spaces may be unpopular politically
• Encourages non-SOV Travel
Employers, property managers, developers and public agencies can encourage non-SOV travel by designating spaces for carpools, vanpools or carshare vehicles and providing curb space for first/last mile modes such as TNCs and micromobility options.
Monitoring and enforcement of curbside management strategies is key in making sure they are impactful.
Benefits →
Challenges →
VMT Reduction:
Impact depends on travel patterns and available parking/curb space on site.
29
Congestion impacts
On private property, facility design to encourage non-SOV modes can reduce overall congestion. In the public realm, curbside management and designated space for non-SOV modes may reduce congestion caused by driver confusion, though may increase congestion slightly due to circling if parking options for drivers are eliminated.
Outcomes Impacts Methods
• Parking availability
• Use of designated spaces by non-SOV modes
• Mode split among travelers by site
• Survey results
• Traffic Data
Many employers throughout the SCAG Region provide designated spaces in their parking lots for employees who carpool. Usually, these spaces are in desirable locations, and are monitored and enforced the use of spaces through the use of hang tags for registered carpool riders.
As seen in the SCAG region
Complementary strategies
• Transit improvements
• Mobility as a Service provision
• Parking pricing
• Parking unbundling
Costs
Costs of facility design and curbside management can include signage and painting of parking spaces. Some curbside management may require cutouts or other sidewalk infrastructure improvements. There is also cost involved in enforcing policies.
Residents / businesses
Implementation tips
Measurement
Other stakeholders
Implementors
Parking Strategies
Parking Facility Design and Curbside Management
Parking Strategies
Visitors
Employees
Parking lot owners/ operators
VMT Reduction:
Impact depends on travel patterns and availablity of destinations to non-SOV Modes.

Planning and engineering departments
Congestion Pricing is the charging of fees for a vehicle to access certain high congestion areas, either during peak periods or other periods.
Public Agencies / Transportation Providers
• Municipalities
• Transit agencies
• County transportation authorities
• Regional government/MPOs
• Caltrans
• Requires strong political leadership, extensive public outreach and education
• Reduces congestion• Pricing revenue can be used to fund
transportation improvements in local area
• Increases reliaility for express bus routes
Congestion pricing reduces congestion along a corridor or in an area by discouraging SOV travel though a charge for drivers. Revenue from programs can be put back into a region, municipality or transit agency’s transportation system. Investment into public transit or TDM measures in low-income areas can help to offset equity concerns.
Benefits →
Challenges →
VMT Reduction:
Congestion Pricing has a proven record of reducing traffic and congestion in urban areas. Implementation of the strategy is important given the untested nature of this strategy in the U.S.
30
Congestion impacts
Congestion pricing will result in targeted reduction in congestion.
Outcomes Impacts Methods
• Vehicles traveling during peak periods or in congested areas
• Revenue collected
• VMT reduction
• Passenger throughput
• Data from tolls or other pricing hardware
SCAG is in the process of developing a plan for a regional Express Lanes network and system.
As seen in the SCAG region
Complementary strategies
• Transit improvements
• Private shared transportation/Shuttles
• Bicycle infrastructure improvements
• Mobility as a Service Provision
Costs
Costs include ITS infrastructure to monitor, charge fees, and enforce violations.
Implementation tips
Measurement
Other stakeholders
Implementors
TDM-Supportive Policy
Congestion Pricing
TDM
-Supportive Policy
Transit riders
TNCs, taxis and rental car companies
Transit agencies

Land use such as Transit Oriented Development (TOD) can support non-SOV trips by placing travelers in close proximity to the locations they frequent, or to non-SOV modes that take them there easily, such as rail or bus rapid transit lines.
Public Agencies / Transportation Providers
• Municipalities
• Regional government/MPOs
• TOD supportive policies can be politically unpopular if they allow increases in density
• Impacts on congestion may be difficult to measure
• Development pressure near transit infrastructure can lead to gentrification and displacement of existing, transit dependent users
• Reduces need for SOV trips
• Reduces need for car ownership
• Reduces parking demand
Land use strategies that support non-SOV travel include:
• Transit Oriented Development and supportive zoning/regulation
• Mixed-use and denser development form based zoning or design guidelines supportive of pedestrian travel
• Reduction or elimination of parking minimums; and
• Anti-displacement policies.
Benefits →
Challenges →
VMT Reduction:
VMT Reduction:
Implementation of this strategy can greatly increase attractiveness of non-SOV modes to residents and visitors alike
Poor implementation of this strategy can displace transit riders for residents that primarily drive.
31
Congestion impacts
Land use policies that support non-SOV trips can reduce congestion, but density can also increase auto congestion.
Outcomes Impacts Methods
• Number of policies in place
• Number of developments
• Number of housing units within 0.5 miles to amenities
• Rate of car ownership among residents
• Census data
Culver City developed a TOD Visioning Study for the Culver City Station on the Expo Line. They worked with community members to identify walkability constraints in order to ensure the station and its nearby development will be accessible.
As seen in the SCAG region
Complementary strategies
• Transit improvements
• Private shared transportation/Shuttles
• Bicycle infrastructure improvements
Costs
Costs include planning and infrastructure investments at transit stations.
Residents
Implementation tips
Measurement
Other stakeholders
Implementors
TDM-Supportive Policy
Transit Oriented Development and Non-SOV Supportive Land Use
TDM
-Supportive Policy
Developers
• Developers - office, retail, residential
Image source: w
ww
.ulvercity.org
Employees
Developers/property managers

TDM ordinances typically require developers or employers to provide TDM strategies at their site or workplace to mitigate the congestion caused by trips to and from their sites.
Public Agencies / Transportation Providers
• Municipalities
• Regional government/MPOs
• Reduces need for SOV trips
• Reduces need for car ownership
• Informs developers and employers of TDM options
While TDM requirements are often included for developers during a project’s initial stages, these requirements are difficult to enforce after projects have been sold. Polices aimed at users of sites, such as employers or property managers, are often more successful in influencing the implementation of TDM strategies. Some policies require the surveying of employees or tenants annually, which provides data on travel habits.
Benefits →
Challenges →
VMT Reduction:
TDM Ordinance impacts can very depending on how the policies are written, implemented and enforced. Availability and quality of non-SOV modes can also effect ultimate impact.
32
Congestion impacts
TDM policy encourages non-SOV travel, which reduces congestion.
Outcomes Impacts Methods
• Number of municipalities with active policies in place
• Number of developments or employers subject to policies
• Mode split, VMT, or AVR among those sites affected by policies
• Survey results
The South Coast Air Quality Management District’s Rule 2202 affects employers of four counties in the SCAG Region. The rule requires employers with 250 or more employees to mitigate the emissions produced from their employees’ commutes by paying into a fund, purchasing emission reduction credits, or providing TDM programs on site.
As seen in the SCAG region
Complementary strategies
• Employee commute programs
• Marketing campaigns
• Educational events
Costs
Initial costs include planning for and development of policies. Ongoing costs include administrative staff time necessary to enforce the policy.
Implementation tips
Measurement
Other stakeholders
Implementors
TDM-Supportive Policy
TDM Ordinance and Policy Development
TDM
-Supportive PolicyResidents
Employees
Developers/property managers
• TDM policies can be politically unpopular
• Impacts on congestion may be difficult to measure

SC A G TDM Strategic Plan and F inal Report
H Potential Application of TDM Toolbox Strategies

Report
August 2019
SCAG TDM Strategic Plan: Potential Application of TDM Toolbox Strategies
Southern California Association of Governments
Our ref: 23272901
Our ref: 23272901

Steer has prepared this material for Southern California Association of Governments. This material may only be used within the context and scope for which Steer has prepared it and may not be relied upon in part or whole by any third party or be used for any other purpose. Any person choosing to use any part of this material without the express and written permission of Steer shall be deemed to confirm their agreement to indemnify Steer for all loss or damage resulting therefrom. Steer has prepared this material using professional practices and procedures using information available to it at the time and as such any new information could alter the validity of the results and conclusions made.
Report
August 2019
SCAG TDM Strategic Plan: Potential Application of TDM Toolbox Strategies
Prepared by: Prepared for:
Steer
800 Wilshire Blvd, Suite 1320,
Los Angeles, CA 90017
USA
Southern California Association of Governments
900 Wilshire Blvd. Suite, 1700
Los Angeles, CA 90017
+1 (213) 425 0990
www.steergroup.com
Our ref: 23272901

SCAG TDM Strategic Plan: Potential Application of TDM Toolbox Strategies | Report
August 2019
Contents
Introduction ............................................................................................................................. 1
Overview ................................................................................................................................... 1
Table of Suggested Application of Strategies per Corridor .......................................................... 3
1 SR-111 – Calexico Port of Entry ........................................................................................ 4
1.1 Existing Conditions ......................................................................................................... 4
1.2 Corridor Vision ............................................................................................................. 10
1.3 TDM Solutions .............................................................................................................. 10
2 1-10/I-110 Interchange .................................................................................................. 15
2.1 Existing Conditions ....................................................................................................... 15
2.2 Corridor Vision ............................................................................................................. 21
2.3 TDM Solutions .............................................................................................................. 21
3 I-710 ............................................................................................................................. 26
3.1 Existing Conditions ....................................................................................................... 26
3.2 Corridor Vision ............................................................................................................. 33
3.3 TDM Solutions .............................................................................................................. 33
4 SR-57/SR-60 Confluence ................................................................................................ 37
4.1 Existing Conditions ....................................................................................................... 37
4.2 Corridor Vision ............................................................................................................. 44
4.3 TDM Solutions .............................................................................................................. 44
5 Wilshire Boulevard ........................................................................................................ 49
5.1 Existing Conditions ....................................................................................................... 49
5.2 Corridor Vision ............................................................................................................. 55
5.3 TDM Solutions .............................................................................................................. 55
6 SR-55 ............................................................................................................................ 60
6.1 Existing Conditions ....................................................................................................... 60
6.2 Corridor Vision ............................................................................................................. 67

SCAG TDM Strategic Plan: Potential Application of TDM Toolbox Strategies | Report
August 2019
6.3 TDM Solutions .............................................................................................................. 67
7 SR-91 ............................................................................................................................ 71
7.1 Existing Conditions ....................................................................................................... 71
7.2 Corridor Vision ............................................................................................................. 78
7.3 TDM Solutions .............................................................................................................. 78
8 I-10 ............................................................................................................................... 83
8.1 Existing Conditions ....................................................................................................... 83
8.2 Corridor Vision ............................................................................................................. 88
8.3 TDM Solutions .............................................................................................................. 89
9 I-15 ............................................................................................................................... 93
9.1 Existing Conditions ....................................................................................................... 93
9.2 Corridor Vision ............................................................................................................. 97
9.3 TDM Solutions .............................................................................................................. 98
10 SR-118 ........................................................................................................................ 102
10.1 Existing Conditions .................................................................................................... 102
10.2 Corridor Vision ........................................................................................................... 106
10.3 TDM Solutions ........................................................................................................... 107
11 Bibliography ............................................................................................................... 111
SCAG TDM Strategic Plan: Potential Application of TDM Toolbox Strategies | Report
1
Introduction
Overview
As stakeholders in the SCAG Region seek to manage congestion and address air quality concerns,
transportation demand management (TDM) strategies can be used to remove vehicles from our
congested corridors, mitigate the impacts of construction of infrastructure upgrades, and facilitate
a long-term shift to alternative ways of traveling. This memorandum examines the strategies put
forth in the TDM Toolbox, and demonstrates how they could be applied to ten corridors in the
SCAG Region that are currently dealing with congestion issues to reduce vehicle miles traveled
(VMT), and therefore greenhouse gas emissions, in the region.
The ten corridors included in this memorandum were chosen with assistance from SCAG’s TDM
Technical Advisory Committee. The corridors were not selected because they are the most
congested corridors in the SCAG Region, but instead to demonstrate the broad range of potential
for implementing TDM strategies in a variety of situations. The corridors span all six counties in
the region and provide solutions aimed to tackle congestion related to unique situations,
including:
• Long-distance commute travel
• Long term construction projects
• Freight travel
• Events and stadium travel
• International border crossing
• Rural and agricultural travel
For each corridor, an existing conditions section identifies key attractors, as well as current traffic
patterns, multimodal access and any existing TDM strategies and upcoming projects that might
impact the corridor segments. This data was collected through stakeholder outreach that took
place during the “Baseline Assessment” task of the TDM Strategic Plan, with additional research
completed and extensive use of Caltrans’ Transportation Concept Reports, the United States
Census’ Longitudinal Employer-Household Dynamics and SCAG’s Trip Based Transportation Model
with base year 2016.
As the corridors vary greatly both physically and in the amount of TDM strategy already
implemented along them, so do the existing conditions provided for each. In particular, when
examining delay and travel volume some of the descriptions are constrained by size and level of
detail achievable with the data available for the corridors. Instead of providing the same
information for each corridor, this document highlights specific pieces of information that are
relevant to the recommended strategies for each corridor and uses graphics to depict those
points. In all figures and tables describing peak hour delay, the “AM peak” refers to 6:00am –
9:00am, and the “PM peak” refers to “3:00pm – 7:00pm.”
Based on each corridor’s existing conditions, five TDM strategies are recommended to help reduce
vehicle miles traveled and greenhouse gas emissions in the short, medium and long terms. In
terms of timelines, short term was assumed to be able to be delivered in less than one year,
medium term 1 to 2 years, and long term 3 years or more. Estimated costs were also allocated to
each strategy based on categories of Low, Medium and High. Low cost was categorized as being

SCAG TDM Strategic Plan: Potential Application of TDM Toolbox Strategies | Report
2
$300,000 or less, medium cost as $300,001 to $1,000,000 and High $1,000,001 or more. These
were drawn from the TDM Toolbox of 32 strategies across five categories, developed as part of
this TDM Strategic Plan.
Daily VMT reductions for each strategy were estimated using the Center for Urban
Transportation’s Trip Reduction Impacts of Mobility Management Strategies (TRIMMS) Model as
suggested by the Federal Highway Administration, and from there greenhouse gas emission
reduction estimations were calculated with the California Air Resources Board’s Mobile Source
Emission Inventory (EMFAC). As the inputs provided for use in the TRIMMS model did not in all
cases match up precisely with the recommended strategies, assumptions were made in order to
obtain the most realistic VMT reduction estimate. The assumptions that were used in this process
have been recorded and are included in Appendix A of this document. Each strategy was also
evaluated for estimated cost and length of time to implement. These estimates have been based
on similar projects implemented both in and outside of the SCAG Region.

SCAG TDM Strategic Plan: Potential Application of TDM Toolbox Strategies | Report
3
Table of Suggested Application of Strategies per Corridor
International
Border Crossing Event-Related
Congestion Port Travel through DT Construction
Local Corridors
Office Park Commute
Long Distance
Commute Education &
Health
Goods Movement & Related
Agricultural Trip
Reduction
Education and Marketing Safe Routes to School Programs Marketing Campaigns ST ST Educational events Wayfinding Upgrades MT Individualized Marketing MT MT ST
Incentives and Facilitation Carpool Coordination ST ST
ST Vanpool Coordination ST Telecommuting and Remote Services
MT MT
Alternative Work Schedules ST Direct Incentives for Non-SOV Travel LT Subsidization of Non-SOV Travel Guaranteed Ride Home Program Mobility as a Service Provision MT LT Carshare Provision MT Provision of on-site amenities or inclusion of complementary uses Development of Employee Commute Programs ST ST ST ST Development of TMAs/TMOs ST MT ST ST Provision of Commuter Choice Programs
Infrastructure and System Upgrades
Pedestrian Improvements MT LT
Bicycle Improvements LT MT
Motor Vehicle Restriction Zones Bicycle Transit Integration ST ST Dockless/Micromobility/New Mobility Programs ST MT MT Private Shared Transportation/Shuttles ST MT ST Transit Improvements LT LT LT MT LT
Parking Strategies LT Parking Pricing MT
Parking Unbundling Parking Cash Out Parking Facility Design and Curbside Management
TDM-Supportive Policy Various Congestion Pricing Methods LT LT TOD and Non-SOV Supportive Land Use LT LT
TDM Ordinance and Policy Developments ST LT MT
ST: Short Term, MT: Medium Term, LT: Long Term
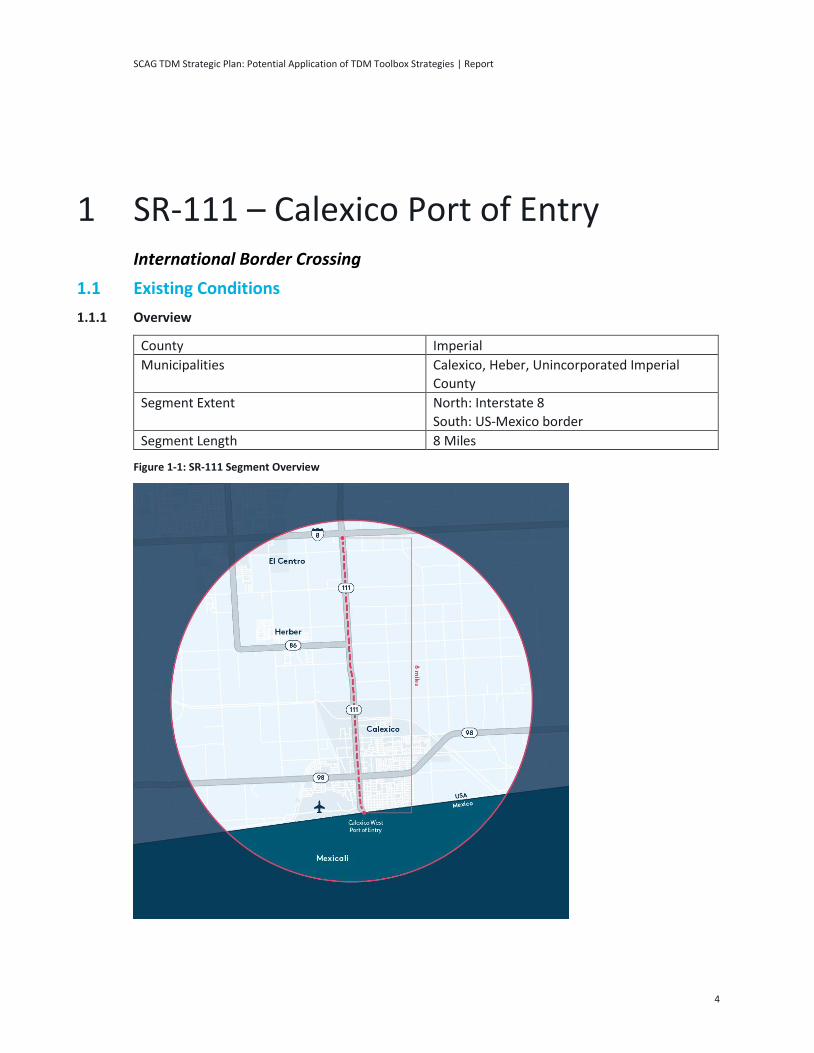
SCAG TDM Strategic Plan: Potential Application of TDM Toolbox Strategies | Report
4
International Border Crossing
1.1 Existing Conditions
1.1.1 Overview
County Imperial
Municipalities Calexico, Heber, Unincorporated Imperial
County
Segment Extent North: Interstate 8
South: US-Mexico border
Segment Length 8 Miles
Figure 1-1: SR-111 Segment Overview
1 SR-111 – Calexico Port of Entry

SCAG TDM Strategic Plan: Potential Application of TDM Toolbox Strategies | Report
5
The State Route 111 (SR-111) corridor segment runs from the US-Mexico border in the City of
Calexico in the south to the I-8 in the north. SR-111 is one of two north-south routes connecting
Calexico to El Centro and Brawley, and further north past the Salton Sea to the Coachella Valley
(the other being the SR-86 corridor). The majority of the corridor (7 miles between SR-98 and I-8)
is a 4-lane freeway with at-grade traffic lights at major intersections.
SR-111 connects to the main pedestrian and personal vehicle border crossing at Calexico and
serves tens of thousands of daily commuters and visitors who are primarily connected to the
agricultural industry.
1.1.2 Multimodal Accessibility
Bicycle Facilities
Although the corridor is technically accessible to bicycles, there are no dedicated or shared bicycle
lanes, and much of the corridor has a 65-mph speed limit in a freeway environment. The speed
limit for the 1-mile portion of the corridor from the US-Mexico border to SR-98 is 35 mph, but it is
still a busy road.
Rockwood Ave might serve as a useful informal bike route that parallels SR-111 from E 2nd St to W Cole Blvd through the City of Calexico. Rockwood Ave has just two lanes of traffic with on street parking helping to reduce traffic speeds.
Pedestrian Facilities
Sidewalks are provided on both sides of the street within the urban environment south of SR-98 in
the City of Calexico; however, the sidewalks are on the edge of the street, leaving no buffer
between pedestrians and potentially fast-moving traffic. Additionally, this southern segment of
SR-111 has mostly auto-oriented land use with many access driveways cutting across the sidewalk.
Parallel streets such as Emerson Ave, Paulin Ave and Rockwood Ave provide better pedestrian
environments with street parking and grass/tree buffers. No sidewalks are provided north of SR-
98 within the freeway environment segment.
Transit
• Bus Connections:
– Imperial Valley Transit operates public transit services in the region, which includes three
routes within the SR-111 corridor:
• 1 N/S -Calexico-El Centro: acts as a circulator within the City of Calexico and uses SR-
111 for a portion before connecting to El Centro.
• 21 N/S – IVC Express/Calexico to Imperial Valley College: follows the same circular
route through Calexico as Route 1 but takes a direct route along SR-111 to IVC.
• 31/32 – Brawley-Calexico: takes a direct route along SR-111 from Brawley to Calexico
and uses a parallel road through Calexico south to near the border.
– Yuma County Area Transit (YCAT) operates service that reaches the Imperial County Area:
• Turquoise Line 10 – Yuma to El Centro: a long-haul route funded partially by the
Quechan Indian Tribe and Imperial County Transportation Commission and is
operated by Yuma County Intergovernmental Transportation Authority (YCIPTA). This
route runs adjacent to SR-111.

SCAG TDM Strategic Plan: Potential Application of TDM Toolbox Strategies | Report
6
1.1.3 Key Attractors
Border crossings
The Calexico (West) border crossing, which connects SR-111 on the US side to Highway 5 on the
Mexico side, is one of only nine border crossings between California and Mexico. Calexico is only
open to pedestrians and small vehicle traffic and in 2018, roughly 12,000 people crossed the
border on foot and almost 24,000 more people crossed in 13,000 vehicles (~1.8 people/car) each
day. This illustrates a significant amount of daily travel, for work, leisure and tourism.
The nearby Calexico East is the primary crossing for goods movement and large trucks and bus
traffic. Trucks use SR-7 and I-8 as key connections, thereby avoiding the urban area of Calexico
and the SR-111 corridor. As a result, the SR-111 corridor has limited truck and goods movement
traffic.
International trade
Much of Imperial County is rural agricultural land with small towns and cities consisting of around
175,000 people in the County. The adjacent city of Mexicali in Mexico has a population of over 1
million people and is the State Capital of Baja California, with a major economic generator being
manufacturing for US markets under NAFTA. SCAG’s 2012 report, Goods Movement Border Crossing Study and Analysis suggests that companies in Mexicali were clustering in industrial
parks, and that these locations are important generators of border‐crossing trips, representing an
important share of the origins and destinations of international trade flows.
Imperial Valley College
The college is located on SR-111 east of El Centro and enrolls roughly 8,000 students annually for
all class types. The campus also employs roughly 450 people.
1.1.4 Existing TDM Strategies
Incentives and Facilitation
Imperial Valley Transit (IVT) has a well-established College Pass Program for students. Twenty-ride
passes are sold for between $16 and $25 for students, and full priced ten ride passes are typically
$17.50.
Mobility Hubs
The Imperial County Transportation Commission (ICTC) and the San Diego Association of
Governments (SANDAG) collaborated to develop a Regional Mobility Hub Implementation Strategy
in 2017. As part of the Strategy, mobility hub prototype sites were identified at:
• Brawley
• El Centro
• Imperial Valley College
The Strategy is also supported by a Mobility Hub Feature Catalog (a resource for local
stakeholders), an Implementation Considerations Memo, and an Equity Considerations Memo.
Mobility hub concepts include multi-modal improvements such as bus priority, bike lanes, shared

SCAG TDM Strategic Plan: Potential Application of TDM Toolbox Strategies | Report
7
mobility, bike and pedestrian safety improvements, wayfinding, parking management, and urban
design.
Vanpool
ICTC is an official member of CalVans, a public transit agency serving 17 counties in California and
providing vanpool services. There are currently 47 vanpools that operate in Imperial and another
60 in neighboring Yuma County AZ. The CalVans program is unique in that it provides service to
seasonal agricultural workers as well as year-round employees.
1.1.5 Planned Improvements
Table 1-1: SR-111 Planned Improvements
Project Description Timeline Project Lead
Calexico Land Port of
Entry Enhancements
To increase vehicle and pedestrian capacity, GSA are creating new pedestrian and privately-owned vehicle (POV) inspection facilities. Primary POV inspection facilities include 16 northbound lanes and five southbound lanes. There will be a new administrative space, a new headhouse and 360 port staff parking spaces.
• Phase 1: Southbound vehicle lanes and bridge; northbound vehicle inspection & admin building
• Phase 2: – 2A (fully funded, in pre-
construction) - additional northbound & southbound vehicle inspection
– 2B (not funded) - northbound pedestrian facility
Phase 1:
completed in 2018
Phase 2:
completion is TBD
General
Services
Administration
(GSA)
Caltrans Corridor
Concept Vision
The future vision for the corridor includes expanding the freeway and building interchanges, including interchanges at Jasper Road and Herber Road, and McCabe Road and Chick Road.
n/a Caltrans

SCAG TDM Strategic Plan: Potential Application of TDM Toolbox Strategies | Report
8
1.1.6 Traffic Conditions
Delay on At Grade Roads
While the area furthest south, closest to the border, is a more urbanized area, the majority of the
delay on the SR-111 corridor occurs between W Cole Blvd and the I-8. This stretch is a 4-lane
highway with at-grade traffic lights at major intersections, which is the likely main cause of delay
during peak hours.
Figure 1-2: SR-111 Travel Delay
High Volumes of US-Side Trips
Traffic using the corridor in the segment between E Heber Rd and E McCabe Rd (blue shading) are
dispersing throughout the region. While many travelers are still accessing the border, many are
travelling to other destinations. Volumes are higher northbound in the AM and southbound in the
PM, highlighting the ‘commute’ patterns associated with cross-border inbound-AM/outbound-PM
travel, but the reverse travel is still a high proportion (67 percent AM, 82 percent PM), illustrating
traffic is flowing in both directions during both morning and afternoon periods. Only 2-3 percent
of the traffic in both AM and PM peak hours is truck traffic on this portion as most cross-border
trucks are using SR-7/I-8 for the Calexico East Port of Entry.
I-8
SR-111
SR-98
AM
W Cole
PM
I-8
SR-111
SR-98
W Cole
Delay per segment in minutes 0.025 and below 0.026 to 0.100 0.100 to 0.200 0.200 to 0.300 0.300 and above Other

SCAG TDM Strategic Plan: Potential Application of TDM Toolbox Strategies | Report
9
Figure 1-3: SR-111 AM and PM Traffic Flow
1.1.7 Challenges
The biggest challenge in the SR-111 corridor is managing the thousands of daily commuters and
visitors (over 30,000) that travel by foot or vehicle. Better understanding commuting patterns and
travel choices will help to manage demand for vehicle traffic on the corridor.
Another challenge will be international coordination. Support and partnership from Mexicali may
make it easier to implement TDM measures for those travelling into and out of the USA on a daily
basis. SCAG has coordinated with Baja CA and Mexicali in the past, but it will be important for
dialogue (whether through SCAG, ICTC or otherwise) in the future.
SR-111
I-8
SR-98
AM PM
SR-111
I-8
SR-98
Vehicle Volume per Segment

SCAG TDM Strategic Plan: Potential Application of TDM Toolbox Strategies | Report
10
1.2 Corridor Vision
SR-111 is a key access point between the US and Mexico, used for international trade, tourism,
and commuting. In addition, the corridor is the main connection between Calexico, El Centro, and
further north to Brawley and the Coachella Valley. The corridor, particularly within the City of
Calexico, is currently very auto-oriented and does not provide a comfortable environment for
pedestrians and bicyclists, though there are large numbers of commuters who cross from Mexico
into Calexico on foot daily for work. The TDM vision for the corridor is supporting cross border
commuters and creating a safer and more convenient environment for all modes.
1.3 TDM Solutions
1.3.1 Short Term
Incentives and Facilitation: Vanpool Coordination
Almost 50% of workers in Imperial County are employed in the agriculture industry which means
many work sites are dispersed across the rural landscape of the region. In addition, over 12,000
people cross the border on foot each day, primarily to access worksites, and require
transportation to reach their destination. The region is currently serviced by CalVans and includes
almost 50 vanpools, but there is an opportunity to leverage this program even more, including
exploring opportunities for cross-border vanpools, or vanpools for cross-border foot traffic once in
the US. Identification and liaison with farm owners and employers will be important, and context-
sensitive communication with employees necessary if success is to be achieved.
To achieve this, ICTC should identify the largest worksites in the County, including both
agricultural-related and other employers, and develop relationships with key industry
organizations such as the Imperial County Farm Bureau, the Imperial Valley Vegetable Growers
Association, and the Imperial Valley Economic Development Corporation. These organizations will
likely have a good understanding of the major employers, worker conditions, and workforce
patterns which will help to prioritize outreach, resources and education.
Table 1-2: SR-111 Vanpool Coordination
Responsible Parties ICTC, employers, Industry Organizations
Estimated Cost Low
Estimated Daily VMT Reduction 15,000
Estimated Daily GHG Reduction (grams) 4,005,000

SCAG TDM Strategic Plan: Potential Application of TDM Toolbox Strategies | Report
11
Incentives and Facilitation: Carpool Coordination
Carpooling is a simple and easy opportunity
for individuals travelling to dispersed work
sites, although it can often be a challenge to
engage with employees to ride together.
Promotions and incentives for both
carpooling and vanpooling can be
successfully coordinated with employers and
can maximize outreach and marketing
resources.
A specific opportunity may be the promotion
of dynamic carpooling services such as Waze
Carpool (WC). WC has been very active in the San Diego region and has recently launched in
Mexico City1 and could be an effective option for commuters travelling in both directions crossing
the US-Mexico border. Promotion of carpooling at Imperial Valley College may be another
opportunity to reduce vehicle trips within the corridor.
To move this opportunity forward, ICTC could lead a regional effort and engage directly with Waze
Carpool to understand their interest in a regional program, including potential incentives. Ideally,
ICTC should also liaise with the Municipality of Mexicali since carpooling is something that is easily
implemented for cross-border travel. This solution should also be implemented in coordination
with Vanpool Expansion (above) as they will be targeted at the same audience.
Table 1-3: SR-111 Carpool Coordination
Responsible Parties ICTC, employers, Municipality of Mexicali
Estimated Cost Low
Estimated Daily VMT Reduction 15,000
Estimated Daily GHG Reduction (grams) 4,002,000
1 (Mexico News Daily, 2019)
Figure 1-4: Waze Carpool Pilot Promotion with SANDAG

SCAG TDM Strategic Plan: Potential Application of TDM Toolbox Strategies | Report
12
1.3.2 Medium Term
Education and Marketing: Wayfinding Upgrades
Information is a key asset for multi-modal travel and supporting individuals in understanding how
to get around the area and along the corridor by different options will be an effective way to
promote alternative travel. Pedestrian wayfinding will help commuters, tourists, and others find
services such as transit, safe walking routes, local attractions, and future services such as shared
mobility. Cycling wayfinding will help people identify safe and convenient routes that reduce
conflicts with trucks and vehicles, and vehicular wayfinding will direct commercial vehicles,
tourists and others find the most direct vehicle routes. This wayfinding infrastructure should all be
coordinated, branded and communicated together to provide a single message of mobility options
within the Calexico community.
To begin implementing such a program, local and regional partners should coordinate to ensure
all modes and trip types are considered. Branding and design are important elements and are a
good place to start to get buy-in from partners and move forward with a clear concept. Rolling
branding into a wider wayfinding strategy that includes mapping, signage, locations and
messaging should be the first step and will ensure a coordinated, integrated and effective
program is developed.
Table 1-4: SR-111 Wayfinding Upgrades
Responsible Parties City of Calexico, ICTC, Imperial Valley Transit,
US General Services Administration
Estimated Cost Medium
Estimated Daily VMT Reduction 191,000
Estimated Daily GHG Reduction (grams) 51,909,000

SCAG TDM Strategic Plan: Potential Application of TDM Toolbox Strategies | Report
13
Infrastructure and System Upgrades: Transit Improvements - Calexico Port of Entry Mobility Hub
An ‘Intermodal Transportation Center’ was proposed in 2014 near the Calexico Port of Entry
“providing a central location to access multiple alternative transportation options.”2 Services such
as conventional transit, private transit and farm labor shuttles were identified. The development
of mobility hubs in the region, through the work ICTC and SANDAG are conducting, presents an
excellent opportunity to reconsider the proposal to include other shared services such as
vanpooling, carshare, e-bike or e-scooter share, and shared on-demand services to provide an
effective hub for cross-border travelers with a range of options that would reduce the need for
vehicle travel.
Figure 1-5: Mobility Hub Features Catalog: Feature Types3
A key component of this solution would be marketing and helping
travelers on both sides of the border learn about what services
are available, where they are available, and how to use/access
them. Coordinating this option with the Multimodal Wayfinding
solution (above) would be an effective approach. It will also be
important to engage with service providers, both public such as
IVT and ICTC, but also private such as car share (e.g. Zipcar,
Car2Go), bike share (e.g. JUMP, Lime), and scooter share (e.g.
JUMP, Lime, Bird). Understanding the appetite for service in
Calexico by these operators will help determine the course of
action needed.
Table 1-5: SR-111 Transit Improvements - Mobility Hub
Responsible Parties City of Calexico, Imperial Valley Transit,
CalVans, ICTC, Imperial Valley College
Estimated Cost Medium
Estimated Daily VMT Reduction 4,000
Estimated Daily GHG Reduction (grams) 992,000
2 (Imperial County Transportation Commission, 2014)
3 (San Diego Association of Governments, Imperial County Transportation Commission, 2017)

SCAG TDM Strategic Plan: Potential Application of TDM Toolbox Strategies | Report
14
1.3.3 Long Term
Infrastructure and System Upgrades: Transit Improvements – HOV and Bus on Shoulder
While the 2014 Caltrans Corridor Concept Vision
included the recommendation to expand SR-
111 to six lanes, the introduction of grade-
separated interchanges where traffic signals
currently exist is likely a more effective strategy
to reducing delays and congestion. The planned
additional lanes could instead be dedicated to
bus and HOV and an incentive to use those
options in the corridor and to improve travel
times for high capacity modes.
In the interim, consideration could be given to
using the highway shoulder as a bus lane or
queue jumper at traffic signals to improve bus
travel times, which may improve the
convenience of using transit. In 2016, State
legislation allowed several regional agencies
including LA Metro, SANDAG, MTS, and NCTD the authority to move ahead with bus-on-shoulder
planning and implementation.4 Statewide legislation could potentially be enacted in 2019.5 As a
result, immediate action could be taken to plan potential service patterns, operations and
improvements (such as signal operation for bus queue jumpers and determining what paving
might be required). Longer term, ICTC and IVT should consider State and Federal grant options
that might help fund bus and HOV lanes as part of the highway widening vision.
Table 1-6: SR-111 Transit Improvements – HOV and Bus on Shoulder
Responsible Parties ICTC, Imperial Valley Transit, Imperial County,
City of Calexico
Estimated Cost High
Estimated Daily VMT Reduction 14,000
Estimated Daily GHG Reduction (grams) 3,936,000
4 (California Legislature, 2016)
5 (Richards, 2018)
Figure 1-6: Bus-on-Shoulder operation in Minnesota

SCAG TDM Strategic Plan: Potential Application of TDM Toolbox Strategies | Report
15
Event-related Congestion
2.1 Existing Conditions
2.1.1 Overview
County Los Angeles
Municipalities City of Los Angeles
Segment Extent/ Length Immediate vicinity of interchange
Figure 2-1: 10/110 Interchange Segment Overview
2 I-10/I-110 Interchange

SCAG TDM Strategic Plan: Potential Application of TDM Toolbox Strategies | Report
16
The I-10 and I-110 Interchange sits at a critical junction connecting freeways carrying vehicular
traffic from North to South and East to West in the Los Angeles Region. In addition, there are several
key destinations close to the interchange including downtown Los Angeles, Staples Center, Los
Angeles Convention Center, USC and Expo Park which attract traffic.
Each of I-110 and I-10 have six through travel lanes through this interchange. In addition, the
Harbor Transitway, a grade-separated bus and high-occupancy vehicle corridor in the median of
the I-110, runs between SR-91 and the south side of Downtown Los Angeles (close to the
interchange).
2.1.2 Multimodal Accessibility
Bicycle Facilities
There is improving bike accessibility through the interchange, with a new three-mile bikeway
running from Martin Luther King Jr. Boulevard to 7th Street, including a two-mile protected
stretch between USC and the Convention Center
Hoover Street and Grand Avenue both run North/South on either side of the interchange and have
Class II bike lanes. Venice Boulevard is dedicated as a bike friendly street and is the only such
route that runs East/West through the interchange.
Pedestrian Facilities
Access is very limited for pedestrians attempting to cross the interchange. Local arterial streets do
have sidewalks but the additional distance to cross the interchange may be up to a mile. Sidewalk
conditions may also be poor due to trash dumping near the overpasses.
Transit
Metro operates both rail and bus services nearby, as do multiple municipal operators. Major hubs
include:
• Nearby Pico station provides service to the Blue and Expo lines and 7th Street Metro Center
provides access to Blue, Expo, as well as Red and Purple lines.
• The Metro Silver, Expo, and 733 bus routes are all examples of regional lines that travel in
directions parallel to I-10 and I-110.
• Metro also operates local bus service on the surface streets surrounding the interchange.
HOV/ Toll Lanes
The 110 Express Lanes start just south of this interchange.

SCAG TDM Strategic Plan: Potential Application of TDM Toolbox Strategies | Report
17
2.1.3 Key Attractors
Downtown Los Angeles
Downtown Los Angeles is located to the north east of this interchange and accessed from a
number of exits off both I-10 and I-110. As a place of employment, downtown Los Angeles
attracts approximately 300,000 employees each day. There is also a growing residential
population.
There is an extensive rail and bus network serving the downtown area including the 7th Street
Metro Station, which the Expo, Blue, Red and Purple lines stop at. Metro bikeshare is also
available, and a small number of bike lanes serve the downtown area.
Staples Center
North east of this interchange lies the Staples Center, one of the major sporting venues in Los
Angeles. Staples Center is host to over 250 events and nearly 4 million visitors each year. The
arena seats up to 19,067 for basketball, 18,340 for ice hockey, and around 20,000 for concerts or
other sporting events.
Convention Center
Los Angeles Convention Center is located next door to the Staples Center in the LA Live area of
downtown Los Angeles. The Center hosts 350 events annually and more than 2 million visitors.
The Convention Center provides on-site parking for over 5,600 vehicles and includes 12 charging
stations for electric vehicles.
Expo Park
Located south west of the 110/10 interchange, Exposition Park is a 160-acre park home to the Los
Angeles Memorial Coliseum (home of USC Trojans football and Los Angeles Rams) Banc of
California Stadium (home of Los Angeles FC), Exposition Rose Garden and three museums
including the California African American Museum, the California Science Center and the Natural
History Museum of Los Angeles County.
Three Metro Expo line stations are located on the northern edge of the park including Expo Park/
USC Station, Vermont Station and Western Station. On the northeast, the Metro Silver Line bus
rapid transit serves Exposition Park & USC at its 37th Street/ USC Station on the Harbor Transitway.
University of Southern California (USC)
USC’s 226-acre University Park Campus is situated immediately north of Expo Park and is served
by the same transit services. The University had 47,000 students enrolled in 2017-18, with classes
running during the day and the evening. There are 4,500 full time faculty staff and over 15,000
staff who work at least 50% of time.
USC Transportation provides an extensive network of free buses throughout the year for students,
staff, faculty, and university guests. Multiple routes service USC’s main campus, the North
University Park neighborhood, the USC Parking Center as well as the USC Health Sciences Campus,
Marina Del Rey ISI/ICT locations, Keck USC of Alhambra, and Union Station. USC also has over

SCAG TDM Strategic Plan: Potential Application of TDM Toolbox Strategies | Report
18
13,000 parking spots, 10 parking structures and 40 parking lots across the University Park Campus
and Health Science Campus.
Dodger Stadium
The Dodger stadium baseball park is located north of the interchange and will contribute to
congestion when games are on. The stadium has capacity for 56,000 spectators and provides
general and preferred parking as well as encouraging visitors to travel by alternative
transportation. Metro operations two Dodger Stadium Express routes that transport fans to and
from the Stadium during home games; the service is operated using funding from the Mobile
Source Air Pollution Reduction Review Committee and Metro ExpressLanes.
2.1.4 Existing TDM Strategies
Education and Marketing
• Metro’s countywide Rideshare Program (Ridematch.com) provides trip planning support,
carpool/vanpool matching, and travel information for commuters who register in the system.
• Metro participates in national rideshare campaigns, also coordinated with other
transportation agencies in the SCAG region.
• Most of the key destinations surrounding the interchange have transportation information
available on their websites for visitors to access:
– LA Live - ww.lalive.com/visitor-center/public-transportation
– Staples Center - www.staplescenter.com/parking/public-transportation
– LA Convention Center - www.lacclink.com/attendees/public-transit
Incentives and Facilitation
The I-10/I-110 Interchange falls within Los Angeles County, where all employees and residents
have access to LA Metro’s vanpool and carpool matching program, which includes:
• a variety of subsidized transit pass programs for students (U-PASS) and employers (B-PASS/E-
PASS).
• a guaranteed ride home reimbursement program for employers registered in the Rideshare
Program.
• a $400 subsidy for registered vanpools who commute to destinations in Los Angeles County.
Nearby attractor University of Southern California (USC) participates in Metro’s U-PASS program
which provides students with discounted unlimited semester-long passes.
Infrastructure and System Upgrades
There have been many improvements to transportation in downtown LA in recent years. These
include the extension of the Expo line bringing eight more stations including Santa Monica in
direct connection with 7th Street Metro station. They also include the roll out of Metro bikeshare
across the downtown area, and on street improvements for bicycle movement around the
downtown area.
The Regional Connector Transit corridor which is currently under construction was due to open
late 2021 but is now expected in 2022. This will connect Metro Rail Blue and Expo lines to the

SCAG TDM Strategic Plan: Potential Application of TDM Toolbox Strategies | Report
19
current Gold line and Union station, meaning direct Metro service from home to work opens up
for many downtown commuters and visitors.
Parking Strategies
Most of the key destinations surrounding the interchange provide paid for parking including:
• Staples Center has paid parking, and designated pick-up/drop-off areas for game days.
• LA Convention Center has paid parking ranging from $15 to $30 per day.
• USC has extensive paid parking and encourages parking reservations in advance.
• The Coliseum has limited public parking in Expo Park; it is mostly allocated for permit parking.
Visitors are encouraged to use transportation or consider parking at USC and walking.
There are also many paid parking facilities in downtown Los Angeles.
TDM Supportive Policies
• There are several Specific Plans containing TDM policies within or close to this interchange,
including:
– The Central City West Specific Plan includes a requirement for projects of over 100,000
square feet or more of commercial or industrial floor area to submit a written,
preliminary Transportation Demand Management plan to the Department of
Transportation.
– The Los Angeles Sports and Entertainment District Specific Plan requires the area to
establish a TMO.
– The USC Specific plan seeks to increase the housing stock for students near the campus
to decrease vehicle trips. It also requires that adequate parking for the mix of uses
anticipated by this Specific Plan is provided while encouraging the use of alternative
transportation modes through the use of alternative parking measures.
– The North University Park Specific Plan is also near the intersection, but no
transportation topics are covered by the plan.
• In addition, City of Los Angeles is currently re-developing its TDM ordinance driven largely by
the decision to shift measurement to VMT through Senate Bill 743. The ordinance is expected
to be adopted in 2020.
• The entire corridor/ interchange falls under the South Coast Air Quality Management District
which require companies of more than 250 employees to mitigate mobile source emissions by
purchasing credits, paying into a fund, or implementing an employee commute trip reduction
program (ECRP), the latter which aligns with TDM programming.
Transportation Management Associations/Organizations
• FastLink DTLA is a non-profit Transportation Management Organization created to improve
travel in downtown Los Angeles by:
– Providing new microtransit services
– Designing a new on-demand travel app for DTLA
– Educating DTLA travelers about travel options other than personal vehicles — transit,
microtransit, vanpools, carsharing, walking and biking to optimize mobility
– Working with employers, developers and event centers
– Providing group rate and low-income discount travel passes.

SCAG TDM Strategic Plan: Potential Application of TDM Toolbox Strategies | Report
20
2.1.5 Planned Improvements
Table 2-1: I-10/I-110 Planned Improvements
Project Name Project Description Timeline Project Lead
110 Flyover Project
Construction off an elevated off-ramp structure on the northbound 110 between 30th St. and Figueroa St. The proposed structure would bypass the bottleneck intersections at Flower St. and Adams Blvd. and northbound I-110 HOT off-ramp to Adams Blvd., connecting the HOT lane traffic to Figueroa St.
Not determined. Caltrans with Metro
Dodger Stadium Aerial Tram
An aerial tram from Union Station to Dodger Stadium, which is capable of transporting up to 5000 people an hour.
Environmental Review process to begin – then Metro will determine whether or not to approve the project. Intent to operate by 2022
Aerial Rapid Transit Technologies (ARTT) wants to build the privately funded tramway.
2.1.6 Traffic Conditions
Congestion through Downtown Los Angeles
During the AM peak period (6am to 9am) the most congested section of the corridor is eastbound
on the I-10, and northbound on the I-110.
The volume of traffic using the I-10 westbound during the AM peak is 22,215 autos and 1,159
trucks. Northbound on the SR-110 in the AM peak there are 23,901 autos and 842 trucks.
During the PM peak period (3pm to 7pm), the most congested section is southbound on the I-110
approaching the exits for downtown LA.
Figure 2-2: I-10/I-110 AM and PM Delay
I-110
I-10
PM
I-110
I-10
AM Delay per segment in minutes
0.090 and below 0.090 to 0.290 0.290 to 0.550 0.550 to 1.000 1.000 to 10.000Other

SCAG TDM Strategic Plan: Potential Application of TDM Toolbox Strategies | Report
21
2.1.7 Challenges
This is a key interchange providing access to employment, residential, education and leisure
destinations.
While some improvements are planned to the roadway, this will take many years to implement
and is very expensive. TDM could provide some short-term relief to interchange congestion and
relieve additional congestion caused by the construction.
2.2 Corridor Vision
There are two main contributors to congestion surrounding the interchange; the first is people
travelling to work and school day to day. The second is the additional traffic that is generated by
“special events” at the myriad of sporting and convention facilities close to the interchange.
Through traffic is also likely a high contributor of congestion but is harder to influence through
TDM strategies.
The TDM vision for this corridor is focused on influencing visitors travelling to special events, as
well as employees commuting to those places. There is clear opportunity to also target users of
the interchange who are commuting into downtown LA, but they are not considered here.
2.3 TDM Solutions
2.3.1 Short Term
TDM Supportive Policy: TDM Ordinance and Policy Development
There is a strong existing policy environment in place around this interchange including a
requirement for the sports and entertainment district to have a TMO.
1. Transportation Management Organization (TMO). The owners of property within the Specific Plan area shall establish a TDM Plan approved by the General Manager. In order to implement this TDM Plan, the owners of property within the Specific Plan area shall establish a TMO, in which owners or property and tenants within the Specific Plan area shall participate. Participation in the TMO shall be required as a term of the tenant's lease with the owners of property within the Specific Plan area or with the management firm. 2. Implementation. Owners of property within the Specific Plan area shall submit an annual TDM report to the TMO, which shall submit one consolidated annual report to the General Manager. The General Manager shall review the annual report, to verify that development in the Specific Plan area has not exceeded environmental thresholds related to traffic and parking, based on Appendix B and the Parking Requirements Table, set forth in this Specific Plan.
Figure 2-3: Los Angeles Sports and Entertainment District Specific Plan, Section 14 Transportation and Parking
That TMO does not appear to have an external presence, and yet there is great potential for it to
serve those travelling to the district. It is therefore recommended that the existing ordinance
requirements are enforced and monitored.

SCAG TDM Strategic Plan: Potential Application of TDM Toolbox Strategies | Report
22
City of LA should review the communications and any plans submitted in relation to the TMO, and
annual report. They should subsequently arrange meetings with the relevant contacts at the
major attractors in the district to discuss what they are doing to meet these requirements.
It is possible that some of the attractors are submitting Employee Commute Reduction Plans to
meet South Coast AQMD requirements, although they could instead be buying credits or paying
into a fund. These could form a basis for an annual TDM Plan.
Table 2-2: I-10/I-110 Interchange TDM Ordinance and Policy Development
Responsible Parties City of Los Angeles
Estimated Cost Low
Estimated Daily VMT Reduction 43,000
Estimated Daily GHG Reduction (grams) 13,200,000
Incentives and Facilitation: Development of TMAs/TMOs
An area based TMO should be set up to facilitate the separate attractors in the district to work
together on transportation issues. Collectively they could promote and advocate for all forms of
non-SOV travel to the district, with a specific interest in evening hour service (for visitors and
employees alike).
Traditionally TMOs focused only on commute trips, but there is some good practice now in
relation to visitor trips too including in Los Angeles County (e.g. Santa Monica). Given the
existence of FastLink DTLA TMO which exists to improve travel in downtown Los Angeles, it is
recommended that the organizations in the Sports and Entertainment District become part of the
existing TMO and that TMO expands it services to meet their needs too.
In addition to advocating for better non SOV travel options in the district, the TMO would be the
one stop place to get transportation information for those wanting to travel to the district. There
would be a single transportation website to communicate that information to visitors, and the
TMO members would work together on marketing campaigns. In addition, they could work
together to explore options for employer vanpools or shuttles as appropriate, as well as additional
microtransit service.
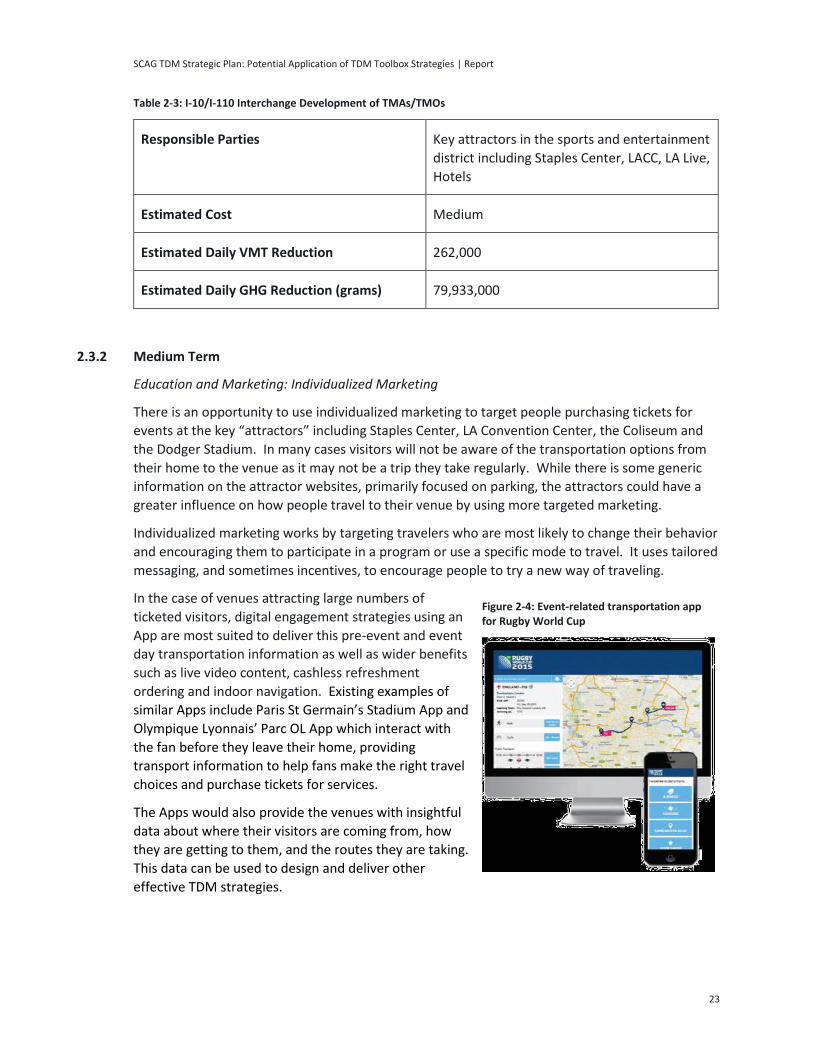
SCAG TDM Strategic Plan: Potential Application of TDM Toolbox Strategies | Report
23
Table 2-3: I-10/I-110 Interchange Development of TMAs/TMOs
Responsible Parties Key attractors in the sports and entertainment
district including Staples Center, LACC, LA Live,
Hotels
Estimated Cost Medium
Estimated Daily VMT Reduction 262,000
Estimated Daily GHG Reduction (grams) 79,933,000
2.3.2 Medium Term
Education and Marketing: Individualized Marketing
There is an opportunity to use individualized marketing to target people purchasing tickets for
events at the key “attractors” including Staples Center, LA Convention Center, the Coliseum and
the Dodger Stadium. In many cases visitors will not be aware of the transportation options from
their home to the venue as it may not be a trip they take regularly. While there is some generic
information on the attractor websites, primarily focused on parking, the attractors could have a
greater influence on how people travel to their venue by using more targeted marketing.
Individualized marketing works by targeting travelers who are most likely to change their behavior
and encouraging them to participate in a program or use a specific mode to travel. It uses tailored
messaging, and sometimes incentives, to encourage people to try a new way of traveling.
In the case of venues attracting large numbers of
ticketed visitors, digital engagement strategies using an
App are most suited to deliver this pre-event and event
day transportation information as well as wider benefits
such as live video content, cashless refreshment
ordering and indoor navigation. Existing examples of
similar Apps include Paris St Germain’s Stadium App and
Olympique Lyonnais’ Parc OL App which interact with
the fan before they leave their home, providing
transport information to help fans make the right travel
choices and purchase tickets for services.
The Apps would also provide the venues with insightful
data about where their visitors are coming from, how
they are getting to them, and the routes they are taking.
This data can be used to design and deliver other
effective TDM strategies.
Figure 2-4: Event-related transportation app for Rugby World Cup
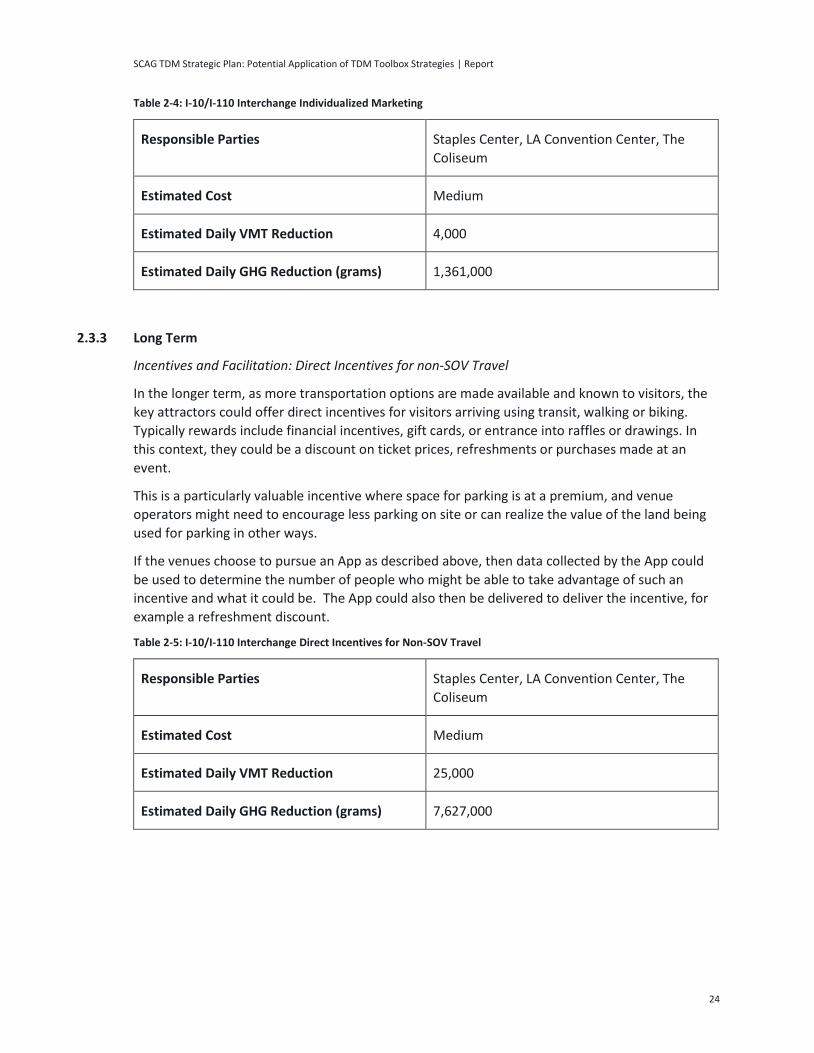
SCAG TDM Strategic Plan: Potential Application of TDM Toolbox Strategies | Report
24
Table 2-4: I-10/I-110 Interchange Individualized Marketing
Responsible Parties Staples Center, LA Convention Center, The
Coliseum
Estimated Cost Medium
Estimated Daily VMT Reduction 4,000
Estimated Daily GHG Reduction (grams) 1,361,000
2.3.3 Long Term
Incentives and Facilitation: Direct Incentives for non-SOV Travel
In the longer term, as more transportation options are made available and known to visitors, the
key attractors could offer direct incentives for visitors arriving using transit, walking or biking.
Typically rewards include financial incentives, gift cards, or entrance into raffles or drawings. In
this context, they could be a discount on ticket prices, refreshments or purchases made at an
event.
This is a particularly valuable incentive where space for parking is at a premium, and venue
operators might need to encourage less parking on site or can realize the value of the land being
used for parking in other ways.
If the venues choose to pursue an App as described above, then data collected by the App could
be used to determine the number of people who might be able to take advantage of such an
incentive and what it could be. The App could also then be delivered to deliver the incentive, for
example a refreshment discount.
Table 2-5: I-10/I-110 Interchange Direct Incentives for Non-SOV Travel
Responsible Parties Staples Center, LA Convention Center, The
Coliseum
Estimated Cost Medium
Estimated Daily VMT Reduction 25,000
Estimated Daily GHG Reduction (grams) 7,627,000

SCAG TDM Strategic Plan: Potential Application of TDM Toolbox Strategies | Report
25
TDM Supportive Policy: Congestion Pricing
The congestion caused by TNCs (e.g. Uber, Lyft) is increasingly an issue in downtown areas as well
as key attractors nationwide. Some of the attractors surrounding this interchange could consider
collecting a fee from TNCs who drop passengers off at the curbside outside of their venues.
Before doing so they would identify and geo-fence specific areas which are dedicated for TNC
drop off and pick up.
Before designing and implementing such a scheme, it would be essential to know the arriving and
departing travel mode for all visitors (and employees) at the attractors. This could be established
via a survey of visitors, ideally over a minimum of a one-week period given the mix of event days
and times taking place at these venues.
Charging TNCs to use the curb will generate revenue which could be used to fund incentives for
those arriving using public transportation, walking or biking.
Table 2-6: I/10-I/110 Interchange Congestion Pricing
Responsible Parties Key attractors
Estimated Cost Medium
Estimated VMT Reduction 45,000
Estimated Daily GHG Reduction (grams) 13,709,000

SCAG TDM Strategic Plan: Potential Application of TDM Toolbox Strategies | Report
26
Port-related Travel through a Downtown Area
3.1 Existing Conditions
3.1.1 Overview
County Los Angeles
Municipalities Long Beach, Los Angeles
Segment Extent South: Ocean Boulevard
North: I-405 Interchange
Segment Length 4.74 Miles
Figure 3-1: I-710 Segment Overview
3 I-710

SCAG TDM Strategic Plan: Potential Application of TDM Toolbox Strategies | Report
27
The 710 Corridor in Los Angeles spans a total of 23 miles from downtown Long Beach north
through roughly 15 different communities, ending abruptly in Alhambra just before the Interstate
210. The corridor is an important freight route linking the Ports of Long Beach and Los Angeles
with distributions centers and intermodal facilities in Los Angeles and the Inland Empire. Caltrans
estimates that this segment has about 103,800 Annual Average Daily Traffic (AADT); 21.3 percent
or 22,200 AADT is truck traffic.6
3.1.2 Multimodal Accessibility
Bicycle Facilities
There are no bicycle facilities on the Interstate 710; bicycles are prohibited on this freeway.
However, there are various facilities for cyclists in Long Beach near the southern extent of the
corridor.
• The City of Long Beach has an extensive network of Class I, II and III and IV bikeways
extending from downtown into North Long Beach. The LA River Bikeway is a 29-mile Class I
Dedicated Bikeway that runs parallel to the 710 for the entirety of this segment. The trail
begins in Azusa and ends in downtown Long Beach.
• Metro Bike Share operates 12 docking stations around the Port of Los Angeles in the
communities of San Pedro and Wilmington (Figure 3-2).
• Long Beach Bike Share operates a 400-bike system throughout the communities of Long
Beach, North Long Beach.
• Long beach has also initiated an electric scooter pilot with various operators.
Figure 3-2. Metro Bike Share Docking Stations at Port of Los Angeles
6 (Caltrans District 7, 2013)

SCAG TDM Strategic Plan: Potential Application of TDM Toolbox Strategies | Report
28
Pedestrian Facilities
Pedestrian access is prohibited along the 710 freeway.
Transit
The 710 corridor is not well served by transit, but there are high-quality transit alternatives linking
downtown Los Angeles to downtown Long Beach and the communities in between.
• Bus Connections
– Metro is currently running local, select and express shuttle service to accommodate
travelers while Blue Line service is closed.
– Long Beach Transit operates 30 local bus routes that connect Metro Blue Line stations to
destinations in Long Beach, Signal Hill, North Long Beach and Compton.
• Rail Connections
– Los Angeles Metro’s Blue Line light rail service runs from downtown Los Angeles (7th
St./Metro Center) to downtown Long Beach and provides an important driving
alternative for people traveling between the two metro areas. Metro is currently working
to upgrade service along the Blue Line and has planned closures along the southern and
northern segments through Fall 2019.
Parking
Los Angeles Metro operates park and ride facilities at several of the Blue Line Stations along this
corridor including the Wardlow and Willow Blue Line Stations, both of which have bike lockers
and/or racks.
3.1.3 Key Attractors
Ports of Long Beach and Los Angeles
The Ports of Los Angeles and Long Beach are major trip generators at the southern terminus of the
710 freeway. Together the Ports account for approximately 40 percent of all container goods
entering the United States and 25 percent of all exports.7 Most of these goods are destined for
distribution centers in Los Angeles and the Inland Empire. The 2016 SCAG RTP/SCS estimates that
25,000 daily trucks travel on the 710 freeway, which is expected to increase to 34,000 by 2030.8
Long Beach Central Business District
I-710 provides primary access to the Long Beach Central Business District. The City of Long Beach
has a resident population of approximately 462,0009 making it the second largest city in Los
Angeles County. Approximately 73 percent of the total workforce, which is 168,000, live outside
7 (Port of Long Beach, 2017)
8 (Southern California Association of Governments, 2016)
9 (United States Census Bureau, 2010)

SCAG TDM Strategic Plan: Potential Application of TDM Toolbox Strategies | Report
29
of Long Beach and commute into the City each workday10. Downtown Long Beach is also a
destination for visitors who take advantage of attractions like the Long Beach Aquarium, the
Convention Center, and cruises to Catalina, among others.
Long Beach Municipal Airport
The Long Beach Municipal Airport is located approximately five miles from the I-710 and I-405
interchange. The airport serves 17 non-stop national destinations and five carriers. The FAA
reports that there were roughly 1.8 million passenger boardings at the airport in 2017.11 In
addition, the airport complex directly supports 19,000 jobs.12
3.1.4 Existing TDM Strategies
Education and Marketing
• Los Angeles Metro’s countywide Rideshare Program (Ridematch.com) provides trip planning
support, carpool/vanpool matching, and travel information for commuters who register in the
system.
• Metro participates in national rideshare campaigns, also coordinated with other
transportation agencies in the SCAG region.
Incentives and Facilitation
The I-170 segment falls within Los Angeles County, where all employees and residents have access
to LA Metro’s vanpool and carpool matching program, which includes:
– a variety of subsidized transit pass programs for students (U-PASS) and employers (B-
PASS/E-PASS).
– a guaranteed ride home reimbursement program for employers registered in the
Rideshare Program.
– a $400 subsidy for registered vanpools who commute to destinations in Los Angeles
County.
Infrastructure and System Upgrades
• Both the Port of Long Beach and Port of Los Angeles have expanded on-dock intermodal rail
facilities to reduce the number of truck trips. Each train eliminates approximately 750 truck
trips.13 At Port of Long Beach, five of the six terminals are outfitted with on-dock intermodal
rail facilities, allowing shipping containers to be moved directly from container ship to double-
stock train.
• The PierPASS program was initiated by the Ports of Long Beach and Los Angeles in 2005 to
address congestion caused by trucks. The program levies fees on containers entering and
leaving the ports at peak periods, providing shippers with financial incentives to move their
10 (United States Census Bureau, 2015)
11 (Air Carrier Activity Information System , 2017)
12 (Long Beach Aiport, 2018)
13 (Port of Long Beach, 2017)

SCAG TDM Strategic Plan: Potential Application of TDM Toolbox Strategies | Report
30
cargoes during off-peak periods. As a result, roughly 20 percent of truck traffic was
redistributed to off-peak hours.
• The TruckTag program, started in 2006, outfits each container truck entering the ports with a
Radio Frequency Identification (RFID) which facilitates check-in/check-out at terminals. Data
may be used by Ports and shippers to monitor throughput and large bottlenecks at the
entrances.
• Metro has developed a First Last Mile plan for all of its Blue Line stations, including the
Downtown Long Beach station. Recommendations for the stations included better lighting,
sidewalk widening and repair, crosswalk improvements, high quality low stress bike facilities
and wayfinding signs.
TDM Supportive Policies
• The City of Los Angeles is currently in the process of updating their TDM ordinance. The
ordinance will require new residential and commercial developments implement TDM plans
to meet site specific SOV targets. Portions of the City of Los Angeles located adjacent to the
710 freeway (Wilmington) are subject to the ordinance.
• The South Coast Air Quality Management District’s Rule 2202 requires employers with 250 or
more employees within the South Coast Air Basin to mitigate the emissions contributed by
their employees’ commute trips through one of three options, including providing worksite
transportation programs to encourage non-SOV travel and trip reduction.
• The City of Long Beach Midtown Specific Plan reimagines the corridor along Long Beach
Boulevard as a vibrant multimodal commercial district. The Plan supports Transit Oriented
Development at three transit nodes along the corridor, the Willow, Pacific Coast Highway and
Anaheim Blue Line Stations. The Plan also identifies areas of active transportation
improvements including a cycle track along the length of the corridor, bike boulevards
running parallel and perpendicular to the corridor, bike loop detectors, high quality
crosswalks, wayfinding and others.
• Three Development Districts in the City of Long Beach have TDM supportive requirements to
provide enhanced pedestrian and bicycle facilities: Downtown Long Beach, Wilmore City,
Downtown Shoreline.
Parking Strategies
• The Long Beach Municipal Airport implements paid parking: $2 per hour with daily rates
varying by lot.
• The City of Long Beach maintains nine public parking lots, three of which provide free parking
for the first two-hours. The lots offer flat monthly and daily rates, but fees vary by garage. The
City has partnered with Passport to provide a mobile parking payment app. The City also has a
mobile app called EZparkLB which provides real-time parking availability info.
• On-street parking is also available from 9am-9pm for $1-$1.50 per hour for a max of two
hours.

SCAG TDM Strategic Plan: Potential Application of TDM Toolbox Strategies | Report
31
3.1.5 Planned Improvements
Table 3-1: I-710 Planned Improvements
Project Description Timeline Project Lead
I-710 Corridor Project/Preferred Alternative 5c
The I-710 Corridor Project is a proposed project to widen the lower 710 freeway and improve safety, mobility, and air quality. Metro selected Alternative 5C as the locally preferred alternative. The $6 billion endeavor will include design features to address areas with high truck volumes, including:
• Buffered Downtown-Only Lanes to separate autos from truck traffic south of the I-405 interchange;
• Truck Bypass Lanes at the I-405 interchange to separate auto and truck traffic; and
• Added general purpose lanes to increase capacity, among other improvements.
Alternative 5c also allocates funding towards a zero-emissions truck program, new and enhanced transit service, increases and enhancements to park space in neighboring communities, and the creation of new bike and pedestrian pathways.
The Final EIR/EIS will be completed in 2019.
Los Angeles Metro
I-710 Corridor Bike Path Project
The I-710 Corridor Bike Path Project proposes three bike paths that aim to serve bicyclists, pedestrians, and transit users of the LA River, Rio Hondo Bike Trail, and Metro’s Blue and Green Line.
Environmental review began in June 2017 and is still underway.
LA Metro
Port of Long Beach Pier B On-Dock Rail Expansion Project
This project will convert areas on Pier B currently used for storage into an expanded on-dock rail facility, with capability to load more containers directly onto longer trains and eliminate more truck trips. The Port is working to upgrade Pier B to include on-dock rail support facilities and hopes to move roughly 35 percent of its cargo out of the region by rail.
EIR was Approved in 2018.
Port of Long Beach

SCAG TDM Strategic Plan: Potential Application of TDM Toolbox Strategies | Report
32
3.1.6 Traffic Conditions
Most Volume Comes from Personal Vehicles
Although the I-710 is an important freight corridor with direct access to the Port of Long Beach,
the volume of autos traveling along this segment every day far exceeds the number of trucks.
Figure 3-3 presents a comparison of auto and truck volumes along the corridor during the AM
peak. According to the I-710 DEIR, the percentage of trucks along the segment from the I-405
junction ranges from 20-24 percent.14 Further south of the Anaheim, the number of trucks as a
percentage of total volume increases to roughly 65 percent, as this freeway crosses over the
bridge onto Terminal Island.
Figure 3-3 Volume of Autos and Trucks along the NB I-710 Segment in the AM Peak
3.1.7 Challenges
Strategies to reduce truck traffic are complicated, as economic growth in the freight industry
requires increased movement of container goods in and out of the port. At present, 26 percent of
goods arriving at the Ports are immediately transferred to on-dock rail.15 Most containers,
14 AECOM. I-710 Corridor Project Traffic Operations Analysis Report (March 2017).
15 (Southern California Association of Governments, 2016)
Trucks
Vehicle volume per segment
I-710
Autos
I-710
Ocean Blvd. Ocean Blvd.

SCAG TDM Strategic Plan: Potential Application of TDM Toolbox Strategies | Report
33
however, are loaded onto trucks and driven to nearby distribution centers, intermodal rail
facilities, retail centers, and airports in Los Angeles and San Bernardino Counties.
3.2 Corridor Vision
Although the I-710 is an important link in the national freight network, the corridor is heavily
trafficked by automobiles. Short-term TDM strategies for the corridor address work and non-work
trips at key attractors to reduce the number of single-occupancy vehicle trips. Medium and long-
term strategies build on existing plans and projects designed to improve truck throughput by
strengthening high quality alternatives and encouraging more efficient use of roadway.
3.3 TDM Solutions
3.3.1 Short Term
Incentives and Facilitation: Development of Employee Commute Programs at Long Beach
Municipal Airport
Employee Commute Programs combine a suite of strategies to encourage people to use
alternative modes for their commute to work. Various complimentary strategies may be included
such as carpool and vanpool coordination, financial incentives for non-SOV travel, and marketing
and education campaigns. Typically, they are implemented by a single employer, consortium of
employers, or TMA/TMO.
The Long Beach Airport Complex is directly responsible for an estimated 29,000 jobs associated
with airport staff, concessionaires, aircraft maintenance, and cargo carriers. However, they do not
presently have an employee commute reduction program.
The airport should initiate a complex-wide employee commute reduction program. This would
require coordination among airport staff and various businesses that operate there. A basic
employee commute program would include carpool and vanpool coordination, pre-tax benefits
for employee transportation, various marketing and educational campaigns, and a guaranteed
ride home program. Marketing campaigns and lunch and learn events are simple ways to educate
employees about their current transportation options. These offerings would be easily
coordinated by the airport for all staff and do not require that management staff at individual
companies be heavily involved. Vanpool subsidies and guaranteed ride home reimbursements are
currently offered by Metro for companies enrolled in their rideshare program. Implementing
these programs may only require assisting various administrative staff in registering for these
benefits. The pre-tax benefit requires coordination through payroll companies and would be more
complicated. The airport could also consider direct incentives for non-SOV travel to complement
and increase participation in this program. This might include discounted transit passes for anyone
working on site or added subsidies for employees that carpool or vanpool.

SCAG TDM Strategic Plan: Potential Application of TDM Toolbox Strategies | Report
34
Table 3-2: I-710 Development of Employee Commute Programs
Responsible Parties Metro, Long Beach Transit, Long Beach Municipal
Airport
Estimated Cost Medium
Estimated Daily VMT Reduction 61,000
Estimated Daily GHG Reduction (grams) 18,655,000
Infrastructure and System Upgrades: Bike Transit Integration
Bike transit integration can include expanding the number of bicycle lockers and repair stations at
key transit hubs, improving bicycle facilities at key intersections and along specific routes, or
providing incentives to people to use bike share in combination with transit (i.e. reduced bike
share memberships).
About 27 percent of the people who live in Long Beach also work in Long Beach, roughly 45,000
people. The City, in cooperation with Metro and Long Beach Transit, could better leverage the
considerable active transportation network in the community to encourage more of these people
to ride transit, walk and bike to destinations in downtown Long Beach for both work and non-
work trips.
Long Beach Transit, Metro and the City of Long Beach should initiate some stakeholder outreach
to better understand how bike transit integration could facilitate first/last mile connections in
downtown Long Beach for work and non-work trips. While most buses that serve this area are
equipped with bicycle racks, this could mean additional bike lockers at strategic locations near
transit stops or other downtown destinations or financial incentives for people who regularly use
the local bikeshare in combination with transit.
Table 3-3: I-710 - Bike Transit Integration
Responsible Parties Metro, Long Beach Transit, City of Long Beach
Estimated Cost Medium
Estimated Daily VMT Reduction 15,000
Estimated Daily GHG Reduction (grams) 4,606,000

SCAG TDM Strategic Plan: Potential Application of TDM Toolbox Strategies | Report
35
3.3.2 Medium Term
Marketing and Education: 710 Freeway Widening Individualized Marketing Campaign
Individualized Marketing or Personalized Trip Planning involves engaging residents directly at their
homes to better understand their transportation needs and challenges and tailoring
recommendations to their specific context. Often, Individualized Marketing Programs are
launched to encourage people to try a specific new program or service.
The 710 Freeway Widening Project offers an excellent opportunity to implement an Individualized
Marketing Campaign to educate residents and commuters in Long Beach and neighboring
communities about their travel options. Construction activities will likely require mitigation
activities as well, so a door-to-door campaign could complement a wider marketing campaign that
combines print, web and social media messaging.
The Campaign should be focused on educating public about transportation alternatives during
construction as well as their future options once the associated active transportation and transit
service improvements have been implemented. The campaign should target approximately 5,000
households near the Willow and Wardlow Blue Line Stations and areas in West Long Beach.
Table 3-4: I-710 - Individualized Marketing
Responsible Parties City of Long Beach, Los Angeles Metro, Long Beach
Transit
Estimated Cost Low
Estimated Daily VMT Reduction 1,000
Estimated Daily GHG Reduction (grams) 414,000
Parking Strategies: Parking Pricing in Downtown Long Beach
Dynamic parking pricing involves raising the cost of parking based on demand to increase
availability of parking spaces, reduce cruising time, and better align driving/parking costs to their
impact on current congestion levels. Dynamic parking systems require real-time information about
parking utilization to accurately price parking spaces.
The City of Long Beach currently manages parking pricing in Long Beach on-street and in public
parking garages and lots. The City has recently launched a new app-based parking system,
EZparkLB, to better manage parking demand. The app provides real-team capacity information
about parking supply both on- and off-street throughout Long Beach. Users can sort facilities by
pricing, payment options and hours of operation. A search function allows users to refer to key
destinations and landmarks.
The City’s innovations in mobile parking applications allow for future use of dynamic parking, to
vary the cost of each parking space by demand and better manage supply. By increasing the cost

SCAG TDM Strategic Plan: Potential Application of TDM Toolbox Strategies | Report
36
of parking at peak periods, the City makes driving alternatives more attractive to those willing to
use transit, ride bicycles or walk to their destinations. This strategy helps reduce commute trips as
well as visitor trips to major downtown destinations and events.
Table 3-5: I-710 - Parking Pricing in Downtown Long Beach
Responsible Parties City of Long Beach
Estimated Cost Medium
Estimated VMT Reduction 82,000
Estimated Daily GHG Reduction (grams) 25,042,000
3.3.3 Long Term
TDM Supportive Policy: TDM Ordinance and Policy Development
TDM ordinances typically require developers or employers to provide TDM strategies at
residential or worksites to mitigate traffic congestion. Changes to the CEQA review process, set in
motion by the passage of SB 375, encourage traffic mitigation efforts to focus more on TDM
measures that reduce VMT than increasing roadway capacity.
Long Beach is an enormous employment center with a growing population of almost 500,000
people. The City should adopt a formal TDM ordinance to guide how TDM is implemented for
future traffic mitigation and better manage future economic and population growth.
The City of Long Beach should initiate a TDM ordinance, modelled after the City of Los Angeles
forthcoming ordinance, that sets specific targets for different areas and aligns with local
development and specific plans.
Table 3-6: I-710 - TDM Ordinance and Policy Development
Responsible Parties City of Long Beach
Estimated Cost Low
Estimated Daily VMT Reduction 60,000
Estimated Daily GHG Reduction (grams) 18,327,000
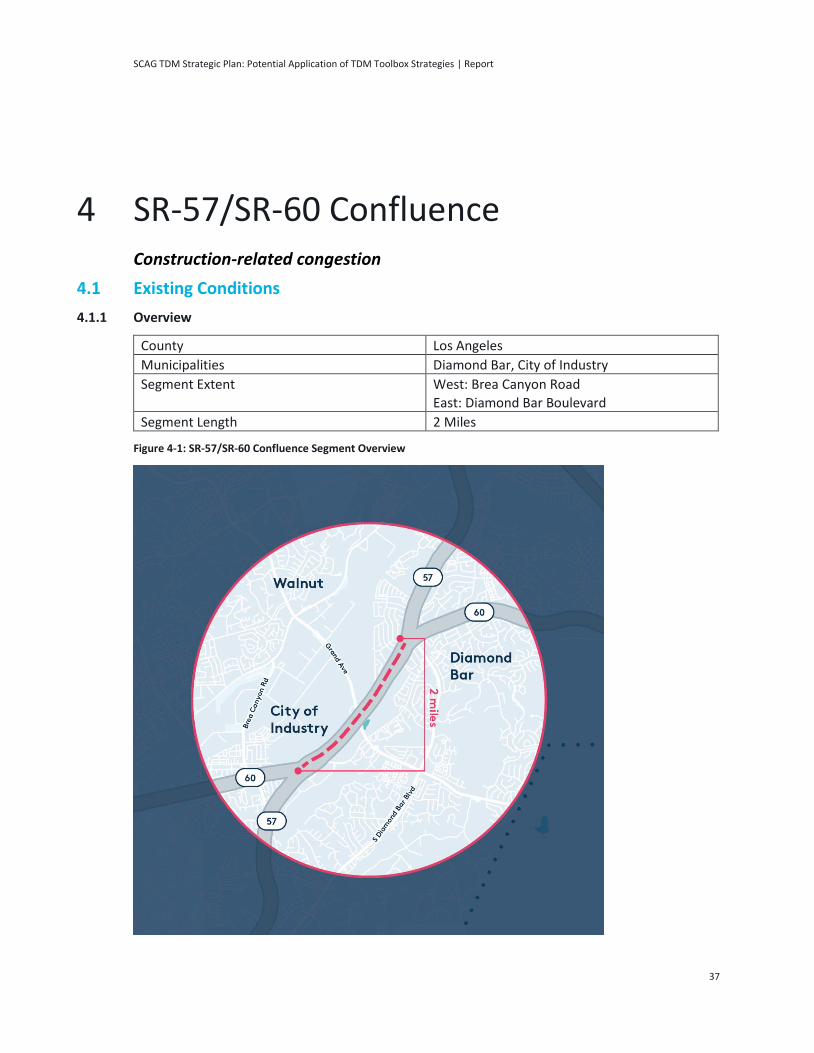
SCAG TDM Strategic Plan: Potential Application of TDM Toolbox Strategies | Report
37
Construction-related congestion
4.1 Existing Conditions
4.1.1 Overview
County Los Angeles
Municipalities Diamond Bar, City of Industry
Segment Extent West: Brea Canyon Road
East: Diamond Bar Boulevard
Segment Length 2 Miles
Figure 4-1: SR-57/SR-60 Confluence Segment Overview
4 SR-57/SR-60 Confluence

SCAG TDM Strategic Plan: Potential Application of TDM Toolbox Strategies | Report
38
State Routes 57 and 60 (SR-57 and SR-60) run parallel for two miles across the City of Industry and
City of Diamond Bar in eastern Los Angeles County, across Grand Avenue. The interchange,
referred to as the SR-57/SR-60 Confluence, or “the Confluence” is characterized with heavy
congestion and dangerous lane configurations, including a required quick merge across several
lanes for many drivers. It has been considered to be the sixth worst freight bottleneck in the
nation, and one of the five most congested segments within Caltrans District 7.
SR-57 has six through lanes, with an HOV lane in each direction, and SR-60 has eight through lanes
with an HOV lane in each direction. Grand Avenue has two through lanes in each direction, with
additional turn lanes at on and off ramps to SR-57. It also connects the residential uses in Walnut
with retail and residential neighborhoods in Diamond Bar and further south in Chino Hills.
Additionally, the construction of an outlet mall has been proposed for the area just east of Grand
Ave. and north of SR-57 and SR-6016.
Beginning in 2016, the Confluence has been impacted by the “SR-57/SR-60 Confluence Project”
(referred to in this document as “the Project”). Major improvements have taken place along the
Confluence, including the construction of westbound on and off ramps between Grand Avenue
and SR-60, and improvements to both the freeways and arterials are planned to be implemented
in the coming years. The construction has so far been funded through the City of Industry, LA
Metro, and the Federal Government through the TIGER grant program. It is expected to continue
through 2028.
4.1.2 Multimodal Accessibility
Bicycle Facilities
There is no access for cyclists along SR-57 or SR-60 themselves as they are freeways. Grand
Avenue is signed for bikes heading south just south of the freeways, though it is an unattractive
corridor for cyclists due to its multiple on and off ramps. Parallel to the freeways, Golden Springs
Drive has Class II bike lanes in each direction. West of the interchange cyclists can cross SR-57 and
SR-60 by traveling north and south on Brea Canyon Rd.
Pedestrian Facilities
The SR-57/SR-60 Confluence has very little pedestrian infrastructure. Grand Ave. has sidewalks
from Valley Blvd. south toward SR-57 and SR-60, but they don’t continue all the way to the
freeways. South of the freeways sidewalks appear again in Diamond Bar. Sidewalks also exist
south of the freeways along Golden Springs Drive, though lack of street trees and sidewalk-
adjacent uses, along with hilly topography, present barriers to pedestrians.
Transit
• Bus Connections
– Foothill Transit operates bus service in the area, with lines 482, connecting Diamond Bar
to Puente Hills further west and Pomona to the east, 853 and 854 providing local travel
around Diamond Bar, and 495 connecting the City of Industry to Downtown Los Angeles.
16 (Majestic Realty)

SCAG TDM Strategic Plan: Potential Application of TDM Toolbox Strategies | Report
39
– To connect to areas further out, their line 497 and Metrolink’s Riverside Line stops in the
City of Industry west of Grand Ave. and travels to Downtown Los Angeles.
4.1.3 Key Attractors
Freight Corridor
SR-60 is a well-traveled freight corridor, with an estimated 26,000 trucks per day traveling to
points east in Riverside, and further on to other parts of the country.
Employment South and West of the Confluence
Though not an attractor to the corridor itself, employment south and west of the SR-57/SR-60
Confluence attracts severe congestion westbound in the AM peak and eastbound in the PM peak
hours. US Census data from 2011 showed that residents in cities along SR-60, in particular Walnut
and Diamond Bar, the two major residential cities that border the Confluence, have average
commutes of upwards of 35 minutes, while the larger regional average was 29 minutes. 17
4.1.4 Existing TDM Strategies
Education and Marketing
• Project stakeholders have developed www.freetheway.org, a website dedicated to the
project. It provides news, and informational documents about the project, and allows
community members to contact them with questions about the project. However, this site
does not appear to be widely publicized and the most recent news article posted is from
2015.
Incentives and Facilitation
• The South Coast Air Quality Management District is one of the largest employers in the area
surrounding the SR-57/SR-60 Confluence. The entire facility follows a “4/40” work schedule,
working four, ten-hour days each week. This cuts back on vehicle trips to and from the
building by 1/5. In addition to the 4/40 work schedule, the South Coast Air Quality
Management District provides financial incentives to employees who use alternative
commute modes which results in additional vehicle trip reductions.
• The City of Walnut provides discounted Metrolink ($32 off per 30 monthly pass), Metro
(discounts vary by zone) and Foothill Transit passes ($10-$20 off per monthly pass) for all its
residents, of which there are just over 30,000.18
• The Confluence falls within Los Angeles County, where all employees and residents have
access to LA Metro’s vanpool and carpool matching program, which includes:
– a variety of subsidized transit pass programs for students (U-PASS) and employers (B-
PASS/E-PASS).
– a guaranteed ride home reimbursement program for employers registered in the
Rideshare Program.
17 (Velasco, 2011)
18 (City of Walnut)
SCAG TDM Strategic Plan: Potential Application of TDM Toolbox Strategies | Report
40
– a $400 subsidy for registered vanpools who commute to destinations in Los Angeles
County.
• As many trips through the Confluence continue to or from the Inland Empire, many
commuters have access to the benefits provided by RCTC and SBCTA
– The IE Commuter program is a partnership with RCTC and SBCTA to assist commuters in
trying alternative modes and incentivize them with rewards. More than 200 employees
are registered for incentive programs, which includes financial incentives for new transit
riders, coupons, and monthly drawings.
– RCTC and SBCTA offer a $400 vanpool subsidy to those registered in the program, similar
to Orange and Los Angeles County. Like the other county programs, it is destination
based and recognizes that many commuters travel between counties. The program
launched in 2019 and hopes to have 200 vanpools registered in three years.
Parking Strategies
• The City of Industry’s park and ride lot has space for 622 cars connecting to Metrolink and
Foothill Transit. 422 of those spaces are reserved for Foothill Transit customers.19
• Additional park and ride facilities exist such as just south of the Confluence along SR-57 at
Pathfinder Road, and just north of the Confluence on Diamond Bar Boulevard in between SR-
57 and SR-60.
TDM Supportive Policies
• The City of Diamond Bar’s General Plan includes a strategy about coordinating with local
jurisdictions to develop a TDM Plan, but it is not apparent that they have acted on this.20
• The City of Industry’s development standards include a requirement for the inclusion of TDM
strategies ranging from the inclusion of a bulletin board with transportation information to
infrastructure upgrades based on the size of the development.
• The South Coast Air Quality Management District’s Rule 2202 requires employers with 250 or
more employees within the South Coast Air Basin to mitigate the emissions contributed by
their employees’ commute trips through one of three options, including providing worksite
transportation programs to encourage non-SOV travel and trip reduction.
19 (Foothill Transit)
20 (City of Diamond Bar, 1995)

SCAG TDM Strategic Plan: Potential Application of TDM Toolbox Strategies | Report
41
4.1.5 Planned Improvements
Table 4-1: SR-57/SR-60 Planned Improvements
Project Description Timeline Project Lead
SR-57/SR-60 Confluence Project
The project is in progress and is planned to include three phases:21
• Phase I: Construction of Grand Avenue westbound on-ramp, westbound auxiliary lane on SR60, and interim operation improvements at the Grand Avenue interchange.
• Phase IIA: Construction of improvements on the arterial roadways including Grand Avenue south of the SR60 interchange, approximately 0.4 miles of Golden Springs Drive. Rebuilding of Grand Avenue and Golden Springs Drive intersection. This phase is out to bid for construction.
• Phase IIB: Construction of a westbound off-ramp and an auxiliary lane to Grand Avenue. This phase is complete.
• Phase III: Construction of freeway mainline improvements and bypass connectors, including construction of a new eastbound bypass connector on SR-60 and a new eastbound loop on-ramp on Grand Avenue and an extended eastbound auxiliary lane to the bypass connector.
• Phase I: Complete (2018)
• Phase IIA: Currently out to bid for construction
• Phase IIB: Complete
• Phase III: Anticipated to be complete by 2028
Caltrans, FHWA, LA Metro, City of Diamond Bar, City of Industry
Diamond Bar Boulevard Streetscape Improvements
Just north of the Confluence, the City of Diamond Bar has proposed streetscape improvements to a stretch of Diamond Bar Boulevard with retail on both sides of the corridor. They have stated that the project will include “plantings, furnishings, colored concrete paving’s, lighting as well as monument signs and decorative accents that both add visual interest and pay tribute to the area's ranching heritage are among the planned improvements.” These improvements are a part of Diamond Bar’s long-term plan to provide streetscape enhancements in key well-traveled areas throughout the City.22
This project is under construction with anticipated completion in 2019.
City of Diamond Bar
21 (City of Industry)
22 (City of Diamond Bar)

SCAG TDM Strategic Plan: Potential Application of TDM Toolbox Strategies | Report
42
Figure 4-2: 57/60 Confluence Project
4.1.6 Traffic Conditions
Morning Westbound and Evening Eastbound Delay
The SR-57/SR-60 Confluence sees heaviest congestion going westbound during the AM peak
period, and going eastbound in the PM peak period.
Figure 4-3: SR-57/SR-60 Confluence AM Travel Delay
Figure 4-4: SR-57/SR-60 Confluence PM Travel Delay
AM
SR-60 SR-57
Delay per segment in minutes 0.160 and below 0.160 to 0.600 0.600 to 1.300 1.300 to 2.700 2.700 and above Other
PM
SR-60 SR-57
Delay per segment in minutes 0.160 and below 0.160 to 0.600 0.600 to 1.300 1.300 to 2.700 2.700 and above Other
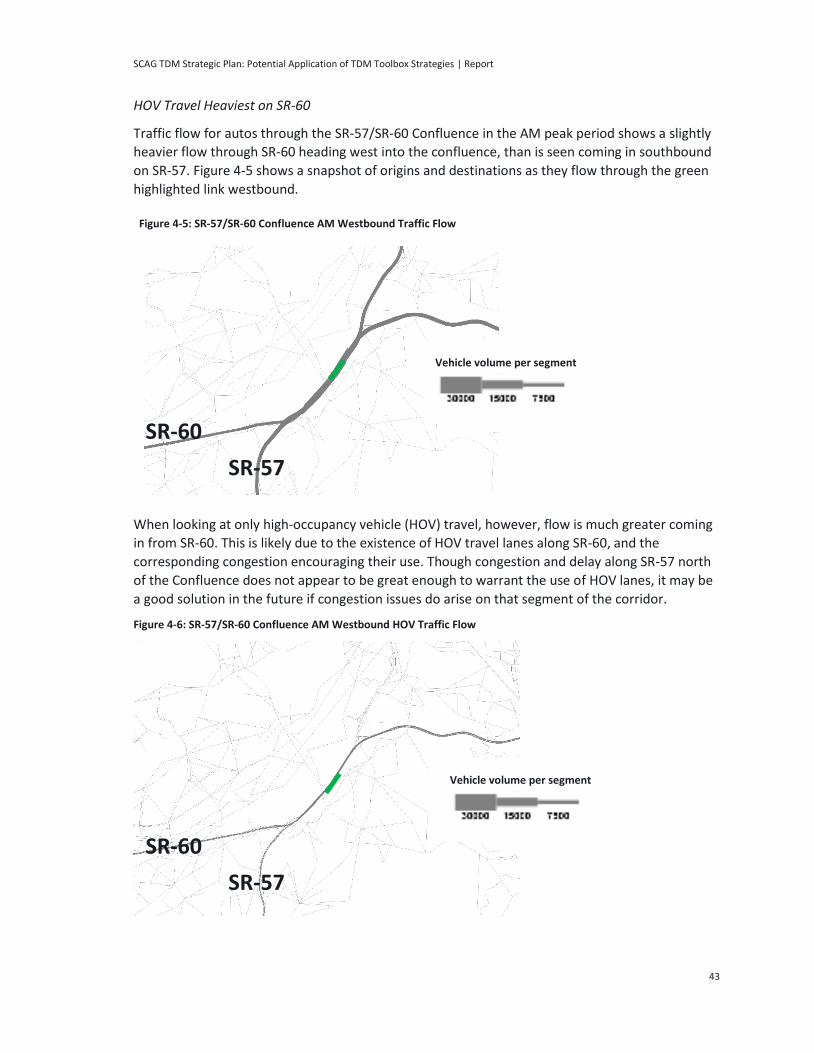
SCAG TDM Strategic Plan: Potential Application of TDM Toolbox Strategies | Report
43
HOV Travel Heaviest on SR-60
Traffic flow for autos through the SR-57/SR-60 Confluence in the AM peak period shows a slightly
heavier flow through SR-60 heading west into the confluence, than is seen coming in southbound
on SR-57. Figure 4-5 shows a snapshot of origins and destinations as they flow through the green
highlighted link westbound.
When looking at only high-occupancy vehicle (HOV) travel, however, flow is much greater coming
in from SR-60. This is likely due to the existence of HOV travel lanes along SR-60, and the
corresponding congestion encouraging their use. Though congestion and delay along SR-57 north
of the Confluence does not appear to be great enough to warrant the use of HOV lanes, it may be
a good solution in the future if congestion issues do arise on that segment of the corridor.
Figure 4-6: SR-57/SR-60 Confluence AM Westbound HOV Traffic Flow
Figure 4-5: SR-57/SR-60 Confluence AM Westbound Traffic Flow
SR-60
Vehicle volume per segment
SR-57
Vehicle volume per segment
SR-60
SR-57

SCAG TDM Strategic Plan: Potential Application of TDM Toolbox Strategies | Report
44
4.1.7 Challenges
The most pressing challenges on the SR-57/SR-60 Confluence relate to safety, as the current lane
configuration requires quick merges that frequently cause accidents. These challenges and
congestion relating to the difficult merges should be addressed through the construction planned.
In the meantime, construction itself, which will likely not conclude until 2028, will contribute to
even heavier congestion. Without a dense network of public transit and safe infrastructure for
active transportation, TDM strategies aimed at converting long trips to transit, bicycling or walking
may only be effective in specific cases.
4.2 Corridor Vision
The SR-57/SR-60 Confluence provides an unsafe and unpleasant experience for drivers.
Stakeholders have joined together to invest in improvements, but while construction takes place
TDM programs should be adopted to mitigate the impacts of the construction. This will help to
keep congestion at bay in the long term as folks who have changed their behavior during the
construction period will continue to use their new habits. There are several successful examples
of this nationally including Shift which was developed to help manage construction on the I5 north
of San Diego. The Shift campaign uses website and social media communication to keep
commuters up to date with construction-related closures and events that may increase
congestion. They also work closely with San Diego’s rideshare program to ensure information is
distributed to commuters in the region through their employers.
4.3 TDM Solutions
4.3.1 Short Term
Education and Marketing: Marketing Campaign
Stakeholders can use marketing surrounding heavy traffic congestion as a tool to encourage
multimodal trips or trips taken outside of the peak commute hours of 6am-9am and 3pm-7pm.
Marketing campaigns often include outreach to both commuters and employers through online
and in-person engagement and typically focus on a specific challenge or mode of travel, or target
specific populations.
The Project, which won’t conclude until 2028, exacerbates traffic along an already congested
corridor segment. Commuters do not want to sit in traffic and as they seek out information about
travel times may be more open to trying an alternative to avoid a situation they know is
congested.
As it has already been branded for the Project, the www.freetheway.org can be used more
actively to provide up to date, easy to download information on road work and current
congestion, alongside providing options for alternatives by showing how local and/or commute
trips could be made by Metrolink or Foothill Transit service, and promoting shared rides such as

SCAG TDM Strategic Plan: Potential Application of TDM Toolbox Strategies | Report
45
carpools and vanpools. Within the same brand, information about congestion and alternatives to
SOV travel should be promoted through social media and email communication, and through
direct engagement with employers and businesses along the corridors.
Table 4-2: SR-57/SR-60 Confluence Marketing Campaign
Responsible Parties Caltrans, Cities of Diamond Bar and Industry
Estimated Cost Low
Estimated Daily VMT Reduction 25,000
Estimated Daily GHG Reduction (grams) 7,779,000
Incentives and Facilitation: Alternative Work Schedules
Employers can take advantage of alternative work schedules by allowing or encouraging their
employees to work ‘flex-hours,’ meaning they arrive and depart work outside of peak hours, or
compressed work week schedules, meaning employees often work longer days but travel to work
fewer times per week. These work schedules directly remove commute trips from corridors during
peak hours.
Some employers are hesitant to provide these options, often seen as a benefit to employees, due
to the fact that it may mean there are more periods of time where there are no employees in the
office, or there will be more time when employee schedules do not overlap. Heavy construction
provides a good opportunity for employers to experiment with allowing employees to work
alternative schedules without having to commit to offering it long term.
The marketing campaign referenced above may be a good way to get information to employers
about their options and help guide them through a pilot project. Additionally, agencies such as Los
Angeles Metro are in a good position to provide support for employers who are interested in
putting together a compressed work week policy. They could take the opportunity to discuss the
construction project with employers and help to promote alternative work schedules as a possible
solution.
Table 4-3: SR-57/SR-60 Confluence Alternative Work Schedules
Responsible Parties Metro, Employers
Estimated Cost Low
Estimated Daily VMT Reduction 24,000
Estimated Daily GHG Reduction (grams) 7,273,000

SCAG TDM Strategic Plan: Potential Application of TDM Toolbox Strategies | Report
46
4.3.2 Medium Term
Incentives and Facilitation: Carshare Provision
Carshare programs provide vehicles either at specific site locations or in a public space for short-
term rental. Access to vehicles when they are needed allows drivers to reduce their dependence
on car ownership. In a workplace setting, access to carshare for midday travel reduces employees’
dependence on commuting to work by car.
As active transportation is not necessarily viable in the area surrounding the confluence, the cities
and employers should consider providing car-share for folks who work in the area but choose to
take alternative forms of transportation. Given the size and distance of most trips, lunchtime
travel is difficult without a vehicle. The ability to travel for lunch or an after-work errand without
having to have driven a car to work will encourage alternative commute travel while also
promoting use of local businesses.
Employers could provide their own fleet vehicles, but could also consider partnering with
companies such as Envoy or StratosFuel, which provide worksites with electric and hydrogen
vehicles and charging infrastructure that employees can make use of for shorter trips. Typically,
there is a cost associated for either employers, car renters, or both. As lunchtime travel boosts
economic activity at local businesses, municipalities may also consider subsidizing the cost of
employers’ adding cars or the cost of employees renting them.
Table 4-4: SR-57/SR-60 Confluence Carshare Provision
Responsible Parties Cities of Diamond Bar, Industry and Walnut
and local employers
Estimated Cost Medium
Estimated Daily VMT Reduction 24,000
Estimated Daily GHG Reduction (grams) 7,275,000
4.3.3 Long Term
Infrastructure and System Upgrades: Bicycle and Pedestrian Infrastructure
Creating spaces that are safe and attractive for pedestrians and cyclists encourages pedestrian
and bike travel over the use of a vehicle for short trips. These improvements include infrastructure
upgrades such as bicycle lane development and sidewalk widening, as well as measures such as
sidewalk abutting zoning requirements and installation of bicycle parking facilities.
As the City of Diamond Bar plans to improve its walkability and pedestrian infrastructure, both the
cities of Industry and Diamond Bar should prioritize pedestrian and cyclist conditions along Grand
Ave. along the two-mile stretch that crosses the SR-57/SR-60 Confluence. This segment of Grand
Ave. connects retail in Diamond Bar, the proposed new retail development just north of the

SCAG TDM Strategic Plan: Potential Application of TDM Toolbox Strategies | Report
47
confluence, and retail centers in the City of Walnut. There are currently some sidewalks across
that segment, but they do not span the entire crossing, and there is no shade or other pedestrian-
friendly elements.
The municipalities should ensure that the sidewalks continue across the entirety of Grand Avenue
between the Confluence and Brea Canyon Boulevard. They should plant street trees to provide
shade and include striping to demarcate space for bikes to travel in either a separated lane or
along with traffic on the corridor.
Table 4-5: SR-57/SR-60 Bicycle and Pedestrian Infrastructure
Responsible Parties City of Industry, City of Diamond Bar
Estimated Cost High
Estimated Daily VMT Reduction 175,000
Estimated Daily GHG Reduction (grams) 53,348,000
Infrastructure and System Upgrades: TDM Ordinance and Policy Development
TDM policy involves public agencies (typically at a regional or municipal level) placing
requirements on groups that wish to build or do business in their jurisdictions to implement TDM
strategies at their sites. Requirements are often included in development agreements, which fall
on developers, but may not be enforced after that developer is out of the project. Municipalities
must be mindful of this as they develop ordinances and policies and have a plan in place to ensure
that their requirements will be adhered to long term.
With over 300,000 square feet of leasable area, “The Grand,” the retail project that Majestic
Realty has proposed for the site just north of the Confluence has the potential to be a major
attractor and trip generator for the area and surrounding municipalities. Due to its location
directly above the confluence and the likelihood it will be accessed by Grand Avenue, this could
provide additional congestion in an already congested location
The City of Industry (where the Majestic Realty site is located) should include in any entitlement
process for the land the requirement for TDM strategies to be provided, and they should be
diligent in enforcing the requirements with any future owners in perpetuity. Based on projections
when they are developed, they may want to include in the agreement the requirement for service
provision such as shuttles from nearby office parks and the Metrolink station, or additional
pedestrian and bicycle infrastructure upgrades on the surrounding network to better connect the
project for bicycle and pedestrian travel.

SCAG TDM Strategic Plan: Potential Application of TDM Toolbox Strategies | Report
48
Table 4-6: SR-57/SR-60 Confluence TDM Ordinance and Policy Development
Responsible Parties City of Industry, Majestic Realty
Estimated Cost Cost will vary based on required measures.
Will be more expensive if shuttle requirement
is included
Estimated Daily VMT Reduction 175,000
Estimated Daily GHG Reduction (grams) 53,490,000

SCAG TDM Strategic Plan: Potential Application of TDM Toolbox Strategies | Report
49
Local corridor congestion
5.1 Existing Conditions
5.1.1 Overview
County Los Angeles
Municipalities Los Angeles, Santa Monica
Segment Extent East: Interstate 405
West: 20th Street
Segment Length 2.5 miles
Figure 5-1: Wilshire Blvd. Segment Overview
5 Wilshire Boulevard
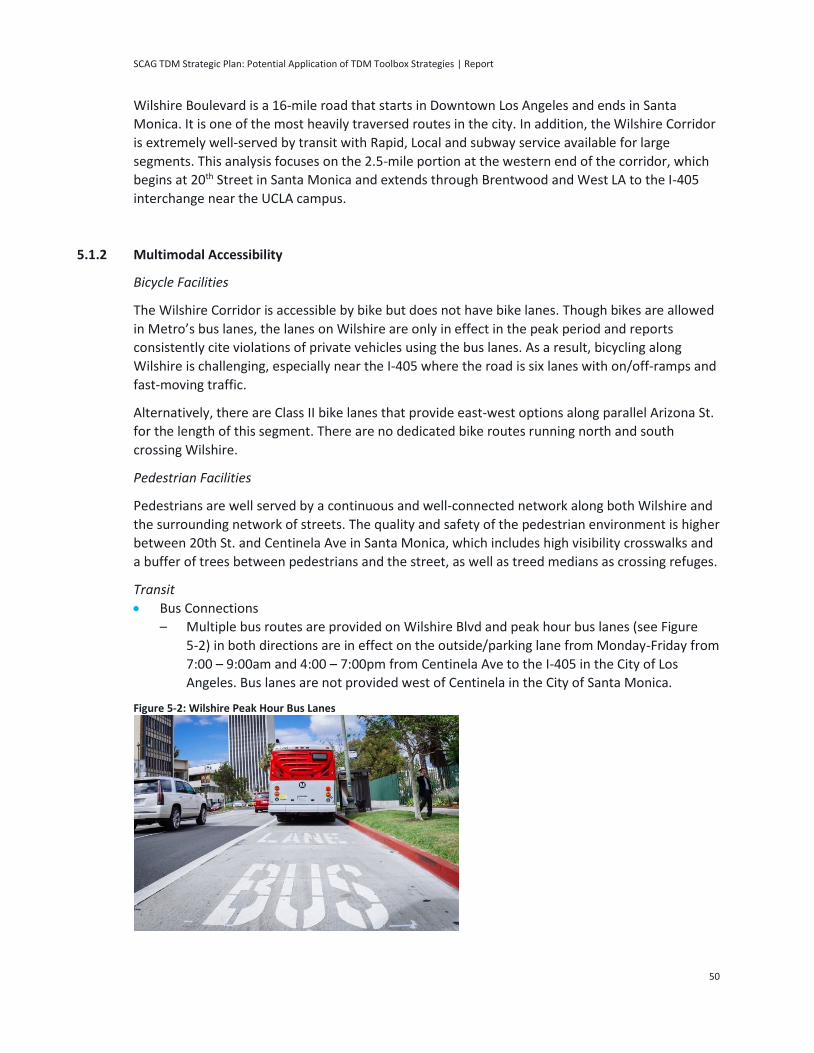
SCAG TDM Strategic Plan: Potential Application of TDM Toolbox Strategies | Report
50
Wilshire Boulevard is a 16-mile road that starts in Downtown Los Angeles and ends in Santa
Monica. It is one of the most heavily traversed routes in the city. In addition, the Wilshire Corridor
is extremely well-served by transit with Rapid, Local and subway service available for large
segments. This analysis focuses on the 2.5-mile portion at the western end of the corridor, which
begins at 20th Street in Santa Monica and extends through Brentwood and West LA to the I-405
interchange near the UCLA campus.
5.1.2 Multimodal Accessibility
Bicycle Facilities
The Wilshire Corridor is accessible by bike but does not have bike lanes. Though bikes are allowed
in Metro’s bus lanes, the lanes on Wilshire are only in effect in the peak period and reports
consistently cite violations of private vehicles using the bus lanes. As a result, bicycling along
Wilshire is challenging, especially near the I-405 where the road is six lanes with on/off-ramps and
fast-moving traffic.
Alternatively, there are Class II bike lanes that provide east-west options along parallel Arizona St.
for the length of this segment. There are no dedicated bike routes running north and south
crossing Wilshire.
Pedestrian Facilities
Pedestrians are well served by a continuous and well-connected network along both Wilshire and
the surrounding network of streets. The quality and safety of the pedestrian environment is higher
between 20th St. and Centinela Ave in Santa Monica, which includes high visibility crosswalks and
a buffer of trees between pedestrians and the street, as well as treed medians as crossing refuges.
Transit
• Bus Connections
– Multiple bus routes are provided on Wilshire Blvd and peak hour bus lanes (see Figure
5-2) in both directions are in effect on the outside/parking lane from Monday-Friday from
7:00 – 9:00am and 4:00 – 7:00pm from Centinela Ave to the I-405 in the City of Los
Angeles. Bus lanes are not provided west of Centinela in the City of Santa Monica.
Figure 5-2: Wilshire Peak Hour Bus Lanes

SCAG TDM Strategic Plan: Potential Application of TDM Toolbox Strategies | Report
51
– The Wilshire corridor is serviced by Metro Route 720, which is a Rapid service running the
full length of Wilshire Blvd from downtown Los Angeles to downtown Santa Monica with
less than 10-minute headways all week during peak hours. Route 720 is one of Metro’s
busiest routes with over 27,000 daily boardings23 and all-door boarding was introduced in
late-2018 to increase reliability and decrease journey time.
– Route 20 also operates on Wilshire, but only serves the segment east of I-405 during
evenings and late night (as Owl service).
– Big Blue Bus Route 2 provides service on Wilshire Boulevard from Westwood/UCLA
through West Los Angeles to the downtown Santa Monica Civic Center with stops at the
UCLA campus, VA West Los Angeles Medical Center, and Santa Monica/UCLA Medical
Center. The service runs every 12- to 15-minutes during weekdays and every 20- to 30-
minutes on weekends.
– Several other Big Blue Bus routes run parallel and perpendicular providing alternative
options to the UCLA/Westwood area and connections to the Expo Line.
• Rail Connections
– Metro’s Expo Line light rail provides service parallel to Wilshire from downtown Los
Angeles to downtown Santa Monica, with approximately 6 minutes service during peak
periods, but its stops are between 0.8-1.2 miles or a 18-26-minute walk from Wilshire,
which makes light rail a potentially feasible, but not ideal, option for travelers from the
east.
5.1.3 Key Attractors
Veterans Affairs West Los Angeles Medical Center
This 388-acre campus west of the I-405 serves the five counties of Los Angeles, Ventura, Kern,
Santa Barbara, and San Luis Obispo, including 1.4 million Veterans in the facility’s service area. It is
one of the largest medical center campuses in the VA system. In 2016, the VA developed a Master
Plan for the West LA campus24 which includes a shift from just medical care to the provision of
supportive housing for homeless Veterans. The final Metro Purple Line extension is planned to
terminate at the West LA Medical Center.
University of California Los Angeles
The University of California Los Angeles (UCLA) main campus is in the Westwood neighborhood of
West Los Angeles, just outside the corridor east of the I-405. The university has a student
population of almost 45,000 and approximately 69,000 full-time employees, making it roughly the
fourth largest employer in Los Angeles.
23 (Chiland, 2018)
24 (United States Department of Veteran's Affairs, 2016)

SCAG TDM Strategic Plan: Potential Application of TDM Toolbox Strategies | Report
52
In addition, the Ronald Reagan Medical center is located within the UCLA campus in Westwood
and provides a suite of specialty services to more than 380,000 patients. The hospital has over 500
rooms and 2,500 doctors and support staff.
UCLA Medical Center, Santa Monica
In addition to the UCLA’s main campus, UCLA operates a medical center in Santa Monica on
Wilshire and 16th St, which includes a 265-bed facility with approximately 3,300 employees,
volunteers and affiliated healthcare providers.
Downtown Santa Monica
Further west from the corridor is Downtown Santa Monica which is a key center for employment
in both commercial and retail, tourism, beach use and access, and entertainment.
5.1.4 Existing TDM Strategies
Transportation Management Associations
• GoSaMo (the Santa Monica TMO) serves residents, employees and visitors traveling to/from
the City of Santa Monica. The TMO is operated by the City and encourages the use of
alternative modes through marketing, education and outreach to local businesses.
• Commute 90067 (the Century City TMO) operates in the area immediately east of I-405 and
focuses on TDM services to employees via a ‘one-stop shop’ website. The TMO is operated by
the Century City Chamber of Commerce.
Education and Marketing
• Metro’s countywide Rideshare Program (Ridematch.com) provides trip planning support,
carpool/vanpool matching, and travel information for commuters who register in the system.
• Metro participates in national rideshare campaigns, also coordinated with other
transportation agencies in the SCAG region.
Incentives and Facilitation
• Metro offer a variety of subsidized transit pass programs for students (U-PASS) and employers
(E-PASS).
• Metro provides a guaranteed ride home program for employers registered in the Rideshare
Program.
• Metro provides a $400 subsidy for registered vanpools who commute to destinations in Los
Angeles County.
SCAG TDM Strategic Plan: Potential Application of TDM Toolbox Strategies | Report
53
5.1.5 Planned Improvements
Table 5-1: Wilshire Blvd. Planned Improvements
Project Description Timeline Responsible Party
Wilshire Purple Line Extension
The Purple Line Extension project is currently under construction and will extend the current subway from its present terminus at Wilshire/Western to Century City (at Westfield mall). A further extension (not fully funded), will extend the service to the VA hospital in Westwood.
The first extension is slated to be complete in 2025. The second phase is in preconstruction.
LA Metro
SCAG Mobility Go Zone & Pricing Feasibility Study
While not a planned improvement, SCAG recently released a study assessing the feasibility of using decongestion fees within a defined area or ‘Go Zone’ to reduce vehicle miles traveled and vehicle hours traveled. The study screened a number of potential locations and selected for more detailed analysis a potential Go Zone in the Westside of Los Angeles, including portions of Wilshire Blvd. The study found that such a Go Zone could reduce automobile trips by 19% (inbound peak period) and increase transit by 9% and walking and biking by 7%.25
N/A N/A
5.1.6 Traffic Conditions
Travel Delay Worst Near I-405
The main source of congestion along this segment of the Wilshire corridor is the I-405 interchange
which is one of the few north-south connections to the San Fernando Valley and to destinations
south of LAX and Inglewood. Figure 5-3 illustrates the highest areas of delay on the interchange
that affect Wilshire west of the I-405, including:
• AM, I-405 southbound ramp towards Wilshire westbound
• AM Wilshire eastbound onto I-405 southbound ramp
• PM Wilshire eastbound onto I-405 southbound ramp
25 (Southern California Association of Governments, 2019)
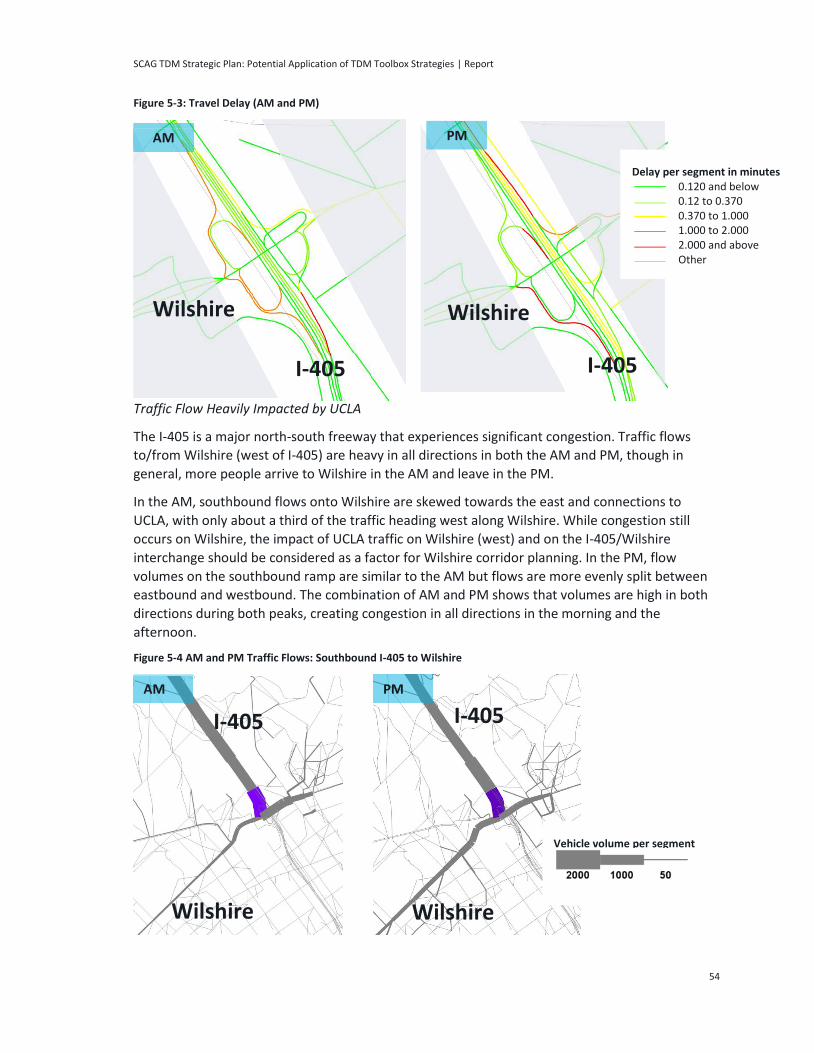
SCAG TDM Strategic Plan: Potential Application of TDM Toolbox Strategies | Report
54
Figure 5-3: Travel Delay (AM and PM)
Traffic Flow Heavily Impacted by UCLA
The I-405 is a major north-south freeway that experiences significant congestion. Traffic flows
to/from Wilshire (west of I-405) are heavy in all directions in both the AM and PM, though in
general, more people arrive to Wilshire in the AM and leave in the PM.
In the AM, southbound flows onto Wilshire are skewed towards the east and connections to
UCLA, with only about a third of the traffic heading west along Wilshire. While congestion still
occurs on Wilshire, the impact of UCLA traffic on Wilshire (west) and on the I-405/Wilshire
interchange should be considered as a factor for Wilshire corridor planning. In the PM, flow
volumes on the southbound ramp are similar to the AM but flows are more evenly split between
eastbound and westbound. The combination of AM and PM shows that volumes are high in both
directions during both peaks, creating congestion in all directions in the morning and the
afternoon.
Figure 5-4 AM and PM Traffic Flows: Southbound I-405 to Wilshire
AM PM
I-405
Wilshire
AM PM
I-405
Wilshire
Delay per segment in minutes 0.120 and below 0.12 to 0.370 0.370 to 1.000 1.000 to 2.000 2.000 and above Other
Wilshire
I-405
Wilshire
I-405
Vehicle volume per segment

SCAG TDM Strategic Plan: Potential Application of TDM Toolbox Strategies | Report
55
5.1.7 Challenges
The key challenges along the Wilshire corridor focus around managing I-405 interchange delays
and congestion that continues on a slower-moving Wilshire with traffic signals, pedestrians and
bus services. Congestion is often so bad that drivers flout the bus lane restrictions, thereby adding
further delays to transit vehicles and reducing their travel time competitiveness and convenience.
With high demand for job access, leisure and residential egress/access, trip generation is much
higher than capacity and significant efforts are needed to transfer trips to higher-capacity vehicle
modes and active modes.
5.2 Corridor Vision
The TDM vision for the Wilshire corridor is capitalizing on the transit infrastructure in place,
including the Wilshire bus lanes and the nearby Expo Line light rail, as well as focusing on
employers as a way to reach a large number of workers who contribute to peak hour congestion
with education, incentives and services.
5.3 TDM Solutions
5.3.1 Short Term
Incentives and Facilitation: Carpool Coordination and Private Shared Transportation/Shuttles
The City of Santa Monica recently supported a partnership with Waze Carpool to promote and
educate employees about dynamic carpool options.26 A key enabler of such systems are a robust
pool of drivers and a comparable amount of demand from riders. Employers along Wilshire
outside of the City of Santa Monica could capitalize on the recent success by initiating their own
promotional programs for Waze Carpool and expand the pool of drivers and/or potential riders.
Additionally, Metro, the City of LA, the City of Santa Monica, and UCLA could work together to
identify potential on-demand shuttle services that could provide faster and more direct service
from the San Fernando Valley and South LA/Long Beach to help reduce vehicle trips and VMT on
the I-405 and along Wilshire. While these services have struggled to launch in the area due to cost
issues, they are similar to dynamic carpooling in that they need a large pool of potential riders in
order to make a business case for service operation and, therefore, pulling from a wider area and
multiple stakeholders may help realize the potential of this option.
Table 5-2: Wilshire Blvd Carpool Coordination and Private Shuttles
Responsible Parties City of Santa Monica, City of LA, LA Metro, UCLA
Estimated Cost Medium
Estimated Daily VMT Reduction 60,000
Estimated Daily GHG Reduction (grams) 18,312,000
26 (Thomas-Patel, 2018)

SCAG TDM Strategic Plan: Potential Application of TDM Toolbox Strategies | Report
56
Infrastructure and System Upgrades: Dockless/Micromobility/New Mobility Programs
The walking distance from Metro’s Expo Line to Wilshire is a minimum of about a mile, which
would take the average person over 15 minutes to walk. This makes it unlikely for most people to
find the service convenient as an option if they were travelling from the east. Creating an easy and
convenient first mile, last mile connection between the Expo Line and Wilshire would make transit
a better option for more people.
While the Brentwood and Sawtelle neighborhoods fall within a void of local bikeshare services
(between Breeze in Santa Monica and UCLA system), there are private services including Spin,
Bird, Lime, JUMP, Lyft and Wheels that provide many vehicles along the Wilshire corridor. Figure
5-5 illustrates availability on a typical weekday afternoon. Promoting these services and
potentially developing incentives in partnership with one or more providers as a means to more
conveniently access the Expo Line may make using the light rail service more feasible and
encourage commuters to leave their cars at home.
Figure 5-5: Scooter and E-Bike Availability: April 12, 2019 at 3pm
Table 5-3: Wilshire Blvd. Dockless/Micromobility/New Mobility Programs
Responsible Parties City of LA, LA Metro
Estimated Cost Low
Estimated Daily VMT Reduction 11,000
Estimated Daily GHG Reduction (grams) 3,291,000

SCAG TDM Strategic Plan: Potential Application of TDM Toolbox Strategies | Report
57
5.3.2 Medium Term
Incentives and Facilitation: Development of
TMA/TMOs
TMOs are currently active in Santa Monica
(GoSaMo TMO) and Century City (Commute
90067) but local commuter services are not
being provided to employers along the rest
of the Wilshire Corridor. A new West LA
TMO which covered the gaps in TMO service
provision could be an effective way to more
actively engage with employers on and
around Wilshire and promote Metro and
other incentives, multi-modal options, and
opportunities like vanpooling and
carpooling. Coordinating or partnering the
TMO with the VA campus in Brentwood,
UCLA, and the City of Beverly Hills could expand the effectiveness of services along the wider
Wilshire corridor, providing service to employers north of the I-10 freeway.
Table 5-4: Wilshire Blvd. Development of TMAs/TMOs
Responsible Parties City of Los Angeles, City of Beverly Hills, UCLA,
Veteran’s Affairs, LA Metro
Estimated Cost Medium
Estimated Daily VMT Reduction 245,000
Estimated Daily GHG Reduction (grams) 74,777,000
Figure 5-6: GoSaMo TMO in Santa Monica promotes Metro Tap cards and transit programs to employers.

SCAG TDM Strategic Plan: Potential Application of TDM Toolbox Strategies | Report
58
Incentives and Facilitation: Telecommuting and Remote Services & Alternative Work Schedules
From the experience of GoSaMo TMO, teleworking is often available as an option for employees in
the Wilshire corridor, along with flexible working hours. Teleworking can be a highly effective way
to reduce peak hour congestion, reduce VMT, and improve employee health and wellness.
Options for how teleworking and flex working could be implemented include:
• Workplace assessments of necessary technical infrastructure to support teleworking, along
with recommendations, incentives or commercial partners who could provide the necessary
infrastructure and services
• Management training for employers to better understand and be able to implement different
management styles to effectively enable teleworking
• Research gathering or primary research studies by Metro or the City of Los Angeles that
demonstrate the commercial benefit of teleworking and flex working for successful
businesses
Table 5-5: Wilshire Blvd. Telecommuting and Alternative Work Schedules
Responsible Parties City of Los Angeles, City of Santa Monica, Veteran’s
Affairs, LA Metro
Estimated Cost Medium
Estimated Daily VMT Reduction 60,000
Estimated Daily GHG Reduction (grams) 18,324,000
5.3.3 Long Term
Infrastructure and System Upgrades: Transit Improvements
LA Metro and the City of Los Angeles
implemented a long segment of peak-hour
bus lanes between the I-405 and Centinela
Ave in 2015. In order to increase the
efficiency, reliability and customer
experience of service such as Rapid 720 that
serve the corridor, these bus lanes should be
dedicated 24/7 to bus service.
Such a move is likely to take time to gain the
support of local businesses and other
stakeholders, but several opportunities for
short-term gains include: Figure 5-7: Cars using the dedicated peak hours bus lanes on Wilshire (source: StreetsBlog LA)

SCAG TDM Strategic Plan: Potential Application of TDM Toolbox Strategies | Report
59
• Stronger enforcement of bus lane violations during the existing peak hour designations.
StreetsBlogLA reported in Nov 201827 the poor state of enforcement of the lanes and the
constant and blatant violations by drivers along the corridor. This could include a crowd-
sourced marketing campaign to encourage transit riders to take pictures of violators and
upload them to the authorities via a simple website.
• Bolder paint to delineate the bus lanes, either painting the entire lane a different color,
painting in color and thickening the delineation line, or other more high-visibility
interventions to make is easy to see the bus lane.
Table 5-6: Wilshire Blvd. Transit Improvements
Responsible Parties City of Los Angeles, City of Beverly Hills, UCLA,
Veteran’s Affairs, LA Metro
Estimated Cost Medium
Estimated Daily VMT Reduction 64,000
Estimated Daily GHG Reduction (grams) 19,481,000
27 (Newton, 2018)

SCAG TDM Strategic Plan: Potential Application of TDM Toolbox Strategies | Report
60
Commute travel to office parks
6.1 Existing Conditions
6.1.1 Overview
County Orange
Municipalities Costa Mesa, Irvine
Segment Extent South: I-405 Junction
North: I-5 Junction
Segment Length 15 miles
Figure 6-1: SR-55 Segment Overview
6 SR-55

SCAG TDM Strategic Plan: Potential Application of TDM Toolbox Strategies | Report
61
The State Route 55 (SR-55) corridor in Orange County spans roughly 17 miles, running north-south
from the Interstate 5 intersection to the Interstate 405 in Newport Beach. The freeway provides a
link to several other major freeways, including the 91 Freeway and Interstate 5. The route has 8 to
10 travel lanes and 2 HOV lanes total. It narrows as it approaches the I-405 to 4-5 through lanes.
The following analysis focuses on the approximately five-mile segment of the SR-55 between the I-
405 and the I-5 junctions. The area is mostly suburban and characterized by several large
corporate business parks. Major destinations along this route include the John Wayne Airport and
the South Coast Plaza shopping center. Other notable destinations such as the Disneyland Theme
Park, Angels Stadium, and Honda Center are only a few miles from the corridor.
6.1.2 Multimodal Accessibility
Bicycle Facilities
There are no bicycle facilities along the SR-55, and the area surrounding this segment is not well
served for bicyclists. The surrounding bicycle network includes:
• Red Hill Ave parallels this segment to the south and has Class II Bikeways for part of the
segment. Further south, Von Karman Ave has a continuous Class II Bikeway. There are no
routes running north/south connecting both sides of the segment.
• Near the South Coast Plaza, there are two Class II bike routes running north-south (Bear St
from I-405 to Sunflower Ave) and east-west (South Coast Drive from Hyland Ave to Bear St.).
• There are additional Class II bike facilities in the surrounding area, including Edinger Ave.,
Main St., and Sunflower Ave.
Pedestrian
There are no pedestrian facilities along the SR-55. Pedestrian connections at key attractors like the
mall and business park have sidewalks and signalized intersections. They are somewhat impeded
by large parking lots, particularly at South Coast Plaza.
Transit
• Transportation Hubs
– The Santa Ana Regional Transit Center (SARTC) is located at 1000 East Santa Ana
Boulevard, approximately six miles north of the South Coast Plaza and eight miles from
John Wayne Airport. The “Depot” is served by Amtrak Pacific Surfliner, Metrolink
Commuter Rail, and OCTA service as well as other intercity and instate bus services.
– Tustin Metrolink Station is located on 2975 Edinger Ave, Tustin, CA near the southern end
of the corridor segment.
• Bus Connections
– OCTA operates a network of buses on routes in and around this segment:
• Route 71 (Yorba Linda to Newport Beach) is a local service that runs parallel to the
SR-55 along Tustin Avenue in the north segment and Red Hill and Newport Avenues
in the north Segment.
• Route 463 (Santa Ana Regional Transportation Center to Hutton Centre via Grand)
connects the Metrolink Station to the South Coast Plaza with weekday service. The

SCAG TDM Strategic Plan: Potential Application of TDM Toolbox Strategies | Report
62
bus runs along the SR 55 in several places with key stops at Hutton Centre at Main
Street & MacArthur and the south Coast Plaza/Metro Pointe areas in Costa Mesa.
• Route 213 (Brea to Irvine Express, via SR 55) connects the Brea Park and Ride,
Fullerton Metrolink Station, Irvine Business Complex, and UC Irvine.
• Route 794 (Riverside/Corona to South Coast Metro Express via 91 Freeway and SR
55) is an inter-county express route that connects La Sierra Metrolink Station in
Corona (Riverside County) to the South Coast Plaza/Metro Pointe areas in Costa
Mesa.
• A number of routes intersect the SR-55 such as:
– Route 60 on 17th in Santa Ana/Tustin
– Route 64 on 1st in Tustin
– Route 66 on McFadden in Tustin
– Route 70 on Edinger in Santa Ana/Tustin
– Route 72 on Warner Avenue in Santa Ana/Tustin
– Route 76 on MacArthur in Santa Ana/Irvine
– Route 86 on Main Street in Santa Ana/Irvine
• The iShuttle 400A and 405F are commuter shuttles operating between Metrolink
Tustin Station and the Irvine Business Complex and Irvine Business Complex West
respectively.
• Rail Connections
– Metrolink provides service on the Inland Empire and the Orange County line through
nearby SARTC and Tustin Stations to the north and south of the corridor segment.
High Occupancy Vehicles and Toll Road Facilities
One carpool lane exists in each direction along the SR-55 segment.
6.1.3 Key Attractors
John Wayne Airport
John Wayne Airport is a commercial passenger and cargo airport in Orange County located
between Irvine, Costa Mesa and Newport Beach. The airport terminal and parking are accessible
directly from the SR-55 just before the I-405 junction. More than 10 million passengers passed
through the airport annually.28 The airport supports approximately 19,000 jobs.
South Coast Plaza
The South Coast Plaza is a major retail destination in Costa Mesa west of the SR 55 and north of
the I-405. More than 250 vendors are located there drawing approximately 24 million visitors to
the site each year. Although difficult to estimate the total number of employees on site, the mall
falls in a high job density area, with roughly 22,000 or more jobs per square mile.29 There are
several surrounding transit stops with bus services connecting to transit hubs in Irvine and Santa
28 (Air Carrier Activity Information System , 2017)
29 (United States Census Bureau, 2015)
SCAG TDM Strategic Plan: Potential Application of TDM Toolbox Strategies | Report
63
Ana as well as California State University, Fullerton campus. Pedestrian connections between
these transit hubs and the mall have sidewalks but are somewhat impeded by the mall’s extensive
surrounding parking lots.
Metro Pointe Business Center
1.1 The Metro Pointe Business Park in Costa Mesa is located near the South Coast Plaza northwest of
the SR-55 directly adjacent to the South Coast Plaza. The business park is characterized by several
large retailers and corporate offices. The South Coast Plaza and business center are located in a
job rich area, with approximately 22,000-32,000 jobs per square mile.30
6.1.4 Existing TDM Strategies
Education and Marketing
• Transportation Management Associations/Organizations
– There are no TMAs or TMOs operating directly along the SR-55 corridor; however, there
are other local TMAs and Universities whose trip reduction efforts likely affect travelers
who regularly use this route for local trips.
– Spectrumotion serves residents, employees, students, employers and property managers
in the Spectrum Irvine business park vicinity, near the junction of the I-405 and 5.
– Anaheim Transportation Network (ATN) is another Orange County TMA operating strictly
in the Anaheim and Disneyland area.
• The University of California, Irvine operates a robust TDM program for students, faculty and
staff. The University’s approach involves parking enforcement, incentives for alternative
mode use, and supportive land use policy. As a result, UCI has a combined student/faculty
SOV mode share of 25%. More than 30% of people walk, 10% bike, and 6% ride transit.
• OCTA operates a Rideshare Program coordinated with Los Angeles and Ventura Counties, and
also participates in several national campaigns coordinated with other transportation
agencies in the SCAG region including Rideshare Week and May’s Bike to Work Week.
Incentives and Facilitation
• Employees and students in Orange County have access to OCTA-sponsored transit incentives
through participating employers and universities. Less than 20 employers participate in the
program.
– OCTA provides a reimbursement based guaranteed ride home program for employers
registered in the Rideshare Program.
– OCTA provides a $400 subsidy for registered vanpools.
– OCTA offers special discounted transit passes for college students. The University Pass
program at UCI provides unlimited discount rides for students.31 Students enrolled in the
Santa Ana College Continuing Education Program qualify for free OC Bus Rides. 32
30 (United States Census Bureau, 2015)
31 (Unviersity of California at Irvine, n.d.)
32 (Santa Ana College, n.d.)

SCAG TDM Strategic Plan: Potential Application of TDM Toolbox Strategies | Report
64
• The City of Santa Ana operates a “Bike Huts” program, restricted access to secure bike parking
through an annual membership, at four locations near the Santa Ana Transportation Center,
Civic Center, and elsewhere.
Parking Strategies
• Parking at South Coast Plaza is plentiful and free. The mall also offers a paid valet service.
• John Wayne Airport offers several paid parking options. Curbside valet parking is available
hourly for up to $30 per day. Terminal parking is also available hourly for up to $20 per day.33
• Many of the large corporate business parks also offer free parking to employees.
TDM Supportive Policies
• The South Coast Air Quality Management District’s (South Coast AQMD) Rule 2202 requires
employers with 250 or more employees within the South Coast Air Basin to mitigate the
emissions contributed by their employees’ commute trips through one of three options,
including providing worksite transportation programs to encourage non-SOV travel and trip
reduction
• The City of Irvine’s Master Plan Growth Management Plan specifies TDM objectives to
encourage use of alternative modes within the City limits including building HOV lanes on
local freeways (Objective 4) and requiring development to provide convenient and direct
pedestrian access to surrounding land uses and transit stops.
• The City of Santa Ana TDM Ordinance (Article XVIII of Chapter 36 of the Municipal Code)
requires that project applicants submit TDM plans for projects that results in more than 250
employees at a worksite.
• Tustin’s TDM Ordinance (Chapter 9 of the Municipal Code) requires that non-residential
developments or projects that result in more than 100 employees on site create and
implement TDM plans using an array of specified strategies. The Tustin Legacy Specific Plan
builds on this and allows the City to require additional mitigations that may or may not be
included in the development’s TDM Plan.
• OCTA has a robust active transportation plan that includes the Regional Bikeways Strategy,
the Pedestrian Action Plan, and OC Active, which is presently underway. The OCTA 2009
Commuter Bikeways Strategic Plan recognizes the potential to make commuting by bicycle a
viable option for more residents in Orange County.
• The OCTA Transit Vision Report (2018) presents the agency’s 20-year plan to improve high
quality transit service in the area. The areas of Costa Mesa and Irvine adjacent to the SR-55
are highlighted as areas of high transit propensity and recognized as a key transit opportunity
corridor for freeway bus rapid transit.
33 (John Wayne Airport, n.d.)

SCAG TDM Strategic Plan: Potential Application of TDM Toolbox Strategies | Report
65
6.1.5 Planned Improvements
Table 6-1: SR-55 Planned Improvements
Project Name Project Description Timeline Project Lead
SR-55 Improvement Project (I-5 to SR-91)
The $230 million SR- 55 Improvement Project will add new lanes and modify ramps at two locations along the 7.5-mile stretch of SR-55 between the I-5 and the SR-91. Environmental review for this project is currently underway.
Environmental Phase Completed by 2020
Caltrans
SR-55 Improvement Project (I-405 to I-5)
This project will add lanes to a four-mile stretch of the freeway and will cost approximately $410 million. It is currently in the design phase and will be completed by 2024.
Design Completed by 2020; Construction Completed 2024
Caltrans
Bike and Transit Projects Funded by Senate Bill 1 Solutions for Congested Corridors Program
OCTA secured funding for several bicycle and transit projects through the 2018 SB 1 Grant Cycle. These include several that are pertinent to the SR-55 corridor: Warner Avenue Class II Bikeway (Santa Ana); Red Hill Avenue Class III Bikeway (Tustin), and the Bravo! Main Street Rapid Bus Expansion.
2023 Caltrans, OCTA
SR-55 Freeway BRT (Santa Ana Regional Transportation Center to Hoag Hospital Newport Beach) Network Study
The BRT will run the length of the SR-55 corridor and connect South Coast Plaza, John Wayne Airport, and Santa Ana Regional Transportation Center.
Study to take place 2018-2020, Implementation 2033
OCTA
Bristol St Transit Corridor Study
Study to analyze and develop options to improve service on Bristol Street from 17th Street in Santa Ana to the South Coast Metro area in Costa Mesa, and to evaluate connections to John Wayne Airport.
To be completed Spring 2020
OCTA

SCAG TDM Strategic Plan: Potential Application of TDM Toolbox Strategies | Report
66
6.1.6 Traffic Conditions
Delay Seen Closest to I-405
Though, as depicted in the SCAG Model, delay along the corridor is relatively light (along most
links within the corridor delay is less than two-thirds of a minute over free-flow), heavier delay is
seen during the PM peak period just south of I-405 heading north. There is also more significant
delay seen along on-ramps further north on SR-55 that are adjacent to the employment centers
mentioned above.
Figure 6-2. Travel Delay (PM Peak)
6.1.7 Challenges
The SR-55 corridor is already one of the most congested in Southern California. Congestion is
expected to increase with population growth and rising rates of car ownership. Meanwhile, the
corridor struggles with poor access to high quality transit alternatives. OCTA cut transit service
during the economic downturn but has not returned to previous levels of service. The agency has
plans to expand access to high quality transit throughout the county, including along the SR-55
corridor.
Delay per segment in minutes 0.072 and below 0.072 to 0.250 0.250 to 0.590 0.590 to 1.200 1.200 and above Other
SR-55
I-405
I-5
PM

SCAG TDM Strategic Plan: Potential Application of TDM Toolbox Strategies | Report
67
6.2 Corridor Vision
Given the limited transit options and the variation in multimodal planning along the corridor, the
first steps in developing a long term TDM strategy should focus on education and increasing
alternatives. To do this, we recommend leveraging the success of local TMAs/TMOs, on-demand
mobility pilots, and the active transportation network to provide people with the most feasible
alternatives.
6.3 TDM Solutions
6.3.1 Short Term
Incentives and Facilitation: Development of Employee Commute Program at South Coast Plaza
Employee Commute Programs combine a suite of strategies to encourage people to use
alternative modes for their commute to work. Various complimentary strategies may be included
such as carpool and vanpool coordination, financial incentives for non-SOV travel, and marketing
and education campaigns. Typically, they are implemented by a single employer, consortium of
employers, or TMA/TMO.
Two of the large retailers at South Coast Plaza (Macy’s and Nordstrom’s) participate in the South
Coast AQMD ECRP program. The South Coast Plaza could assist these employees and others by
developing a commute program that includes all the businesses at the site.
Commuter benefits provisions should focus on employees at the South Coast Plaza. Property
management should consider using financial incentives to encourage employees to use alternative
modes. This may also result in extra parking space for use by mall visitors.
Table 6-2: SR-55 Development of Employee Commute Program at South Coast Plaza
Responsible Parties South Coast Plaza
Estimated Cost Low
Estimated Daily VMT Reduction 59,000
Estimated Daily GHG Reduction (grams) 15,629,000
Incentives and Facilitation: TMAs/TMO Development in Costa Mesa
TMAs/TMOs are organizations that promote, advocate and coordinate mobility services to assist
people in finding alternative to driving alone. Typically, TMAs/TMOs are created by cities or
consortia of businesses to facilitate employee commute programs, assist with regulation
compliance (such as Rule 2202), and advocate for improvements to transportation improvements.
There are presently two TMAs operating in proximity to the SR-55 corridor, Spectrumotion and
the Anaheim Transportation Network. However, there are no organizations currently providing
services to employees of the South Coast Plaza and the Metro Pointe Business Center, which both
lie within the most job-dense area of Costa Mesa. Given that these two major attractors are

SCAG TDM Strategic Plan: Potential Application of TDM Toolbox Strategies | Report
68
located next to one another, there is potential to form a new TMA or TMO that provides services
for these and surrounding employment centers.
The City of Costa Mesa and OCTA could facilitate the creation of a TMA/TMO to assist local
businesses with Rule 2202 compliance and employee trip reduction. It may also be possible to
include the John Wayne Airport, encompassing all three major attractors in the City of Costa
Mesa. There are a few different funding models for the City to consider. The City could choose to
fund the organization completely, which would require an annual budget allocation, and therefore
retain control over where its resources are focused. Employers may be more willing to participate
in an organization that provides free services. However, another model would be to help develop
a membership-based organization that helps specific employers implement TDM programs and
comply with South Coast AQMD’s Rule 2202 regulations.
Table 6-3: SR-55 Development of TMAs/TMOs in Costa Mesa
Responsible Parties City of Costa Mesa, OCTA, South Coast Plaza,
John Wayne Airport, Local Businesses
Estimated Cost Medium
Estimated Daily VMT Reduction 105,000
Estimated Daily GHG Reduction (grams) 27,941,000
6.3.2 Medium Term
Incentives and Facilitation: Dockless/Micromobility/Shared Mobility
Cities in the SCAG region have begun experimenting with new ways to improve first/last mile
connections with on-demand services. OCTA has launched the OC Flex On-Demand Microtransit
Pilot in two zones: Huntington Beach/Westminster and Aliso Viejo/Laguna Beach/Mission Viejo.
The pilot allows users to hail a shuttle on-demand through the use of smart phone application. In
Santa Monica and Monrovia, local government is partnering with private service provider Lyft to
offer subsidized rides to/from transportation hubs.
Shared mobility can help people with their first/last mile connections, which would benefit
commuters and visitors trying to connect to the Metro Pointe and South Coast Plaza area. A
Shared Mobility Pilot near the SR-55 corridor would improve connections to the Tustin and Santa
Ana Stations.
OCTA should consider partnering with the South Coast Plaza, John Wayne Airport and the Metro
Pointe Business Center to develop a shared mobility pilot serving these areas and the SARTC and
Tustin Metrolink Stations. The agency could partner with a TNC provider to provide reduce fares
for shared rides. The service area and amount of subsidy provided should be based on the average
trip fare to/from these destinations.
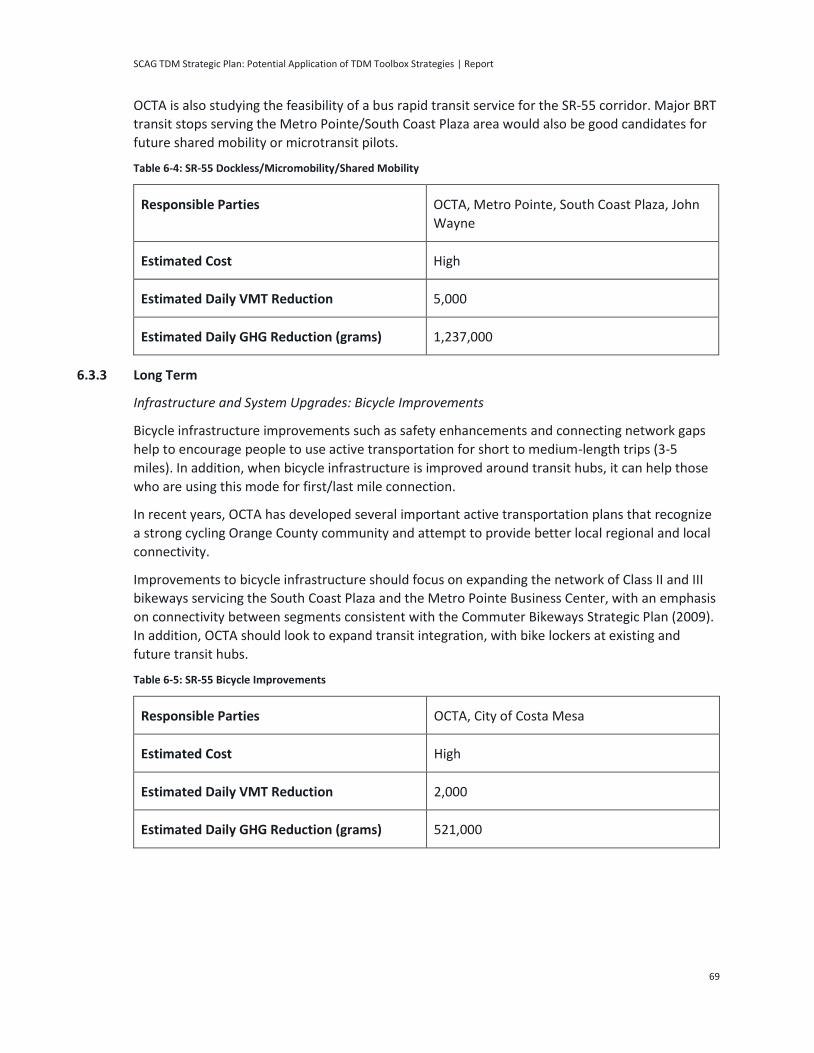
SCAG TDM Strategic Plan: Potential Application of TDM Toolbox Strategies | Report
69
OCTA is also studying the feasibility of a bus rapid transit service for the SR-55 corridor. Major BRT
transit stops serving the Metro Pointe/South Coast Plaza area would also be good candidates for
future shared mobility or microtransit pilots.
Table 6-4: SR-55 Dockless/Micromobility/Shared Mobility
Responsible Parties OCTA, Metro Pointe, South Coast Plaza, John
Wayne
Estimated Cost High
Estimated Daily VMT Reduction 5,000
Estimated Daily GHG Reduction (grams) 1,237,000
6.3.3 Long Term
Infrastructure and System Upgrades: Bicycle Improvements
Bicycle infrastructure improvements such as safety enhancements and connecting network gaps
help to encourage people to use active transportation for short to medium-length trips (3-5
miles). In addition, when bicycle infrastructure is improved around transit hubs, it can help those
who are using this mode for first/last mile connection.
In recent years, OCTA has developed several important active transportation plans that recognize
a strong cycling Orange County community and attempt to provide better local regional and local
connectivity.
Improvements to bicycle infrastructure should focus on expanding the network of Class II and III
bikeways servicing the South Coast Plaza and the Metro Pointe Business Center, with an emphasis
on connectivity between segments consistent with the Commuter Bikeways Strategic Plan (2009).
In addition, OCTA should look to expand transit integration, with bike lockers at existing and
future transit hubs.
Table 6-5: SR-55 Bicycle Improvements
Responsible Parties OCTA, City of Costa Mesa
Estimated Cost High
Estimated Daily VMT Reduction 2,000
Estimated Daily GHG Reduction (grams) 521,000

SCAG TDM Strategic Plan: Potential Application of TDM Toolbox Strategies | Report
70
TDM Supportive Policy: Transit Oriented Development and Non-SOV Supportive Land Use
Policies such as Transit Oriented Development (TOD) support non-SOV trips by integrating
commercial and residential land-uses with transportation planning.
Cities like Placentia, Tustin, and Irvine have developed TOD and TDM policies that align residential
and commercial development along major transit hubs or corridors. The SR-55 corridor is
characterized by relatively high residential and job density in the City Costa Mesa. With the roll-
out of high-quality transit alternatives along the SR-55 (Freeway BRT) there is additional
opportunity for a TOD oriented district.
The City of Costa Mesa could begin with a specific plan in a commercial district, such as the jobs-
rich areas near Metro Pointe and the South Coast Plaza to encourage street design, transportation
improvements, and TDM mitigations that support multimodal transportation.
Table 6-6: SR-55: Transit Oriented Development and Non-SOV Supportive Land Use
Responsible Parties City of Costa Mesa
Estimated Cost High
Estimated Daily VMT Reduction 2,000
Estimated GHG Reduction (grams) 481,000

SCAG TDM Strategic Plan: Potential Application of TDM Toolbox Strategies | Report
71
Long distance, cross-county commute travel
7.1 Existing Conditions
7.1.1 Overview
County Orange, Riverside
Municipalities Anaheim, Corona, Riverside
Segment Extent East: SR-60/215 Interchange
West: SR-55
Segment Length 29 Miles
Figure 7-1: SR-91 Segment Overview
7 SR-91

SCAG TDM Strategic Plan: Potential Application of TDM Toolbox Strategies | Report
72
The examined segment of the State Route 91 Corridor (SR-91) extends between the SR-55 and the
SR-60/215 Interchange in Riverside. The western edge of the corridor is served by the 91 Express
Lanes. The western section of SR-91 in Orange County has had express lanes since 2002, and
recently the eastern section in Riverside County added express lanes that extend to I-15 in Corona.
The addition of those express lanes came with a road widening, and now the majority of the
corridor is five general purpose lanes with two express lanes in each direction. East of I-15, SR-91
is four general travel lanes and one HOV lane in each direction.
7.1.2 Multimodal Accessibility
Bicycle Facilities
Though SR-91 itself has no bicycle access, cyclists could travel the length of the corridor along a
series of Class I and II bike routes which would run over 30 miles. In particular, the corridor
parallels the Santa Ana River Trail through Orange County and the Victoria Avenue Trail in
Riverside.
Pedestrian Facilities
There is no pedestrian access on the corridor, and the corridor boundaries do not include many
walkable areas.
Transit
• Express Service
– Express service parallels the SR-91 segment, but service is infrequent; each of the
services below operate with 30-minute headways or greater.
• OCTA operates the 794 Express bus along SR-91 which travels from La Sierra
Metrolink Station in Riverside to the employment centers in the South Coast
Plaza/Metro Pointe areas in Costa Mesa.
• Metrolink operates the Inland Empire-Orange County Line and 91-Perris Valley Line.
• Riverside Transit Agency (RTA) operates the 200 and 205 Express buses along SR-91
and SR-55 which travel from Riverside County to Orange county.
• Amtrak operates the 4967 Bus between Riverside and Fullerton
• Local Service
– The Corona Cruiser Red Route operates along the Eastern part of the Segment.
– Anaheim Resort Transportation (ART) provides various routes in the Anaheim Resort area
and key destinations throughout Orange County.
– Riverside Transit Agency (RTA) operates the 1 and 200 Routes that connect downtown
Riverside with Corona, and a variety of other routes that travel along smaller sections of
the SR-91 Corridor segment. RTA offers free service to students at many participating
local universities
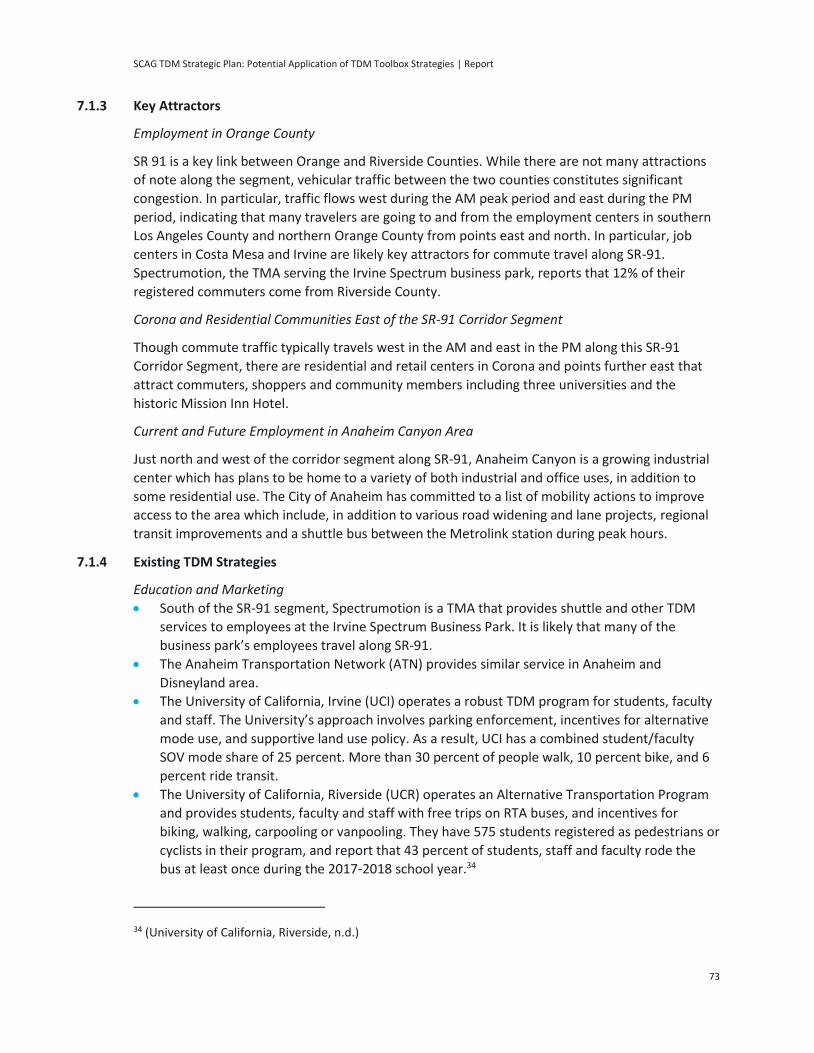
SCAG TDM Strategic Plan: Potential Application of TDM Toolbox Strategies | Report
73
7.1.3 Key Attractors
Employment in Orange County
SR 91 is a key link between Orange and Riverside Counties. While there are not many attractions
of note along the segment, vehicular traffic between the two counties constitutes significant
congestion. In particular, traffic flows west during the AM peak period and east during the PM
period, indicating that many travelers are going to and from the employment centers in southern
Los Angeles County and northern Orange County from points east and north. In particular, job
centers in Costa Mesa and Irvine are likely key attractors for commute travel along SR-91.
Spectrumotion, the TMA serving the Irvine Spectrum business park, reports that 12% of their
registered commuters come from Riverside County.
Corona and Residential Communities East of the SR-91 Corridor Segment
Though commute traffic typically travels west in the AM and east in the PM along this SR-91
Corridor Segment, there are residential and retail centers in Corona and points further east that
attract commuters, shoppers and community members including three universities and the
historic Mission Inn Hotel.
Current and Future Employment in Anaheim Canyon Area
Just north and west of the corridor segment along SR-91, Anaheim Canyon is a growing industrial
center which has plans to be home to a variety of both industrial and office uses, in addition to
some residential use. The City of Anaheim has committed to a list of mobility actions to improve
access to the area which include, in addition to various road widening and lane projects, regional
transit improvements and a shuttle bus between the Metrolink station during peak hours.
7.1.4 Existing TDM Strategies
Education and Marketing
• South of the SR-91 segment, Spectrumotion is a TMA that provides shuttle and other TDM
services to employees at the Irvine Spectrum Business Park. It is likely that many of the
business park’s employees travel along SR-91.
• The Anaheim Transportation Network (ATN) provides similar service in Anaheim and
Disneyland area.
• The University of California, Irvine (UCI) operates a robust TDM program for students, faculty
and staff. The University’s approach involves parking enforcement, incentives for alternative
mode use, and supportive land use policy. As a result, UCI has a combined student/faculty
SOV mode share of 25 percent. More than 30 percent of people walk, 10 percent bike, and 6
percent ride transit.
• The University of California, Riverside (UCR) operates an Alternative Transportation Program
and provides students, faculty and staff with free trips on RTA buses, and incentives for
biking, walking, carpooling or vanpooling. They have 575 students registered as pedestrians or
cyclists in their program, and report that 43 percent of students, staff and faculty rode the
bus at least once during the 2017-2018 school year.34
34 (University of California, Riverside, n.d.)

SCAG TDM Strategic Plan: Potential Application of TDM Toolbox Strategies | Report
74
• California Baptist University also provides free rides for students on RTA buses.35
• OCTA operates a Rideshare Program coordinated with Los Angeles and Ventura Counties and
RCTC operates a Rideshare Program coordinated with San Bernardino County. Both OCTA
and RCTC also participate in several national campaigns coordinated with other
transportation agencies in the SCAG region including Rideshare Week and May’s Bike to Work
Week.
Incentives and Facilitation
• Employees and students in Orange County have access to OCTA-sponsored transit incentives
through participating employers and universities. Less than 20 employers participate in the
program.
– OCTA provides a reimbursement based guaranteed ride home program for employers
registered in the Rideshare Program.
– OCTA provides a $400 subsidy for registered vanpools.
– OCTA offers special discounted transit passes for college students. The University Pass
program at UCI provides unlimited discount rides for students.36 Students enrolled in the
Santa Ana College Continuing Education Program qualify for free OC Bus Rides. 37
• The IE Commuter program is a partnership with RCTC and SBCTA to assist commuters in trying
alternative modes and incentivize them with rewards. More than 200 employees are
registered for incentive programs, which include financial incentives for new transit riders,
coupons, and monthly drawings.
• RCTC and SBCTA offer up to a $400 vanpool subsidy to those registered in the program,
similar to Orange and Los Angeles County. Like the other county programs, it is destination
based and recognizes that many commuters travel between counties.
– RCTC’s program launched in 2019, branded as Van Club. It allows users to sign up
with vanpools from both Enterprise and CalVans, and hopes to have 200 vanpools
registered in three years.
• The western segment of SR-91 through I-15 now includes managed lanes, which provide
either free or discounted trips (depending on direction and time of day) to carpools of three
or more people. East of I-15, SR-91 provides HOV lanes.
Infrastructure and System Upgrades
• Two new express bus routes were implemented by RTA in January 2018 between Riverside
and Orange County, including RTA Route 200 which connects San Bernardino/Riverside to
Anaheim and Route 205 which connects the Village at Orange to Corona
Parking Strategies
• Anaheim, Corona, and Riverside all have park and ride lots allowing commuters to take
Metrolink, carpool/vanpool, or buses. Anaheim has two train stations, Anaheim Canyon and
the Anaheim Regional Transportation Intermodal Center. In Riverside, Metrolink stations at
Downtown Riverside and La Sierra provide parking for Metrolink riders.
35 (California Baptist University)
36 (Unviersity of California at Irvine, n.d.)
37 (Santa Ana College, n.d.)

SCAG TDM Strategic Plan: Potential Application of TDM Toolbox Strategies | Report
75
• Additionally, standalone park and ride facilities such as Orange Street Park & Ride and Galleria
at Tyler in Riverside exist to support carpool and vanpool riders.
Congestion Pricing
• Roughly half of this SR-91 segment is served by the 91 Express Lanes. While not all drivers are
required to pay to travel along the corridor, those who wish to move into an uncongested
lane pay a fee that fluctuates based on demand. Therefore access to uncongested lanes
during peak hours is typically more expensive than it is during the off-peak hours when there
is less demand.
TDM Supportive Policies
• The South Coast Air Quality Management District’s Rule 2202 requires employers with 250 or
more employees within the South Coast Air Basin to mitigate the emissions contributed by
their employees’ commute trips through one of three options, including providing worksite
transportation programs to encourage non-SOV travel and trip reduction.
• The Specific Plan in Anaheim Canyon requires that new development develop, implement and
administer a comprehensive TDM program38.
7.1.5 Planned Improvements
Table 7-1: SR-91 Planned Improvements
Project Name Project Description Timeline Project Lead
15/91 Express Lanes Connector
RCTC is preparing to build the 15/91 Express Lanes Connector, which will link the 91 Express Lanes to the future I-15 Express Lanes, which began construction in 2018. Separate from the I-15 Express Lanes Project, the connector will link the eastbound 91 Express Lanes to the northbound I-15 Express Lanes, and link the southbound I-15 Express Lanes to the westbound 91 Express Lanes. Funded by Senate Bill 132, the I-15/SR-91 and is designed to provide a seamless transition between these Riverside County tolling systems for reliable, congestion-free travel for vehicles and express buses.
Anticipated to be complete in 2022.
RCTC
SR-91 Corridor Operations Project
The proposed project would add a lane on westbound SR-91 from the Green River Road on-ramp to the southbound State Route 241 connector. The auxiliary lane, located next to the exterior shoulder, would help relieve westbound traffic congestion through the SR-91 Corridor.
Environmental studies to be completed in late 2019. Construction could be completed by 2021.
RCTC, Caltrans, OCTA, Transportation Corridor Agencies, City of Corona
38 (City of Anaheim, 2016)

SCAG TDM Strategic Plan: Potential Application of TDM Toolbox Strategies | Report
76
Metrolink SCORE Project
The SCORE Project, if fully funded, promises to increase regional rail service throughout Metrolink’s service area, including a plan for at least two trains per hour along the Inland Empire-Orange County and 91-Perris Valley lines.39
Timeline for program unknown.
Metrolink, Caltrans, RCTC, OCTA
Placentia Metrolink Station parking structure40
A parking structure planned for the Placentia Metrolink station will serve the 91-Perris Valley Line.
Construction will break ground in 2020, with completion anticipated for 2021.
OCTA, City of Placentia
SR-91 Widening
This project will improve the SR-57/SR-91 interchange complex by adding capacity between SR-55 and SR-57
Anticipated that construction will be completed in 2025.
OCTA
Fairmont Boulevard Improvements
This project would provide a new interchange with SR-91 at Fairmont Boulevard. A pedestrian and bicycle connection is also proposed between La Palma Avenue and Santa Ana Canyon Road to connect to the Santa Ana River Trail.
Construction is anticipated to be completed in 2035.
OCTA
7.1.6 Congestion and Trip Profiles41
Travel Delay Heaviest from Riverside County into Orange County in the Morning and Back in the Evening
The SR-91 Corridor Segment sees the most delay going westbound during the AM peak period,
and going eastbound in the PM peak period.
39 (Wanek-Libman, 2018)
40 (City of Placentia, n.d.)
41 (Scauzillo, 2017)
Figure 7-2: SR-91 AM Travel Delay
Delay per segment in minutes 0.000 to 0.710 0.071 to 0.273 0.273 to 2.569 2.569 to 3.992 3.992 and above Other
SR-91
AM

SCAG TDM Strategic Plan: Potential Application of TDM Toolbox Strategies | Report
77
Traffic Flow
During the AM peak period, traffic flow calculations for the section of the SR-91 Corridor Segment
just east of SR-55 (indicated in by the green line in Figure 7-4) show that westbound traffic is
coming from Riverside County further east on SR-91 and north from I-15. After the SR-91/SR-55
interchange, it primarily travels south along SR-55, but a good portion continues west along SR-91.
The largest generator of eastbound volume through the same section of SR-91 is SR-55 North.
Though the eastbound volume is smaller in general, there is still volume heading further east
along SR-91 and south on I-15 during the AM peak (depicted below in Figure 7-4).
Figure 7-3: SR-91 PM Travel Delay
Figure 7-4: SR-91 W AM Auto Traffic Volume
Delay per segment in minutes 0.000 to 0.710 0.071 to 0.273 0.273 to 2.569 2.569 to 3.992 3.992 and above Other
PM
SR-91
SR-55
SR-55
AM
Vehicle volume per segment
1-15
SR-55
SR-91

SCAG TDM Strategic Plan: Potential Application of TDM Toolbox Strategies | Report
78
In the PM peak, traffic conditions are essentially reversed, with the same generators and
destinations demonstrated. However, on the western segment of the corridor traffic volume
during the PM peak period is significantly higher than during the AM period, with 65 percent more
automobiles than there are in the AM peak. This is reflected in the price of the Express Lanes
through Orange County, which never reach $6 in the AM peak, but reach $6 or more at ten
separate hours during the PM peak42. Express Lane travel hovers around 20% of total travel during
the more congested travel times (AM westbound and PM eastbound).
Table 7-2: SR-91 Percent of Total Volume in Express Lanes
AM PM
Auto Truck Auto Truck
Westbound 19% 14% 11% 22%
Eastbound 10% 22% 17% 16%
7.1.7 Challenges
The SR-91 segment is heavily traveled by commuters, and congestion during the peak hours
makes travel difficult. This issue is exacerbated by the fact that there are few arterials that parallel
SR-91, so even for short trips, it is often the only option. Though there are various options for
transit, due to the distance of many of the trips and a lack of first/last mile connections. Transit is
likely to add a great deal of time to trips for many commuters compared with driving, however,
TNCs are currently providing transit commuters with first/last mile connections.
7.2 Corridor Vision
Since current transit options may not be attractive for the types of long trips being taken by those
commuting from Riverside County and eastern Orange County on SR-91, a long-term vision is one
where express bus and rail service is frequent and easy to schedule and connections to first and
last mile multimodal options are strong and easy to use.
7.3 TDM Solutions
7.3.1 Short Term
Marketing and Education: Marketing Campaign
Stakeholders can use marketing surrounding heavy traffic congestion as a tool to encourage
multimodal trips or trips taken outside of the peak hours. Marketing campaigns often include
outreach to both commuters and employers through online and in-person engagement and
typically focus on a specific challenge or mode of travel, or target specific populations.
The Express Lanes project aims to decrease congestion by allowing individuals who are willing to
pay financially to avoid congested lanes and utilize uncongested lanes, and by allowing high-
42 (91 Express Lanes, 2019)
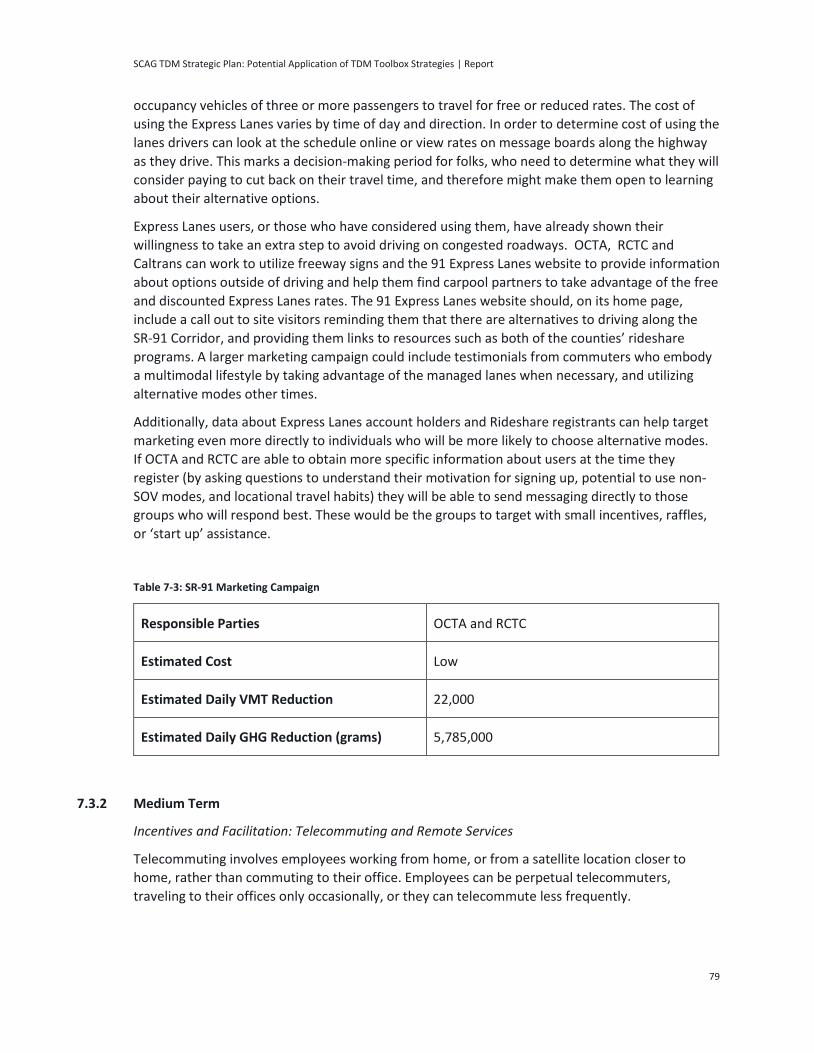
SCAG TDM Strategic Plan: Potential Application of TDM Toolbox Strategies | Report
79
occupancy vehicles of three or more passengers to travel for free or reduced rates. The cost of
using the Express Lanes varies by time of day and direction. In order to determine cost of using the
lanes drivers can look at the schedule online or view rates on message boards along the highway
as they drive. This marks a decision-making period for folks, who need to determine what they will
consider paying to cut back on their travel time, and therefore might make them open to learning
about their alternative options.
Express Lanes users, or those who have considered using them, have already shown their
willingness to take an extra step to avoid driving on congested roadways. OCTA, RCTC and
Caltrans can work to utilize freeway signs and the 91 Express Lanes website to provide information
about options outside of driving and help them find carpool partners to take advantage of the free
and discounted Express Lanes rates. The 91 Express Lanes website should, on its home page,
include a call out to site visitors reminding them that there are alternatives to driving along the
SR-91 Corridor, and providing them links to resources such as both of the counties’ rideshare
programs. A larger marketing campaign could include testimonials from commuters who embody
a multimodal lifestyle by taking advantage of the managed lanes when necessary, and utilizing
alternative modes other times.
Additionally, data about Express Lanes account holders and Rideshare registrants can help target
marketing even more directly to individuals who will be more likely to choose alternative modes.
If OCTA and RCTC are able to obtain more specific information about users at the time they
register (by asking questions to understand their motivation for signing up, potential to use non-
SOV modes, and locational travel habits) they will be able to send messaging directly to those
groups who will respond best. These would be the groups to target with small incentives, raffles,
or ‘start up’ assistance.
Table 7-3: SR-91 Marketing Campaign
Responsible Parties OCTA and RCTC
Estimated Cost Low
Estimated Daily VMT Reduction 22,000
Estimated Daily GHG Reduction (grams) 5,785,000
7.3.2 Medium Term
Incentives and Facilitation: Telecommuting and Remote Services
Telecommuting involves employees working from home, or from a satellite location closer to
home, rather than commuting to their office. Employees can be perpetual telecommuters,
traveling to their offices only occasionally, or they can telecommute less frequently.

SCAG TDM Strategic Plan: Potential Application of TDM Toolbox Strategies | Report
80
Telecommuting can have a direct impact on VMT reduction by reducing the number of trips taken
by commuters.’
Long distance travel is common along SR-91, many commuters live in Riverside and points east,
but travel west into Orange County daily. If these individuals were able to work from home offices
or out of satellite centers in Riverside County, VMT could be reduced significantly.
OCTA and RCTC could work together to create a robust telecommute program for employers
along the western edge of the SR-91 Corridor Segment. This could be a hybrid program,
incorporating Individualized Marketing to reach out to large employers that may not currently
allow telecommuting, provide ongoing support and program development through more
generalized marketing material to use with their employees, and potentially providing small
incentives to either individuals who telecommute or team leaders who help get programs off the
ground. OCTA and RCTC would want to monitor each program closely and collect metrics on the
number of employer programs developed, the number of employees telecommuting, and where
possible, the vehicle miles reduced from their commutes per week.
Responsible Parties OCTA, RCTC and Employers
Estimated Cost Medium
Estimated Daily VMT Reduction 48,000
Estimated Daily GHG Reduction (grams) 12,809,000
Incentives and Facilitation: Mobility as a Service Provision
Mobility as a Service can help commuters plan, pay for, and facilitate simpler trips that make use
of multiple modes, providing a more efficient service for commuters overall through the use of a
single application or platform. In the SCAG Region, Lyft has begun to head in this direction in Santa
Monica by providing suggestions for transit travel along with or in place of hailing a traditional Lyft
ride. Uber has started a similar program in partnership with the Regional Transportation District in
Denver.
Due to the distance many individuals travel, it is likely that most commuters using the SR-91
segment would need to make at least one transfer (or connection to another mode) if they were
to take transit to work. This might be intimidating and discouraging, particularly if they are not
currently regular transit riders.
OCTA and RCTC could take the lead in connecting municipalities, local transit operators, and
private providers to provide a coordinated Mobility as a Service platform for those commuting
between the two counties. It would likely include the ability to plan trips on Metrolink and the
available transit services, and would also show users their most efficient trip by also connecting to
TNCs to demonstrate first and last mile connections, fixed or dynamically routed bus service, or
dockless options where available. Eventually, the ability to pay for a multimodal trip managed by

SCAG TDM Strategic Plan: Potential Application of TDM Toolbox Strategies | Report
81
more than one operator through one single payment will make these trips even more accessible
to commuters.
Table 7-4: SR-91 - Mobility as a Service Provision
Responsible Parties OCTA, RCTC and Private Service Operators
Estimated Cost High
Estimated Daily VMT Reduction 39,000
Estimated Daily GHG Reduction (grams) 10,333,000
Infrastructure and System Upgrades: Private Transportation/Shuttles
Private transportation and shuttle service are often operated by employers or TMAs to connect
employees to worksites not well served by transit. While these services are operated outside of
public transportation systems, they often connect to and exist within the larger transportation
network. In some cases, such as in Dallas, TX, public transit agencies subsidize the cost of
operating shuttle service as it provides a more efficient service than large-scale fixed route bus
service might.
Given the size of Orange County and the distance between Metrolink stations and employment
centers, OCTA and employers in the area should work together to provide shuttle service to bridge
the first/last mile gap for potential Metrolink Riders.
In late 2018, OCTA launched a microtransit pilot in two zones, one connecting riders in the
western part of the county and the other in the southern part of the county. Something similar
could be implemented further east to connect Metrolink riders to their workplaces. A service like
this could be a hybrid between a fixed route and completely flexible service, with scheduled pick
up times aligning with Metrolink and a drop-off route based on rider need.
Table 7-5: SR-91 - Private Transportation/Shuttles
Responsible Parties Orange County employers, OCTA
Estimated Cost Medium
Estimated Daily VMT Reduction 22,000
Estimated Daily GHG Reduction (grams) 5,740,000

SCAG TDM Strategic Plan: Potential Application of TDM Toolbox Strategies | Report
82
7.3.3 Long Term
Infrastructure and Service Provision: Transit Upgrades
Transit upgrades include addition or alteration of service within a pre-existing transit network.
They make public transit more efficient, enjoyable or accessible.
To remain competitive with single-occupancy vehicle travel, transit service must improve. Express
service such as Metrolink and OCTA’s and RTA’s express buses are often able to travel more
quickly than cars (travel time on Metrolink between Corona and the Anaheim Canyon station is
just over 20 minutes, and the same trip in a car typically takes at least 30 minutes during peak
hours), but the speed of these services is mitigated by the lack of convenience associated with
their limited departure times. Metrolink has plans to improve frequency along the SR-91 Corridor
through their SCORE program, which will help to make their service more attractive for regular
commuters.
OCTA and RTA should support this increase in frequency of Metrolink service where possible, and
continue to monitor both Metrolink ridership and ridership of express bus service. As Metrolink
ridership grows, both agencies may see the need to increase frequency of connector service to
and from Metrolink stations. Increased Metrolink service will also provide better options for
those who commute from Orange County to Riverside County, which should incentivize employers
to locate in Riverside County.
Table 7-6: SR-91 - Transit Improvements
Responsible Parties OCTA, RCTC, Metrolink, RTA
Estimated Cost High
Estimated Daily VMT Reduction 22,000
Estimated Daily GHG Reduction (grams) 5,740,000

SCAG TDM Strategic Plan: Potential Application of TDM Toolbox Strategies | Report
83
Education and health facilities
8.1 Existing Conditions
8.1.1 Overview
County Riverside, San Bernardino
Municipalities Cities of Ontario, Fontana, Bloomington, Rialto, Colton, San
Bernardino, Loma Linda, Redlands, Yucaipa, Calimesa, Beaumont
Segment Extent West: LA County Line
East: SR-60 interchange
Segment Length 46 Miles
Figure 8-1: I-10 Segment Overview
8 I-10

SCAG TDM Strategic Plan: Potential Application of TDM Toolbox Strategies | Report
84
I-10 is a key route connecting the Inland Empire with LA and the Ports to the west and areas to the
east. San Bernardino and the Inland Empire are key centers for goods movement which would
serve as a large attraction for vehicular traffic. The segment considered here runs between the
Los Angeles County border in the west to SR-60 in the southeast, a length of approximately 46
miles. There are 6-8 through lanes on the corridor, depending on the segment.
8.1.2 Multimodal Accessibility
Bicycle Facilities
There is no bike accessibility along the route. There are no dedicated bike routes that run
anywhere on the segment. Various highways and arterials link together to parallel this segment
along the I-10 and could serve as bike routes.
Pedestrian Facilities
Pedestrians face similar challenges to cyclists along this segment. Few roads parallel the I-10
segment and pedestrians would have to go well out of their way to find continuous sidewalks.
Transit
• Bus
– Omnitrans operates the 208 and 290 routes along I-10.
– Sunline Transit Agency operates the 220 Commuter which runs parallel to the corridor
segment.
– Beaumont Pass Transit 120 Commuter Line runs from San Bernardino Transit Center to
Beaumont along the eastern end of corridor.
– Riverside Transit Agency 204 Commuter Line runs from Montclair to Riverside, south of
corridor.
• Rail
– Metrolink operates the IE - OC and San Bernardino lines along the corridor.
– There is very limited Amtrak service at Riverside and San Bernardino stations.
8.1.3 Key Attractors
The corridor is characterized by a large number of attractors serving the more congested 30 miles
between the I-15 and SR-60 at the western end and an increase in traffic around Palm Springs at
the eastern end.
Ontario International Airport Ontario International Airport is a passenger and commercial airport located two miles east of downtown Ontario in San Bernardino County. While it is located just outside of the corridor, south of the I-10 and west of the I-15, it is still a major attractor for traffic on the corridor. In 2018, Ontario experienced over 5.1 million passenger arrivals and departures and moved over 750,000 tons of freight for the region43. It is Ontario’s mission to operate and grow Ontario International Airport which has capacity to grow to 10 million passengers per year in the existing development. There are approximately 7000 parking spaces on site. According to the US Census,
43 (Ontario International Airport, 2018)

SCAG TDM Strategic Plan: Potential Application of TDM Toolbox Strategies | Report
85
there are about 538 employees who work for various industries within a quarter mile of the airport complex.44
Educational Institutions
• Crafton Hills College is located one-mile northeast of I-10 off Sand Canyon Road. It is part of
the California community college system with an enrollment of 5,100 students.
• The University of Redlands is located just south of I-10 off Colton Avenue. The College of Arts
and Sciences has approximately 2,500 students while the Schools of Education and Business
have approximately 500 and 1,000 students, respectively.
• Loma Linda University is a Seventh-day Adventist educational health-sciences institution with
3,000 students. It is located south of I-10 off Tippecanoe/Anderson and north of Barton Road.
• San Bernardino Valley College is located one and a half miles north of I-10, just west of I-215 off Mount Vernon Avenue. It is part of the California community college system with an
enrollment of over 25,000 students. Hospital Facilities
• The Loma Linda University Medical Center is a 900-bed hospital located adjacent to the Loma
Linda University south of I-10 off Tippecanoe/Anderson. It includes a Children’s Hospital, a
Medical Center East Campus, and a Behavioral Medicine Center. This hospital serves more
than 33,000 inpatients and half a million outpatients each year.
• Kaiser Permanente Fontana Medical Center is located north of I-10 at the corner of Sierra
Avenue and Valley Boulevard. It is a full-service hospital offering preventive care, prenatal
care, emergency services, screening diagnostics, and pharmacy services. It serves part of
Kaiser Permanente’s 6.5 million members in California.
• Arrowhead Regional Medical Center is located just north of I-10 at Pepper Avenue. It is a 373-
bed teaching facility with a Level II trauma center, an emergency department and other
specialty services serving the San Bernardino, Riverside, Inyo, and Mono counties.
• Redlands Community hospital is located nearly 3 miles south of the I-10 and downtown
Redlands. It is a 229-bed facility with a team of over 300 physicians and 1,600 employees.
Venues/ Retail/ Other Attractors
• California Speedway, which is located just one mile north of I-10 off Cherry Avenue, provides
over 92,000 grandstand seats and is accessible by car as well as Metrolink train services
during race event weekends.
• The San Bernardino Stadium is located approximately two miles north of I-10, east of I-215. It
is home to the Inland Empire 66ers, San Bernardino’s single-A minor league baseball team in
the California League.
• The Citizens Bank Arena, formerly the Ontario Community Events Center, hosts local events
and concerts. The arena's capacity is approximately 11,000. It is located less than a mile north
of I-10 and west of I-15.
• Victoria Gardens is a large shopping mall in Rancho Cucamonga, located approximately four
miles north of the I-10/I-15 interchange. It is 147 acres with more than 175 tenants, and
incorporates an entertainment venue with more than 500 seats.
44 US Census, 2015 Work Area Profile for Ontario International Airport.

SCAG TDM Strategic Plan: Potential Application of TDM Toolbox Strategies | Report
86
• Ontario Mills Mall is located just west of the I-10/I-15 interchange and is the largest outlet
mall in California with over 200 discount stores and entertainment venues.
Coachella Valley
To the east of the corridor, the Coachella Valley serves as a busy resort and tourist destination and
major agricultural producer in Southern California with 13.6 million visitors in 2017, and 1 in 4 jobs
being supported by tourism. The area also attracts many long stay visitors with the winter
population double that of the summer population.
The area is served by the 1-10 freeway.
8.1.4 Existing TDM Strategies
Education and Marketing
• SBCTA and RCTC operate a joint employer-based IE Commuter program to assist commuters
in trying alternative modes and incentivize them with rewards. Employees have access to trip
planning information, education and incentives through registered employers. This includes a
rideshare database and assistance in ridematching and post information about trip logging,
park and rides and emissions reductions online.
Incentives and Facilitation
• The IE Commuter program is a partnership with RCTC and SBCTA to assist commuters in trying
alternative modes and incentivizes them with rewards. More than 200 employees are
registered for incentive programs, which includes financial incentives for new transit riders,
coupons, and monthly drawings.
• RCTC and SBCTA offer a $400 vanpool subsidy to those registered in the program, similar to
Orange and Los Angeles County. Like the other county programs, it is destination based and
recognizes that many commuters travel between counties. The program launched in 2019
and hopes to have 200 vanpools registered in three years.
• OmniTrans’ GoSmart Program offers free transit trips for all participating schools, colleges
and universities in San Bernardino.
Infrastructure and System Upgrades
• RCTC is looking to identify areas for new park-and-rides to accommodate growth in the
vanpool and carpool programs.
• The Redland Rails Project will connect the San Bernardino Transit Center to downtown
Redlands with a passenger rail service.
TDM Supportive Policies
• The entire corridor falls under the South Coast Air Quality Management District which
requires companies of more than 250 employees to mitigate mobile source emissions by
purchasing credits, paying into a fund, or implementing an employee commute trip reduction
program (ECRP), the latter which aligns with TDM programming.
• Some Cities along the corridor require Development Agreements with mitigation measures
that include TDM measures to offset parking or congestions impacts.

SCAG TDM Strategic Plan: Potential Application of TDM Toolbox Strategies | Report
87
8.1.5 Planned Improvements
Table 8-1: Planned Improvements
Project Name Project Description Timeline Project Lead
I-10 Corridor Project
This project provides approximately 10 miles of express lanes along the I-10 in each direction from the Los Angeles County line to the I-15.
July 2017 - Completion & Approval of Final Environmental Document Summer 2019 - Award Design/Build Contract Summer 2019 - Anticipated Start of Construction Spring 2023 - Anticipated End of Construction
SBCTA & Caltrans
Coachella Valley - San Gorgonio Pass Rail Corridor Service
Study for options to provide additional Amtrak intercity rail service between Los Angeles and the desert cities in the Coachella Valley. The Coachella Valley – San Gorgonio Pass Rail Corridor Service would extend from Indio in the east to Los Angeles Union Station in the west, approximately 141 miles.
EIS/EIR Phase - 2016-2018 Alternatives Analysis Phase - 2013 - 2015
RCTC, FRA, and Caltrans
San Bernardino & Riverside 10 & 60 Expand Multi-modal Freight
$82.4 million bridge project will improve the vertical clearance for trucks to improve freight movement on the Etiwanda San Sevain Bridge and Colton Overhead Bridge on Interstate 10 in San Bernardino County, the Ramona Avenue Overcrossing on State Route 60 in San Bernardino County, and the Highland Springs Avenue Undercrossing and the Eagle Mountain Road Bridge on I-10 in Riverside County.
TBD SBCTA, RCTC
Redlands Rail Project (Arrow)
The Redland Rail Project will connect the San Bernardino Transit Center to downtown Redlands with a passenger rail service.
Under construction – will begin operations late 2021.
SBCTA
BRT System The West Valley Connector Project is a two phase 35-mile-long bus rapid transit (BRT) serving the communities of Pomona, Montclair, Ontario, Rancho Cucamonga and Fontana.
Phase 1 in Final Design – planned to begin operations in 2022.
Omnitrans
I-10 Truck Climbing Lane
This project will add a truck climbing lane from west of the 16th Street Bridge in the City of Yucaipa to just east of the County Line Road Bridge at the San Bernardino County and Riverside County line.
Completion and Approval of Final Environmental Document (Project Approved) Spring 2019 and Spring 2022 anticipated end of construction.
SBCTA
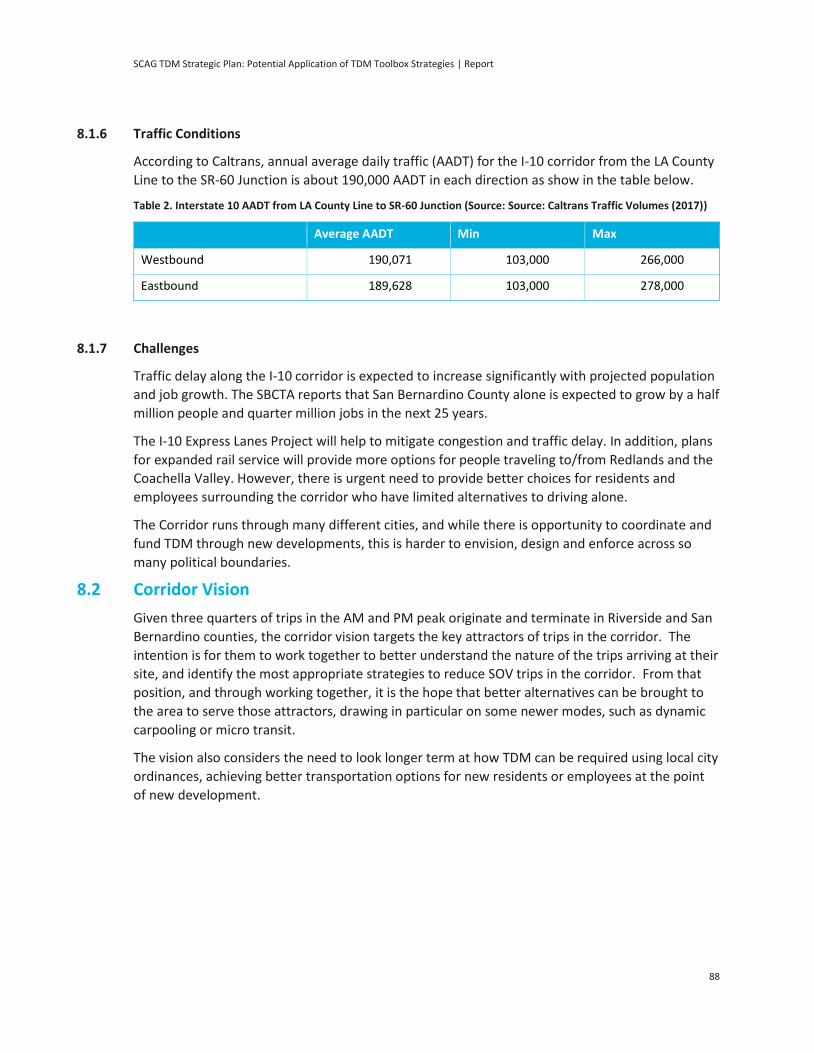
SCAG TDM Strategic Plan: Potential Application of TDM Toolbox Strategies | Report
88
8.1.6 Traffic Conditions
According to Caltrans, annual average daily traffic (AADT) for the I-10 corridor from the LA County
Line to the SR-60 Junction is about 190,000 AADT in each direction as show in the table below.
Table 2. Interstate 10 AADT from LA County Line to SR-60 Junction (Source: Source: Caltrans Traffic Volumes (2017))
Average AADT Min Max
Westbound 190,071 103,000 266,000
Eastbound 189,628 103,000 278,000
8.1.7 Challenges
Traffic delay along the I-10 corridor is expected to increase significantly with projected population
and job growth. The SBCTA reports that San Bernardino County alone is expected to grow by a half
million people and quarter million jobs in the next 25 years.
The I-10 Express Lanes Project will help to mitigate congestion and traffic delay. In addition, plans
for expanded rail service will provide more options for people traveling to/from Redlands and the
Coachella Valley. However, there is urgent need to provide better choices for residents and
employees surrounding the corridor who have limited alternatives to driving alone.
The Corridor runs through many different cities, and while there is opportunity to coordinate and
fund TDM through new developments, this is harder to envision, design and enforce across so
many political boundaries.
8.2 Corridor Vision
Given three quarters of trips in the AM and PM peak originate and terminate in Riverside and San
Bernardino counties, the corridor vision targets the key attractors of trips in the corridor. The
intention is for them to work together to better understand the nature of the trips arriving at their
site, and identify the most appropriate strategies to reduce SOV trips in the corridor. From that
position, and through working together, it is the hope that better alternatives can be brought to
the area to serve those attractors, drawing in particular on some newer modes, such as dynamic
carpooling or micro transit.
The vision also considers the need to look longer term at how TDM can be required using local city
ordinances, achieving better transportation options for new residents or employees at the point
of new development.
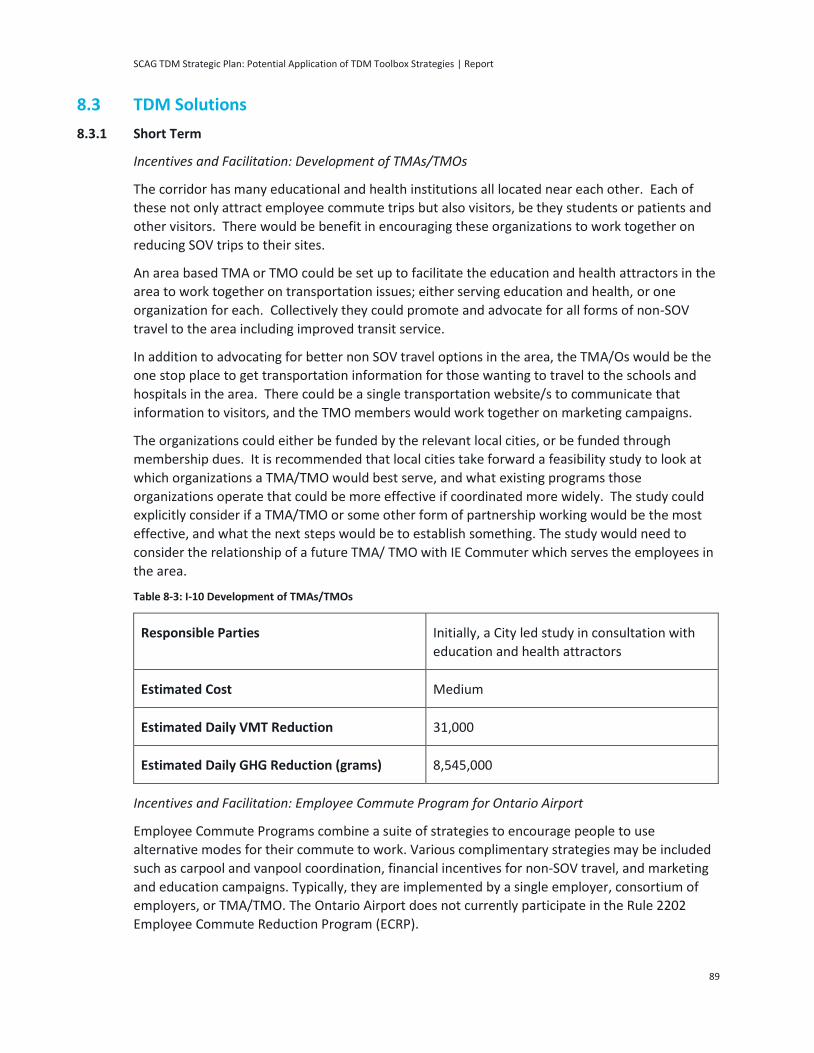
SCAG TDM Strategic Plan: Potential Application of TDM Toolbox Strategies | Report
89
8.3 TDM Solutions
8.3.1 Short Term
Incentives and Facilitation: Development of TMAs/TMOs
The corridor has many educational and health institutions all located near each other. Each of
these not only attract employee commute trips but also visitors, be they students or patients and
other visitors. There would be benefit in encouraging these organizations to work together on
reducing SOV trips to their sites.
An area based TMA or TMO could be set up to facilitate the education and health attractors in the
area to work together on transportation issues; either serving education and health, or one
organization for each. Collectively they could promote and advocate for all forms of non-SOV
travel to the area including improved transit service.
In addition to advocating for better non SOV travel options in the area, the TMA/Os would be the
one stop place to get transportation information for those wanting to travel to the schools and
hospitals in the area. There could be a single transportation website/s to communicate that
information to visitors, and the TMO members would work together on marketing campaigns.
The organizations could either be funded by the relevant local cities, or be funded through
membership dues. It is recommended that local cities take forward a feasibility study to look at
which organizations a TMA/TMO would best serve, and what existing programs those
organizations operate that could be more effective if coordinated more widely. The study could
explicitly consider if a TMA/TMO or some other form of partnership working would be the most
effective, and what the next steps would be to establish something. The study would need to
consider the relationship of a future TMA/ TMO with IE Commuter which serves the employees in
the area.
Table 8-3: I-10 Development of TMAs/TMOs
Responsible Parties Initially, a City led study in consultation with
education and health attractors
Estimated Cost Medium
Estimated Daily VMT Reduction 31,000
Estimated Daily GHG Reduction (grams) 8,545,000
Incentives and Facilitation: Employee Commute Program for Ontario Airport
Employee Commute Programs combine a suite of strategies to encourage people to use
alternative modes for their commute to work. Various complimentary strategies may be included
such as carpool and vanpool coordination, financial incentives for non-SOV travel, and marketing
and education campaigns. Typically, they are implemented by a single employer, consortium of
employers, or TMA/TMO. The Ontario Airport does not currently participate in the Rule 2202
Employee Commute Reduction Program (ECRP).
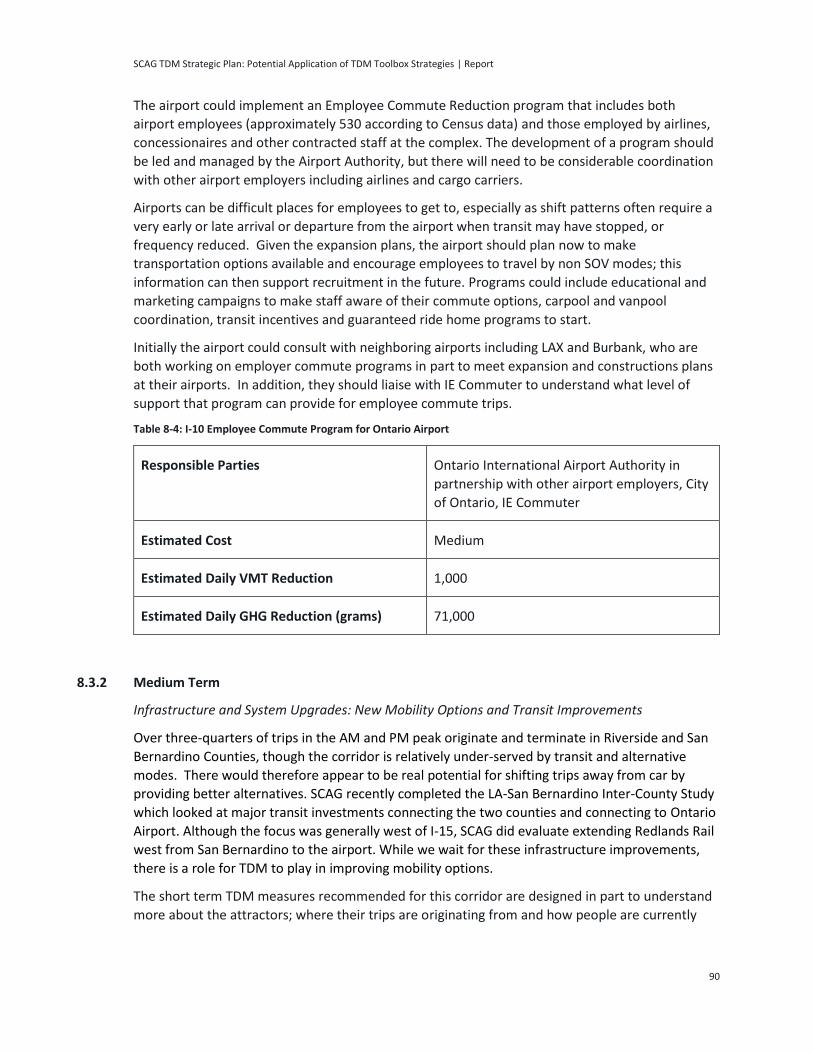
SCAG TDM Strategic Plan: Potential Application of TDM Toolbox Strategies | Report
90
The airport could implement an Employee Commute Reduction program that includes both
airport employees (approximately 530 according to Census data) and those employed by airlines,
concessionaires and other contracted staff at the complex. The development of a program should
be led and managed by the Airport Authority, but there will need to be considerable coordination
with other airport employers including airlines and cargo carriers.
Airports can be difficult places for employees to get to, especially as shift patterns often require a
very early or late arrival or departure from the airport when transit may have stopped, or
frequency reduced. Given the expansion plans, the airport should plan now to make
transportation options available and encourage employees to travel by non SOV modes; this
information can then support recruitment in the future. Programs could include educational and
marketing campaigns to make staff aware of their commute options, carpool and vanpool
coordination, transit incentives and guaranteed ride home programs to start.
Initially the airport could consult with neighboring airports including LAX and Burbank, who are
both working on employer commute programs in part to meet expansion and constructions plans
at their airports. In addition, they should liaise with IE Commuter to understand what level of
support that program can provide for employee commute trips.
Table 8-4: I-10 Employee Commute Program for Ontario Airport
Responsible Parties Ontario International Airport Authority in
partnership with other airport employers, City
of Ontario, IE Commuter
Estimated Cost Medium
Estimated Daily VMT Reduction 1,000
Estimated Daily GHG Reduction (grams) 71,000
8.3.2 Medium Term
Infrastructure and System Upgrades: New Mobility Options and Transit Improvements
Over three-quarters of trips in the AM and PM peak originate and terminate in Riverside and San
Bernardino Counties, though the corridor is relatively under-served by transit and alternative
modes. There would therefore appear to be real potential for shifting trips away from car by
providing better alternatives. SCAG recently completed the LA-San Bernardino Inter-County Study
which looked at major transit investments connecting the two counties and connecting to Ontario
Airport. Although the focus was generally west of I-15, SCAG did evaluate extending Redlands Rail
west from San Bernardino to the airport. While we wait for these infrastructure improvements,
there is a role for TDM to play in improving mobility options.
The short term TDM measures recommended for this corridor are designed in part to understand
more about the attractors; where their trips are originating from and how people are currently

SCAG TDM Strategic Plan: Potential Application of TDM Toolbox Strategies | Report
91
travelling. By gaining a better understanding of this data, and having in place better partnership
working, then it will be easier to identify needs.
It is likely that some of the needs can be met with better transit service, either amendments to
frequency or schedules to better serve the 24-hour operation of many of the attractors in this part
of the corridor. There is also likely to be an opportunity to develop new mobility options including
on demand micro transit service/s or more dynamic carpooling, e.g. Waze carpool.
There are some pilots of each of these being rolled out in other parts of Southern California at the
current time; results and lessons learned from each could be understood to inform some pilots in
this area of San Bernardino County.
This may be a strategy that IE Commuter could be encouraged to explore on behalf of the
employers they serve in this area.
Table 8-5: I-10 New Mobility Options and Transit Improvements
Responsible Parties Key attractors, transit operators, San
Bernardino County though IE Commuter
Estimated Cost Medium
Estimated Daily VMT Reduction 1,000
Estimated Daily GHG Reduction (grams) 225,000
8.3.3 Long Term
Land Use: TDM Ordinance and Policy Developments
The future of the Inland Empire is one which foresees growth in population and in employment.
TDM ordinances could be used to help manage new development and expansion of residents and
jobs. TDM Ordinances typically require developers or employers to provide TDM strategies at
their site or workplace to mitigate the congestion garnered from trips to and from their sites.
The cities in San Bernardino and in Riverside counties along this corridor could work together to
agree a common framework for how they might want to introduce TDM ordinances given each
city would need to have its own, and there will be common and competing policy objectives
already in place within each City. There is good practice in other parts of Southern California
which could be considered; for example, in San Diego County where SANDAG as the MPO
supported the City of Carlsbad in developing their first TDM ordinance which was adopted earlier
in 2019. It may be that one city could follow the same approach and lead the way with a blueprint
for others to follow.

SCAG TDM Strategic Plan: Potential Application of TDM Toolbox Strategies | Report
92
Table 8-6: I-10 TDM Ordinance and Policy Development
Responsible Parties All cities along the corridor
Estimated Cost Low
Estimated Daily VMT Reduction 214,000
Estimated Daily GHG Reduction (grams) 59,901,000

SCAG TDM Strategic Plan: Potential Application of TDM Toolbox Strategies | Report
93
Goods Movement and Related Industry
9.1 Existing Conditions
9.1.1 Overview
Counties Riverside, San Bernardino
Municipalities Corona, Norco, Eastvale, Ontario, Rancho Cucamonga, Fontana
Segment South: SR-91
North: Interstate 215 Junction
Length 27.7 miles
Figure 9-1. Interstate 15 Segment (SR-91 to I-215)
9 I-15

SCAG TDM Strategic Plan: Potential Application of TDM Toolbox Strategies | Report
94
The Interstate 15 is a major goods movement corridor that begins at the Interstate 5 junction in
San Diego County and continues across the Nevada state line. It provides an important link for
trucks coming from the San Diego/Mexico border as well as the Ports of Long Beach and Los
Angeles to distribution centers and warehouses in the Inland Empire as well as destinations in
greater North America.
9.1.2 Multimodal Accessibility
Bicycle
• There are no bicycle facilities along the Interstate 15 and bicycles are prohibited in almost
every segment.
• There are no north-south bikeway alternatives, however, cities have begun implementing
bike lanes along arterials that could offer north-south travel parallel to I-15 in certain
sections.
Pedestrian
• There are no pedestrian facilities along the Interstate 15, except for the shoulders, and
pedestrians are prohibited.
Transit
The I-15 corridor is served by three local transit agencies. In addition, Caltrans operates five
adjacent Park and Ride facilities along the I-15 corridor in Ontario, Mira Loma, Norco and Corona.
Rail
• Metrolink
– The San Bernardino Line provides east-west service from downtown San Bernardino to
downtown Los Angeles. There is a nearby station in Rancho Cucamonga.
– The Riverside Line provides service from downtown Riverside to downtown Los Angeles
and stops in East Ontario.
– The Perris Valley Line is a new line that extends east from the Riverside – Downtown
station to Perris – South station.
– The Inland Empire-Orange County Line provides services from downtown San Bernardino
to Riverside and onto Oceanside in San Diego County.
Bus
• Riverside Transit Agency
– Route 3 runs north-south parallel to the I-15 from Amazon in Eastvale to the Corona
Transit Center north of the SR-91.
– Route 204 connects Ontario to the Montclair Transit Center to the east (San Bernardino
County) and downtown Riverside and University of Riverside.
• Omnitrans
– Route 81 (Chino – Haven - Chaffey College) parallels this segment of the I-15.
– Route 82 (Rancho Cucamonga – Fontana – Sierra Lakes) also parallels this segment in the
Ontario area.

SCAG TDM Strategic Plan: Potential Application of TDM Toolbox Strategies | Report
95
– Omnitrans also operates several east-west routes (61, 66, 67, and 85) that intersect with
this segment.
HOV and HOT Lanes
• There are presently no managed lanes along this segment of the I-15; however, RCTC plans to
add 2-4 HOV and HOT lanes (see Planned Improvements).
9.1.3 Key Attractors
Ontario International Airport Ontario International Airport is a passenger and commercial airport located two miles east of Ontario in San Bernardino County. In 2018, Ontario experienced over 5.1 million passenger arrivals and departures and moved over 750,000 tons of freight for the region45. It is Ontario’s mission to operate and grow Ontario International Airport which has capacity to grow to 10 million passengers per year in the existing development. There are approximately 7,000 parking spaces on site. According to the US Census, there are about 538 employees who work for various industries within a quarter mile of the airport complex.46
Inland Empire Distribution Centers in Ontario and Eastvale
Due to the proximity to the Ports of Long Beach and Los Angeles, and the relative land value in
exurban Inland Empire, the region is characterized by high concentrations of large distribution
centers owned and operated by mega retailers Amazon, Walmart and others. The Amazon
Eastvale complex is located immediately west of the I-15 in Ontario. A Walmart and Grainger
Fulfilment Centers are also located nearby.
Shopping and Entertainment Centers
The shopping and entertainment destinations in Ontario and Rancho Cucamonga such as the
Citizens Bank Arena and the Ontario Mills and Victoria Gardens shopping centers, attract travelers
on I-15. Additionally, SilverLakes Sports Complex in Norco attracts travelers to the southern edge
of the corridor.
9.1.4 Existing TDM Strategies
Education and Marketing
• SBCTA and RCTC operate a joint employer-based program called IE Commuter to assist
commuters in trying alternative modes and incentivize them with rewards. Employees have
access to trip planning information, education and incentives through registered employers.
This includes a rideshare database, assistance in ridematching and posted information about
trip logging, park and rides and emissions reductions online.
Incentives and Facilitation
• The IE Commuter program is a partnership between RCTC and SBCTA to assist commuters in
trying alternative modes and incentivizing them with rewards. More than 200 employers are
registered for incentive programs, which includes financial incentives for new rideshare
45 (Ontario International Airport, 2018)
46 US Census, 2015 Work Area Profile for Ontario International Airport.

SCAG TDM Strategic Plan: Potential Application of TDM Toolbox Strategies | Report
96
participants, coupons, and monthly drawings. IE Commuter also supports employers with
surveying and Rule 2202 compliance.
• RCTC and SBCTA offer up to a $400 vanpool subsidy to vanpools participating in the program,
similar to Orange and Los Angeles County. Like the other county programs, it is destination
based and recognizes that many commuters travel between counties. The program launched
in 2018 and hopes to have 200 vanpools registered in three years.
• Amazon provides commuter benefits for employees at roughly 10 worksites throughout
Southern California. The program, Amazon Ride, is driven by compliance with South Coast
AQMD Rule 2202.
Infrastructure and System Upgrades
• The Redland Rails Project will connect the San Bernardino Transit Center to downtown
Redlands with a passenger rail service.
• RCTC is looking to identify areas for new Park & Rides to accommodate growth in the vanpool
and carpool programs.
• RCTC is working with SANDAG on a Park & Ride study to support new park and ride planning
efforts and operations.
Parking Strategies
• In general, there is an abundance of free parking in the Inland Empire. Specific locations (such
as universities, airports) use some parking management strategies.
TDM Supportive Policies
• The Southern California Air Quality Control District (South Coast AQMD) provides air quality
oversight for multiple counties in the SCAG region, including Los Angeles County, Orange
County, and portions of Riverside and San Bernardino. Through Rule 2202 regulations, the
agency requires that companies with 250 or more employees implement various emissions
reductions measures. One option is to implement an employee commute reduction program
consisting of various TDM measures such as incentives, marketing, and others. South Coast
AQMD requires that companies who select this option survey their employees annually to
establish mode share and monitor their progress against specific targets.
9.1.5 Planned Improvements
Project Description Timeline Project Lead
I-15 Express Lanes Project
The I-15 Express Lanes Project will add two tolled express lanes in both directions, widen bridges and add sound walls along the I-15 between Cajalco Road and State Route 60. It will provide multiple entry and exit points and will extend Riverside County’s express lane network. In the longer range, there are plans to extend the Express Lanes further south to Lake Elsinore
The project is currently under construction with anticipated completion in 2020. The Southern portion will begin construction as early as 2025.
RCTC, Caltrans, FHWA

SCAG TDM Strategic Plan: Potential Application of TDM Toolbox Strategies | Report
97
Customer-Based Ridesharing and Transit Interconnectivity Plan
This study was initiated by SBCTA in partnership with SCAG and Omnitrans to develop strategies for attracting new users to the multimodal network of rail, bus and demand response services among others available in the San Bernardino Valley. The Action Plan includes 16 mobility strategies to address information, first-and-last mile, and rider support. Of note, $426,000 has been set aside to subsidize TNC trips to and from the airport for Metrolink riders.
Study Complete. Implementation TBD.
SBCTA, SCAG, Omnitrans
I-10 Express Lanes Project
This project provides approximately 10 miles of express lanes along the I-10 in each direction from the Los Angeles County line to the I-15.
Construction is anticipated to commence in 2019 and end in 2023
SBCTA
9.1.6 Traffic Conditions
Traffic Volume is Relatively Balanced in the AM and PM Peak Periods
Based on the results of the SCAG model, volume of trucks and autos is relatively balanced in both
direction along the corridor. Taking a snapshot of the section between Jurupa St. and Philadelphia
St. (north of the 210), autos account for roughly 94-97 percent of the total traffic along the
corridor. I-15 corridor experiences congestion in both directions but is slightly worse heading
north during the AM peak period and south in the PM peak period.
9.1.7 Challenges
Interstate 15 is part of the regional freight network connecting the Ports of Long Beach and Los
Angeles with warehouses and distribution centers in the Inland Empire. In addition, it begins at
the US/Mexico border and extends through California, to Nevada and beyond to the Canadian
border. As a result, there is a high volume of truck traffic along the corridor.
The I-15 also serves commuters in San Bernardino County and Riverside County, and many who
are traveling between counties for work. There is little transit service running north-south along
the corridor to provide alternatives.
The area near Eastvale and Ontario is home to several large distribution centers. These
employment centers have a high turnover rate among employees, which makes traditional
commuter benefits more difficult to administer.
9.2 Corridor Vision
The vision for the I-15 corridor is one that embraces innovations in micro mobility and Mobility as
a Service to solve first/last mile problems in a sparse exurban area, while improving traditional

SCAG TDM Strategic Plan: Potential Application of TDM Toolbox Strategies | Report
98
transit service to give commuters better quality alternatives to driving. Some traditional employer-
based programs that provide information about and incentives for non-SOV travel would also be
well-suited for large attractors like Ontario Airport.
9.3 TDM Solutions
9.3.1 Short Term
Incentives and Facilitation: Development of Employee Commute Programs at Ontario Airport
Employee Commute Programs combine a suite of strategies to encourage people to use
alternative modes for their commute to work. Various complimentary strategies may be included
such as carpool and vanpool coordination, financial incentives for non-SOV travel, and marketing
and education campaigns. Typically, they are implemented by a single employer, consortium of
employers, or TMA/TMO. The Ontario Airport does not currently participate in the Rule 2202
Employee Commute Reduction Program (ECRP).
The airport could implement an Employee Commute Reduction program that includes both
airport employees (approximately 530 according to Census data) and those employed by airlines,
concessionaires and other contracted staff at the complex. The development of a program should
be led and managed by the Airport Authority, but there will need to be considerable coordination
with other airport employers including airlines and cargo carriers.
Airports can be difficult places for employees to get to, especially as shift patterns often require a
very early or late arrival or departure from the airport when transit may have stopped, or
frequency reduced. Given the expansion plans, the airport should plan now to make
transportation options available and encourage employees to travel by non SOV modes; this
information can then support recruitment in the future. Programs could include educational and
marketing campaigns to make staff aware of their commute options, carpool and vanpool
coordination, transit incentives and guaranteed ride home programs to start.
Initially the airport could consult with neighboring airports including LAX and Burbank, who are
both working on employer commute programs in part to meet expansion and constructions plans
at their airports. In addition, they should liaise with IE Commuter to understand what level of
support that program can provide for employee commute trips.
Responsible Parties Ontario Airport, City of Ontario
Estimated Cost Medium
Estimated Daily VMT Reduction 1,000
Estimated Daily GHG Reduction (grams) 71,000
Infrastructure and System Upgrades: Private Shared Transportation/Shuttles
Private shuttle services can provide important first/last mile connections for employees who use
transit to commute. The Amazon Eastvale campuses are located near key transit stops as well as
other distribution centers in Ontario.

SCAG TDM Strategic Plan: Potential Application of TDM Toolbox Strategies | Report
99
The Amazon Ride program, Amazon’s company-wide TDM program, currently uses shuttle services
during the holiday season to transport employees to their 10 Southern California sites. The
company has also tried to implement vanpool programs, which have been less successful due to
the high rates of employee turnover. To secure a larger pool of year-round users, Amazon Ride
could partner with other distribution centers in the Ontario/Eastvale region to offer a year-round
shuttle service.
Amazon could coordinate a shuttle or microtransit pilot in the area to focus on improving
connections for Amazon and employees of other distribution centers in the vicinity. Potential
transit hubs to be considered would be the East Ontario Metrolink Station and the RCTC Amazon
Eastvale transit stop. This is a costly service and might be best coordinated among multiple large
distribution centers, particularly those subject to the South Coast AQMD Rule 2202.
Responsible Parties Amazon Ride, City of Eastvale, RCTC,
OmniTrans, Metrolink
Estimated Cost High
Estimated Daily VMT Reduction 400
Estimated Daily GHG Reduction (grams) 25,000
9.3.2 Medium Term
Incentives and Facilitation: Telecommuting and Remote Services
Telecommuting can include working from home or at a satellite office close to home instead of at
the official worksite. By allowing employees the flexibility to work remotely one or two days a
week, employers can reduce the number of vehicle trips to their sites and effectively reduce their
SOV mode share. This is also a low-cost option; many companies already have the server and
communications software needed for employees to access files and communicate with other
team members efficiently.
The Western Riverside Council of Governments (WRCOG) is focused on encouraging co-working
spaces to reduce the need for inter-county travel and encourage economic development. WRCOG
is developing a Regional Sustainability Center with designated coworking space to demonstrate
the effectiveness of this model, similar to the LA Clean Tech Incubator. This program could be
expanded to reduce the need for commute trips along I-15 to San Diego County.
The first phase of this project might emphasize an employer education program that discusses the
benefits of telework. This could be a coordinated effort between SBCTA and RCTC, agencies who
currently partner to provide the IE Commuter rideshare program. Employer outreach will require
engaging executive level management staff with authority to implement telecommute policies,
likely through one-on-one meetings and working group sessions. A second phase could expand the
partnership to local Councils of Governments to develop policies and incentives for coworking
spaces and facilities.

SCAG TDM Strategic Plan: Potential Application of TDM Toolbox Strategies | Report
100
Responsible Parties SBCTA, RCTC, SCAG, SANDAG, County of
Riverside, County of San Bernardino, COGs
Estimated Cost Medium
Estimated Daily VMT Reduction 60,000
Estimated daily GHG Reduction (grams) 3,798,000
9.3.3 Long Term
Infrastructure and System Upgrades: Transit Improvements
The success of most TDM alternatives depends on the quality of access to high quality driving
alternatives. Transit improvements may include route optimization and improved area coverage,
first/last mile options, or increased frequency to make transit use more competitive with driving.
In areas of San Bernardino and Riverside Counties that abut the I-15, there is a lack of access to
transit services, which causes challenges for companies that want to encourage their employees
to try alternative modes but struggle to meet their AVR targets. The forthcoming increase in rail
service in Riverside County, both extended commuter rail and new passenger rail service, provides
transit operators with the opportunity to enhance connecting bus service and better serve the
corridor. In addition, OmniTrans has recently conducted a Warehouse Tripper pilot to test the
feasibility of service changes that allow buses to deviate from standards routes during peak
periods to service to stops closer to large areas of employments like warehouses in San
Bernardino.
RTA and OminiTrans should continue to study the long-term feasibility of introducing broader
coverage to serve proliferating employment centers associated with warehousing as well as
increased frequency along specific routes that serve as important connections, such as those
connecting to East Ontario Metrolink Station and San Bernardino Transit Center.
Responsible Parties RTA, OmniTrans, Metrolink
Estimated Cost High
Estimated Daily VMT Reduction 1,030,000
Estimated Daily GHG Reduction (grams) 65,110,000
Incentives and Facilitation: Mobility as a Service Provision for Ontario Airport
Mobility as a Service (MaaS) refers to the consolidation of various transportation services into a
single platform to streamline trip planning and planning in one place. MaaS is unfolding quickly,
with various public and private agencies working together to integrate transit, bikeshare,
ridehailing, and other services. MaaS also introduces the possibility of applying subsidies to
encourage specific types of travel.

SCAG TDM Strategic Plan: Potential Application of TDM Toolbox Strategies | Report
101
An application that allows customers to plan and purchase fare for their entire trip in one place
creates opportunities to incentivize alternative modes. In a MaaS application, airports can
effectively push various users towards different types of transportation modes, including rail, bus,
shared rides and others using notifications and incentives. For example, the airport (or other third
parties) could offer reduced fare for non-SOV trips or shared rides, which helps to manage parking
and curb space and reduce the total number of TNC trips. This could incorporate a subsided
ridehailing pilot for Airport-Metrolink trips as recommended by the SBCTA Customer-Focused,
Technology-Enabled Multi-Modalism Action Plan (Subsidized Ride-Hailing Trips — Metrolink
Stations to Ontario Airport).
Airports like Ontario are in a unique position to facilitate trip planning for customers and could
help to develop a program and application that allows the user to purchase their airfare and book
travel to/from the airport in one step. The airport could initiate this process by reaching out
private companies, airlines, Uber and Lyft, and software makers to think about ways they could
coordinate their various transportation services into one seamless experience that encourages
multimodal travel and the use of TNCs for first and last mile trips.
Responsible Parties Ontario Airport, City of Ontario, Airlines, TNCs,
Software Developers
Estimated Cost High
Estimated Daily VMT Reduction 42,000
Estimated GHG Reduction (grams) 2,645,000

SCAG TDM Strategic Plan: Potential Application of TDM Toolbox Strategies | Report
102
Agricultural Trip Reduction
10.1 Existing Conditions
10.1.1 Overview
County Ventura
Municipalities Ventura, Moorpark, Unincorporated Ventura
County
Segment Extent East: SR-126
West: SR-23
Segment Length 18 Miles
Figure 10-1: SR-118 Segment Overview
10 SR-118

SCAG TDM Strategic Plan: Potential Application of TDM Toolbox Strategies | Report
103
The State Route 118 corridor in Ventura (SR-118) runs for just over eighteen miles between Route
126 in Ventura and Route 23 in Moorpark. From Ventura, the first four miles run southeast with
four lanes, before heading west. The largest segment of the corridor has two lanes that run west
along agricultural sites. At around mile fifteen, the corridor jumps to four lanes as it hits
Moorpark, passing residential and then a retail center. Just east of the retail center the corridor
increases to six lanes prior to intersecting with Route 23.
10.1.2 Multimodal Accessibility
Bicycle
Although the corridor is technically accessible to bicycles, there are no dedicated or shared bicycle
lanes, and shoulders are narrow throughout the majority of the corridor.
Pedestrian
Most of the corridor lacks sidewalks, and large-spanning agricultural sites mean that the distance
between many sites is far. There are sidewalks in the Moorpark section of the corridor, though
there are long blocks and little sidewalk-adjacent retail.
Transit
• Bus
– Ventura County Transit Commission’s East-West Connector bus travels along SR-118
between Route 34 and Route 23 in Moorpark, connecting the corridor with commercial
centers in Camarillo and Ventura. The route runs hourly in the morning and evening, with
a few additional runs mid-day.
– VCTC’s East County Route runs along SR-118 briefly between SR-23 and Moorpark
Avenue.
– Moorpark’s two local bus routes also travel along SR-118 for short distances.
• Rail
– Moorpark has a Metrolink station just north of the corridor which sits on the Ventura
County line which connects to East Ventura and downtown Los Angeles.
10.1.3 Key Attractors
Agricultural Business
The main attractor along the 118 Corridor is the agricultural industry, with farmland that attracts
workers daily.
Moorpark
Just north of the eastern edge of the corridor, downtown Moorpark attracts retail and restaurant
shoppers, and employees at City-owned facilities and the local hospital. Northeast of downtown
lies Moorpark college, a community college with enrollment of over 15,000 students who attend
classes both during the day and in the evenings.

SCAG TDM Strategic Plan: Potential Application of TDM Toolbox Strategies | Report
104
10.1.4 Existing TDM Strategies
Education and Marketing
• Ventura County Transportation Commission operates a Rideshare program along with Los
Angeles and Orange Counties. Ventura County employees can register with Go511 to receive
trip planning assistance and transportation information, and can register for the multi-county
“On the Go” newsletter.
Incentives and Facilitation
• All employees in Ventura County have access to a reimbursement based Guaranteed Ride
Home program through GoVentura.
• All employees in Ventura County have access to a Ridematching service through GoVentura
that helps connect them with others who have registered for the service and are taking
similar trips.
Parking Strategies
• Parking on campus at Moorpark College is $2 per day. Students can purchase semester-long
passes.
• The SR-118 segment has one Park and Ride lot near the eastern end at the Moorpark
Metrolink station. It is listed on VCTC’s website as an official Park and Ride lot.
TDM Supportive Policies
• The City of Moorpark has within its code various TDM policies, including requirements for
developments serving 50, 100, and 150 more employees to provide (respectively)
transportation information, dedicated parking for carpools and vanpools, and pedestrian and
cyclist on-site amenities.
• Residential developments of 500 or more units in the City of Moorpark are required to
incorporate amenities that will reduce drive-alone trips.
• The entire corridor falls under Ventura County’s Congestion Management Program which lists
TDM strategies that can be implemented by municipalities.
• No TDM-related requirements cover the unincorporated areas of the county, in which most of
the 118 Corridor falls.

SCAG TDM Strategic Plan: Potential Application of TDM Toolbox Strategies | Report
105
10.1.5 Planned Improvements
Table 10-1: SR-118 Planned Improvements
Project Name Project Description Timeline Project Lead
SR-118 Widening
Caltrans is exploring a widening of SR-118. The segment being considered is east of the area examined in this report, however if the project brings more volume to the corridor as a whole it is likely that some of it will flow through to the segment between SR-126 and SR-23. As the population of the area being considered for widening is under 20,000, the project is not required to include TSM or TDM strategies47.
Project was approved in 2015.
Caltrans
Slurry Seal Project
Caltrans and the City of Ventura are in the process of requesting services for Slurry Seal marking along the 118. Their request for proposals does not mention where markings will be, but the project will include slurry seal for at least 500 square feet of crosswalks and 20 bike arrows along the entire corridor, though it is unclear whether any will be included within this segment48.
A contract is expected to be awarded in June, 2019.
Caltrans, City of Ventura
10.1.6 Traffic Conditions
Travel Delay is Worse Heading East in the AM and West in the PM Peaks
While traffic volume on the SR-118 Corridor Segment is significantly lower than in other congested
corridors in the SCAG Region, the segment still experiences peak hour delay. Heaviest delays in
the AM peak period are seen heading eastbound, with a volume of almost twice as much that
from westbound travel.
Figure 10-2: SR-118 East AM Delay
47 (Caltrans, 2017)
48 (City of Ventura, 2018)
AM
Delay per segment in minutes 0.176 and below 0.176 to 0.700 0.700 to 1.900 1.900 to 7.300 7.000 and above Other
SR-118
US-101
Moorpark

SCAG TDM Strategic Plan: Potential Application of TDM Toolbox Strategies | Report
106
The delay heading east during the PM peak period is slightly less than in the AM peak period,
though the same segment of the corridor (just west of Moorpark) sees the most delay at both
times of day.
Figure 10-3: SR-118 East PM Delay
10.1.7 Challenges
Although congestion along the 118 Corridor may not be as intense as it is in other areas, traffic on
the 118 has posed challenges to both residents and employees in Moorpark. The congestion
increased 136% between 1995 and 2015 at the intersection of the 118 and 23. While population in
Moorpark has grown steadily, traffic has grown at a much more rapid pace. Caltrans predicts that
employment in Moorpark will grow 30% between 2008 and 2035, more than the growth the City
will see in population or households49. The city can therefore expect to see additional traffic in
years to come.
In addition to congestion, the Route 118 corridor struggles with access. Employees who work in
the agricultural industry are likely to be lower income and may therefore be less likely to have
access to, or be more thoughtful about the cost of operating private vehicles.
The 118 Corridor in Ventura poses unique challenges to TDM implementation because the
majority of the corridor exists in unincorporated land, so does not have a municipality from which
to fund projects. Ventura County government (specifically VCTC) might be able to fund or
implement TDM programs, but has a tight budget due to their lack of a county-wide self-help tax.
10.2 Corridor Vision
Congestion has begun to become an issue along SR-118, which is not well served by
comprehensive public transit alternatives. Over 18,000 people work along the Corridor Segment,
with more using it as an alternative to US-10150. In particular, the Corridor Segment employs a
large number of agricultural workers who could benefit from improved service and access and
reduced transportation costs. Local stakeholders such as Caltrans, Ventura County and the cities
49 (Caltrans, 2015)
50 (United States Census Bureau, 2015)
PM
Delay per segment in minutes 0.176 and below 0.176 to 0.700 0.700 to 1.900 1.900 to 7.300 7.000 and above Other
SR-118
US-101
Moorpark

SCAG TDM Strategic Plan: Potential Application of TDM Toolbox Strategies | Report
107
of Ventura and Moorpark should work together to implement TDM strategies to help cut back on
congestion along the corridor.
10.3 TDM Solutions
10.3.1 Short Term
Incentives and Facilitation: Carpool and Vanpool Coordination
Carpool and Vanpool coordination describes the process of assisting people, usually commuters or
those travelling to a common area, with finding others who are making similar trips at similar
times. Coordination can either be ‘static,’ where commuters are connected and encouraged to
plan trips together themselves, or ‘dynamic’ where systems help carpool partners to find each
other on a trip by trip basis, typically through a mobile application.
Over 30% of the employees along the SR-118 Corridor Segment work in the agricultural,
construction or manufacturing industries. As the agricultural and manufacturing sites along the
segment are not well accessed by public transit or active transportation options, employees at the
farms who want to save money or do not have steady access to a car would benefit from a robust
carpool and vanpool program.
Though VCTC does have carpool and vanpool resources online, it is important that they work
closely with the owners and managers of the sites themselves to better access the populations
that work there by providing material in Spanish and assisting those without computers or
internet access in signing up to find matches on Ridematch.info, the County’s static ridematching
platform.
Table 10-2: SR-118 Carpool and Vanpool Coordination
Responsible Parties VCTC and Agricultural Location Managers
Estimated Cost Low
Estimated Daily VMT Reduction 4,000
Estimated Daily GHG Reduction (grams) 1,170,000
Education and Marketing: Individualized Marketing
Individualized Marketing involves listening to the needs of individuals and providing solutions that
work specifically for them. Relating to transportation, it often involves encouraging individuals to
experiment with alternative forms of transportation by understanding what their major
motivators are (such as time or money) and helping them to find options that work well for them.
In order to be successful in setting up carpools and vanpools among the Route 118’s agricultural
worker population, it will be useful to engage in Individualized Marketing at the sites. Many

SCAG TDM Strategic Plan: Potential Application of TDM Toolbox Strategies | Report
108
employees may not be familiar with the concept of a vanpool, or may not initially feel comfortable
driving with someone they don’t know – particularly if that person works at a different site.
As the sites are spread out and there is no central location for a marketing event, a large-scale
marketing effort should be undertaken, with multiple representatives working to visit and talk
with employees at each site in person about their carpool and vanpool options.
Table 10-3: SR-118 Individualized Marketing
Responsible Parties VCTC
Estimated Cost Medium
Estimated Daily VMT Reduction 4,000
Estimated Daily GHG Reduction (grams) 1,197,000
10.3.2 Medium Term
Parking: Parking Pricing
Parking pricing relates to managing the cost of parking either on private property or in the public
realm. Higher priced parking can discourage vehicle trips, and, if prices vary within a larger parking
network, can better direct drivers to the parking they know is within the range they want to pay,
reducing circling for a small number of “best” spots.
The downtown Moorpark area is becoming more congested and will struggle with being able to
provide parking spaces to all residents, employees and visitors in the future.
Before this happens, the City should develop a pricing program that makes more desirable parking
spaces more expensive, and spaces a few blocks away cheaper or free. Prices can be kept low for
now, but drivers can get used to the idea that they will be paying more for the most desirable
spots. Then, when parking becomes more of an issue they can raise prices accordingly. This will
cut down congestion from drivers circling the downtown area looking for spaces, and will have an
effect on any built-up congestion on Route 118.
Table 10-4: SR-118 Parking Pricing
Responsible Parties City of Moorpark
Estimated Cost Medium – may involve some infrastructure
upgrades
Estimated Daily VMT Reduction 22,000
Estimated Daily GHG Reduction (grams) 6,025,000

SCAG TDM Strategic Plan: Potential Application of TDM Toolbox Strategies | Report
109
Infrastructure and System Upgrades: Bicycle Improvements
Bicycle infrastructure improvements can include physical roadway infrastructure such as bicycle
lanes and bicycle parking infrastructure.
Currently the SR-118 Corridor Segment is not safe for bicycle travel, and suggested bicycle routes
between the western and eastern points of the corridor extend the trip by over ten miles.
However, the County of Ventura’s Bicycle Masterplan has identified the segment as having
“moderately high” suitability for bike infrastructure51.
As has been proposed in Ventura County’s Bicycle Masterplan, the County and Caltrans should
consider making infrastructure upgrades to as much of the corridor as possible to make it
accessible by bicycle. The Masterplan has suggested the construction of a separate, Class I
bikeway parallel to the SR-118 Corridor, and estimated cost at $24 million. If those funds are not
available a Class II bikeway could be developed by potentially widening the shoulder or narrowing
lanes and reducing speed limits. As indicated in the Masterplan, caution must be taken to prevent
dust, dirt and rocks from the adjacent agricultural industry from creating dangerous conditions for
cyclists.
Table 10-5: SR-118 Bicycle Improvements
Responsible Parties VCTC, Caltrans
Estimated Cost High
Estimated Daily VMT Reduction 4,000
Estimated Daily GHG Reduction (grams) 1,148,000
10.3.3 Long Term
Land Use: Transit Oriented Development and Non-SOV Supportive Land Use
Housing provided close to public transit or close to popular destinations such as office or retail
centers allows residents to take shorter trips to get where they need to go, and if the
infrastructure exists it can encourage them to take those trips by foot or on a bicycle.
According to 2015 census data, only 15% of the employees who work within a two-mile radius of
the Corridor Segment live within the area, meaning that most of those employees are contributing
to bringing congestion to the Corridor Segment, and likely take longer trips than they would if they
lived within the Corridor Segment.
51 (County of Ventura, 2007)

SCAG TDM Strategic Plan: Potential Application of TDM Toolbox Strategies | Report
110
While it is unrealistic that an area as rural as the 118 Corridor develop densely and charge
extensively for parking, there is an opportunity in both Ventura and Moorpark to build more
densely, and for employer participants, to build housing close to work for those who work at their
farms52. Slightly more dense housing can be established to meet the needs of the agricultural
worker population with support from the Cities in allowing for zoning changes and conditional use
permits.
Table 10-6: SR-118 Transit Oriented Development and Non-SOV Supportive Land Use
Responsible Parties City of Moorpark, City of Ventura, Agricultural
employers
Estimated Cost Medium
Estimated Daily VMT Reduction 7,000
Estimated Daily GHG Reduction (grams) 1,808,000
52 (Davalos, 2019)

SCAG TDM Strategic Plan: Potential Application of TDM Toolbox Strategies | Report
111
91 Express Lanes. (2019, April 1). Toll Schedule. Retrieved from 91 Express Lanes:
https://www.91expresslanes.com/toll-schedules/
Air Carrier Activity Information System . (2017). Commercial Service Airports (Rank Order) based
on Calendar Year 2017 Enplanements.
California Legislature. (2016, May 24). California Legislative Information. Retrieved from Assembly
Bill 1746:
https://leginfo.legislature.ca.gov/faces/billNavClient.xhtml?bill_id=201520160AB1746
Caltrans. (2015, June). Transportation Concept Report Route 118 District 7.
Caltrans. (2017, October). State Route 118 Widening Project. CA, Ventura.
Caltrans District 7. (2013). Transportation Concept Report, Interstate 710.
Chiland, E. (2018, October 10). Metro rolls out all-door boarding on Wilshire express bus. Retrieved
from Curbed LA: https://la.curbed.com/2018/10/10/17960768/metro-all-door-bus-
boarding-720-delays
City of Anaheim. (2016, January). Anaheim Canyon Devleoper's Toolkit. Retrieved from
http://www.anaheim.net/DocumentCenter/View/13329/ACSP_DT_Final_9-2016?bidId=
City of Diamond Bar. (1995, July 25). City of Diamond Bar General Plan. Diamond Bar, CA, Los
Angeles.
City of Diamond Bar. (n.d.). Diamond Bar Boulevard Streetscape Project. Retrieved from City of
Diamond Bar: https://www.diamondbarca.gov/462/Diamond-Bar-Boulevard-Streetscape-
Projec
City of Industry. (n.d.). 57/60 Confluence Project. City of Industry, CA, Los Angeles.
City of Placentia. (n.d.). Metrolink Station and Parking Structure. Retrieved from
https://www.placentia.org/705/Metrolink-Station-and-Parking-Structure
City of Ventura. (2018, March 5). Invitation For BId; Bid No. B-130000423. San Buenaventura, CA,
Ventura.
City of Walnut. (n.d.). Transportation. Retrieved from City of Walnut:
http://www.cityofwalnut.org/for-residents/community-resources/transportation
Commission, R. C. (2018). Fiscal Year 2018/2019 Budget. Riverside.
County of Ventura. (2007, October). Ventura Countywide Bicycle Master Plan. CA, Ventura.
11 Bibliography

SCAG TDM Strategic Plan: Potential Application of TDM Toolbox Strategies | Report
112
Davalos, H. (2019, March 28). Creating living spaces for farmworkers. Retrieved from Santa Maria
times: https://santamariatimes.com/opinion/columnists/hazel-davalos-creating-living-
spaces-for-farmworkers/article_9dd80935-2d23-5f4e-8871-
227de33eba0a.html?utm_content=buffer7cc92&utm_medium=social&utm_source=faceb
ook.com&utm_campaign=LEEDCC&fbclid=IwAR2MW_kxQQ
Federal Highway Administration. (2012). Integrating Demand Management into the
Transportation Planning Process: A Desk Reference. Washington, DC.
Foothill Transit. (n.d.). City of Industry Park & Ride. Retrieved from Foothill Transit:
http://foothilltransit.org/lines-and-schedules/park-ride/city-of-industry-park-ride/
Imperial County Transportation Commission. (2014, October). Calexico Intermodal Transportation
Center: Fact Sheet: Feasibility Study of an Intermodal Transportation Center in the City of
Calexico. Retrieved from
http://www.imperialctc.org/media/managed/Calexico_ITC_Feasibility_Study_Final_Factsh
eet.pdf
Imperial County Transportation Commission. (n.d.). CalVans. CA, Imperial.
Imperial County Transportation Commission. (n.d.). Mobility Hub Strategy. CA, Imperial.
John Wayne Airport. (n.d.). Parking Information. Retrieved from John Wayne Airport:
https://www.ocair.com/parking/default
Long Beach Aiport. (2018). Economic Impact. Long Beach.
Los Angeles County Metropolitan Transportation Authority. (2010). 2010 Congestion Management
Program. Los Angeles: Los Angeles County Metropolitan Transportation Authority.
Majestic Realty. (n.d.). The Grand. City of Industry.
Metropolitan Council, UrbanTrans. (2010). Metropolitan Council TDM Evaluation and
Implementation Study. Metropolitan Council.
Mexico News Daily. (2019, March 27). Google's Waze Carpooling Launched Throughout Mexico.
Nelson, L. J. (2019, March 28). Pay $4 to drive to the Westside? Congestion pricing could cut traffic
gridlock. Los Angeles, CA, Los Angeles.
Newton, D. (2018, November 19). Eyes on the Street: Wilshire's Car-Only Bus Lane. Retrieved from
Streets Blog LA: https://la.streetsblog.org/2018/11/19/eyes-on-the-street-wilshires-car-
only-bus-lane/
Ontario International Airport. (2018). Ontario International Airport PAX and Cargo Statistics.
Retrieved from Fly Ontario: https://www.flyontario.com/corporate/statistics
Port of Long Beach. (2017). On Track for Tomorrow. Long Beach: Port of Long Beach.
Richards, G. (2018, December 5). Bay Area may allow buses to drive on freeway shoulders during
heavy commute times. Retrieved from Mercury News:
https://www.mercurynews.com/2018/12/05/bay-area-may-allow-buses-to-drive-on-
freeway-shoulders/

SCAG TDM Strategic Plan: Potential Application of TDM Toolbox Strategies | Report
113
San Bernardino County Transportation Authority . (2017). Financial Report.
San Diego Association of Governments, Imperial County Transportation Commission. (2017,
December). Regional Mobility Hub Implementation Strategy: Mobility Hub Features
Catalog.
San Francisco County Transportation Authority . (2018). TNCs & Congestion: Draft Report. San
Francisco: San Francisco County Transportation Authority.
Santa Ana College. (n.d.). Free OCTA Bus Pass. Retrieved from
https://sac.edu/ContinuingEducation/Pages/Free-OCTA-Bus-Pass.aspx
Scauzillo, S. (2017, November 10). The worst freeway interchange in California is getting fixed...
until the money runs out. Retrieved from San Gabriel Valley Tribune:
https://www.sgvtribune.com/2015/11/10/the-worst-freeway-interchange-in-california-is-
getting-fixed-until-the-money-runs-out/
Southern California Association of Governments. (2016, April). Regional Transportation
Plan/Sustainable Commmunities Study: Transit Goods Movement System. Los Angeles,
CA, Los Angeles.
Southern California Association of Governments. (2016). The 2016-2040 Regional Transportation
Plan/Sustainable Communities Strategy; A Plan for Mobility, Accessibility Sustainability
and a High Quality of Life. Los Angeles: Southern California Association of Governments .
Southern California Association of Governments. (2019, March). Mobility Go Zone & Pricing
Feasibility Study.
Thomas-Patel, P. (2018, December 17). Transportation Management Organization and Waze
Carpool Pilot is a Success. Retrieved from City of Santa Monica:
https://www.santamonica.gov/blog/tmo-and-waze-carpool-pilot-is-a-success
TRIMMS. (n.d.). Home. Retrieved from TRIMMS Trip Reduction Impacts of Mobility Management
Strategies: http://trimms.com/
United States Census Bureau. (2010). 2010 Census.
United States Census Bureau. (2015). Longitudinal Employer-Household Dynamics. United States
Department of Commerce.
United States Department of Veteran's Affairs. (2016, January 28). VA Greater Los Angeles
Healthcare System Draft Master Plan. Los Angeles, CA, Los Angeles.
Unviersity of California at Irvine. (n.d.). Commute by Bus. Retrieved from
https://www.parking.uci.edu/at/modes/octa.cfm
Velasco, J. (2011, December 27). Those living along 60 Freeway have longest commutes in Valley.
Wanek-Libman, M. (2018, August 23). Metrolink SCORE(s) state funds for regional rail
improvements. Retrieved from RT & S: https://www.rtands.com/passenger/commuter-
regional/metrolink-scores-state-funds-for-regional-rail-improvements/

SCAG TDM Strategic Plan: Potential Application of TDM Toolbox Strategies | Report
114
VMT reductions have been calculated using the TRIMMS model, and GHG reductions through the EMFAC model. Both are described in more
detail in the introduction.
Corridor Strategy Commuters Affected
<- Based On TRIMMS Strategies Selected Industry Selected
VMT Reduced (miles)
GHG Reduced (grams)
SR-111 Vanpool Expansion 52,325 Census Longitudinal Employer-Household Data (LEHD): Employment in Imperial County
• Emergency Ride Home provided
• Vanpool subsidies
• Carpool matching services offered
Other services 14,845.4 4,034,659.1
SR-111 Carpool Promotion 52,325 LEHD: Employment in Imperial County
• Carpool matching services offered
Other services 14,835 4,031,832.6
SR-111 Wayfinding 12,475 Volume on corridor during PM peak period
• Access and Travel Time Improvements – Cur. Access: 30 min – New Access: 15 min
• Auto Rideshare
• Public Transport
• Walking
• Cycling
Other services 190,998.4 51,909,239.6
A Appendix A: VMT Calculation Assumptions

SCAG TDM Strategic Plan: Potential Application of TDM Toolbox Strategies | Report
115
SR-111 Mobility Hub/Transit upgrades 12,475 Volume on corridor during peak PM peak period
• Access and Travel Time Improvements – Cur. Access: 30 min – New Access: 20 min
• Public Transport
• Walking
• Cycling
• Bus or train station on site or within ¼ mile
Other services 3,651.5 992,398.8
SR-111 HOV Lanes/Transit upgrades 12,475 Volume on corridor during peak PM peak period
• Access and Travel Time Improvements – Cur. Travel: 60 min – New Travel: 45 min
• Public Transport
• Carpool
• Vanpool
Other services 14,481 3,935,623
10/110 Interchange
TDM Ordinance and Policy Development
23,720 Number of estimated visitors (site-specific information) and employees (LEHD) from:
• Staples Center
• LA Convention Center
• LA Live
• Marriott
• Ritz Carlton
• Residence Inn
• Carpool matching service offered
• Emergency Ride Home provided
• All “Program Marketing” elements
• Financial and Pricing Strategies – Cur. Parking: $0 – New Parking: $5
• Auto: Drive Alone
Food and entertainment
43,223.1 13,199,788.3

SCAG TDM Strategic Plan: Potential Application of TDM Toolbox Strategies | Report
116
10/110 Interchange
Development of TMAs/TMOs 23,720 Number of estimated visitors (site-specific information) and employees (LEHD) from:
• Staples Center
• LA Convention Center
• LA Live
• Marriott
• Ritz Carlton
• Residence Inn
• Carpool matching service offered
• Emergency Ride Home provided
• All “Program Marketing” elements
• Program Subsidies – Carpool – Public Transport – Vanpool – Bike – Walk
• Financial and Pricing Strategies – Cur. Trip: $0.50 – New Trip: $0
• Auto-Rideshare
• Vanpool
• Public Transport
• Cycling
• Walking
Food and entertainment
261,741.5 79,932,545.2
10/110 Interchange
Individualized Marketing 19,683 Number of estimated visitors (site-specific information) from:
• Staples Center
• LA Convention Center
• LA Live
• Marriott
• Ritz Carlton
• Residence Inn
• All “Program Marketing” elements
Food and entertainment
4,455.8 1,360,745.0

SCAG TDM Strategic Plan: Potential Application of TDM Toolbox Strategies | Report
117
10/110 Interchange
Direct Incentives for Non-SOV Travel
19,683 Number of estimated visitors (site-specific information) from:
• Staples Center
• LA Convention Center
• LA Live
• Marriott
• Ritz Carlton Residence Inn
• Program Subsidies – Carpool – Transit – Vanpool – Bike – Walk
• Financial and Pricing Strategies – Cur. Trip: $1 – New Trip: $0
• Auto-Rideshare
• Vanpool
• Public Transport
• Cycling
• Walking
Food and entertainment
24,976.1 7,627,385.2
10/110 Interchange
Various Congestion Pricing Methods
19,683 Number of estimated visitors (site-specific information) from:
• Staples Center
• LA Convention Center
• LA Live
• Marriott
• Ritz Carlton
• Residence Inn
• Financial and Pricing Strategies – Cur. Trip: $0 – New Trip: $5
• Auto Drive alone
– Cur. Parking: $0 – New Parking: $5
Food and entertainment
44,891.3 13,709,235.5

SCAG TDM Strategic Plan: Potential Application of TDM Toolbox Strategies | Report
118
I-710 Development of Employee Commute Programs at Long Beach Municipal Airport
29,000 Number of estimated jobs at Long Beach Municipal Airport
• Flexible working hours offered
• Compressed work week offered
• All “Program Marketing” elements
• Financial and Pricing Strategies – Cur. Parking: $0 – New Parking: $5
• Auto: Drive Alone
Other services 61,087.6 18,655,380.8
I-710 Bike Transit Integration 45,000 Number of estimated people who both live and work in Long Beach (LEHD)
• Bus or train station on site or within ¼ mile
• Access and Travel Time Improvements – Cur. Access: 30 min – New Access: 20 min
• Public Transport
Other services 15,081.8 4,605,791.1
I-710 Individualized Marketing 5,000 Number of estimated households in area of widening project
• All “Program Marketing” elements
Other services 1,354.3 413,586.1
I-710 Parking Pricing 45,000 Number of estimated people who both live and work in Long Beach (LEHD)
• Financial and Pricing Strategies – Cur. Parking: $0 – New Parking: $5
• Auto: Drive Alone
Other services 81,999.9
25,041,732.8

SCAG TDM Strategic Plan: Potential Application of TDM Toolbox Strategies | Report
119
I-710 TDM Ordinance and Policy Development
28,500 New projected jobs by 2040 in by 2016 RTP/SCS, + 18,200 new residents
• Carpool matching service offered
• Emergency Ride Home provided
• All “Program Marketing” elements
• Financial and Pricing Strategies – Cur. Parking: $0 – New Parking: $5
• Auto: Drive Alone
Other services 60,013.5 18,327364.2
SR-57/SR-60 Interchange
Marketing Campaign 86,999 Based on volume of autos and HOV, AM and PM
• Internal snail-mail of promotional material
• Internal promotional email
Other services 25,471.5
7,778,674.1
SR-57/SR-60 Interchange
Alternative Work Schedules 82,888 Number of employees in Diamond Bar, City of Industry and Walnut (LEHD)
• Flexible working hours offered
• Compressed work week offered
Other services 23,816.7 7,273,319.1
SR-57/SR-60 Interchange
Carshare Provision 82,888 Number of employees in Diamond Bar, City of Industry and Walnut (LEHD)
• Vehicle for non-work trips
Other services 23,823 7,275,243.0

SCAG TDM Strategic Plan: Potential Application of TDM Toolbox Strategies | Report
120
SR-57/SR-60 Interchange
TDM Ordinance and Policy Development
82,888 Number of employees in Diamond Bar, City of Industry and Walnut (LEHD)
• Carpool matching service offered
• Emergency Ride Home provided
• All “Program Marketing” elements
• Financial and Pricing Strategies – Cur. Parking: $0 – New Parking: $5
• Auto: Drive Alone
Other services 175,153.2 53,489,573.0
SR-57/SR-60 Interchange
Bicycle and Pedestrian Infrastructure
84,962 Number of estimated residents in Diamond Bar, City of Industry and Walnut
• Bike lanes on site or within ¼ mile
• Dedicated sidewalk onsite
• Access and Travel Time Improvements – Cur. Travel: 45 min – New Travel: 30 min
• Cycling
• Walking
Other services 174,689.2 53,347,873.3
Wilshire Blvd. Shuttle
204,712 Number of employees within 2-mile radius of corridor (LEHD)
• Bus or train station on site or within ¼ mile
Other services 59,964
18,312,247.5
Wilshire Blvd. Telework Program 204,712
Number of employees within 2-mile radius of corridor (LEHD)
• Telework program offered
Other services 60,002.9 18,324,127.1

SCAG TDM Strategic Plan: Potential Application of TDM Toolbox Strategies | Report
121
Wilshire Blvd. Development of TMAs/TMOs 204,712 Number of employees within 2-mile radius of corridor (LEHD)
• Carpool matching service offered
• Emergency Ride Home provided
• All “Program Marketing” elements
• Program Subsidies – Carpool – Public Transport – Vanpool – Bike – Walk
• Financial and Pricing Strategies – Cur. Trip: $0.50 – New Trip: $0
• Auto-Rideshare
• Vanpool
• Public Transport
• Cycling
• Walking
Other services 244,860.9 74,777,148.5
Wilshire Blvd. Bus Lane Development and Enforcement
204,712 Number of employees within 2-mile radius of corridor (LEHD)
• Access and Travel Time Improvements – Cur. Travel: 45 min – New Travel: 30 min
• Public transport
Other services 63,792.6 19,481,453.6

SCAG TDM Strategic Plan: Potential Application of TDM Toolbox Strategies | Report
122
Wilshire Blvd. Micromobility 204,712 Number of employees within 2-mile radius of corridor (LEHD)
• Access and Travel Time Improvements – Cur. Access: 30 min – New Access: 10 min
• Cycling
• Public transport
Other services 10,778 3,291,464.9
SR-55 Development of Employee Commute Programs
28,000 Per the work area profile, Metro Point and the South Coast Plaza have 22,000 -32,000 jobs
• Carpool matching service offered
• Emergency Ride Home provided
• Flexible working hours offered
• Compressed work week offered
• All “Program Marketing” elements
• Financial and Pricing Strategies – Cur. Parking: $0 – New Parking: $5
• Auto: Drive Alone
Other services 58,947 15,629,375.3

SCAG TDM Strategic Plan: Potential Application of TDM Toolbox Strategies | Report
123
SR-55 Development of TMAs/TMOs 88,518
Number of employees in Costa Mesa (LEHD)
• Carpool matching service offered
• Emergency Ride Home provided
• All “Program Marketing” elements
• Program Subsidies – Carpool – Public Transport – Vanpool – Bike – Walk
• Financial and Pricing Strategies – Cur. Trip: $0.50 – New Trip: $0
• Auto-Rideshare
• Vanpool
• Public Transport
Other services 105,381.6 27,941,177.3
SR-55 Dockless/Micromobility/Shared Mobility
88,518
Number of employees in Costa Mesa (LEHD)
• Access and Travel Time Improvements – Cur. Access: 30 min – New Access: 10 min
• Cycling
• Public transport
Other Services 4,664.8 1,236,838.3

SCAG TDM Strategic Plan: Potential Application of TDM Toolbox Strategies | Report
124
SR-55 Bicycle Improvements 7,300 Number of people who both live and work in Costa Mesa (LEHD)
• Access and Travel Time Improvements – Cur. Access: 45min – New Access: 30 min
• Cycling – Cur. Travel: 60 min – New Travel: 45min
• Cycling
Other services 1,963.5 520,608.0
SR-55 Transit Oriented Development 5,200 Estimated new residents in Costa Mesa by 2040
• Encouraging higher densities in residential areas – 15% increase
• Encouraging mixed land-use – 15% increase
• Increasing station accessibility – Cur: .72 miles – New: .25 miles
• Presence of a TOD stop: Yes
Other services 1,813.0 480,704.0
SR-91 Marketing Campaign 75,670 AM peak volume
• Internal snail-mail of promotional material
• Internal promotional email
Other services 21,820 5,785,416.9

SCAG TDM Strategic Plan: Potential Application of TDM Toolbox Strategies | Report
125
SR-91 Telework Program 75,670 AM peak volume • Telework Program Offered
Other services 48,308.1 12,808,547.1
SR-91 Mobility as a Service Provision 75,670 AM peak volume • Bus or train station on site or within ¼ mile
• Vehicle for non-work trips
• Access and Travel Time Improvements – Cur. Access: 30 min – New Access: 10 min
• Auto-Rideshare
• Vanpool
• Public Transport
• Cycling
• Walking
Other services 38,971.2 10,332,934.9
SR-91 Private Transportation/Shuttles 75,670 AM peak volume
• Bus or train station on site or within ¼ mile
Other services 21,649.2 5,740,130.5
SR-91 Transit Improvements 75,670 AM peak volume • Access and Travel Time Improvements – Cur. Access: 60 min – New Access: 30 min
• Public Transport
Other services 21649.2 5,740,130.5

SCAG TDM Strategic Plan: Potential Application of TDM Toolbox Strategies | Report
126
– Cur. Travel: 120 min
– New Travel: 90 min
• Public Transport
I-10 Development of TMAs/TMOs 33,984 Number of students at SBVC, Crafton Hills College, Uni. Of Redlands, Loma Linda Uni., and estimated number of patients at Loma Linda Med. Ctr., Arrowhead Med. Ctr.
• Carpool matching service offered
• Emergency Ride Home provided
• All “Program Marketing” elements
• Program Subsidies – Carpool – Public Transport – Vanpool – Bike – Walk
• Financial and Pricing Strategies – Cur. Trip: $0.50 – New Trip: $0
• Auto-Rideshare
• Vanpool
• Public Transport
Education and health
30,540.8 8,544,094.2
I-10 Development of Employee Commute Programs
30,999 Number of people who work within ¼ of Ontario Airport
• Carpool matching service offered
• Emergency Ride Home provided
• Flexible working hours offered
Other services 1,117.3 312,580.7

SCAG TDM Strategic Plan: Potential Application of TDM Toolbox Strategies | Report
127
• Compressed work week offered
• All “Program Marketing” elements
• Financial and Pricing Strategies – Cur. Parking: $0 – New Parking: $5
• Auto: Drive Alone
I-10 Dockless/Micromobility/New Mobility Programs
15,248 Estimated average daily trips from students, university staff, medical center patients, visitors, staff
• Access and Travel Time Improvements – Cur. Access: 30 min – New Access: 10 min
• Cycling
• Public transport
Education and health services
805.4 225,322.2
I-10 Transit Improvements 15,248 Estimated average daily trips from students, university staff, medical center patients, visitors, staff
• Bus or train station on site or within ¼ mile
• Access and Travel Time Improvements – Cur. Travel: 60 min – New Travel: 30 min
• Public transport
Education and health services
3,853.7 1078127.7
I-10 TDM Ordinance and Policy Developments
117,503 Number of employees within ½ mile radius of corridor (LEHD)
• Carpool matching service offered
• Emergency Ride Home provided
• All “Program Marketing” elements
• Financial and Pricing Strategies
Education and health services
214,116.4 59,901,204.1

SCAG TDM Strategic Plan: Potential Application of TDM Toolbox Strategies | Report
128
– Cur. Parking: $0 – New Parking: $5
• Auto: Drive Alone
I-15 Telecommuting & Remote Services
204,900 ADT on segment 9 of I-15 (SCAG Model)
• Telework program offered
Other services 60,059.2 16,802,420.4
I-15 Mobility as a Service Provision 13,698 Average daily passengers at Ontario Airport
• Carpool matching program offered
• Vehicle for non-work trips
• Access and Travel Time Improvements – Cur. Access: 45min – New Access: 30 min
• Auto-Rideshare
• Vanpool
• Public Transport
• Cycling
Other services 41,820 11,699,743.2
I-15 Development of Employee Commute Program
30,999 Number of people who work within ¼ of Ontario Airport
• Carpool matching service offered
• Emergency Ride Home provided
• Flexible working hours offered
• Compressed work week offered
• All “Program Marketing” elements
Other services 1,117.3 312,580.7
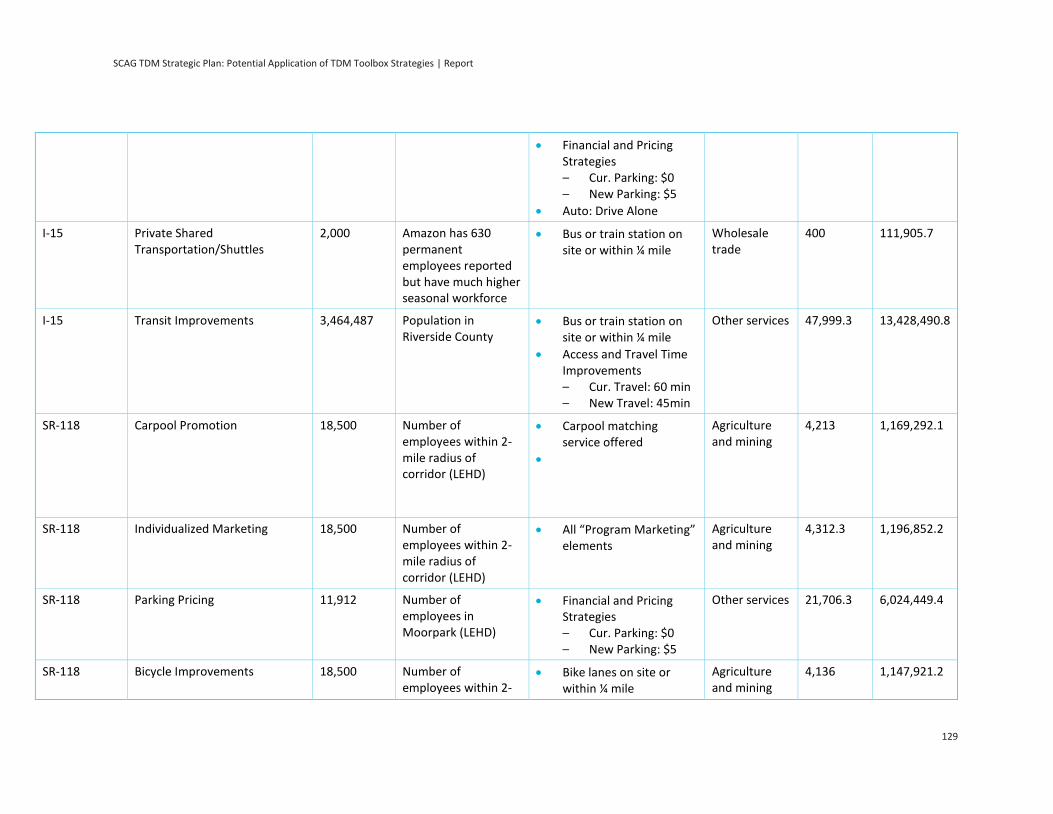
SCAG TDM Strategic Plan: Potential Application of TDM Toolbox Strategies | Report
129
• Financial and Pricing Strategies – Cur. Parking: $0 – New Parking: $5
• Auto: Drive Alone
I-15 Private Shared Transportation/Shuttles
2,000 Amazon has 630 permanent employees reported but have much higher seasonal workforce
• Bus or train station on site or within ¼ mile
Wholesale trade
400 111,905.7
I-15 Transit Improvements 3,464,487 Population in Riverside County
• Bus or train station on site or within ¼ mile
• Access and Travel Time Improvements – Cur. Travel: 60 min – New Travel: 45min
Other services 47,999.3 13,428,490.8
SR-118 Carpool Promotion 18,500 Number of employees within 2-mile radius of corridor (LEHD)
• Carpool matching service offered
•
Agriculture and mining
4,213 1,169,292.1
SR-118 Individualized Marketing 18,500 Number of employees within 2-mile radius of corridor (LEHD)
• All “Program Marketing” elements
Agriculture and mining
4,312.3 1,196,852.2
SR-118 Parking Pricing 11,912 Number of employees in Moorpark (LEHD)
• Financial and Pricing Strategies – Cur. Parking: $0 – New Parking: $5
Other services 21,706.3 6,024,449.4
SR-118 Bicycle Improvements 18,500 Number of employees within 2-
• Bike lanes on site or within ¼ mile
Agriculture and mining
4,136 1,147,921.2

SCAG TDM Strategic Plan: Potential Application of TDM Toolbox Strategies | Report
130
mile radius of corridor (LEHD)
• Access and Travel Time Improvements – Cur. Travel: 270
min – New Travel: 180
min
• Cycling
SR-118 TOD and Non-SOV Supportive Land Use
18,500 Number of employees within 2-mile radius of corridor (LEHD)
• Encouraging higher densities in residential areas – 15% increase
• Encouraging mixed land-use – 15% increase
• Increasing station accessibility – Cur: .72 miles – New: .25 miles
• Presence of a TOD stop: Yes
Agriculture and mining
6,514.2 1,807,976.0
Appendix A:

Control Information
Prepared by Prepared for
Steer 800 Wilshire Blvd, Suite 1320, Los Angeles, CA 90017 USA +1 (213) 425 0990 www.steergroup.com
Southern California Association of Governments 900 Wilshire Blvd. Suite, 1700 Los Angeles, CA 90017
Steer project/proposal number Client contract/project number
23272901 18-C15-01
Author/originator Reviewer/approver
Julia Wean Lisa Buchanan
Other contributors Distribution
Kate Bridges Lisa Buchanan Geoff England
Client: Philip Law Steve Fox Thomas Bellino
Steer:
Version control/issue number Date
Final August 23, 2019

steergroup.com