sbsa: the short and medium term sbsa: the short and medium term media briefing: ... – vtb,...
TRANSCRIPT
SBSA: The short and medium term
Media briefing: 15 March 2011Sim Tshabalala : CEO Standard Bank of South Africa Ltd
1. Refining the Group’s strategy
2
Refinement of strategy
Previous vision
We aspire to be a leading emerging markets financial services organisation
Refined strategy
• To build the leading African financial services organisation using all our competitive advantages to the full
• We will focus on delivering superior sustainable shareholder value by serving the needs of our customers through first-class, on-the-ground, operations in
chosen countries in Africa. We will also connect other selected emerging k Af i d h h l i i i l l
3
markets to Africa and to each other, applying our sector expertise, particularly in natural resources, globally
• Our key differentiator is people who are passionate about our strategy, wherever in the world they are based
Algeria
EgyptLibyaWestern Sahara
Morocco
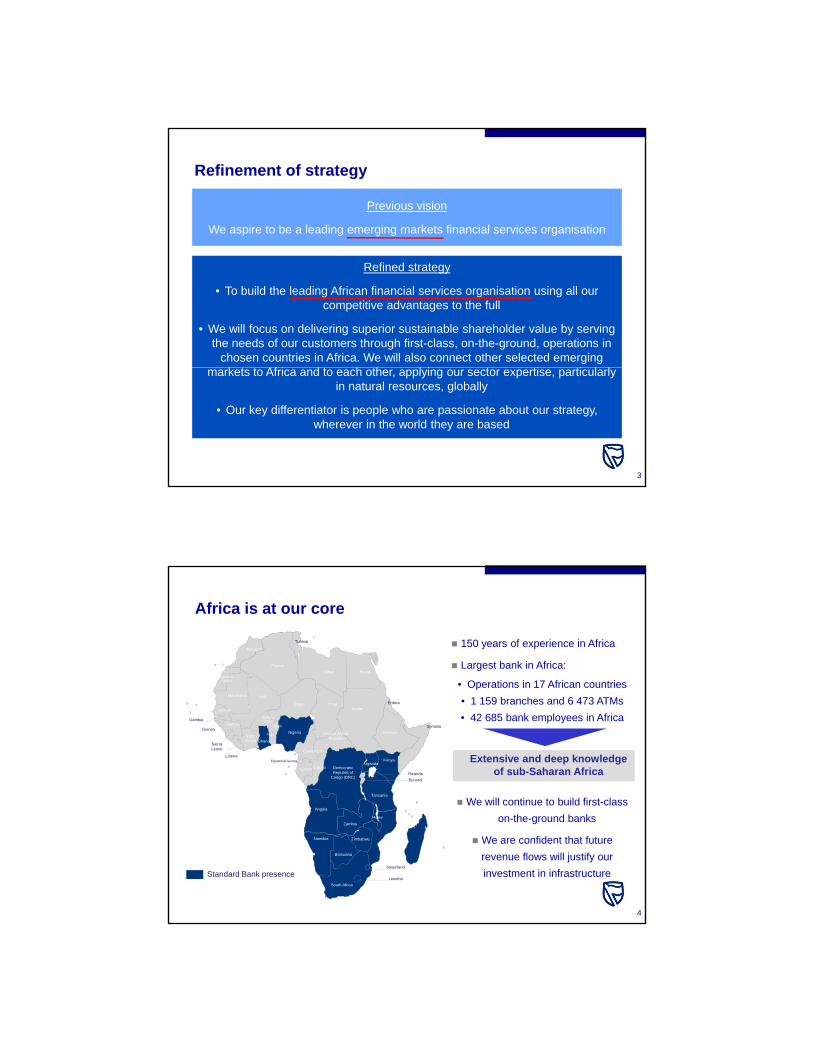
Tunisia 150 years of experience in Africa
Largest bank in Africa:
• Operations in 17 African countries
Africa is at our core
Congo
Central African Republic
ChadNiger
Benin
Togo
Burkina Faso
MaliMauritania
Nigeria
Senegal
Ivory Coast Ghana
Cameroon
Gabon
Gambia
Guinea Bissau
Guinea
Sierra Leone
Liberia Equatorial Guinea
Democratic Republic of
Congo (DRC)
Sudan
Ethiopia
Kenya
Tanzania
Uganda
Rwanda
Burundi
Somalia
Djibouti
Eritrea
Seychelles
Cape Verde
• Operations in 17 African countries
• 1 159 branches and 6 473 ATMs
• 42 685 bank employees in Africa
We will continue to build first-class
Extensive and deep knowledge of sub-Saharan Africa
Madagascar
Botswana
South Africa
Namibia
Zambia
Angola
Mauritius
Mozambique
Lesotho
Malawi
Swaziland
Zimbabwe
We will continue to build first class
on-the-ground banks
We are confident that future
revenue flows will justify our
investment in infrastructureStandard Bank presence
44

South Africa: Our springboard for growth
o South Africa is an emerging market with well developed, leading edge
and highly competitive financial markets
o We have a successful business with exportable and replicable:p p
• Cost effective and efficient systems and infrastructure
• Products and solutions delivered with excellent customer service
• Risk and capital management practices
o Strong balance sheet (even under stricter Basel III rules)
o South Africa is increasingly becoming the springboard for growth into
other parts of Africaother parts of Africa
o Engine room of the group
• Has generated the capital to grow the group
• We earn the right to expand internationally only through achieving
excellence in our home base
5
2. South African Banking 2010 results
6

South African banking operations
FY10Rm
change %
FY09Rm
Total income 39 215 (2) 40 207
Headline earnings 9 271 (1) 9 327Headline earnings 9 271 (1) 9 327
Restructuring costs included above 304
ROE 19.0% 21.4%
7 7
3. Regulatory environment
8

Wave of new international regulations
o Dodd-Frank Act increases regulatory oversight in USA:
o Volcker rule is part of the Dodd-Frank Act
o It stops US commercial banks from proprietary trading, owningo It stops US commercial banks from proprietary trading, owning
hedge funds or private equity entities
o European Banking Authority formed, with ability to override national
authorities in emergency situations
o UK continues to charge special levies on banks
o Basel III will result in higher holdings of capital and liquidity
I d t ti b i th l b llo Increased consumer protection becoming the norm globally
o Regulation of banks deemed “too big to fail”
o Global thinking is manifesting itself in South African policy, laws
and regulation
9
Wave of new South African legislation
o 2011 will see a number of new laws passed, some of which have
unintended negative consequences for banks:
• Companies Act (ability to include symbols in company names p ( y y p y
resulting in expensive system changes)
• Competition Amendment Act (could change the way banks
perform distressed debt work-outs and syndicated loans)
• Consumer Protection Act (potential impact on fixed deposits
through lowering power of fixed term contracts)
• Labour law amendments (could impact our ability to employLabour law amendments (could impact our ability to employ
temporary workers in peak times)
• Expropriation Bill (could impact property rights)
• Protection of Personal Information Bill (UK banks allowed 7
years to implement similar law, but only 1 year allowed in SA)
10

‘A Safer Financial Sector to Serve SA better’
o Released with the National Budget on 23 Feb 2011
o Focused on five policy priorities:
1. Financial stability1. Financial stability
2. Improved market conduct
3. Consumer protection
4. Financial inclusion
5. Combating financial crime
o To strengthen financial stability, we’re adopting the “twin peak” model:
• SARB responsible for macro prudential supervision
• New retail banking market conduct supervisor to report to FSB
o “Twin peak” model used in Australia, Netherlands and Canada
11
The result of global and local trends will be…
o Greater resources allocated to compliance and policy engagement
o Larger capital and liquidity balances held for doing the same business
as before
o Greater emphasis on expanding banking access and lowering fees
o International banks competing more aggressively in South Africa to
supplement lower returns in their home markets
Lower bank profitability globally
o NOTE: Credit Suisse, HSBC and Barclays all lowered long-term ROE
targets in recent results announcements
12
4. The competitive environment
13
It’s a competitive world out there
o Outside South Africa
• Africa and emerging markets becoming more crowded
• Growing number of multi-nationals cherry-picking dealsg y p g
• Range of good domestic banks
• Full-service banks in-country
– VTB, Garanti, Bradesco, Banco Galacia, Zenith, Centenary Bank etc
• Multi-national banks
– Global players competing for CIB deals across EM and Africa
– Regional Pan-African banks include Ecobank, UBA, Kenya Commercial Bank, Standard Chartered, Barclays, Citi
– Absa, Nedbank and FirstRand all compete in Africa
• Capital markets in Africa becoming crowded
14
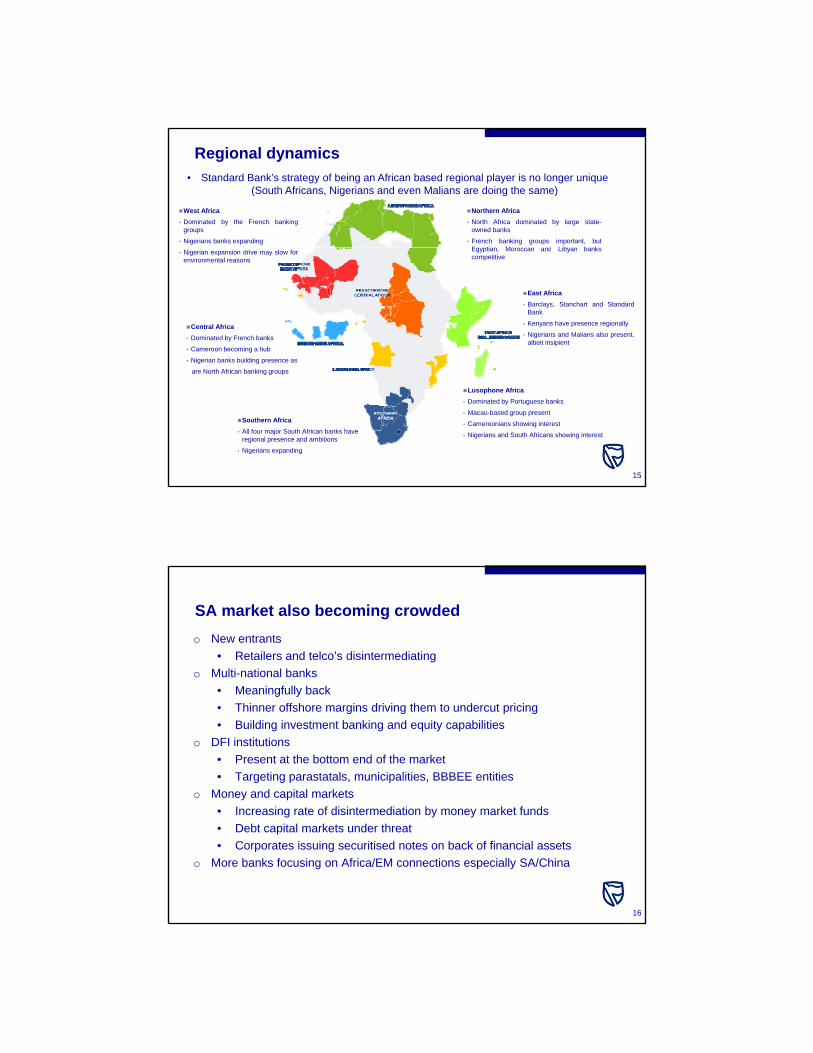
Regional dynamics
• Standard Bank’s strategy of being an African based regional player is no longer unique (South Africans, Nigerians and even Malians are doing the same)
West Africa
• Dominated by the French bankinggroups
• Nigerians banks expanding
Northern Africa
• North Africa dominated by large state-owned banks
• French banking groups important, butE ti M d Lib b k
• Nigerian expansion drive may slow forenvironmental reasons
Central Africa
• Dominated by French banks
• Cameroon becoming a hub
• Nigerian banks building presence as
Egyptian, Moroccan and Libyan bankscompetitive
East Africa
• Barclays, Stanchart and StandardBank
• Kenyans have presence regionally
• Nigerians and Malians also present,albeit insipient
1515
are North African banking groups
Southern Africa
• All four major South African banks haveregional presence and ambitions
• Nigerians expanding
Lusophone Africa
• Dominated by Portuguese banks
• Macau-based group present
• Cameroonians showing interest
• Nigerians and South Africans showing interest
SA market also becoming crowded
o New entrants
• Retailers and telco’s disintermediating
o Multi-national banks
• Meaningfully back
• Thinner offshore margins driving them to undercut pricing
• Building investment banking and equity capabilities
o DFI institutions
• Present at the bottom end of the market
• Targeting parastatals, municipalities, BBBEE entities
o Money and capital markets
• Increasing rate of disintermediation by money market funds
• Debt capital markets under threat
• Corporates issuing securitised notes on back of financial assets
o More banks focusing on Africa/EM connections especially SA/China
16
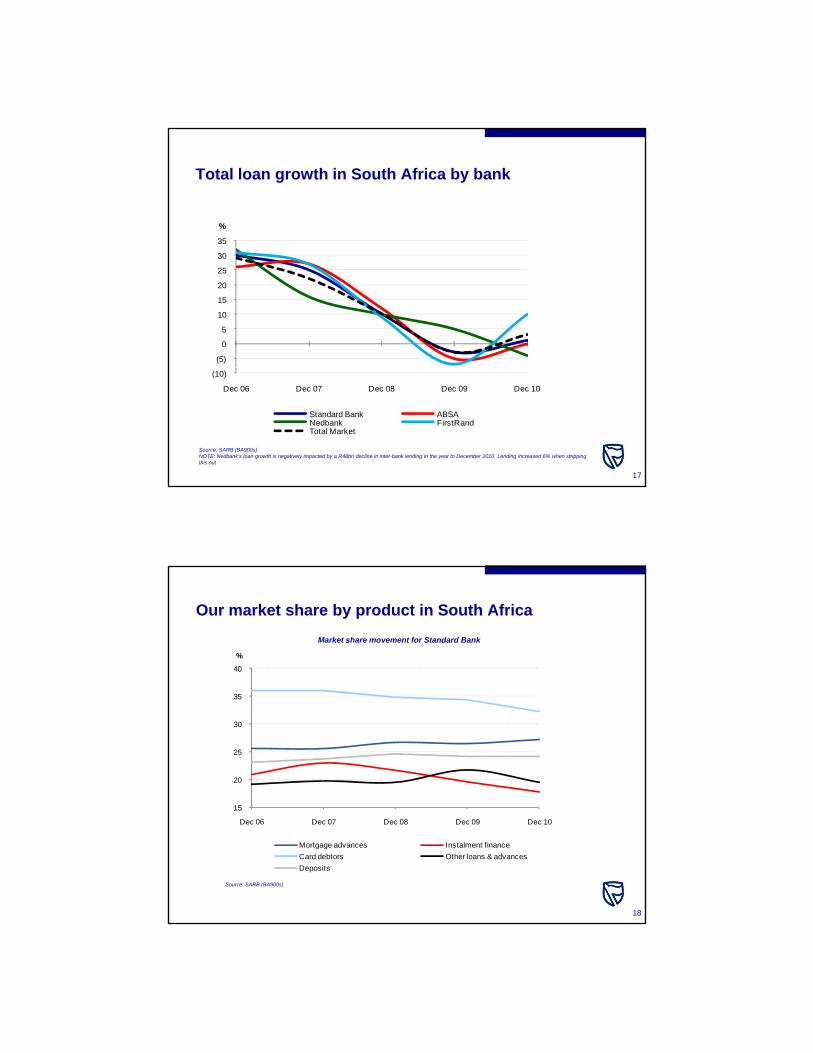
Total loan growth in South Africa by bank
35
%
(5)
0
5
10
15
20
25
30
17
Source: SARB (BA900s) NOTE: Nedbank’s loan growth is negatively impacted by a R48bn decline in inter-bank lending in the year to December 2010. Lending increased 6% when stripping this out
17
(10)
Dec 06 Dec 07 Dec 08 Dec 09 Dec 10
Standard Bank ABSANedbank FirstRandTotal Market
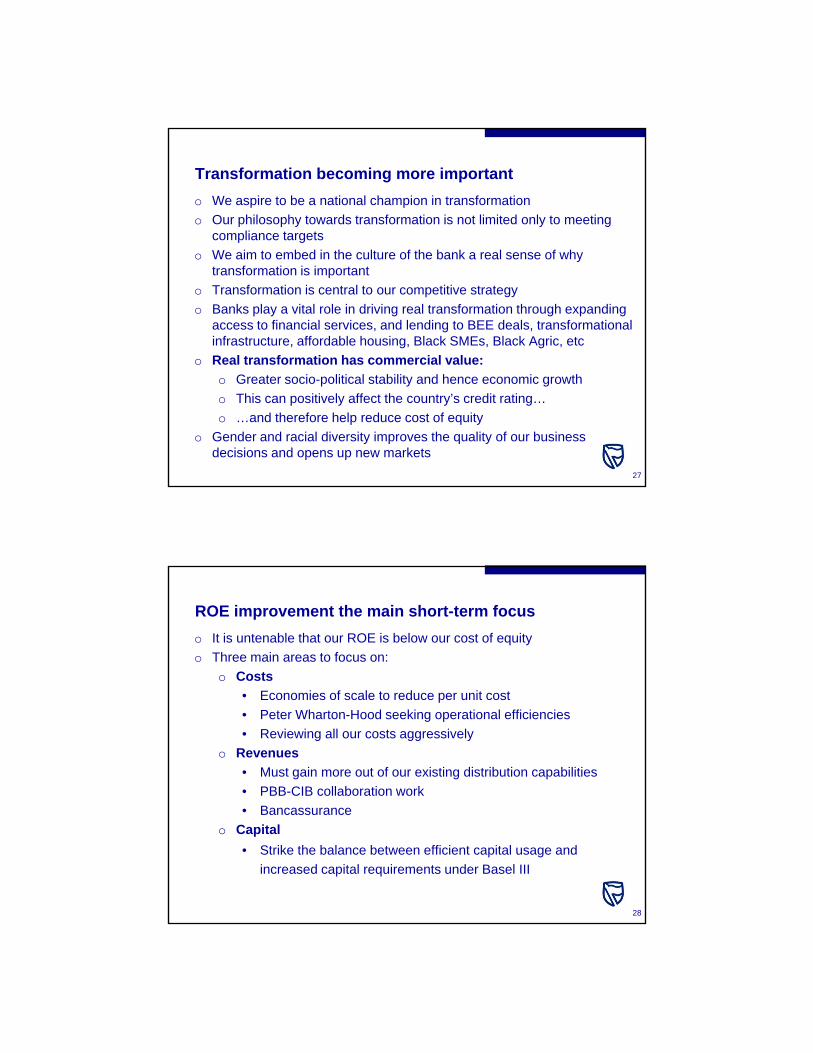
Market share movement for Standard Bank
Our market share by product in South Africa
40
%
20
25
30
35
18
Source: SARB (BA900s)
18
15
Dec 06 Dec 07 Dec 08 Dec 09 Dec 10
Mortgage advances Instalment finance
Card debtors Other loans & advances
Deposits

Banking is a scale and scope business
o One basis for our competitiveness is our sheer size in South Africa:
o Should allow us to extract economies of scale and scope
o A major way to defend against international competition
o Some vital signs in South Africa:
o Total assets of R840.4bn (loans of R536.4bn)
o Total equity of R48.9bn (14.9% Capital Adequacy Ratio)
o Banking Operations’ earnings of R9.3bn
o >30 000 employees servicing c10 million customers
o 705 branches, 5 565 ATMs
#1o #1 market share in numerous categories:
• Total loans
• Total deposits (Retail and Corporate)
• Global Markets (particularly Forex)
• Credit Card lending
• Business Banking19
Total loans and advances market share per South African bank
We are the lending market share leader
24
26%
14
16
18
20
22
24
20
Source: SARB (BA900s)
20
12
Dec 05 Dec 06 Dec 07 Dec 08 Dec 09 Dec 10
Standard Bank ABSA Nedbank FirstRand Other

5. SBSA’s focus in the short and medium term
21
Macroeconomic forecasts: South Africa
2004 2005 2006 2007 2008 2009 2010F 2011F 2012F 2013F
Real GDP growth 4.9% 5.3% 5.6% 5.5% 3.7% ‐1.8% 2.8% 3.7% 4.0% 4.6%
Gross fixed capital formation growth 8.9% 11.0% 12.1% 14.2% 11.7% 2.3% ‐3.6% 6.1% 7.0% 8.4%
Current account balance (% of GDP) ‐3.2% ‐3.5% ‐5.3% ‐7.2% ‐7.1% ‐4.1% ‐3.7% ‐4.7% ‐5.1% ‐5.1%
Source: Standard Bank Group Economics forecasts
Headline inflation (annual average) 1.4% 3.4% 4.6% 7.1% 11.5% 7.1% 4.3% 4.3% 5.3% 6.1%
Prime (year end) 11.0% 10.5% 12.5% 14.5% 15.0% 10.5% 9.0% 9.0% 11.0% 12.0%
Prime (average) 11.3% 10.6% 11.2% 13.1% 15.1% 11.8% 9.9% 9.0% 10.2% 11.9%
R/$ exchange rate (average) 6.43 6.33 6.77 7.05 8.22 8.42 7.31 7.08 7.44 8.24
o Real GDP growth to recover well (medium-term 4-5% potential growth)
o Healthy recovery in Gross Fixed Capital Formation growth
o Inflation to remain relatively benign, despite tailwinds
2222
o Interest rates to pick up marginally, starting only in 2012
o Major risks:
• Sustained increase in oil price
• Rapid capital outflow impacting Balance of Payments and Rand
• European fiscal issues
• Sharp and sustained deleveraging of consumers

South Africa: The growth story
o Global Insight predicts long-term average real GDP growth of 4.5% to 5% through to 2040
o Government and SOEs budgeting for infrastructure spend of more than R800b t 3R800bn over next 3 years
• SA companies should benefit, stimulating corporate lending
o 14% of our exports are to China and India (fast growing economies), and this share is growing. China was our top export country in 2010
o Structurally lower interest and inflation rates expected in future, driving up consumer credit demand (good precedent in developed markets)
o Emerging middle class story remains interesting:g g y g
• Middle income customers (R3.3K-R10.2K per month) have moved from 35% to 55% of population since 2001
• New Growth Path focusing on job creation
• Expanding banking access is opening up new markets, with high demand for credit
23
Total credit and mortgages as a % of GDP
Secured lending is fairly mature in SA…
T i
45%
Hong Kong
ChinaThailand
Korea
Taiwan
Poland
Malaysia
Israel
k
South Africa
Singapore
Hungary
Czech Rep
10%
15%
20%
25%
30%
35%
40%
al m
ort
gag
e le
nd
ing
as
a %
of
GD
P
24
Source: UBS Research
24
Indonesia
MexicoIndia
RussiaPhilippines
Turkey
KazakBrazil0%
5%
0% 20% 40% 60% 80% 100% 120% 140% 160% 180% 200%
Total lending as a % of GDP
To
ta

60%
70%
80%Credit card penetration (% of working population)
…but unsecured lending remains under-penetrated
0%
10%
20%
30%
40%
50%
60%
0%
25
Source: UBS Research
25
Never banked, 33.2%
125
130Secured credit
Unsecured credit
Banking habits of SA adult population
Unbanked opportunity still prevalent
Gross debtors book proportion (based to 100)
Currently banked, 62.5%
Previously banked, 4.3%
90
95
100
105
110
115
120
2009 (Q2) 2009 (Q3) 2009 (Q4) 2010 (Q1) 2010 (Q2)
Source: Finscope Source: National Credit Regulator
2626
o Total unbanked is 12.3 million people
o Unsecured lending increasing as a proportion of total lending
o Currently only 5.4% of total lending
o Includes short-term credit (<6 month lending)
Transformation becoming more important
o We aspire to be a national champion in transformation
o Our philosophy towards transformation is not limited only to meeting compliance targets
o We aim to embed in the culture of the bank a real sense of why transformation is important
o Transformation is central to our competitive strategy
o Banks play a vital role in driving real transformation through expanding access to financial services, and lending to BEE deals, transformational infrastructure, affordable housing, Black SMEs, Black Agric, etc
o Real transformation has commercial value:
o Greater socio-political stability and hence economic growth
o This can positively affect the country’s credit rating…
o …and therefore help reduce cost of equity
o Gender and racial diversity improves the quality of our business decisions and opens up new markets
27
ROE improvement the main short-term focus
o It is untenable that our ROE is below our cost of equity
o Three main areas to focus on:
o Costs
• Economies of scale to reduce per unit cost
• Peter Wharton-Hood seeking operational efficiencies
• Reviewing all our costs aggressively
o Revenues
• Must gain more out of our existing distribution capabilities
• PBB-CIB collaboration work
• Bancassurance
o Capital
• Strike the balance between efficient capital usage and
increased capital requirements under Basel III
28

What will keep SBSA busy in 2011
o Implementing new business architecture and refined strategy
o Big focus on cost-to-income ratio and ROE:
• Helping Group attain the goal of keeping costs flat, while actively seeking revenue opportunities
• More optimal use of capital in South Africa
o Attitude towards transformation aligns with our philosophy
o Ensuring we maintain our premier position by defending against competition, hence giving us the right to execute our geographic diversification
o Ensuring that policy engagement is effectiveo Ensuring that policy engagement is effective
o Keeping customer service at the centre of all we do
o Strict credit focus persists, to realise full benefit of improving cycle
o Greater teamwork amongst business units to compete as one:
• PBB-SA and CIB-SA collaboration efforts
• “One CIB” 29
Corporate and Investment BankingSouth Africa
Focusing on the year ahead
Media briefing: 15 March 2011
Kennedy Bungane: Chief Executive

Abridged income statement and key ratios – FY2010
FY10Rm
change %
FY09Rm
T t l i 10 595 (8) 11 545
o Income and headline earnings weredown 8% and 15% respectively fromprior year. Slowdown in client activity(especially trading) and negativeendowment effect primarily to blame
Total income 10 595 (8) 11 545
Headline earnings 4 422 (15) 5 212
Loans and advances 215 528 (4) 224 258
Return on Equity (%) 30.6 40.2
o Credit impairment chargeso Fell dramatically on bothPerforming Loans and NPLs,with a net benefit booked to theincome statement
o Operating expenseso Up on prior year due toincreased headcount
Th i t d ti f l
31 31
oThe introduction of several newIT applications
o Increased premises costs dueto a new recovery site
Challenging operating environment & our response…..
Global Marketso Market pressures result in:
o decreased client volumeso compressed margins across allo major desks
o Limited trading opportunities:o the Rand’s failure to break out of
Clients
o Heightened focus on client engagements and Business Unit
pipelines to capitalise on limited opportunities
o Integration of TPS products and Corporate Banking Coverage
o Clients executive sponsorship
A call to focus on 3Cs – Clients, Coordination, and Cost
a narrow rangeo stable interest rates
Investment Bankingo Positive signs of recovery:
o increased client activity in thesecond half of 2010
o good performances were seenacross DCM, ECM, StructuredFinance and Advisory
Transactional Products and ServicesS bd d f i 2010
p p
o Leverage off the Standard Bank brand
o Leverage off the CIB product leadership
o Client Service Campaign
Coordination
o Stronger coordination of client service teams
o Streamline internal processes
o Draw synergies from PBB & CIB
o One CIB
Costs
32 32
o Subdued performance in 2010:o increased negative endowmenteffect following MPC rate cuts
o reduction in Current Account andCash Management advancebalances and margins
Costs
o Tight discretionary cost control
o Review of operating structures to extract efficiencies / synergies
o Doing more with less
o Improved management of the CIB SA vs. “CIB in SA” investment
and operational priorities

Some of the landmark transactions completed last year demonstratethe strength of our domestic franchise…..
Standard Bank, in its capacity as Joint Lead Manager successfully raised a US$2bn bond forthe National Treasury of South Africa. This transaction constitutes the largest global bondoffering by the National Treasury to date at the lowest absolute US$ coupon
Standard Bank Group underwrote Aus$800-million and also acted as lead arranger and debtadvisor in Aspen’s acquisition of Sigma’s pharmaceutical division, being one of the largestSouth African debt underwriting deals in more than a year.
Standard Bank was mandated as the sole advisor to ENRC, a leading emerging marketsresources company on the purchase of 12.2% of JSE listed Northam Platinum Limited.
Standard Bank funded R3 billion (€300 million) of perpetual preference shares of Steinhoff International Holdings’ cash acquisition of French furniture retailer Conforama.
Standard Bank helped MTN raise R3.5 billion in the SA market. Acting as joint lead manager,Standard Bank issued R1.5 billion of commercial paper and R2 billion of 5 and 7 year bonds.This represents the largest corporate bond in South Africa.
33
We continue to invest in our franchise in order to improve ourrevenue generating capacity…..
o Formation of the Global Structuring Group
o Establishment of Investment Banking Coverage
o Establishment of SBG Securitieso Establishment of SBG Securities
o Offering settlements in Chinese currency – Renminbi
o Launched Host-to-host system to facilitate the banking needs of
Chinese corporate clients across Africa
o Upgrading of IT platforms
34

Standard Bank continues to be recognised as a leading AfricanInvestment Bank…..
National Treasury of South Africa – Emerging Market Deal of the Year
Best Investment Bank in Africa
Best Bank in South Africa
Best Investment Bank in Nigeria
Best Bank in Africa
Best Bank in South Africa, Lesotho, Malawi, Uganda and Zimbabwe
Best Sub-Custodian in Africa
Best Sub-Custodian in Nigeria
35
Conclusion…..
o Maintain and protect our leading market position by leveraging our
core product and sectoral capabilities
o Continue to operate on an integrated Corporate and Investment p g p
Banking model
o Fiercely compete for limited opportunities to grow our franchise
o Continued investment in our client offering, particularly in Cash
Equities and Commodities platforms
o Increase cost disciple on non-staff costs such as travel &
entertainment and marketingentertainment and marketing
36
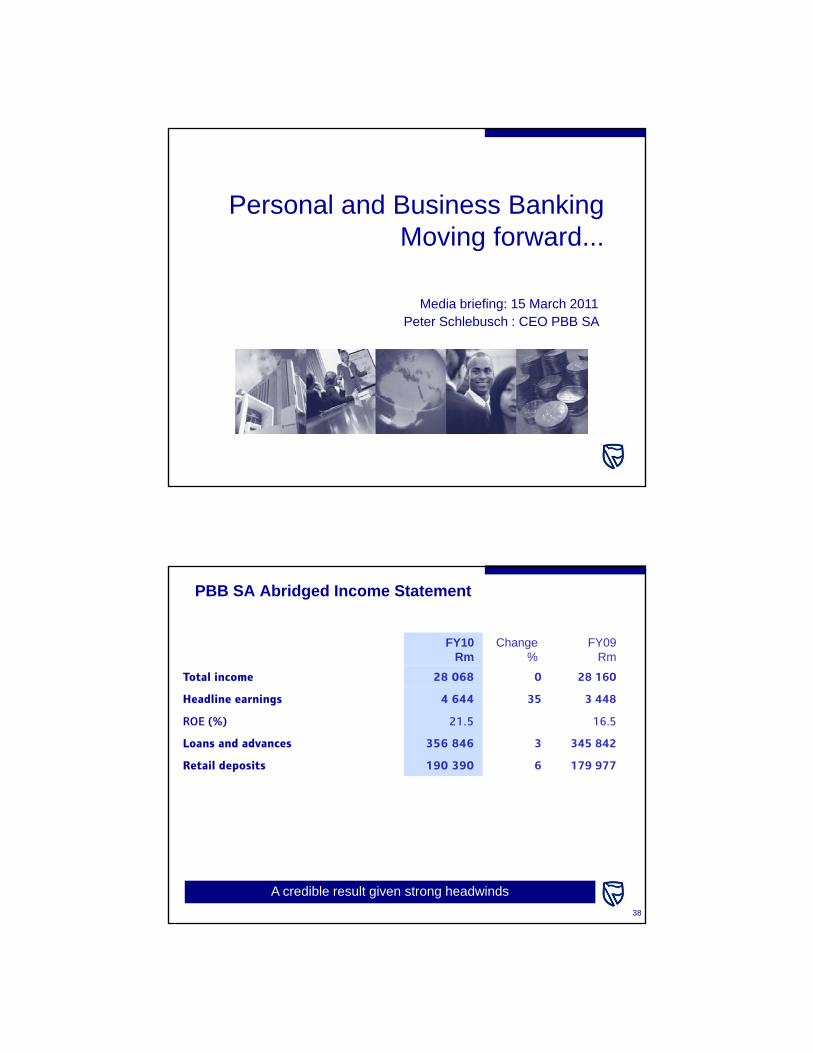
Personal and Business BankingMoving forward...g
Media briefing: 15 March 2011Peter Schlebusch : CEO PBB SA
PBB SA Abridged Income Statement
FY10Rm
Change %
FY09Rm
Total income 28 068 0 28 160
Headline earnings 4 644 35 3 448
ROE (%) 21.5 16.5
Loans and advances 356 846 3 345 842
Retail deposits 190 390 6 179 977
38 38
A credible result given strong headwinds
PBB achievements in 2010
PBB was rated as the #1 bank for customer service in SA 2 years running
(2009 and 2010)
PBB achievements in 2010
SBSA was recognised as the # 1 business bank in South Africa in 2010

New origination in 2010...
‘Core’ relationship
products
Secured lending
Customers
o Business +9%
Unsecured lending Insurance and Asset management
VAF +34% o Multi-product +19%
Evolving customer needs leads to greater opportunity
o Current
Account
+26%
o Youth +19%
o Business +9%
o Personal +52%
Savings & Investments
o Market share leader 26.3%
o Individuals & Unincorporated business
Custom
ers
o VAF +34%
o HL +70%
o Multi product +19%
o HLP+89%
Customers
Year on year growth is encouraging - we are open for business!
p
Managing costs tightly, but investing for future growth...
Opex CAGR 2007 to 2010
= 8.4%
2007 2008 2009 2010
Improving convenience, accessibility and relevance to customers...
o Growth in distribution footprint
o > 1 000 new ATM’s
o 45 new physical points of representation
o > 7 000 bank shops
o ATM & systems uptime exceeding 97%
o Launched a BEE Agri fund of R500m
o Launch of Inclusive Banking
Improving people engagement and moral...
o The retrenchment process was necessary but painful
o Going forward re-engagement and focus are critical
o More than 6 000 managers have been through our road shows detailing a clear vision
2010 has been a tough year but there are definite improvements....
o More than 6 000 managers have been through our road shows detailing a clear vision
for the future (vision 2015) and 2011 plans
o While we are happy engagement is improving we still have significant work to do

Inclusive Banking
o Financial inclusion and increasing participation in the economy is a key responsibility of
SBSA
o Specific use of technology to reduce costs for customers and for the bank
o Almost 8 000 bankshops deployed
Making banking accessible to all
o >1 000 full service
o >6 000 value added (airtime and money transfers)
o >47 loan centres
o Spar/MiMoney remittances
o Mobile Banking account – cost effective way to transact
o Customer education focus (Winning Teams board game, assisted self-service)
Inclusive Banking
Mobile Banking accounts opened
Loan accept rates New loan disbursements
Ja
n-0
9
Fe
b-0
9
Ma
r-0
9
Ap
r-0
9M
ay
-09
Ju
n-0
9
Ju
l-0
9
Au
g-0
9S
ep
-09
Oc
t-0
9
No
v-0
9D
ec
-09
Ja
n-1
0
Fe
b-1
0
Ma
r-1
0A
pr-
10
Ma
y-1
0
Ju
n-1
0
Ju
l-1
0A
ug
-10
Se
p-1
0
Oc
t-1
0
No
v-1
0D
ec
-10
Ja
n-1
1
Fe
b-1
1 Aug-10 Sep-10 Oct-10 Nov-10 Dec-10 Jan-11 Feb-11 Mar-11 Feb-10 Mar-10 Apr-10 May-10 Jun-10 Jul-10 Aug-10 Sep-10 Oct-10 Nov-10 Dec-10 Jan-11 Feb-11
>370% year on year
growth
Steadily increasing
accept rates
>200% increase in
disbursements

Prospects
o Determined, enthusiastic and committed management team
o We are budgeting for good growth and ROE’s
o Continued improvement in impairments
o Well positioned to meet customer needs off excellent service
2011 for PBB
platform and main bank sales
o Improving risk appetite
o Continued growth in lending portfolios
o Inclusive Banking strategy – affordable, convenient and
accessible banking
Risks on the horizon
o Inflationary pressures and decreases in personal disposable
income
o Basel III, particularly liquidity requirements
o Fragile world economic growth
o SA employment and economic growth
o Increased regulation and compliance costs
Sim Tshabalala - Concluding Remarks
o The Group’s results were disappointing, as discussed at our results presentation
What does all this mean?
presentation
o South African banking operations are still 82% of Group earnings, so are vitally important to us
o We did reasonably well in the South African banking operations
o We are not taking our eye off the ball here
o The South African market is getting more competitive, but we are competing hard
o We remain the biggest player in the domestic market
o South Africa is not ex-growth – there are numerous growth opportunities here that we aim to tap into
48

Questions ?