sbp working paper series
TRANSCRIPT
STATE BANK OF PAKISTAN
April, 2016 No. 75
M. Ali Choudhary,
Saima Naeem
Gylfi Zoega
Informal Labour Markets in Pakistan
SBP Working Paper Series
SBP Working Paper Series
Editor: Dr. Muhammad Nadim Hanif
The objective of the SBP Working Paper Series is to stimulate and generate discussions on different
aspects of macroeconomic issues among the staff members of the State Bank of Pakistan. Papers
published in this series are subject to intense internal review process. The views expressed in these papers
are those of the author(s) not State Bank of Pakistan.
© State Bank of Pakistan.
Price per Working Paper (print form)
Pakistan: Rs 50 (inclusive of postage)
Foreign: US$ 20 (inclusive of postage)
Purchase orders, accompanied with cheques/drafts drawn in favour of State Bank of Pakistan, should be
sent to:
Chief Spokesperson,
External Relations Department,
State Bank of Pakistan,
I.I. Chundrigar Road, P.O. Box No. 4456,
Karachi 74000. Pakistan.
Soft copy is downloadable for free from SBP website: http://www.sbp.org.pk
For all other correspondence:
Postal: Editor,
SBP Working Paper Series,
Research Department,
State Bank of Pakistan,
I.I. Chundrigar Road, P.O. Box No. 4456,
Karachi 74000. Pakistan.
Email: [email protected]
ISSN 1997-3802 (Print)
ISSN 1997-3810 (Online)
Published by State Bank of Pakistan, Karachi, Pakistan.
Printed at the SBP BSC (Bank) – Printing Press, Karachi, Pakistan.
-1-
Informal Labour Markets in Pakistan
M. Ali Choudharya, Saima Naeem
a and Gylfi Zoega
b,c
a Research Department, State Bank of Pakistan, I.I. Chundrigar Road, Karachi 74000, Pakistan (e-mail:
[email protected] and [email protected])
b Department of Economics, University of Iceland, 101 Reykjavik, Iceland
c Birkbeck College, University of London, Malet Street, London WC1E 7HX ([email protected])
Abstract
This paper describes the results of a survey of informal-sector firms in Pakistan. Firms belong to the
informal sector mainly because of scarce financial resources. There are significant differences in the
level of wages and the flexibility of wages with the informal sector having both lower wages and greater
flexibility than the formal sector. While minimum wages are less binding in the informal sector, a sort
of indexation of wages to inflation is more common. In spite of these differences the reasons for not
cutting wages in a recession are similar between the two sectors.
JEL Classification: E24, E26, J31, J46
Keywords: Informal sector, wage setting, wage rigidity.
Acknowledgment
We thank the Editor, the referees, and Nooman Majid for their valuable comments on the survey. We
would also like to thank FPCCI, Chambers of Commerce of Karachi and Lahore. We would also like to
acknowledge the field work of enumerators of Bureau of Statistics (BOS) Punjab and BOS Sindh with
special appreciation for Shamim Rafique and Sajid Rasool from BOS Punjab and Manzoor Ahmed
Memon and Qazi Masood from BOS Sindh (currently with IBA). This project was possible only due to
efforts and support of researchers at the State Bank of Pakistan including Hassan Abbas, Waqas
Ahmad, Amjad Ali, Javaid Iqbal, Nadim Hanif, Abdul Faheem, Shahid Hussain Javaid, Sajawal Khan,
Farooq Pasha and Amna Saeed, a team of translators (Suhail Anjum, Alia Atta Karim, Mansoor Ahmed,
Shujat Ali), and Zeeshan Suleman.
Contact for correspondence:
M. Ali Choudhary,
Director, Research Department,
State Bank of Pakistan,
I.I. Chundrigar Road,
Karachi – 74000, Pakistan.
Email: [email protected]
-2-
Non-technical summary
By surveying 960 informal-sector manufacturing firms in Pakistan we explored the wage-setting behaviour
in the informal labour market in the country and compared it with wage setting in the formal sector. The
results can be summarised as follows.
1. Low-wage informal sector
47.6% of firm in the informal sector pay workers below the minimum wage, while only 17.5% of the formal
sector pays below the minimum wage. Wage differentials between formal and informal sectors are
especially pronounced for white collar workers.
2. Sticky informal sector employment and occupations
64.3% of respondents were involved in the same or similar business in the past, while 19.5% moved from
other businesses. In a similar vein, employment history suggests that 92.9% of the respondents were
previously working in the informal.
3. Wage setting without rules
Wage duration in the informal sector is lower; 9.6 versus 13.1 months in the informal and the formal sector
respectively. There is a weaker pattern in wage-setting; 73.5 per cent versus 18.1 per cent of firms having
no pattern for wage-setting in the informal and the formal sector respectively. Informal sector firms rely
more on state dependent rules, 24.4 per cent relative to 6.8 per cent in the formal sector.
4. Indexation to inflation
47.7 % of informal sector firms say that wages are indexed, while only 30% in the formal sector say that
wages inflation-indexed. In particular, past inflation and not future inflation or productivity matter
wage-setting. Inflation is an important anchor in wage negotiation in the informal labour market, both in
terms of frequency.
5. Minimum wages not binding
In contrast to formal sector, minimum wages are less important and non-binding in informal sector. The
minimum wage was among the five least important factors for wage adjustments in the informal sector.
6. Wage rigidity for same reason
Similar reasons are found for not cutting wages in a depression between sectors. The most important
reasons for wage rigidity are: (i) adverse selection (the fear of losing better workers), (ii) efficiency wage
theory (outside options to workers appearing more attractive and (iii) workers’ morale (gift exchange: a
type of goodwill investment on workers).
7. Frequent wage changes
Informal sector firms have higher frequency of wages changes in both directions relative to formal sector
firms and the frequencies are lower than a year.
-3-
8. Main reason for Informality
Informal sector firms list financial constraints as one of the most important reasons for staying in the
informal sector. This implies that their ability to absorb shocks is limited, as clearly seen in their lower life
expectancy (median age of sampled formal sector firms is 19 years while that of the informal sector firms is
median 12 years).
-4-
1. Introduction
It is striking that most research in labour economics is focused on the developed economies while most
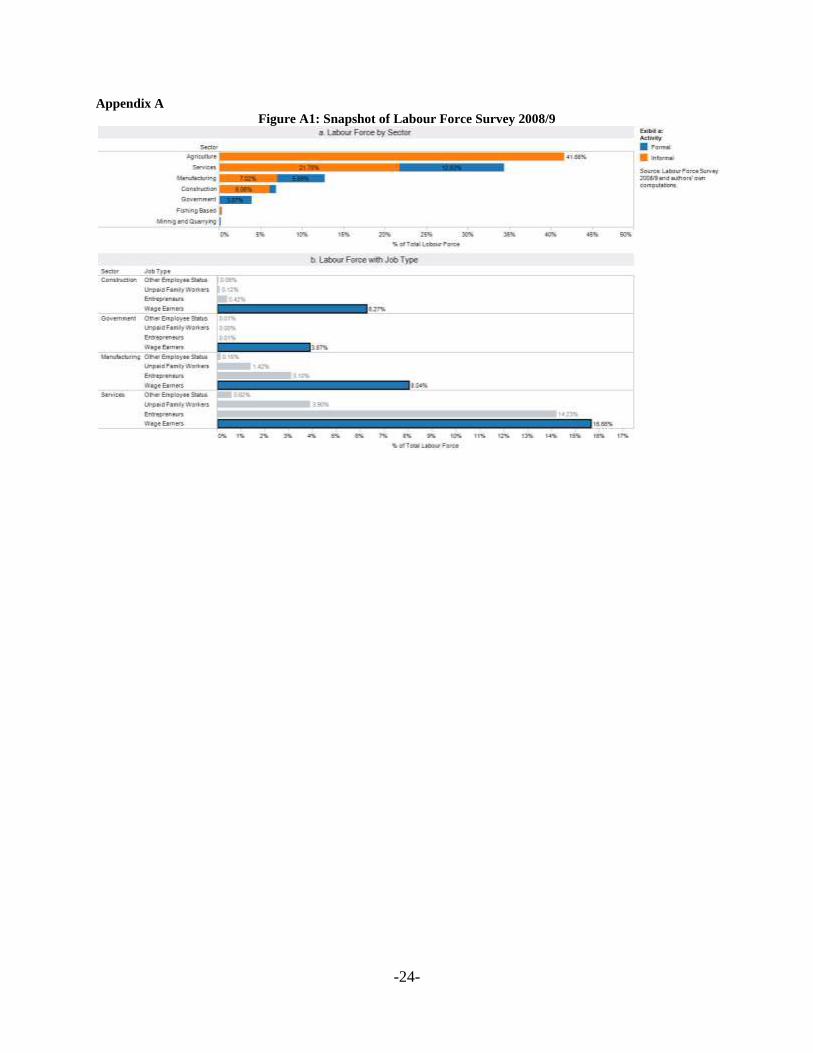
workers in the world economy are employed in the informal labour markets in developing countries. The
objective of this paper is to help bridge this gap by exploring wage-setting behaviour in the informal labour
market in Pakistan and to compare it with wage setting in the formal sector.1 Pakistan is ideally suited to the
study of the informal labour market. The informal sector employment accounts for 76.43 per cent of the
labour force, while 73.8 per cent of the non-agricultural labour force is employed in the informal market
(see Figure A1 in Appendix A). The informal sector is therefore the largest source of total employment.
The informal economy in Pakistanis is comprised of small firms that are allowed to stay unregistered by the
government while operating within the law in contrast to the underground economy and the illegal
economy.2 We define the informal sector as consisting of firms that employ less than ten paid employees.
The Pakistan Bureau of Statistics has defined the informal economy as consisting of household enterprises
employing less than ten persons and also including all agricultural activities. Instead of using those criteria
we take the informal sector as consisting of enterprises operated by single individuals or households that are
not separate legal entities from their owners and employ less than ten paid workers. These include “family
units” (those operated by nonprofessional with or without contributing family workers) and/or
“micro-enterprises” (productive units with no more than nine employees).3 The main reason for choosing
ten workers as a threshold in our wage setting survey is that we wanted to study the wage setting behaviour
of firms with at least some kind of paid work force while controlling for membership of the informal sector
by ensuring that a firm is not registered as a legal entity.4
We will show how the informal sector differs from the formal one in many respects while also showing
some similarities. Limited access to capital markets, credit constraints, higher failure rates, lower wages,
more frequent wage setting and the irrelevance of the minimum wage set the two sectors apart while they
share reservations about cutting wages in a recession out of fear of losing the best workers or seeing effort
slide. In essence the informal sector has firms that are more sensitive to shocks employing workers with
little bargaining power or protection by the state.
1 See Ahmed et al. (2014) on wage setting in the formal sector in Pakistan.
2 The labour market can broadly be split into (i) the formal economy consisting of registered firms with businesses
that comply with laws and regulations, (ii) the informal economy that comprises micro-house based firms that are
allowed to be unregistered but operating within the law, (iii) the underground economy, where firms produce legal
output but choose to remain unregistered mostly to avoid taxes, and lastly (iv) the illegal economy that produces illegal
output in addition to remaining unregistered and avoiding taxes. 3 Enumerators in our sample surveyed roughly 2 per cent of firms with more than nine paid workers. We do not
exclude these firms from our analysis since that these are not registered firms. 4 There is an underground sector in Pakistan that includes firms that may have more than ten employees and are not
registered anywhere; also there might be registered firms that are partially informal in order to keep a fraction of their
workers and/or sales hidden from government regulators, and/or fail to comply with at least some government
regulations. These firms are not included in our survey. There are also firms that might underreport their workforce to
avoid being registered, so there might be many firms in our study that might actually have ten or more employees and
underreport their workers to our enumerators.
-5-
2. Survey Design
Our survey covers 960 informal-sector manufacturing firms and also draws on past surveys of wage- and
price setting in the formal sector as a comparison.5 The design of the survey is based on Druant et al.
(2012), while the comparison is made with Ahmed et al. (2014) with some modification to suit the
particularities of the informal sector. We included sections for profiling firms and proprietors, while the
main survey covers a wide range of characteristics including employment size, remunerative decisions, cost
minimizing strategies and linkages to the formal sector. We also queried about reasons for the firms
belonging to the informal sector.
The survey sample consists of informal sector manufacturing firms in Punjab and Sindh6 and took place
between January - February 2011 and between October 2012 - January 2013, respectively, in collaboration
with the statistical agencies of Pakistan.7,8 For the province of Punjab, we found that the Small and Medium
Enterprises Development Authority (SMEDA) maintains a data base on small and medium enterprises
(SMEs) in Punjab province, although they included many medium-sized registered firms as well.9 For the
purpose of our survey we only include enterprises with less than ten employees.10 Another benefit of using
the SMEDA frame is that, as in the formal sector sampling frame such as the Census of Manufacturing
Industries (CMI), these firms are categorized as per International Standard Industrial Classification (ISIC).
From this survey we have selected a sample of 500 informal-sector firms stratified over the subsectors
within manufacturing using the Pakistan Standard Industrial Classification(PSIC) classification (code 15 to
36, excluding 30).11 Unfortunately, SMEDA did not maintain such extensive firm listing for Sindh. After
exploring many other options we were left with no other choice than to select a non-probability sample.
However, we went through internal exercises to ensure adequate geographical, size and sector
representations.12 To verify the extent of sample representativeness of the population of industries within
5 Survey results for the price and wage setting behaviour of formal sector firms are presented in Choudhary et al.
(2011) and Ahmed et al. (2014) respectively. 6 Two other provinces i.e. Khyber PakhtunKhuwa and Baluchistan were not selected for security reasons.
7 The interviewers were very experienced and were provided with specialized training, both theoretical and practical.
In addition, economists from the Central Bank randomly audited 10% of live interviews for quality assurance of the
interviewing process. 8 The process of selecting an informal sector sample with adequate sub-sector representation is not an easy task
because most of these small firms are not registered and have no proper record register by law. A few agencies do
maintain some sort of registers for details on small firms. However, the lack of coordination among these agencies
usually makes it difficult to find an appropriate sampling frame for the informal sector firms. 9This is a public sector institution that helps to develop small and medium enterprises by facilitating business
development through seminars, workshops and training programmes. SMEDA Punjab regularly prepares profiles of
different industrial clusters in Punjab. These profiles provide basic information on the history and background of
clusters, core cluster actors, current scenario of cluster, and the analysis of business operations, institutional setups,
issues and problems and potential businesses in particular cluster. 10
Around 220,000 firms are included in their database, while short listing of firms as per our definition resulted in
around 207,000 firms remaining in our frame. 11
The activities are: 15-(food products & beverages), 16-(tobacco products), 17-(manufacture of textiles),
18-(wearing apparel), 19-(leather products), 20-(wood & wood products), 21-(paper & paper products),
22-(publishing, printing & reproduction), 23-(petroleum), 24-(chemicals & chemical products), 25-(rubber & plastics
products), 26-(other non-metallic mineral products), 27-(basic metals), 28-(fabricated metal products), 29-(machinery
& equipment N.E.C.), 31-(electrical machinery & apparatus N.E.C.), 32-(radio, TV & communication equipment),
33-(medical & optical instruments), 34-(motor vehicles & trailers), 35-(other transport equipment), 36-(furniture). 12
There is a possibility of over-representation of very small enterprises (three or fewer employees) due to their
abundance. Also not controlling for geography might result in the overrepresentation of certain localities. Surveyors
-6-
the manufacturing sector, we compared the sector-wise distribution of own-account workers´ category in
the manufacturing sector of Punjab from Labour Force Survey (LFS) with SMEDA's Punjab sample. The
distribution turned out to be similar.13 This exercise increased our confidence in using Sindh’s distribution
of own account workers from LFS for the industry representation of Sindh. We resorted to this
approximation because, as explained earlier, in Sindh no frame was available and this move helped us avoid
over representation of easily searchable industries. In addition, we also utilised many other sources of
information to find geographical details such as: Sindh Employees' Social Security Institution (SESSI),
newspapers, knowledge of local enumerators as well other informal firms. The sample for Sindh includes
350 private informal enterprises.14
We will compare the informal sector to its formal sector counterpart. A description of the formal
manufacturing sector sample is included in Ahmed et al. (2014) and Choudhary et al. (2011). We describe
the sample here only briefly. The survey was carried out in Punjab and Sindh between December
2009-March 2010 and June 2010-October 2011 respectively for 1025 formal sector firms in the
manufacturing sector.15 The manufacturing sample was based on the data registers maintained by the
Bureau of Statistics of Punjab and Bureau of Statistics of Sindh for a census of manufacturing industries
(CMI).16 We selected a stratified random sample based on economic activity (subeconomic activities in
manufacturing) and firm size (small, medium and large).17 The survey was designed to obtain answers with
respect to the main occupational group of permanent employees divided into three broad categories: white
collar, skilled blue collar, skilled worker and unskilled blue collar workers.
3. Characteristics of Firms and Their Owners
The firms in our informal-sector sample have on average of 5.1 workers, out of which there is on average
only one working proprietor (1.1 average) and every other firm has one unpaid family member (0.61
average).18 Firms that have paid employees have on average 3.6 regular employees. Note that we omit all
surveyed firms that do not have any paid workers when analysing wage setting, but we include these while
describing the characteristics of the informal-sector firms. Younger firms are more likely to belong to the
informal sector while older firms are more likely to belong to the formal sector reflecting stability of
business activity. Formal-sector small firms are more profitable and micro-firms created in the informal
sector may eventually face the decision to remain at a certain size or move to the formal sector to extend the
scale of production (Di Giannatale et al. (2013)).19
were instructed not to select too many firms within one locality or sector. 13
The distribution of economic activities remains quite similar except for two economic activities; the correlation of
sector-wise distribution after omitting the two outliers is 0.7. 14
Family businesses with no paid workforce were omitted from the study of wage-setting behaviour and replaced by
firms in the same type of economic activity having fewer than ten paid workers. This explains why the observations
on firm and proprietor’s profiles are 960 while surveys on wage-setting behaviour include only 850 firms. 15
The provinces of Khyber Pakhtun-khuwa and Baluchistan are also missing from this survey due to security reason. 16
The manufacturing sample covers firms with economic activity codes from 15 to 36 (excluding 30) according to the
Pakistan Standard Industrial Classification (PSIC). 17
Firm size in manufacturing industry was defined on the basis of employment; firms in the manufacturing sector
were split into three categories: 10- 50, 51-250 and more than 250 employees as small, medium and large firms
respectively. We are comparing only manufacturing sectors for both the formal and the informal sector. 18
See questionnaire in Appendix B. 19
Ingram et al. (2007) show that for Africa, 50 per cent of informal-sector firms are less than ten years old suggesting
that either informal firms tend to fail within the first ten years or join the formal sector.
-7-
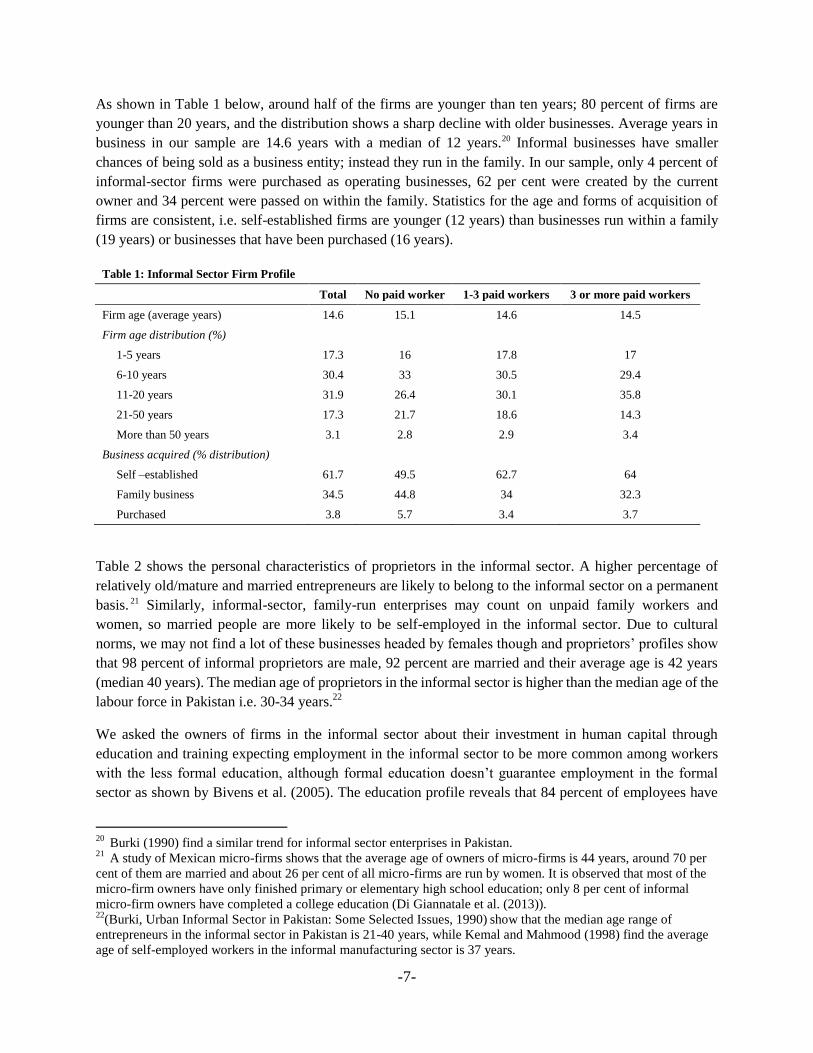
As shown in Table 1 below, around half of the firms are younger than ten years; 80 percent of firms are
younger than 20 years, and the distribution shows a sharp decline with older businesses. Average years in
business in our sample are 14.6 years with a median of 12 years.20 Informal businesses have smaller
chances of being sold as a business entity; instead they run in the family. In our sample, only 4 percent of
informal-sector firms were purchased as operating businesses, 62 per cent were created by the current
owner and 34 percent were passed on within the family. Statistics for the age and forms of acquisition of
firms are consistent, i.e. self-established firms are younger (12 years) than businesses run within a family
(19 years) or businesses that have been purchased (16 years).
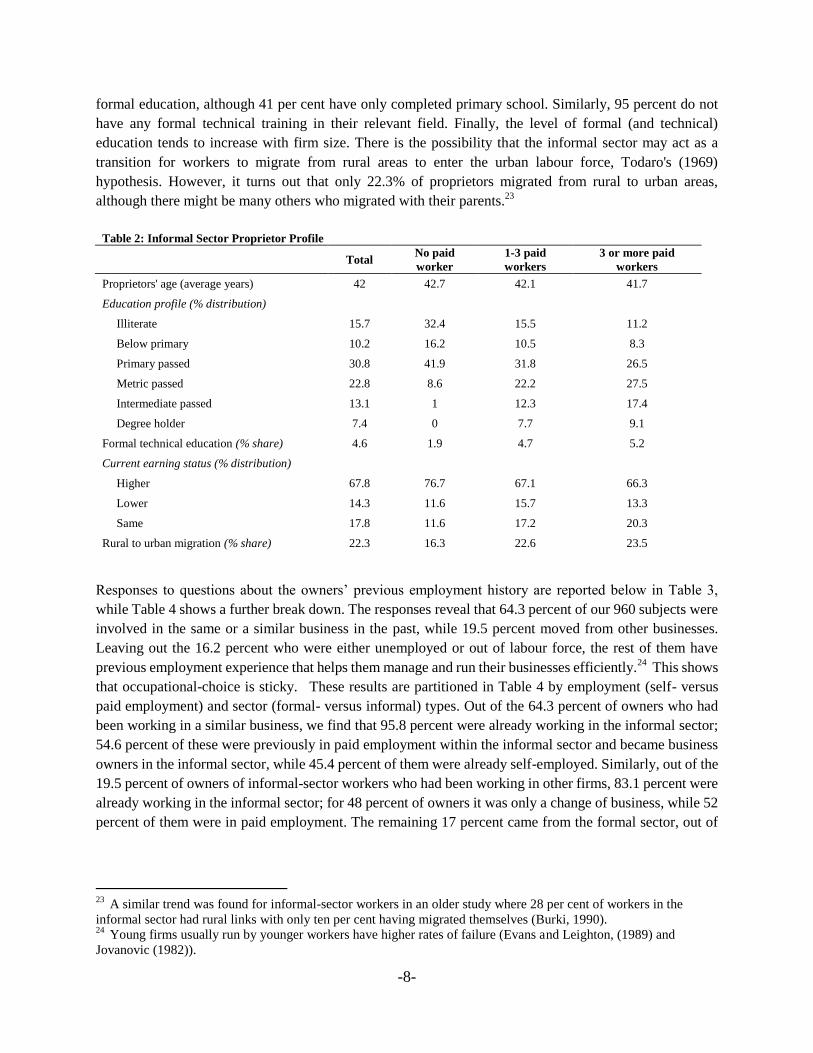
Table 2 shows the personal characteristics of proprietors in the informal sector. A higher percentage of
relatively old/mature and married entrepreneurs are likely to belong to the informal sector on a permanent
basis. 21 Similarly, informal-sector, family-run enterprises may count on unpaid family workers and
women, so married people are more likely to be self-employed in the informal sector. Due to cultural
norms, we may not find a lot of these businesses headed by females though and proprietors’ profiles show
that 98 percent of informal proprietors are male, 92 percent are married and their average age is 42 years
(median 40 years). The median age of proprietors in the informal sector is higher than the median age of the
labour force in Pakistan i.e. 30-34 years.22
We asked the owners of firms in the informal sector about their investment in human capital through
education and training expecting employment in the informal sector to be more common among workers
with the less formal education, although formal education doesn’t guarantee employment in the formal
sector as shown by Bivens et al. (2005). The education profile reveals that 84 percent of employees have
20
Burki (1990) find a similar trend for informal sector enterprises in Pakistan. 21
A study of Mexican micro-firms shows that the average age of owners of micro-firms is 44 years, around 70 per
cent of them are married and about 26 per cent of all micro-firms are run by women. It is observed that most of the
micro-firm owners have only finished primary or elementary high school education; only 8 per cent of informal
micro-firm owners have completed a college education (Di Giannatale et al. (2013)). 22
(Burki, Urban Informal Sector in Pakistan: Some Selected Issues, 1990) show that the median age range of
entrepreneurs in the informal sector in Pakistan is 21-40 years, while Kemal and Mahmood (1998) find the average
age of self-employed workers in the informal manufacturing sector is 37 years.
Table 1: Informal Sector Firm Profile
Total No paid worker 1-3 paid workers 3 or more paid workers
Firm age (average years) 14.6 15.1 14.6 14.5
Firm age distribution (%)
1-5 years 17.3 16 17.8 17
6-10 years 30.4 33 30.5 29.4
11-20 years 31.9 26.4 30.1 35.8
21-50 years 17.3 21.7 18.6 14.3
More than 50 years 3.1 2.8 2.9 3.4
Business acquired (% distribution)
Self –established 61.7 49.5 62.7 64
Family business 34.5 44.8 34 32.3
Purchased 3.8 5.7 3.4 3.7
-8-
formal education, although 41 per cent have only completed primary school. Similarly, 95 percent do not
have any formal technical training in their relevant field. Finally, the level of formal (and technical)
education tends to increase with firm size. There is the possibility that the informal sector may act as a
transition for workers to migrate from rural areas to enter the urban labour force, Todaro's (1969)
hypothesis. However, it turns out that only 22.3% of proprietors migrated from rural to urban areas,
although there might be many others who migrated with their parents.23
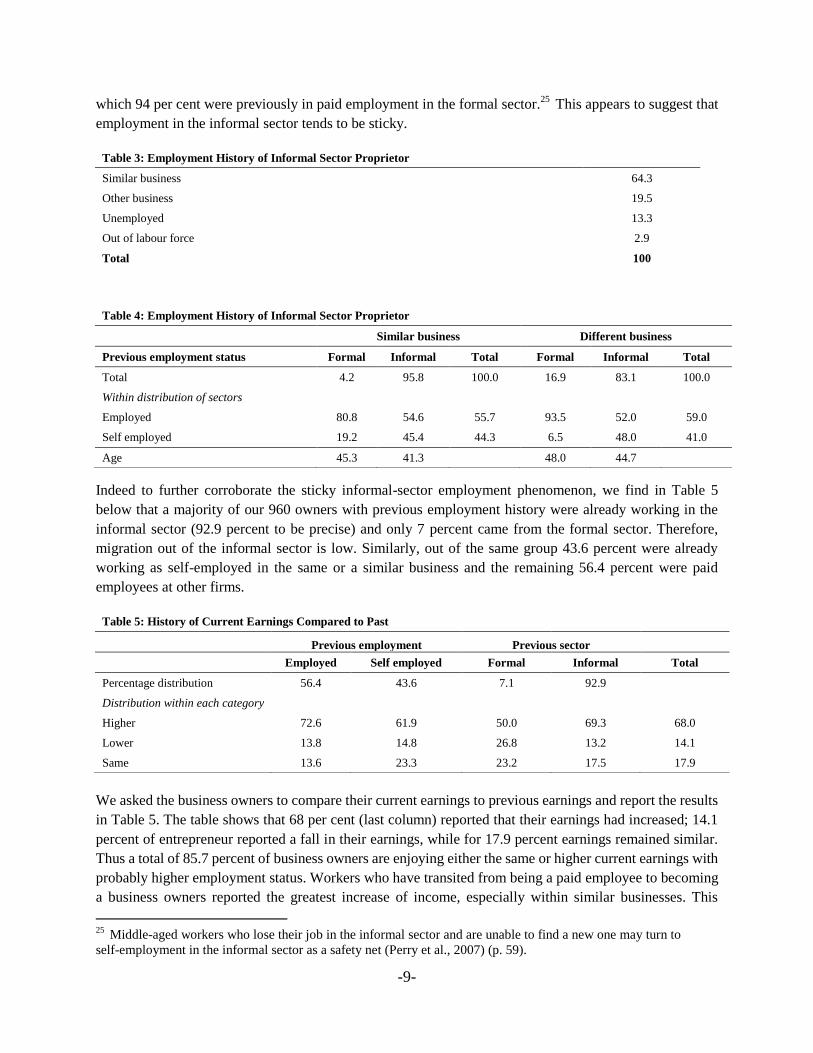
Responses to questions about the owners’ previous employment history are reported below in Table 3,
while Table 4 shows a further break down. The responses reveal that 64.3 percent of our 960 subjects were
involved in the same or a similar business in the past, while 19.5 percent moved from other businesses.
Leaving out the 16.2 percent who were either unemployed or out of labour force, the rest of them have
previous employment experience that helps them manage and run their businesses efficiently.24
This shows
that occupational-choice is sticky. These results are partitioned in Table 4 by employment (self- versus
paid employment) and sector (formal- versus informal) types. Out of the 64.3 percent of owners who had
been working in a similar business, we find that 95.8 percent were already working in the informal sector;
54.6 percent of these were previously in paid employment within the informal sector and became business
owners in the informal sector, while 45.4 percent of them were already self-employed. Similarly, out of the
19.5 percent of owners of informal-sector workers who had been working in other firms, 83.1 percent were
already working in the informal sector; for 48 percent of owners it was only a change of business, while 52
percent of them were in paid employment. The remaining 17 percent came from the formal sector, out of
23
A similar trend was found for informal-sector workers in an older study where 28 per cent of workers in the
informal sector had rural links with only ten per cent having migrated themselves (Burki, 1990). 24
Young firms usually run by younger workers have higher rates of failure (Evans and Leighton, (1989) and
Jovanovic (1982)).
Table 2: Informal Sector Proprietor Profile
Total
No paid
worker
1-3 paid
workers
3 or more paid
workers
Proprietors' age (average years) 42 42.7 42.1 41.7
Education profile (% distribution)
Illiterate 15.7 32.4 15.5 11.2
Below primary 10.2 16.2 10.5 8.3
Primary passed 30.8 41.9 31.8 26.5
Metric passed 22.8 8.6 22.2 27.5
Intermediate passed 13.1 1 12.3 17.4
Degree holder 7.4 0 7.7 9.1
Formal technical education (% share) 4.6 1.9 4.7 5.2
Current earning status (% distribution)
Higher 67.8 76.7 67.1 66.3
Lower 14.3 11.6 15.7 13.3
Same 17.8 11.6 17.2 20.3
Rural to urban migration (% share) 22.3 16.3 22.6 23.5
-9-
which 94 per cent were previously in paid employment in the formal sector.25
This appears to suggest that
employment in the informal sector tends to be sticky.
Indeed to further corroborate the sticky informal-sector employment phenomenon, we find in Table 5
below that a majority of our 960 owners with previous employment history were already working in the
informal sector (92.9 percent to be precise) and only 7 percent came from the formal sector. Therefore,
migration out of the informal sector is low. Similarly, out of the same group 43.6 percent were already
working as self-employed in the same or a similar business and the remaining 56.4 percent were paid
employees at other firms.
We asked the business owners to compare their current earnings to previous earnings and report the results
in Table 5. The table shows that 68 per cent (last column) reported that their earnings had increased; 14.1
percent of entrepreneur reported a fall in their earnings, while for 17.9 percent earnings remained similar.
Thus a total of 85.7 percent of business owners are enjoying either the same or higher current earnings with
probably higher employment status. Workers who have transited from being a paid employee to becoming
a business owners reported the greatest increase of income, especially within similar businesses. This
25
Middle-aged workers who lose their job in the informal sector and are unable to find a new one may turn to
self-employment in the informal sector as a safety net (Perry et al., 2007) (p. 59).
Table 3: Employment History of Informal Sector Proprietor
Similar business 64.3
Other business 19.5
Unemployed 13.3
Out of labour force 2.9
Total 100
Table 4: Employment History of Informal Sector Proprietor
Similar business Different business
Previous employment status Formal Informal Total Formal Informal Total
Total 4.2 95.8 100.0 16.9 83.1 100.0
Within distribution of sectors
Employed 80.8 54.6 55.7 93.5 52.0 59.0
Self employed 19.2 45.4 44.3 6.5 48.0 41.0
Age 45.3 41.3
48.0 44.7
Table 5: History of Current Earnings Compared to Past
Previous employment Previous sector
Employed Self employed Formal Informal Total
Percentage distribution 56.4 43.6 7.1 92.9
Distribution within each category
Higher 72.6 61.9 50.0 69.3 68.0
Lower 13.8 14.8 26.8 13.2 14.1
Same 13.6 23.3 23.2 17.5 17.9
-10-
implies that workers first learn the trade as employees and then establish their own businesses. Similarly,
migration from the formal sector shows the smallest increase in current earnings.
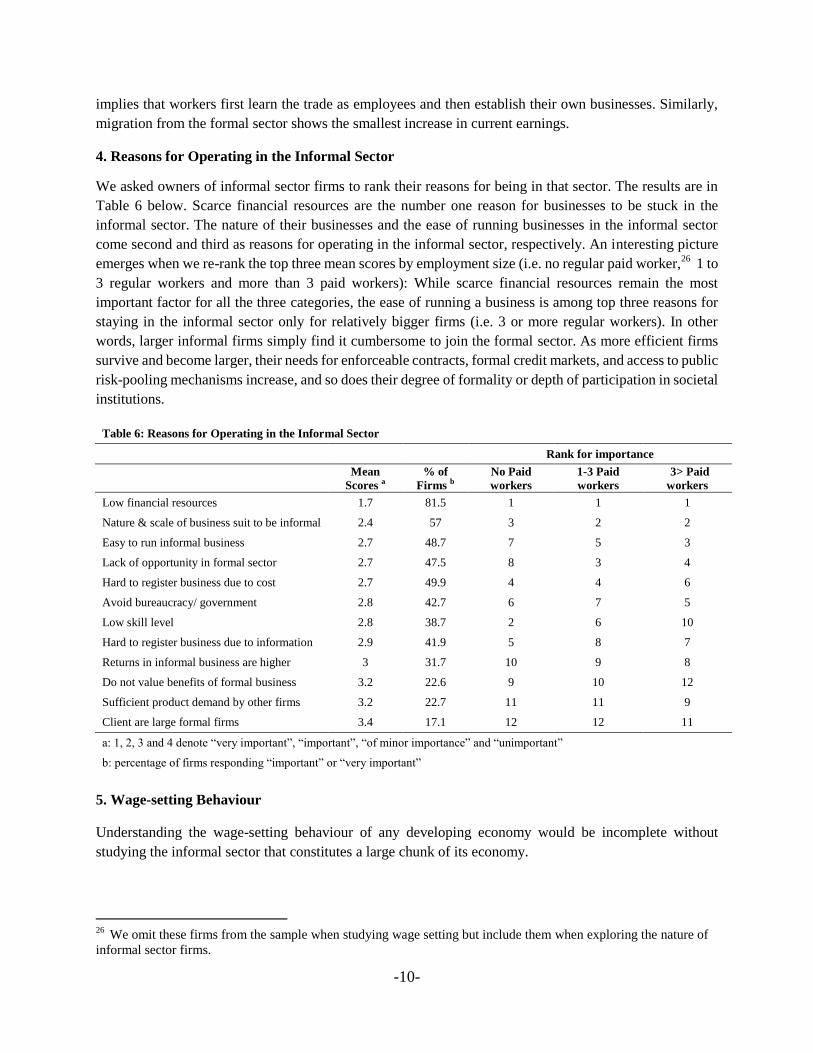
4. Reasons for Operating in the Informal Sector
We asked owners of informal sector firms to rank their reasons for being in that sector. The results are in
Table 6 below. Scarce financial resources are the number one reason for businesses to be stuck in the
informal sector. The nature of their businesses and the ease of running businesses in the informal sector
come second and third as reasons for operating in the informal sector, respectively. An interesting picture
emerges when we re-rank the top three mean scores by employment size (i.e. no regular paid worker,26
1 to
3 regular workers and more than 3 paid workers): While scarce financial resources remain the most
important factor for all the three categories, the ease of running a business is among top three reasons for
staying in the informal sector only for relatively bigger firms (i.e. 3 or more regular workers). In other
words, larger informal firms simply find it cumbersome to join the formal sector. As more efficient firms
survive and become larger, their needs for enforceable contracts, formal credit markets, and access to public
risk-pooling mechanisms increase, and so does their degree of formality or depth of participation in societal
institutions.
5. Wage-setting Behaviour
Understanding the wage-setting behaviour of any developing economy would be incomplete without
studying the informal sector that constitutes a large chunk of its economy.
26
We omit these firms from the sample when studying wage setting but include them when exploring the nature of
informal sector firms.
Table 6: Reasons for Operating in the Informal Sector
Rank for importance
Mean
Scores a
% of
Firms b
No Paid
workers
1-3 Paid
workers
3> Paid
workers
Low financial resources 1.7 81.5 1 1 1
Nature & scale of business suit to be informal 2.4 57 3 2 2
Easy to run informal business 2.7 48.7 7 5 3
Lack of opportunity in formal sector 2.7 47.5 8 3 4
Hard to register business due to cost 2.7 49.9 4 4 6
Avoid bureaucracy/ government 2.8 42.7 6 7 5
Low skill level 2.8 38.7 2 6 10
Hard to register business due to information 2.9 41.9 5 8 7
Returns in informal business are higher 3 31.7 10 9 8
Do not value benefits of formal business 3.2 22.6 9 10 12
Sufficient product demand by other firms 3.2 22.7 11 11 9
Client are large formal firms 3.4 17.1 12 12 11
a: 1, 2, 3 and 4 denote “very important”, “important”, “of minor importance” and “unimportant”
b: percentage of firms responding “important” or “very important”
-11-
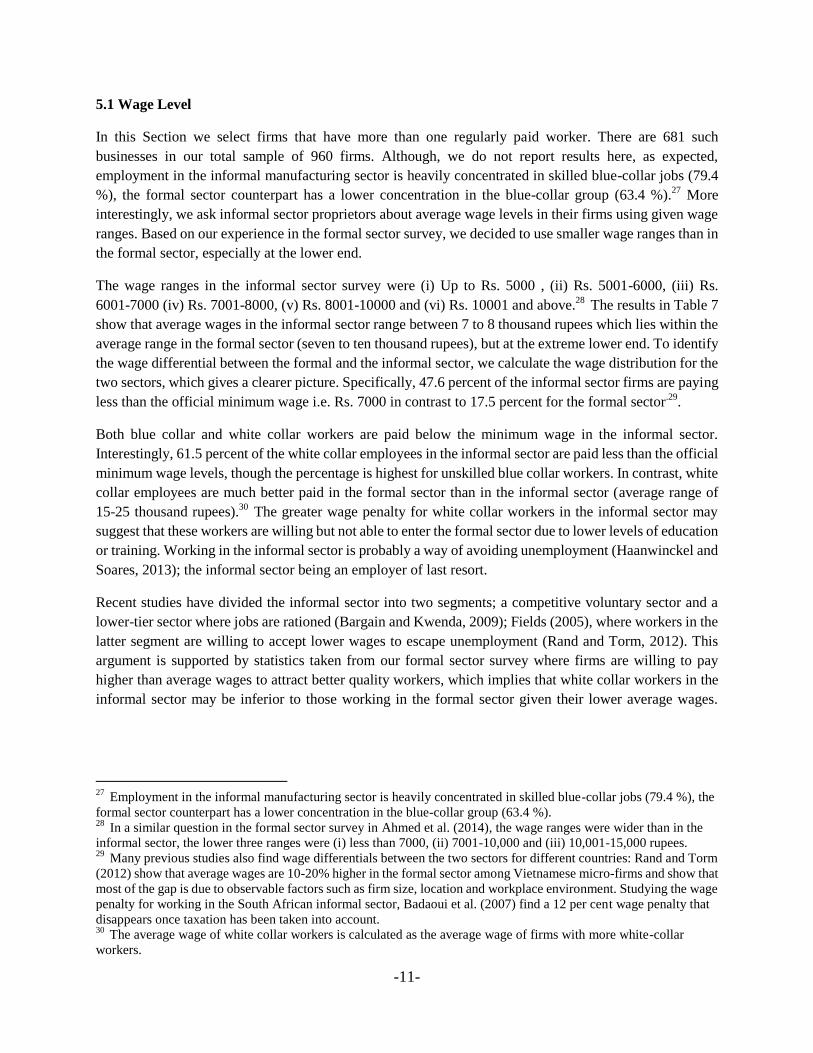
5.1 Wage Level
In this Section we select firms that have more than one regularly paid worker. There are 681 such
businesses in our total sample of 960 firms. Although, we do not report results here, as expected,
employment in the informal manufacturing sector is heavily concentrated in skilled blue-collar jobs (79.4
%), the formal sector counterpart has a lower concentration in the blue-collar group (63.4 %).27
More
interestingly, we ask informal sector proprietors about average wage levels in their firms using given wage
ranges. Based on our experience in the formal sector survey, we decided to use smaller wage ranges than in
the formal sector, especially at the lower end.
The wage ranges in the informal sector survey were (i) Up to Rs. 5000 , (ii) Rs. 5001-6000, (iii) Rs.
6001-7000 (iv) Rs. 7001-8000, (v) Rs. 8001-10000 and (vi) Rs. 10001 and above.28
The results in Table 7
show that average wages in the informal sector range between 7 to 8 thousand rupees which lies within the
average range in the formal sector (seven to ten thousand rupees), but at the extreme lower end. To identify
the wage differential between the formal and the informal sector, we calculate the wage distribution for the
two sectors, which gives a clearer picture. Specifically, 47.6 percent of the informal sector firms are paying
less than the official minimum wage i.e. Rs. 7000 in contrast to 17.5 percent for the formal sector.29
.
Both blue collar and white collar workers are paid below the minimum wage in the informal sector.
Interestingly, 61.5 percent of the white collar employees in the informal sector are paid less than the official
minimum wage levels, though the percentage is highest for unskilled blue collar workers. In contrast, white
collar employees are much better paid in the formal sector than in the informal sector (average range of
15-25 thousand rupees).30
The greater wage penalty for white collar workers in the informal sector may
suggest that these workers are willing but not able to enter the formal sector due to lower levels of education
or training. Working in the informal sector is probably a way of avoiding unemployment (Haanwinckel and
Soares, 2013); the informal sector being an employer of last resort.
Recent studies have divided the informal sector into two segments; a competitive voluntary sector and a
lower-tier sector where jobs are rationed (Bargain and Kwenda, 2009); Fields (2005), where workers in the
latter segment are willing to accept lower wages to escape unemployment (Rand and Torm, 2012). This
argument is supported by statistics taken from our formal sector survey where firms are willing to pay
higher than average wages to attract better quality workers, which implies that white collar workers in the
informal sector may be inferior to those working in the formal sector given their lower average wages.
27
Employment in the informal manufacturing sector is heavily concentrated in skilled blue-collar jobs (79.4 %), the
formal sector counterpart has a lower concentration in the blue-collar group (63.4 %). 28
In a similar question in the formal sector survey in Ahmed et al. (2014), the wage ranges were wider than in the
informal sector, the lower three ranges were (i) less than 7000, (ii) 7001-10,000 and (iii) 10,001-15,000 rupees. 29
Many previous studies also find wage differentials between the two sectors for different countries: Rand and Torm
(2012) show that average wages are 10-20% higher in the formal sector among Vietnamese micro-firms and show that
most of the gap is due to observable factors such as firm size, location and workplace environment. Studying the wage
penalty for working in the South African informal sector, Badaoui et al. (2007) find a 12 per cent wage penalty that
disappears once taxation has been taken into account. 30
The average wage of white collar workers is calculated as the average wage of firms with more white-collar
workers.
-12-
Skilled and unskilled blue collar workers in the formal sector are mostly paid competitive wages so may not
necessarily show similar wage penalty in the informal sector (Ahmed et al. 2014).31
5.2 Wage Adjustment
We have found that a higher share of informal-sector workers is paid less than the minimum wage and that
this penalty applies especially to white-collar workers when compared with their formal sector peers. We
next turn to analysing the frequency of wage changes.
5.2.1 Frequency of Wage Changes
In Druant et al. (2012) and Ahmed et al. (2014) formal-sector firms were asked to state the frequency of
wage changes and the reasons for changing wages where three reasons were listed, i.e. inflation, tenure and
changes due to reasons other than these. Respondents were asked to indicate whether these wage changes
occur (i) quarterly (ii) bi-annually (iii) annually (iv) once in every two year32
(v) never. The shortest of the
wage frequency from any of these frequencies is assigned as the overall frequency of wage changes for each
firm.
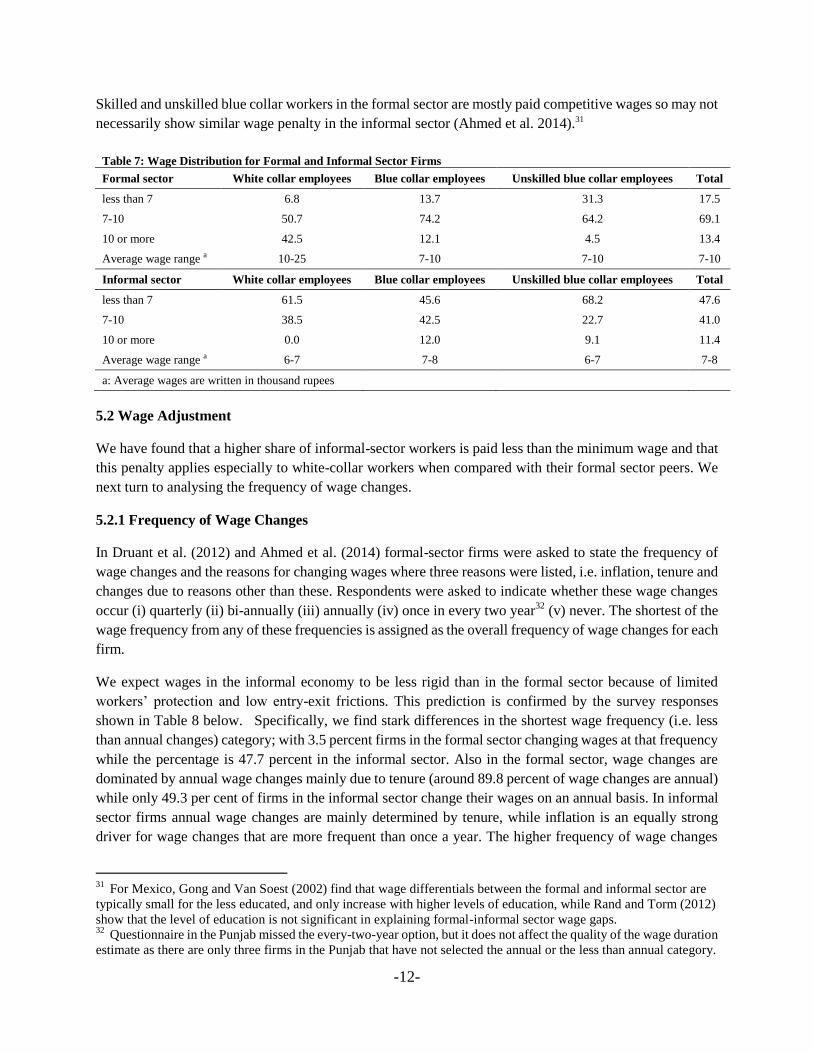
We expect wages in the informal economy to be less rigid than in the formal sector because of limited
workers’ protection and low entry-exit frictions. This prediction is confirmed by the survey responses
shown in Table 8 below. Specifically, we find stark differences in the shortest wage frequency (i.e. less
than annual changes) category; with 3.5 percent firms in the formal sector changing wages at that frequency
while the percentage is 47.7 percent in the informal sector. Also in the formal sector, wage changes are
dominated by annual wage changes mainly due to tenure (around 89.8 percent of wage changes are annual)
while only 49.3 per cent of firms in the informal sector change their wages on an annual basis. In informal
sector firms annual wage changes are mainly determined by tenure, while inflation is an equally strong
driver for wage changes that are more frequent than once a year. The higher frequency of wage changes
31
For Mexico, Gong and Van Soest (2002) find that wage differentials between the formal and informal sector are
typically small for the less educated, and only increase with higher levels of education, while Rand and Torm (2012)
show that the level of education is not significant in explaining formal-informal sector wage gaps. 32
Questionnaire in the Punjab missed the every-two-year option, but it does not affect the quality of the wage duration
estimate as there are only three firms in the Punjab that have not selected the annual or the less than annual category.
Table 7: Wage Distribution for Formal and Informal Sector Firms
Formal sector White collar employees Blue collar employees Unskilled blue collar employees Total
less than 7 6.8 13.7 31.3 17.5
7-10 50.7 74.2 64.2 69.1
10 or more 42.5 12.1 4.5 13.4
Average wage range a 10-25 7-10 7-10 7-10
Informal sector White collar employees Blue collar employees Unskilled blue collar employees Total
less than 7 61.5 45.6 68.2 47.6
7-10 38.5 42.5 22.7 41.0
10 or more 0.0 12.0 9.1 11.4
Average wage range a 6-7 7-8 6-7 7-8
a: Average wages are written in thousand rupees
-13-
affects all occupational groups in the informal sector, more so the white collar group with 63% changing
wages annually.
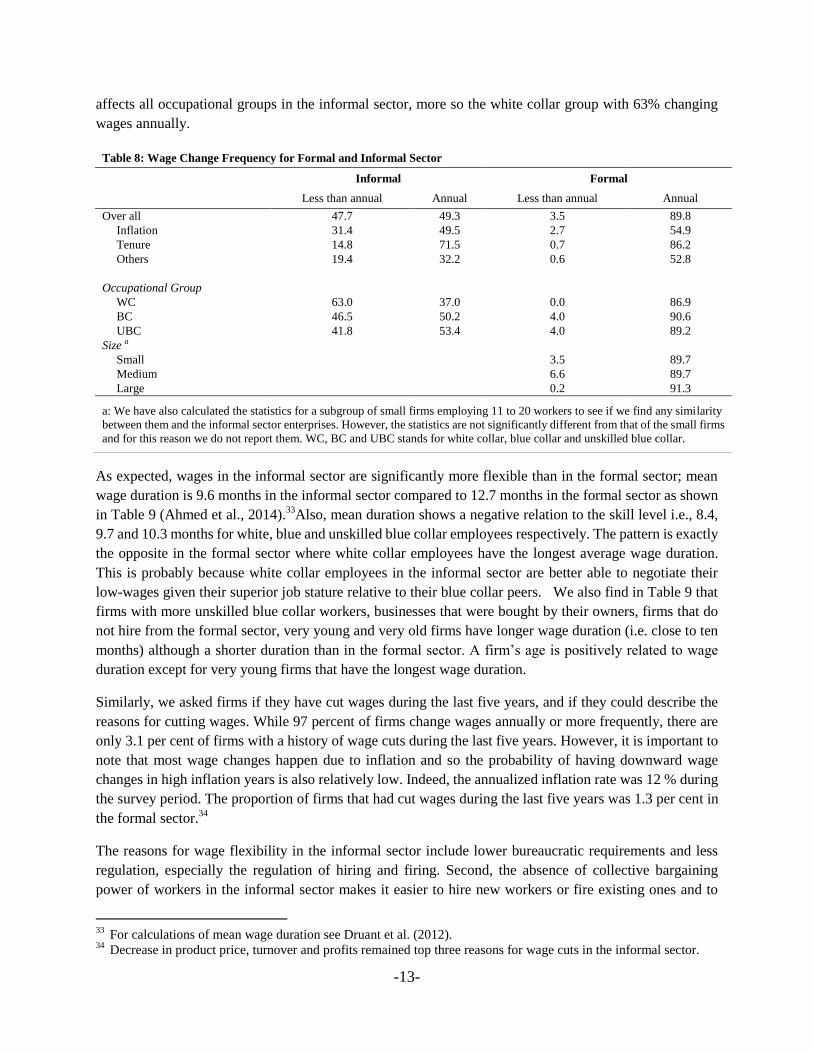
As expected, wages in the informal sector are significantly more flexible than in the formal sector; mean
wage duration is 9.6 months in the informal sector compared to 12.7 months in the formal sector as shown
in Table 9 (Ahmed et al., 2014).33
Also, mean duration shows a negative relation to the skill level i.e., 8.4,
9.7 and 10.3 months for white, blue and unskilled blue collar employees respectively. The pattern is exactly
the opposite in the formal sector where white collar employees have the longest average wage duration.
This is probably because white collar employees in the informal sector are better able to negotiate their
low-wages given their superior job stature relative to their blue collar peers. We also find in Table 9 that
firms with more unskilled blue collar workers, businesses that were bought by their owners, firms that do
not hire from the formal sector, very young and very old firms have longer wage duration (i.e. close to ten
months) although a shorter duration than in the formal sector. A firm’s age is positively related to wage
duration except for very young firms that have the longest wage duration.
Similarly, we asked firms if they have cut wages during the last five years, and if they could describe the
reasons for cutting wages. While 97 percent of firms change wages annually or more frequently, there are
only 3.1 per cent of firms with a history of wage cuts during the last five years. However, it is important to
note that most wage changes happen due to inflation and so the probability of having downward wage
changes in high inflation years is also relatively low. Indeed, the annualized inflation rate was 12 % during
the survey period. The proportion of firms that had cut wages during the last five years was 1.3 per cent in
the formal sector.34
The reasons for wage flexibility in the informal sector include lower bureaucratic requirements and less
regulation, especially the regulation of hiring and firing. Second, the absence of collective bargaining
power of workers in the informal sector makes it easier to hire new workers or fire existing ones and to
33
For calculations of mean wage duration see Druant et al. (2012). 34
Decrease in product price, turnover and profits remained top three reasons for wage cuts in the informal sector.
Table 8: Wage Change Frequency for Formal and Informal Sector
Informal Formal
Less than annual Annual Less than annual Annual
Over all 47.7 49.3 3.5 89.8
Inflation 31.4 49.5 2.7 54.9
Tenure 14.8 71.5 0.7 86.2
Others 19.4 32.2 0.6 52.8
Occupational Group WC 63.0 37.0 0.0 86.9
BC 46.5 50.2 4.0 90.6
UBC 41.8 53.4 4.0 89.2
Size a Small
3.5 89.7
Medium
6.6 89.7
Large
0.2 91.3
a: We have also calculated the statistics for a subgroup of small firms employing 11 to 20 workers to see if we find any similarity
between them and the informal sector enterprises. However, the statistics are not significantly different from that of the small firms
and for this reason we do not report them. WC, BC and UBC stands for white collar, blue collar and unskilled blue collar.
-14-
adjust wages, which is difficult for formal sector firms due to the existence of labour unions. Third,
informal sector technology itself generates flexibility since it is easier to monitor effort and manage
relations with workers in small firms, which in turn increases the likelihood of competitive wages and wage
flexibility (Esfahani and Salehi-Isfahani, 1989).35
5.2.2 Timing and Wage Setting Rules
In adjusting wages a firm may decide to follow a time-dependent rule, a state-dependent rule or a
combination of the two36
. Firms following a time-dependent rule change their wages only periodically.
Time-dependent rules are common in both the formal and the informal sector, specifically 46.4 percent of
informal sector enterprises follow time dependent rule, compared to 80.3 percent in the formal sector (see
Table 10 below). Nonetheless, we see striking differences in the percentages between these wage
adjustment rules in that significantly fewer firms in the informal sector follow strictly time-dependent rule.
If anything, this implies that informal sector firms respond to large shocks by adjusting wages even though
they may normally follow time-dependent rules. There are also differences between the sectors in the
average frequency of wage changes under state-dependent rules. Indeed, there is a large contingent of
informal-sector businesses, 24.4 percent, following state-dependent rules. In sum, the evidence suggests
that wage setting in the informal sector is more flexible and responsive to changes in the external
environment, which indirectly implies the predominance of state-dependent wage-setting strategies.
35
Woltermann (2003) links the informal sector to better information and job search; he argues that labour market
segmentations arises from the lack of information on available vacancies in the formal sector, making wages relatively
rigid in the formal sector. 36
Staggered price models: Taylor (1980); Calvo (1983)); state-dependent firms tend to change wages whenever there
is large shock to the economy (state dependent prices: Hall et al. (2000)).
Table 9: Wage Durations in the Informal Sector
Months
Over all 9.6
WC 8.4
BC 9.7
UBC 10.3
Self establishes 9.6
Family business 9.6
Purchased 10.1
1-5 Years 10.0
6-10 Years 9.3
11-20 Years 9.6
21-50 9.8
51 or more 10.2
1-3 employees 9.6
more than 3 9.8
Hire from formal sector
Yes 8.7
No 10.2
-15-
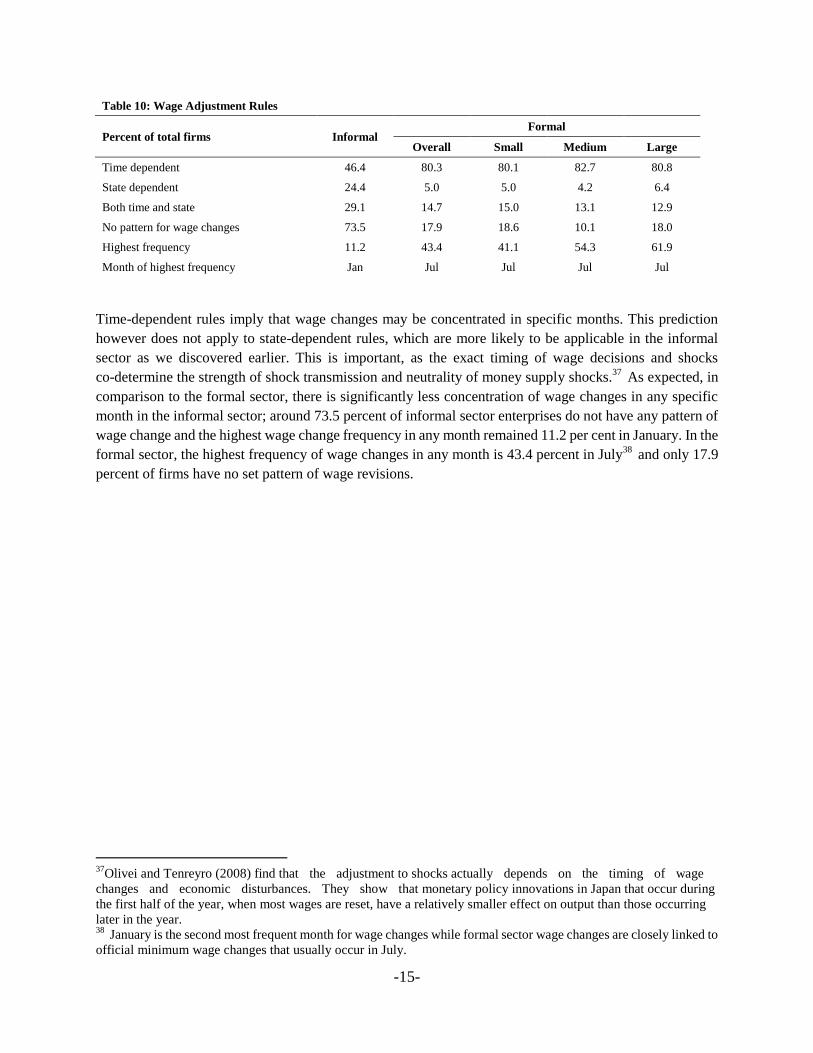
Time-dependent rules imply that wage changes may be concentrated in specific months. This prediction
however does not apply to state-dependent rules, which are more likely to be applicable in the informal
sector as we discovered earlier. This is important, as the exact timing of wage decisions and shocks
co-determine the strength of shock transmission and neutrality of money supply shocks.37
As expected, in
comparison to the formal sector, there is significantly less concentration of wage changes in any specific
month in the informal sector; around 73.5 percent of informal sector enterprises do not have any pattern of
wage change and the highest wage change frequency in any month remained 11.2 per cent in January. In the
formal sector, the highest frequency of wage changes in any month is 43.4 percent in July38
and only 17.9
percent of firms have no set pattern of wage revisions.
37
Olivei and Tenreyro (2008) find that the adjustment to shocks actually depends on the timing of wage
changes and economic disturbances. They show that monetary policy innovations in Japan that occur during
the first half of the year, when most wages are reset, have a relatively smaller effect on output than those occurring
later in the year. 38
January is the second most frequent month for wage changes while formal sector wage changes are closely linked to
official minimum wage changes that usually occur in July.
Table 10: Wage Adjustment Rules
Percent of total firms Informal
Formal
Overall Small Medium Large
Time dependent 46.4 80.3 80.1 82.7 80.8
State dependent 24.4 5.0 5.0 4.2 6.4
Both time and state 29.1 14.7 15.0 13.1 12.9
No pattern for wage changes 73.5 17.9 18.6 10.1 18.0
Highest frequency 11.2 43.4 41.1 54.3 61.9
Month of highest frequency Jan Jul Jul Jul Jul
-16-
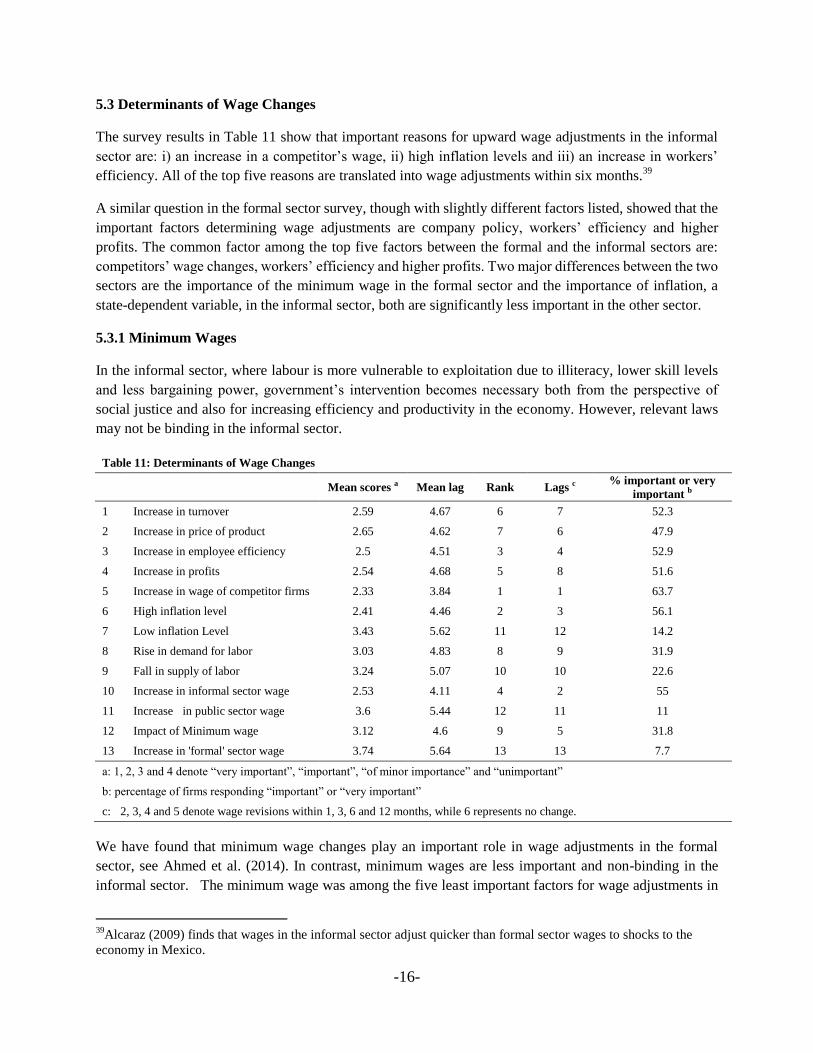
5.3 Determinants of Wage Changes
The survey results in Table 11 show that important reasons for upward wage adjustments in the informal
sector are: i) an increase in a competitor’s wage, ii) high inflation levels and iii) an increase in workers’
efficiency. All of the top five reasons are translated into wage adjustments within six months.39
A similar question in the formal sector survey, though with slightly different factors listed, showed that the
important factors determining wage adjustments are company policy, workers’ efficiency and higher
profits. The common factor among the top five factors between the formal and the informal sectors are:
competitors’ wage changes, workers’ efficiency and higher profits. Two major differences between the two
sectors are the importance of the minimum wage in the formal sector and the importance of inflation, a
state-dependent variable, in the informal sector, both are significantly less important in the other sector.
5.3.1 Minimum Wages
In the informal sector, where labour is more vulnerable to exploitation due to illiteracy, lower skill levels
and less bargaining power, government’s intervention becomes necessary both from the perspective of
social justice and also for increasing efficiency and productivity in the economy. However, relevant laws
may not be binding in the informal sector.
We have found that minimum wage changes play an important role in wage adjustments in the formal
sector, see Ahmed et al. (2014). In contrast, minimum wages are less important and non-binding in the
informal sector. The minimum wage was among the five least important factors for wage adjustments in
39
Alcaraz (2009) finds that wages in the informal sector adjust quicker than formal sector wages to shocks to the
economy in Mexico.
Table 11: Determinants of Wage Changes
Mean scores a Mean lag Rank Lags c % important or very
important b
1 Increase in turnover 2.59 4.67 6 7 52.3
2 Increase in price of product 2.65 4.62 7 6 47.9
3 Increase in employee efficiency 2.5 4.51 3 4 52.9
4 Increase in profits 2.54 4.68 5 8 51.6
5 Increase in wage of competitor firms 2.33 3.84 1 1 63.7
6 High inflation level 2.41 4.46 2 3 56.1
7 Low inflation Level 3.43 5.62 11 12 14.2
8 Rise in demand for labor 3.03 4.83 8 9 31.9
9 Fall in supply of labor 3.24 5.07 10 10 22.6
10 Increase in informal sector wage 2.53 4.11 4 2 55
11 Increase in public sector wage 3.6 5.44 12 11 11
12 Impact of Minimum wage 3.12 4.6 9 5 31.8
13 Increase in 'formal' sector wage 3.74 5.64 13 13 7.7
a: 1, 2, 3 and 4 denote “very important”, “important”, “of minor importance” and “unimportant”
b: percentage of firms responding “important” or “very important”
c: 2, 3, 4 and 5 denote wage revisions within 1, 3, 6 and 12 months, while 6 represents no change.
-17-
the informal sector; only 31.8 percent of firms ranked it as either a very important or an important factor for
wage adjustment (74 percent in the formal sector), for firms with average wages below minimum wage
level the percentage was 47.6 per cent (17.4 percent in the formal sector). For 85.3 percent of the firms in
the informal sector changes in the official minimum wages do not have any employment effects either.40
5.3.2 Wage Indexation
Theoretically, workers, being more risk averse than the employers, are more concerned about real wages
than nominal wages and want to be insured against any unanticipated change in their real wages (for details
see Keeney and Lawless, 2010).41
Wages may be indexed to inflation, either completely or partially, as an
alternative to costly collective bargaining.
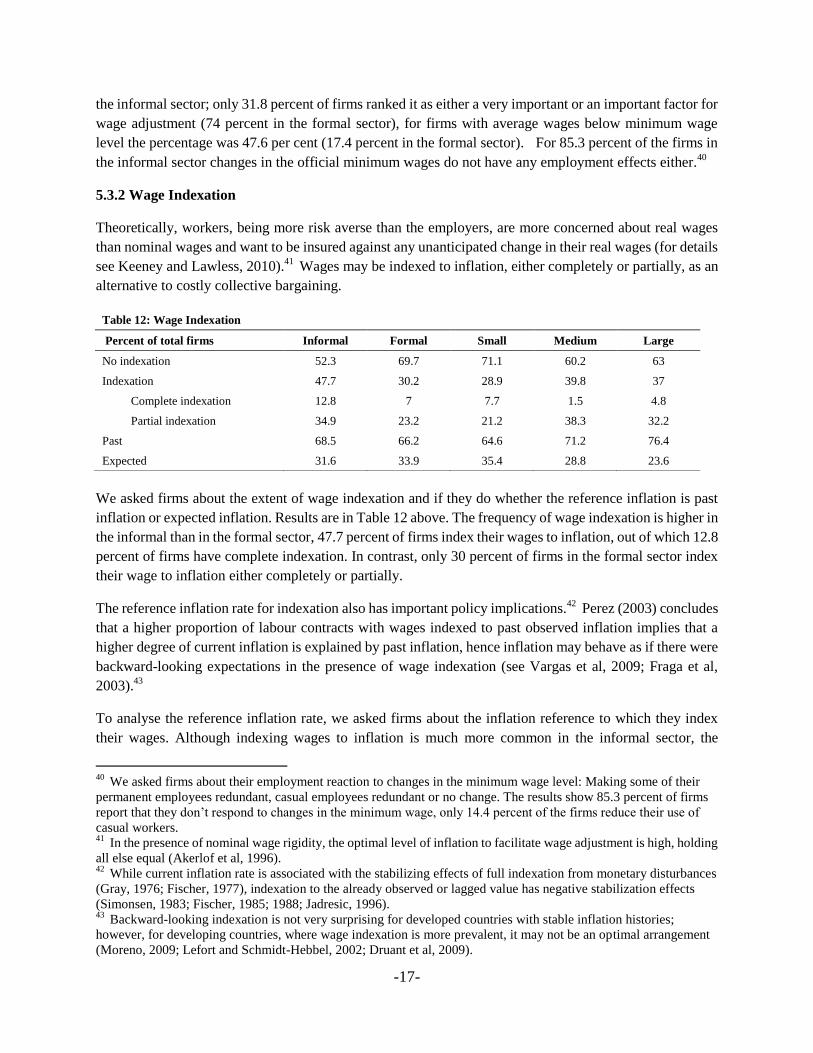
We asked firms about the extent of wage indexation and if they do whether the reference inflation is past
inflation or expected inflation. Results are in Table 12 above. The frequency of wage indexation is higher in
the informal than in the formal sector, 47.7 percent of firms index their wages to inflation, out of which 12.8
percent of firms have complete indexation. In contrast, only 30 percent of firms in the formal sector index
their wage to inflation either completely or partially.
The reference inflation rate for indexation also has important policy implications.42
Perez (2003) concludes
that a higher proportion of labour contracts with wages indexed to past observed inflation implies that a
higher degree of current inflation is explained by past inflation, hence inflation may behave as if there were
backward-looking expectations in the presence of wage indexation (see Vargas et al, 2009; Fraga et al,
2003).43
To analyse the reference inflation rate, we asked firms about the inflation reference to which they index
their wages. Although indexing wages to inflation is much more common in the informal sector, the
40
We asked firms about their employment reaction to changes in the minimum wage level: Making some of their
permanent employees redundant, casual employees redundant or no change. The results show 85.3 percent of firms
report that they don’t respond to changes in the minimum wage, only 14.4 percent of the firms reduce their use of
casual workers. 41
In the presence of nominal wage rigidity, the optimal level of inflation to facilitate wage adjustment is high, holding
all else equal (Akerlof et al, 1996). 42
While current inflation rate is associated with the stabilizing effects of full indexation from monetary disturbances
(Gray, 1976; Fischer, 1977), indexation to the already observed or lagged value has negative stabilization effects
(Simonsen, 1983; Fischer, 1985; 1988; Jadresic, 1996). 43
Backward-looking indexation is not very surprising for developed countries with stable inflation histories;
however, for developing countries, where wage indexation is more prevalent, it may not be an optimal arrangement
(Moreno, 2009; Lefort and Schmidt-Hebbel, 2002; Druant et al, 2009).
Table 12: Wage Indexation
Percent of total firms Informal Formal Small Medium Large
No indexation 52.3 69.7 71.1 60.2 63
Indexation 47.7 30.2 28.9 39.8 37
Complete indexation 12.8 7 7.7 1.5 4.8
Partial indexation 34.9 23.2 21.2 38.3 32.2
Past 68.5 66.2 64.6 71.2 76.4
Expected 31.6 33.9 35.4 28.8 23.6
-18-
dependence on lagged inflation is prevalent in both sectors. This backward-looking nature can explain
inflation persistence in Pakistan.44
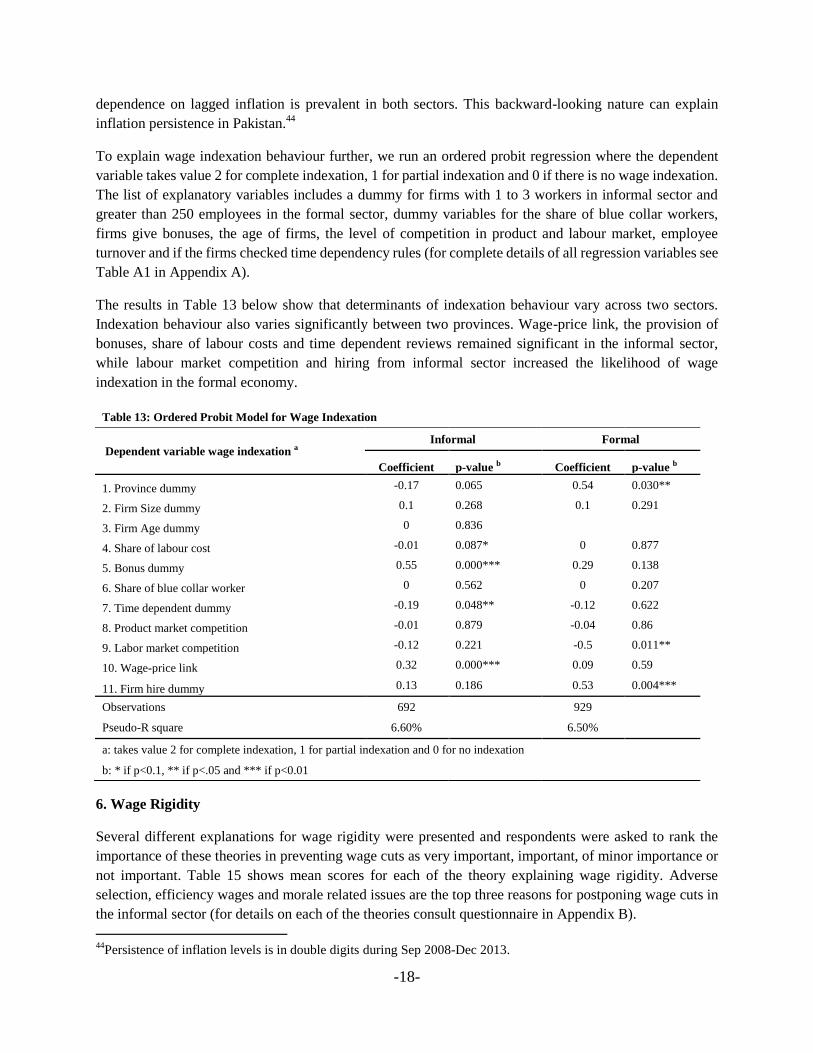
To explain wage indexation behaviour further, we run an ordered probit regression where the dependent
variable takes value 2 for complete indexation, 1 for partial indexation and 0 if there is no wage indexation.
The list of explanatory variables includes a dummy for firms with 1 to 3 workers in informal sector and
greater than 250 employees in the formal sector, dummy variables for the share of blue collar workers,
firms give bonuses, the age of firms, the level of competition in product and labour market, employee
turnover and if the firms checked time dependency rules (for complete details of all regression variables see
Table A1 in Appendix A).
The results in Table 13 below show that determinants of indexation behaviour vary across two sectors.
Indexation behaviour also varies significantly between two provinces. Wage-price link, the provision of
bonuses, share of labour costs and time dependent reviews remained significant in the informal sector,
while labour market competition and hiring from informal sector increased the likelihood of wage
indexation in the formal economy.
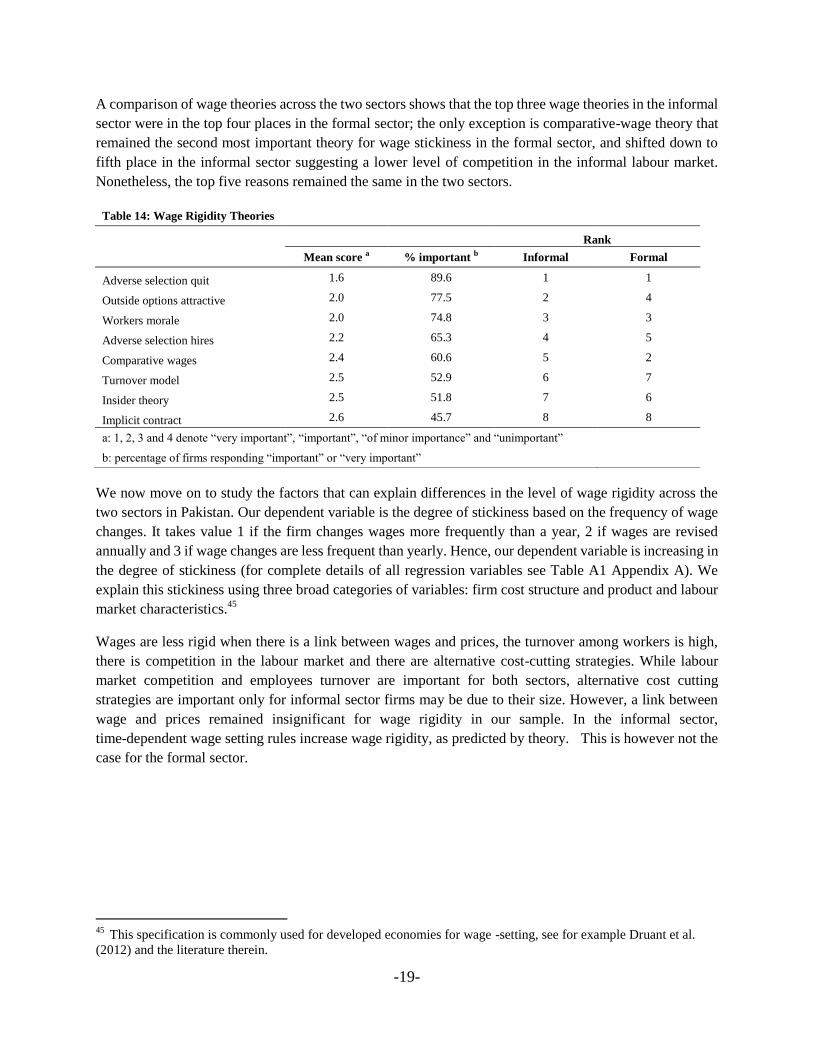
6. Wage Rigidity
Several different explanations for wage rigidity were presented and respondents were asked to rank the
importance of these theories in preventing wage cuts as very important, important, of minor importance or
not important. Table 15 shows mean scores for each of the theory explaining wage rigidity. Adverse
selection, efficiency wages and morale related issues are the top three reasons for postponing wage cuts in
the informal sector (for details on each of the theories consult questionnaire in Appendix B).
44
Persistence of inflation levels is in double digits during Sep 2008-Dec 2013.
Table 13: Ordered Probit Model for Wage Indexation
Dependent variable wage indexation a Informal Formal
Coefficient p-value b Coefficient p-value b
1. Province dummy -0.17 0.065 0.54 0.030**
2. Firm Size dummy 0.1 0.268 0.1 0.291
3. Firm Age dummy 0 0.836
4. Share of labour cost -0.01 0.087* 0 0.877
5. Bonus dummy 0.55 0.000*** 0.29 0.138
6. Share of blue collar worker 0 0.562 0 0.207
7. Time dependent dummy -0.19 0.048** -0.12 0.622
8. Product market competition -0.01 0.879 -0.04 0.86
9. Labor market competition -0.12 0.221 -0.5 0.011**
10. Wage-price link 0.32 0.000*** 0.09 0.59
11. Firm hire dummy 0.13 0.186 0.53 0.004***
Observations 692
929
Pseudo-R square 6.60%
6.50%
a: takes value 2 for complete indexation, 1 for partial indexation and 0 for no indexation
b: * if p<0.1, ** if p<.05 and *** if p<0.01
-19-
A comparison of wage theories across the two sectors shows that the top three wage theories in the informal
sector were in the top four places in the formal sector; the only exception is comparative-wage theory that
remained the second most important theory for wage stickiness in the formal sector, and shifted down to
fifth place in the informal sector suggesting a lower level of competition in the informal labour market.
Nonetheless, the top five reasons remained the same in the two sectors.
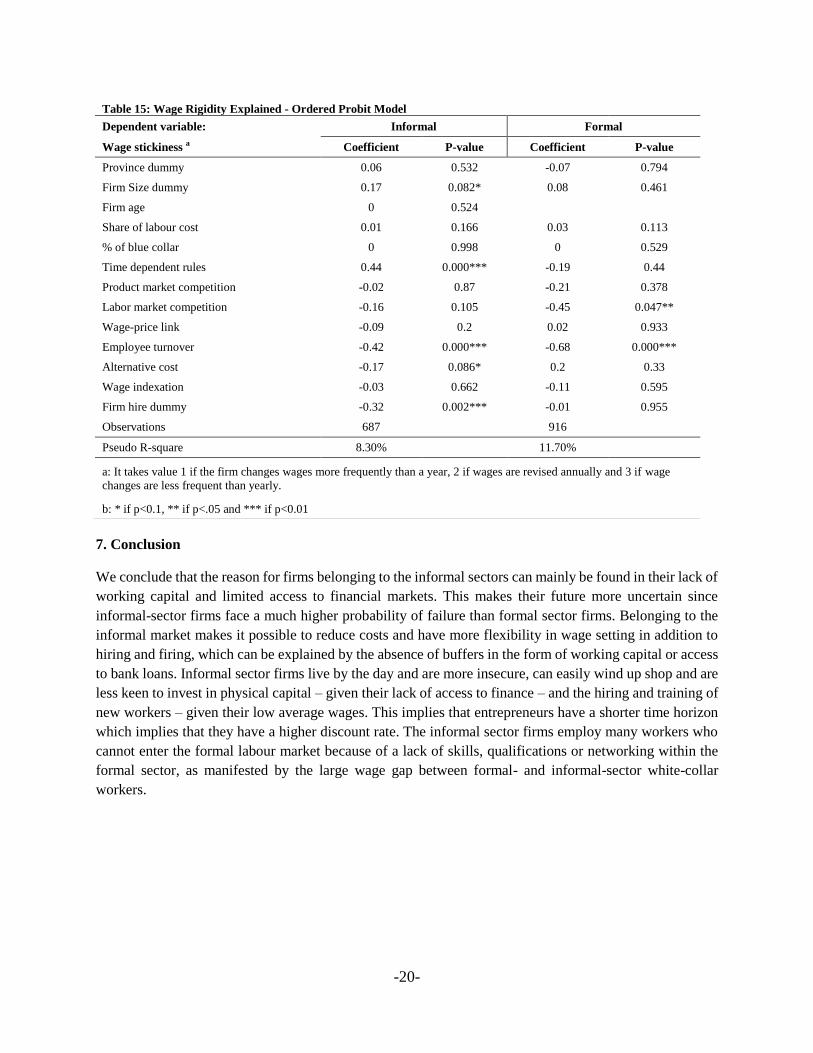
We now move on to study the factors that can explain differences in the level of wage rigidity across the
two sectors in Pakistan. Our dependent variable is the degree of stickiness based on the frequency of wage
changes. It takes value 1 if the firm changes wages more frequently than a year, 2 if wages are revised
annually and 3 if wage changes are less frequent than yearly. Hence, our dependent variable is increasing in
the degree of stickiness (for complete details of all regression variables see Table A1 Appendix A). We
explain this stickiness using three broad categories of variables: firm cost structure and product and labour
market characteristics.45
Wages are less rigid when there is a link between wages and prices, the turnover among workers is high,
there is competition in the labour market and there are alternative cost-cutting strategies. While labour
market competition and employees turnover are important for both sectors, alternative cost cutting
strategies are important only for informal sector firms may be due to their size. However, a link between
wage and prices remained insignificant for wage rigidity in our sample. In the informal sector,
time-dependent wage setting rules increase wage rigidity, as predicted by theory. This is however not the
case for the formal sector.
45
This specification is commonly used for developed economies for wage -setting, see for example Druant et al.
(2012) and the literature therein.
Table 14: Wage Rigidity Theories
Rank
Mean score a % important b Informal Formal
Adverse selection quit 1.6 89.6 1 1
Outside options attractive 2.0 77.5 2 4
Workers morale 2.0 74.8 3 3
Adverse selection hires 2.2 65.3 4 5
Comparative wages 2.4 60.6 5 2
Turnover model 2.5 52.9 6 7
Insider theory 2.5 51.8 7 6
Implicit contract 2.6 45.7 8 8
a: 1, 2, 3 and 4 denote “very important”, “important”, “of minor importance” and “unimportant”
b: percentage of firms responding “important” or “very important”
-20-
7. Conclusion
We conclude that the reason for firms belonging to the informal sectors can mainly be found in their lack of
working capital and limited access to financial markets. This makes their future more uncertain since
informal-sector firms face a much higher probability of failure than formal sector firms. Belonging to the
informal market makes it possible to reduce costs and have more flexibility in wage setting in addition to
hiring and firing, which can be explained by the absence of buffers in the form of working capital or access
to bank loans. Informal sector firms live by the day and are more insecure, can easily wind up shop and are
less keen to invest in physical capital – given their lack of access to finance – and the hiring and training of
new workers – given their low average wages. This implies that entrepreneurs have a shorter time horizon
which implies that they have a higher discount rate. The informal sector firms employ many workers who
cannot enter the formal labour market because of a lack of skills, qualifications or networking within the
formal sector, as manifested by the large wage gap between formal- and informal-sector white-collar
workers.
Table 15: Wage Rigidity Explained - Ordered Probit Model
Dependent variable: Informal Formal
Wage stickiness a Coefficient P-value Coefficient P-value
Province dummy 0.06 0.532 -0.07 0.794
Firm Size dummy 0.17 0.082* 0.08 0.461
Firm age 0 0.524
Share of labour cost 0.01 0.166 0.03 0.113
% of blue collar 0 0.998 0 0.529
Time dependent rules 0.44 0.000*** -0.19 0.44
Product market competition -0.02 0.87 -0.21 0.378
Labor market competition -0.16 0.105 -0.45 0.047**
Wage-price link -0.09 0.2 0.02 0.933
Employee turnover -0.42 0.000*** -0.68 0.000***
Alternative cost -0.17 0.086* 0.2 0.33
Wage indexation -0.03 0.662 -0.11 0.595
Firm hire dummy -0.32 0.002*** -0.01 0.955
Observations 687
916
Pseudo R-square 8.30% 11.70%
a: It takes value 1 if the firm changes wages more frequently than a year, 2 if wages are revised annually and 3 if wage
changes are less frequent than yearly.
b: * if p<0.1, ** if p<.05 and *** if p<0.01
-21-
Reference
Ahmed, W., Choudhary, M. A., Naeem, S., & Zoega, G. (2014). Determinants of Wage Stickiness in a
Developing Economy. Economic Modelling , 296–304.
Akerlof, G. A., Dickens, W. R., & Perry, G. L. (1996). The Macroeconomics of Low Inflation. Brookings
Papers on Economic Activity, Economic Studies Program, The Brookings Institution 27 , 1-76.
Alcaraz, C. (2009). Informal and Formal Labour Flexibility in Mexico. PRIMER SEMESTRE DE, 115-143.
Badaoui, E., Strobl, E., & Walsh, F. (2007). Is There An Informal Sector Wage Penalty? Evidence from
South Africa. Economic Development and Cultural Chane, 56 (3), 683-710.
Bargain, O., & Kwenda, P. (2009). The Informal Sector Wage Gap: New Evidence Using Quantile
Estimations on Panel Data. IZA Discussion Paper Series No.4286 .
Bivens, J., Avirgan, T., & Gammage, S. (2005). Good Jobs, Bad Jobs, No Jobs: Labor Markets and
Informal Work in Egypt, El Salvador, India, Russia, and South Africa. Economic Policy INstitute.
Burki, A. A. (1990). Urban Informal Sector in Pakistan: Some Selected Issues. Pakistan Development
Review , 28 (4), 911-924.
Calvo, G. A. (1983). Involuntary Unemployment and Inventories: An Exploratory Model of Equilibrium
and Pure Competition. Journal of Macroeconomics , 4 (3), 253-275.
Choudhary, M. A., Naeem, S., Faheem, A., Haneef, N., & Pasha, F. (2011). Formal sector price discoveries:
Results from a developing country. University of Surrey Discussion Papers in Economics .
Di Giannatale, S., Ramírez-Abarca, G., & Smith, R. (2013). Estimating the Effects of Formality on
Mexican Informal Microfirms A Joint Multivariate Approach. economía mexicana nueva época, , Cierre de
Época (II), 441-463.
Druant, M., Fabiani, S., Kezdi, G., Lamo, A., Martins, F., & Sabbatini, R. b. (2012). Firms' price and wage
adjustment in Europe: survey evidence on nominal stickiness. Labour Economics , 19, 772–782.
Druant, M., Fabiani, S., Kezdi, G., Lamo, A., Martins, F., & Sabbatini, R. (2009). How Are Firms’ Wages
and Prices Linked: Survey Evidence in Europe. Working paper No 1084, European Central Bank.
Esfahani, H. S., & Salehi-Isfahani, D. (1989). Effort Observability and Worker Productivity: Towards an
Explanation of Economic Dualism. Economic Journal , 99, 818-836.
Evans, D. S., & Leighton, L. (1989). Some empiricalaspects of enterpreneurship. American Economic
Review , 79 (3), 519-35.
Fields, G. S. (2005). A Guide to Multisector labor Markets Models. Paper prepared for the World Bank
labor Market Conference .
Fischer, S. (1985). Contracts, Credibility, and Disinflation. In J. .. Neville, & V. Argy, Inflation and
Unemployment. London: George Allen and Unwin .
-22-
Fischer, S. (1988). Monetary Policy and Performance in the U.S., Japan and Europe, 1973–86 . In Y.
Suzuki, & M. Okabe, Toward a World of Economic Stability. University of Tokyo Press.
Fischer, S. (1977). Wage Indexation and Macroeconomics Stability. Carnegie-Rochester Conference
Series on Public Policy , 107-147.
Fraga, A., Goldfajn, I., & Minella, A. (2003). Inflation Targeting in Emerging Market Economies. National
Bureau of Economic Research Working Paper Series, No. 10019 .
Gong, X., & van Soest, A. (2002). Wage Differentials and Mobility in the Urban Labor Market: A Panel
Data Analysis for Mexico. Labor Economics , 9 (4), 513-529.
Gray, J. (1976). Wage Indexation: A Macroeconomic Approach. Journal of Monetary Economics , 2 (2),
221-235.
Haanwinckel, D., & Soares, R. R. (2013). A Compensating Differentials Theory of Informal Labor
Markets: Quantitative Model and Implications for a Developing Country. IZA Discussion Paper No. 9168 .
Hall, S., Walsh, M., & Yates, A. (2000). Are UK Companies’ Prices Sticky? Oxford Economic Papers , 52,
425-446.
Ingram, M., Ramachandran, V., & Desai, V. (2007). Why Do Firms Choose to be Informal? Evidence from
Enterprise Surveys in Africa. NBER .
Jadresic, E. (1996, December). Wage Indexation and the Cost of Disinflation. IMF Staff Papers , 43 (4), pp.
796-825.
Jovanovic, B. (1982). Selection and Evolution of Industry. Econometrica , 50 (3), 649-70.
Keeney, M., & Lawless, M. (2010). Wage Setting and Wage Flexibility in Ireland: Results from a
Firm-level Survey. Working Paper Series No 1181, Feb 2010, European Central Bank.
Kemal, A., & Mahmood, Z. (1998). The Urban Informal Sector of Pakistan: Some Stylized Facts. Pakistan
Institute of Development Economics, Research Paper No. 161 .
Labout Force Survey . (2012). Labour Force survey 2010-11. Pakistan Bureau of Statistics.
Lefort, F., & Schmidt-Hebbel, K. (2002). Indexation, Inflation and Monetary Policy: An Overview. Central
Bank of Chile , pp. 1-18.
Moreno, R. (2009). Some Issues in Measuring and Tracking Prices in Emerging Market Economies. Bank
for International Settlements , pp. 13-51.
Olivei, G., & Tenreyro, S. D. (2008). Wage Setting Patterns and Monetary Policy: International Evidence.
CEP Discussion Papers dp0872, Centre for Economic Performance, LSE.
Perez, J. (2003). Non-stationary Job Search When Jobs Do Not Last Forever: A Structural Estimation to
Evaluate Alternative Unemployment Insurance Systems. . Centro de Estudios Andaluces .
-23-
Perry, G. E., Maloney, W. F., Arias, O. S., Fajnzylber, P., Mason, A. D., & Saavedra- Chanduvi, J. (2007).
Informality: Exit and Exclusion. The World Bank.
Rand, J., & Torm, N. (2012). The informal sector wage gap among Vietnamese micro-firms. Journal of the
Asia Pacific Economy , 17 (4), 560-577.
Simonsen, M. (1983). Indexation: Current Theory and the Brazilian Experience. In R. a. Dornbusch,
Inflation, Debt, and Indexation. The MIT Press.
Taylor, J. (1980). Aggregate Dynamics and Staggered Contracts. Journal of Political Economy , 88 (I),
1-23.
Todaro, M. (1969). A model of Labour Migration and Urban Employment in Less Developed Countries.
American Economic Review , 59 (1), 138-43.
Vargas, H., Gonzalez, A., Gonzalez, E., Romero, J., & Rojas, L. (2009). Assessing Inflationary Pressures in
Colombia. Banco de la Republica de Colombia.
Woltermann, S. (2003). Job-Search methods and labor market transitions in a segmented economy. Labor
and Demography, EconWPA .
-24-
Appendix A
Figure A1: Snapshot of Labour Force Survey 2008/9
-25-
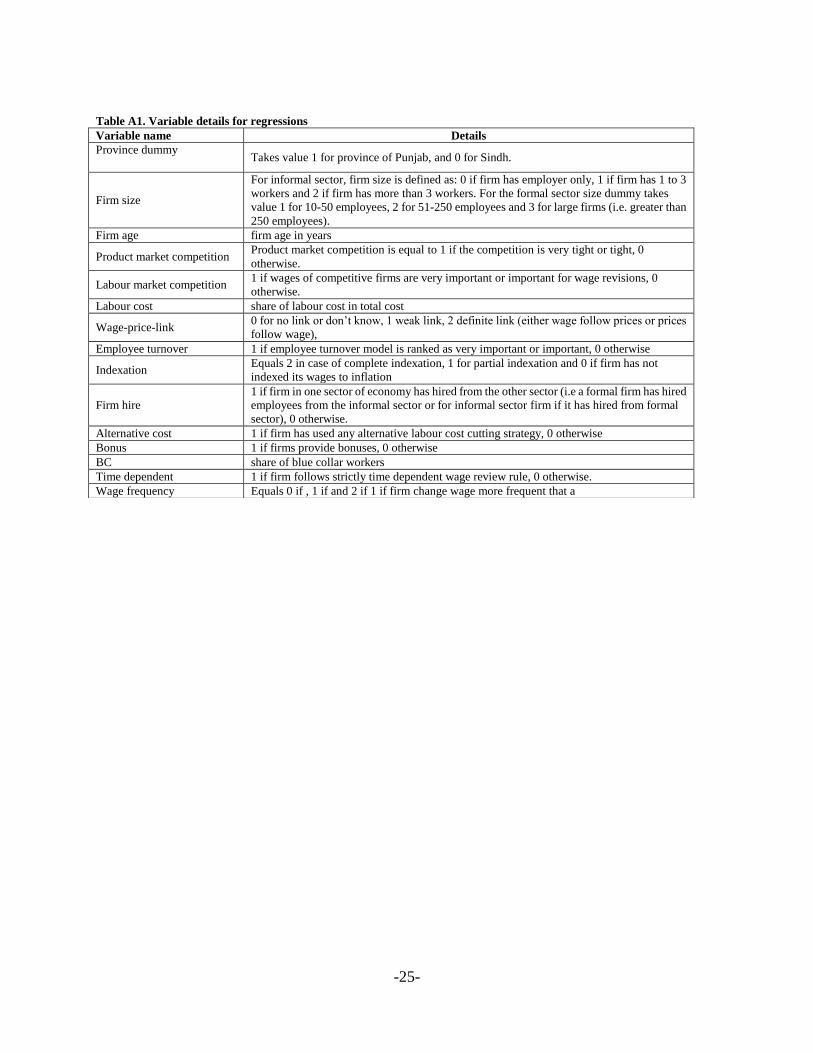
Table A1. Variable details for regressions
Variable name Details
Province dummy Takes value 1 for province of Punjab, and 0 for Sindh.
Firm size
For informal sector, firm size is defined as: 0 if firm has employer only, 1 if firm has 1 to 3
workers and 2 if firm has more than 3 workers. For the formal sector size dummy takes
value 1 for 10-50 employees, 2 for 51-250 employees and 3 for large firms (i.e. greater than
250 employees).
Firm age firm age in years
Product market competition Product market competition is equal to 1 if the competition is very tight or tight, 0
otherwise.
Labour market competition 1 if wages of competitive firms are very important or important for wage revisions, 0
otherwise.
Labour cost share of labour cost in total cost
Wage-price-link 0 for no link or don’t know, 1 weak link, 2 definite link (either wage follow prices or prices
follow wage),
Employee turnover 1 if employee turnover model is ranked as very important or important, 0 otherwise
Indexation Equals 2 in case of complete indexation, 1 for partial indexation and 0 if firm has not
indexed its wages to inflation
Firm hire
1 if firm in one sector of economy has hired from the other sector (i.e a formal firm has hired
employees from the informal sector or for informal sector firm if it has hired from formal
sector), 0 otherwise.
Alternative cost 1 if firm has used any alternative labour cost cutting strategy, 0 otherwise
Bonus 1 if firms provide bonuses, 0 otherwise
BC share of blue collar workers
Time dependent 1 if firm follows strictly time dependent wage review rule, 0 otherwise.
Wage frequency Equals 0 if , 1 if and 2 if 1 if firm change wage more frequent that a
-26-
Appendix B: The Survey
-27-
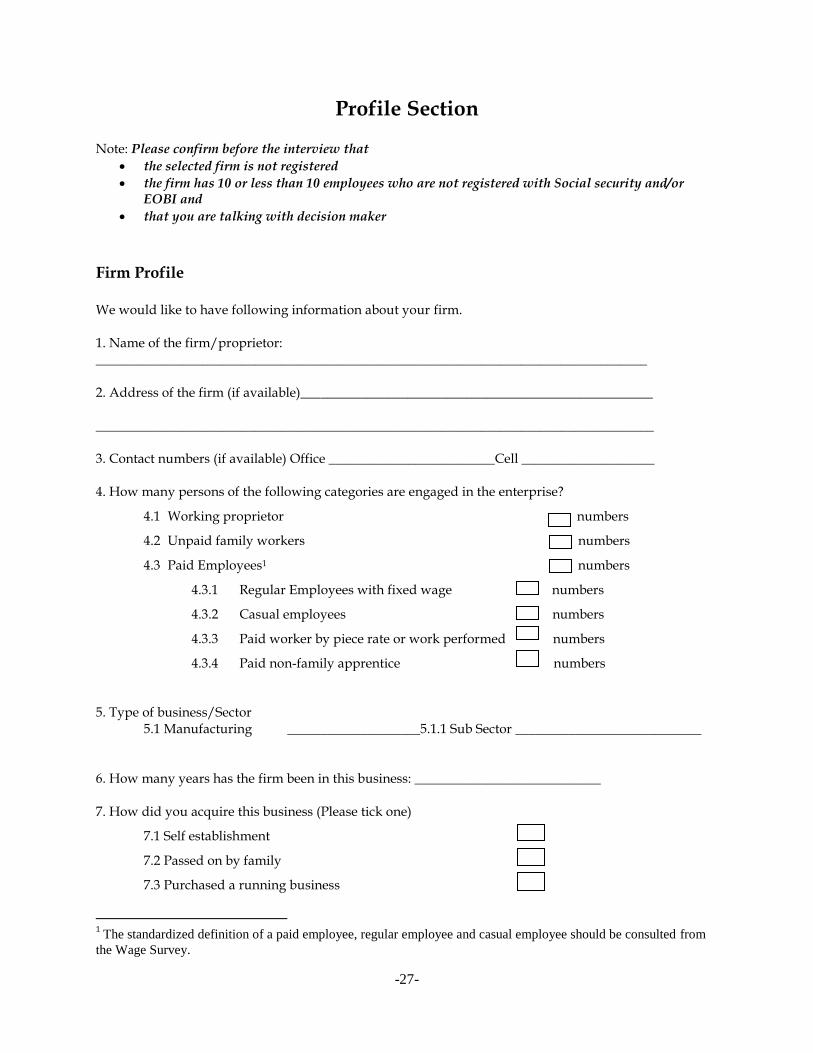
Profile Section Note: Please confirm before the interview that
the selected firm is not registered
the firm has 10 or less than 10 employees who are not registered with Social security and/or EOBI and
that you are talking with decision maker
Firm Profile
We would like to have following information about your firm. 1. Name of the firm/proprietor: ___________________________________________________________________________________ 2. Address of the firm (if available)_____________________________________________________ ____________________________________________________________________________________ 3. Contact numbers (if available) Office _________________________Cell ____________________ 4. How many persons of the following categories are engaged in the enterprise?
4.1 Working proprietor numbers
4.2 Unpaid family workers numbers
4.3 Paid Employees1 numbers
4.3.1 Regular Employees with fixed wage numbers
4.3.2 Casual employees numbers
4.3.3 Paid worker by piece rate or work performed numbers
4.3.4 Paid non-family apprentice numbers
5. Type of business/Sector 5.1 Manufacturing ____________________5.1.1 Sub Sector ____________________________ 6. How many years has the firm been in this business: ____________________________ 7. How did you acquire this business (Please tick one)
7.1 Self establishment
7.2 Passed on by family
7.3 Purchased a running business
1 The standardized definition of a paid employee, regular employee and casual employee should be consulted from
the Wage Survey.
-28-
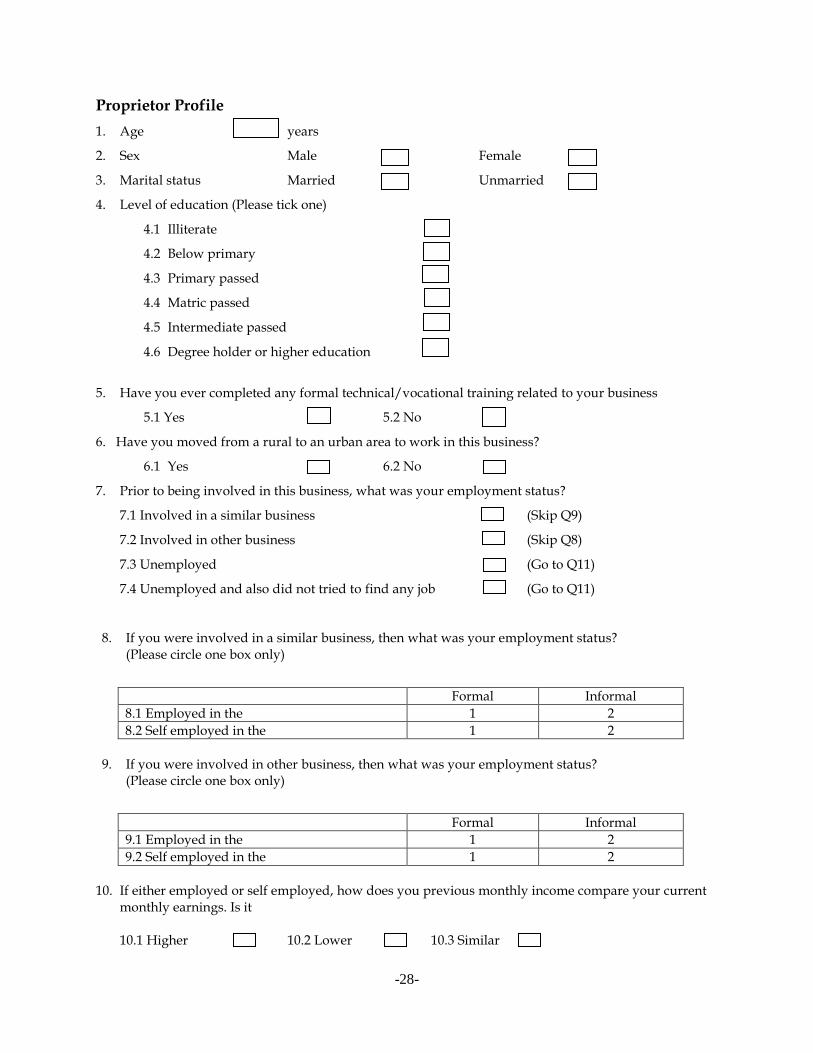
Proprietor Profile
1. Age years
2. Sex Male Female
3. Marital status Married Unmarried
4. Level of education (Please tick one)
4.1 Illiterate
4.2 Below primary
4.3 Primary passed
4.4 Matric passed
4.5 Intermediate passed
4.6 Degree holder or higher education
5. Have you ever completed any formal technical/vocational training related to your business
5.1 Yes 5.2 No
6. Have you moved from a rural to an urban area to work in this business?
6.1 Yes 6.2 No
7. Prior to being involved in this business, what was your employment status?
7.1 Involved in a similar business (Skip Q9)
7.2 Involved in other business (Skip Q8)
7.3 Unemployed (Go to Q11)
7.4 Unemployed and also did not tried to find any job (Go to Q11)
8. If you were involved in a similar business, then what was your employment status? (Please circle one box only)
Formal Informal
8.1 Employed in the 1 2
8.2 Self employed in the 1 2
9. If you were involved in other business, then what was your employment status?
(Please circle one box only)
Formal Informal
9.1 Employed in the 1 2
9.2 Self employed in the 1 2
10. If either employed or self employed, how does you previous monthly income compare your current
monthly earnings. Is it
10.1 Higher 10.2 Lower 10.3 Similar
-29-
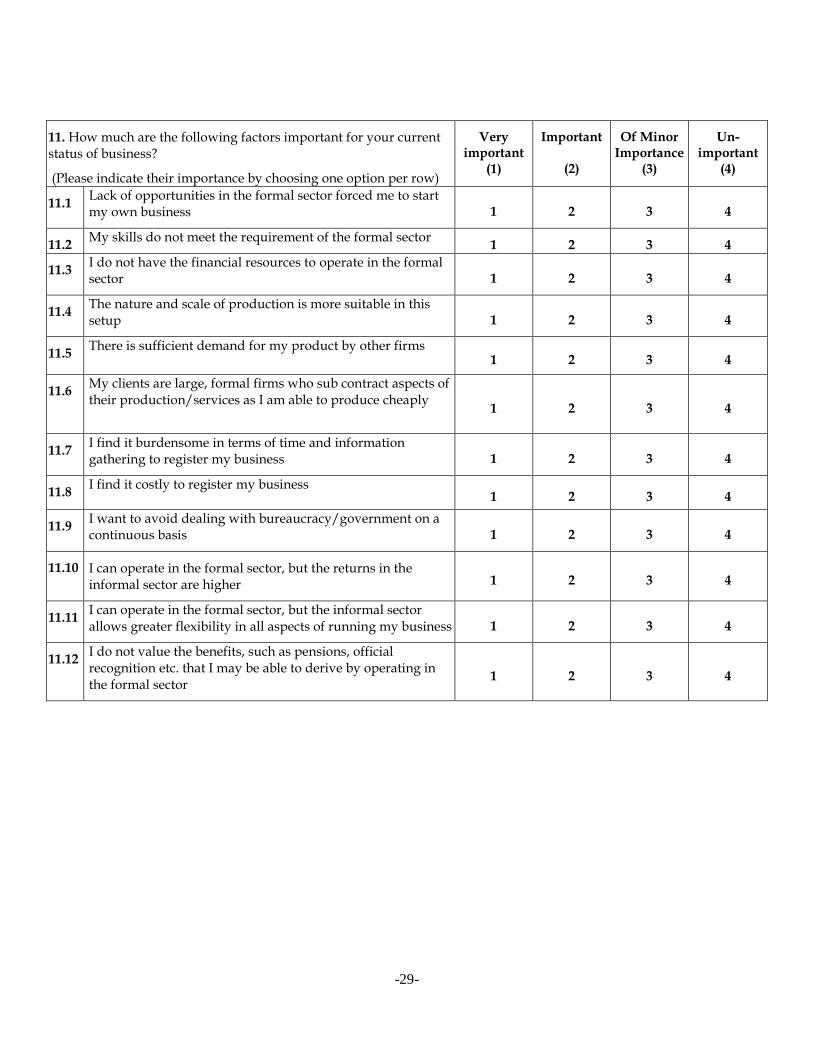
11. How much are the following factors important for your current status of business?
(Please indicate their importance by choosing one option per row)
Very important
(1)
Important
(2)
Of Minor Importance
(3)
Un- important
(4)
11.1 Lack of opportunities in the formal sector forced me to start my own business 1 2 3 4
11.2 My skills do not meet the requirement of the formal sector
1 2 3 4
11.3 I do not have the financial resources to operate in the formal sector 1 2 3 4
11.4 The nature and scale of production is more suitable in this setup 1 2 3 4
11.5 There is sufficient demand for my product by other firms
1 2 3 4
11.6 My clients are large, formal firms who sub contract aspects of their production/services as I am able to produce cheaply
1 2 3 4
11.7 I find it burdensome in terms of time and information gathering to register my business 1 2 3 4
11.8 I find it costly to register my business
1 2 3 4
11.9 I want to avoid dealing with bureaucracy/government on a continuous basis 1 2 3 4
11.10 I can operate in the formal sector, but the returns in the informal sector are higher 1 2 3 4
11.11 I can operate in the formal sector, but the informal sector allows greater flexibility in all aspects of running my business 1 2 3 4
11.12 I do not value the benefits, such as pensions, official recognition etc. that I may be able to derive by operating in the formal sector
1 2 3 4
-30-
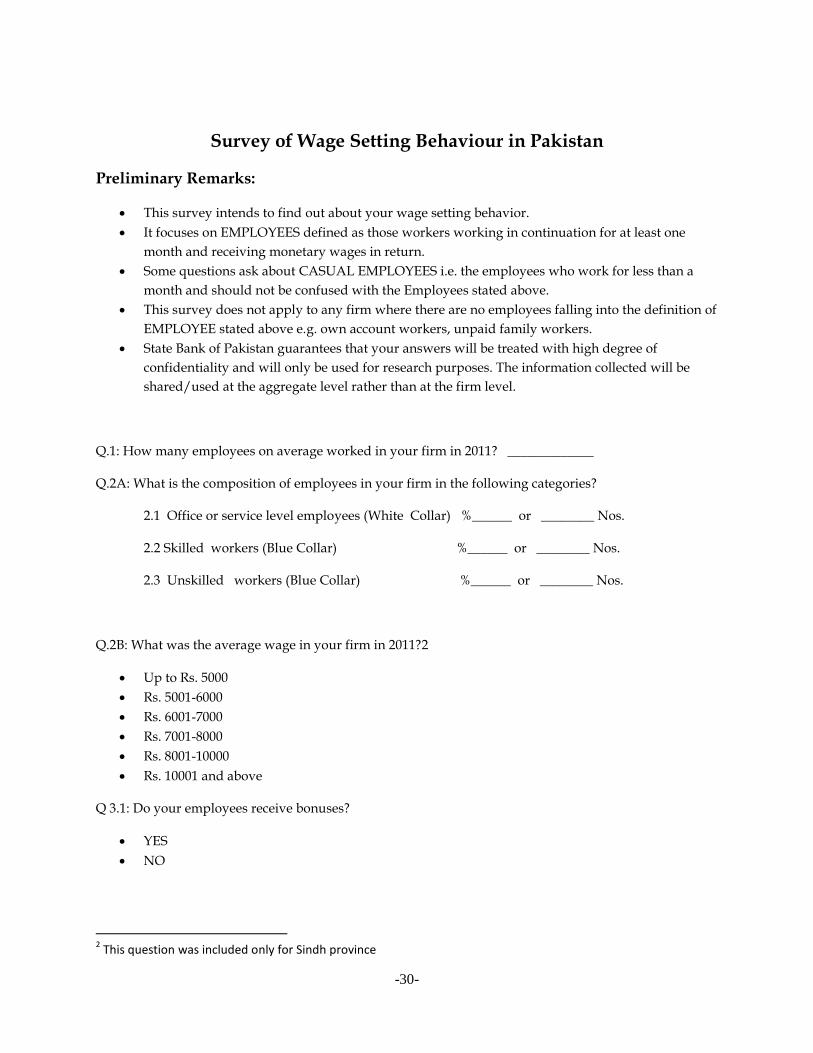
Survey of Wage Setting Behaviour in Pakistan
Preliminary Remarks:
This survey intends to find out about your wage setting behavior.
It focuses on EMPLOYEES defined as those workers working in continuation for at least one
month and receiving monetary wages in return.
Some questions ask about CASUAL EMPLOYEES i.e. the employees who work for less than a
month and should not be confused with the Employees stated above.
This survey does not apply to any firm where there are no employees falling into the definition of
EMPLOYEE stated above e.g. own account workers, unpaid family workers.
State Bank of Pakistan guarantees that your answers will be treated with high degree of
confidentiality and will only be used for research purposes. The information collected will be
shared/used at the aggregate level rather than at the firm level.
Q.1: How many employees on average worked in your firm in 2011? _____________
Q.2A: What is the composition of employees in your firm in the following categories?
2.1 Office or service level employees (White Collar) %______ or ________ Nos.
2.2 Skilled workers (Blue Collar) %______ or ________ Nos.
2.3 Unskilled workers (Blue Collar) %______ or ________ Nos.
Q.2B: What was the average wage in your firm in 2011?2
Up to Rs. 5000
Rs. 5001-6000
Rs. 6001-7000
Rs. 7001-8000
Rs. 8001-10000
Rs. 10001 and above
Q 3.1: Do your employees receive bonuses?
YES
NO
2 This question was included only for Sindh province
-31-
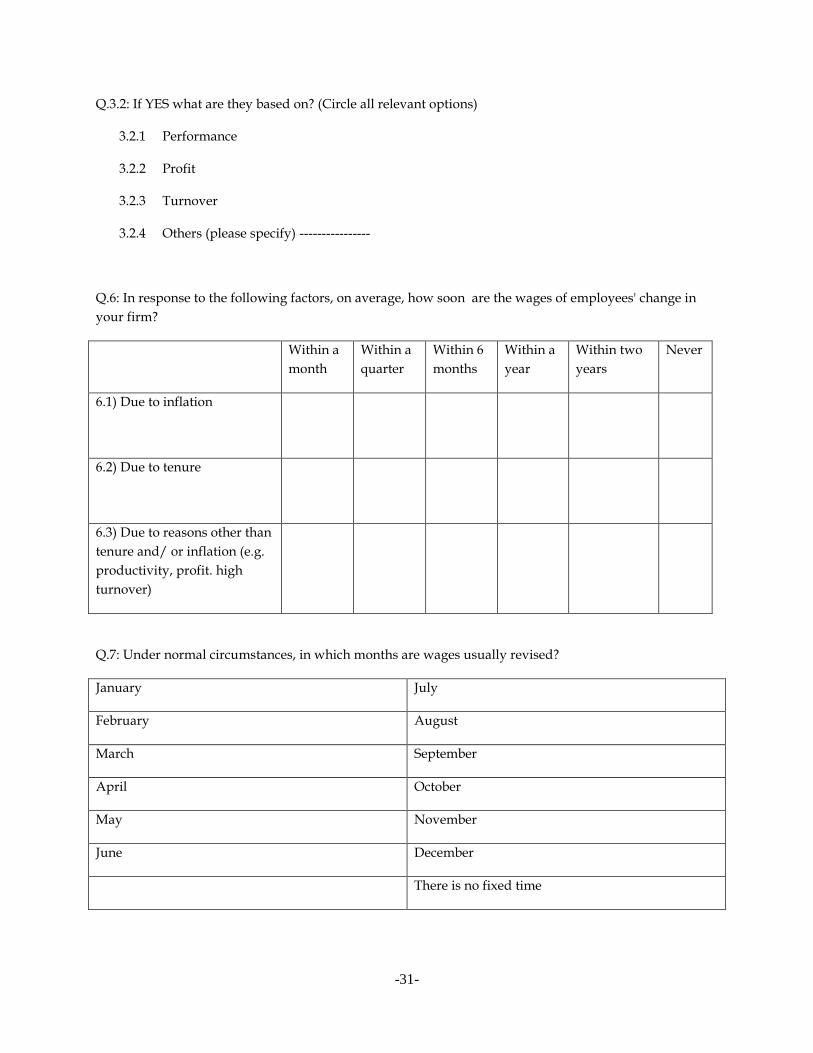
Q.3.2: If YES what are they based on? (Circle all relevant options)
3.2.1 Performance
3.2.2 Profit
3.2.3 Turnover
3.2.4 Others (please specify) ----------------
Q.6: In response to the following factors, on average, how soon are the wages of employees' change in
your firm?
Within a
month
Within a
quarter
Within 6
months
Within a
year
Within two
years
Never
6.1) Due to inflation
6.2) Due to tenure
6.3) Due to reasons other than
tenure and/ or inflation (e.g.
productivity, profit. high
turnover)
Q.7: Under normal circumstances, in which months are wages usually revised?
January July
February August
March September
April October
May November
June December
There is no fixed time
-32-
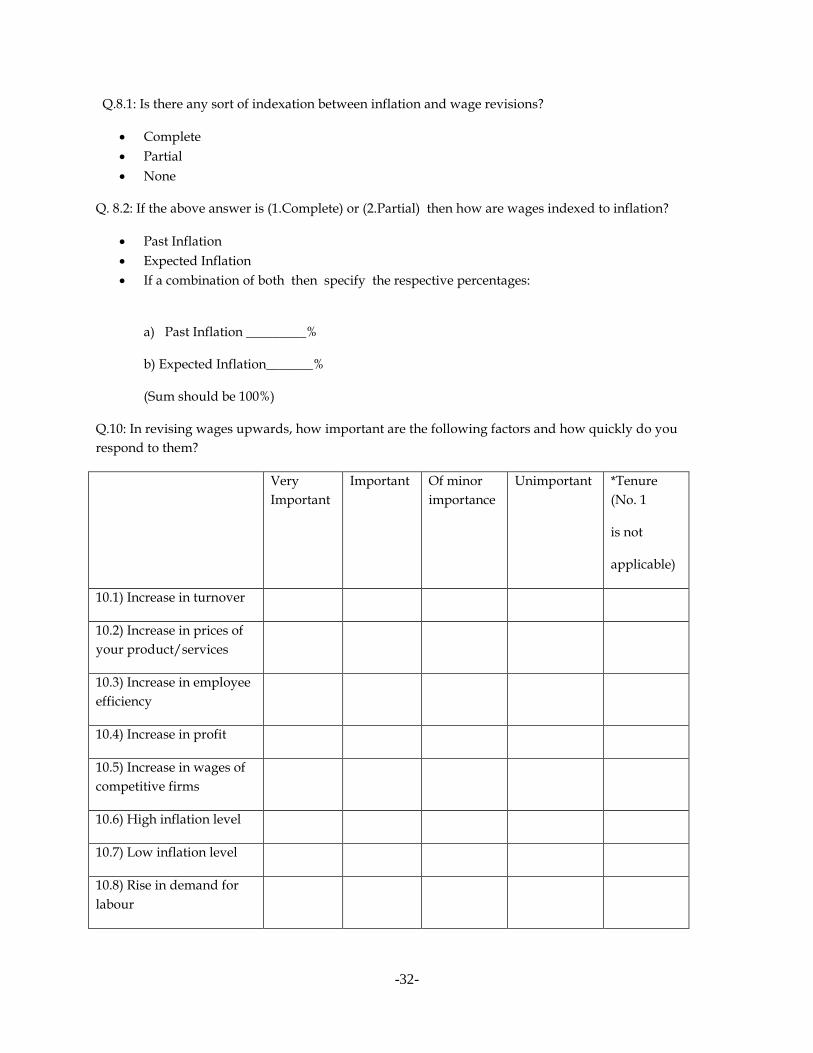
Q.8.1: Is there any sort of indexation between inflation and wage revisions?
Complete
Partial
None
Q. 8.2: If the above answer is (1.Complete) or (2.Partial) then how are wages indexed to inflation?
Past Inflation
Expected Inflation
If a combination of both then specify the respective percentages:
a) Past Inflation _________%
b) Expected Inflation_______%
(Sum should be 100%)
Q.10: In revising wages upwards, how important are the following factors and how quickly do you
respond to them?
Very
Important
Important Of minor
importance
Unimportant *Tenure
(No. 1
is not
applicable)
10.1) Increase in turnover
10.2) Increase in prices of
your product/services
10.3) Increase in employee
efficiency
10.4) Increase in profit
10.5) Increase in wages of
competitive firms
10.6) High inflation level
10.7) Low inflation level
10.8) Rise in demand for
labour
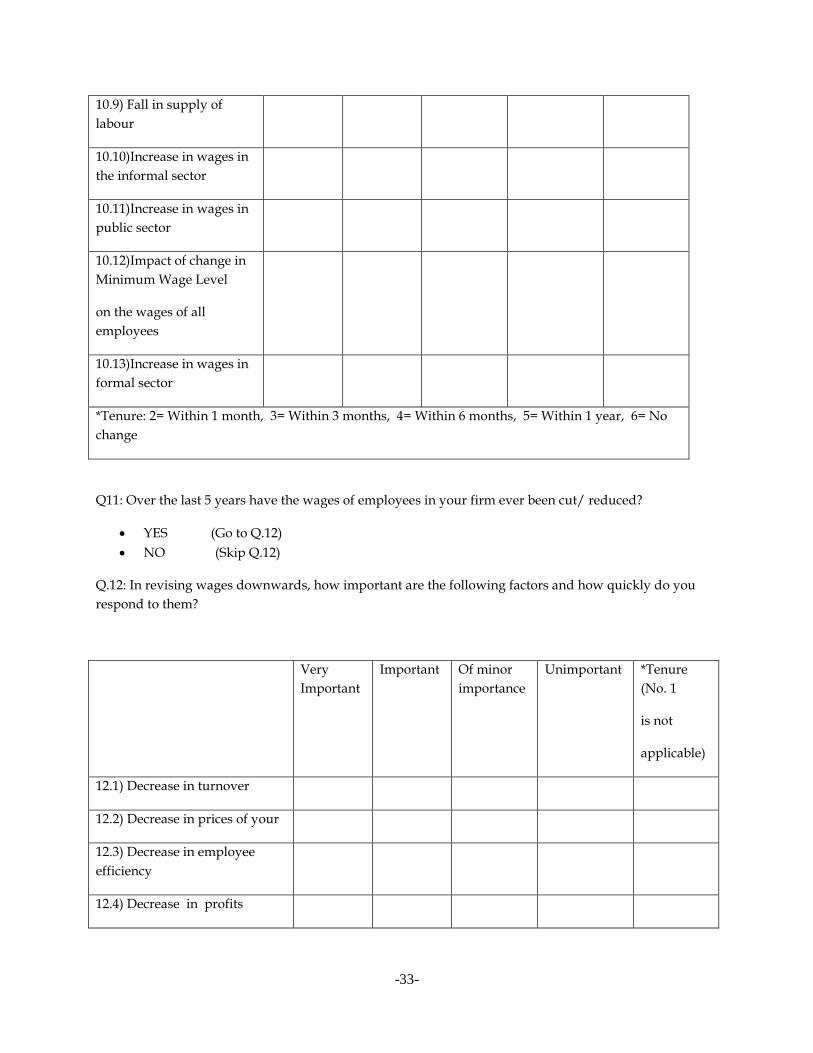
-33-
10.9) Fall in supply of
labour
10.10)Increase in wages in
the informal sector
10.11)Increase in wages in
public sector
10.12)Impact of change in
Minimum Wage Level
on the wages of all
employees
10.13)Increase in wages in
formal sector
*Tenure: 2= Within 1 month, 3= Within 3 months, 4= Within 6 months, 5= Within 1 year, 6= No
change
Q11: Over the last 5 years have the wages of employees in your firm ever been cut/ reduced?
YES (Go to Q.12)
NO (Skip Q.12)
Q.12: In revising wages downwards, how important are the following factors and how quickly do you
respond to them?
Very
Important
Important Of minor
importance
Unimportant *Tenure
(No. 1
is not
applicable)
12.1) Decrease in turnover
12.2) Decrease in prices of your
12.3) Decrease in employee
efficiency
12.4) Decrease in profits
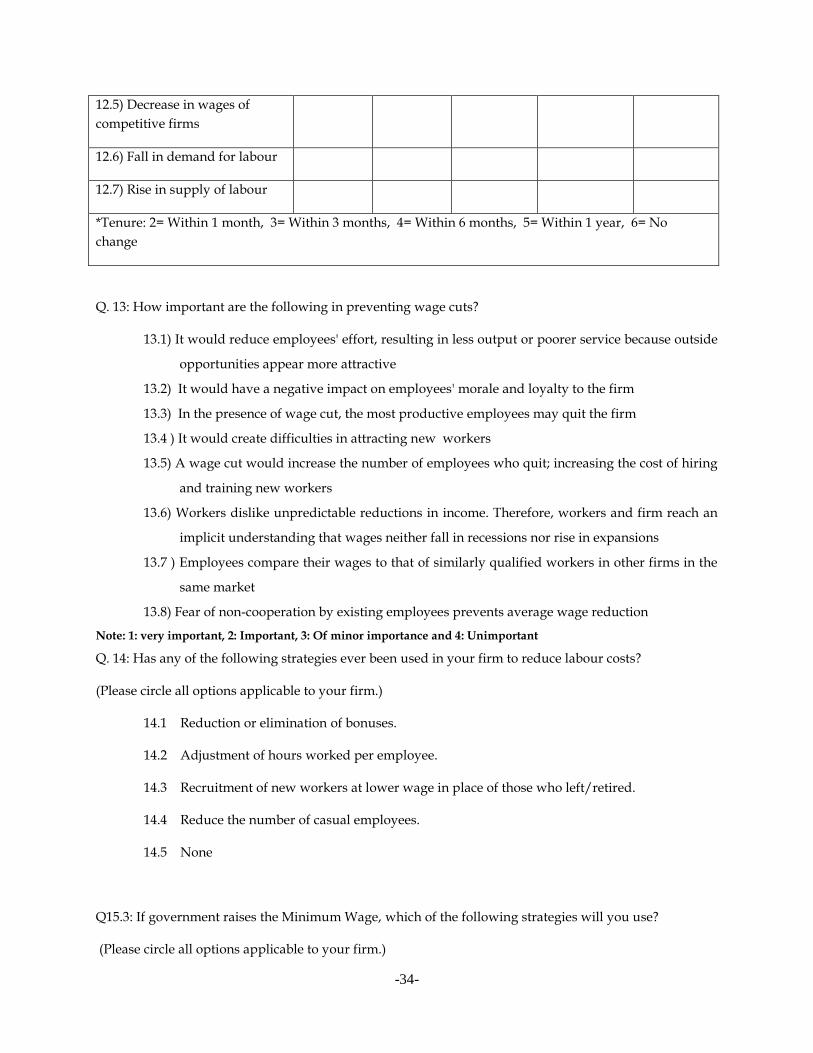
-34-
12.5) Decrease in wages of
competitive firms
12.6) Fall in demand for labour
12.7) Rise in supply of labour
*Tenure: 2= Within 1 month, 3= Within 3 months, 4= Within 6 months, 5= Within 1 year, 6= No
change
Q. 13: How important are the following in preventing wage cuts?
13.1) It would reduce employees' effort, resulting in less output or poorer service because outside
opportunities appear more attractive
13.2) It would have a negative impact on employees' morale and loyalty to the firm
13.3) In the presence of wage cut, the most productive employees may quit the firm
13.4 ) It would create difficulties in attracting new workers
13.5) A wage cut would increase the number of employees who quit; increasing the cost of hiring
and training new workers
13.6) Workers dislike unpredictable reductions in income. Therefore, workers and firm reach an
implicit understanding that wages neither fall in recessions nor rise in expansions
13.7 ) Employees compare their wages to that of similarly qualified workers in other firms in the
same market
13.8) Fear of non-cooperation by existing employees prevents average wage reduction
Note: 1: very important, 2: Important, 3: Of minor importance and 4: Unimportant
Q. 14: Has any of the following strategies ever been used in your firm to reduce labour costs?
(Please circle all options applicable to your firm.)
14.1 Reduction or elimination of bonuses.
14.2 Adjustment of hours worked per employee.
14.3 Recruitment of new workers at lower wage in place of those who left/retired.
14.4 Reduce the number of casual employees.
14.5 None
Q15.3: If government raises the Minimum Wage, which of the following strategies will you use?
(Please circle all options applicable to your firm.)
-35-
15.3.1 Reduce employees
15.3.2 Reduce casual employees
15.3.3 No change
Q. 17: What was the percentage of labour cost in total cost of production for your firm in 2011?
Up to 10 percent
11-25 percent
26-50 percent
51-75 percent
76-100 percent
Q. 18: Is training provided to new employees?
Yes
No
Q. 19: Do you employ workers who, before joining your firm, worked in the formal sector?
Yes (Skip Q.21)
No (Skip Q.20)