sbi magnum balanced fund - sbi mutual fund leaflet and brochure/sbi magnum... · a balanced fund...
TRANSCRIPT
SBI Magnum Balanced Fund

Introduction
WHAT IS BALANCED FUND? CHARACTERISTICS OF EQUITY & DEBT SBI MAGNUM BALANCED FUND ASSET ALLOCATION PERFORMANCE SYNOPSIS PORTFOLIO HOLDINGS PERFORMANCE OF OTHER SCHEMES MANAGED BY FUND MANAGERS FUND MANAGER BIOGRAPHIES ABOUT SBI FM DISCLAIMER

A balanced fund aims to balance the risk & return of the portfolio by investing in more than one asset class. Generally these funds have allocation to asset classes such as equity & debt. Equity & debt assets classes in the fund endeavour to:
Equity • To provide capital appreciation
• To generate returns above inflation
Debt
• To provide stability in the portfolio
• To generate consistent income from coupons
What is balanced fund?
Balanced fund aims to strike a balance between growth & stability
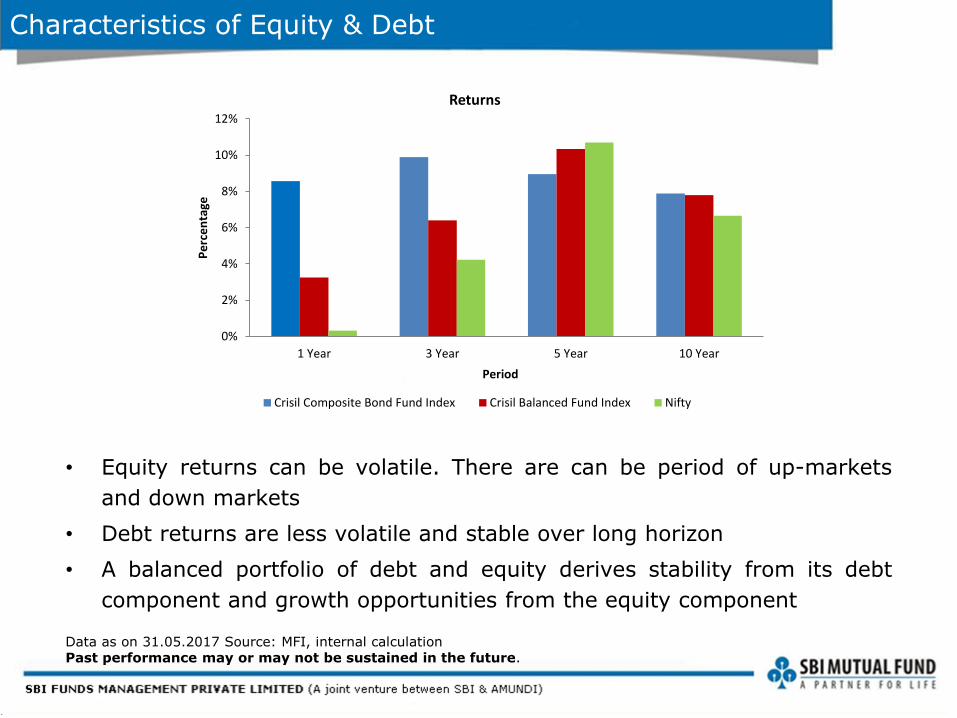
Characteristics of Equity & Debt
• Equity returns can be volatile. There are can be period of up-markets
and down markets
• Debt returns are less volatile and stable over long horizon
• A balanced portfolio of debt and equity derives stability from its debt
component and growth opportunities from the equity component
Data as on 31.05.2017 Source: MFI, internal calculation Past performance may or may not be sustained in the future.
0%
2%
4%
6%
8%
10%
12%
1 Year 3 Year 5 Year 10 Year
Pe
rce
nta
ge
Period
Returns
Crisil Composite Bond Fund Index Crisil Balanced Fund Index Nifty
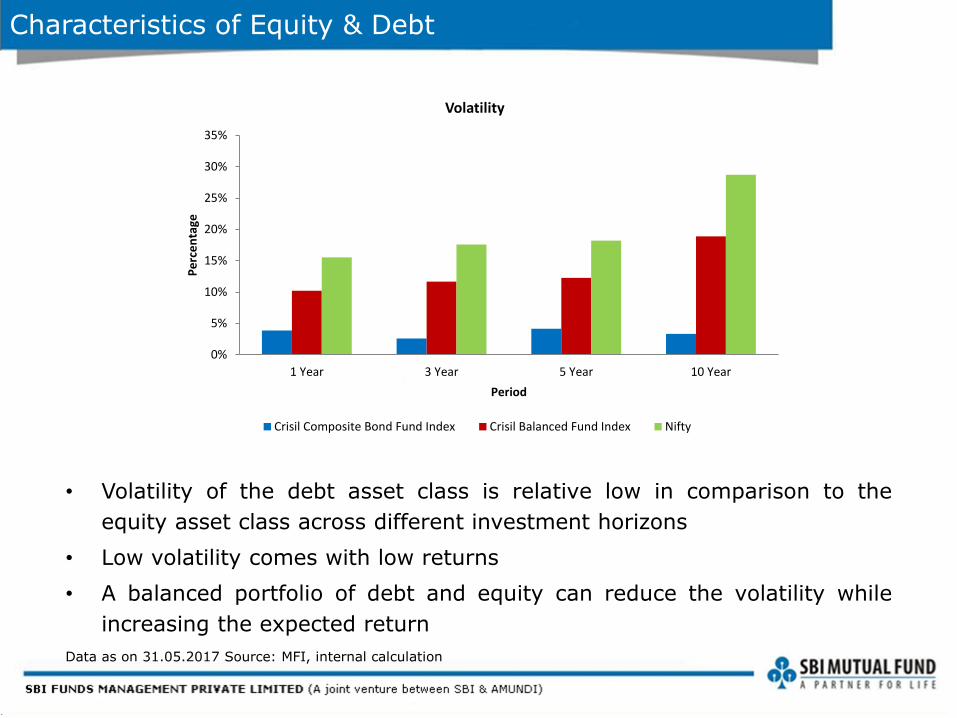
Characteristics of Equity & Debt
• Volatility of the debt asset class is relative low in comparison to the
equity asset class across different investment horizons
• Low volatility comes with low returns
• A balanced portfolio of debt and equity can reduce the volatility while
increasing the expected return
Data as on 31.05.2017 Source: MFI, internal calculation
0%
5%
10%
15%
20%
25%
30%
35%
1 Year 3 Year 5 Year 10 Year
Pe
rce
nta
ge
Period
Volatility
Crisil Composite Bond Fund Index Crisil Balanced Fund Index Nifty
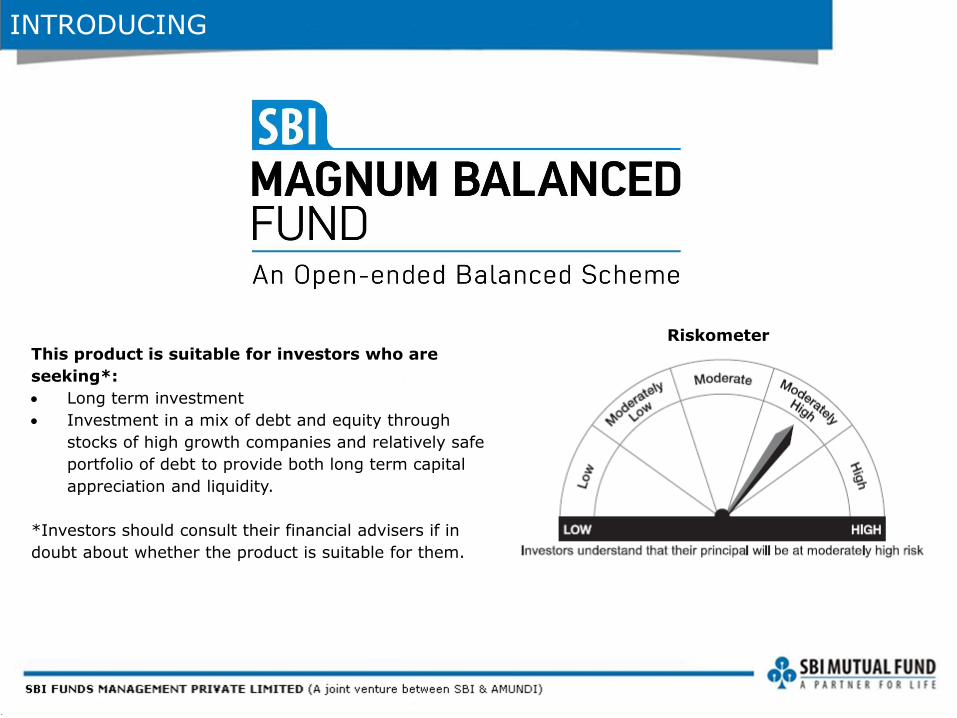
This product is suitable for investors who are
seeking*:
Long term investment
Investment in a mix of debt and equity through
stocks of high growth companies and relatively safe
portfolio of debt to provide both long term capital
appreciation and liquidity.
*Investors should consult their financial advisers if in
doubt about whether the product is suitable for them.
INTRODUCING
Riskometer

Date of Inception 31/12/1995
Benchmark Crisil Balanced Fund –
Aggressive Index
Fund Manager Mr. R. Srinivasan-Equity Mr. Dinesh Ahuja - Debt
Investment Plans
Direct Plan &
Regular Plan
Investment Options
Growth &
Dividend (Payout, Re-investment &
Transfer Facility)
FUND FEATURES
Investment Objective To provide investors long term capital appreciation along with the liquidity of an open-ended scheme by investing in a mix of debt and equity. The scheme will invest in a diversified portfolio of equities of high growth companies and balance the risk through investing the rest in a relatively safe portfolio of debt.
Investment Amount
Minimum investments Rs. 1000 & in multiples of
Re. 1
Additional investments Rs. 1000 & in multiples of
Re. 1
SIP Rs. 100 / month – 60 months Rs. 500 / month – 12 months Rs. 1000 / month – 6 months
Rs. 1500 / quarter – 4 quarters
SBI Magnum Balanced Fund
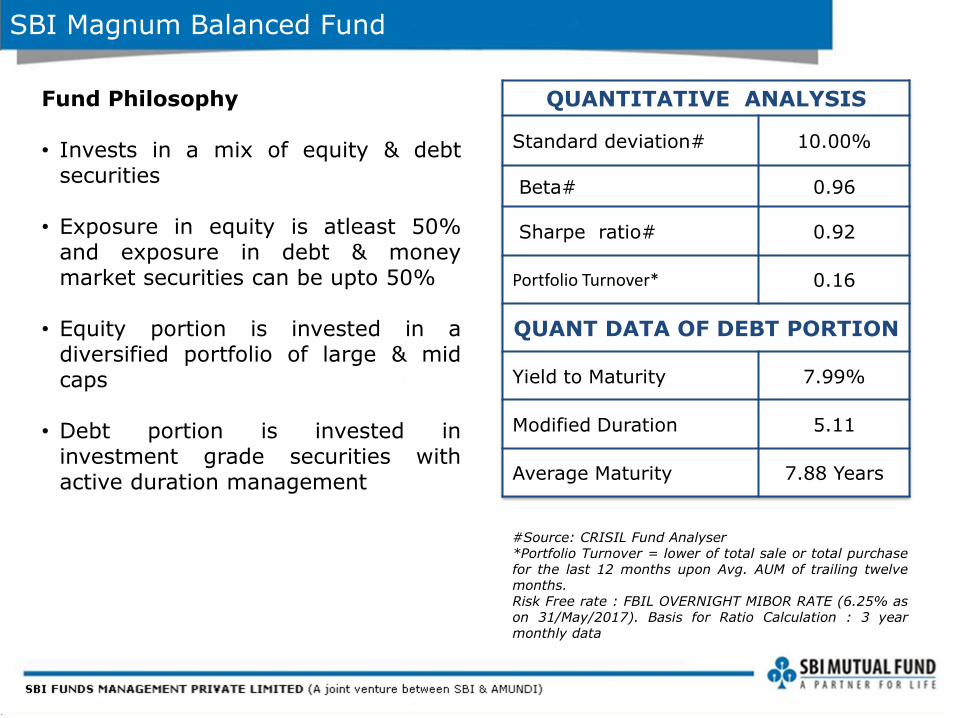
#Source: CRISIL Fund Analyser *Portfolio Turnover = lower of total sale or total purchase for the last 12 months upon Avg. AUM of trailing twelve months. Risk Free rate : FBIL OVERNIGHT MIBOR RATE (6.25% as on 31/May/2017). Basis for Ratio Calculation : 3 year monthly data
QUANTITATIVE ANALYSIS
Standard deviation# 10.00%
Beta# 0.96
Sharpe ratio# 0.92
Portfolio Turnover* 0.16
QUANT DATA OF DEBT PORTION
Yield to Maturity 7.99%
Modified Duration 5.11
Average Maturity 7.88 Years
Fund Philosophy • Invests in a mix of equity & debt
securities
• Exposure in equity is atleast 50% and exposure in debt & money market securities can be upto 50%
• Equity portion is invested in a diversified portfolio of large & mid caps
• Debt portion is invested in investment grade securities with active duration management
SBI Magnum Balanced Fund
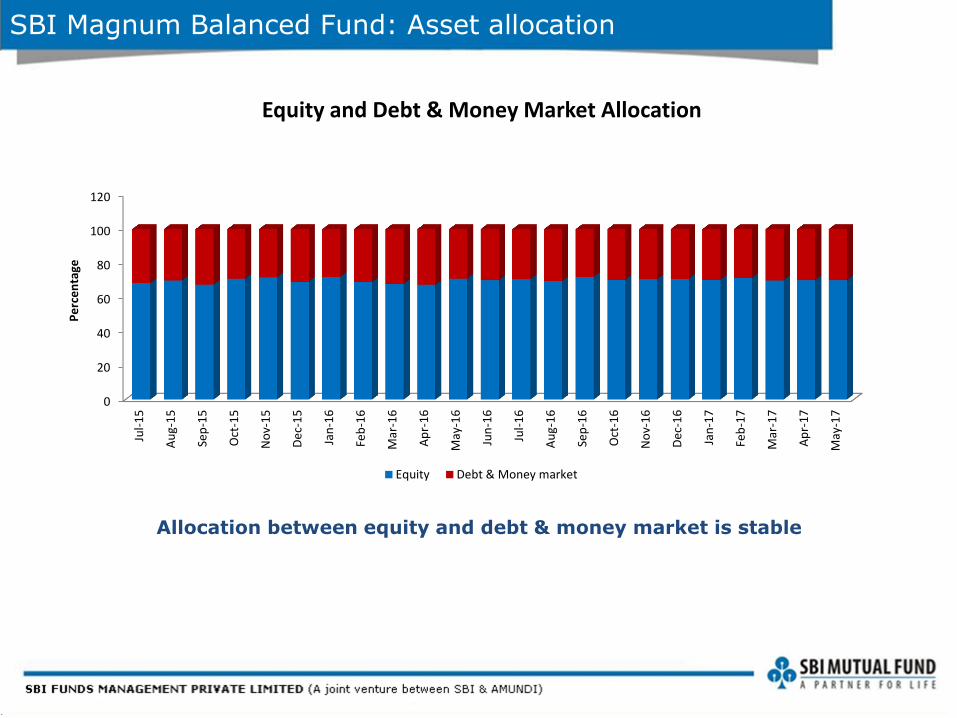
SBI Magnum Balanced Fund: Asset allocation
Allocation between equity and debt & money market is stable
Equity and Debt & Money Market Allocation
0
20
40
60
80
100
120
Jul-
15
Au
g-1
5
Sep
-15
Oct
-15
No
v-1
5
De
c-1
5
Jan
-16
Feb
-16
Mar
-16
Ap
r-1
6
May
-16
Jun
-16
Jul-
16
Au
g-1
6
Sep
-16
Oct
-16
No
v-1
6
De
c-1
6
Jan
-17
Feb
-17
Mar
-17
Ap
r-1
7
May
-17
Pe
rce
nta
ge
Equity Debt & Money market
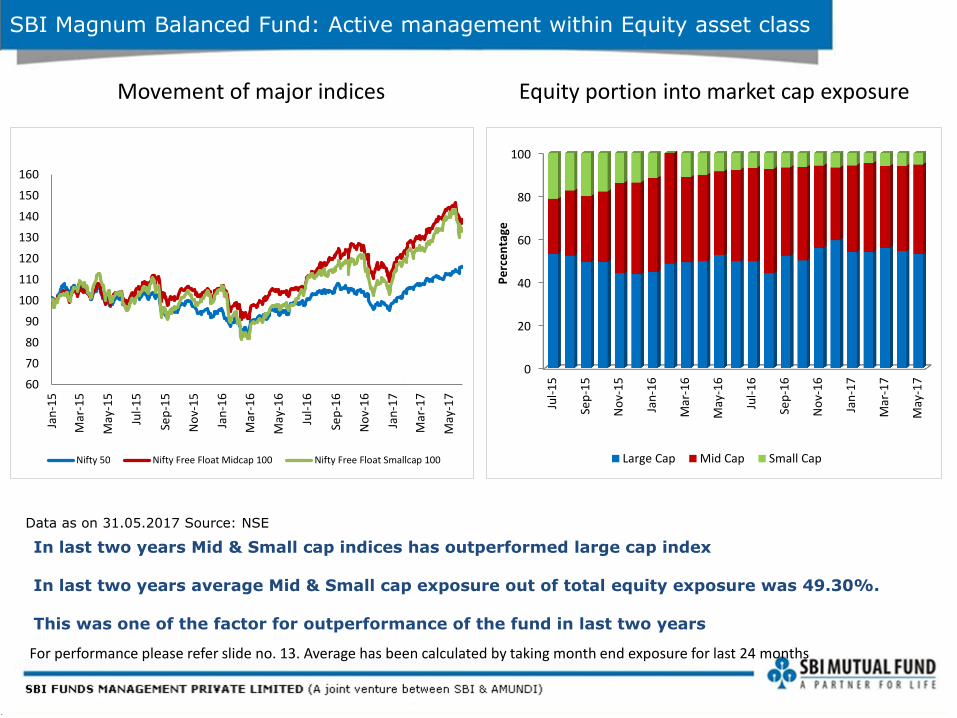
In last two years Mid & Small cap indices has outperformed large cap index In last two years average Mid & Small cap exposure out of total equity exposure was 49.30%. This was one of the factor for outperformance of the fund in last two years
SBI Magnum Balanced Fund: Active management within Equity asset class
Equity portion into market cap exposure Movement of major indices
For performance please refer slide no. 13. Average has been calculated by taking month end exposure for last 24 months
Data as on 31.05.2017 Source: NSE
60
70
80
90
100
110
120
130
140
150
160
Jan
-15
Mar
-15
May
-15
Jul-
15
Sep
-15
No
v-1
5
Jan
-16
Mar
-16
May
-16
Jul-
16
Sep
-16
No
v-1
6
Jan
-17
Mar
-17
May
-17
Nifty 50 Nifty Free Float Midcap 100 Nifty Free Float Smallcap 100
0
20
40
60
80
100
Jul-
15
Sep
-15
No
v-1
5
Jan
-16
Mar
-16
May
-16
Jul-
16
Sep
-16
No
v-1
6
Jan
-17
Mar
-17
May
-17
Pe
rce
nta
ge
Large Cap Mid Cap Small Cap

SBI Magnum Balanced Fund: Active management within Debt asset class
Debt portion is managed dynamically based on interest rate view, inflation & credit risk In last two years, yields have moved in a trending way Dynamic allocation between of debt & money market portion into debt & cash has helped fund to outperform in last two years
Movement of major government securities yields Debt & money market portion into debt & cash exposure
Data as on 31.05..2017 Source: Bloomberg
For performance please refer slide no. 13.
0
20
40
60
80
100
Jul-
15
Sep
-15
No
v-1
5
Jan
-16
Mar
-16
May
-16
Jul-
16
Sep
-16
No
v-1
6
Jan
-17
Mar
-17
May
-17
Pe
rce
nta
ge
Debt Cash
5
6
7
8
9
Jan
-15
Mar
-15
May
-15
Jul-
15
Sep
-15
No
v-1
5
Jan
-16
Mar
-16
May
-16
Jul-
16
Sep
-16
No
v-1
6
Jan
-17
Mar
-17
May
-17
Pe
rce
nta
ge
91 Day 1 Year 10 Year
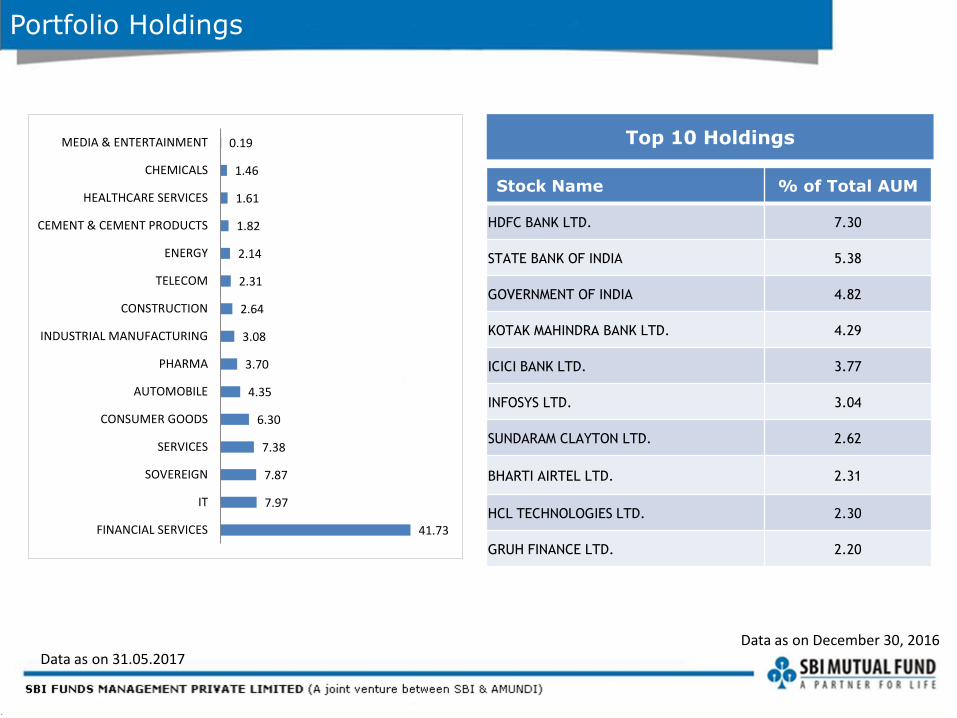
Portfolio Holdings
Data as on December 30, 2016
Top 10 Holdings
Stock Name % of Total AUM
HDFC BANK LTD. 7.30
STATE BANK OF INDIA 5.38
GOVERNMENT OF INDIA 4.82
KOTAK MAHINDRA BANK LTD. 4.29
ICICI BANK LTD. 3.77
INFOSYS LTD. 3.04
SUNDARAM CLAYTON LTD. 2.62
BHARTI AIRTEL LTD. 2.31
HCL TECHNOLOGIES LTD. 2.30
GRUH FINANCE LTD. 2.20
Data as on 31.05.2017
41.73
7.97
7.87
7.38
6.30
4.35
3.70
3.08
2.64
2.31
2.14
1.82
1.61
1.46
0.19
FINANCIAL SERVICES
IT
SOVEREIGN
SERVICES
CONSUMER GOODS
AUTOMOBILE
PHARMA
INDUSTRIAL MANUFACTURING
CONSTRUCTION
TELECOM
ENERGY
CEMENT & CEMENT PRODUCTS
HEALTHCARE SERVICES
CHEMICALS
MEDIA & ENTERTAINMENT
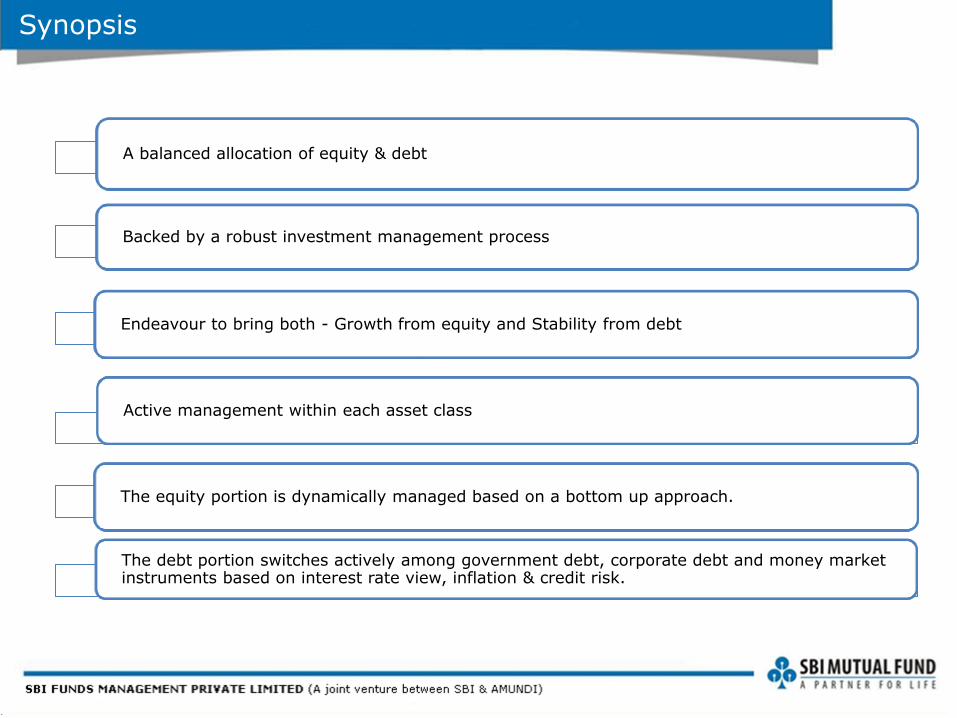
Synopsis
A balanced allocation of equity & debt
Backed by a robust investment management process
Endeavour to bring both - Growth from equity and Stability from debt
Active management within each asset class
The equity portion is dynamically managed based on a bottom up approach.
The debt portion switches actively among government debt, corporate debt and money market instruments based on interest rate view, inflation & credit risk.
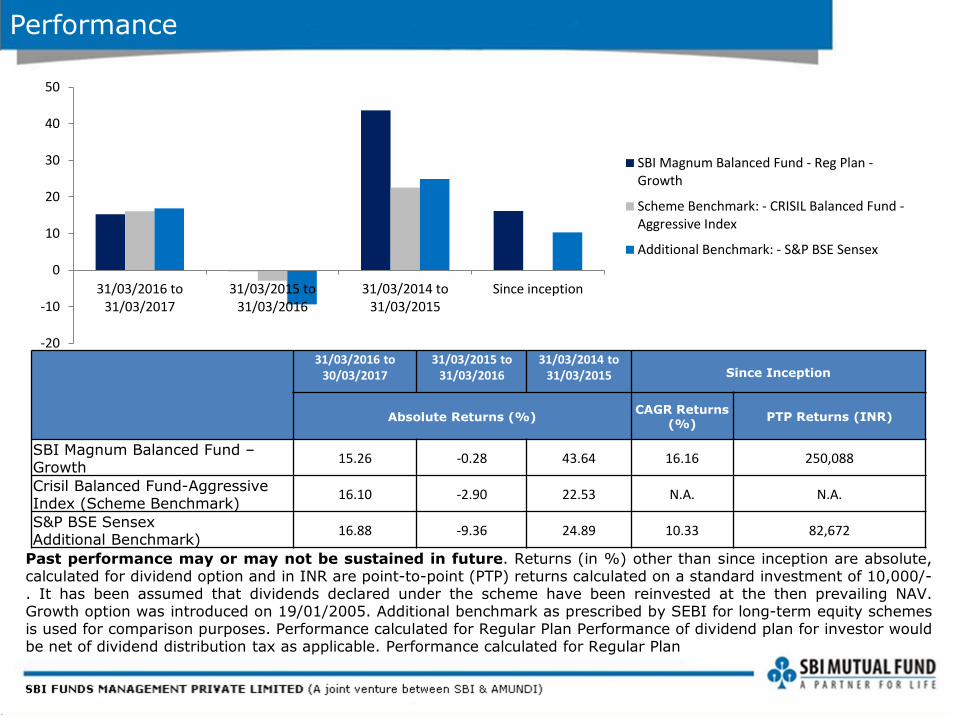
Performance
Past performance may or may not be sustained in future. Returns (in %) other than since inception are absolute, calculated for dividend option and in INR are point-to-point (PTP) returns calculated on a standard investment of 10,000/-. It has been assumed that dividends declared under the scheme have been reinvested at the then prevailing NAV. Growth option was introduced on 19/01/2005. Additional benchmark as prescribed by SEBI for long-term equity schemes is used for comparison purposes. Performance calculated for Regular Plan Performance of dividend plan for investor would be net of dividend distribution tax as applicable. Performance calculated for Regular Plan
31/03/2016 to 30/03/2017
31/03/2015 to 31/03/2016
31/03/2014 to 31/03/2015 Since Inception
Absolute Returns (%) CAGR Returns
(%) PTP Returns (INR)
SBI Magnum Balanced Fund – Growth
15.26 -0.28 43.64 16.16 250,088
Crisil Balanced Fund-Aggressive Index (Scheme Benchmark)
16.10 -2.90 22.53 N.A. N.A.
S&P BSE Sensex Additional Benchmark)
16.88 -9.36 24.89 10.33 82,672
-20
-10
0
10
20
30
40
50
31/03/2016 to31/03/2017
31/03/2015 to31/03/2016
31/03/2014 to31/03/2015
Since inception
SBI Magnum Balanced Fund - Reg Plan -Growth
Scheme Benchmark: - CRISIL Balanced Fund -Aggressive Index
Additional Benchmark: - S&P BSE Sensex

Performance of Schemes Managed by R. Srinivasan
Since inception NAV has been assumed at Rs 10.
Past performance may or may not be sustained in future. Returns (in %) other than since inception are absolute, calculated for dividend option and in INR are point-to-point (PTP) returns calculated on a standard investment of 10,000/-. It is assumed that dividends declared under the scheme have been reinvested at the then prevailing NAV. Growth option introduced on 27/11/2006. Additional benchmark as prescribed by SEBI for equity schemes is used for comparison purposes. Performance calculated for Regular Plan Performance of dividend plan for investor would be net of dividend distribution tax as applicable. Performance calculated for Regular Plan
Past performance may or may not be sustained in future. Returns (in %) other than since inception are absolute, calculated for dividend option and in INR are point-to-point (PTP) returns calculated on a standard investment of 10,000/-. It is assumed that dividends declared under the scheme have been reinvested at the then prevailing NAV. Growth option introduced on 27/06/2005. Additional benchmark as prescribed by SEBI for long-term equity schemes is used for comparison purposes. Performance calculated for Regular Plan. Performance of dividend plan for investor would be net of dividend distribution tax as applicable.
Past performance may or may not be sustained in future. Returns (in %) other than since inception are absolute, calculated for dividend option and in INR are point-to-point (PTP) returns calculated on a standard investment of 10,000/-. It is assumed that dividends declared under the scheme have been reinvested at the then prevailing NAV. Growth option introduced on 06/05/2005. Additional benchmark as prescribed by SEBI for equity schemes is used for comparison purposes. Performance of dividend plan for investor would be net of dividend distribution tax as applicable. Performance calculated for Regular Plan
31/03/2016 to 30/03/2017
31/03/2015 to 31/03/2016
31/03/2014 to 31/03/2015
Since Inception
Absolute Returns (%) CAGR Returns
(%) PTP Returns (INR)
SBI Magnum Equity Fund 18.17 -3.49 39.76 14.75 370,937 Nifty 50 (Scheme Benchmark) 18.55 -8.86 26.65 13.65 287,623
S&P BSE Sensex (Additional Benchmark) 16.88 -9.36 24.89 13.78 296,424
31/03/2016 to 30/03/2017
31/03/2015 to 31/03/2016
31/03/2014 to 31/03/2015 Since Inception
Absolute Returns (%) CAGR Returns
(%) PTP Returns
(INR)
SBI Magnum Global Fund 15.23 -6.19 66.01 14.90 228,118 S&P BSE Midcap Index (Scheme Benchmark) 35.14 -3.34 51.11 N.A. N.A. S&P BSE Sensex (Additional Benchmark) 16.88 -9.36 24.89 8.97 69,191
31/03/2016 to 30/03/2017
31/03/2015 to 31/03/2016
31/03/2014 to 31/03/2015 Since Inception
Absolute Returns (%) CAGR Returns
(%) PTP Returns
(INR)
SBI Contra Fund 19.58 -7.10 45.24 19.96 252,931
S&P BSE 100 Index (Scheme Benchmark) 21.17 -8.96 28.32 13.05 88,283
S&P BSE Sensex (Additional Benchmark) 16.88 -9.36 24.89 11.48 68,783

Performance of Schemes Managed by R. Srinivasan
Past performance may or may not be sustained in future. Returns (in %) other than since inception are absolute, calculated for growth option and in INR are point-to-point (PTP) returns calculated on a standard investment of 10,000/-. Additional benchmark as prescribed by SEBI for equity schemes is used for comparison purposes. Performance calculated for Regular Plan.
Since inception NAV has been assumed at Rs 10.
Past performance may or may not be sustained in future. Returns (in %) other than since inception are absolute, calculated for growth option and in INR are point-to-point (PTP) returns calculated on a standard investment of 10,000/-. Additional benchmark as prescribed by SEBI for equity schemes is used for comparison purposes. Performance calculated for Regular Plan
31/03/2016 to 30/03/2017
31/03/2015 to 31/03/2016
31/03/2014 to 31/03/2015
Since Inception
Absolute Returns (%) CAGR Returns
(%) PTP Returns
(INR)
SBI Emerging Businesses Fund 19.20 -1.44 53.78 20.83 107,296
S&P BSE 500 Index (Scheme Benchmark) 24.02 -7.82 33.19 14.77 56,266
S&P BSE Sensex (Additional Benchmark) 16.88 -9.36 24.89 14.27 53,263
31/03/2016 to 30/03/2017
31/03/2015 to 31/03/2016
31/03/2014 to 31/03/2015 Since Inception
Absolute Returns (%) CAGR Returns
(%) PTP Returns
(INR)
SBI Small and Midcap Fund – Growth 30.68 8.66 89.90 20.46 40,861
S&P BSE Small Cap Index (Scheme Benchmark) 36.92 -3.20 53.99 9.67 20,093
S&P BSE Sensex (Additional Benchmark) 16.88 -9.36 24.89 8.32 18,303
Past performance may or may not be sustained in future. Returns (in %) other than since inception are absolute, calculated for growth option and in INR are point-to-point (PTP) returns calculated on a standard investment of 10,000/-. Additional benchmark as prescribed by SEBI for equity schemes is used for comparison purposes. Performance calculated for Regular Plan.
Past performance may or may not be sustained in future. Returns (in %) other than since inception are absolute, calculated for growth option and in INR are point-to-point (PTP) returns calculated on a standard investment of 10,000/-. Additional benchmark as prescribed by SEBI for equity schemes is used for comparison purposes. Performance calculated for Regular Plan
31/03/2016 to 30/03/2017
31/03/2015 to 31/03/2016
31/03/2014 to 31/03/2015
Since Inception
Absolute Returns (%) CAGR Returns
(%) PTP Returns
(INR)
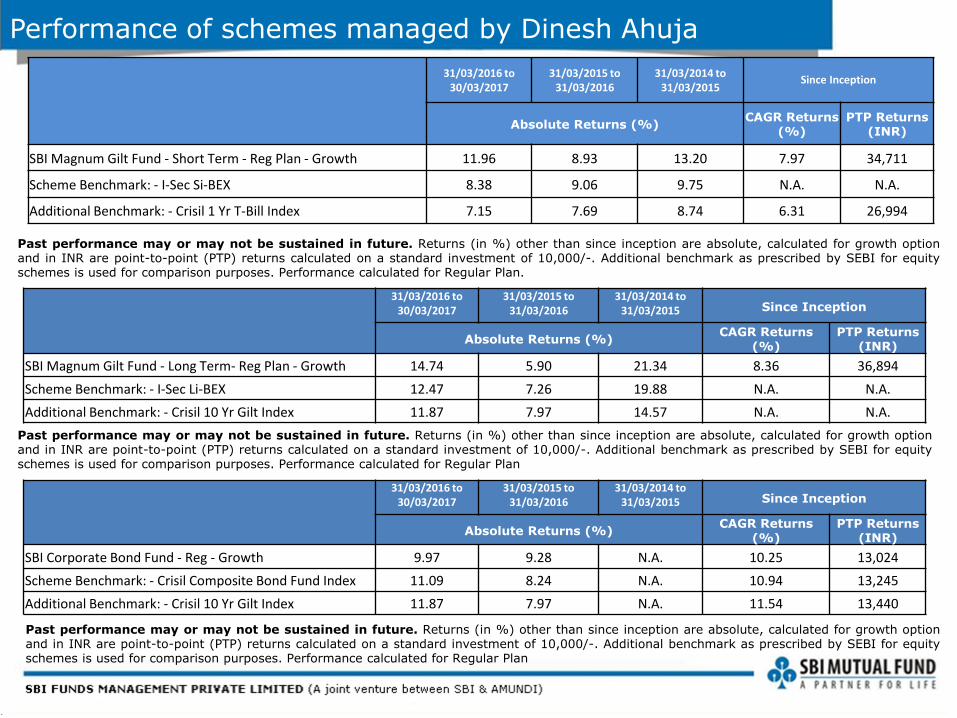
SBI Magnum Gilt Fund - Short Term - Reg Plan - Growth 11.96 8.93 13.20 7.97 34,711
Scheme Benchmark: - I-Sec Si-BEX 8.38 9.06 9.75 N.A. N.A.
Additional Benchmark: - Crisil 1 Yr T-Bill Index 7.15 7.69 8.74 6.31 26,994
31/03/2016 to 30/03/2017
31/03/2015 to 31/03/2016
31/03/2014 to 31/03/2015 Since Inception
Absolute Returns (%) CAGR Returns
(%) PTP Returns
(INR)
SBI Magnum Gilt Fund - Long Term- Reg Plan - Growth 14.74 5.90 21.34 8.36 36,894
Scheme Benchmark: - I-Sec Li-BEX 12.47 7.26 19.88 N.A. N.A.
Additional Benchmark: - Crisil 10 Yr Gilt Index 11.87 7.97 14.57 N.A. N.A.
31/03/2016 to 30/03/2017
31/03/2015 to 31/03/2016
31/03/2014 to 31/03/2015 Since Inception
Absolute Returns (%) CAGR Returns
(%) PTP Returns
(INR)
SBI Corporate Bond Fund - Reg - Growth 9.97 9.28 N.A. 10.25 13,024
Scheme Benchmark: - Crisil Composite Bond Fund Index 11.09 8.24 N.A. 10.94 13,245
Additional Benchmark: - Crisil 10 Yr Gilt Index 11.87 7.97 N.A. 11.54 13,440
Past performance may or may not be sustained in future. Returns (in %) other than since inception are absolute, calculated for growth option and in INR are point-to-point (PTP) returns calculated on a standard investment of 10,000/-. Additional benchmark as prescribed by SEBI for equity schemes is used for comparison purposes. Performance calculated for Regular Plan
Performance of schemes managed by Dinesh Ahuja

Past performance may or may not be sustained in future. Returns (in %) other than since inception are absolute, calculated for growth option and in INR are point-to-point (PTP) returns calculated on a standard investment of 10,000/-. Additional benchmark as prescribed by SEBI for equity schemes is used for comparison purposes. Performance calculated for Regular Plan.
Past performance may or may not be sustained in future. Returns (in %) other than since inception are absolute, calculated for growth option and in INR are point-to-point (PTP) returns calculated on a standard investment of 10,000/-. Additional benchmark as prescribed by SEBI for equity schemes is used for comparison purposes. Performance calculated for Regular Plan
31/03/2016 to 30/03/2017
31/03/2015 to 31/03/2016
31/03/2014 to 31/03/2015
Since Inception
Absolute Returns (%) CAGR Returns
(%) PTP Returns
(INR)
SBI Dynamic Bond Fund - Reg Plan - Growth 13.62 5.57 13.69 5.65 20,600
Scheme Benchmark: - Crisil Composite Bond Fund Index 11.09 8.24 14.59 6.75 23,617
Additional Benchmark: - Crisil 10 Yr Gilt Index 11.87 7.97 14.57 5.80 20,995
31/03/2016 to 30/03/2017
31/03/2015 to 31/03/2016
31/03/2014 to 31/03/2015 Since Inception
Absolute Returns (%) CAGR Returns
(%) PTP Returns
(INR)
SBI Magnum Income Fund - Reg Plan - Growth 12.71 5.86 13.09 7.86 40,132
Scheme Benchmark: - Crisil Composite Bond Fund Index 11.09 8.24 14.59 N.A. N.A.
Additional Benchmark: - Crisil 10 Yr Gilt Index 11.87 7.97 14.57 N.A. N.A.
Performance of schemes managed by Dinesh Ahuja
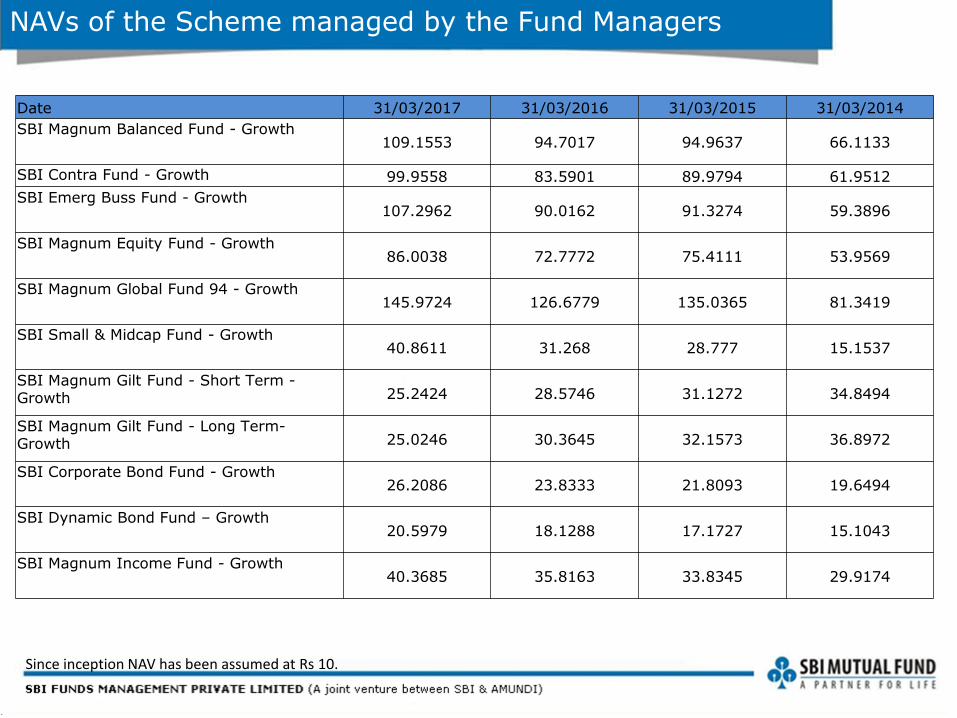
NAVs of the Scheme managed by the Fund Managers
Since inception NAV has been assumed at Rs 10.
Date 31/03/2017 31/03/2016 31/03/2015 31/03/2014
SBI Magnum Balanced Fund - Growth 109.1553 94.7017 94.9637 66.1133
SBI Contra Fund - Growth 99.9558 83.5901 89.9794 61.9512
SBI Emerg Buss Fund - Growth 107.2962 90.0162 91.3274 59.3896
SBI Magnum Equity Fund - Growth 86.0038 72.7772 75.4111 53.9569
SBI Magnum Global Fund 94 - Growth 145.9724 126.6779 135.0365 81.3419
SBI Small & Midcap Fund - Growth 40.8611 31.268 28.777 15.1537
SBI Magnum Gilt Fund - Short Term - Growth 25.2424 28.5746 31.1272 34.8494
SBI Magnum Gilt Fund - Long Term- Growth 25.0246 30.3645 32.1573 36.8972
SBI Corporate Bond Fund - Growth 26.2086 23.8333 21.8093 19.6494
SBI Dynamic Bond Fund – Growth 20.5979 18.1288 17.1727 15.1043
SBI Magnum Income Fund - Growth 40.3685 35.8163 33.8345 29.9174

• Mr. Navneet Munot - Chief Investment Officer
Navneet joined SBIFM as Chief Investment Officer in 2008. In his role Navneet is responsible for
overseeing investments across asset classes worth over $29.10 billion. His prior stint was with Morgan
Stanley Investment Management as Executive Director and head- multi strategy boutique. Prior to that,
Navneet was the Chief Investment Officer - Fixed Income and Hybrid Funds at Birla Sun Life Asset
Management Company Ltd. Navneet had been associated with the financial services business of the Birla
group for 14 years and worked in various areas such as fixed income, equities and foreign exchange.
Navneet holds masters in accountancy and business statistics from the University of Ajmer and is a
Chartered Accountant from ICAI. He is a charter holder of the CFA Institute USA and CAIA Institute USA.
He is also an FRM charter holder of Global Association of Risk professionals (GARP).
Mr. R. Srinivasan – Fund Manager Equity portion
Mr. Srinivasan joined SBI Funds Management as a Senior Fund Manager in May 2009, now heads
equities and also directly manages a few funds. He has an experience of over 20 years in capital
markets having worked with FCH, Principal PNB, Oppenheimer & Co, Indosuez WI Carr and Motilal
Oswal, among others. Srinivasan is a post graduate in commerce and has done his MFM from the
University of Bombay.
Mr. Dinesh Ahuja - Fund Manager Debt portion
Dinesh joined SBI Funds Management Pvt. Ltd. as a fixed income portfolio manager in 2010. Prior to
joining SBI Funds Management Pvt. Ltd. Dinesh was a portfolio manager at L&T Asset Management and
Reliance Group for four years. Dinesh started his career in 1998 as a fixed income dealer on the sell
side. Thereafter he worked in leading broking outfits for eight years before moving on the buy side in
2006. Dinesh is a commerce graduate and has completed his Masters in Management Studies from
Mumbai University
Biographies
21
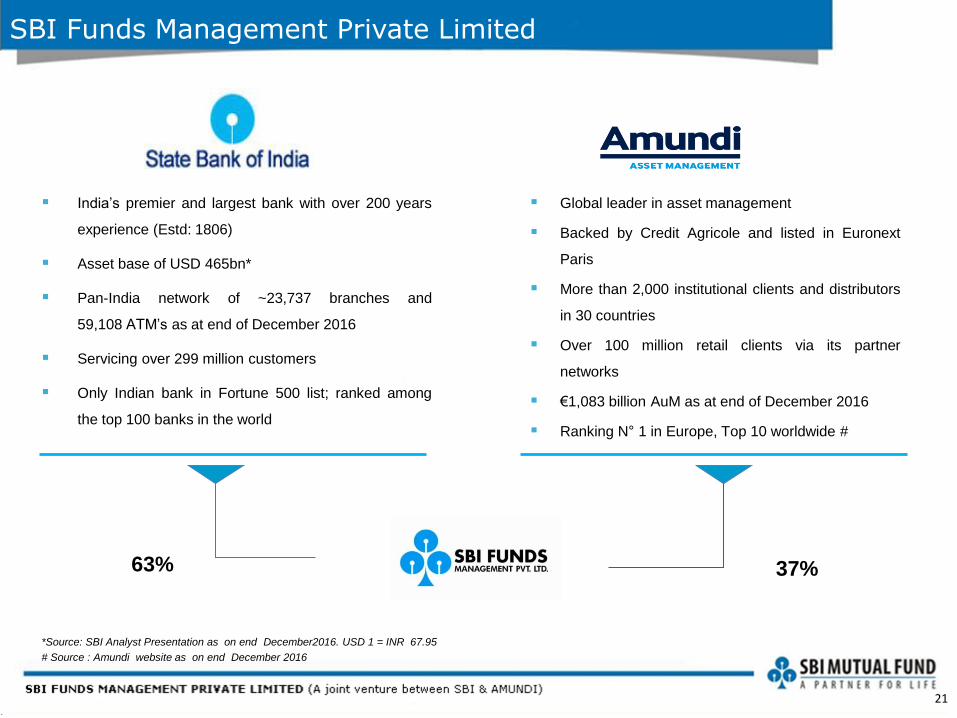
SBI Funds Management Private Limited
*Source: SBI Analyst Presentation as on end December2016. USD 1 = INR 67.95
# Source : Amundi website as on end December 2016
63% 37%
India’s premier and largest bank with over 200 years
experience (Estd: 1806)
Asset base of USD 465bn*
Pan-India network of ~23,737 branches and
59,108 ATM’s as at end of December 2016
Servicing over 299 million customers
Only Indian bank in Fortune 500 list; ranked among
the top 100 banks in the world
Global leader in asset management
Backed by Credit Agricole and listed in Euronext
Paris
More than 2,000 institutional clients and distributors
in 30 countries
Over 100 million retail clients via its partner
networks
€1,083 billion AuM as at end of December 2016
Ranking N° 1 in Europe, Top 10 worldwide #
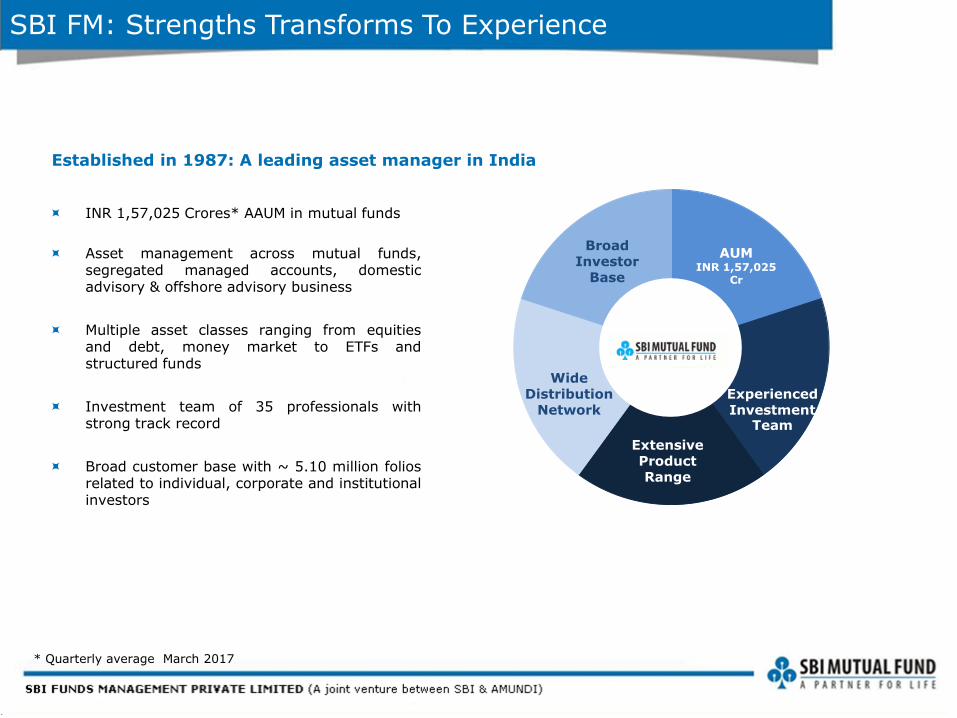
SBI FM: Strengths Transforms To Experience
Established in 1987: A leading asset manager in India
Broad Investor
Base
AUM
INR 1,57,025 Cr
Wide Distribution
Network Experienced Investment
Team
Extensive Product Range
INR 1,57,025 Crores* AAUM in mutual funds
Asset management across mutual funds, segregated managed accounts, domestic advisory & offshore advisory business
Multiple asset classes ranging from equities and debt, money market to ETFs and structured funds
Investment team of 35 professionals with strong track record
Broad customer base with ~ 5.10 million folios related to individual, corporate and institutional investors
* Quarterly average March 2017

Disclaimer
Mutual Fund investments are subject to market risks, read all scheme related documents carefully. This presentation is for information purposes only and is not an offer to sell or a solicitation to buy any mutual fund units/securities. These views alone are not sufficient and should not be used for the development or implementation of an investment strategy. It should not be construed as investment advice to any party. All opinions and estimates included here constitute our view as of this date and are subject to change without notice. Neither SBI Funds Management Private Limited, nor any person connected with it, accepts any liability arising from the use of this information. The recipient of this material should rely on their investigations and take their own professional advice