saving water through global trade - water footprint network
TRANSCRIPT


Saving water through global trade
A.K. Chapagain
A.Y. Hoekstra
H.H.G. Savenije
September 2005
Value of Water Research Report Series No. 17
UNESCO-IHE DelftP.O. Box 30152601 DA DelftThe Netherlands
Contact author:
Arjen HoekstraE-mail [email protected]


Value of Water Research Report Series (Downloadable from http://www.waterfootprint.org) 1. Exploring methods to assess the value of water: A case study on the Zambezi basin.
A.K. Chapagain − February 2000
2. Water value flows: A case study on the Zambezi basin.
A.Y. Hoekstra, H.H.G. Savenije and A.K. Chapagain − March 2000
3. The water value-flow concept.
I.M. Seyam and A.Y. Hoekstra − December 2000
4. The value of irrigation water in Nyanyadzi smallholder irrigation scheme, Zimbabwe.
G.T. Pazvakawambwa and P. van der Zaag – January 2001
5. The economic valuation of water: Principles and methods
J.I. Agudelo – August 2001
6. The economic valuation of water for agriculture: A simple method applied to the eight Zambezi basin countries
J.I. Agudelo and A.Y. Hoekstra – August 2001
7. The value of freshwater wetlands in the Zambezi basin
I.M. Seyam, A.Y. Hoekstra, G.S. Ngabirano and H.H.G. Savenije – August 2001
8. ‘Demand management’ and ‘Water as an economic good’: Paradigms with pitfalls
H.H.G. Savenije and P. van der Zaag – October 2001
9. Why water is not an ordinary economic good
H.H.G. Savenije – October 2001
10. Calculation methods to assess the value of upstream water flows and storage as a function of downstream benefits
I.M. Seyam, A.Y. Hoekstra and H.H.G. Savenije – October 2001
11. Virtual water trade: A quantification of virtual water flows between nations in relation to international crop trade
A.Y. Hoekstra and P.Q. Hung – September 2002
12. Virtual water trade: Proceedings of the international expert meeting on virtual water trade
A.Y. Hoekstra (ed.) – February 2003
13. Virtual water flows between nations in relation to trade in livestock and livestock products
A.K. Chapagain and A.Y. Hoekstra – July 2003
14. The water needed to have the Dutch drink coffee
A.K. Chapagain and A.Y. Hoekstra – August 2003
15. The water needed to have the Dutch drink tea
A.K. Chapagain and A.Y. Hoekstra – August 2003
16. Water footprints of nations
Volume 1: Main Report, Volume 2: Appendices
A.K. Chapagain and A.Y. Hoekstra – November 2004
17. Saving water through global trade
A.K. Chapagain, A.Y. Hoekstra and H.H.G. Savenije – September 2005
18. The water footprint of cotton consumption
A.K. Chapagain, A.Y. Hoekstra, H.H.G. Savenije and R. Gautam – September 2005


Contents
Summary................................................................................................................................. 7
1. Introduction........................................................................................................................ 9
2. Methodology .................................................................................................................... 11
3. National water savings.................................................................................................... 13
4. National water losses...................................................................................................... 17
5. Global water savings....................................................................................................... 21
6. Global blue water savings at the cost of green water losses...................................... 27
7. Discussion ....................................................................................................................... 29
References............................................................................................................................ 31


Summary
Many nations save domestic water resources by importing water-intensive products and exporting commodities
that are less water intensive. National water saving through the import of a product can imply saving water at a
global level if the flow is from sites with high to sites with low water productivity. The report analyses the
consequences of international virtual water flows on the global and national water budgets. The assessment
shows that the total amount of water that would have been required in the importing countries if all imported
agricultural products would have been produced domestically is 1605 Gm3/yr. These products are however being
produced with only 1253 Gm3/yr in the exporting countries, saving global water resources by 352 Gm3/yr. This
saving is 28 per cent of the international virtual water flows related to the trade of agricultural products and 6 per
cent of the global water use in agriculture. National policy makers are however not interested in global water
savings but in the status of national water resources. Egypt imports wheat and in doing so saves 3.6 Gm3/yr of its
national water resources. Water use for producing export commodities can be beneficial, as for instance in Cote
d’Ivoire, Ghana and Brazil, where the use of green water resources (mainly through rain-fed agriculture) for the
production of stimulant crops for export has a positive economic impact on the national economy. However,
export of 28 Gm3/yr of national water from Thailand related to rice export is at the cost of additional pressure on
its blue water resources. Importing a product which has a relatively high ratio of green to blue virtual water
content saves global blue water resources that generally have a higher opportunity cost than green water.

Saving water through global trade / 9
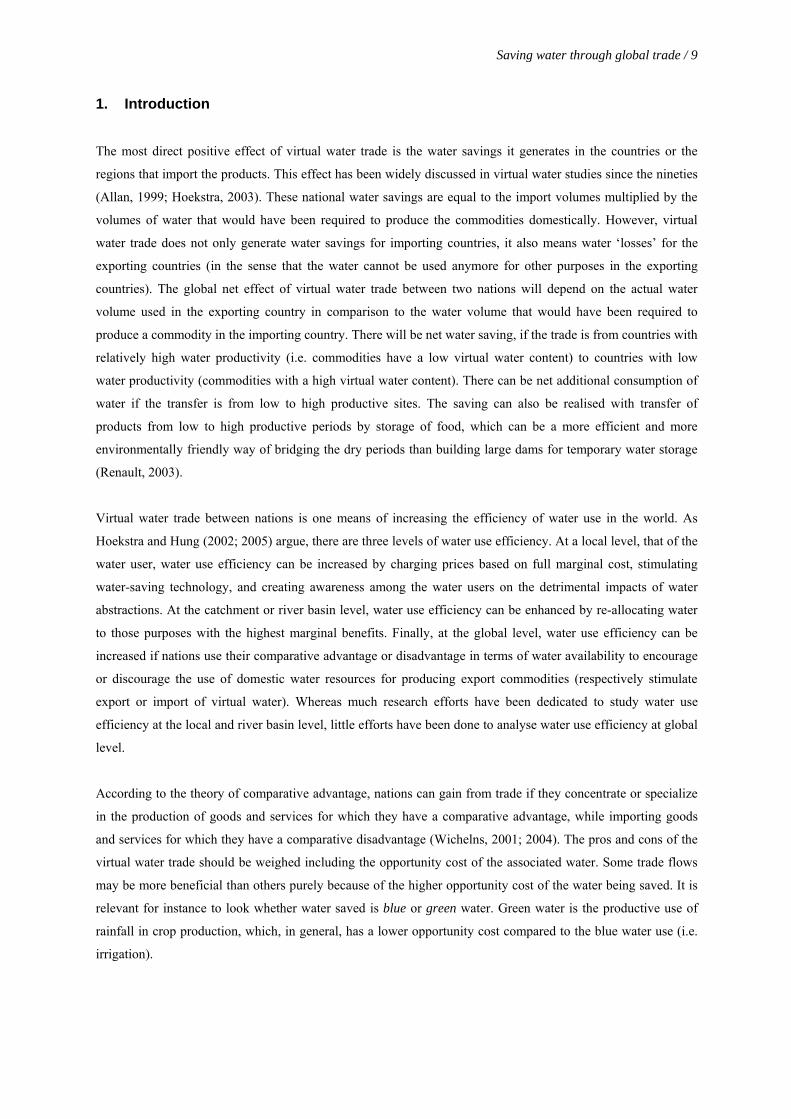
1. Introduction
The most direct positive effect of virtual water trade is the water savings it generates in the countries or the
regions that import the products. This effect has been widely discussed in virtual water studies since the nineties
(Allan, 1999; Hoekstra, 2003). These national water savings are equal to the import volumes multiplied by the
volumes of water that would have been required to produce the commodities domestically. However, virtual
water trade does not only generate water savings for importing countries, it also means water ‘losses’ for the
exporting countries (in the sense that the water cannot be used anymore for other purposes in the exporting
countries). The global net effect of virtual water trade between two nations will depend on the actual water
volume used in the exporting country in comparison to the water volume that would have been required to
produce a commodity in the importing country. There will be net water saving, if the trade is from countries with
relatively high water productivity (i.e. commodities have a low virtual water content) to countries with low
water productivity (commodities with a high virtual water content). There can be net additional consumption of
water if the transfer is from low to high productive sites. The saving can also be realised with transfer of
products from low to high productive periods by storage of food, which can be a more efficient and more
environmentally friendly way of bridging the dry periods than building large dams for temporary water storage
(Renault, 2003).
Virtual water trade between nations is one means of increasing the efficiency of water use in the world. As
Hoekstra and Hung (2002; 2005) argue, there are three levels of water use efficiency. At a local level, that of the
water user, water use efficiency can be increased by charging prices based on full marginal cost, stimulating
water-saving technology, and creating awareness among the water users on the detrimental impacts of water
abstractions. At the catchment or river basin level, water use efficiency can be enhanced by re-allocating water
to those purposes with the highest marginal benefits. Finally, at the global level, water use efficiency can be
increased if nations use their comparative advantage or disadvantage in terms of water availability to encourage
or discourage the use of domestic water resources for producing export commodities (respectively stimulate
export or import of virtual water). Whereas much research efforts have been dedicated to study water use
efficiency at the local and river basin level, little efforts have been done to analyse water use efficiency at global
level.
According to the theory of comparative advantage, nations can gain from trade if they concentrate or specialize
in the production of goods and services for which they have a comparative advantage, while importing goods
and services for which they have a comparative disadvantage (Wichelns, 2001; 2004). The pros and cons of the
virtual water trade should be weighed including the opportunity cost of the associated water. Some trade flows
may be more beneficial than others purely because of the higher opportunity cost of the water being saved. It is
relevant for instance to look whether water saved is blue or green water. Green water is the productive use of
rainfall in crop production, which, in general, has a lower opportunity cost compared to the blue water use (i.e.
irrigation).

10 / Saving water through global trade a
The average global volume of virtual water flows related to the international trade in agricultural products was
1263 Gm3/yr in the period 1997-2001 (Chapagain and Hoekstra, 2004). This estimate is based on the virtual
water content of the products in the exporting countries. It would be interesting to see the volume of virtual
water traded internationally based on the virtual water content of the products in the importing countries.
Zimmer and Renault (2003) estimated this as 1340 Gm3 /yr related to the international trade in crop and
livestock products in the year 2000. These studies only present a partial view of the global or national savings.
An estimate of global virtual water trade and resulting global water saving was done by Oki et al. (2003) and
Oki and Kanae (2004). They estimated the global sum of virtual water exports on the basis of the virtual water
content of the products in the exporting countries (683 Gm3/yr) and the global sum of virtual water imports on
the basis of the virtual water content of the products in the importing countries (1138 Gm3/yr). This saves 455
Gm3/yr as a result of food trade. Their study is severely limited with respect to the methodology followed in
calculating the virtual water content of a product. First, they have assumed a constant global average crop water
requirement throughout the world, being 15 mm/day for rice and 4 mm/day for maize, wheat and barley. Thus
the climatic factor, which plays a major role in the crop water requirement of a crop, is completely neglected.
Secondly, they did not take into account the role of the crop coefficient, which is the major limiting factor
determining the evaporation from a crop at different stages of crop growth. The global virtual water flows and
the resulting water savings as calculated in these studies are limited to the international trade of four major crops
(maize, wheat, rice and barley) only.
The purpose of this study is to quantify and analyse the global and national water savings for the period 1997-
2001 with proper accounting of climate, yield, and cropping pattern per crop per country. The study covers the
international trade of all major crop and livestock products.

Saving water through global trade / 11
2. Methodology The virtual water content of a product is calculated using the methodology as developed by Hoekstra and Hung
(2002; 2005) and Chapagain and Hoekstra (2003; 2004). First the virtual water content (m3/ton) of the primary
crop is calculated based on crop water requirement and yield in the producing country. The crop water
requirement is calculated using the methodology developed by FAO (Allen et al., 1998). The calculation is done
using the climate data of the producing country and the specific cropping pattern of each crop per country. The
virtual water content (m3/ton) of live animals has been calculated based on the virtual water content of their feed
and the volumes of drinking and service water consumed during their lifetime. The virtual water content of
processed products is calculated based on product fractions (ton of crop product obtained per ton of primary
crop or live animal) and value fractions (the market value of one crop or livestock product divided by the
aggregated market value of all products derived from one primary crop or live animal). The product fractions
have been taken from the commodity trees in FAO (2003). The value fractions have been calculated based on
the market prices of the various products. The global average market prices of the different products for the
period 1997-2001 have been calculated using trade data from the International Trade Centre (ITC, 2004).
The national water saving ΔSn (m3/yr) of a country ni as a result of trade of product p is:
[ , ] [ , ] [ , ] [ , ] [ , ]n i i i i iS n p V n p I n p V n p E n pΔ = × − × (1)
where V is the virtual water content (m3/ton) of the product p in country ni, I the amount of product p imported
(ton/yr) and E is the amount of product exported (ton/yr). Obviously, ΔSn can have a negative sign, which means
a net water loss instead of a saving.
The global water saving ΔSg (m3/yr) through the trade of a product p from an exporting country ne to an
importing country ni, is:
[ , , ] [ , , ] ( [ , ] [ , ])g e i e i i eS n n p T n n p V n p V n pΔ = × − (2)
where T is the amount of trade (ton/yr) between the two countries. The global saving is thus obtained as the
difference between the water productivities of the trading partners. The total global water saving can be obtained
by summing up the global savings of all trades ΔSg. By definition, the total global water saving is also equal to
the sum of the national savings of all countries ΔSn.
The case of global water saving is illustrated with an example of the import of husked rice in Mexico from the
USA in Figure 2.1. The case of global water loss is shown with an example of export of broken rice from
Thailand to Indonesia in Figure 2.2. For the computation of the total water saving that is made by international
trade of agricultural products, the calculation has been carried out for 285 crop products and 123 livestock
12 / Saving water through global trade a
products as reported in the database PC-TAS (ITC, 2004) which covers international trade between 243
countries for 1997-2001.
Figure 2.1. An example of global water saving with the import of husked rice in Mexico from USA.
MexicoVirtual water content, Vi = 2182 m3/ton
National water lossSn = Ve x T
= 1275 x 488,195 = 0.62 x 10⁹ m3/yr
Global water savingSg = T (Vi-Ve)
= 488,195 x (2182 - 1275) = 0.44 x 10⁹ m3/yr
Product tradeT = 488,195 ton/yr
National water savingSn = Vi x T
= 2182 x 488,195 = 1.06 x 10⁹ m3/yr
USAVirtual water content, Ve = 1275 m3/ton
Figure 2.2. An example of global water loss with the import of broken rice in Indonesia from Thailand.

Saving water through global trade / 13
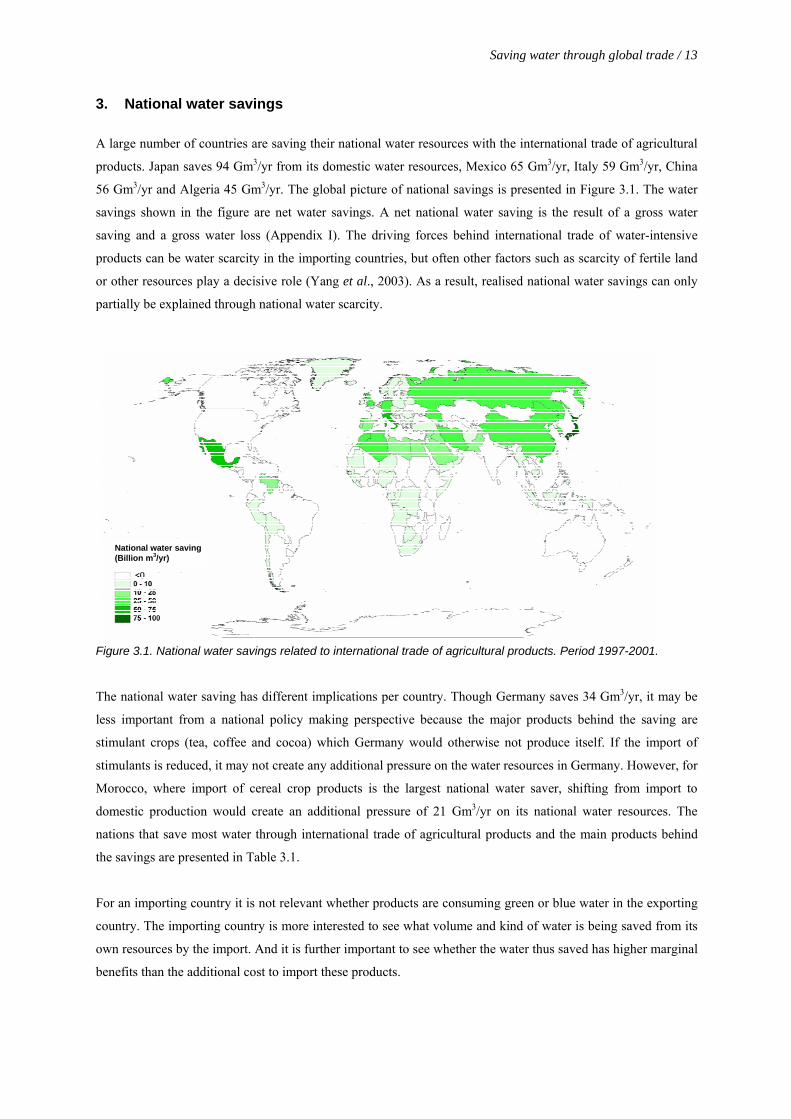
3. National water savings A large number of countries are saving their national water resources with the international trade of agricultural
products. Japan saves 94 Gm3/yr from its domestic water resources, Mexico 65 Gm3/yr, Italy 59 Gm3/yr, China
56 Gm3/yr and Algeria 45 Gm3/yr. The global picture of national savings is presented in Figure 3.1. The water
savings shown in the figure are net water savings. A net national water saving is the result of a gross water
saving and a gross water loss (Appendix I). The driving forces behind international trade of water-intensive
products can be water scarcity in the importing countries, but often other factors such as scarcity of fertile land
or other resources play a decisive role (Yang et al., 2003). As a result, realised national water savings can only
partially be explained through national water scarcity.
National water saving(Billion m3/yr)
Figure 3.1. National water savings related to international trade of agricultural products. Period 1997-2001.
The national water saving has different implications per country. Though Germany saves 34 Gm3/yr, it may be
less important from a national policy making perspective because the major products behind the saving are
stimulant crops (tea, coffee and cocoa) which Germany would otherwise not produce itself. If the import of
stimulants is reduced, it may not create any additional pressure on the water resources in Germany. However, for
Morocco, where import of cereal crop products is the largest national water saver, shifting from import to
domestic production would create an additional pressure of 21 Gm3/yr on its national water resources. The
nations that save most water through international trade of agricultural products and the main products behind
the savings are presented in Table 3.1.
For an importing country it is not relevant whether products are consuming green or blue water in the exporting
country. The importing country is more interested to see what volume and kind of water is being saved from its
own resources by the import. And it is further important to see whether the water thus saved has higher marginal
benefits than the additional cost to import these products.

14 / Saving water through global trade a
Table 3.1. Nations with the largest net water saving as a result of international trade of agricultural products. Period 1997-2001.
Countries Net national water saving
(Gm3/yr)
Major partners (Gm3/yr)
Major product categories (Gm3/yr)
Japan 94 USA (48.9), Australia (9.6), Canada (5.4), Brazil (3.8), China (2.6)
Cereal crops (38.7), oil-bearing crops (23.2), livestock (16.1), stimulants (9.2)
Mexico 65 USA (54.0), Canada (5.1) Livestock (31.0), oil-bearing crops (20.5), cereal crops (19.3)
Italy 59 France (14.6), Germany (6.0), Brazil (5.4), Netherlands (4.4), Argentina (3.1), Spain (3.1)
Livestock (23.2), cereal crops (15.2), oil-bearing crops (12.9), stimulant (8.1)
China 56 USA (17.4), Brazil (8.3), Argentina (8.3), Canada (3.6), Italy (3.4), Australia (3.2), Thailand (2.6)
Livestock (27.5), oil-bearing crops (32.6)
Algeria 45 Canada (10.8), USA (7.6), France (7.1), Germany (4.0), Argentina (1.6)
Cereal crops ( 33.7), oil-bearing crops (4.0), livestock (3.4)
Russian Fed.
41 Kazakhstan (5.2), Germany (4.4), USA (4.1), Ukraine (3.4), Brazil (3.3), Cuba (2.4), France (1.9), Netherlands (1.9)
Livestock (15.2), cereal crops (7.1), sugar (6.9), oil-bearing crops (4.3), stimulant (3.8), fruits (2.3)
Iran 37 Brazil (8.3), Argentina (8.1), Canada (7.7), Australia (6.0), Thailand (2.2), France (2.0)
Cereal crops (22.5), oil-bearing crops (15.1), sugar (1.6)
Germany 34 Brazil (8.3), Cote d’Ivoire (5.3), Netherlands (5.0), USA (4.2), Indonesia (3.3), Argentina (2.2), Colombia (2.1)
Stimulants (21.8), oil-bearing crops (15.0), fruits(3.4), nuts (2.3)
Korea Rep. 34 USA (15.6), Australia (3.6), Brazil (2.2), China (1.5), India (1.4), Malaysia (1.2), Argentina (1.1)
Oil-bearing crops (14.3), cereal crops (12.8), livestock (2.3), sugar (1.9), stimulants (1.5)
UK 33 Netherlands (5.3), France (3.7), Brazil (2.8), Ghana (1.9), USA (1.8), Cote d’Ivoire (1.5), Argentina (1.4)
Oil-bearing crops (10.1), stimulants (9.5), livestock (5.2)
Morocco 27 USA (7.8), France (6.4), Argentina (3.3), Canada (2.2), Brazil (1.2), Turkey (0.8), UK (0.8)
Cereal crops (20.9), oil-bearing crops (4.4)
As an example, Figure 3.2 shows the national water saving of Egypt as a result of the import of wheat. In Egypt,
the mean rainfall is only 18 mm/yr. Almost all agriculture in Egypt is irrigated. At present, Egypt and Sudan
base their water resources plan on the agreed division of water by the 1959 Nile water agreement between Sudan
and Egypt. However, future developments in upstream countries will have to be taken into account. Disputes
over the distribution of water of the Nile could become a potential source of conflict and contention. The
expansion of irrigation in the basin will require basin-wide cooperation in the management of water resources to
meet increasing demands and to face the associated environmental consequences. In this context, the import of
wheat in Egypt is contributing to national water saving of 3.6 Gm3/yr which is about seven percent of the total
volume of water Egypt is entitled to according to the 1959 agreement. The national saving is made with the
investment of foreign exchange of 593 million US$/yr (ITC, 2004). Hence, from an economic point of view, the
opportunity cost of the resources being saved (such as land, water and labour) should be more or at least equal to
the price paid for it. If the opportunity cost of land and labour approaches zero, the opportunity cost of water
being saved should be more than 0.17 US$/m3. But the import of wheat in Egypt should be assessed including
other factors of production such as land and labour. In Egypt fertile land is also a major scarce resource. The
pressure to increase the land area with reclamation is released to some extent by the wheat import but on the
other hand the import is made at the cost of employment lost. Greenaway et al. (1994) and Wichelns (2001)

Saving water through global trade / 15
have shown that the production of wheat has a comparative disadvantage in Egypt. As the saving is completely
in blue water, the marginal utility of the saved water may justify the import economically.
Turkey
Canada
Argentina
France
Australia
USA
EgyptSn = + 2051 Mm3/yr
Sn = + 147 Mm3/yr
Sn = - 1871 Mm3/yr
Sn = - 414 Mm3/yr
Sn = - 116 Mm3/yr
Sn = - 86 Mm3/yr
Sn = - 158 Mm3/yr
Sn = - 1171 Mm3/yr
Sn = + 53 Mm3/yr
Sn = + 96 Mm3/yr
Sn = + 686 Mm3/yr
Sn = + 431 Mm3/yr + 3578
Mm3/yr
Sn = - 144 Mm3/yr
Others
Sn = + 114 Mm3/yr
Figure 3.2. National water saving related to the net wheat import of Egypt. Period 1997-2001.

Saving water through global trade / 17
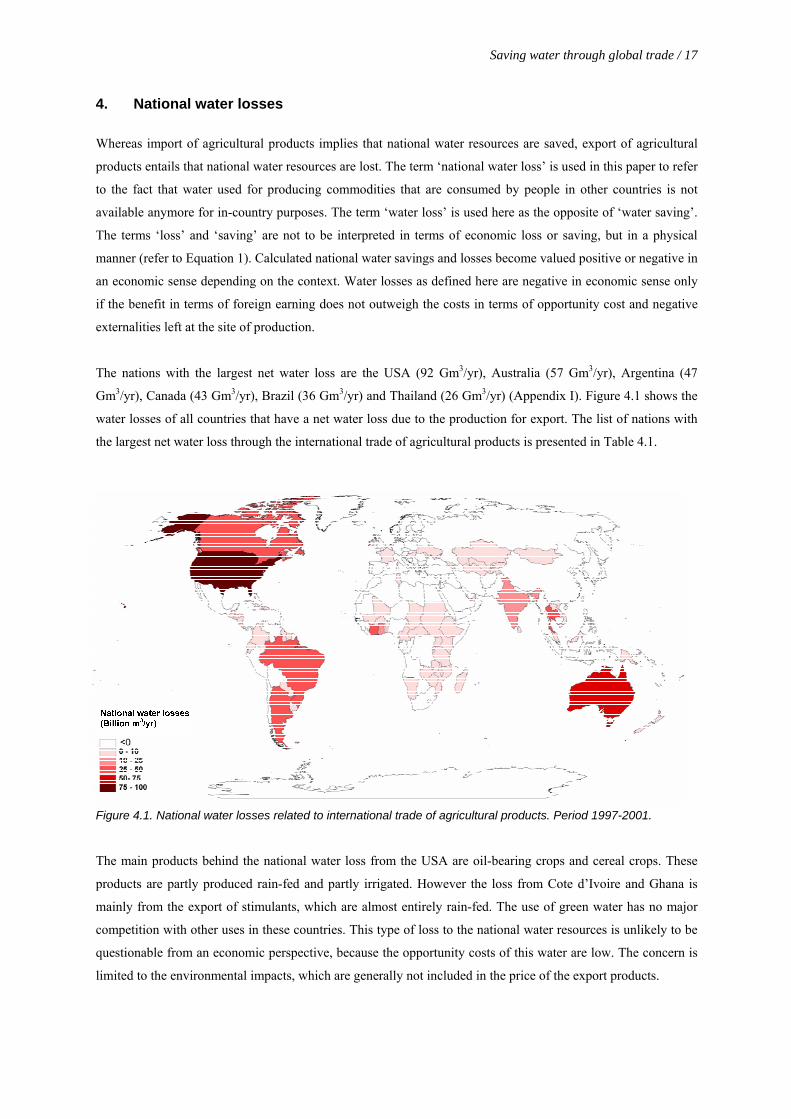
4. National water losses Whereas import of agricultural products implies that national water resources are saved, export of agricultural
products entails that national water resources are lost. The term ‘national water loss’ is used in this paper to refer
to the fact that water used for producing commodities that are consumed by people in other countries is not
available anymore for in-country purposes. The term ‘water loss’ is used here as the opposite of ‘water saving’.
The terms ‘loss’ and ‘saving’ are not to be interpreted in terms of economic loss or saving, but in a physical
manner (refer to Equation 1). Calculated national water savings and losses become valued positive or negative in
an economic sense depending on the context. Water losses as defined here are negative in economic sense only
if the benefit in terms of foreign earning does not outweigh the costs in terms of opportunity cost and negative
externalities left at the site of production.
The nations with the largest net water loss are the USA (92 Gm3/yr), Australia (57 Gm3/yr), Argentina (47
Gm3/yr), Canada (43 Gm3/yr), Brazil (36 Gm3/yr) and Thailand (26 Gm3/yr) (Appendix I). Figure 4.1 shows the
water losses of all countries that have a net water loss due to the production for export. The list of nations with
the largest net water loss through the international trade of agricultural products is presented in Table 4.1.
Figure 4.1. National water losses related to international trade of agricultural products. Period 1997-2001.
The main products behind the national water loss from the USA are oil-bearing crops and cereal crops. These
products are partly produced rain-fed and partly irrigated. However the loss from Cote d’Ivoire and Ghana is
mainly from the export of stimulants, which are almost entirely rain-fed. The use of green water has no major
competition with other uses in these countries. This type of loss to the national water resources is unlikely to be
questionable from an economic perspective, because the opportunity costs of this water are low. The concern is
limited to the environmental impacts, which are generally not included in the price of the export products.

18 / Saving water through global trade a
Table 4.1. Nations with the largest net water loss as a result of international trade of agricultural products. Period 1997-2001.
Countries Net national water loss (Gm3/yr)
Major partners (Gm3/yr)
Major product categories (Gm3/yr)
USA 92 Japan (29.2), Mexico (26.8), China (14.1), Korea Rep (10.1), Taiwan (8.4), Egypt (3.8), Spain (3.7)
Oil-bearing crops (65.2), cereal crops (45.4), livestock (7.8)
Australia 57 Japan (13.7), China (6.0), USA (5.7), Indonesia (4.7), Korea Rep (3.9), Iran (3.3)
Cereal crops (23.1), livestock (24.3), oil-bearing crops (6.8), sugar (4.3)
Argentina 47 Brazil (6.7), China (3.7), Spain (2.4), Netherlands (2.2), Italy (2.1), USA (2.0), Iran (1.9)
Oil-bearing crops (29.9), cereal crops (12.8), livestock (3.7)
Canada 43 USA (12.4), Japan (7.9), China (5.2), Iran (3.7), Mexico (3.4), Algeria (2.1)
Cereal crops (29.3), livestock (12.3), oil-bearing crops (9.6)
Brazil 36 Germany (5.8), USA (5.3), China (4.5), Italy (4.2), France (4.2), Netherlands (3.9), Russian Fed (2.8)
Oil-bearing crops (17.7), stimulants (15.8), sugar (9.0), livestock (9.3)
Cote d’Ivoire
32 Netherlands (5.7), France (4.7), USA (4.5), Germany (4.1), Italy (1.7), Spain (1.5), Algeria (1.4)
Stimulants (32.9), oil-bearing crops (1.5)
Thailand 26 Indonesia (4.7), China (4.4), Iran (2.6), Malaysia (2.5), Japan (2.3), Senegal (1.8), Nigeria (1.7)
Cereal crops (23.6), Sugar (5.1), roots and tuber (2.5)
Ghana 17 Netherlands (3.6), UK (3.3), Germany (1.7), Japan (1.6), USA (1.3), France (1.0)
Stimulants (19.1)
India 13 China (2.4), Saudi Arabia (2.0), Korea Rep (1.8), Japan (1.6), Russian Fed (1.3), France (1.3), USA (1.3)
Cereal crops (6.1), stimulants (3.2), livestock (3.0), oil-bearing crops (1.8)
France 9 Italy (6.4), Belgium-Luxembourg (3.8), UK (2.8), Germany (2.1), Greece (1.6), Algeria (1.4), Morocco (1.1)
Cereal crops (21.9), sugar (4.6), livestock (4.2)
Vietnam 8 Indonesia (2.3), Philippines (1.7), Ghana (0.4), USA (0.4), Germany (0.4), Senegal (0.4), Singapore (0.4)
Cereal crops (6.8), stimulants (2.7)
The national water losses from France, Vietnam and Thailand are mainly the result of cereal crop products.
Particularly the example of rice export from Thailand is interesting from blue water and opportunity cost
perspective (Figure 4.2). Thailand exports 27.8 Gm3/yr of water in the form of rice. The monetary equivalent of
rice export is 1556 million US$/yr (ITC, 2004). Hence, from the loss of its national water, Thailand is generating
foreign exchange of 0.06 US$/m3. The water loss is partly from blue water resources and partly from green
water resources. As rice cultivation in Thailand is done during the rainy season, the share of green water is quite
considerable in the virtual water content of the rice. Here, one needs to remember that the benefits of rice export
should be attributed to all the resources consumed in the production process such as water, land and labour. If
the contribution of rainfall is 50% to the total evaporative demand of the crop, and if other resources have zero
opportunity cost (which is not the case) the opportunity cost of rice export from Thailand approaches 0.12
US$/m3 of blue water. Though it is a crude estimation of opportunity cost of rice export, it indicates that the
volume of national water loss could have produced higher economic benefits to the nation.

Saving water through global trade / 19
Figure 4.2. National water loss related to the net rice export of Thailand. Period 1997-2001.


Saving water through global trade / 21
5. Global water savings Considering the international trade flows between all major countries of the world and looking at the major
agricultural products being traded (285 crop products and 123 livestock products), it has been calculated that the
global water saving by trade in agricultural products is 352 Gm3/yr (Table 5.1). This volume equals 28% of the
international virtual water flows related to agricultural product trade and 6% of the global volume of water used
for agricultural production (which is 6391 Gm3/yr, see Chapagain and Hoekstra, 2004). The trade flows that save
more than 0.5 Gm3/yr are shown in Figure 5.1. The trade flows between USA-Japan and USA-Mexico are the
biggest global water savers. The contribution of different product groups to the total global water saving is
presented in Figure 5.2. Cereal crop products form the largest group responsible for the total global water
saving, with a saving of 222 Gm3/yr, followed by oil-bearing crops (68 Gm3/yr, mainly soybeans) and livestock
products (45 Gm3/yr). The cereal group is composed of wheat (103 Gm3/yr), maize (68 Gm3/yr), rice (21
Gm3/yr), barley (21 Gm3/yr), and others (9 Gm3/yr).
Table 5.1. Global virtual water flows and water savings. Period 1997-2001.
Related to trade of crop products
(Gm3/yr)
Related to trade of livestock products
(Gm3/yr)
Total (Gm3/yr)
Global sum of virtual water exports, assessed on the basis of the virtual water content of the products in the exporting countries (Gm3/yr) 979 275 1254 Global sum of virtual water imports, assessed on the basis of the virtual water content of products if produced in the importing countries (Gm3/yr) 1286 320 1646 Global water saving (Gm3/yr) 307 45 352
Saving compared to the sum of international virtual water flows (%) 34% 16% 30%
Saving compared to the global water use for agricultural products (%) 5.3% 0.7% 6%
Figure 5.1. Global water savings (>5.0 Gm3/yr) associated with international trade of agricultural products. Period 1997-2001.

22 / Saving water through global trade a
222
68
45
10 70
50
100
150
200
250
Cereal crops Oil-bearing crops Livestock andproducts
Pulses Others
Glo
bal w
ater
sav
ings
(Gm3 /y
r)
Others9
Wheat103
Barley21
Rice21
Maize68
0
20
40
60
80
100
120
Others2.6
Soybeans65.2
0
10
20
30
40
50
60
70
Bovine22
Others4
Swine6
Dairy products
13
0
20
Global water saving = 352 Gm3/yr
Figure 5.2. Global water savings (Gm3/yr) per traded product category. Period 1997-2001.
The largest global water savings by wheat trade are occurring as a result of wheat import in the Middle East and
North African from Western Europe and North America. Figure 5.3 shows the wheat trade flows saving more
than 2 Gm3 of water per year. Maize imports in Japan alone are responsible for 15 Gm3/yr of global water
saving. The global saving of water as a result of maize trade is mainly from the export of maize from USA.
Figure 5.4 shows the maize trade flows saving more than 1 Gm3/yr. Figure 5.5 shows the global water savings
above 0.5 Gm3/yr as a result of rice trade. As the production is more favourable (climate and culture) in South-
east Asia, the largest savings are from the export from this region to the Middle East and West Africa. The major
saving through the trade of rice is between Thailand-Iraq, Thailand-Nigeria, Syria-Nigeria, and China-Indonesia.
e East and
North African from Western Europe and North America. Figure 5.3 shows the wheat trade flows saving more
than 2 Gm3 of water per year. Maize imports in Japan alone are responsible for 15 Gm3/yr of global water
saving. The global saving of water as a result of maize trade is mainly from the export of maize from USA.
Figure 5.4 shows the maize trade flows saving more than 1 Gm3/yr. Figure 5.5 shows the global water savings
above 0.5 Gm3/yr as a result of rice trade. As the production is more favourable (climate and culture) in South-
east Asia, the largest savings are from the export from this region to the Middle East and West Africa. The major
saving through the trade of rice is between Thailand-Iraq, Thailand-Nigeria, Syria-Nigeria, and China-Indonesia.
Figure 5.3. Global water savings (>2.0 Gm3/yr) associated with the international trade of wheat. Period 1997-2001. Figure 5.3. Global water savings (>2.0 Gm3/yr) associated with the international trade of wheat. Period 1997-2001.

Saving water through global trade / 23
Figure 5.4. Global water savings (>1.0 Gm3/yr) associated with the international trade of maize. Period 1997-2001.
Figure 5.5. Global water savings (>0.5 Gm3/yr) associated with the international trade of rice. Period 1997-2001.
Considering the import of wheat in Egypt, one can see that this contributes to global water saving in some cases
and global water loss in other cases (Figure 3.2). The import from USA, France and Argentina is globally saving
water by 0.23 Gm3/yr, whereas the import of wheat from Canada, Turkey and Australia results in a global water
loss of 0.58 Gm3/yr. Though Egypt’s import of wheat saves national water resources by 3.6 Gm3/yr, it results in
a net global water loss of 0.4 Gm3/yr. The crop water requirement in Egypt is relatively high compared to its
trading partners, but this is partially compensated by a relatively high wheat yield, which is more than twice the
global average (Table 5.2). As a result, water productivity (water use per unit of product) in wheat production in
Egypt is higher than in Canada, Turkey and Australia. However, wheat production in Egypt is using scarce blue

24 / Saving water through global trade a
water resources and the partner countries are making use of the effective rainfall (green water). The net global
water loss related to the wheat export from Canada etc. to Egypt results from the fact that the volume of blue
water resources that would have been required in Egypt to produce domestically is smaller than the volume of
green water resources actually used in Canada etc. Blue and green water resources fundamentally differ in terms
of possible application and thus opportunity cost. For further analysis and interpretation of figures on global
water savings or losses it is thus important to split up these figures into a blue and green water component.
Table 5.2. Crop water requirements, crop yields and the virtual water content of wheat in Egypt and its major trade partners. Period 1997-2001.
Crop water requirement (mm/crop period)
Wheat yield (ton/ha)
Virtual water content (m3/ton)
Argentina 179 2.4 738 Australia 309 1.9 1588 Canada 339 2.3 1491 Egypt 570 6.1 930 France 630 7.0 895 Turkey 319 2.1 1531 USA 237 2.8 849 Global average 2.7 1334
A second example elaborated here is the trade of maize from the USA to Japan. The global water saving from
this trade is 15.4 Gm /yr. The evaporative demand of maize in Japan (367 mm/crop period) is comparable with
that in the USA (411 mm/crop period), but the crop yield in the USA (8.4 ton/ha) is significantly higher than in
Japan (2.5 ton/ha), so that the virtual water content of maize in Japan is 3 times higher than in the USA. Saving
domestic water resources is not the only positive factor for Japan. If Japan would like to grow the quantity of
maize which is now imported from the USA, it would require 6 million hectare of additional cropland. This is a
lot given the scarcity of land in Japan.
3
A third case considered here is rice export from Thailand. Though Thailand looses water by exporting to Nigeria
and Senegal by 1.7 Gm3/yr and 1.8 Gm3/yr respectively, it is saving water globally as the national water savings
in Nigeria (3.2 Gm3/yr) and Senegal (2.9 Gm3/yr) are higher than the losses in Thailand (Figure 4.2). The main
reason behind the global saving related to the trade between Thailand and Nigeria, is that rice yield in Thailand
is 1.7 times higher than in Nigeria (Table 5.3). These two countries have crop water requirements of comparable
magnitude (1000 mm/crop period). On the contrary, the main reason behind the global water saving by the trade
between Thailand and Senegal, which both have a crop yield in the order of 2.5 ton/ha, is the difference in the
crop water requirements in Thailand (945 mm/crop period) and Senegal (1523 mm/crop period). The export of
rice from Thailand to five other trading partners (China, Indonesia, Iran, Malaysia and USA) is creating a global
water loss of 5 Gm3/yr. National water loss in Thailand is greater than the corresponding national water savings
in these countries. This is due to the fact that rice yield in Thailand is low if compared to the countries where it
exports to.

Saving water through global trade / 25
Table 5.3. Crop water requirements, crop yields and the virtual water content of rice in Thailand and its major trade partners. Period 1997-2001.
Crop water requirement(mm/crop period)
Rice yield (ton/ha)
Virtual water content (m3/ton)
China 830 6.3 1321 Indonesia 932 4.3 2150 Iran 1306 4.1 3227 Malaysia 890 3.0 2948 Nigeria 1047 1.5 7036 Senegal 1523 2.5 6021 Thailand 945 2.5 3780 USA 863 6.8 1275 Global average 3.9 2291

Saving water through global trade / 27
6. Global blue water savings at the cost of green water losses
The global water saving ΔSg is made up of a global blue water saving (ΔSg,b) and a global green water saving
(ΔSg,g) component:
( )( ) (( )( ) ( )
, , , ,
, , , ,
, ,
g i e
g i b i g e b e
g i g e b i b e
g g g b
S T V V
T V V V V
T V V T V V
S S
Δ = × −
= × + − +
= × − + × −
= Δ + Δ
) (3)
Even if there is a net global water loss from a trade relation, there might be a saving of blue water at the cost of a
greater loss of green water or vice versa. The case is elaborated with the example of Egypt’s wheat trade. The
virtual water content of wheat in Egypt is 930 m3/ton. This is all blue water; the green component of the virtual
water content of wheat is zero. Suppose that Egypt is importing T ton/yr of wheat from Australia. The virtual
water content of wheat in Australia is 1588 m3/ton. Wheat production in Australia is not 100% irrigated; it is
assumed here that a fraction f of the virtual water content of wheat in Australia is green water. There is net
global loss of 658T m /yr3 in this trade.
( )( )930 1588
658
g i eS T V V
TT
Δ = × −
= × −
= −
The global green water saving, ΔSg,g (m3/yr), in this case is always negative:
( )( )
, , ,
0 15881588
g g g i g eS T V V
T fT f
Δ = × −
= × − ×
= − ×
However, whether the global blue water saving ΔSg,b (m3/yr) is positive or negative depends upon the fraction f
in the exporting country:
( )( )( )
( )
, , ,
930 1 1588
658 1588
g b b i b eS T V V
T f
T f
Δ = × −
= × − −
= × − +
There is net gain in global blue water resources as long as the blue water component of Australian wheat is
smaller than in Egypt, i.e. if the fraction f in Australia is larger than 0.42. In a case of extreme drought, if the

28 / Saving water through global trade a
effective rainfall in Australia for wheat is zero (f=0) and all the evaporative demand is met by irrigation, all the
losses are in blue water resources, which is 658T m /yr. In another extreme example, when the full evaporative
demand of wheat in Australia is met by effective rainfall, so that no irrigation water is used (f=1), the global loss
of green water will be 1588T, but we obtain a net global gain of blue water of 930T m /yr. Here, the gain in blue
water is obtained at the cost of green water.
3
3
Since blue water resources are generally scarcer than green water resources, global water losses can be
positively evaluated if still blue water resources are being saved. The classical example of trade that makes sense
from both water resources and economic point of view is when predominantly rain-fed crop or livestock
products from humid areas are imported into a country where effective rainfall is negligible. Also the import of
products that originate from semi-arid countries that apply supplementary irrigation can be beneficial from a
global point of view, because supplementary irrigation increases yields often more than double, a profitable
situation that can never be achieved in arid countries where effective rainfall is too low to allow for
supplementary irrigation, so that full irrigation is the only option.

Saving water through global trade / 29
7. Discussion
The volume of global water saving from the international trade of agricultural products is 352 Gm3/yr (average
over the period 1997-2001). The largest savings are from international trade of crop products, mainly cereals
(222 Gm3/yr) and oil crops (68 Gm3/yr), owing to the large regional differences in virtual water content of these
products and the fact that these products are generally traded from water efficient to less water efficient regions.
Since there is smaller variation in the virtual water content of livestock products, the savings by trade of
livestock products are less.
The export of a product from a water efficient region (relatively low virtual water content of the product) to a
water inefficient region (relatively high virtual water content of the product) saves water globally. This is the
physical point of view. Whether trade of products from water efficient to water inefficient countries is beneficial
from an economic point of view, depends on a few additional factors, such as the character of the water saving
(blue or green water saving), and the differences in productivity with respect to other relevant input factors such
as land and labour. Besides, international trade theory tells that it is not the absolute advantage of a country that
indicates what commodities to produce but the relative advantage (Wichelns, 2004). The decision to produce
locally or to import from other sites should be made on the basis of the marginal value or the utility of the water
being saved at the consumption site compared to the cost of import.
Saving domestic water resources in countries that have relative water scarcity by the mechanism of virtual water
import (import of water-intensive products) looks very attractive. There are however a number of drawbacks that
have to be taken into account as well. Saving domestic water through import should explicitly be seen in the
context of:
− the need to generate sufficient foreign exchange to import food which otherwise would be produced
domestically;
− the risk of moving away from food self sufficiency that associates with the fear of being held to political
ransom;
− increased urbanization in importing countries as import reduces employment in the agricultural sector;
− reduced access of the poor to food; and
− increased risk of environmental impact in exporting countries, which is generally not accounted for in the
price of the imported products.
Enhanced virtual water trade to optimise the use of global water resources can relieve the pressure on water
scarce countries but may create additional pressure on the countries that produce the water-intensive
commodities for export. The potential water saving from global trade is only sustainable if the prices of the
export commodities truly reflect the opportunity costs and negative environmental externalities in the exporting
countries. Otherwise the importing countries simply gain from the fact that they would have to bear the cost of
water depletion if they would produce domestically whereas the costs remain external if they import the water-
intensive commodities instead.

30 / Saving water through global trade a
Since an estimated 16% of the global water use is not for domestic consumption but for export, global water use
efficiency becomes an important issue with increasing globalisation of trade. Though international trade is
seldom done to enhance global water productivity, there is an urgent need to address the increasing global water
scarcity problem.

Saving water through global trade / 31
References Allan, J. A. (1999) 'Water Stress and Global Mitigation: Water, Food and Trade' Arid Land Newsletter 45.
Allen, R. G., Pereira, L. S., Raes, D. and Smith, M. (1998) 'Crop evapotranspiration - Guidelines for computing crop water requirements', FAO, Rome.
Chapagain, A. K. and Hoekstra, A. Y. (2003) 'Virtual water flows between nations in relation to trade in livestock and livestock products', Value of Water Research Report Series No. 13, UNESCO-IHE, Delft, the Netherlands.
Chapagain, A. K. and Hoekstra, A. Y. (2004) 'Water footprints of nations' Value of Water Research Report Series No. 16, UNESCO-IHE, Delft, the Netherlands.
FAO (2003) 'Technical Conversion Factors for Agricultural Commodities', FAO, Rome.
Greenaway, F., Hassan, R. and Reed, G. V. (1994) 'An empirical analysis of comparative advantage in Egyptian agriculture', Appl. Eco., 26, 649-657.
Hoekstra, A. Y. (ed.) (2003) 'Virtual water trade: Proceedings of the International Expert Meeting on Virtual Water Trade', Value of Water Research Report Series No. 12, UNESCO-IHE, Delft, The Netherlands.
Hoekstra, A. Y. and Hung, P. Q. (2002) 'Virtual water trade: a quantification of virtual water flows between nations in relation to international crop trade', Value of Water Research Report Series No.11, UNESCO-IHE, Delft, The Netherlands.
Hoekstra, A. Y. and Hung, P. Q. (2005) 'Globalisation of water resources: International virtual water flows in relation to crop trade', Global Environmental Change, 15(1): 45-56.
ITC (2004) 'PC-TAS version 1997-2001 in HS or SITC', CD-ROM, International Trade Centre, Geneva.
Oki, T. and Kanae, S. (2004) 'Virtual water trade and world water resources', Water Science & Technology, 49(7), 203-209.
Oki, T., Sato, M., Kawamura, A., Miyake, M., Kanae, S. and Musiake, K. (2003) 'Virtual water trade to Japan and in the world', In: Virtual water trade: Proceedings of the International Expert Meeting on Virtual Water Trade, Value of Water Research Report Series No. 12, ed. A. Y. Hoekstra, UNESCO-IHE, Delft, The Netherlands.
Renault, D. (2003) 'Value of virtual water in food: Principles and virtues', In: Virtual water trade: Proceedings of the International Expert Meeting on Virtual Water Trade, Value of Water Research Report Series No. 12, ed. A. Y. Hoekstra, UNESCO-IHE, Delft, The Netherlands.
Wichelns, D. (2001) 'The role of ‘virtual water’ in efforts to achieve food security and other national goals, with an example from Egypt', Agricultural Water Management, 49(2), 131-151.
Wichelns, D. (2004) 'The policy relevance of virtual water can be enhanced by considering comparative advantages', Agricultural Water Management 66(1), 49-63.
Yang, H., Reichert, P., Abbaspour, K.C. and Zehnder, A.J.B. (2003) 'A water resources threshold and its implications for food security', In: Virtual water trade: Proceedings of the International Expert Meeting on Virtual Water Trade’ Value of Water Research Report Series No. 12, ed. A. Y. Hoekstra, UNESCO-IHE, Delft, the Netherlands.
Zimmer, D. and Renault, D. (2003) 'Virtual water in food production and global trade: Review of methodological issues and preliminary results', In: Virtual water trade: Proceedings of the International Expert Meeting on Virtual Water Trade, Value of Water Research Report Series No. 12, ed. A. Y. Hoekstra, UNESCO-IHE, Delft, The Netherlands.

Saving water through global trade / 33
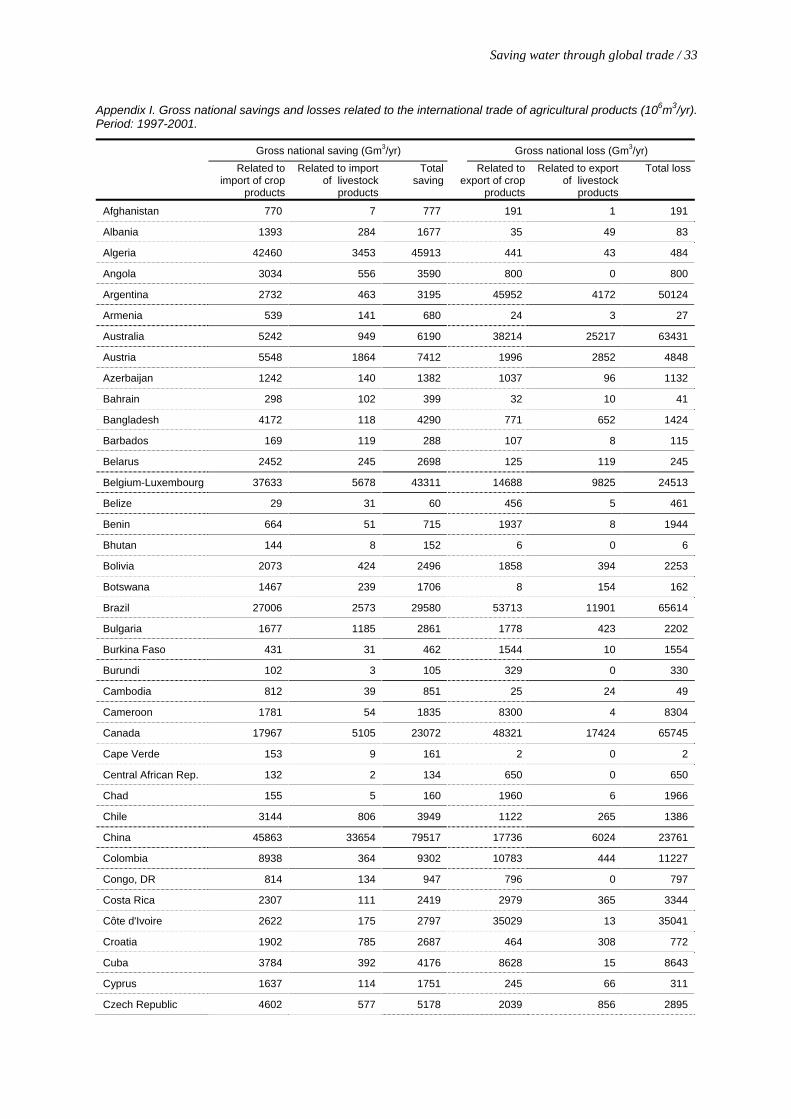
Appendix I. Gross national savings and losses related to the international trade of agricultural products (106m3/yr). Period: 1997-2001.
Gross national saving (Gm3/yr) Gross national loss (Gm3/yr)
Related to import of crop
products
Related to import of livestock
products
Total saving
Related to export of crop
products
Related to export of livestock
products
Total loss
Afghanistan 770 7 777 191 1 191
Albania 1393 284 1677 35 49 83
Algeria 42460 3453 45913 441 43 484
Angola 3034 556 3590 800 0 800
Argentina 2732 463 3195 45952 4172 50124
Armenia 539 141 680 24 3 27
Australia 5242 949 6190 38214 25217 63431
Austria 5548 1864 7412 1996 2852 4848
Azerbaijan 1242 140 1382 1037 96 1132
Bahrain 298 102 399 32 10 41
Bangladesh 4172 118 4290 771 652 1424
Barbados 169 119 288 107 8 115
Belarus 2452 245 2698 125 119 245
Belgium-Luxembourg 37633 5678 43311 14688 9825 24513
Belize 29 31 60 456 5 461
Benin 664 51 715 1937 8 1944
Bhutan 144 8 152 6 0 6
Bolivia 2073 424 2496 1858 394 2253
Botswana 1467 239 1706 8 154 162
Brazil 27006 2573 29580 53713 11901 65614
Bulgaria 1677 1185 2861 1778 423 2202
Burkina Faso 431 31 462 1544 10 1554
Burundi 102 3 105 329 0 330
Cambodia 812 39 851 25 24 49
Cameroon 1781 54 1835 8300 4 8304
Canada 17967 5105 23072 48321 17424 65745
Cape Verde 153 9 161 2 0 2
Central African Rep. 132 2 134 650 0 650
Chad 155 5 160 1960 6 1966
Chile 3144 806 3949 1122 265 1386
China 45863 33654 79517 17736 6024 23761
Colombia 8938 364 9302 10783 444 11227
Congo, DR 814 134 947 796 0 797
Costa Rica 2307 111 2419 2979 365 3344
Côte d'Ivoire 2622 175 2797 35029 13 35041
Croatia 1902 785 2687 464 308 772
Cuba 3784 392 4176 8628 15 8643
Cyprus 1637 114 1751 245 66 311
Czech Republic 4602 577 5178 2039 856 2895
34 / Saving water through global trade a
Gross national saving (Gm3/yr) Gross national loss (Gm3/yr)
Related to import of crop
products
Related to import of livestock
products
Total saving
Related to export of crop
products
Related to export of livestock
products
Total loss
Denmark 7537 1436 8972 2696 9451 12147
Dominican Republic 0 0 0 3309 67 3376
Ecuador 3863 98 3961 7385 67 7451
Egypt 13175 2046 15220 1755 221 1976
El Salvador 2184 393 2577 2718 72 2790
Eritrea 1234 17 1251 14 18 31
Estonia 2929 279 3207 399 162 561
Ethiopia 803 4 807 2143 90 2233
Fiji Islands 0 0 0 564 9 574
Finland 3338 399 3737 1015 569 1584
France 39080 9022 48103 43410 13206 56616
Gabon 431 134 565 70 0 70
Gambia 942 47 989 142 1 142
Georgia 265 106 371 347 217 563
Germany 64876 14091 78967 27630 17429 45058
Ghana 2265 97 2361 19501 2 19502
Greece 5303 5952 11255 4634 330 4964
Guatemala 2322 509 2831 5684 166 5850
Guyana 154 42 196 1033 1 1034
Haiti 0 0 0 253 5 257
Honduras 1809 202 2011 3043 77 3120
Hungary 3397 3544 6941 3495 8586 12081
Iceland 210 2 213 9 62 71
India 22582 362 22944 32411 3406 35817
Indonesia 26425 1763 28188 24749 369 25118
Iran 40078 769 40846 3587 314 3901
Iraq 15011 961 15972 703 5 707
Israel 8176 2307 10482 575 139 714
Italy 49095 38068 87163 12920 14899 27819
Jamaica 1361 258 1619 489 11 501
Japan 78930 17036 95966 951 955 1905
Jordan 7666 710 8375 97 163 261
Kazakhstan 562 72 633 7363 648 8011
Kenya 3473 15 3488 4638 161 4799
Korea, DPR 2809 100 2909 31 19 50
Korea, Republic of 32321 6198 38519 997 3930 4927
Kuwait 1614 579 2193 30 23 53
Kyrgyzstan 0 0 0 296 128 423
Laos 176 11 187 246 22 268
Latvia 1042 243 1284 387 192 579
Lebanon 3569 1924 5492 212 75 287

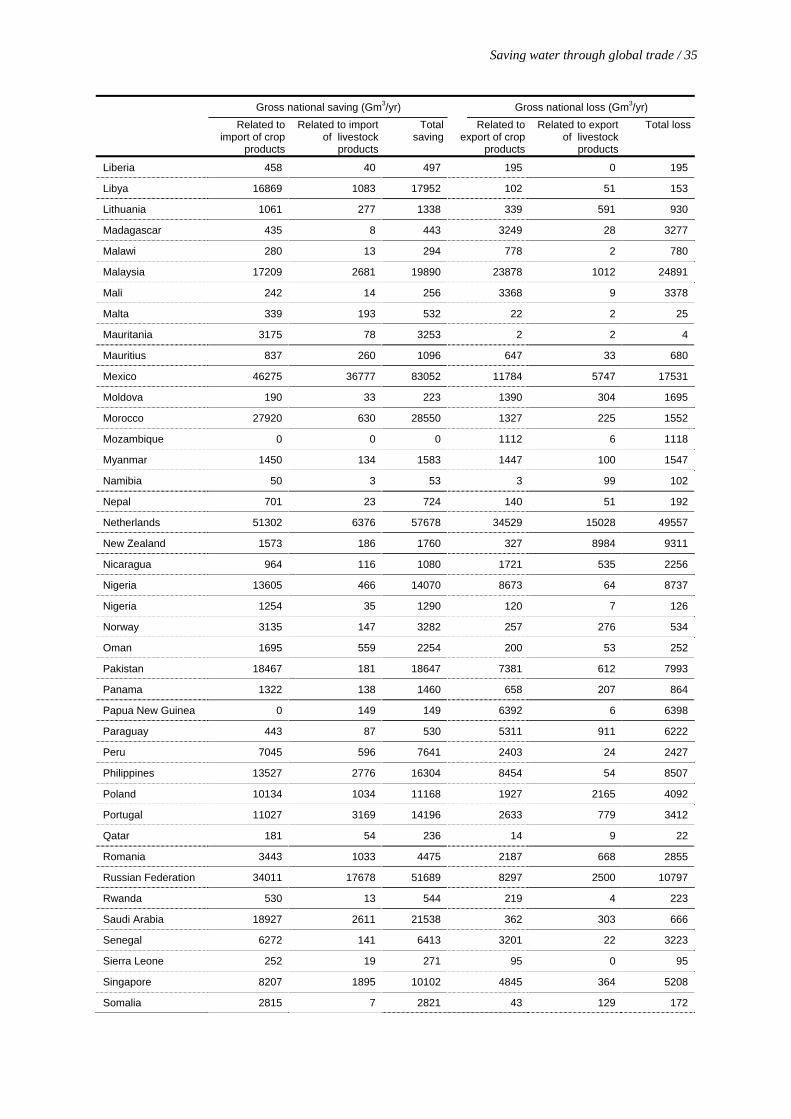
Saving water through global trade / 35
Gross national saving (Gm3/yr) Gross national loss (Gm3/yr)
Related to import of crop
products
Related to import of livestock
products
Total saving
Related to export of crop
products
Related to export of livestock
products
Total loss
Liberia 458 40 497 195 0 195
Libya 16869 1083 17952 102 51 153
Lithuania 1061 277 1338 339 591 930
Madagascar 435 8 443 3249 28 3277
Malawi 280 13 294 778 2 780
Malaysia 17209 2681 19890 23878 1012 24891
Mali 242 14 256 3368 9 3378
Malta 339 193 532 22 2 25
Mauritania 3175 78 3253 2 2 4
Mauritius 837 260 1096 647 33 680
Mexico 46275 36777 83052 11784 5747 17531
Moldova 190 33 223 1390 304 1695
Morocco 27920 630 28550 1327 225 1552
Mozambique 0 0 0 1112 6 1118
Myanmar 1450 134 1583 1447 100 1547
Namibia 50 3 53 3 99 102
Nepal 701 23 724 140 51 192
Netherlands 51302 6376 57678 34529 15028 49557
New Zealand 1573 186 1760 327 8984 9311
Nicaragua 964 116 1080 1721 535 2256
Nigeria 13605 466 14070 8673 64 8737
Nigeria 1254 35 1290 120 7 126
Norway 3135 147 3282 257 276 534
Oman 1695 559 2254 200 53 252
Pakistan 18467 181 18647 7381 612 7993
Panama 1322 138 1460 658 207 864
Papua New Guinea 0 149 149 6392 6 6398
Paraguay 443 87 530 5311 911 6222
Peru 7045 596 7641 2403 24 2427
Philippines 13527 2776 16304 8454 54 8507
Poland 10134 1034 11168 1927 2165 4092
Portugal 11027 3169 14196 2633 779 3412
Qatar 181 54 236 14 9 22
Romania 3443 1033 4475 2187 668 2855
Russian Federation 34011 17678 51689 8297 2500 10797
Rwanda 530 13 544 219 4 223
Saudi Arabia 18927 2611 21538 362 303 666
Senegal 6272 141 6413 3201 22 3223
Sierra Leone 252 19 271 95 0 95
Singapore 8207 1895 10102 4845 364 5208
Somalia 2815 7 2821 43 129 172

36 / Saving water through global trade a
Gross national saving (Gm3/yr) Gross national loss (Gm3/yr)
Related to import of crop
products
Related to import of livestock
products
Total saving
Related to export of crop
products
Related to export of livestock
products
Total loss
South Africa 10566 1147 11713 6326 1312 7638
Spain 38530 11453 49983 18252 8540 26791
Sri Lanka 1643 157 1800 2381 46 2427
Sudan 1085 26 1110 7251 273 7524
Suriname 38 7 45 178 1 179
Swaziland 0 0 0 0 0 0
Sweden 5289 1215 6504 2034 808 2842
Switzerland 5773 571 6344 1163 401 1564
Syria 15448 608 16056 4025 512 4537
Taiwan 13360 4000 17360 329 3559 3888
Tanzania 1695 17 1712 3173 52 3225
Thailand 13611 2022 15633 38307 2856 41163
Togo 570 13 583 1920 2 1922
Trinidad and Tobago 811 210 1021 350 15 365
Tunisia 6216 955 7171 11013 71 11084
Turkey 17078 1032 18110 11069 335 11404
Turkmenistan 221 98 318 1071 27 1098
Uganda 2569 5 2574 4432 77 4510
Ukraine 2247 407 2654 8154 2447 10602
United Arab Emirates 0 0 0 4603 475 5078
United Kingdom 36398 9017 45415 8773 3785 12559
Uruguay 675 161 836 2009 3348 5357
USA 50601 27488 78089 134611 35306 169917
Uzbekistan 1252 281 1533 6533 55 6588
Venezuela 15823 648 16472 1394 389 1783
Viet Nam 2516 379 2894 11124 165 11289
Yemen 8047 587 8634 243 37 280
Zambia 383 12 395 508 14 522
Zimbabwe 0 0 0 3032 319 3351
Others 16471 4685 21156 7227 9330 16557
Total 1285537 319723 1605260 978566 274551 1253117
