saving potential of regional comprehensive economic
TRANSCRIPT

Journal of Economic Info Vol 6 No 1; 34- 42
34
Journal of Economic Info (JEI)
ISSN:2313-3376
www.readersinsight.net/jei
Saving Potential of Regional Comprehensive Economic Partnership (RCEP): Implication for China and Japan Ranti Yulia Wardani*1, Nawalage S. Cooray2 1Ph.D. Candidate at the International University of Japan's Graduate School of International Relations Niigata, Japan. 2Professor at the International University of Japan, Graduate School of International Relations, Niigata, Japan. * Corresponding author: [email protected]
Abstract ASEAN community and six ASEAN FTA partners' leaders have engaged in strengthening economic development within the region by establishing RCEP. ASEAN had signed trade agreements with all the other six FTA partners. The other six ASEAN trading partners within RCEP have no free trade agreements yet among them. Therefore, the RCEP is involved in tough negotiation among the six non-ASEAN member countries. RCEP commitment is established through ASEAN as a catalyst. This study will examine the total saving potential of free trade agreement by using ex-ante FTA analysis and the political implication of RCEP for non-ASEAN member countries, especially Japan and China. The impact of RCEP will be insignificant without China and Japan existence. These two countries are essential to be maintained in the RCEP initiatives. The six non-ASEAN members in RCEP are finding ways to exploit the balance benefit among them. China-Japan relations will be embedded in the RCEP association if RCEP is concluded. From the economic perspective Japan and China seems to have strong economic interdependence. From the political perspective both countries have long history relations, distrust and mistrust. Therefore, economic interdependence could be the way forward for both countries to have a harmonious relationship. Japan and China need ASEAN and other RCEP members to tighten the economic and political relations among them.
ARTICLE INFORMATION Received: 10 Dec 2018 Revised: 10 Jan 2019 Accepted: 31 Jan 2019 DOI: 10.31580/jei.v6i1.122
Keywords: Japan; China; ASEAN; RCEP; Political; Economy; Regionalism
© Readers Insight Publication
INTRODUCTION
The Association of Southeast Asian Nations (ASEAN) community is building a relationship with some other countries under free trade agreements (FTAs). The ASEAN community consists of ten countries: Brunei Darussalam, Cambodia, Indonesia, Lao PDR, Malaysia, Myanmar, Philippines, Singapore, Thailand, and Vietnam. ASEAN leaders and six ASEAN FTA partners' leaders are engaging in strengthening economic development within the region by establishing a Regional Comprehensive Economic Partnership (RCEP). RCEP member countries are ASEAN member countries, plus the People's Republic of China (PRC), Japan, Republic of Korea (ROK), India, Australia, and New Zealand. RCEP has been proposed based on the ASEAN community during the 21st ASEAN Summit in November 2012 (ASEAN.org, 2016). The RCEP objective is achieving a modern, high-quality economic partnership and comprehensively contributing towards mutual benefit among members (ASEAN.org, 2016). In addition to trade and economic developments, politics are among the main factors affecting the regional relationship of the RCEP members. Political factor as a driving force is one of the essential factors in the free trade agreement and relationship building among countries. ASEAN centrality is the critical role in strengthening economic collaboration and magnifying economic integration within RCEP. Furthermore, RCEP will negotiate on trade in goods, investment, trade in service, intellectual property, competition, economic and technical cooperation, dispute settlement and other issues (ASEAN Secretariat, 2016b).
ASEAN Plus Three (APT) is cooperation between PRC, Japan, and ROK. This APT cooperation was institutionalized in 1999 by issuing a joint statement on East Asia Cooperation and adopting the comprehensive partnership in 2007 (ASEAN Secretariat, 2017). ASEAN and China signed FTA in November 2002; ASEAN, Australia, and New Zealand had signed FTA in February 2009;
ASEAN and India signed trade in good agreement in August 2009; ASEAN and Japan signed a comprehensive economic partnership agreement in April 2008; ASEAN and ROK have signed FTA in December 2005 (ASEAN Secretariat, 2016a). Some of the other six ASEAN trading partners within RCEP have no free trade agreements yet among them. Therefore, the RCEP is having tough negotiation among the six non-ASEAN member countries.
China and Japan are the big countries that contribute a significant percentage of GDP compared to other participant countries. China and Japan have been viewed as rivalry states with greater political and economic power than other countries within the RCEP (Yoshimatsu, 2017). India feels pressure to reduce tariff more than 90% to all RCEP members, including China (Sen, 2018). These non-ASEAN member countries are negotiating to find the balance of optimal benefit among them. These non-ASEAN member countries are bargaining in terms of political and economic perspectives. The bargaining political and economic powers among non-ASEAN members are essential to be analyzed for the sustainability of RCEP. This paper will analyze the following questions: How has the relationship between China and Japan developed within ASEAN centrality? How much is the potential saving tariffs reduction of FTA between these China and Japan?
Many studies have been conducted in order to explore the economic implication of the free trade agreement between ASEAN and six trading partners within RCEP. Itakura (2014) has evaluated the potential liberalization impact on economic among ASEAN member states (AMSs) by using a computable general equilibrium (CGE) model. He has conducted a simulation to get the picture of building FTAs in which AMSs participate. Ahmed & Singh (2016) have investigated the financial integration of RCEP. Fukunaga & Isono (2013) have identified the opportunity, benefit and challenges of the RCEP formation and delineating FTA impact between RCEP and ASEAN+1 using dynamic GTAP analysis. Cheong & Tongzon

Journal of Economic Info Vol 6 No 1; 34- 42
35
(2013) have investigated the implications of TPP and RCEP initiatives economic integration by using the CGE model. Therefore, there is a gap to study the impact of the free trade agreement with a different measurement.
This study will examine the impact of free trade agreement by using ex-ante FTA analysis and analyze the dynamic relations between China and Japan within RCEP. The potential saving of free trade agreement among six non-ASEAN members has not been measured yet. This study will calculate the total potential saving of trade agreements between six non-ASEAN member countries, especially China and Japan, by using ex-ante FTA analysis. A clear and accurate analysis is necessary to be considered before its negotiation (Plummer, et al., 2010, p.2). The ex-ante analysis is a critical analysis to figure out the overall cost-benefit analysis, overall country negotiation position, and to identify what the country can and cannot provide to its negotiation's partners (Plummer, et al., 2010, p.2). The ex-ante analysis is increasingly utilized by researchers to be used as a free trade agreement assessment (Ziltener, 2017).
This paper will combine qualitative and quantitative methods. An in-depth literature review will be used as a qualitative method. The quantitative method will be used to calculate the potential savings of China and Japan countries if the RCEP negotiation will be concluded in the future. Both qualitative and quantitative analyses will give a useful contribution to gain knowlegde from a different perspective. The literature review approach will be used to explore the development of political, economic ASEAN and RCEP negotiation progress. This study mainly focuses on China and Japan within RCEP in the regional free trade implications context.
This study will be organized in the following order: the literature review will be described in section 2. Section 3 will describe the data and measurement result. Section 4 will be an analysis of the maximum saving potential for China's exporters and Japan's exporters by the year or cumulative results. Section 5 will explain the conclusion of the study, limitation, and recommendation for further study. LITERATURE REVIEW RCEP Economic Perspectives
ASEAN has signed ASEAN +1 FTA agreements. The agreements with ASEAN +1 do not distribute broader market access for ASEAN countries comparef to RCEP. Moreover, RCEP gives an opportunity for ASEAN to broaden market access by maintaining commitments in trade of goods and services, and rules of origin (ROO) (Fukunaga, 2015). Table 1 below shows that the world percentage ASEAN GDP was small at 3,37% in 2016. The other six ASEAN FTAs partners of RCEP GPD is 27,96% in 2016. It shows that ASEAN's GDP is only a small number percentage of GDP without the other six FTAs partners sign-up in the RCEP. In this regard, Fukunaga (2015) suggests that ASEAN centrality plays a role as the "facilitator of process" and as "the driver of substance." ASEAN has become the driver of substance by considering the political aspect and economical aspect. Fukunaga (2015) explains that ASEAN +1 FTAs is creating the "noodle-bowl" situation. Therefore, RCEP facilitates the "noodle-bowl" problem with different rules and commitments.
Table 1. ASEAN GDP VS RCEP GDP 2011 2012 2013 2014 2015 2016 ASEAN GDP 3,13% 3,24% 3,26% 3,20% 3,27% 3,37% 6 ASEAN FTAs Partners 24,99% 26,08% 25,57% 25,86% 27,34% 27,96%
RCEP 28,13% 29,32% 28,82% 29,05% 30,61% 31,32% Data source: The World Bank, authors’ calculation
Figure 1 below shows the proportion of the total RCEP
GDP. It shows that China's GDP dominated among the other countries within RCEP. ASEAN contributes 11% of the total RCEP GDP.
Figure 1. Pie Chart ASEAN GPD within RCEP GDP in 2016
Data source: The World Bank, authors’ calculation
The formation of Regional Trade Agreements (RTA) is triggering
some arguments whether RTAs become “building blocks” or “stumbling blocks” in achieving its goal of opening a regional trading system (Scollay & Gilbert, 2001, p.10). It could not be generalizing in all trade regionalism processes. The outcome will be different based on the nature and characteristics of the countries involved in the RTA formulation. The RTA has a different objective based on the countries involved in the formulation of RTA. It is assisting the developing countries to improve their economic performance through trade and policies.
In the globalization era, the production system turns out to be more fragmented because of outsourcing and vertical specialization (Balaam & Dillman, 2014, p.127). For instance, China produces iPhone 3G's. The significant components of this product are coming from Japan, Korea, and other countries (Xing & Detert, 2010, p.4). The ‘World Is flat’ book by Friedman has explained that the production processes was spreading fast through the world especially for India and China (Balaam & Dillman, 2014, p.127). Both are two powerful countries to collaborate and compete at global level.
RCEP commitment is established through ASEAN as a catalyst. From the economic perspective, ASEAN deliberately attempts to maintain the ASEAN center within external economic relations of RCEP with FTAs network. The formulation of regional economics group can be used as a tool for controlling the agenda and membership within the regional block (Hamanaka, 2014). The potential saving of FTA will contribute to non-ASEAN member countries if RCEP is concluded in the future. Ravenhill (2010) argues that East Asian regionalism is being driven by “political domino” rather than “economic domino.” The table 2 below shows the trade agreements between sixteen countries that formulated RCEP. The table shows that the other six countries, particularly Australia-India, Japan-Korea, China-Japan, China-India, Japan-New Zealand, and India-New Zealand, have no free trade agreement yet.
RCEP Political Perspectives
Protection in international trade shows that economist insufficient to give political influence on trade policy. Baldwin, (1989, p.131) believes that economic self-interest and people welfare need to be considered as a driving force for political action. It has become a vital part of developing a better national trade policy formulation influenced by international trade agreements. Robert Kuttner has explained that "trade is always political" (Balaam & Dillman, 2014, p.128). Cai (2010, p.40) explains that the evolving of global economic since 1945 is demonstrating a different pattern of global politics and economics setting. It leads to different national interests and decision makers concern for their national economic development. These arguments show that economics, trade, and politics are interrelated to each other.
11%
47%9%
21%
6%5%
1%
Percentage of ASEAN GDP within RCEP GDP 2016
ASEAN
China
India
Japan
Korea, Rep.
Australia
New Zealand

Journal of Economic Info Vol 6 No 1; 34- 42
36
Some countries are eager to have some bilateral and multilateral trade agreement. Limão (2007) has argued that preferential trade agreement (PTA) motivation is not only trading. PTAs have some other non-trade objectives or motives. Non-trade motives of PTAs describe each of the motive consequences on the multilateral trading system. Political strategy is needed to realize the trade objectives between countries. Internal politics, social, environmental and international securities are essential to be negotiated in the bilateral or multilateral trade negotiations (Egger & Olarrega, 2014, p.136). International trade policy and trade negotiations between some countries are influencing domestic trade policy as well.
Table 2. RCEP Trade Policy (TP) Matrix Country BRN CAM IDN LAOS MYS MYA PHIL SGP THAI VNM AUS CHINA INDIA JAPAN NZL ROK BRN CAM IDN LAOS MYS MYA PHIL SGP THAI VNM AUS CHINA INDIA JAPAN NZL ROK Yellow: The ASEAN Free Trade Area (AFTA) will be fully implemented ASEAN member states, including the CLMV states which were given more time, will conclude this year
the process of internal tariff elimination that started in 1993 ASEAN Free Trade Area (AFTA) - Common Effective Preferential Tariff (CEPT): for goods originating
within ASEAN, ASEAN members are to apply a tariff rate of 0-5 % (the more recent members of Cambodia, Laos, Myanmar, and Vietnam, CMLV, were given additional time to implement the reduced tariff rates)
ASEAN Trade in Goods Agreement (ATIGA) since 2010: Pink: Framework Agreement on China-ASEAN Comprehensive Economic Cooperation Blue: WTO MFN relation, green: FTA relation, dark green: FTA under negotiations 240 TP relations, of which 6 WTO-MFN (AUS-INDIA, JAPAN-KOREA, CHINA-JAPAN, CHINA-
INDIA, NZL-JAPAN, NZL-INDIA), RCEP turns this into 1 TP framework
Dai, (2015, pp.5-6) differentiates between regionalization and
regionalism. He explains that regionalization is economic flows within region that merge and regionalism is intergovernmental economic cooperation which is mainly politics. Ravenhill's (2010) article shows little support for the argument that the new East Asian economic regionalism objective is to expand its market to other countries under the free trade agreements. He argues that in regionalism political domino effect plays the major part compared to an economic domino effect.
RCEP will be part of the regional partnership that intergovernmental economic cooperation is dominated by political objective than economic objective. The ten AMSs had the central trade negotiations within RCEP. RCEP negotiations recognize the unique setting of ASEAN. Therefore, ASEAN as a catalyst is playing an essential role in the RCEP mega trading negotiation and ASEAN is balancing its position with non-ASEAN members (Fukunaga, 2015). Yoshimatsu (2017) explains that ASEAN is trying to maintain the central position by creating a social constitution and norms system. ASEAN has maintained the centrality between China-Japan relations by placing them in the social constitution construction and keeping away exclusive links with each of the two countries. China and Japan Relations: Competition and Cooperation
There are two perspectives of China’s rise: liberal and realist perspectives. The liberal perspective believed that economic interrelation between countries such as foreign direct investment and trade would lead to peace and harmony (Takeuchi, 2014, p.8). Neo-liberal is viewing China integration will be peaceful utilizing economic engagement, strategic agreement and the network of normative obligation (Xie and Page, 2010, p.481). The realist perspective believed that China’s economic growth, China’s ambition
of its territory, China’s power confident escalation, Japan’s economic stagnation, Japan’s nationalism, and Japanese people’ fear of China are increasing the rivalry tensions between both countries (Takeuchi, 2014, p.8). John Mearsheimer, as a realist theorist, believed that great powers are feared and compete with each other to reach dominant power to maintain their sustainability (Xie and Page, 2010, p.481).
Sino-Japanese bilateral relations complexities have affected not both countries but also the East Asian regional level and global level (Honghua, 2010, p.75). The complexity of Sino-Japanese has accompanied by long history relations, distrust, and mistrust (Honghua, 2010, p.75). Mistrust and fear play a pivotal part in several expositions of international conflict (Kydd 2000, p.325). Sino-Japanese tensions are complex and durable, but the South East Asians elites look forward to eliminating the conflict escalation and to increase the engagement level with ASEAN and South East Asian countries as an opportunity (Singh, et al. 2017, p.112).
China and Japan have improved the economic interdependence within the last twenty years and Sino-Japanese relations have notably developed from 2006 to 2012 (Takeuchi, 2014, p.29). Takeuchi (2014, p.29) has explained that the economic interrelations become a fundamental bilateral relationship development on the assumption that authoritarian leader was having an environment to deliver a strong signal to alter public opinion. Sino-Japanese relations are deteriorating since 2012 because China clearly shows the ambition for Senkaku/Diaoyu Island territory (Takeuchi, 2014, p.29).
Table 3. Japan’s Biggest Trading Partners (2016) Japan’s Trading Partners
Export (US$
thousand)
Import (US$
thousand)
Import Partner Share (%)
Export Partner Share (%)
United States 130,585,866 69,221,593 11,41% 20,25% China 113,830,234 156,552,583 25,79% 17,65% Data source: WITS 2018
Table 3 shows that China is one of the biggest markets for Japan.
Japan has depended on the United States for security and economy because China is one of the biggest markets for Japan (Singh, 2002, p.280). It turns Japan will build economic links with Southeast Asian countries to get natural resources and to expand the markets (Singh, 2002, p.280). Japan began dialogue partner with ASEAN since 1977 and China began dialogue partner with ASEAN since 1996 (Singh, et al. 2017, p.107). China has started negotiation with ASEAN countries for a free trade agreement in 2002, and it came into effect in 2010 (Singh, et al. 2017, p.108). The Chinese’ passionate engagement with ASEAN becomes part of the major trend for China’s strategic, economic, and political movement; then later this movement required Japan to respond (Singh, et al. 2017, p.109). Japan is responding to China's initiative on the FTA with ASEAN countries by offering Comprehensive Economic Partnership with ASEAN in January 2002 and concluded in 2007 (Chung, 2011, p.415). Japanese Prime Minister Koizumi Junichiro has proposed to include Australia and New Zealand to balance China’s influence (Chung, 2011, p.415). China and Japan have encouraged economic regionalism by means of larger FTAs across Asia-Pacific (Webster, 2008, p.318). China and Japan have a different style of adopting FTA. Japan is adopting a comprehensive and orthodox style, and China is adopting gradualism and flexibility of FTA approaches (Webster, 2008).
China becomes the largest market for Japan, and Japan becomes a source of capital and technology for China (Taylor, 1996, p.58). The strategy of Chinese leaders to search for Japanese investment shows that both countries are planning for industrial development and the subsequent expanding role in the economic growth of East Asian (Taylor, 1996, p.56). The Chinese leaders believed that Japanese investment is vital for the economic leverage and Japan is the most desired partner based on the advanced technology, geographic closeness, and cultural similarity (Taylor, 1996, p.58). Japanese industrialist's investment in China is encouraged by the high cost of production as an appreciation of yen and production based abroad is increasing to gain a competitive advantage (Taylor, 1996, p.57).

Journal of Economic Info Vol 6 No 1; 34- 42
37
The spreading effect of regional integrations, China's economic growth, Japan's political effort of expansion in regional and global areas, ASEAN's normative influence, and United States' strategic alignment are the dominant dynamics pattern in East Asian subsequent development (Honghua, 2010, pp.81-82). The main concern is that the major power dynamics among Sino-Japanese competition is viewed as the manifestation of Sino-US power dynamics (Singh, et al. 2017, p.115). China and Japan relationship is the main factor of peaceful rise because China could not build a peaceful Asian international society that is peaceful at regional and global arenas without Japan (Buzan, 2010, p.35). China should lead the initiative for a peaceful rise strategy because Japan has an alliance with the United States (Buzan, 2010, p.35). Japan’s relations with Southeast Asia is a way for the United States to strengthen Southeast Asian against China communism, to maintain Japan’s access for security, to get raw materials and markets and to minimize trade between Japan and China (Schaller, 1982, p.393). China should lead first because China will gain the most from the change and will lose from the status quo (Buzan, 2010, p.35).
The Sino-Japanese connection has both competition and cooperative components. Japan demonstrates the efforts to equal to China's influence on Asian-Western Pacific regional arrangements built within the last 14 years (Chung, 2011, p.423). Based on Honghua (2010, p.74) China and Japan have consensus on the new strategic relationship: maintaining partner’s harmonious development to develop bilateral political trust, intensifying mutual cooperation to attain mutual progress, reinforcing dialogue and communication to protect and to encourage regional stability, increasing Chinese and Japanese people exchanges to enrich the common understanding between both countries, and reinforcing cooperation and coordination to reach regional and global challenges. In 2006, the Japanese Prime Minister Abe Shinzo broke the tradition by choosing China as the first foreign country visit instead of the United States (Takeuchi, 2014, p.16). The Chinese government respected the Japanese government’s signal and followed Chinese President Hu Jintao’s visit to Japan in 2008 (Takeuchi, 2014, p.16). Chinese and Japanese leaders are defining the mutual benefit relation associated with fundamental strategic interest (Takeuchi, 2014, p.16). The connection of economic interdependence is supporting to prevent the escalation of serious conflict (Honghua, 2010, p.74). China and Japan have mistrust and distrust, but mutual interdependence is growing (Honghua, 2010, p.74). It shows that the two of the most important Asian powers are collaborating to preserve security and generate prosperity for both countries and the neighborhood (Chung, 2011, p.423). In 2017, Prime Minister Shinzo Abe and Chinese President Xi Jinping met on the sidelines of Asia Pacific Economic Cooperation (APEC) Vietnam summit. Both leaders are maintaining to improve relation ties, to cope and control the dispute between the two countries, and to keep in good condition the stability of relationship (Takenaka, 2017). DATA ANALYSIS OF SAVING POTENTIAL DUTIES
China’s export and Japan’s export will be described in this section. The following table shows the Japan and China exports in the ten years data between 2006-2015. Table 4. China and Japan exports Year China’s Export to Japan
(US$ thousand) Japan’s Export to China
(US$ thousand) 2006 118,525,736 115,672,581 2007 127,922,366 133,950,504 2008 143,229,984 150,600,041 2009 122,574,081 130,937,525 2010 153,203,234 176,736,084 2011 183,882,190 194,567,856 2012 188,500,370 177,832,336 2013 180,977,514 162,245,573 2014 181,294,159 162,920,512 2015 160,559,699 142,902,573 Data source: WITS 2018 Methodology
The saving potential method will be used to calculate the saving potential for both countries. The potential saving is the export duties that should be paid by any World Trade Organization (WTO) member countries to another country based on the composition of its export duties that have not been reduced at FTA based (Ziltener, 2016b). The model will use country A and country B as a trading partners. The trading values of country A in a certain year will be multiplied with the tariff of country B and the other way around. The tariff calculation is based on the Most Favor Nation (MFN) tariff rate at the six-digit level Harmonized System Code (HS code). World Customs Organization (WCO) has developed the HS code. HS code is used as a multi-function for the international product nomenclature (World Customs Organization, 2017). The cross-section data will be used in this study. The most current year trade data will be accessed through the UN Comtrade website. The applied tariff rate data will be collected through WTO statistics trade and tariff. The other data will be collected from the World Integrated Trade Solution (WITS) and the World Bank.
This maximum saving potential will be described in detail at the statistical analysis of the saving potential duties between China and Japan. The explanation is based on the tariff reduction for the exporters in China and Japan. The scenario of the tariff reduction in this paper assumes that both sides will reduce the tariff into the maximum zero. This assumption is close to real calculation of FTA but some conditions might be applied in the realistic application of the free trade agreement. The conditions that might be applied in reality will not eliminate all the tariffs reduction into zero. In this paper, the calculation scenario of saving potential is reducing all tariffs into zero.
The statistical analysis of saving potential trade includes the Information Technology Agreement (ITA). ITA is concluded with29 participants in Singapore, December 1996 (WTO, 2018). The ITA is an agreement that leads to eliminate 201 information and technology (IT) products tariffs. The statistical analysis shows the result of both by excluding ITA and including the ITA. The statistical analysis in this paper excludes four commodities: 1) HS code 71 is natural, cultured pearls, precious, imitation jewelry, semi-precious stones, precious metals, metal clad with precious metal, articles thereof, and coin, 2) HS code 93 is arms and ammunition, 3) HS code 97 is works of art, collectors’ pieces and antiques, 4) HS 99 commodities not specified according to kind. Japan’s Exports to China The saving potential value results for Japan’s export to China shows that Japan would gain big amount of saving potential if China eliminate most of their tariffs rate for Japan. The following table shows the saving potential for Japan’s export in each commodity cluster and total saving potential. Table 5. Saving potential for Japan’s exports to China excluding ITA (2016)
Commodities HS Code
Trade Values (US$ million)
Potential Duties (US$
million) Transportation 86-89 14,277 2,520 Machinery / Electrical 84-85 67,658 2,271 Miscellaneous 90-96 16,631 1,213 Chemicals & Allied Industries 28-38 14,434 832 Plastics / Rubbers 39-40 10,215 750 Metals 72-83 12,695 710 Stone / Glass 68-70 2,140 290 Textiles 50-63 2,577 236 Mineral Products 25-27 1,469 91 Foodstuffs 16-24 301 58 Animal, Animal Products &Vegetable Products 01-15 418 46
Wood & Wood Products 44-49 1,451 43 Footwear / Headgear 64-67 49 9 Raw Hides, Skins, Leather, & Furs 41-43 55 5

Journal of Economic Info Vol 6 No 1; 34- 42
38
Total 144,370 9,074 Data source: UN Comtrade 2018, authors’ calculations
The total maximum saving potential duties for Japan is 9,074 US$ million. This total maximum saving potential is excluding the ITA. Table 5 above shows that the potential duty of transportation commodity is 2,520 US$ million, the highest potential duties among other commodities. The trade value of transportation commodities is less than the machinery/electrical commodities. It represents that China is high tariffs on transportation. In Figure 2 the transportation commodities show that the maximum tariff is 45%, the average tariff is 12,5%, the minimum tariff is 0%, and the mode tariff is 10%.
Figure 2. Tariff Range of China imports from Japan excluding ITA
Data source: WTO 2018, authors’ calculations
Table 6 below shows the Japan potential export saving duties to
China, including ITA. The total potential duties value is decreasing by 11% from 9,074 US$ million to 8,073 US$ million. Table 6 shows that the potential duties values for machinery/electrical, miscellaneous, chemicals, and allied industries commodities are decreasing after including the ITA Table 6. Saving potential for Japan’s exports to China including ITA 2016
Commodities HS Code
Trade Values (US$ million)
Potential Duties
(US$ million) Transportation 86-89 14,277 2,520 Machinery / Electrical 84-85 67,658 1,803 Miscellaneous 90-96 16,631 788 Chemicals & Allied Industries 28-38 14,434 724 Plastics / Rubbers 39-40 10,215 750 Metals 72-83 12,695 710 Stone / Glass 68-70 2,140 290 Textiles 50-63 2,577 236 Mineral Products 25-27 1,469 91 Foodstuffs 16-24 301 58 Animal, Animal Products &Vegetable Products 01-15 418 46
Wood & Wood Products 44-49 1,451 43 Footwear / Headgear 64-67 49 9 Raw Hides, Skins, Leather, & 41-43 55 5
Furs Total 144,370 8,073 Data source: UN Comtrade 2018, authors’ calculations
Figure 3 shows that the average tariff for machinery/electrical is decreasing from 8,4% to 7,5%. The average tariff for the miscellaneous is decreasing from 11,2% to 9,9%. The average tariff for chemicals and allied industries is decreasing from 6,9% to 6,8%.
Figure 3. Tariff range of China imports from Japan including ITA
Data source: WTO 2018, authors’ calculations
Figure 3 above shows that maximum tariffs for foodstuffs
commodity and animal, animal products, and vegetable products at 65% are higher than other commodities. The saving potential of duties shows that transportation commodities are the highest values among other commodities. The ten highest transportation commodities are described in the following table: Table 7. Ten highest saving potential for Japan’s transportation commodities exports to China (HS 6 digits level) 2016
HS Code Duties Trade Value
(US$ million)
Potential Duties Values (US$ million)
Descriptions
870323 25% 4,940 1,235
Vehicles; spark-ignition internal combustion reciprocating piston engine, cylinder capacity exceeding 1500cc but not exceeding 3000cc
870324 25% 2,545 636
Vehicles; spark-ignition internal combustion reciprocating piston engine, cylinder capacity exceeding 3000cc
870840 9% 4,114 370 Vehicle parts; gear boxes and parts thereof
870899 14% 481 68 Vehicle parts and accessories; n.e.c. in heading no. 8708
870829 10% 399 40 Vehicles; parts and accessories, of bodies, other
Transp
ortati
on
Machin
ery / E
lectric
al
Miscell
aneo
us
Che
micals
& Allied I
ndus
tries
Plastic
s / R
ubbe
rs
Metals
Stone /
Glas
s
Textile
s
Mineral
Produc
ts
Foods
tuffs
Animal,
Anim
al Prod
ucts
&Vegeta
ble Prod
ucts
Woo
d & W
ood P
roduc
ts
Footw
ear /
Headg
ear
Raw H
ides,
Skins,
Leath
er, & Fu
rs
12.5%8.4%11.2%6.9%9.5%7.7%13.4%11.3%4.3%18.6%13.0%
5.2%18.2%13.0%
45%
35%30%50%
25%25%28%
40%
8%
65%65%
20%
25%21%
0%
0% 0%
0%
0% 0%0%
4%
0%
0%0%
0%
10%
5%
10%
10%0%
6%
7% 8%8%
10%
3%
10%10%
8%
24%
20%
Tariff RangeAverage Max Min Mode
Transp
ortati
on
Machin
ery / E
lectric
al
Miscell
aneo
us
Che
micals
& Allied I
ndus
tries
Plastic
s / R
ubbe
rs
Metals
Stone /
Glas
s
Textile
s
Mineral
Produc
ts
Foods
tuffs
Animal,
Anim
al Prod
ucts
&Vegeta
ble Prod
ucts
Woo
d & W
ood P
roduc
ts
Footw
ear /
Headg
ear
Raw H
ides,
Skins,
Leath
er, & Fu
rs
12.5%7.5%9.9%6.8%9.5%7.7%13.4%11.3%4.3%
18.6%13.0%5.2%
18.2%13.0%
45%
35%30%50%
25%25%28%
40%
8%
65%65%
20%
25%21%
0%
0% 0%
0%
0% 0%
0%
4%
0%
0%0%
0%
10%
5%
10%
0% 0%
6%
7% 8%
8%
10%
3%
10%10%
8%
24%
20%
Tariff Range
Average Max Min Mode

Journal of Economic Info Vol 6 No 1; 34- 42
39
than safety seat belts
870894 9% 236 21
Vehicle parts; steering wheels, steering columns and steering boxes; parts thereof
870880 10% 179 18 Vehicle parts; suspension systems and parts thereof (including shock-absorbers)
870830 9% 163 14 Vehicle parts; brakes, servo-brakes, and parts thereof
870850 9% 155 14
Vehicle parts; drive-axles with differential, whether or not provided with other transmission components, and non-driving axles; parts thereof
870895 10% 135 14 Vehicle parts; safety airbags with inflater system; parts thereof
Data source: UN Comtrade 2018, authors’ calculations China’s Exports to Japan
Japan's import tariff is relatively lower than China's import tariff. The Japan import tariff statistical analysis shows that there is no significant difference between excluding ITA and including ITA. Japan's import tariffs for 201 IT products (based on ITA) are already zero. Table 8 below shows that the total saving potential duty for China's export to Japan is 3,710 US$ million. The highest total duty is the textiles commodity. The total duty for the textile commodity is 1,810 US$ million. Table 8. Saving potential for China’s exports to Japan
Commodities HS Code
Trade Values (US$ million)
Potential Duties (US$ million)
Textiles 50-63 21,555 1,810 Foodstuffs 16-24 4,758 474 Footwear / Headgear 64-67 3,726 383 Raw Hides, Skins, Leather, & Furs 41-43 2,704 253 Animal, Animal Products &Vegetable Products 01-15 3,964 237 Plastics / Rubbers 39-40 5,575 161 Chemicals & Allied Industries 28-38 7,515 127 Miscellaneous 90-96 14,730 103 Metals 72-83 8,129 71 Wood & Wood Products 44-49 3,096 62 Stone / Glass 68-70 2,091 18 Mineral Products 25-27 1,339 9 Machinery / Electrical 84-85 71,167 2 Transportation 86-89 4,180 - Total 154,530 3,710 Data Source: UN Comtrade 2018, authors’ calculations
The total trade value of textile 21,555 US$ million is less than the
total value of machinery/electrical 71,167 US$ million. The tariff range of textile is higher than the tariff of machinery/electrical. The all Japan's transportation tariffs are zero. Figure 4 below shows that the maximum tariff is footwear/headgear at 28,5%; animal, animal products, and vegetable products at 28,5%; and raw hides, skins, leather, and furs at 25%. The foodstuff is the second highest duties value with the total potential duties at 474 US$ million. The average duty of foodstuff is 10,3%.
Figure 4. Tariff range of Japan’s imports from China excluding ITA
(See Appendix –A for Figure 4) China’s trade value of textile exports is 21,554 US$ million. The
maximum tariff for textile is 13,4%, and the average tariff is 6,5%. The tariff ranges shows the tariff barrier from each commodity for China’s export to Japan. The tariff range figure of Japan’s duties
above shows that the tariff barrier is relatively lower than the tariff barrier of China’s duties.
Table 9. Ten highest saving potential for China’s textile commodities exports to Japan. (HS 6 digits level) 2016
HS Code Duties Trade Value
(US$ million)
Potential Duties (US$
million) Descriptions
611030 11% 1,914 206
Jerseys, pullovers, cardigans, waistcoats and similar articles; of human-made fibers, knitted or crocheted
611020 10% 721 75
Jerseys, pullovers, cardigans, waistcoats, and similar articles; of cotton, knitted or crocheted
610910 10% 614 60 T-shirts, singlets and other vests; of cotton, knitted or crocheted
610990 10% 553 54
T-shirts, singlets and other vests; of textile materials (other than cotton), knitted or crocheted
620462 10% 524 50
Trousers, bib and brace overalls, breeches and shorts; women's or girls', of cotton (not knitted or crocheted)
630790 5% 901 48
Textiles; made up articles (including dress patterns), n.e.c. in chapter 63, n.e.c. in heading no. 6307
620193 11% 410 45
Anoraks (including ski-jackets), wind-cheaters, wind-jackets, and similar articles; men's or boys', of human-made fibers, other than those of heading no. 6203 (not knitted or crocheted)
610620 10% 428 42
Blouses, shirts, and shirt-blouses; women's or girls', of human-made fibers, knitted or crocheted
620463 10% 427 41
Trousers, bib and brace overalls, breeches and shorts; women's or girls', of synthetic fibers (not knitted or crocheted)
620213 11% 355 39
Coats; women's or girls', overcoats, raincoats, car-coats, capes, cloaks, and similar articles, of human-made fibers, other than those of heading no. 6204 (not knitted or crocheted)
Data Source: UN Comtrade 2018, authors’ calculations The saving potential tariff analysis is a useful analysis to figure
out the saving potential that could be utilized from the free trade tariff reduction agreement. Table 9 above shows the ten highest duties of the textile commodity. The detail calculation of the duties shows that each of the commodities has a different tariff. Therefore, the free trade agreement could utilize the results of saving potential analysis of tariff reduction into more detail by using ex-ante analysis to find out the tariff reduction value.
Journal of Economic Info Vol 6 No 1; 34- 42
40
Table 10. Comparison of GDP to maximum saving potential No. Japan
(US$ million) China (US$ million)
1. GDP (current US$) 2016 4,939,380 11,199,145 2. Max saving potential 8,073 3,710 3. Ratio (2/3) 0.2% 0.03% Data Source: WITS 2018, authors’ calculations.
The comparison of the GDP to maximum saving potential between Japan and China shows that the ratio for maximum saving potential to GDP for Japan 0.2% and for China 0.03%. Therefore, Japan has bigger ratio of saving potential than China. DATA ANALYSIS OF MAXIMUM SAVING POTENTIAL BY YEAR FOR ALL THE TOTAL PRODUCTS
The maximum saving potential for Japan's exports and China's exports have been calculated. In this paper, the scenario for the maximum free trade calculation of saving potential starts at the year of enforcement basis. The data of this paper is retrieved from the latest year available in 2016 from the UN Comtrade. The maximum saving is calculated based on the estimation that all these products are according to the rules of origin and utilization rate is 100%. It means that the free trade agreement will be effectively applied for all products. In the real application of FTA shows that utilization rate has not utilized up to 100%. For example, the utilization rate of Swiss export to Germany is 50% and another 40% exports on the duty-free basis (Ziltener and Blind, 2015). The ex-ante analysis is using the free trade utilization rate in order to analyze the saving potential close to reality (Ziltener, 2016a). The ideal utilization rate obtains from the ex-post analysis. The free trade agreement utilization rate calculates the free trade agreement successfully implemented to attain duty-free export (Ziltener, 2016a). If the utilization rate utilized is 66%, it means 66% of all exports (value based) in that year have been free from customs duties (Ziltener, 2016a). Therefore, the utilization rate is used to assume as a scenario for free trade between Japan and China. There are three scenarios in this paper. The first scenario is using the maximum utilization rate of 100%, the second scenario is using a medium utilization rate at 66%, and the third scenario is using the low utilization rate at 33%.
The assumption will calculate closer to the realistic projection by including export growth. The assumption of export growth: Japan's export to China growth annually is 5,4%, and China's export to Japan growth annually is 5,6%. These average export growths are calculated based on the average of country growth (%) data available in WITS. The China country growth of export is averaging from 1992 to 2015. The Japan country growth of export is averaging from 1993 to 2015.
The free trade negotiation between Japan and China has not been concluded yet. The maximum saving potential estimation could not be based on the specific agreement. The assumption can be made by assuming that it will cover substantially all trade as the GATT article (Ziltener, 2016a). The tariff will take part over ten years in 10 equal steps. The assumption is that the tariff will be eliminated on the first day of enforcement. Thus, the realization of the maximum saving potential in year one will be projected up to year 10.
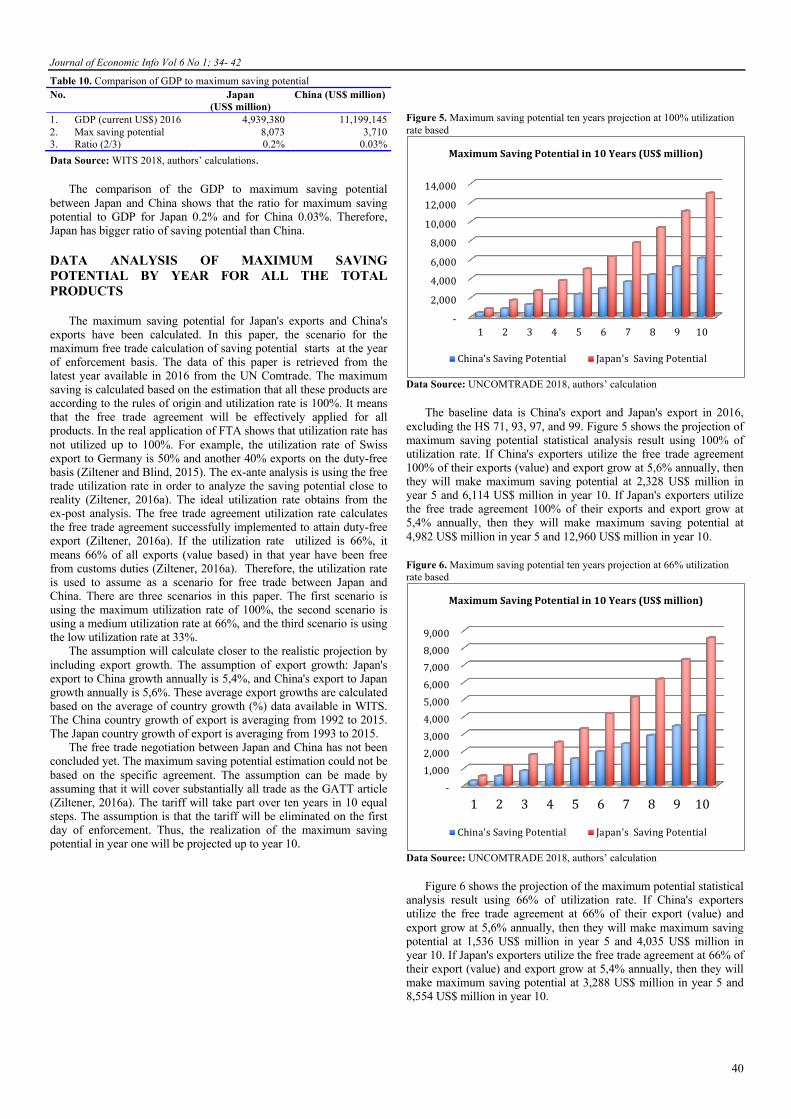
Figure 5. Maximum saving potential ten years projection at 100% utilization rate based
Data Source: UNCOMTRADE 2018, authors’ calculation
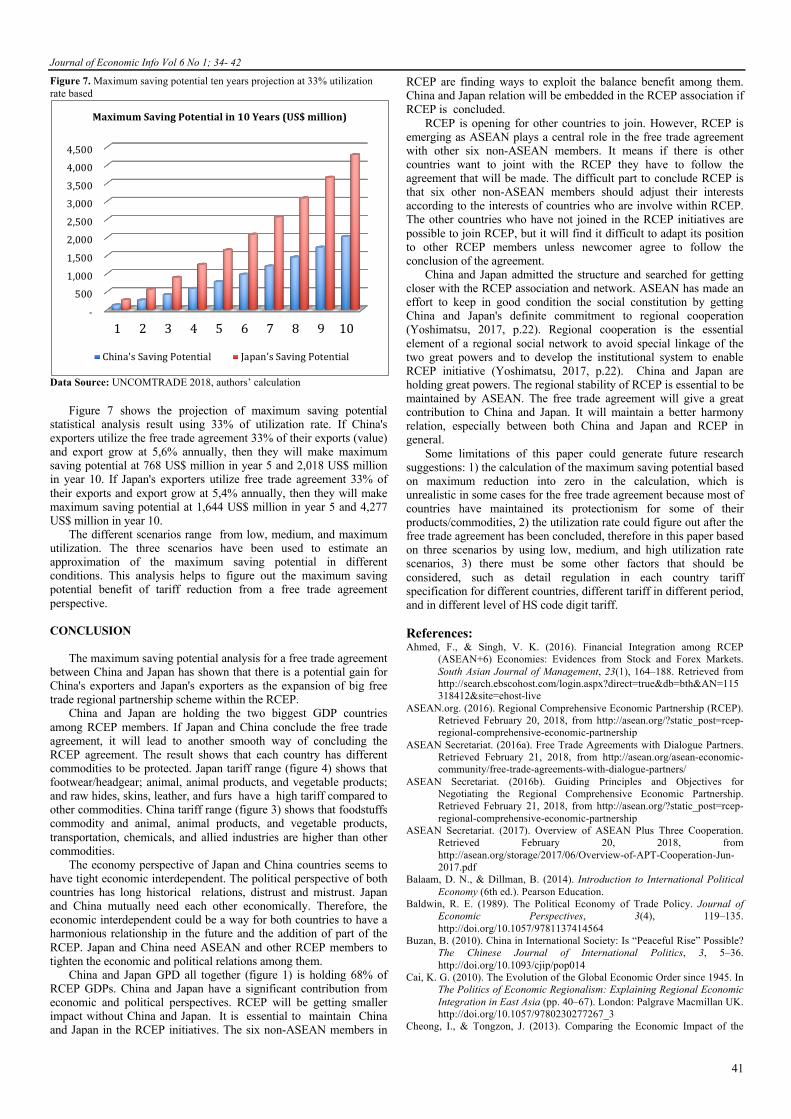
The baseline data is China's export and Japan's export in 2016, excluding the HS 71, 93, 97, and 99. Figure 5 shows the projection of maximum saving potential statistical analysis result using 100% of utilization rate. If China's exporters utilize the free trade agreement 100% of their exports (value) and export grow at 5,6% annually, then they will make maximum saving potential at 2,328 US$ million in year 5 and 6,114 US$ million in year 10. If Japan's exporters utilize the free trade agreement 100% of their exports and export grow at 5,4% annually, then they will make maximum saving potential at 4,982 US$ million in year 5 and 12,960 US$ million in year 10. Figure 6. Maximum saving potential ten years projection at 66% utilization rate based
Data Source: UNCOMTRADE 2018, authors’ calculation
Figure 6 shows the projection of the maximum potential statistical
analysis result using 66% of utilization rate. If China's exporters utilize the free trade agreement at 66% of their export (value) and export grow at 5,6% annually, then they will make maximum saving potential at 1,536 US$ million in year 5 and 4,035 US$ million in year 10. If Japan's exporters utilize the free trade agreement at 66% of their export (value) and export grow at 5,4% annually, then they will make maximum saving potential at 3,288 US$ million in year 5 and 8,554 US$ million in year 10.
-
2,000
4,000
6,000
8,000
10,000
12,000
14,000
1 2 3 4 5 6 7 8 9 10
MaximumSavingPotentialin10Years(US$million)
China'sSavingPotential Japan'sSavingPotential
-1,0002,0003,0004,0005,0006,0007,0008,0009,000
1 2 3 4 5 6 7 8 9 10
MaximumSavingPotentialin10Years(US$million)
China'sSavingPotential Japan'sSavingPotential
Journal of Economic Info Vol 6 No 1; 34- 42
41
Figure 7. Maximum saving potential ten years projection at 33% utilization rate based
Data Source: UNCOMTRADE 2018, authors’ calculation
Figure 7 shows the projection of maximum saving potential statistical analysis result using 33% of utilization rate. If China's exporters utilize the free trade agreement 33% of their exports (value) and export grow at 5,6% annually, then they will make maximum saving potential at 768 US$ million in year 5 and 2,018 US$ million in year 10. If Japan's exporters utilize free trade agreement 33% of their exports and export grow at 5,4% annually, then they will make maximum saving potential at 1,644 US$ million in year 5 and 4,277 US$ million in year 10.
The different scenarios range from low, medium, and maximum utilization. The three scenarios have been used to estimate an approximation of the maximum saving potential in different conditions. This analysis helps to figure out the maximum saving potential benefit of tariff reduction from a free trade agreement perspective. CONCLUSION
The maximum saving potential analysis for a free trade agreement between China and Japan has shown that there is a potential gain for China's exporters and Japan's exporters as the expansion of big free trade regional partnership scheme within the RCEP.
China and Japan are holding the two biggest GDP countries among RCEP members. If Japan and China conclude the free trade agreement, it will lead to another smooth way of concluding the RCEP agreement. The result shows that each country has different commodities to be protected. Japan tariff range (figure 4) shows that footwear/headgear; animal, animal products, and vegetable products; and raw hides, skins, leather, and furs have a high tariff compared to other commodities. China tariff range (figure 3) shows that foodstuffs commodity and animal, animal products, and vegetable products, transportation, chemicals, and allied industries are higher than other commodities.
The economy perspective of Japan and China countries seems to have tight economic interdependent. The political perspective of both countries has long historical relations, distrust and mistrust. Japan and China mutually need each other economically. Therefore, the economic interdependent could be a way for both countries to have a harmonious relationship in the future and the addition of part of the RCEP. Japan and China need ASEAN and other RCEP members to tighten the economic and political relations among them.
China and Japan GPD all together (figure 1) is holding 68% of RCEP GDPs. China and Japan have a significant contribution from economic and political perspectives. RCEP will be getting smaller impact without China and Japan. It is essential to maintain China and Japan in the RCEP initiatives. The six non-ASEAN members in
RCEP are finding ways to exploit the balance benefit among them. China and Japan relation will be embedded in the RCEP association if RCEP is concluded.
RCEP is opening for other countries to join. However, RCEP is emerging as ASEAN plays a central role in the free trade agreement with other six non-ASEAN members. It means if there is other countries want to joint with the RCEP they have to follow the agreement that will be made. The difficult part to conclude RCEP is that six other non-ASEAN members should adjust their interests according to the interests of countries who are involve within RCEP. The other countries who have not joined in the RCEP initiatives are possible to join RCEP, but it will find it difficult to adapt its position to other RCEP members unless newcomer agree to follow the conclusion of the agreement.
China and Japan admitted the structure and searched for getting closer with the RCEP association and network. ASEAN has made an effort to keep in good condition the social constitution by getting China and Japan's definite commitment to regional cooperation (Yoshimatsu, 2017, p.22). Regional cooperation is the essential element of a regional social network to avoid special linkage of the two great powers and to develop the institutional system to enable RCEP initiative (Yoshimatsu, 2017, p.22). China and Japan are holding great powers. The regional stability of RCEP is essential to be maintained by ASEAN. The free trade agreement will give a great contribution to China and Japan. It will maintain a better harmony relation, especially between both China and Japan and RCEP in general.
Some limitations of this paper could generate future research suggestions: 1) the calculation of the maximum saving potential based on maximum reduction into zero in the calculation, which is unrealistic in some cases for the free trade agreement because most of countries have maintained its protectionism for some of their products/commodities, 2) the utilization rate could figure out after the free trade agreement has been concluded, therefore in this paper based on three scenarios by using low, medium, and high utilization rate scenarios, 3) there must be some other factors that should be considered, such as detail regulation in each country tariff specification for different countries, different tariff in different period, and in different level of HS code digit tariff. References: Ahmed, F., & Singh, V. K. (2016). Financial Integration among RCEP
(ASEAN+6) Economies: Evidences from Stock and Forex Markets. South Asian Journal of Management, 23(1), 164–188. Retrieved from http://search.ebscohost.com/login.aspx?direct=true&db=bth&AN=115318412&site=ehost-live
ASEAN.org. (2016). Regional Comprehensive Economic Partnership (RCEP). Retrieved February 20, 2018, from http://asean.org/?static_post=rcep-regional-comprehensive-economic-partnership
ASEAN Secretariat. (2016a). Free Trade Agreements with Dialogue Partners. Retrieved February 21, 2018, from http://asean.org/asean-economic-community/free-trade-agreements-with-dialogue-partners/
ASEAN Secretariat. (2016b). Guiding Principles and Objectives for Negotiating the Regional Comprehensive Economic Partnership. Retrieved February 21, 2018, from http://asean.org/?static_post=rcep-regional-comprehensive-economic-partnership
ASEAN Secretariat. (2017). Overview of ASEAN Plus Three Cooperation. Retrieved February 20, 2018, from http://asean.org/storage/2017/06/Overview-of-APT-Cooperation-Jun-2017.pdf
Balaam, D. N., & Dillman, B. (2014). Introduction to International Political Economy (6th ed.). Pearson Education.
Baldwin, R. E. (1989). The Political Economy of Trade Policy. Journal of Economic Perspectives, 3(4), 119–135. http://doi.org/10.1057/9781137414564
Buzan, B. (2010). China in International Society: Is “Peaceful Rise” Possible? The Chinese Journal of International Politics, 3, 5–36. http://doi.org/10.1093/cjip/pop014
Cai, K. G. (2010). The Evolution of the Global Economic Order since 1945. In The Politics of Economic Regionalism: Explaining Regional Economic Integration in East Asia (pp. 40–67). London: Palgrave Macmillan UK. http://doi.org/10.1057/9780230277267_3
Cheong, I., & Tongzon, J. (2013). Comparing the Economic Impact of the
-
500
1,000
1,500
2,000
2,500
3,000
3,500
4,000
4,500
1 2 3 4 5 6 7 8 9 10
MaximumSavingPotentialin10Years(US$million)
China'sSavingPotential Japan'sSavingPotential

Journal of Economic Info Vol 6 No 1; 34- 42
42
Trans-Pacific Partnership and the Regional Comprehensive Economic Partnership. Asian Economic Papers, 12(2), 144–164.
Chung, C.-P. (2011). Japan’s Involvement in Asia-Centered Regional Forums in the Context of Relations with China and the United States. Asian Survey, 51(3), 407–428.
Dai, X. (2015). Who defines the rules of the game in East Asia? The Trans-Pacific Partnership and the strategic use of international institutions. International Relations of the Asia-Pacific, 15, 1–25. http://doi.org/10.1093/irap/lcu014
Egger, P., & Olarrega, M. (2014). Introduction to the special issue on the political economy of multilateral trade negotiations. The Review of International Organizations, 9(2), 135–142. Retrieved from https://link.springer.com/article/10.1007/s11558-014-9196-2
Fukunaga, Y. (2015). ASEAN’s leadership in the regional comprehensive economic partnership. Asia and the Pacific Policy Studies, 2(1), 103–115. http://doi.org/10.1002/app5.59
Fukunaga, Y., & Isono, I. (2013). Taking ASEAN+1 FTAs towards the RCEP: A Mapping Study. ERIA Discussion Paper Series. Retrieved from http://www.eria.org/ERIA-DP-2013-02.pdf
Hamanaka, S. (2014). TPP versus RCEP: Control of Membership and Agenda Setting. Journal of East Asian Economic Integration, 18(2), 163–186. http://doi.org/10.11644/KIEP.JEAI.2014.18.2.279
Honghua, M. (2010). East Asian Order Formation and Sino-Japanese Relations. Indiana Journal of Global Legal Studies, 17(1), 47–82.
Itakura, K. (2014). Impact of liberalization and improved connectivity and facilitation in ASEAN. Journal of Asian Economics, 35, 2–11. http://doi.org/10.1016/j.asieco.2014.09.002
Kydd, A. (2000). Trust, Reassurance, and Cooperation. International Organization, 54(2), 325–357. http://doi.org/10.1162/002081800551190
Limão, N. (2007). Are Preferential Trade Agreements with Non-trade Objectives a Stumbling Block for Multilateral Liberalization? The Review of Economic Studies, 74(3), 821–855. http://doi.org/10.1111/j.1467-937X.2007.00456.x
Page, S. (2003). How Developing Countries Trade: The Institutional Constraints. New York: Routledge. Retrieved from https://books.google.co.jp/books?id=ZVSKAgAAQBAJ
Plummer, M. G., Cheong, D., & Hamanaka, S. (2010). Methodology for Impact Assessment of Free Trade Agreements. Manila. Retrieved from http://www20.iadb.org/intal/catalogo/PE/2011/07645.pdf
Ravenhill, J. (2010). The “new East Asian regionalism”: A political domino effect. Review of International Political Economy, 17(2), 178–208. http://doi.org/10.1080/09692290903070887
Schaller, M. (1982). Securing the Great Crescent: Occupied Japan and the Origins of Containment in Southeast Asia. The Journal of American History, 69(2), 392–414. http://doi.org/10.2307/1893825
Scollay, R., & Gilbert, J. (2001). New Regional Trading Arrangements in the Asia Pacific? Institute for International Economics. Retrieved from https://books.google.co.jp/books?id=u4u2AAAAIAAJ
Sen, A. (2018). RCEP talks: India “unhappy” with revised service offers, too. Retrieved March 8, 2018, from https://www.thehindubusinessline.com/economy/macro-economy/rcep-talks-india-unhappy/article22661235.ece
Singh, B. (2002). Asean’s Perceptions Of Japan: Change and Continuity. Asian Survey, 42(2), 276–296.
Singh, B., Teo, S., & Ho, B. (2017). Rising Sino-Japanese competition:
perspectives from South-East Asian elites. Australian Journal of International Affairs, 71(1), 105–120. http://doi.org/10.1080/10357718.2016.1157849
Takenaka, K. (2017). Abe hails “fresh start” to Japan-China ties after Xi meeting. Retrieved April 17, 2018, from https://www.reuters.com/article/us-apec-summit-japan-china/abe-hails-fresh-start-to-japan-china-ties-after-xi-meeting-idUSKBN1DB0HU
Takeuchi, H. (2014). Sino-Japanese relations: power, interdependence, and domestic politics. International Relations of the Asia-Pacific Volume, 14, 7–32. http://doi.org/10.1093/irap/lct023
Taylor, R. (1996). Japanese investment in China. In Greater China and Japan (pp. 56–108). London: Routledge.
Webster, T. (2008). East Asia Institutionalizes: China, Japan and the Vogue for Free Trade. Faculty Publications, 77, 301–318. http://doi.org/10.1163/157181008X324000
World Customs Organization. (n.d.). What is the Harmonized System (HS)? Retrieved February 24, 2017, from http://www.wcoomd.org/en/topics/nomenclature/overview/what-is-the-harmonized-system.aspx
WTO. (2018). Information Technology Agreement. Retrieved March 20, 2018, from https://www.wto.org/english/tratop_e/inftec_e/inftec_e.htm
Xie, T., & Page, B. I. (2010). Americans and the Rise of China as a World Power. Journal of Contemporary China, 19(65), 479–501. http://doi.org/10.1080/10670561003666095
Xing, Y., & Detert, N. (2010). How the iPhone Widens the United States Trade Deficit with the People’s Republic of China (No. 257). Tokyo. Retrieved from https://www.adb.org/sites/default/files/publication/156112/adbi-wp257.pdf
Yoshimatsu, H. (2017). Meanings, Norms, and Social Constitution: Revisiting ASEAN Centrality in East Asian Regionalism (No. RWP-17002). Retrieved from http://www.apu.ac.jp/rcaps/uploads/fckeditor/publications/workingPapers/RWP_17002.pdf
Ziltener, P. (2016a). Free Trade Agreement Report 2015: The Potential of Free Trade Agreements with ASEAN Countries and BRAZIL for Swiss Exporters. Zurich. Retrieved from https://www.s-ge.com/sites/default/files/cserver/static/downloads/potential-fta-asean-countries-brazil-swiss-exporters-s-ge-2016.pdf
Ziltener, P. (2016b). The Free Trade and Economic Partnership Agreement (FTEPA): An Evaluation of its Utilization By Swiss and Japanese Companies (2009-2014). Retrieved from http://www.s-ge.com/sites/default/files/Final_Report_FTEPA_with_S-GE_Logo_Feb_2016_FINAL_0.pdf
Ziltener, P. (2017). The missing link: The case of free trade between Switzerland and Taiwan. Aussenwirtschaft, University of St. Gallen, School of Economics and Political Science, Swiss Institute for International Economics and Applied Economics Research, 68(1), 115–138. Retrieved from http://ux-tauri.unisg.ch/RePEc/usg/auswrt/AW_68-01__09_Ziltener.pdf
Ziltener, P., & Blind, G. D. (2015). Switzerland’s new Free Trade Agreements (FTA): Opportunities in Asia, Middle East and America for Swiss Exporters. Zurich. Retrieved from http://www.zora.uzh.ch/id/eprint/122868/1/75485.pdf
APPENDIX – A Figure 4. Tariff range of Japan’s imports from China excluding ITA

Journal of Economic Info Vol 6 No 1; 34- 42
43
Data Source: WTO 2018, authors’ calculations
Textile
s
Foods
tuffs
Footw
ear /
Headg
ear
Raw H
ides,
Skins,
Leath
er, & Fu
rs
Animal,
Anim
al Prod
ucts
&Vegeta
ble…
Plastic
s / R
ubbe
rs
Che
micals
& Allied I
ndus
tries
Miscell
aneo
us
Metals
Woo
d & W
ood P
roduc
ts
Stone /
Glas
s
Mineral
Produc
ts
Machin
ery / E
lectric
al
Transp
ortati
on
6.5% 10.3% 10.0% 11.8%5.3% 2.2% 2.1% 0.7% 1.0% 1.1% 1.1% 0.3% 0.0% 0.0%
13.4% 3.9%
28.5% 25.0%28.5%
5.2%
17.0%9.0% 7.5% 7.9% 8.0%
3.9% 4.8%0.0%
0%0%
0% 0%0%
0%
0%
0% 0% 0% 0%0% 0%
0%
6%
0%
7% 13%
0%
0%
0%
0% 0% 0% 0%0% 0%
0%
Tariff Range
Average Duties Max Min Mod