saving lives and protecting infrastructure through ... elevation program (3dep) lidar 10 glacier...
TRANSCRIPT

+ 1 +
Kevin T. Gallagher Associate Director, Core Science Systems
April 6, 2017
Saving Lives and
Protecting
Infrastructure
Through Foundational
Mapping

+ 2 + 2
Mapping Saves Lives and Protects Infrastructure
■ Every year and across all regions in the United States, natural hazard events
threaten lives and livelihoods, resulting in deaths and billions of dollars in damage
■ Hazards research and response by USGS and other Federal, State, local and
Tribal agencies rely on foundational data
■ Geologic mapping
■ Topographic mapping
■ Elevation
■ Hydrography
By Underpinning Hazards Research and Response
Cri
tic
al Z
on
e
■ Examples
■ Earthquake
■ Volcano
■ Landslide
■ Tsunami
■ Flooding

+ 3 + 3 Consistent, National Foundational Data
Topographic mapping
National Hydrography
and Watershed Datasets
(NHD and WBD)
Intelligent network map of
surface water – current
annual benefits $538M
3D Elevation Program
(3DEP) High accuracy
3D elevation from lidar
(lower 49) or IfSAR
(Alaska) – Estimated
$13B annual benefits for
nationwide data
National Cooperative
Geologic Mapping
Program (NCGMP)
Detailed geologic maps
and 3D framework models
The National Map provides
3DEP, NHD, WBD and other
topographic information via
web visualization, services,
and downloadable data
Geologic mapping
National Geologic Map
Database a resource for
maps and information
about geology, natural
hazards, earth resources,
geophysics, paleontology,
marine geology, and more
Partnerships
The National Map is a collaborative effort among
the USGS and other Federal, State, local and
Tribal partners to improve and deliver topographic
information for the Nation
Partnerships
Over 20 years
of successful
cooperation
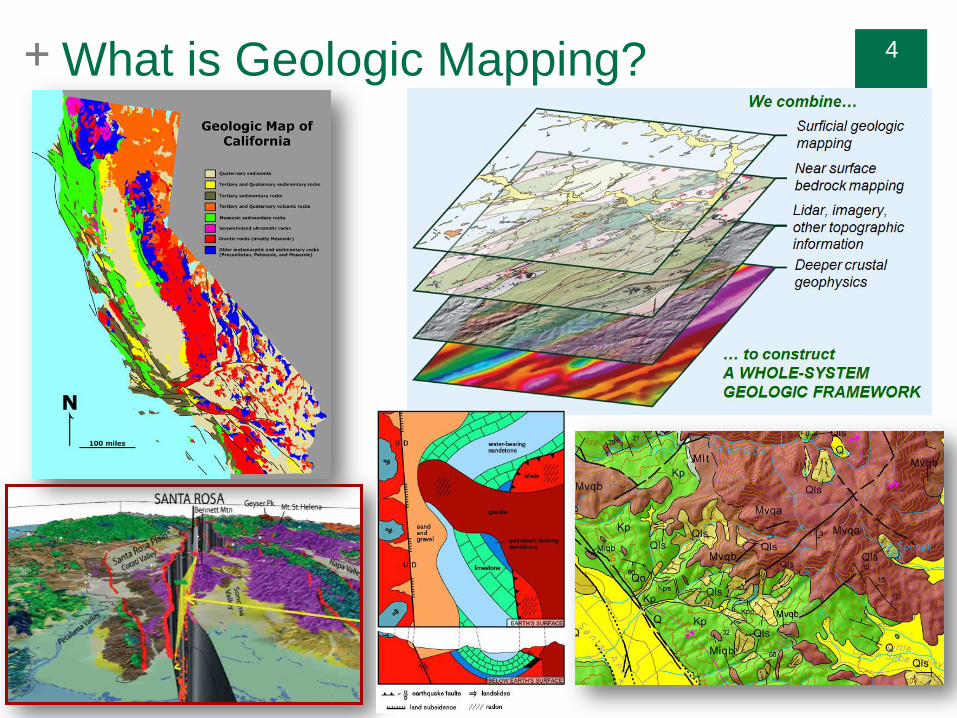
+ 4 + 4 What is Geologic Mapping?

+ 5 + 5
What is Lidar? Light Detection and
Ranging (lidar) provides
digital elevation (bare
earth) and 3D models

+ 6 + 6
What is Lidar?

+ 7 + 7
What is Lidar?

+ 8 + 8 NCGMP Collaboration To Understand the Central Virginia Seismic Zone with
Virginia Division of Geology and Mineral Resources
Louisa
County, VA
Washington
Monument
National Cathedral Mw5.8 earthquake
Aeromagnetic data help to identify
buried faults and rock structures
Did You Feel It?

+ 9 + 9
State-of-the-art 3D Geologic Maps
Characterize seismic hazards – San Francisco Bay Area
3D Map of Bedrock
of the northern
San Francisco Bay Area

+ 10 + 10 3D Elevation Program (3DEP) Lidar Glacier Peak Volcano, WA
■ Unraveling the volcano’s history through lidar-
guided geologic mapping of volcanic deposits that
are otherwise hidden by heavy forest cover and
inaccessible on steep terrain
■ Modeling the path of lahars that can travel
downstream to populated areas, planning for
escape routes
■ Numeric modeling of volcanic processes
■ Designing a new real-time monitoring network Aerial Photo
Elevation model from 3DEP lidar
used to improve monitoring Courtesy of D. Ramsey, USGS

+ 11 + 11
3DEP for Landslides Recognition, Hazard
Assessment, and Mitigation Support
Create accurate landslide
inventory and estimate
thickness and ages of deposits
Estimate the shape and activity
of landslides
Provide input data for models
used to identify conditions that
trigger landslides, and to
forecast their potential impacts
on people and infrastructure
Identify locations for safe
evacuation and staging in
response to landslide crises
Conservative annual benefits of
lidar for landslides is estimated
at $20.2 M
Oso, Washington Landslide
Red cross-hatched area marks the approximate extent of deposits from the 2014 Oso
landslide. Colored areas show older landslide deposits by their relative age: A,
youngest, to D, oldest. Modified from Haugerud (2014). Yellow arrow shows the
direction of material flow
Baum and others (2014) showed that compared to other technologies, using 3DEP data
identified 3 to 200 times the number of landslides in densely forested areas

+ 12 + 12
Topographic Mapping
■ Modeling identifies areas
where life loss is possible
from Alaska tsunamis
■ Analysis based on 3DEP
lidar and IfSAR, NHD,
land cover, roads,
structures, and
populations
■ Identified life-safety
concerns with local
tsunamis generated by
submarine landslides
■ Alaska State agencies
are using model to
continue local mapping
Tsunami evacuation modeling to save lives in Alaska
Landslide Tsunami Sources
Valdez (wave arrival = 2 min)
Tectonic Tsunami Sources
Cordova (wave arrival = 60 min)
Courtesy of N. Wood, USGS
+ 13 + 13
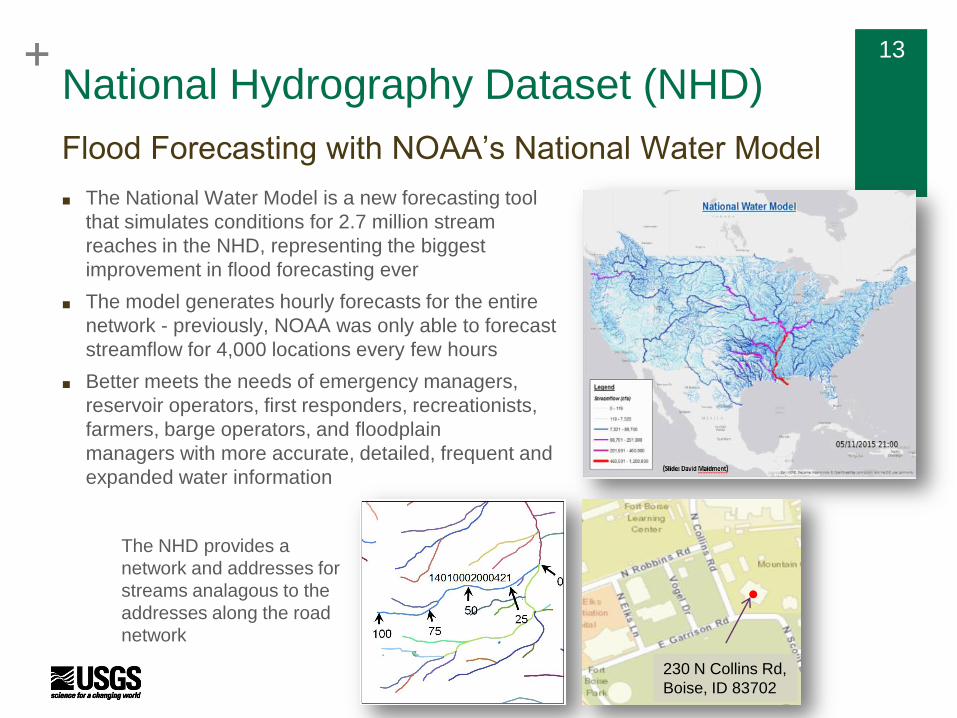
National Hydrography Dataset (NHD)
■ The National Water Model is a new forecasting tool
that simulates conditions for 2.7 million stream
reaches in the NHD, representing the biggest
improvement in flood forecasting ever
■ The model generates hourly forecasts for the entire
network - previously, NOAA was only able to forecast
streamflow for 4,000 locations every few hours
■ Better meets the needs of emergency managers,
reservoir operators, first responders, recreationists,
farmers, barge operators, and floodplain
managers with more accurate, detailed, frequent and
expanded water information
Flood Forecasting with NOAA’s National Water Model
The NHD provides a
network and addresses for
streams analagous to the
addresses along the road
network
230 N Collins Rd,
Boise, ID 83702

+ 14 + 14
3DEP and Flood Risk Management
■ Enabling the production of much higher quality
flood maps, including documentation studies
and Flood Insurance Rate Maps (FIRMS)
■ Managing dam and levee safety programs
reducing flood risks
■ Improving hydrologic modeling and flood
forecasting for emergency management
■ Improving State and local government flood risk
management and response
■ Improving regional and local government
emergency management and floodplain and
storm water management
■ Improving storm water facilities and dam design
■ Extracting building footprints and identifying the
finished floor elevation in order to quantify
potential damages based on flooding depths
■ Annual benefits from 3DEP to flood risk
management is $502M
Southeastern US
Building footprints
extracted from lidar in red
Courtesy of J. Dorman,
NC Department of Public
Safety, Floodplain
Mapping Program
Lidar aids hydraulic modeling to determine flood-
inundation on the Saluda River, near Greenville, SC

+ 15
NGCMP Geologic Mapping Flood Risk Planning and Mitigation in Louisiana
In the aftermath of the 2016 flood event, a detailed geology layer will be
compiled and analyzed to aid the reassessment of flooding risk
Provides basic geologic data to planners in Baton Rouge and Lafayette
Improves the planning and siting for waste-disposal and other industrial
facilities and structures in relation to two large aquifer systems underlying south
Louisiana, the Southern Hills (Baton Rouge) and the Chicot (Lafayette)
From LA 2017 Statemap Proposal
Proposed mapping in relation to areas of
flooding (Sergent et al., 2016) Source:
Stephenson Disaster Management Institute
(Louisiana State University) and FEMA

+ 16 + 16
Thank You
National Cooperative Geologic
Mapping Program ncgmp.usgs.gov
The National Map nationalmap.gov