savills plcir.savills.com/~/media/files/s/savills-ir-v2/annual reports/company... · business...
TRANSCRIPT
Savills plc
Results for the six months ended 30th June 2017
10 August 2017

Disclaimer: Forward-looking statements
2
These slides contain certain forward-looking statements including the Group’s financial condition,
results of operations and business, and management’s strategy, plans and objectives for the Group.
These statements are not guarantees of future performance and are subject to risks, uncertainties and
other factors, some of which are beyond the Group’s control, are difficult to predict and could cause
actual results to differ materially from those expressed or implied or forecast in the forward-looking
statements. These factors include, but are not limited to, the fact that the Group operates in a highly
competitive environment. All forward-looking statements in these slides are based on information known
to the Group on the date hereof. The Group undertakes no obligation publically to update or revise any
forward-looking statements, whether as a result of new information, future events or otherwise.

Results
1 Introduction, Highlights & Business Development 2 Financial Review 3 Management Focus 4 Summary and Outlook
3

Highlights
4
Performance overview Drivers
Group Revenue£714.4m
+14.7% (cc 7.1%)
Group UPBT £48.1m
+12.4% (cc 5.1%)
Transaction advisory revenues up 15%,
reflecting strong performance throughout
Asia, Continental Europe and UK
Commercial market.
Property Management revenue up 13%,
Consultancy revenue up 15%.
Continued expansion in Europe and
North America, through bolt-on
acquisitions and recruitment.
Savills IM revenue growth of 22% and
underlying profits up 69%.
Group UEPS 25.7p
+17.9%
Net Cash £1.4m
(2016 H1: £34.7m)
Dividend 4.65p
+5.7%
cc = constant currency

Ten Year H1 Revenues
5
-
100
200
300
400
500
600
700
800
2008 2009 2010 2011 2012 2013 2014 2015 2016 2017
£m
Transactional "Less-Transactional"
44%
56%
Total Revenue
£399.0m
Total Revenue
£714.4m
63%
37%
Less-Transactional
Revenue £402.3m
Total Revenue
£278.1m
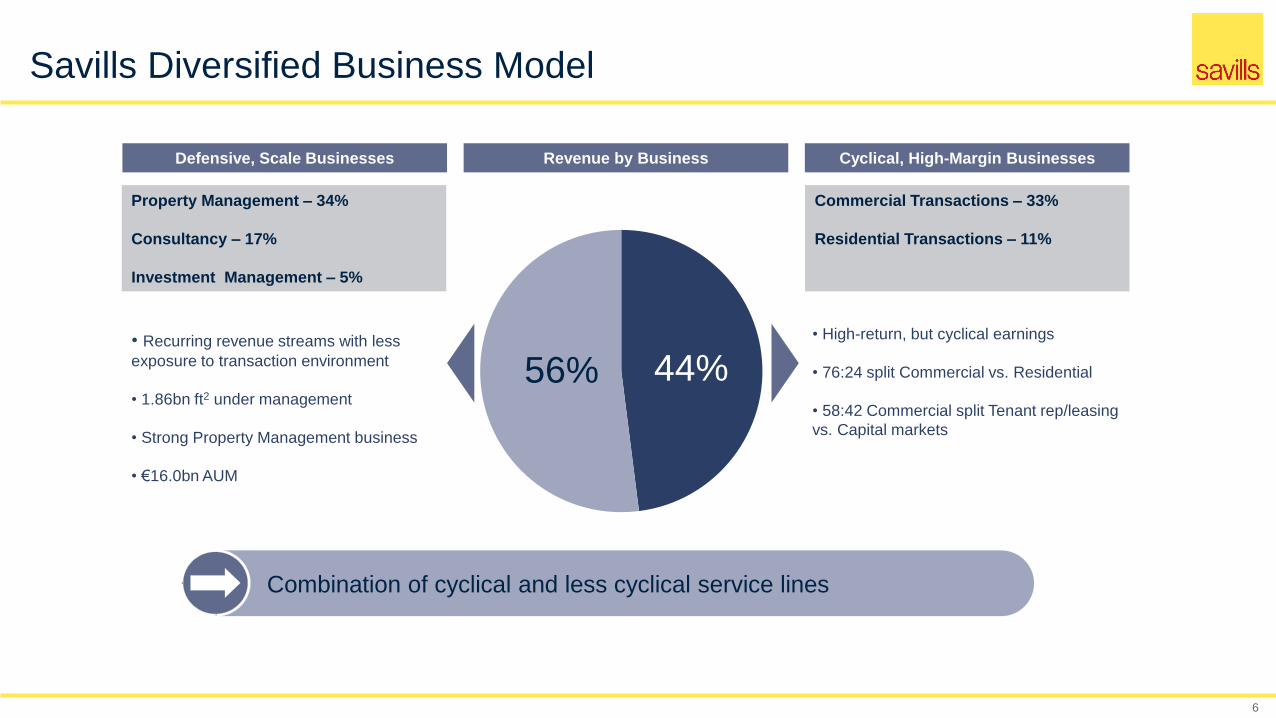
Savills Diversified Business Model
6
Defensive, Scale Businesses Revenue by Business Cyclical, High-Margin Businesses
Property Management – 34%
Consultancy – 17%
Investment Management – 5%
Commercial Transactions – 33%
Residential Transactions – 11%
• Recurring revenue streams with less
exposure to transaction environment
• 1.86bn ft2 under management
• Strong Property Management business
• €16.0bn AUM
• High-return, but cyclical earnings
• 76:24 split Commercial vs. Residential
• 58:42 Commercial split Tenant rep/leasing
vs. Capital markets
44%56%
Combination of cyclical and less cyclical service lines

Broad Geographic Spread
7
Over 31,000 employees in 700 offices in more than 60 countries
580Employees
5,442Employees
137Offices
1,118Employees
38Offices
26,501Employees
63Offices
Revenue
£103.6m
(14% of Total)
743Employees
30Offices
*Staff numbers –
weighted average
for 2017 H1
Revenue
£275.3m
(39% of Total)
Revenue
£72.0m
(10% of Total)
Revenue
£263.5m
(37% of Total)
Over 33,000* employees and over 600 offices in more than 60 countries

Recent acquisitions in Europe
8
Larry Smith (Italy)
Annual Revenue circa €7m
80 staff
Aguirre Newman (Spain / Portugal)
Annual Revenue circa €69m
(net €40m)
400 staff
Shows current offices of Aguirre Newman and Larry Smith. Savills has existing offices in Madrid, Barcelona and Milan.

Financial Review
9

Summary Underlying Result
10
6 months ended 30 June (£m) 2017 2016 % chg
Revenue 714.4 622.7 +14.7%
Underlying PBT 48.1 42.8 +12.4%
Underlying PBT margin 6.7% 6.9% (0.2)% pts
Underlying basic earnings per share 25.7p 21.8p +17.9%
Dividend per share 4.65p 4.40p +5.7%
Net cash 1.4 34.7 n/a
Net assets 382.8 346.7 10.4%

Revenue and underlying PBT by business
11
271.1
219.0
105.1
27.5
312.1
246.6
121.0
33.6
0
50
100
150
200
250
300
350
2016
2017
+13%
+15%
+22%
Revenue
23.3
10.28.2
3.9
24.6
10.2 10.2
6.6
0
5
10
15
20
25
30
0%+24%
+69%
Transaction
Advisory
Property
Management Consultancy
Investment
Management
UPBT
+15%
+6%
Margin 8.6% 7.9% 4.7% 4.1% 7.8% 8.4% 14.2% 19.6%
£m
The figures in these charts
exclude revenues of £1.1m
and other net costs of £3.5m
(2016-H1 £2.8m) not
allocated to the operating
activities of the group’s
business segments
Combined revenue and UPBT growth of 13% and 11% respectively

Revenue and underlying PBT by region
12
255.8
209.4
94.4
63.1
274.2263.5
103.6
72.0
0
50
100
150
200
250
300
2016
2017
Revenue
UK Asia Pacific North America
UPBT
+7%
Continental Europe
24.8
13.1
7.8
(0.1)
25.3
21.8
3.01.5
-5
0
5
10
15
20
25
30+2%
+26%
+10%
+14%
+66%
n/a
(62)%
£m
Margin 9.7% 9.2% 6.3% 8.3% 8.3% 2.9% (0.2)% 2.1%
The figures in these charts
exclude revenues of £1.1m
and other net costs of £3.5m
(2016-H1 £2.8m) not
allocated to the operating
activities of the group’s
business segments

Cashflow performance
13
188
1
48
1
4
79
70
1417
33
1450
50
100
150
200
250
Net cash at31-Dec-2016
UPBT Non-cashitems
Workingcapital
Acquisitionspend -
current &deferred
Capex Cash flowsfrom
investments
Purchase ofEBT shares
Dividendspaid
Tax Foreignexchange
Other Net cash at30-Jun-2017
£m
Cash used in operations of £35m
At 30 June 2017 - Net cash of £1.4m
At 30 June 2016 - Net cash of £34.7m

Commercial Transaction Advisory
14
2017 Revenue £237.0m (+20%) 2017 UPBT £16.3m (+26%)
North America subdued capital markets and reduction in leasing activity in Chicago, New York and
Washington DC. Capital Markets and other team hires increased cost base short term.
Europe revenue growth across the region, in particular France and Germany. New start-ups in Czech Republic
and Luxembourg impacting cost base.
UK significant growth in Investment and Development revenue.
Asia Pacific strong growth in revenues in Hong Kong, Japan and Australia. Increasing controls over export of
Chinese capital
67.6
39.4
26.4
103.6
-
20
40
60
80
100
120
Asia Pacific UK Europe North America
Growth +39% +23% +18% +10%
9.7
4.5
(0.9)
3.0
(2)
-
2
4
6
8
10
12
Asia Pacific UK Europe North America
Growth +169% +67% n/a (62)%

Residential Transaction Advisory
15
2017 Revenue £75.1m (+2%) 2017 UPBT £8.3m (-20%)
UK second-hand sales broadly flat despite declining market volumes. Some currency underpin for international
buyers
UK new development sales reduced reflecting fewer exchanges and lower average unit values; but good
pipeline of reservations.
Asia Pacific strong growth in Hong Kong primary and secondary markets; further cooling measures in Hong
Kong
20.1
55.0
0
10
20
30
40
50
60
Asia Pacific UK
Growth +23% -4%
2.9
5.4
-
1
2
3
4
5
6
Asia Pacific UK
Growth -3% -27%

Property Management
16
2017 Revenue £246.6m (+13%) 2017 UPBT £10.2m (2016 H1: £10.2m)
Asia Pacific revenue growth in Hong Kong, China and Korea.
UK strong revenue growth in Residential lettings and Commercial property management.
Europe revenue growth in the Netherlands and Ireland.
150.4
76.2
20.0
-
20
40
60
80
100
120
140
160
Asia Pacific UK Europe
Growth +18% +3% +16%
6.2
5.0
(1.0)(2)
(1)
-
1
2
3
4
5
6
7
Asia Pacific UK Europe
Growth (2)% +2% n/a

Consultancy
17
2017 Revenue £121.0m (+15%) 2017 UPBT £10.2m (+24%)
UK strong performances in building & project consultancy and hotels & leisure.
Asia Pacific valuation growth in Australia, China and Hong Kong.
Europe lower revenues in Germany and the Netherlands offsetting growth elsewhere in Europe.
91.6
22.1
7.3
0
10
20
30
40
50
60
70
80
90
100
UK Asia Pacific Europe
Growth +13% +35% -4%
8.0
2.6
-0.4
-1.0
0.0
1.0
2.0
3.0
4.0
5.0
6.0
7.0
8.0
9.0
UK Asia Pacific Europe
Growth +11% +1,200% n/a

Investment Management
18
2017 Revenue £33.6m (+22%) 2017 UPBT £6.6m (+69%)
Positive impact of Transaction fees on Fund disposals; but pure management fees still represented 67%
of revenue
Capital raising slightly ahead of H1 2016 at €0.8bn and €3.0bn transacted (H1 2016: €1.0bn)
Assets under management reduced through disposals to €16.0bn (2016-H1: €17.1bn), slightly higher
than forecast at this stage of the programme.
12.0
18.3
3.3
-
2
4
6
8
10
12
14
16
18
20
UK Europe Asia Pacific
Growth
2.4
3.8
0.4
-
0.5
1.0
1.5
2.0
2.5
3.0
3.5
4.0
UK Europe Asia Pacific
Growth+16%+3% +192%-8%n/a n/a

Management Progress
19

Integrate new acquisitions: Aguirre Newman and Larry Smith
Develop the New York Capital Markets team
20
Continue to invest and grow Property Management and Consultancy
Expand Savills Investment Management’s platform
Management Focus
Review new markets – India

A strong H1 despite some uncertain markets, but with positive currency effect
Results again demonstrate the breadth and depth of the business, both by geography and business sector
21
The Board’s expectations for the full year remain unchanged
Summary and Outlook

Connecting people and
property since 1855