saver plus evaluation - anz
TRANSCRIPT

Saver Plus EvaluationDECEMBER 2009
Phase III: 2006 - 2009 Summary Report Roslyn Russell, Lauren Wall, Minh Phuong Doan
School of Economics, Finance and Marketing, RMIT University
Robert Brooks Department of Econometrics and Business Statistics, Monash University

Foreword
ANZ is pleased to release this summary report of the evaluation of Saver Plus from 2006-2009 (Phase Three of the program).
During this period Saver Plus evolved from a ‘pilot’ program delivered from four sites, to an established, national program available in 21 sites across Australia. We are delighted that the early positive program outcomes have been retained with this significant increase in scale. Importantly, the program has continued to increase the levels of financial and social inclusion, and contribute to the social capital of the communities in which it operates.
ANZ and the Brotherhood of St Laurence are committed to a continuous improvement approach for Saver Plus, and for the first time this report captures the characteristics of participants who leave the program prior to completion. This will allow us to further refine the model, better supporting each participant and hopefully lead to even higher completion rates in the future.
We would like to thank and acknowledge our longstanding community partners, The Brotherhood of St Laurence, Berry Street, the Smith Family and The Benevolent Society for their commitment to the program since its inception. Each partner has made a significant ongoing investment, and the success of Saver Plus is a testament to the unique skills and expertise that each organisation brings to the partnership. We would also like to acknowledge the support of the Victorian Government for the important funding contribution they made during this phase.
The next phase of Saver Plus will be an exciting one, as the Federal Government, through the Department for Families, Housing, Community Services and Indigenous Affairs (FaHCSIA) has recently committed significant funding to assist the partners to expand the program, making it available in up to 60 communities across Australia.
The body of evaluation work undertaken by Associate Professor Roslyn Russell and her team at RMIT was drawn on extensively for the expansion of Saver Plus in Phase Three. We anticipate that the findings of this new report will similarly contribute to the development of this, and other similar programs, in the future.
Michelle Commandeur Head of Community Relations ANZ

Phase III: 2006 - 2009 Summary Report Roslyn Russell, Lauren Wall, Minh Phuong Doan
School of Economics, Finance and Marketing, RMIT University
Robert Brooks Department of Econometrics and Business Statistics, Monash University

Foreword 1Contents 3List of Tables 4List of Figures 4Summary 51. Introduction 72. Program Design 8 Matched savings 8
Organisational support 8
Financial education 9
Account structure 10
3. Saver Plus Community Partners 114. Methodology 125. Recruitment Sources 136. Saver Plus Participants 14 Demographics 14
Motivations for Joining Saver Plus 15
7. Saving and Money Management Behaviour Prior to Saver Plus 16 Past Saving Patterns 16
Spending and Planning for the Future 17
Banking and Payment Methods 18
Level of Use of Financial Products 19
Cashflow Problems and Financial hardship 20
Participants and Debt 20
Credit Card use 21
Attitudes towards Credit Cards 21
Management and use of Credit Cards 22
Understanding Credit Cards 22
8. General Money Management Knowledge and Skills 23 Shopping for Products and Keeping Track of Expenses 23
General Attitudes towards Finances 23
Knowledge of Fees and Charges 23
9. Saving During Saver Plus 24 Overall success of Saver Plus 24
Meeting the Savings Goal 24
Items Saved For 25
Overall Debt Level during Saver Plus 25
Saving Methods 27
Use of Credit during Saver Plus 28
Monthly Deposits 29
Average Time in Program 30
Savings Levels 30
Income Levels throughout the Program 30
10. The Vietnamese Experience in Saver Plus 3111. Banking Activity 32 Overall Deposits and Withdrawals 32
Patterns of Saving Behaviour 32
12. Impact of Financial Education 3313. Encouraging Social Inclusion and Building Social Capital 3714. Satisfaction and Benefit Rating of the Saver Plus Program 3915. Post-Saver Plus Savings Behaviour 4116. Program Drop-Outs 42 Main Reasons for Dropping Out 43
17. Conclusion 4418. References 45
Contents

List of Tables
Table 1: Main motivation to join the program 15
Table 2: Payment and banking methods 18
Table 3: Financial products used 19
Table 4: Relationship between goal achievement and overall debt 26
Table 5: Banking methods used for saving 27
Table 6: Changes in levels of knowledge of fees and charges 35
Table 7: Changes in levels of usage of financial products 36
Table 8: Impacts on social inclusion 38
Table 9: Rating of overall experience 39
Table 10: Comments about experiences in the Saver Plus program 40
Table 11: Planned saving behaviour post-Saver Plus 41
Table 12: Reasons for dropping out of Saver Plus 43
List of Figures
Figure 1: Proportions of recruitment sources 13
Figure 2: Overall success of Saver Plus 24
Figure 3: Overall proportion of completed participants who met their saving goal 24
Figure 4: Variability in individual amounts deposited during Saver Plus 29
3–4

Summary
Saver Plus is a financial literacy and matched savings program developed by ANZ and the Brotherhood of St Laurence. It aims to assist families and individuals on low incomes to develop long term saving habits and reach a savings goal. Participants in the program save for education costs either for themselves or their children. During this phase of the program, Saver Plus offered an incentive of matched savings of $1:1 (up to a maximum amount of $1,000) and financial education and support through the community organisation.
The program is delivered through partnerships with Berry Street, The Benevolent Society and The Smith Family, and was supported by the Victorian Department of Planning and Community Development.
This report provides a summary of the final evaluation results for Phase Three of the program, encompassing the period 1 April 2006 through to 30 June 2009. During this evaluation period, the program was delivered from 21 sites across Victoria, New South Wales, Australian Capital Territory, Queensland and Tasmania. During this period there were 4,110 participants who commenced Saver Plus; 2,668 who completed the program; 558 who dropped out without completing; and 884 still enrolled in the program as at 30 June 2009.
The evaluation confirms the success of Saver Plus in assisting participants in achieving a savings goal. From all participants who commenced Saver Plus during this period, 82.7% successfully completed and received matched funds. ANZ has paid a total of $2,760,623 in matched savings.
In addition to positive financial benefits for participants, the evaluation also showed that Saver Plus can encourage the development of social capital within communities and facilitate greater levels of social inclusion.
A key design feature of Saver Plus is the cross-sector partnership delivery model. This has brought benefits for participants and the communities in which the program is delivered. By strengthening relationships between sectors, organisations and participants, Saver Plus has facilitated the development of social capital within communities. The resources from each of the partners combine to address financial exclusion and encourage social inclusion. The participants have consistently reported a broader set of benefits that include increased levels of self-esteem and confidence, reduced stress levels, greater propensity to plan for the future, feelings of greater control over their lives, positive intergenerational effects, and increased social networks.
Following is a summary of the key findings:
Level of Satisfaction with Saver Plus
Overall, nearly all the participants (99.1%) reported a positive experience in the Saver Plus program.
Success Rates
Overall, from the people who commenced the program, 82.7% completed and received matched funds.
During this evaluation period, 95.9% of participants who had completed the program met (56.4%) or exceeded their savings goal (39.5%).
Around 80% of participants believe they can continue to save the same amount or more after completing the program.
Education Products Saved for
Nearly 80% (79.1%) of participants saved for their children’s education and 20.8% saved for their own education costs.
The most commonly saved for items were computers or computer-related equipment followed by general education costs such as uniforms, textbooks or school fees.
Key Participant Characteristics
The majority of participants were female (86.4%) with an average age of 37 years. Most of the participants were sole parents (54.4%) or a couple with children (28.7%). There were 16% of participants who had no children.
The average family income (after tax) was $675.32 per week although the average equivalised income was $387.73 per week.
The most common level of education reached was either a TAFE qualification (23%) or Year 12 (23%).
Over half the participants had experienced a cashflow problem in the 12 months prior to joining Saver Plus.
There were 26% of participants who spent all their income as they received it and about 42% had problems setting aside money for major financial outlays.

5–6
Savings Behaviour during Saver Plus
A total of $3,057,186 was deposited by participants in their ANZ Progress Saver Accounts from 1 April 2006 to 30 June 2009.
The average amount of time spent in the program was 11.8 months.
The most common method of saving was to make cash deposits in person at the bank (40%), followed by transferring money from another account (30%).
The average monthly deposit amount by completed participants was $154 and the median deposit per month by all participants was approximately $97.
The majority of participants saved more than their goal each month (68%).
Nearly 20% of participants saved the same as their goal and about 11% saved less than their goal.
Debt Levels
There were 84.5% of participants who met or exceeded their goal and were also able to decrease their levels of debt during the program. Those who did not meet their savings goal were more likely to have their debt stay the same (35.2%) or decrease (40.7%).
Impact of Financial Education
‘Saving and Spending’ was the most useful financial education module for participants with 94% of participants finding this topic to be useful or extremely useful.
Participants reported significant increases in knowledge of fees and charges relating to all financial products measured.
Participants found the workshops to be enjoyable, and were useful in facilitating knowledge sharing and support.
Encouraging Social Inclusion and Building Social Capital
Saver Plus has continued to build social capital and encourage social inclusion. The cross-sector partnership delivery model is a key factor in building social capital. The range of resources brought together by the partners have assisted Saver Plus participants in achieving their goals, strengthened relationships within communities and developed networks that participants can draw upon post-Saver Plus.
Participants that Dropped Out
The proportion of Saver Plus participants who did not complete the program was 17.3%.
There is a strong correlation between the Consumer Sentiment Index and the drop-out rate of participants in the program during the period from April 2006 to June 2009. On average, a 1% decrease in CSI will lead to an increase of 0.77% in the number of drop-outs.
The main differences between participants who dropped out of the program and those who completed were financial. Participants who dropped out were more likely to have had: slightly lower levels of income, less savings prior to joining Saver Plus, more difficulty in managing credit card debt, and more cashflow problems.
1. Introduction
‘My son has received a scholarship to a top Melbourne school and I really believe that it was because of the Saver Plus program. Without it I could have never afforded a computer for him which he really needed and I am just so grateful.’ Saver Plus participant
This document presents a summary of the final evaluation results of the Saver Plus program (Phase Three), for the period 1 April 2006 to 30 June 20091. Saver Plus is a financial literacy and matched savings program developed by ANZ and the Brotherhood of St Laurence. It aims to assist families and individuals on low incomes to develop long term saving habits and reach a savings goal. During this phase of the program, Saver Plus offered an incentive of matched savings of $1:1 (up to a maximum amount of $1,000) and financial education and support through the community organisation.
The program is delivered through partnerships with Berry Street, The Benevolent Society and The Smith Family, and was supported by the Victorian Department of Planning and Community Development.
Saver Plus began in 2003 and was piloted through two savings periods, Phase One (2003-2004) in three sites and Phase Two (2004-2005) in four sites. A total of 676 participants successfully completed the Saver Plus pilot program, saving an average of $1,214 each. The evaluation of the pilot (including Phase One and Two) showed the program has been very successful with approximately 96% of participants reaching their goal (Russell, Brooks, Nair and Fredline, 2005; Russell, Mihajilo, Nair and Brooks, 2006). The program was expanded to Phase Three in 2006, during which time it covered 21 sites across Victoria, New South Wales, Queensland, ACT and Tasmania.
Chant Link & Associates also undertook research during this period which has contributed to our understanding of the success of Saver Plus. This research explored the role of both traditional economic and behavioural economic theories in explaining the savings behaviour of Saver Plus participants, and how this knowledge can be applied to other programs which seek to affect long term behaviour change (Chant Link 2009). Behavioural frameworks can provide insight into why human behaviour does not always follow economically rational patterns.
This report provides a summary of the final results for Phase Three including: an analysis of the demographics of Saver Plus participants, their saving behaviour prior to Saver Plus, saving patterns during Saver Plus, levels of success for participants who have completed the program, and an analysis of characteristics of participants who do not complete the program.
1 The full report including detailed site analysis can be found on www.anz.com/saverplus

7–8
2. Program Design
Saver Plus was offered to low income households in 21 sites across Victoria, New South Wales, Australian Capital Territory, Queensland and Tasmania. The program is designed to assist participants to achieve a savings goal, develop a savings habit and save for education costs for themselves or their children.
To be eligible to join Saver Plus, a person must:
be an adult, 18 years or over, either:
with a child/children attending primary or secondary school OR
attending or returning to vocational education;
have a current Health Care Card or Pensioner Concession Card;
have a regular income from paid employment.
These criteria have been broadened slightly from the pilot program to include individuals saving for their own education.
Participants can choose a saving timeframe between 10 and 18 months to suit their individual circumstances. This is also a variation of the pilot program in which all participants completed Saver Plus between 10 and 12 months.
Matched Savings
For this period, Saver Plus offered, those who successfully complete the program a matched savings rate of $1:1, capped at $1,000. Participants, upon enrolling in the program, nominate a savings goal based on an assessment of their financial situation and a set amount that can be saved regularly in order to achieve their goal.
••
••
•
Organisational Support
Saver Plus has been supported through a cross-sector partnership between ANZ, Department of Planning and Community Development (DPCD) and community organisations. Each partner offers valuable resources critical to the success of the program. Through 2006 to 2009, ANZ provided financial resources for 14 sites, DPCD supported six sites across Victoria, and in 2009, Jewish Care supported the program for one site (through community donations).
ANZ provides the matching funds for all 21 sites and together with the Brotherhood of St Laurence, provides management and central systems support such as a program database, media and communications, and policy advice.
Saver Plus is delivered through community organisations, with each one having a dedicated Saver Plus project worker to deliver the program at each Saver Plus location. The Saver Plus project worker undertakes recruitment, enrolment, facilitation of the financial education component, disbursement of matched funds, and also supports and monitors the progress of the participants.

Financial Education
Participants are required to complete a 10 hour financial education course delivered by the community organisation. The financial education component uses the content from the MoneyMinded2program. The workshops are usually two hours each and are spread over a period of five weeks, although this does vary from site to site. Most sites use a combination of day and night classes to suit the needs of the participants. Some sites also offer Saturday classes. Project workers are able to select content from the range of modules to suit the needs of the participants. Following is a list of the MoneyMinded modules used as the basis for the financial education program in Saver Plus.
2 MoneyMinded is an unbiased financial education program developed by ANZ for use in the community by trained facilitators. The program is aimed at helping people make informed decisions about the use and management of their money.
Planning and Saving
Understanding Paperwork
Dealing with Debt Getting Started Credit Providers Rights and
Responsibilities
Goals Types of paperwork Debt Opening an
accountCredit and credit cards Golden rules
Saving and Spending Bills, Bills, Bills Recovery plan Introduction to
everyday banking Loans The hard sell
Money Planning - When paying is difficult
Different ways to pay - Your right to
complain

9–10
Account Structure
The bank product used for the Saver Plus program is the ANZ Progress Saver Account. The Progress Saver Account is a mainstream banking account which allows all participants to maintain this account beyond the program. The account features include:
unlimited number of deposits – with a bonus tiered interest rate calculated daily and paid monthly when one deposit of $10 or more is made with no withdrawals per month;
flexible banking – allows phone banking, ATM, e-banking and branch access. The account also allows direct deposits from salary or pension income and regular transfers from other accounts;
no monthly account service fee;
minimum initial and ongoing balance is $0 for Saver Plus participants;
allows for one free withdrawal per month and free ANZ internet banking transactions; and
a savings graph on each statement to help account holder track savings progress.
•
•
••
•
•

3. Saver Plus Community Partners
There were nine community organisations delivering Saver Plus across 21 sites during this evaluation period. These organisations are involved in a wide range of community services, including child and family welfare, employment, housing and health. The delivery organisations involved were:
Ballarat Group Training (http://www.bgt.org.au) delivered Saver Plus in the Ballarat region under management by the Brotherhood of St Laurence, with the support of Department of Planning and Community Development (DPCD).
Berry Street (http://www.berrystreet.org.au) is one of the founding implementation partners of Saver Plus. Berry Street operated, sites in Shepparton, La Trobe, Greater Dandenong, South West Gippsland, and Eltham and Heidelberg, which are all located in Victoria.
Bethany Community Support (http://www.bethany.org.au) delivered Saver Plus in the Geelong region under management by the BSL, with the support of DPCD.
The Brotherhood of St Laurence (BSL) (http://www.bsl.org.au) developed Saver Plus in partnership with ANZ in 2002. During Phase 3, BSL had three sites which are co-supported by DPCD – Frankston, Craigieburn and Fitzroy. BSL also managed the other DPCD funded sites of Greater Geelong including Colac, Ballarat and Mildura.
Colac Area Health (http://www.colacareahealth.com.au) delivered Saver Plus in Colac under management by BSL, with the support of DPCD.
Jewish Care Victoria (http://www.jewishcare.org.au) began delivered Saver Plus in 2009 and service the Jewish community in Victoria with support from donors within the Jewish Community.
Loddon Mallee Housing Services (www.lmh.com.au) delivered Saver Plus in the Mildura region under management by BSL, with the support of DPCD.
The Benevolent Society (http://www.bensoc.org.au) was one of the original implementation partners of Saver Plus and conducted the first two savings periods from their office in Campbelltown. The Benevolent Society serviced the Macarthur and Northern Illawarra region; as well as sites in Inner-West Sydney and South-East Sydney.
The Smith Family (http://www.thesmithfamily.com.au) joined the Saver Plus program in the second savings period of the pilot and offered the program through their Brisbane office to South East Queensland. The Smith Family also established five new sites in Phase Three – Canberra, Central Coast, Newcastle, Tasmania and Fairfield in Sydney.

11–12
4. Methodology
This evaluation of Saver Plus had the following aims:
to assess the levels of participant success in achieving a savings goal;
to assess the levels of change in financial literacy and money management behaviour; and
to identify benefits and impacts from program participation.
The techniques used in the evaluation are both quantitative and qualitative. The evaluation captures participant demographic information, pre-program saving and money management behaviour, saving behaviour during the program, success levels in meeting savings goals, benefits and indirect effects from program participation, and participants’ overall experiences in the program.
The evaluation was comprised of the following steps:
1. Participants who agreed to participate in the research completed a questionnaire at the time of joining the program. This questionnaire captured demographics, prior saving behaviour, credit card use and levels of involvement in the community.
2. Prior to undertaking the financial education workshops, the participants complete a second questionnaire to capture baseline data on their levels of financial knowledge and money management skills before completing the financial education.
3. At the completion of the program, participants completed a final questionnaire giving them the opportunity to comment on their experience in the program, levels of success in achieving their savings goal, reported changes in money management knowledge and skills, reported benefits gained from the program and factors that enabled or inhibited their saving efforts.
•
•
•
Focus groups were conducted in 13 sites across 2008 and 2009. Participants who had completed the program for a period of at least three months were randomly chosen to participate in the focus groups. The focus groups aimed to capture richer data about the participants’ experiences in the program, impacts on their lives and post-program money management changes.
This report is based on analysis of survey responses collected from 2,802 commencing participants and 1,090 completed participants. Focus groups included a total of 114 participants across 13 sites.
Bank data: The evaluation also utilises participant banking data to provide analysis of savings deposit levels and patterns. The bank data analysed in this report includes all participants involved in the program.
Site reports: Monthly site reports produced by each delivering organisation are used to capture recruitment activity and numbers of participant drop-outs.

5. Recruitment Sources
‘I was quite sceptical at first. I just thought it was too good to be true, but I was referred from my school principal who personally rang and said this is wonderful, get out there and spread the word. So I think there were about seven or eight from our school that signed up and we all still continue to tell everyone we know how good it is.’ Saver Plus participant
Participants were recruited from a range of sources. The recruitment of participants is a significant part of the workload of the project worker, especially when new sites commence operating. As time passes, word-of-mouth and the reputation of the Saver Plus brand in the community helps to ease the recruitment efforts. An effective media and communications strategy has also assisted in creating awareness of Saver Plus in the delivery regions. Recruitment is helped through building and maintaining relationships with schools and community organisations in the local community.
Interviews with project workers have revealed that building the profile of Saver Plus in their communities has led to other development opportunities for the community organisation.
Through initiating Saver Plus, and from the relationships that have been formed to market and promote Saver Plus, a positive feedback cycle has developed, bringing wider benefits to the organisation and the community.
Figure 1 shows that schools and word-of-mouth continue to be the most common sources of referrals, followed by media and other agencies.
‘It’s now got to the point where word-of-mouth has continually been the major source of referral, which means, obviously people have done the program and are going out telling friends or family which is fantastic.’ Project worker
In terms of recruiting, the Saver Plus program experienced similar challenges to that of international matched savings programs, confirming that a range of marketing strategies are needed to recruit participants, and that some sources prove to be more effective than others (Kingwell et al., 2005).
Figure 1: Proportions of recruitment sources
0
5
10
15
20
25
30
35
Ow
n A
genc
y
AN
Z
Empl
oyer
Indi
geno
usO
rgan
isat
ions
Oth
er A
gnec
y
Wor
d of
Mou
th
Med
ia
Scho
ol
Oth
erSa
ver P
lus
Site
Oth
er

13–14
6. Saver Plus Participants
The program during this evaluation period attracted 4,110 participants. This section provides an overview of the demographic data of a sample of 2,802 Saver Plus participants. The eligibility criteria around income and a restricted savings goal result in a relatively homogeneous group of participants, although there are differences across sites in terms of some participant characteristics (see www.anz.com/saverplus for full details).
Demographics
Although Saver Plus is available to males and females, it consistently attracts more female participants than males. The broadening of the eligibility criteria to include individuals who want to save for their own education attracted more male participants. In this evaluation period 86.4% of total participants were female whereas in the previous pilot periods the average proportion of females was 92% in Phase 1 and 94% in Phase 2.
The average age of participants was approximately 37 years. Overall, only 7% of participants were under the age of 20.
In terms of household structure, the majority of participants were sole parents (54.4%) or a couple with children (28.7%). Participants had on average 2 children with an average age of nearly 10 years.
Overall, the majority of participants (75%) were born in Australia with 88.3% speaking English as their main language at home. There was only a very small proportion (2.1%) of Indigenous Australians or Torres Strait Islanders enrolled in the program.
In terms of the highest level of education reached by participants, 26.4% hold a TAFE qualification; 23.3% of participants have completed Year 12; 19.6% reached Year 10; and 19.4% hold a university qualification.
To join Saver Plus, an individual must have some form of paid employment. The highest proportion of participants were employed part-time (44.4%), followed by casual employment (38.1%). Participants’ partners were significantly more likely to have full-time employment (60.1%).
The average family income (after tax) was $675.32 per week. The average weekly equivalised household income was calculated using the equivalence scales adopted by the Australian Bureau of Statistics (ABS, 2005 in its analysis of household incomes. These scales weight the first adult in the household as 1, subsequent adult as 0.5, children aged 15 years and over as 0.5, and children under 15 as 0.3. The overall average equivalised household income was $387.73.
Approximately 59.7% of participants earned most of their income from paid employment and the remainder (40.3%) of participants relied on other (predominantly government benefit) income sources. There were 49.1% of participants receiving the sole parenting payment.

Motivations for Joining Saver Plus
‘I thought the program was a marvellous idea. I was attracted by the reward system knowing I have two children and was single parenting, and my youngest one was going to start high school so I knew that it would be a big expense of over $1,000 to get the books and uniforms and everything. And, I really liked the idea of challenging myself to improve my management of money, which you know, at times in my life has been quite good. But, since becoming a single parent and a lot of things falling apart you become very poor and my self-esteem had become very poor also, and saving money got put on the backburner.’ Saver Plus participant
Unsurprisingly, the most common motivation for people joining Saver Plus was for the opportunity to have their savings matched at a rate of $1:1. Three quarters of the participants reported they joined for this reason.
The next most common reason was to receive financial education (12.7%). This figure has increased substantially from Phase Two, in which only around 4% of participants nominated this reason as their main motivation to join Saver Plus. Perhaps experiencing tougher financial circumstances has highlighted the need for more effective money management tools.
Participants choose a goal of what to save for when they join Saver Plus. The matched funds are spent on an educational product or service for either the participant or their children. Similar to Phase One and Two, computers, laptops and computer accessories were the most frequently purchased items. Other commonly purchased items were schoolbooks, uniforms, music instruments, paying for school fees, school camps and excursions. The majority of participants aim to save for their child or children’s education (79.1%).
Table 1: Main motivation to join the program
N %
The opportunity to get matched savings 1018 75.4%
The opportunity to get financial education 171 12.7%
The support from the community organisation 18 1.3%
To learn how to save 126 9.3%
Other 18 1.3%
Total 1351 100%
15–16
7. Saving and Money Management Behaviour Prior to Saver Plus
‘I had a massive credit card debt. I had been living beyond my means and doing a lot of emotional spending and I thought I need to do something. Get some control. I’m a relatively educated person but I haven’t really ever picked up very good financial management skills particularly from my family and there was a lot of irresponsible spending, a lot of gambling issues and I’d taken on all that by osmosis somehow, and I hadn’t really gotten myself together. So, I thought I’m 37 years old and I will take this opportunity and go forward and break that cycle. In my family, there wasn’t a culture of saving or prioritising. Everybody rented and lived beyond their means and that was seen as okay.’ Saver Plus participant
This section will detail aspects of participants’ general money management behaviour such as saving, spending, credit card use, knowledge and use of financial products prior to joining Saver Plus. Some of this information was gathered from participants before joining Saver Plus (upon enrolment) and some information was given before they commenced the financial education component.
Past Saving Patterns
Upon enrolling and before commencing the financial education component of Saver Plus, the participants were asked about their attitude towards saving. There were 56.8% of participants that said they had tried to save when they could. This is congruent with recent research on saving behaviour of low-income individuals in the UK. The research found, however, that lower income individuals are more likely to save informally than to actively save into an account than those that have higher incomes (Kempson and Finney, 2009). Saving is often done informally, that is, by saving cash at home using such methods as putting coins in a jar, or allocating amounts to envelopes for a variety of needs or wants.
It is also important to recognise that there are different types of savers. Three broad categories have been identified as:
Rainy day savers: This is the best type of saver – they have a saving mindset based on values usually instilled in them in childhood and they save for the sake of saving without a specific goal in mind. They are the most committed and dedicated type of savers (Rowlingson et al., 1999) who like to make sure they always have a safety net or buffer against economic shocks such as loss of income or unexpected expenses. Rainy day savers will always save and are uncomfortable with having to use their savings (Kempson and Finney, 2009).
Instrumental savers: These are individuals who save up for a specific purpose. They are goal-oriented in their saving. Rowlingson et al (1999) refers to this type of saving as ‘circumstantial saving’. There is the risk of these savers becoming non-savers if there are no goals. However, there is also the potential for instrumental savers to become rainy day savers. The evaluation of the UK’s Saving Gateway pilot found that there were a proportion of participants who were instrumental savers that became rainy day savers (Kempson et al., 2005). Saver Plus has also demonstrated that those who identified as being savers when joining become better savers (Russell et al., 2005, 2006, 2008).
Non-savers: Kempson and Finney (2009) found that there are actually very few ‘non-savers’. These are individuals who do not save at all and have no plans to start saving. They are characterised by an attitude of ‘living for the day’ and are more likely to be young, single, working full-time, have no children or living at home (Kempson and Finney, 2009). However, it is possible with the appropriate incentives and education for non-savers to become instrumental savers. Matched savings programs have also been instrumental in converting non-savers to goal-oriented savers. Saver Plus has shown to be successful in doing this (Russell et al., 2005, 2006, 2008).
The research tends to suggest that it is a myth that low-income earners do not save at all or do not want to save. However, there is much evidence that indicates that actively saving formally towards longer term goals is less common among lower income households (Whyley and Kempson, 2000). Also, it is well known that low-income households have lower amounts of savings than more well-off individuals (ABS, 2007a; 2007b) and are therefore less prepared for unexpected expenses or retirement.
While low-income individuals and families may have less saving activity and low levels of saving, it does not mean that they do not want to save. Indeed, saving for their children’s future is one of the most prominent aspirations of low-income parents (Kempson and Finney, 2009). This has been consistently apparent in all the Saver Plus evaluations. Parents want the best for their children and will go to great lengths to provide all they can for them. Follow-up evaluations of Saver Plus have shown that even after program completion, saving for the education of their children is still the most common goal for past Saver Plus participants. Saver Plus, through the opportunity of saving for education products, offering an incentive and providing financial literacy training, provides a path that enables parents to meet these goals.

Therefore, it is not surprising that upon enrolling in Saver Plus only 2.4% of Saver Plus participants thought that saving was not important. However, there were 17.3% of participants who, before Saver Plus, thought there was no use in trying to save because there was not enough money. Insufficient money left over after meeting living expenses is the most common reason for lower levels of saving among low-income households (Kempson and Finney, 2009; Russell et al, 2005, 2006, 2008).
Participants were also asked to describe their past saving patterns. Before joining Saver Plus, 31.4% of participants were saving a set amount on a regular basis and 32.6% saved the odd amount when possible. Approximately 25% of participants were saving what was left over after other expenses and nearly 10.8% had been unable to save in the past.
Overall, 21% of participants reported having $50-$199 in savings before joining Saver Plus, while the lowest proportion (5.7%) of participants reported having savings of $3,000-$4,999.
Participants were asked if they had ever set a saving goal before and if so, were they successful in achieving it. On average, around 18% of participants had previously had a goal, and of those, most were successful in achieving it (89.7%). This figure is much lower than in Phase Two when 45% of participants said they had a savings goal prior to joining the program. The success rate of achieving their goal, however, was the same as this phase. The strategies employed by participants for reaching their savings goal included putting aside some money when possible (39.3%) or by opening a special savings account (27.9%).
Those who were not able to meet their savings goal prior to Saver Plus provided a variety of reasons which prevented them from doing so. The most commonly reported reason was not having enough income or suffering a drop in income. The other frequently reported reason was lack of planning or financial management knowledge and not knowing how to save.
Spending and Planning for the Future
‘My boy has got to have braces and he knows that it’s just something which is very expensive and it’s going to be really hard for me to do. Anyway, he’s got involved and we’ve all started a native tree nursery. He has collected seeds and rah, rah, rah. He now has 370 trees growing in our backyard! They are lemon-scented gums and a few other bits and pieces as well. They’re only tiny at the moment, but he intends to grow them and get them to grow about so high and sell them for $10 each and, “There’s my braces, mum.” Saver Plus participant
Prior to undertaking the education component of the program, participants were asked to describe other aspects of their money management behaviour including spending and planning for the future. Overall, about a quarter of participants (25.9%) spend all of their income as they get it. The majority of the participants (65.8%) reported they could manage for a period of time if they suffered a major loss of income, however, 41.7% said they had problems setting money aside for major financial outlays. Only 9% of participants overall had worked out how much they will need to save for their retirement.
17–18
Banking and Payment Methods
‘I prefer to pay for things with cash because it means I can keep an eye on the money more and avoid overspending.’ Saver Plus participant
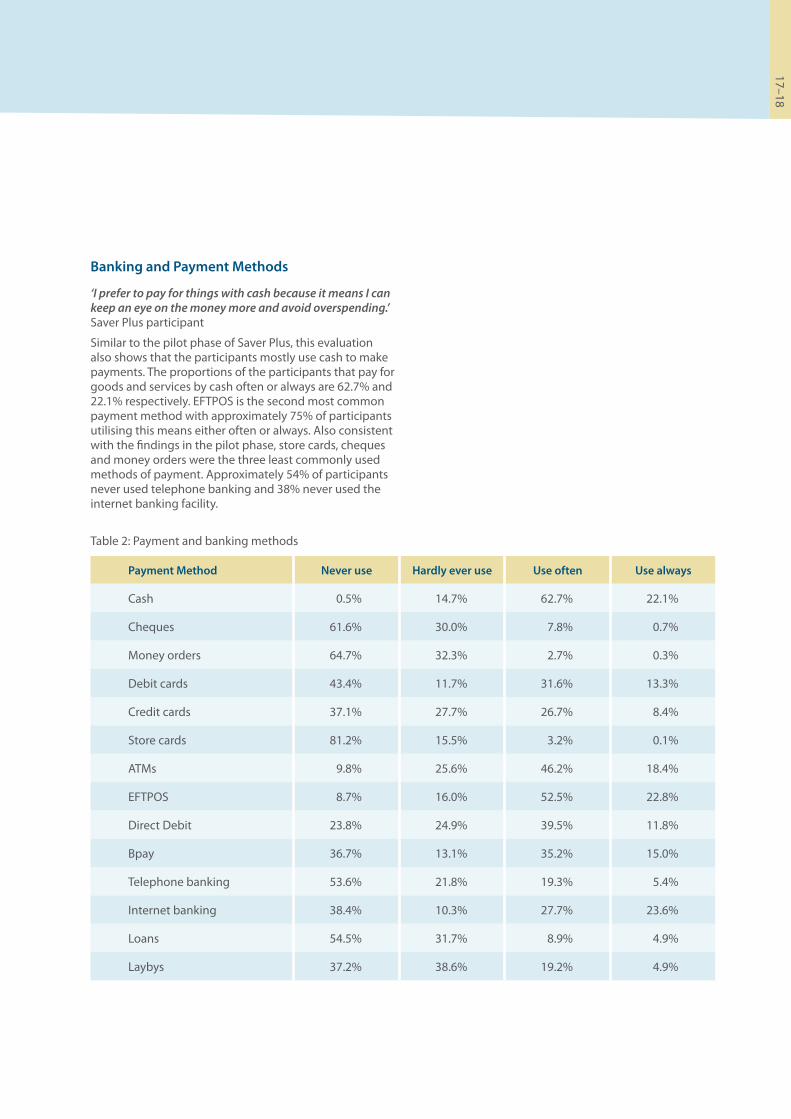
Similar to the pilot phase of Saver Plus, this evaluation also shows that the participants mostly use cash to make payments. The proportions of the participants that pay for goods and services by cash often or always are 62.7% and 22.1% respectively. EFTPOS is the second most common payment method with approximately 75% of participants utilising this means either often or always. Also consistent with the findings in the pilot phase, store cards, cheques and money orders were the three least commonly used methods of payment. Approximately 54% of participants never used telephone banking and 38% never used the internet banking facility.
Table 2: Payment and banking methods
Payment Method Never use Hardly ever use Use often Use always
Cash 0.5% 14.7% 62.7% 22.1%
Cheques 61.6% 30.0% 7.8% 0.7%
Money orders 64.7% 32.3% 2.7% 0.3%
Debit cards 43.4% 11.7% 31.6% 13.3%
Credit cards 37.1% 27.7% 26.7% 8.4%
Store cards 81.2% 15.5% 3.2% 0.1%
ATMs 9.8% 25.6% 46.2% 18.4%
EFTPOS 8.7% 16.0% 52.5% 22.8%
Direct Debit 23.8% 24.9% 39.5% 11.8%
Bpay 36.7% 13.1% 35.2% 15.0%
Telephone banking 53.6% 21.8% 19.3% 5.4%
Internet banking 38.4% 10.3% 27.7% 23.6%
Loans 54.5% 31.7% 8.9% 4.9%
Laybys 37.2% 38.6% 19.2% 4.9%

Level of Use of Financial Products
The extent of financial products used is a measure of financial literacy (Atkinson et al., 2006). In many countries, there is a significant proportion of low-income households that are unbanked. However, in Australia, low-income households are more likely to be underbanked rather than unbanked due to government payments being made directly to bank accounts. Hence, nearly all participants had an ordinary bank account before joining Saver Plus.
Around 14% of participants had no superannuation before joining Saver Plus. This reflects broader concerns that low-income individuals, especially women, are under-resourced for the future (Glass and Kilpatrick, 1998; Watson and McNaughton, 2007). The majority of participants hold vehicle insurance (83.9%), and with a significant increase from previous years, 66.6% of participants had house or contents insurance. Only 39.1% had a mortgage and 22.9% had a personal loan. Investment products were the least used of the financial products, which is consistent with the pilot phase of the program.
Table 3: Financial products used before Saver Plus
Solely Jointly Both Do not have
Ordinary bank account with a bank, building society or credit union
78.0% 13.2% 7.5% 1.4%
Superannuation 80.1% 1.3% 4.3% 14.2%
Managed investments other than Superannuation
10.8% 2.6% 0.7% 85.8%
Shares 16.5% 2.6% 1.4% 79.5%
Term deposits 11.8% 2.1% 0.5% 85.6%
An investment property 3.6% 2.5% 0.7% 93.2%
A home mortgage 22.1% 14.3% 2.7% 60.8%
A personal loan 17.7% 4.2% 1.0% 77.2%
A lease or hire purchase agreement 6.9% 2.9% 0.6% 89.6%
House or contents insurance 44.1% 19.2% 3.3% 33.4%
Vehicle insurance 64.6% 14.5% 4.8% 16.1%
Private health insurance 15.5% 9.9% 1.8% 72.8%

19–20
Cashflow Problems and Financial Hardship
In this phase of Saver Plus, participants were asked before commencing the program whether they experienced any cashflow problems during the previous 12 months. Over half the participants (56.5%) reported that they had.
Related to this issue of financial hardship, participants were asked about their ability to raise $2,000 in two days for an emergency and where they would source this money from. There were 29.9% of participants overall who said they had the savings to cover such an emergency. Approximately 45% of participants said they would be able to borrow $2,000 from family or friends in case of an emergency. Overall, a quarter of the participants said they do not have the savings and they could not borrow from family or friends in order to raise $2,000 in an emergency.
The overall proportion of Saver Plus participants able to use savings to raise $2,000 for an emergency was half that of the lowest national quintile in which nearly 60% of people are able to use savings to raise $2,0003 (Headey and Warren, 2007).
Participants and Debt
Debt levels in Australia have risen to dangerous levels over the last decade. The ratio of personal debt to income is higher in Australia than in the US and the UK (Consumer Affairs Victoria, 2007). We owe and spend more than we earn and the debt levels are rising faster than income levels (Commonwealth Bank of Australia 2007).
The most common type of debt held by the participants before joining Saver Plus was credit card debt (45.9%). However, lower income households in general are less likely to have loans and outstanding credit card payments than other households (Eardley, 2004). It is often harder for people in the lower income quintile to have access to affordable credit or credit cards.
Not being able to access affordable credit leaves low-income populations vulnerable to predatory lenders. Fortunately, amongst Saver Plus participants, there is a relatively low incidence of utilising credit from these sources. At the time of joining Saver Plus, only 1.4% of participants had debt owed to pay day lenders (0.9%) or pawn brokers (0.5%).
The second most commonly reported type of debt was a mortgage at 37.2%. This is slightly lower than the 38.7% of households that reported housing and other residential property debt in the HILDA survey of 2002 (Headey, Warren, & Harding, 2006)4. In the same survey, a mortgage was the main type of household debt.
3 This figure is based on 2004 results of the HILDA survey. The question is slightly different in that it asks if $2,000 could be raised within a week rather than in two days. This could affect the comparison of the figures.
4 The time period of the survey may need to be taken into consideration for the differences.

Credit Card use
There are now 14.3 million credit or charge cards and nearly 30 million debit cards in Australia. The current credit card debt is $45.4 billion (RBA, 2009) with an average of $3,149 owed by every Australian cardholder.
Before undertaking the financial education, Saver Plus participants were asked a series of questions about how they used and managed credit cards. The participants were also asked how many credit card offers they had received in the 12 months prior to joining the program. The majority of participants (46%) reported they had received 1-5 offers while 20.7% of participants had not received any.
Attitudes towards Credit Cards
Participants were asked to select from a list of statements which would best describe their feelings about credit cards. Approximately 31% of participants indicated ‘I dislike them as they make it too easy to run up a debt.’ Only 6.2% of participants chose the option ‘Without them I could not purchase necessary living expenses as savings and/or income are insufficient.’ Although in some sites higher proportions of participants indicated they needed a credit card to make ends meet.
Nearly 28% of participants found credit cards beneficial and useful to purchase items and they reportedly pay off the balance each month. Slightly less (24.6%) found them beneficial and useful to purchase items now and then pay them off over time.
When asked for the main reasons why they wanted to have a credit card, the majority of participants (59.8%) said they had a credit card for emergencies. The next most common reason was to buy products over the phone or the internet (31%). The introduction of products such as Visa Debit cards, which can be used to buy products on the internet or over the phone but without using credit, have provided a useful alternative to credit cards.
Nearly 40% of participants reported the credit card had no effect on their ability to manage their finances and 27% reported that having a credit card had improved their ability to manage their finances. A lower proportion of participants said that having a credit card had worsened their ability to manage their finances (19%).
The average amount owed on credit cards by the participants was $2,525, which was less than the average amount reported in previous phases and less than the Australian average (RBA, 2009). Approximately three quarters of the participants believed that their current weekly income would be enough to pay off their credit card debt during the next 12 months.
Many participants gave examples of the strategies they would employ to pay off their debt over the next 12 months. These included using lump sum payments to pay off accumulated credit card debt, using the card only for items within their budget, and others transferred a set amount from their income each month to pay the credit card debt. Following are some examples cited by Saver Plus participants.
‘I have set up an amount that is deducted directly from my wages.’
‘I have quit smoking recently and use that $26 a fortnight to pay off the credit card debt.’
‘I intend on using my tax return to pay off big amounts off the credit card.’
There were however, many respondents who believed that their current weekly income would not be enough to pay off their credit card debt within the next 12 months. The majority stated insufficient income or loss of income as the primary reason for not being able to pay off their credit card debt. Following are some examples of other barriers that prevent Saver Plus participants from paying off their debt.
‘Can never pay more than the minimum. Emergency expenses keep adding to the debt.’
‘There always seems to be a monthly temptation to buy something which I know I won’t be able to pay back as soon as I would like.’
‘Lack of money management skills. I know this is the problem.’
‘Unpredictable expenses i.e. medical or car repairs.’
In the same series of questions answered prior to undertaking the financial education course, participants were asked about their knowledge of responsibility for a secondary cardholder’s expenses on their credit card account. The majority of the participants (63.4%) correctly identified personal liability as a primary cardholder for the debt incurred by the second cardholder. This is a much higher proportion than reported in the ANZ Survey of Adult Financial Literacy in Australia which found that only 35% of low-income earners were aware of the responsibility (ANZ, 2008).
Participants were asked about how they felt about their credit card debt. Nearly 22% of participants were worried about how they would pay off this debt. Just under half of the participants (48.6%) were not worried about their credit card debt because they had a specific plan to pay it off.

21–22
Management and use of Credit Cards
This research also explored how participants used their primary credit cards. These questions were also asked prior to the participants undertaking the financial education course. Over half the participants (50.1%) used their credit cards for everyday transactions. The next most common use was for large, infrequent purchases with 35.7% of participants using credit cards for this purpose.
Also prior to undertaking the financial education course, the participants were asked to indicate whether the balance on their credit card(s) was lower, higher or the same as it was 12 months prior to commencing Saver Plus. There were 30.7% of participants who had higher credit card balances on their primary card than 12 months prior, 26.7% had lower balances and 42.6% said their balances were about the same.
Participants were asked to select from a list, a statement to best describe how they managed the payments on their credit cards. Just over 22% of participants paid the full balance each month and 6% struggled to even pay the minimum required.
Understanding Credit Cards
One of the measures of financial literacy is the ability to understand how interest rates on financial products are calculated. Only 31.4% of participants reported that they completely understood how the payment is calculated, 41.3% thought they knew and 27.3% had no idea how the payment is calculated.

8. General Money Management Knowledge and Skills
Participants were asked to indicate their level of involvement in their household financial management and level of understanding of their payslips. Nearly all the participants (91.1%) were either solely or jointly involved in managing the household finances. Of those who receive payslips, 70.2% always read them. About 75% reported that they are able to understand their payslips.
Shopping for Products and Keeping Track of Expenses
Shopping around for products and keeping track of expenses are indicators of financial competence (Atkinson et al., 2006). Before undertaking Saver Plus, only 19% of participants reportedly shopped around ‘a lot’ for financial products and 17.2% did not shop around at all. This is a significantly lower proportion than reported in the ANZ survey of Adult Financial Literacy in Australia which found that 56% of low-income individuals shopped around for financial products (ANZ, 2008).
Upon receiving a bank account statement, 32.5% of participants read and understand the information completely and a further 29.6% check the statements against their own records. Approximately 7.7% of participants disregard the statement.
Nearly half the participants keep a fairly close eye on expenses without keeping written records and only 2.8% of participants do not keep an eye on expenses at all.
General Attitudes towards Finances
Participants were asked about their attitude towards finances and their future in general. Almost all participants agreed or strongly agreed that it is important to have a life-long (94.7%) and short-term financial plan (96.2%). Only 6.5% believed they didn’t have to worry about planning for retirement because they believed the government would take care of it. These figures are very similar to the pilot phase results.
The majority of participants (66.0%) felt stressed about the uncertainty of the future and approximately 27.2% of participants liked to live day-to-day and let tomorrow take care of itself. There were a small proportion of participants (6.8%) who believed that it was no use having a plan because things always change.
If participants had a sudden loss of income or unexpected difficulty, nearly half (47.8%) would approach family for help. Roughly 16.9% of participants would contact Centrelink (this is a much lower proportion than the pilot phase figure of 55.2%), and only 9.5% would contact their bank or financial institution.
The majority of participants (58%) said they would make an appointment with the bank to discuss fees if they noticed the bank was charging them fees they were not previously aware of. Only 10.7% said they would just accept the fees because there is no use arguing.
When asked about their attitude towards using a credit card to buy a new bicycle for their child’s birthday, over half the participants (51.4%) believed it would be convenient as long as it did not cost them interest. Approximately 32% believed it would most likely lead to debt. Only 8.2% thought it was a good way to have something now, even if it cost them interest.
Knowledge of Fees and Charges
Participants were asked to rate their knowledge of fees and charges associated with various financial products and transaction methods on a scale ranging from 1 to 6, where 1 is ‘not at all’ and 6 is ‘very well’. The highest mean score on the knowledge scale for fees and charges was for their own bank’s ATM facility with a score of 5.09, followed closely by bank account (4.91) and EFTPOS (4.75). In contrast, the lowest mean scores were consistent with previous reports, with superannuation knowledge (2.84) and store cards (2.86).
The other way to assess knowledge of fees and charges is to examine the proportion of participants who said they have no knowledge at all about the various products. These proportions were lowest for ATMs (7.3%), bank accounts (7.7%) and EFTPOS (11%). The proportions were highest for store cards (48%), mortgages (41%), superannuation (37.6%) and telephone banking (37.6%). The results for this sample are very similar to that of the participants in the pilot phase and also reflect the low rate of ownership of these products amongst the participants.

23–24
9. Saving During Saver Plus
‘On Thursdays, I take my nine-year-old daughter to the bank and we make our deposits and we look at the balance and I tell her that, “This is for you, Daisy”, and then we go and have a date together, just the two of us.’ Saver Plus participant
This section gives results for completed participants’ success rates, goal achievement, products and services saved for, strategies employed to meet savings goals, and patterns of saving behaviour during the program.
Overall Success of Saver Plus
Overall, from the total number of participants who commenced the program, 82.7% were successful in completing and obtaining matched funds.
Meeting the Savings Goal
Upon enrolling in the program, the participants nominate an amount they wish to save. An important measure of participant success in Saver Plus is meeting their savings goal. This analysis includes data for 1,090 participants in Phase Three of the program who finished and returned the final questionnaire by 30 June 2009. Overall there was 95.9% of completed participants who successfully met or exceeded their savings goal. This is very similar to the previous result from Phase Two of the program, when 96.5% of participants reached or exceeded their goal and is about 3.5% higher than Phase One, where 92.4% of participants reached or exceeded their goal.
Figure 2: Overall success of Saver Plus
Drop-outs,17.3%
Completed and obtained matched funds,
82.7%
17.3% Drop-outs
82.7% Completed and obtained matched funds
Yes, I met my goal,56.40%
No, not quite4.09%
Yes, and I saved more than I had originally
aimed to,39.51%
Figure 3: Overall proportion of completed participants who met their saving goal
4.09% No, not quite
39.51% Yes, and I saved more than I had originally aimed to
56.40% Yes, I met my goal

Items Saved For
‘I got myself a computer for study. It was a fantastic feeling to be able to go out and buy something like that and not feel guilty because I’m not going to be able to eat for the next few weeks. That feeling of being able to buy it without the guilt, it was fantastic to be able to do that.’ Saver Plus participant
When they start the program, participants in Saver Plus agree to save for education expenses either for themselves or their children, and nominate the education product(s) or service(s) they plan to purchase with the matched funds. Similar to the pilot phase, computers, laptops and computer accessories were the most frequently purchased items. Other commonly purchased items were schoolbooks, uniforms, music instruments, paying for school fees, school camps and excursions.
‘I got a cheque made out to my daughter’s school. She’s in Grade 6. That was $780 and that covered two lots of excursions and other activities, and usually, in the past, it’s taken me six weeks to pay off, so it was just so good to be able to give them the cheque and not have it hovering over my head, wondering whether I’m going to get any nasty letters.’ Saver Plus participant
Overall Debt Level during Saver Plus
‘It made me realise that I really do need to pay off my debts in order to achieve things. It sounds simple, but I needed to be reminded.’ Saver Plus participant
There are statistically significant results in the relationship between overall debt levels and the rate of success in achieving savings goals. There were 84.5% of participants who met or exceeded their goal and were also able to decrease their levels of debt during the program. Those who did not meet their savings goal were more likely to have their debt stay the same (35.2%) or decrease (40.7%).

25–26
‘Mostly I really learnt how to manage my debts much more effectively, which in turn obviously brings a more positive outlook for the future. I mean I was only paying off interest only on my debts for eight years. There was never an end date. It wasn’t a smart goal. There was no timing. All I was thinking was that I will have to keep working to pay the minimum.’ Saver Plus participant
‘I never wanted to think about the future like holidays or how will we pay for our kids to go to high school. That was just not there. It was just doomy, gloomy. Then I went and got organised. Things happened for me and all of a sudden plans changed because of my finances. I was starting to save $800 a month on interest and now I don’t even want to start calculating how much money I’ve wasted in the last eight years.’ Saver Plus participant
Table 4: Relationship between goal achievement and overall debt
χ2(6)=12.65, p<0.05 What has happened to your overall debt level while participating in the Saver Plus program?
Did you succeed in meeting your savings goal? Increased Stayed the same Decreased I have no debt
No, not quite 9.3% 35.2% 40.7% 14.8%
Yes, I met my goal 7.1% 30.0% 36.4% 26.6%
Yes, and I saved more than I had originally aimed to 5.7% 17.9% 48.1% 28.2%
Saving Methods
‘I enjoyed taking my deposits into the bank. I felt good about myself doing it this way.’ Saver Plus participant
Similar to the pilot phase, a considerable proportion of participants (40%) make their savings deposits in person at the bank. There were 30% who transferred money from another account to make regular savings deposits. Other participants made use of automatic deductions from their bank accounts (16.2%), automatic deductions from their salary (10%) or Centrepay (2.8%).
Overall, the majority of participants (58%) found saving fairly easy while only 3.9% usually found it hard. Approximately 35.4% found it sometimes easy and sometimes hard. The recent study by Chant Link & Associates found that Saver Plus participants were more likely to miss deposits if they chose to make cash deposits in a branch rather than opting for direct debit, and that this may contribute to higher rates of non-completion (Chant Link 2009).
There were one in four participants who reported having difficulties that affected their ability to save at some point during the program. Unsurprisingly, and similar to the pilot phase, the most common cause for difficulty was receiving unexpected bills (57.1%). Other reasons nominated by participants who experienced difficulties were: reduced hours or complete loss of employment, illness or death in the family or a relationship breakdown. Even though difficulties were experienced, more than half (57.3%) were still able to meet their savings goal each month. Approximately one in four participants missed one or more deposits but made them up later.
Participants were asked to nominate the most important factor that helped them save on the program. There were 66.1% of participants who said it was the opportunity to obtain the matched funds at the end of the program that helped them continue to save. Approximately a quarter of participants (21.4%) said the most important factor was the financial education and 7.2% found the support from the organisation the most important factor in helping them to save. These results reflect the importance of incentives in saving programs.
The concept of saving is essentially a decision to not spend a certain portion of money. This decision can be broken down into what participants felt can be forgone in order to save that portion of money. The majority of participants (89.5%) gave up things they ‘wanted’ rather than things they ‘needed’. Some participants adopted more than one of the strategies of giving up wants and needs to meet saving goals.
‘The light bulb goes on and I have started going to the shops and looking at my trolley and thinking, okay, is that a need or a want. Now I’m just doing it on autopilot.’ Saver Plus participant
Table 5: Banking methods used for saving
%
How were your monthly deposits made?
Cash deposits at the bank 40.0%
Automatic deductions from my salary (Autopay) 10.0%
Automatic deductions from my Centrelink payments (Centrepay) 2.8%
Transfer from another account 30.0%
Automatic deductions from my bank account (direct debit) 16.2%
Other 1.0%

27–28
Use of Credit during Saver Plus
A widely held concern by stakeholders in all matched savings programs is the possibility that participants borrow money to make the required savings deposits. This action, of course, defeats the purpose of the program. Monitoring this activity is important in evaluating the saving behaviour of participants. As in the pilot phase, participants in this evaluation period were asked if they needed to borrow or use credit in order to meet their monthly savings goal. In this phase, 10.8% of participants said that they had to borrow or use credit in order to make their saving deposit. This is a little higher than the pilot period in which 7.2% of participants reported having to borrow or use credit to meet their savings. There were 5.6% of participants who indicated they used their credit card for items they would normally pay cash for in order to meet their savings deposit goal. The average amount borrowed, or used credit for, to meet the savings goal was more commonly between $100 and $300.

Monthly Deposits
One of the major objectives of Saver Plus is to assist participants in developing a savings habit. This requires participants to make regular and consistent deposits over the course of the program. Hence, when participants enrolled in Saver Plus, they were asked to nominate how much they wished to save over the period of time in the program and then calculate how much they needed to save each month in order to reach their goal. For example, a participant might have nominated to save $1,000 (the maximum amount that was eligible for matching in this phase) over a 10-month period which meant they needed to deposit $100 each month in order to reach that goal. The majority of participants (68.5%) saved more than their goal each month. The average deposit was $154 and the average goal ratio was 1.25. Nearly 20% of participants saved the same as their goal and 11.5% saved less than their goal.
The best type of saving behaviour is regular and consistent deposit amounts. Hence we also explored the variability of average deposits made over the course of the program by all participants5. The most common levels of variability were 10% and 60%. This means that participant deposit amounts most commonly deviated around their average deposit by 10% or by 60%6. For example, with 10% variability, and considering a participant’s average deposit amount is $100 then this means that deposit amounts could vary from $90 to $110. At the other end of the spectrum, with 60% variability, and considering a participant’s average deposit amount is $100 then it could possibly vary from $40 to $160. Phase 1 of the pilot had the most consistent saving pattern but Phase 2 also experienced large degrees of variability.
Figure 4: Variability in individual amounts deposited during Saver Plus
FREQ
UEN
CY
VARIABILITY
10%
20%
30%
40%
50%
60%
70%
80%
90%
100%
110%
120%
130%
140%
150%
160%
170%
180%
190%
200%
Mor
e
0
100
200
300
400
500
600
700
800
5 This is done by calculating the coefficient of variation which gives the standard deviation divided by the mean multiplied by 100%.6 Outliers were not excluded in this analysis

29–30
Average Time in Program
Participants were able to be in the Saver Plus program for a minimum of 10 months and a maximum of 18 months. On average, participants were in the program for just under 12 months.
Savings Levels
We investigated the average savings balance of all participants as at 30 June 2009 across a range of individual characteristics. Participants aged less than 20 had a higher balance than the other age cohorts, and the participants aged between 20 and 39 had the lowest final savings balance. Couples with children had considerably higher average balances than that of sole parents, grandparents with children or couples with no children.
Participants who speak a language other than English at home had a higher than average balance compared to those who spoke English at home. Participants who reached a Year 10 level of education had the highest average balance while participants who only reached a Primary School level had the lowest.
Participants whose primary source of income is paid employment had a higher average balance than those whose primary source of income was government benefits. In terms of equivalised weekly income, participants whose equivalised income was between $125 and $250 had a slightly higher than average balance than the other income ranges.
Participants who had been saving a set amount on a regular basis before joining Saver Plus had a higher than average balance than those who saved what is left over after expenses, those who saved the odd amount when they could and those who had been unable to save. Those who had between $200 and $600 in savings prior to Saver Plus had a higher than average balance than those who had less savings and those who had more.
Income Levels throughout the Program
Overall, 54% of participants who completed Saver Plus reported that their income stayed about the same throughout the program. Approximately 9.4% reported an income decrease of more than $100 a week and a further 10.6% report a smaller decrease in income of less than $100 per week. Approximately 26% of participants experienced an increase in income of more or less than $100 per week.
10. The Vietnamese Experience in Saver Plus
‘I was a participant of the HIPPY program, which is run by the Brotherhood of St Laurence also, and I was told about Saver Plus and that I would be eligible to join. I now work part-time as a HIPPY officer and tell lots of people about Saver Plus and that they should join too.’ Vietnamese Saver Plus participant
In a couple of sites, there is a cohort of Vietnamese participants. A focus group was held with a sample of Vietnamese participants to capture their experience in Saver Plus.
Upon first hearing about the Saver Plus program, the initial reactions were excitement because participants could purchase the ‘big things’ that are expensive and that they otherwise couldn’t afford. The Vietnamese participants, like the majority of Saver Plus participants heard about Saver Plus via word-of-mouth – someone they knew had done the program and told them they should do it too.
Like many Saver Plus participants, the Vietnamese participants were already saving before they began the program, but since starting the program they had improved the way they saved. Most saved informally, by regularly putting money aside but then dipping into the funds when needed. The participants said this was easy to do because they didn’t have clearly defined goals for what they were saving for.
The focus group participants said that in the Vietnamese culture, saving was important, and they knew they should put money aside but were not committed to purchasing a particular item. They also reported that the act of writing the goal down made it easier for them to save to reach that goal as opposed to just thinking about it. The Vietnamese participants said that they found the program relatively easy and the way they maintained motivation was by thinking about what they could purchase at the end.
The Vietnamese participants reported their children becoming excited and involved in saving. For example, one participant’s child got a part time job at K-Mart so that he could also save up for a saxophone. The child’s father had offered to buy him the saxophone as a birthday gift, but the child declined the offer and said he would rather save for it himself. This led to participants saying that the best aspect of the program was that their children had learned good tips to help them save money and had seen the importance of saving through the examples set by their parents.
Participants said that their project worker supported them through the program and her flexibility was a key attribute that made it easy for the participants to complete the program. She understood their schedules and offered alternate times and locations to attend the workshops, if the option was available. A suggestion from the participants was to have classes on the weekends which would make it more convenient to attend and would interfere less with their jobs. They learnt valuable and helpful advice in the classes, and can now distinguish between what is a need and a want. They also acquired some very practical tips, for example, the best time and place to go shopping for certain groceries. For example, one participant told the class that they should go to the Preston Market at 10am on a Tuesday because that is when the bargains are offered. This sharing of knowledge within the program was something that participants really enjoyed.
In terms of saving method, the Vietnamese focus group participants all preferred to deposit funds in person at the bank. They also preferred not to have credit cards. The participants noted the generosity of ANZ in supporting the program and they would be interested in learning more money management tips in the future.
A key experience reported in the Vietnamese focus group was that a participant had contacted an ANZ staff member and thanked her for having such a program available. This lady had a son who had just received a scholarship to a top Melbourne school and attributed his success to the Saver Plus program as without it, she would not have been able to purchase a computer for him.

31–32
11. Banking Activity
This section details the banking activity of participants from 1 April 2006 to 30 June 2009. Deposits7 and withdrawal patterns are explored across participant months.
Overall Deposits and Withdrawals
The average deposit amounts per month are quite consistent across participating months with an average low of $60.13 in May 2006 to an average high of $103.24 in December 2008.The average number of deposits per participant is also consistent during the period analysed. When the program period started in April 2006, only six deposits were made with a total of $234.70. Then the deposits per month increased significantly (along with the number of participants) with 2,470 deposits made with a total of $127,920.35 in October 2007. For the period of April 2006 to June 2009, a total of $3,057,186 had been deposited by participants into their Progress Saver accounts.
Unsurprisingly the withdrawal patterns are not as consistent as the deposits. The total number of withdrawals understandably increased over time with only one withdrawal in April 2006 to 412 withdrawals per month in November 2007. The large number of withdrawals in November 2007 include withdrawals from the first batch of completing participants. The total and average withdrawals in dollar amounts are high in some participant months due to a number of incidents of unusual withdrawal behaviour. The total amount withdrawn from participant accounts is $635,814 for the period of April 2006 to June 2009.
Patterns of Saving Behaviour
Another way to measure the degree of consistency in saving behaviour is to analyse pairs of deposits – that is to compare the previous and current months’ deposits. For each participant, the deposits were compared across months to identify whether they increased, remained constant or decreased relative to the amount deposited in the previous month. Nearly 70% of all pairs of consecutive deposits were constant (47.4%) or increased (22%) in one month compared to the previous month. There were only slightly more than 2% of consecutive months in which no deposits were made. Overall, there were 28% of deposits that decreased from one month to the next.
7 Outliers are excluded when calculating deposit amounts.

12. Impact of Financial Education
‘At the beginning I didn’t think I needed the education, I just needed the money and the $1,000 was the motivator, and all of a sudden you realise well, in fact, I’m learning some stuff here that is actually more important than what the $1,000 is going to be at the end.’ Saver Plus participant
While many matched savings programs offer financial education as an optional activity, there is a growing belief that including it as compulsory is best practice (Carpenter, 2008). Learning by doing is an important factor in the success of matched savings programs but it could be seen as irresponsible to instruct a participant to save without providing for the skills and knowledge that will enable them to do so. Offering an effective financial education program is resource intensive but has the potential to provide the most lasting impacts. Participants in all evaluation periods of Saver Plus have reported that upon first enrolling they weren’t keen on having to come to class and do a ‘boring financial course’, but were always surprised to find how much value they gained from it and even more surprised to find how enjoyable the program was. If the primary aims of the program include developing a savings habit and increasing levels of financial literacy then there is an obligation to assist the participants in acquiring these skills. As in the previous phases, participants have reaped benefits that go beyond financial literacy and savings. Some examples are provided below.
‘During the workshops, I remember this one activity where you would write down all the lists of your expenses and choose what’s a want and then get those wants and add them up – how much you spent each day, each month, each year, and then you go HOLY MOLY, I just spent $1,800 on coffee.’ Saver Plus participant
‘The financial education sessions in a group setting are really successful. People feel comfortable and not intimidated, which has been really amazing because quite often money is something people don’t talk about. You don’t have to talk in depth about your own situation, but by listening to the experiences of others you can pick up some ideas and get support. Some women still get together over a cup of coffee and discuss financial matters.’ Saver Plus project worker
‘We learnt all sorts of consumer tips. Learnt how to change the way we think about spending money. We changed from our credit card to a Visa debit card and have saved about $200 a month. We’ve only had it for a couple of months and are already saving $40 a month. With a debit card you can’t get charged interest because it’s your own money and if you don’t have the money you can’t spend it.’ Saver Plus participant
‘I know that when I was telling my kids about the saving, that mum was saving for a computer and all that, they’d every now and again say, “How much money have you got in that account now, Mum? How much will we have to spend on a computer?” They couldn’t wait. Now we have a brand new computer and the kids are so excited and I am proud.’ Saver Plus participant
‘It made me think, made me a bit more aware about where I am spending my money because sometimes I would just spend money for the sake of spending money.’ Saver Plus participant
‘I used to think that because I didn’t earn much money there is no way I could save. But it’s not about how much you make, it’s about managing it, and if you can’t manage small amounts you won’t be able to manage large amounts. That’s what I learnt out of it – managing, managing your money.’ Saver Plus participant

33–34
MoneyMinded is used as the financial literacy training resource and while all modules are listed in Section 2.0, not all are used by all the organisations. The facilitators tailor the topics to suit the needs of the participants.
Participants were asked to rate how useful they found each of the topics using a scale of 0 – not at all useful to 4 – extremely useful. The most highly rated module was ‘Saving and Spending’ (mean rating of 3.64) with 94% of participants finding this topic useful or extremely useful. This is followed closely by the module ‘Goals’ with a mean rating of 3.61 and 93.2% of participants finding it useful or extremely useful. The module ‘Money Planning’ is also highly rated having a mean rating of 3.46 and 93% of participants finding it useful or extremely useful.
According to participants, the lowest rated module is ‘Opening a Bank Account’ which had a mean rating of 2.90 and 65.2% of participants finding it useful. Overall, there were very few participants who rated any of the modules to be of little or no use.
In this evaluation period, a direct comparison of participants’ reported levels of knowledge pre and post Saver Plus can be reported. Although changes in knowledge do not necessarily lead to changes in behaviour (Braunstein and Welch, 2002), knowledge and awareness are the necessary foundations for more effective money management behaviour. Knowledge of fees and charges relating to financial products is a component of financial literacy and is important in assisting individuals to make informed decisions about product choice. The evaluation found that there were various degrees of increases in knowledge levels across all products and services. The changes were statistically significant with the biggest change in knowledge level relating to store cards and debit cards with a difference in means of 1.13 and 1.02 respectively.

Similarly, a comparison was done on pre and post levels of usage of various financial products as reported by participants. Unlike the results of the interim analysis of Phase Three (Russell et.al., 2008), there are some decreases in the use of some financial products. There was a slight decrease in the use of superannuation, managed investments other than superannuation, shares, term deposits, personal loans, lease or hire purchase agreements, and all insurances (house and contents, vehicle and health).
While decreases in some products could indicate better money management behaviour if participants have consolidated loans or paid off their personal loans and cancelled lease or hire agreements, the decreased use of insurances and superannuation is of more concern. Decreased use of superannuation and investments could perhaps be explained in part by impacts of the Global Financial Crisis if participants had reduced employment and therefore less superannuation, but there are no obvious explanations in the data about the reduced levels of the use of insurances. Encouragingly, there were statistically significant increases in the use of ordinary bank accounts and home mortgages.
Table 6: Changes in levels of knowledge of fees and charges
Mean Before Mean After Paired Samples t-Test Results
Bank accounts 4.95 5.44 t(842)=8.18, p<0.05
Debit cards 3.84 4.86 t(751)=12.54, p<0.05
Credit cards 4.34 5.20 t(776)=11.98, p<0.05
Store cards 2.93 4.06 t(677)=12.19, p<0.05
Your own bank’s ATM 5.15 5.86 t(806)=11.15, p<0.05
EFTPOS 4.79 5.57 t(807)=11.59, p<0.05
Bpay 3.66 4.54 t(765)=11.98, p<0.05
Telephone banking 3.41 4.28 t(749)=10.98, p<0.05
Superannuation 2.89 3.66 t(777)=10.44, p<0.05
Mortgage 3.35 4.15 t(720)=11.00, p<0.05
Loans 3.33 4.36 t(716)=12.71, p<0.05
Internet banking 3.66 4.58 t(769)=12.19, p<0.05

35–36
Many participants indicated interest in undertaking more financial education especially in topic areas that are a little more complex than what is offered during the program. Encouragingly, many participants are interested in asset building and longer term financial planning.
Participants were asked to select other areas they would like to see included in the financial education component. The majority of participants wanted more information on superannuation (39.6%) followed by information on Centrelink benefits (27.9%). Other areas of interest were home ownership, investment and asset creation, internet and phone banking, financial planning (both short and long term), and the psychology of shopping.
Table 7: Changes in levels of usage of financial products
% Before % After Paired Samples t-Test Results
Ordinary bank account with a bank, building society or credit union 98.61 99.5 t(904)=4.57, p<0.0.5
Superannuation 85.7% 81.4 t(896)=-3.73, p<0.05
Managed investments other than superannuation 14.6% 8.63% t(833)=-5.36, p<0.05
Shares 21.4% 18.5% t(843)=-3.18, p<0.05
Term deposits 14.2% 12.1% t(828)=-2.18, p<0.05
An investment property 6.1% 6.0% t(825)=0.48, p>0.05
A home mortgage 61.3% 89.3% t(855)=1.05, p>0.05
A personal loan 21.5% 18.5% t(833)=-0.55, p<0.05
A lease or hire purchase agreement 10.3% 6.6% t(824)=-0.10, p<0.05
House or contents insurance 68.0% 63.8% t(880)=-0.63, p<0.05
Vehicle insurance 84.7% 80.8% t(895)=-3.54, p<0.05
Private health insurance 28.0% 25.2% t(842)=-2.53, p<0.05

13. Encouraging Social Inclusion and Building Social Capital
‘The group contact really inspired me to make more contact within my own community. I had become very socially isolated particularly because I was a sole parent and on my own. I didn’t have the money to go out, and network and socialise so it was great to hear about things that existed which I could participate in.’ Saver Plus participant
Financial and social exclusion are closely linked, although causality is not determined (Chant Link and Associates, 2004). We do know, however, that if people are more financially included they are more likely to be socially included (Rogaly and Fisher, 1999). Burchardt, Le Grand and Piachaud (2002) view social inclusion as having the following dimensions:
Consumption: having the capacity to buy goods and services and accumulate savings;
Production: to participate in the economy and other activities relevant to the society lived in;
Politicalengagement: contributing to decisions that affect ones life
Social: belong to a network of family, friends and / or neighbours.
Also relevant to understanding the value of the impacts of Saver Plus is the concept of social capital. Building social capital has been found to contribute to addressing marginalisation and social exclusion within a community. The World Bank defines social capital as ‘norms and social relations embedded in the social structures of societies that enable people to co-ordinate action to achieve desired goals’ (2009). Social capital refers to collective action that brings about social change. It focuses attention on the structures and relationships between entities that bring about success in achieving goals. Social capital recognises that different entities, be they organisations or people, possess a range of resources that when combined are able to bring about goal achievement.
Saver Plus embodies the concepts of social capital. The success of the program hinges on partnerships across institutions and sectors – partnerships that nurture trust, reciprocity and community engagement, not only in the participants but across organisations. The cross-sector partnership at the core of the delivery model brings together different resources that have made Saver Plus possible and successful. Partnership models ‘recognise that different sectors have access to different resources and channels of power’ (Packer et al., 2002, p.317). Saver Plus has built relationships horizontally and vertically. It has developed relationships between participants and the community organisation delivering the program,
between participants and a mainstream financial institution – ANZ, between community organisations, ANZ and government, and between participants themselves.
Networking is a major benefit of partnerships (Packer et al., 2002; Gilchrest, 1998), and is a core element of building social inclusion and social capital. The community organisations, through delivering Saver Plus, have built relationships with other organisations, schools and businesses in the community, which in turn, has expanded the resources available to the Saver Plus participants. ‘A well connected society can leverage individuals and local communities towards higher aspirations and better outcomes through reciprocity, trust, cooperation and mutuality of support’ (Althaus et al., 2007, p.113).
One example is given below by a project worker reporting on the positive impacts Saver Plus has had on their organisation and in the community through strengthening relationships with other organisations.
‘It’s a great community development project because it assists families to make positive changes rather than crisis response which is more of the nature of Berry Street’s work in the past. I think it has assisted us to build relationships and networks with a variety of organisations, and groups including schools, banks, cultural groups and church groups. It has been amazing that we’ve been able to engage these partners, and in some cases had spin-offs where we established other programs like the Life Skills Project which was through the secondary schools youth coordinator who really loved Saver Plus and asked how we could introduce the concept of saving to students before they leave school. So we put together a little package and delivered it to Year 10 students in two secondary schools and now all our other sites want to implement something similar.’ Saver Plus project worker
It is difficult, however, to definitively measure changes in participants’ levels of social inclusion and how much can be attributed to program participation, especially over a relatively short period of time. However, to explore the participants’ levels of community involvement we have used pre and post program indicators around volunteering, involvement in children’s school activities and feelings of connectedness. We also include qualitative data on social impacts from participating in the program.
‘I live in Bondi and I run into participants all the time down at the beach or around about, which I really like so it’s given me a sense of community as well.’ Saver Plus participant

37–38
Overall, the average level of volunteering increased after program completion, although the results are not statistically significant. The majority of participants felt connected to the community before the program. Hence, there is less movement possible in terms of change. However, some sites showed some significant increases in connectedness.
The majority of participants in Saver Plus were saving for their children’s education so participants were asked to indicate the degree of involvement they had in their child/ren’s school activities. The majority of participants were already involved prior to Saver Plus and remained involved during the program.
Perhaps of more significance than levels of involvement in the community are the social benefits and associated impacts gained from being in the program. The focus
group data revealed that the participants found the social interaction and being part of something – a group or a program – was really important. They found it comforting and reassuring to meet others in similar situations. Prior to Saver Plus, many often felt they were the only ones struggling to make ends meet. Being with others reduced feelings of isolation and inadequacy.
Also, participants learned a lot from each other. The groups shared tips and money saving strategies, and together built a storehouse of local knowledge and information. This illustrates the concept that all people have social and human resources that are of great value, not just those delivering the program. This is social capital. And, if these resources are tapped into through appropriate mechanisms, they can help strengthen structures within the community.
Table 8: Impacts on social inclusion
We all came together and shared stories about the challenges in each of our lives, and in return, we helped each other stick at the little promises we had all made to ourselves.’
‘Sharing knowledge amongst the group was fantastic. I picked up lots of little gems of information – like the best time to go to The Preston Market is at 10am on a Tuesday because that is when the bargains are to be had!’
‘I don’t know what I would have done without the support. People like me would end up stuffed. You helped me make good choices.’
‘The program is only as good as the people that run it. It’s about relationships and communication between people.’
‘I definitely feel more capable and that’s really increased me self-esteem across the board which I think has flowed back on to the children because I feel happier.’
‘I managed to save all the money. My son started out at high school, and I met a bloke and I started a business as a personal trainer. It was a trigger for me, and my life now is really good.’
‘Initially I just thought ‘FREE MONEY’ and never once considered how it would completely change my life. I am now in control of my life and a much wiser consumer.’
‘It’s also assisted us to build positive relationships with participants and it provides hope, and I think that’s quite a challenge in these times. Saver Plus has made a significant difference in lots of people’s lives. And it’s also provided a forum where people can share stories and experiences and resources and the workshops, no two are the same, and I’ve gotten so much out of them that it inspired me to set up a community resource directory for this area.’
‘Everyone participated in the whole four educational classes together as a group so by the end there was a lot of friendships formed and even buying groups. While I didn’t keep much contact with my own group from the educational classes, it inspired me to make much more contact within my own community.’
‘I started looking at other sorts of jobs. It was great to get sent that information about positions that are family friendly and part-time.’

14. Satisfaction and Benefit Rating of the Saver Plus Program
‘My daughter helps me with my spending diaries and now she writes the shopping list, and she tells me what’s not on the list…You’re not getting that, it’s not on the list, she says. She’s 10 and in Year five and so it is great to have her thinking this way from such an early age.’ Saver Plus participant
Overall, 99.1% of participants reported a positive experience of the Saver Plus program. This result has been consistent across all evaluation periods and confirms the value of the program to participants. Having a positive experience in the program will more likely lead to the adoption of lessons learned and the maintenance of the savings habit than if the participant had a negative experience.
While the level of satisfaction with the program is extremely high, the participants experience a range of benefits in varying degrees. For some participants, the program has triggered life changing circumstances and for others the benefits may be less pronounced. It depends upon the starting point of the participant – what they are going through or experiencing at the time of joining. The benefits of the Saver Plus program have consistently fallen into the following categories:
Increased self-esteem and confidence
Reduced stress
Increased positive education experiences
Greater propensity to plan for the future
Feelings of greater control over their lives
Positive intergenerational effects
Increased social networks
•••••••
Table 9: Rating of overall experience
Very Negative -3
Negative -2
Somewhat Negative
-1
Neutral 0
Somewhat Positive
+1
Positive +2
Very Positive +3
0.1% 0% 0.3% 0.5% 2.7% 21.7% 74.7%
Mean Rating 2.70

39–40
Table 10: Comments about experiences in the Saver Plus program
‘I am an accountant so I thought I wouldn’t learn anything from the program but I did. I learnt to re-focus again. Something I had stopped doing.’
‘For the first time, I feel like I’m providing for my son instead of limiting him. I had a total change in attitude and just started to plan my life because it is my life and nobody else is going to.’
‘It was really helpful when the ANZ Branch Manager attended the session, and he spoke about different products and about negotiating with banks. He said that if we wanted to buy a house that we could buy one in Campbelltown for $300,000 if we wanted it. And, at the end, we could ask him questions and he was just really easy to understand.’
‘I do the same with my seven-year-old. I would do internet banking and he would be sitting beside me, and see the money going up and he said, “Mum, you can almost buy me a Playstation.” And I said, “You can buy a Playstation any time. Can I? Yeah, all you have to do is save this amount of money.” So, I actually suggested to him that there are lots of things he could do like a garage sale or he could go and ask the neighbours in the street if they needed their car washed, and I think within a month he had enough money to get a Playstation.’
‘I’ve found that it has united our family more closely. We’re doing more old-fashioned things rather than going to the movies and going out doing stuff which costs money. So instead we just get a board game out or go to the park and walk the dog. We are spending more time together and with our friends rather than going up to the shopping centres and wasting money.’
‘I’m a single mother with two little boys and I am much less stressed now when I get home from work because they know not to ask for McDonalds. I used to get it after swimming, and now we are a bit more organised and have something to heat up when we get home. There have been a few tears when I said there’s lasagne and not McDonalds, but they’re over it now.’
‘And for some, they are learning how to manage their debts much more effectively, which obviously brings a more positive outlook for their future.’
‘I think the program should be expanded so more people know about it because it is so good.’
‘I worked out a deal with my daughter that she can have half of her money and the other half she has to bank and she’s quite okay with that arrangement and she has become more aware of what money is worth and even waits for things to go on sale.’
Participants were given a list of potential benefits and asked to rank the three most important to them and overall, the most important benefit of the program was ‘getting the matched funds’ (48.6%); the second benefit that was ranked as most important was ‘developing a savings habit’ (40.8%); and the third most important benefit was ‘getting my finances organised’ (10.6%).

15. Post-Saver Plus Savings Behaviour
‘I now sit down with my family once a month around the dinner table, and we talk about our money and saving which we were never doing before.’ Saver Plus participant
Participants were asked to indicate if they planned to continue saving after completing Saver Plus. While intentions are not always a good indication of behaviour (Barr, 2008), it is usually a precondition of behaviour. The overwhelming majority (80.1%) believed they could keep saving the same amount or more each month. Approximately 18% believed they could keep saving but a smaller amount each month. These are encouraging results given the current economic circumstances.
‘I feel like I’ve done it once and can do it again. You realise it wasn’t really that difficult at all.’ Saver Plus participant
Table 11: Planned saving behaviour post-Saver Plus
N %
Do you think you will be able to continue saving now that the program is finished?
Yes, I think I should be able to save even more each month 372 27.8%
Yes, I should be able to keep saving the same amount each month 701 52.3%
Yes, but a smaller amount each monthw 244 18.2%
No, I don’t think I’ll be able to save regularly 15 1.1%
No, I don’t think I’ll be able to save at all 8 0.6%

41–42
16. Program Drop-outs
During the pilot phase Saver Plus experienced very small numbers of participants who commenced the program but did not complete it. However, since the program has been scaled up from four sites to 21 sites, and the participant numbers overall have increased 10 fold, the numbers of drop-outs have also increased. Therefore in Phase Three, we were able to conduct a series of analyses on the drop-out sample of participants.
In this period of analysis (April 2006 to 30 June 2009) there were a total of 5588 participants who commenced the program but did not complete. This is an overall proportion of 17.3%. This compares favourably to international programs. For example, evaluations of North American matched savings programs estimate that drop-out rates range from 20% to 60% (Rohe, Gorham, Quercia, 2005).
In exploring the characteristics of participants who did not complete the program and comparing them to those who did, we noted some differences.
There is no significant difference in age or education levels between drop-out participants and those who completed. There were, however, more differences in financial characteristics. For example, those who dropped out were more likely to have lower levels of savings prior to joining the program than those who completed the program. The participants who did not complete were also more likely to have experienced cashflow problems in the 12 months prior to Saver Plus. Also, the participants who did not complete were more likely to dislike credit cards whereas the completed Saver Plus participants found credit cards beneficial.
International research has found that the presence of debt is associated with greater drop-out rates in matched saving programs (Schreiner and Sherraden, 2005). This evaluation shows that drop-out participants generally found it more difficult to pay their credit card debt off when compared to the majority of the Saver Plus participants. Approximately 23% of drop-outs struggle to pay the minimum each month compared to only 14.5% of completed participants. Conversely, nearly 23% of completed participants pay the full balance on their credit card each month compared to only 5.7% of drop-out participants.
We were interested to see if the current macro-economic conditions were correlated at all to the drop-out rate. A time-series regression was conducted and the monthly Australian Consumer Sentiment Index (CSI) was used as an economic indicator. The data is collected from the Australian Bureau of Statistics, which spans the period from November 2006 to April 2009. The CSI is an average of five component indexes which reflect consumers’ evaluations of their household financial situation over the past year and the coming year, anticipated economic conditions over the coming year and the next five years, and buying conditions for major household items. Assessments about future unemployment are also recorded.
It was found that the CSI contributes significantly to the changes in the drop-out rate in the Saver Plus program. On average, a 1% decrease in the CSI will lead to an increase of 0.77% in the number of drop-outs. The figure is significant statistically and economically. It shows a strong correlation between the number of drop-outs and the economic conditions. Since participants in Saver Plus are predominantly low-income earners, they are the most affected by the economic downturn.
Therefore, the number of drop-outs = 5.7278 + (-0.76883 CSI).
8 The analysis of characteristics of participant drop-outs is based on 383 responses.

Main Reasons for Dropping Out
The main reason for participants dropping out of the Saver Plus program was that they missed too many deposits (36.1%). The other main reasons that were identified were loss of income (13.2%), losing contact with their project worker (12.9%), a major sudden expense (9.8%) or moving from the area (2.4%).
Table 12: Reasons for dropping out of Saver Plus
Reasons for participants dropping out %
Missed deposits 36.1%
Loss of income 13.2%
Not contactable 12.9%
Major sudden expense 9.8%
Moved out of area 2.4%
Other 17.9%
Unknown 7.4%

This evaluation confirms the ongoing success of the Saver Plus program. Phase Three was conducted across 21 sites and has enrolled over 4,000 participants across Victoria, New South Wales, Queensland, ACT and Tasmania. The participant success levels have continued to exceed international standards of matched savings programs and have also brought wider benefits to participants and the community.
In looking at the savings behaviour of low-income households, there are three broad categories: non-savers; instrumental savers who save for specific purposes; and dedicated savers, who save regularly and continually (Kempson and Finney, 2009). In considering the evaluation results of Saver Plus, it has demonstrated its ability to transform non-savers to instrumental, goal-oriented savers; and prior instrumental savers to dedicated savers.
In addition, through the education program and the opportunity to put the lessons into practice over the period of time in the program, participants reported changed money management behaviour and attitudes that have benefited themselves and their families. Encouragingly, this third evaluation period has continued to show that participants are sharing their experiences with their children who in many cases have adopted savings habits too. Instilling saving behaviour in children is the most important factor in dedicated saving behaviour in adulthood.
Unfortunately, the Global Financial Crisis has impacted the ability of some participants to stay in the program and the drop-out rate has increased somewhat from that of the pilot program. There is a strong correlation between the Consumer Sentiment Index and the drop-out rate. However, the drop-out rate of Saver Plus is still considerably lower than that of international programs.
The cross-sector partnership delivery model is a crucial factor in the success of Saver Plus and is also responsible for facilitating the development of social capital in the communities where it is delivered. The resources, information, skills, and networks that have been developed through Saver Plus have the potential to create long-lasting impacts on participants and their communities.
43–44
17. Conclusion

18. References
Althaus, C., Bridgman, P. and Davis, G. (2007), The Australian Policy Handbook. 4th ed. Crows Nest: Allen and Unwin.
ANZ (2008), ANZ Survey of Adult Financial Literacy in Australia. The Social Research Centre.
Atkinson, A., McKay, S., Kempson, E. and Collard, S. (2006), Levels of Financial Capability in the UK: Results of a Baseline Survey. Report for the Financial Services Authority.
Australian Bureau of Statistics (2004), 2000-2001 Household Income and Income Distribution, ABS: Canberra.
Australian Bureau of Statistics (2002), Australian Social Trends 2002, Retrieved 30th Jan 2008 from Australian Bureau of Statistics website:
http://www.abs.gov.au/AUSSTATS/[email protected]/Previousproducts/968DA9850C931BE6CA2570EC000B715F?opendocument.
Australian Bureau of Statistics (2006), Australian Social Trends 2006, Retrieved 11th Feb 2008 from Australian Bureau of Statistics website:
http://www.abs.gov.au/AUSSTATS/[email protected]/DetailsPage/4102.02006?OpenDocument.
Australian Bureau of Statistics (2007a), Spotlight on National Accounts, 2007: Household Saving Ratio, Australian Bureau of Statistics Catalogue No. 5202.0.
Australian Bureau of Statistics (2007b), Australian Social Trends 2007, Article: Low Income Low Wealth Households, Australian Bureau of Statistics Catalogue No. 4102.0.
Barr, M.S. (2008), Behaviourally Informed Home Mortgage & Financial Services Regulation. Presentation at Assets for Learning Conference, Washington DC. September 11-13, 2008.
Braunstein, S. & Welch, C. (2002), ‘Financial Literacy: An Overview of Practice, Research, and Policy’, in Federal Reserve Bulletin, November, pp. 445-457.
Burchardt, T., Le Grand, J., and Piachaud, D. (2002). ‘Degrees of exclusion: developing a dynamic,
multidimensional measure’, in J. Hills, J. Le Grand and D. Piachaud (eds). Understanding Social Exclusion. Oxford: Oxford University Press, pp 30-43.
Carpenter, E. (2008), Major Findings from the IDA Research in the United States. Centre for Social Development, Washington University in St Louis. CSD Research Report No. 08-04.
Chant Link and Associates (2004), A Report on Financial Exclusion in Australia. ANZ.
Chant Link and Associates (2009). Understanding the Success of Saver Plus - Summary Report, ANZ.”
Commonwealth Bank of Australia (2007), Borrowing and Lending, Retrieved 27th Sep 2009 from http://www.dollarsandsense.com.au/BorrowingAndLending/australians_and_debt.asp.
Consumer Affairs Victoria (2005), Consumer Credit Review: Issues Paper.
DeMarco, D., Mills, G. and Ciurea, M. (2008) Assets for Independence Act Evaluation, Retrieved on 5th Mar 2008 from US Department of Health and Human Services website:
http://www.acf.hhs.gov/programs/ocs/afi/AFI_Final_Process_Study.pdf.
Eardley, T. (2004), Australian Social Trends 2004, Retrieved 30th Jan 2008 from Australian Bureau of Statistics website: http://www.abs.gov.au/AUSSTATS/[email protected]/Previousproducts/8D441B3151E9E159CA256EA80000EA10?opendocument.
Fry, T., Mihajilo, S., Russell, R. and Brooks, R. (2008), ‘The factors influencing saving in a matched savings program: Goals, Knowledge of payment instruments and other behaviour’, in the Journal of Family and Economic Issues, 29, pp. 234-250.
Gilchrest, A. (1998), ‘A more excellent way: developing coalitions and consensus through informal networking’ in Community Development Journal, 33 (2), pp. 100-108.
Glass J.C. and Kilpatrick, B.B. (1998),’Financial Planning for Retirement: An Imperative for Baby Boomer Women’, in Educational Gerontology, 24(6), pp. 595-617.
Han, C. and Sherraden, M. (2007), Do Institutions Really Matter for Saving Among Low-income Households? A comparative approach. CSD Working Papers No. 07 – 26. Washington University in St Louis.
Headey, B., Warren, D. and Harding, G. (2006), Families, income and jobs: A statistical report of the HILDA survey, Melbourne Institute of Applied Economic and Social Research, University of Melbourne.
Headey, B. and Warren, D. (2007), Families, income and jobs, volume 2: A statistical report on waves 1 to 4 of the HILDA survey, Melbourne Institute of Applied Economic and Social Research, University of Melbourne.
Kempson, E., McKay, S. and Collard, S. (2005), Incentives to save: Encouraging saving among low-income households. Final report on the Saving Gateway pilot project. London: HM Treasury.

45–46
Kempson, E. and Finney, A. (2009), Saving in lower-income households: A review of the evidence. Personal Finance Research Centre, Bristol.
Kingwell, P., Dowie, M., Holler, B., Vincent, C., Gyarmati, D., and Cao, H. (2005), Design and Implementation of a Program to help the poor save: The Learn$ave Project, Retrieved on 5th Mar 2008 from Social Research and Demonstration Corporation: http://www.srdc.org/uploads/learnsave_implementation.pdf.
Lombe, M. and Sherraden, M. (2005), Impact of Asset Ownership on Social Inclusion. CSD working paper no. 05-06, Center for Social Development, Washington University.
Packer, J., Spence, R., Beare, E. (2002), ‘Building community partnerships: an Australian case study of sustainable community-based rural programmes’ in Community Development Journal, 37 (4), pp. 316-326.
Reserve Bank of Australia (2009), Lending Finance, Australia, Jul 2009, Retrieved 28th Sep 2008 from Australian Bureau of Statistics website:
http://www.abs.gov.au/AUSSTATS/[email protected]/DetailsPage/5671.0Jul%202009?OpenDocument.
Rogaly, B. (1999), ‘Introduction’, in B. Rogaly, T. Fisher and E. Mayo (eds). Poverty, Social exclusion and microfinance in Britain. Great Britain: Oxfam.
Rogaly, B. and Fisher T. (1999), ‘Poverty and social inclusion in Britain: Where finance fits’, in B. Rogaly, T. Fisher and E. Mayo (eds). Poverty, Social exclusion and microfinance in Britain. Great Britain: Oxfam.
Rohe, W. M., Gorham, L. S. and Quercia, R. G. (2005), ‘Individual Development Acounts: Participants’
Characteristics and Success’, in Journal of Urban Affairs, 27 (5), pp. 503-520.
Rowlingson, K., Whyley, C., and Warren, T. (1999), Income, Wealth and the Lifecycle. London: Policy Studies Institute.
Russell, R., Brooks, R., Nair, A. and Fredline, L. (2005), Saver Plus: Improving Financial Literacy Through Encouraging Savings, Report for ANZ.
Russell, R. Joymungul, Y. and Brooks, R. (2007), Saver Plus Interim Evaluation April 2006 – April 2007. Report for ANZ.
Russell, R., Mihajilo, S., Nair, A. and Brooks, R. (2006), Saver Plus – Encouraging Savings and Increasing Financial Capabilities Among Low-Income Families. Report for ANZ.
Schreiner, M. and Sherraden, M. (2005), ‘Drop-out From Individual Development Accounts: Prediction and Prevention’, in Financial Services Review 14, pp. 37-54.
Watson, J. and McNaughton, M., (2007), ‘Gender Differences in Risk Aversion and Expected Retirement Benefits’, in Financial Analysts Journal, 63(4), pp. 52-62.
Whyley, C., and Kempson, E. (2000), Understanding Small Savers. Peterborough: AMP.
World Bank (2009), Social Capital for Development, Retrieved on 13th Mar 2009 from the Washington DC: World Bank website: http://go.worldbank.org/K4LUMW43B0.
