save or borrow – what determines russian households ... · * the study was implemented in the...
TRANSCRIPT

BOFIT Discussion Papers
28 2011
Maria Semenova
Save or borrow – what determines Russian households’ financial strategies?
Bank of Finland, BOFIT Institute for Economies in Transition

BOFIT Discussion Papers
Editor-in-Chief Laura Solanko
BOFIT Discussion Papers 28/2011
1.11.2011
Author: Maria Semenova
Save or borrow – what determines Russian households’ financial strategies?
ISBN 978-952-462-723-8
ISSN 1456-5889
(online)
This paper can be downloaded without charge from http://www.bof.fi/bofit
Suomen Pankki
Helsinki 2011
BOFIT- Institute for Economies in Transition Bank of Finland
BOFIT Discussion Papers 28/ 2011
3
Contents
Abstract .................................................................................................................................. 5
Tiivistelmä ............................................................................................................................. 6
1 Introduction .................................................................................................................... 7
2 Methodology and Data ................................................................................................. 11
3 Becoming a saver or a borrower: results ...................................................................... 18
4 How much to save or to borrow: results ...................................................................... 22
5 Robustness checks: financial strategies at the edge of financial crisis ........................ 27
6 Conclusion .................................................................................................................... 29
References ........................................................................................................................... 31
Appendix ............................................................................................................................. 33

Maria Semenova Save or borrow - what determines Russian households’ financial strategies?
4
All opinions expressed are those of the authors and do not necessarily reflect the views of
the Bank of Finland.

BOFIT- Institute for Economies in Transition Bank of Finland
BOFIT Discussion Papers 28/ 2011
5
Maria Semenova*
Save or borrow – what determines Russian households’ financial strategies?
Abstract
This paper examines what influences Russian households‟ decisions to save and borrow.
We use the 2008 data from the 17th round of the Russia Longitudinal Monitoring Survey
(RLMS-HSE). Our results show that the determinants of saving and borrowing are not only
those suggested by economic theory but also include psychological and sociological con-
siderations: smarter respondents, who are satisfied with their lives and inclined to help
other people, are more likely to save. Those who enjoy stable or improving financial condi-
tions and/or are satisfied with them are more likely to save and less likely to borrow. Fi-
nancial literacy, a factor cited by institutional theory as positive for both saving and bor-
rowing from banks, lost its significance at the onset of the financial crisis. Household in-
come, suggested by economic theory as a basis for choosing a financial strategy, was found
to have much less influence on savings and to have a positive influence on borrowing, con-
firming the rationing theory rather than inter-temporal choice theory. Surprisingly, the fear
of job loss does not make people save more, contrary to the precautionary motive.
JEL: D14, D91, G21
Keywords: household, Russia, saving, bank loans
* The study was implemented in the framework of the Basic Research Program of the Higher School of Eco-
nomics in 2011.
I am grateful to Aaron Mehrotra, Laura Solanko and all participants in the BOFIT Seminar on December 29,
2010 for a lively discussion of the initial results from this project and for useful advice on how to improve the
paper.
E-mail: [email protected]
Researcher, International Laboratory for Institutional Analysis of Economic Reforms,
Center for Institutional Studies, NRU HSE, Moscow, Russia
Maria Semenova Save or borrow - what determines Russian households’ financial strategies?
6
Maria Semenova
Save or borrow – what determines Russian households’ financial strategies?
Tiivistelmä
Tutkimuksessa tarkastellaan kotitalouksien säästämiseen ja lainanottoon vaikuttavia teki-
jöitä Venäjällä tuoreen poikkileikkausaineiston avulla. Tulokset korostavat psykologisten
ja sosiologisten tekijöiden merkitystä kotitalouksien päätöksenteossa. Elinoloihinsa tyyty-
väiset vastaajat säästävät muita useammin. Kotitalouksien tuloilla oli vain vähän vaikutusta
säästämiseen, mutta positiivinen vaikutus lainanottoon. Vastoin odotuksia epävarmuus
työpaikasta ei lisännyt kotitalouksien säästämistä.
JEL:D14, D91, G21
Asiasanat: kotitaloudet, Venäjä, säästäminen, lainanotto
BOFIT- Institute for Economies in Transition Bank of Finland
BOFIT Discussion Papers 28/ 2011
7
1 Introduction
Consideration of what determines household financial strategies is not new in economic
theory. As the OECD report (2002) suggests, “…as one of the key variables determining
individual welfare and quality of life, consumption has dominated much of the microeco-
nomic debate dating back to John Stuart Mill and the classical economists of the 18th and
19th centuries.” (p.61). Two financial strategies related to consumption optimization over
time are usually analyzed starting with the first models of households‟ inter-temporal
choice. Having the possibility to store financial assets and to access the credit market, a
household chooses a borrower or saver strategy.
These two strategies at least partly ensure the efficiency of banking-system trans-
mission mechanisms. A lack of savings undermines the flow of funds into bank deposits.
Low demand for bank loans and dominance of loans from private third parties reduce
banks‟ profits and diversification possibilities even if the market is not affected by the
problem of credit rationing.
In this paper we aim to determine the factors that influence Russian households‟
decisions on whether to save and/or borrow. In respect of those who choose one of these
strategies, we analyze the determinants of exposure to the strategy, namely, the amount of
funds saved or borrowed. We use the 2008 cross-section survey data from the 17th
round of
the Russia Longitudinal Monitoring Survey (RLMS-HSE). Because this round took place
in late 2008, we also examine financial strategies at the start of the financial crisis.
According to standard inter-temporal theory, saving and borrowing depend on the
household‟s current income, expected future income and the rate of inter-temporal prefer-
ence (discount rate). The equilibrium amounts of savings and borrowing comprise the solu-
tion of a utility maximization problem with an inter-temporal budget constraint. Thus bor-
rowing and saving serve to smoothen consumption over time. However, the literature goes
beyond this theory to add other influences on household decisions as to how much to save
or borrow.
Initially these factors were tested with macro-data. For example, the determinants
of savings in OECD countries (1975-1995) are analyzed in Callen and Thiman (1997), who
use macro-data and focus primarily on the influence of social security and welfare systems
on the ratio of household savings to GDP. Besides showing that direct taxes and govern-
ment transfers have negative impacts on saving, they demonstrate that income has a posi-
Maria Semenova Save or borrow - what determines Russian households’ financial strategies?
8
tive effect and unemployment a negative effect (so that no precautionary savings effect
was found). Loayza et al (2000) present an overview of several studies relating to private
savings in developing countries, all of which are based on macro-data. The results suggest
that income has a positive effect on savings; the influence of age is U-shaped; and uncer-
tainty (measured by inflation or urbanization variables – for rural areas the uncertainty is
considered to be higher) provides additional incentive to save. An earlier paper by
Schmidt-Hebbel et al (1992) presents evidence on household saving determinants in ten
developing countries in 1970-1985. They find a positive influence for income but not for
inflation.
However, moving from the life-cycle or permanent income hypothesis to studying
the influence of personal and psychological characteristics (Thaler, 1990, 1994) as well as
social and institutional factors (Han, Sherraden, 2009) complicates the empirical testing of
aggregated macro-data. As suggested by Deaton (1997), Miles (1997) and many others, to
probe deeper into household motivation one needs to switch from macro-level to individ-
ual-level or household-level data (surveys or personal files). This type of data enables one
to control for personal, social and institutional factors. An example of such a study is Har-
ris et al (1999), which studies the determinants of saving in Australia using household sur-
vey data and examines the risk-aversion motive for saving. These results confirm the pre-
cautionary motive, showing that respondents who are pessimistic or uncertain about future
incomes save more. The authors also provide some evidence for the relative income hy-
pothesis by showing that social factors are important and that higher relative income leads
to higher savings. Webley and Nyhus (2006), using data from Dutch household surveys,
demonstrate that social factors and the environment in which a person grows up strongly
influence his incentive to save. For instance, parents‟ saving habits and living principles
are statistically significant for their children‟s savings. Even genetic factors proved to exert
an influence on financial strategies. Based on data on Swedish twins, Barnea, Cronqvist
and Siegel (2010) show that even if they grow up in different environments and have dif-
ferent life experiences a pair of twins will have similar investment strategies. Han and
Sherraden (2009) provide evidence that institutional factors may stimulate savings and that
financial education/literacy is among the most important determinants of savings (at least
for lower-income households in the Individual Development Account program).
There are relatively few papers that bring to light peculiarities of saving determi-
nants in transition economies. Denizer et al (2002) analyze determinants of savings in Bul-
BOFIT- Institute for Economies in Transition Bank of Finland
BOFIT Discussion Papers 28/ 2011
9
garia, Hungary and Poland, using survey data. They find a positive – albeit rather small –
linear influence of age (in contrast to the U-shaped relationship for developed and develop-
ing countries). Employment is not highly significant, and the education of the head of
household has a negative effect on the propensity to save. Kulikov et al (2007) analyze the
determinants of household savings in Estonia and find some income and wealth effects, eg
that higher income increases savings whereas holdings of durables and financial assets re-
duce them. The latter is shown to be true for Russian households by Foley and Pyle (2005)
who also show that savings are sensitive to transitory income, measured as income from
household production and private transfers. The savings of Russian households also seem
to be based on a precautionary savings motive. The probability of the head of household
being fired stimulates saving, as Guariglia and Kim (2001) show using data for 1994-2000,
which was a period of political, economic and institutional instability in Russia.
One of the problems in credit markets, which pushes them away from the inter-
temporal choice model equilibria, is liquidity constraints due to credit rationing, as sug-
gested by Stiglitz and Weiss (1981). Most of the papers dealing with the determinants of
borrowing behavior analyze bank loans and concentrate on credit rationing factors and li-
quidity constraints (see Magri (2007) for an overview of this literature).
An exception is Diagne (1999), who analyses both formal and informal credit
markets in Malawi, though focusing on credit constraint determinants (based on the 1995
survey of rural households participating in special microcredit programs). It is shown that
formal and informal credit markets are not substitutes for each other but instead serve dif-
ferent purposes (investment and personal use respectively).
Also in contrast to many others, Magri (2007) clearly differentiates between de-
mand (households willing to apply) and supply (households that apply but are rejected)
factors for household debt in Italy. Using the results of household surveys, she demon-
strates that age is a demand factor that increases the probability of becoming a borrower (at
least up to a certain point). However, household income, which has a similar influence,
seems to be a supply factor. The latter is true for the amount borrowed.
The literature on borrowing does not take account of a wide range of factors dis-
cussed in the savings literature, such as personal and psychological characteristics, self-
esteem and social status, and financial literacy.
Our study adds to these two streams of literature in the following ways. First, we
analyze the choice between two types of financial strategies, rather than concentrating

Maria Semenova Save or borrow - what determines Russian households’ financial strategies?
10
solely on saving or borrowing behavior. This allows us to analyze households‟ motivations
for involvement in the financial markets.
Secondly, we go beyond income and wealth analysis, which are performed by
other authors dealing with Russian data. We include households‟ expectations and self-
esteem among the factors that may influence their choices. In fact, the household may not
save and may be out of the credit market due to its own-life (dis)satisfaction or a sense of
being richer or poorer than others. We also suggest that financial literacy/experience may
be a factor that stimulates saving and borrowing. Households may be more involved be-
cause they know more about financial strategies themselves or have the experience of par-
ticipating in the financial markets (eg Semenova (2008) suggests that Russian depositors
use of payroll cards increases their probability of having a long-term deposit in a bank).
We use recent survey data for a post-Soviet country, including the period of fi-
nancial crisis, 2008-2009. The propensity to save dropped significantly in 2008, from a his-
torically stable 10 percent of total income, and rose again in 2009 to 15 percent, albeit the
factors triggering the changes were ambiguous. As for the consumer loan market, the pe-
riod of financial instability witnessed a drop in both demand and supply of consumer loans,
which may indicate that households switched from formal to informal credit markets.
However, after the crisis the banks, being willing to increase lending, may face demand
problems if the market is greatly influenced by the demand-side factors and these are more
fundamentally undermined by financial instability.
The survey allows one to concentrate on self-reported financial strategies. In con-
trast to other studies, we adopt the respondents‟ view of being a saver or a borrower. If
there is a gap between total income and spending, this need not mean that the household is
a saver. If the household does not report itself as a saver this may signal that the difference
cannot be invested because it is reserved for necessary future expenditures. As for bank
loans, self-reporting is the only way to reveal them, given a lack of access to private bank
data.
The rest of the paper is organized as follows. Section 2 describes the data and
methodology. Sections 3 and 4 present the results of regression analysis, ie the factors that
influence the propensity to use different financial strategies and the scope of the exposure.
In Section 5 we offer robustness checks of the results, using data on financial strategies at
the edge of financial crisis. Section 6 concludes.

BOFIT- Institute for Economies in Transition Bank of Finland
BOFIT Discussion Papers 28/ 2011
11
2 Methodology and Data
We use the unique dataset originating from the 17th
round of the Russia Longitudinal
Monitoring Survey of HSE (RLMS-HSE)1, which is a series of nationally representative
surveys2 designed to monitor the effects of Russian reforms on the health and economic
welfare of households and individuals in Russia. The surveys, which gather data on Rus-
sian households‟ income, expenditures and welfare, have been conducted 18 times since
1992. Of these, 15 represent RLMS Phase II, which has been run jointly by the Carolina
Population Center at the University of North Carolina at Chapel Hill and the Demoscope
team in Russia.
Our dataset is based on household and individual surveys. In RLMS-HSE, a
household includes all people living with the respondent and having common income and
expenditures. If the family includes unmarried children under 18, who are not living with
the respondent because they study in a different city, they are also included in the house-
hold. The data of the 17th
round was collected in September – December 2008, which en-
ables us to observe households‟ decisions during the early phase of the financial crisis.
The original database covers approximately 5300 households and 13500 individu-
als. After cleaning the household database and merging it with that for individuals (by head
of household) we end up with 5186 households in our dataset. The number of observations,
however, may differ for different specifications of our econometric model.
1) We study the full range of financial-strategy characteristics available in the
dataset, examining the following:
2) Whether the household has savings
3) Whether the household saved last month (during financial crisis)
4) Whether the household has bank loans
5) Whether the household borrowed from a bank last month
6) (during financial crisis)
7) Whether the household has private loans
8) Whether the household borrowed from private parties last month
(during financial crisis)
9) If so, how much (for all of the above)
10) Whether the household plans to borrow from a bank in the next 12 months
1 Sources: Russia Longitudinal Monitoring survey, RLMS-HSE, conducted by Higher School of Economics,
ZAO Demoscope, Carolina Population Center of the University of North Carolina at Chapel Hill, and the
Institute of Sociology RAS. 2 Sampling details may be found at the RLMS-HSE web-site, http://www.cpc.unc.edu/projects/rlms-
hse/project/sampling

Maria Semenova Save or borrow - what determines Russian households’ financial strategies?
12
For each of these questions except number 7, we introduce a dummy variable
equal to one if a household chooses the corresponding strategy or zero otherwise. For ques-
tion 9 we introduce eight variables equal to the corresponding amounts of savings, borrow-
ing and loans (for those observations with corresponding Dummy equal to one). We use
the “during financial crisis” variables for robustness checks. The details of these depend-
ent variables (DepVars) will be discussed below.
As different theories suggest, the following groups of factors may influence the
household‟s choice of financial strategy and the extent to which it is exposed to the chosen
strategy:
1) Current and future income
2) Personal characteristics
3) Employment characteristics
4) Self-esteem and social characteristics
5) Financial literacy and experience
To determine the influence of different groups of factors on household strategy
choice as well as on the amount of savings and loans for those who chose any strategy, we
run the following regressions. The basic model includes only standard inter-temporal
choice theory variables and control variables:
iii ControlIncomefDepVar ,0 (1)
The first extended model takes account of personal characteristics of the head of
household:
iiii ControlPersonalIncomefDepVar ,,1 (2)
The second extended model is estimated for those heads of household who are
employed and includes the length of the working week as well as work satisfaction and
fear of job loss:
iiii ControlLabourIncomefDepVar ,,2 (3)
The third extended model controls for the household‟s self-estimation of financial
situation, trajectory of development and relative richness and respect of others:
iiii ControlSocialIncomefDepVar ,,3 (4)
The forth extended model includes the financial literacy variable:
iiii ControlFinLitIncomefDepVar ,,4 (5)
BOFIT- Institute for Economies in Transition Bank of Finland
BOFIT Discussion Papers 28/ 2011
13
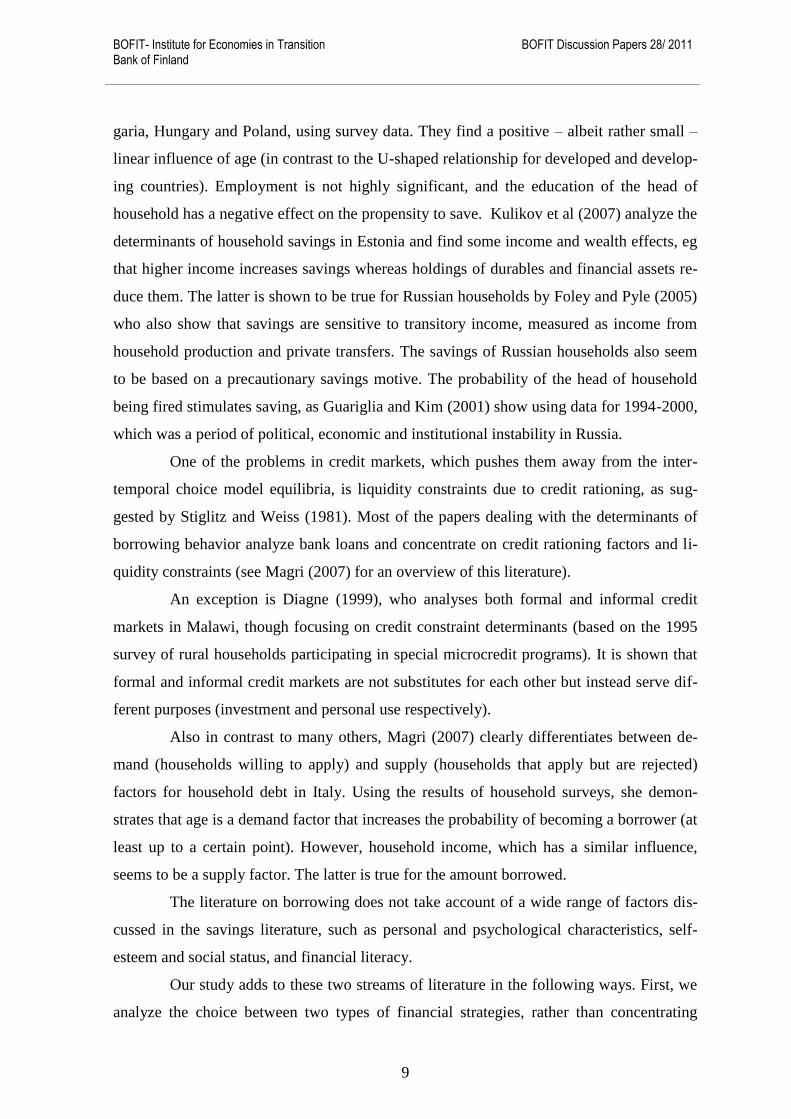
The last model, used in robustness checks, is aimed to control for relationships
obtained in the previous stages and includes all groups of factors except employment char-
acteristics (in order not to limit the sample to households where the head is employed):
iiiiii ControlFinLitSocialPersonalIncomefDepVar ,,,,5 (6)
We estimate robit models for strategy choice variables and OLS for the amounts
of savings and loans (with Heckman maximum likelihood correction). We cluster the er-
rors by region.
Table 1 includes all dependant variables describing the measurement methodology.
Table 1 Financial strategy variables
Variable N Avg S.E. Min. Max. Description/survey question
savings 5186 0.205 0.404 0.000 1.000 How much did your family manage to save, i.e., what
savings does your family have today - at home or on
bank deposit, or in floater? If the debt is estimated in
other currency, please convert it into rubles (if the
amount exceeds zero, this denotes that savings variable
equals to 1)
savings_am* 1063 38.624 65.705 0.100 1000.000
savings_c 5186 0.141 0.348 0.000 1.000 Did your family in the last 30 days save any money?
sav-
ings_c_am* 618 8.953 15.877 0.100 250.000
How many rubles‟ worth did your family save in the
last 30 days?
bloan 5186 0.267 0.442 0.000 1.000 Does your family have any credit debts today?
bloan_am* 1249 135.687 410.349 0.056 10700.000 How much money does your family owe in credit to-
day? If the debt is estimated in other currency, please
convert it into rubles.
bloan_c 5186 0.027 0.163 0.000 1.000 In the last 30 days, did your family take money on cre-
dit?
bloan_c_am* 132 61.910 139.103 1.100 1100.000 How much in rubles?
loanplan 5186 0.035 0.183 0.000 1.000 Are you going to borrow money from a bank in the
next 12 months?
ploan 5186 0.072 0.259 0.000 1.000 Does your family have any money debts to private
persons today?
ploan_am* 375 20.924 45.964 0.080 350.000 How much money does your family owe in credit to-
day? If the debt is estimated in other currency, please
convert it into rubles
ploan_c 5186 0.062 0.240 0.000 1.000 In the last 30 days, did your family borrow money from
private persons?
ploan_c_am* 302 13.927 45.087 0.100 480.000 How much in rubles?
* - in thousands of rubles
Thus, over 20 percent of the respondents claim to have some savings. The average amount
of savings is 38.5 thousand rubles. As for the crisis period, only 14 percent of the house-
holds saved anything, and the average amount is much lower, 9 thousand rubles.
Borrowers are even more frequent among respondents – 27 percent of the house-
holds borrow from a bank (another 3 percent plan to borrow next year), 7 percent borrow
from private parties. The average bank loan is for 136 thousand rubles, and only 21 thou-
sand rubles on average was borrowed privately. The crisis undermined bank borrowing -
only 3 percent of the households borrowed from a bank in the last 30 days, the average
Maria Semenova Save or borrow - what determines Russian households’ financial strategies?
14
amount being 62 thousand rubles - but did not greatly reduce private borrowing (6 percent
and 14 thousand respectively).
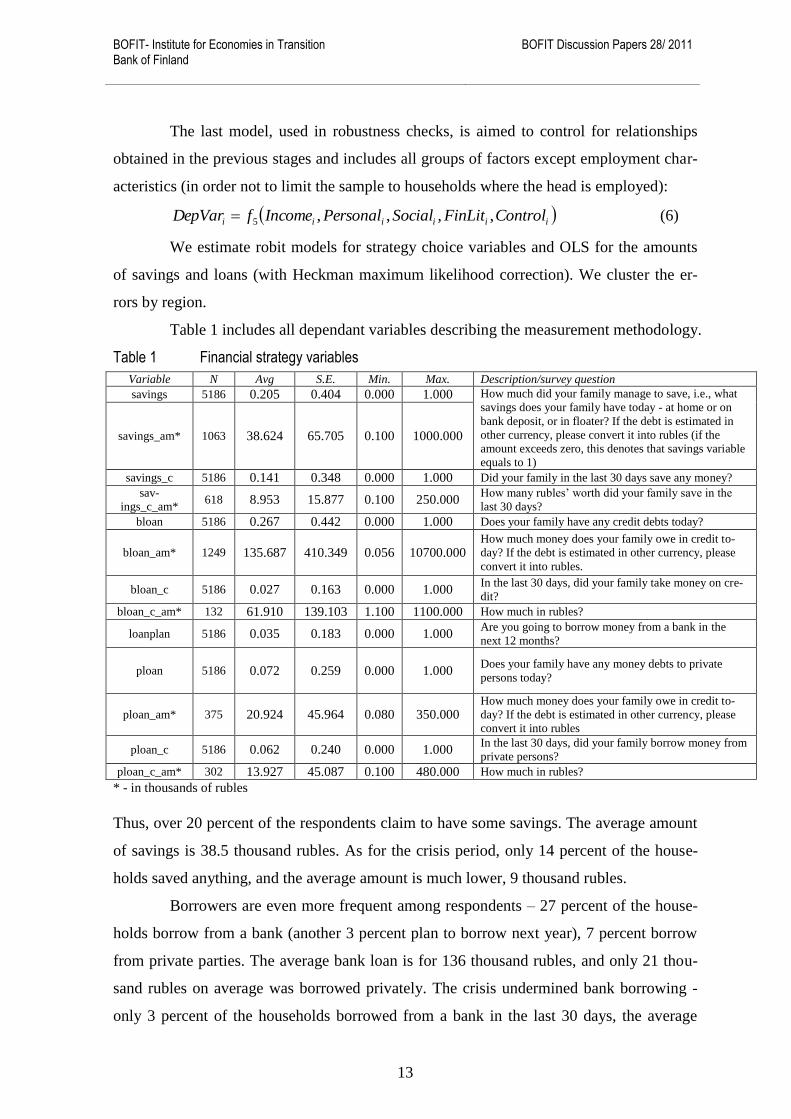
The next six tables present the groups of factors which may influence households‟
financial strategies. Table 2 presents the income variables. The average household monthly
income does not exceed 25 thousand rubles. Less than half (40 percent) of the respondents
said they expect no change in their financial situation during the next year, another 20 per-
cent believed they would earn more.
We expect that households with higher incomes and worse prospects will save
more often and more in total. Borrowings will depend on demand or supply conditions. For
a market without credit rationing, we expect those with higher incomes and better pros-
pects to borrow less frequently and less in total, and vice versa in the case of credit ration-
ing.
Table 2 Income variables
Variable N Avg S.E. Min. Max. Description/survey question
income* 4894 24.971 38.702 0 1148 Household income, last 30 days
fin_nochange12 2920 0.725 0.446 0 1
Do you think that in the next 12 months you and your family will
live better than today or worse? 1 - "Nothing will change", 0 -
"You will live much worse" or "You will live somewhat worse"
fin_better12 1864 0.567 0.495 0 1
Do you think that in the next 12 months you and your family will
live better than today or worse? 1 - "You will live much better" or
"You will live somewhat better", 0 - "You will live much worse"
or "You will live somewhat worse"
* - in thousands of rubles
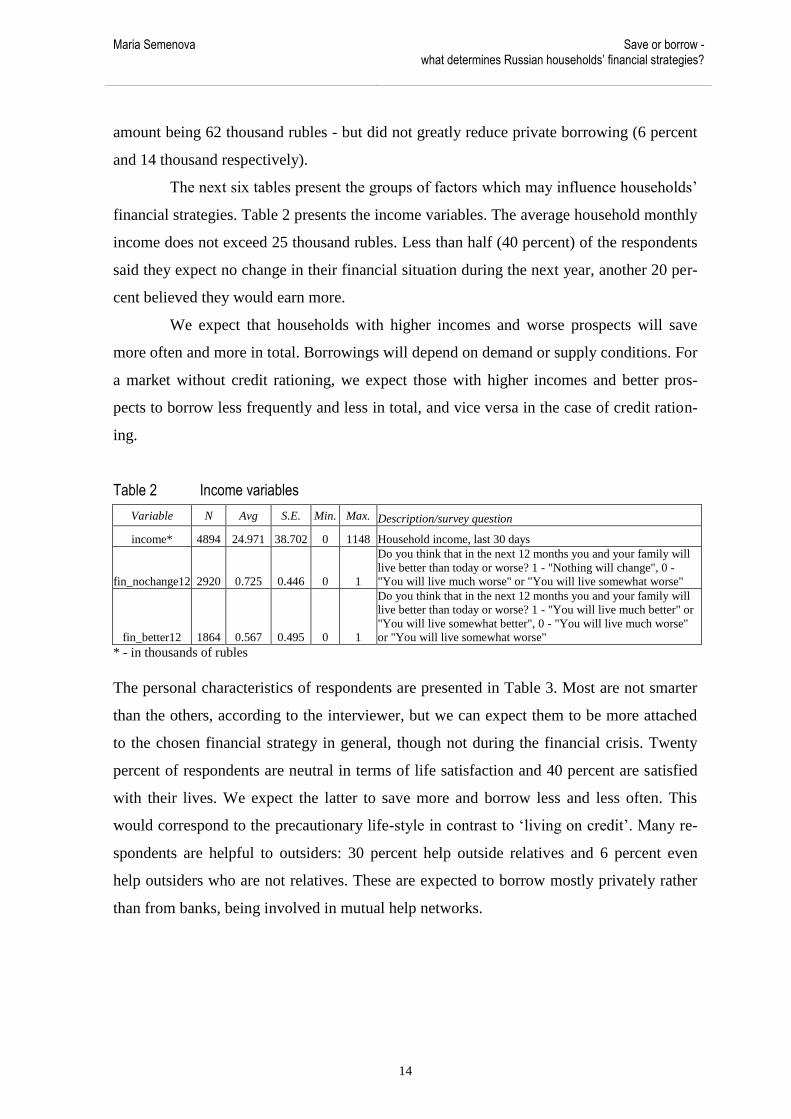
The personal characteristics of respondents are presented in Table 3. Most are not smarter
than the others, according to the interviewer, but we can expect them to be more attached
to the chosen financial strategy in general, though not during the financial crisis. Twenty
percent of respondents are neutral in terms of life satisfaction and 40 percent are satisfied
with their lives. We expect the latter to save more and borrow less and less often. This
would correspond to the precautionary life-style in contrast to „living on credit‟. Many re-
spondents are helpful to outsiders: 30 percent help outside relatives and 6 percent even
help outsiders who are not relatives. These are expected to borrow mostly privately rather
than from banks, being involved in mutual help networks.
BOFIT- Institute for Economies in Transition Bank of Finland
BOFIT Discussion Papers 28/ 2011
15
Table 3 Personal characteristics
Variable N Avg S.E. Min. Max. Description/survey question
smart_same* 4715 0.936 0.244 0 1 The respondent was 1 - as bright as the majority of respondents,
0 - slow-witted
smart_more* 5163 0.087 0.282 0 1 The respondent was 1 - notably brighter than the majority
of respondents, 0 - slow-witted
life_sat 3112 0.388 0.487 0 1 Life satisfaction: 1 - Neutral, 0 - "Rather dissatisfied"
or "Fully dissatisfied"
life_sat_more 3952 0.518 0.500 0 1 Life satisfaction: 1 - "Fully satisfied" or "Rather satisfied",
0 - "Rather dissatisfied" or "Fully dissatisfied"
help_in 5186 0.325 0.469 0 1 Do you help you relatives, who are not in the household?
1 - Yes, 0 - otherwise
help_out 5186 0.061 0.240 0 1 Do you help other people, who are not in the household?
1 - Yes, 0 - otherwise
*According to the interviewer
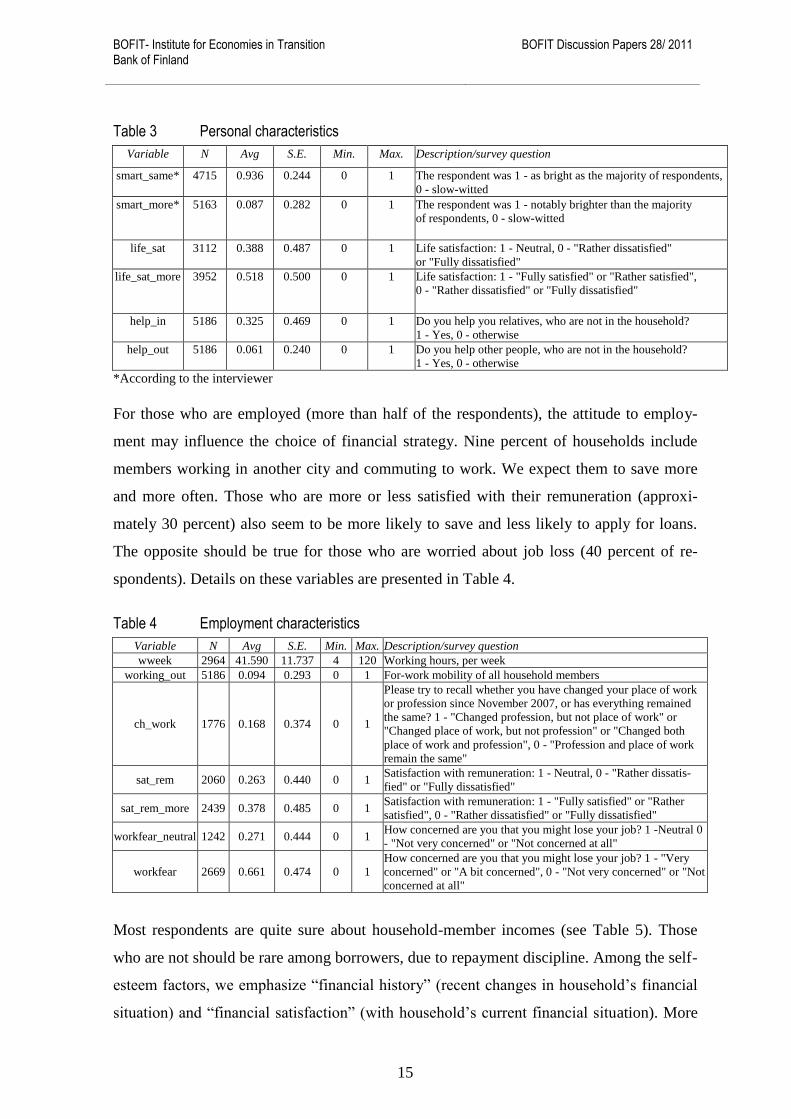
For those who are employed (more than half of the respondents), the attitude to employ-
ment may influence the choice of financial strategy. Nine percent of households include
members working in another city and commuting to work. We expect them to save more
and more often. Those who are more or less satisfied with their remuneration (approxi-
mately 30 percent) also seem to be more likely to save and less likely to apply for loans.
The opposite should be true for those who are worried about job loss (40 percent of re-
spondents). Details on these variables are presented in Table 4.
Table 4 Employment characteristics
Variable N Avg S.E. Min. Max. Description/survey question
wweek 2964 41.590 11.737 4 120 Working hours, per week
working_out 5186 0.094 0.293 0 1 For-work mobility of all household members
ch_work 1776 0.168 0.374 0 1
Please try to recall whether you have changed your place of work
or profession since November 2007, or has everything remained
the same? 1 - "Changed profession, but not place of work" or
"Changed place of work, but not profession" or "Changed both
place of work and profession", 0 - "Profession and place of work
remain the same"
sat_rem 2060 0.263 0.440 0 1 Satisfaction with remuneration: 1 - Neutral, 0 - "Rather dissatis-
fied" or "Fully dissatisfied"
sat_rem_more 2439 0.378 0.485 0 1 Satisfaction with remuneration: 1 - "Fully satisfied" or "Rather
satisfied", 0 - "Rather dissatisfied" or "Fully dissatisfied"
workfear_neutral 1242 0.271 0.444 0 1 How concerned are you that you might lose your job? 1 -Neutral 0
- "Not very concerned" or "Not concerned at all"
workfear 2669 0.661 0.474 0 1
How concerned are you that you might lose your job? 1 - "Very
concerned" or "A bit concerned", 0 - "Not very concerned" or "Not
concerned at all"
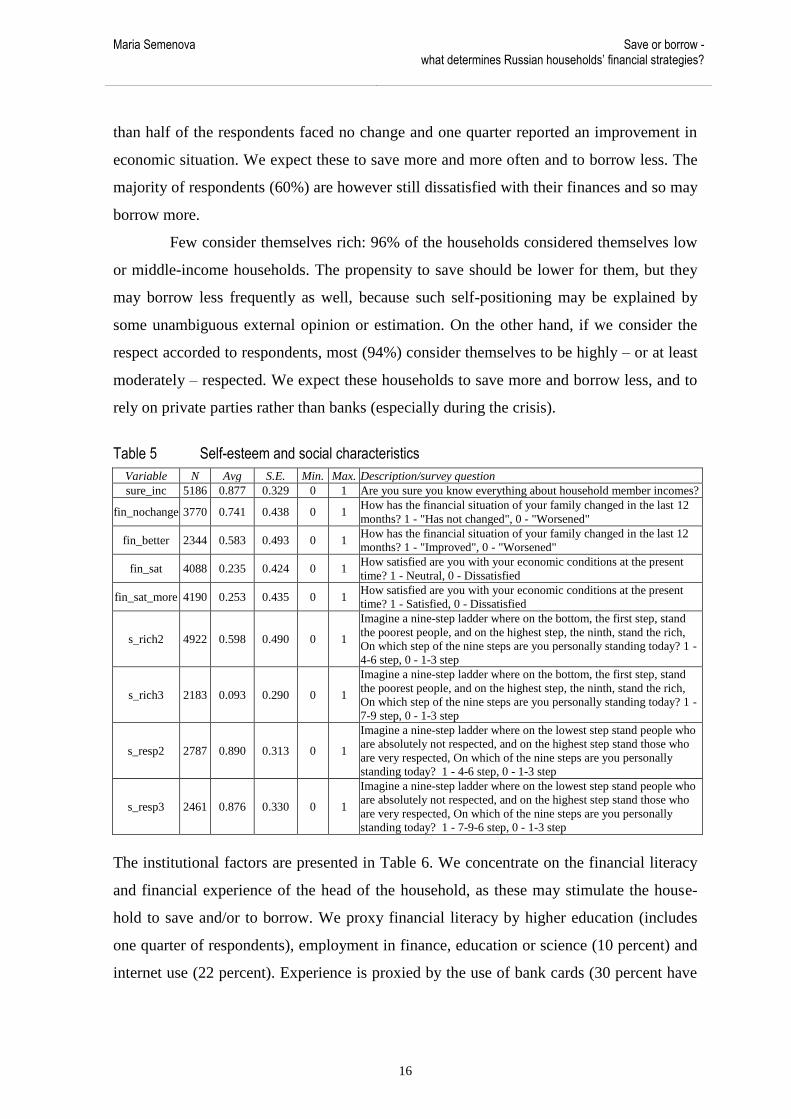
Most respondents are quite sure about household-member incomes (see Table 5). Those
who are not should be rare among borrowers, due to repayment discipline. Among the self-
esteem factors, we emphasize “financial history” (recent changes in household‟s financial
situation) and “financial satisfaction” (with household‟s current financial situation). More
Maria Semenova Save or borrow - what determines Russian households’ financial strategies?
16
than half of the respondents faced no change and one quarter reported an improvement in
economic situation. We expect these to save more and more often and to borrow less. The
majority of respondents (60%) are however still dissatisfied with their finances and so may
borrow more.
Few consider themselves rich: 96% of the households considered themselves low
or middle-income households. The propensity to save should be lower for them, but they
may borrow less frequently as well, because such self-positioning may be explained by
some unambiguous external opinion or estimation. On the other hand, if we consider the
respect accorded to respondents, most (94%) consider themselves to be highly – or at least
moderately – respected. We expect these households to save more and borrow less, and to
rely on private parties rather than banks (especially during the crisis).
Table 5 Self-esteem and social characteristics
Variable N Avg S.E. Min. Max. Description/survey question
sure_inc 5186 0.877 0.329 0 1 Are you sure you know everything about household member incomes?
fin_nochange 3770 0.741 0.438 0 1 How has the financial situation of your family changed in the last 12
months? 1 - "Has not changed", 0 - "Worsened"
fin_better 2344 0.583 0.493 0 1 How has the financial situation of your family changed in the last 12
months? 1 - "Improved", 0 - "Worsened"
fin_sat 4088 0.235 0.424 0 1 How satisfied are you with your economic conditions at the present
time? 1 - Neutral, 0 - Dissatisfied
fin_sat_more 4190 0.253 0.435 0 1 How satisfied are you with your economic conditions at the present
time? 1 - Satisfied, 0 - Dissatisfied
s_rich2 4922 0.598 0.490 0 1
Imagine a nine-step ladder where on the bottom, the first step, stand
the poorest people, and on the highest step, the ninth, stand the rich,
On which step of the nine steps are you personally standing today? 1 -
4-6 step, 0 - 1-3 step
s_rich3 2183 0.093 0.290 0 1
Imagine a nine-step ladder where on the bottom, the first step, stand
the poorest people, and on the highest step, the ninth, stand the rich,
On which step of the nine steps are you personally standing today? 1 -
7-9 step, 0 - 1-3 step
s_resp2 2787 0.890 0.313 0 1
Imagine a nine-step ladder where on the lowest step stand people who
are absolutely not respected, and on the highest step stand those who
are very respected, On which of the nine steps are you personally
standing today? 1 - 4-6 step, 0 - 1-3 step
s_resp3 2461 0.876 0.330 0 1
Imagine a nine-step ladder where on the lowest step stand people who
are absolutely not respected, and on the highest step stand those who
are very respected, On which of the nine steps are you personally
standing today? 1 - 7-9-6 step, 0 - 1-3 step
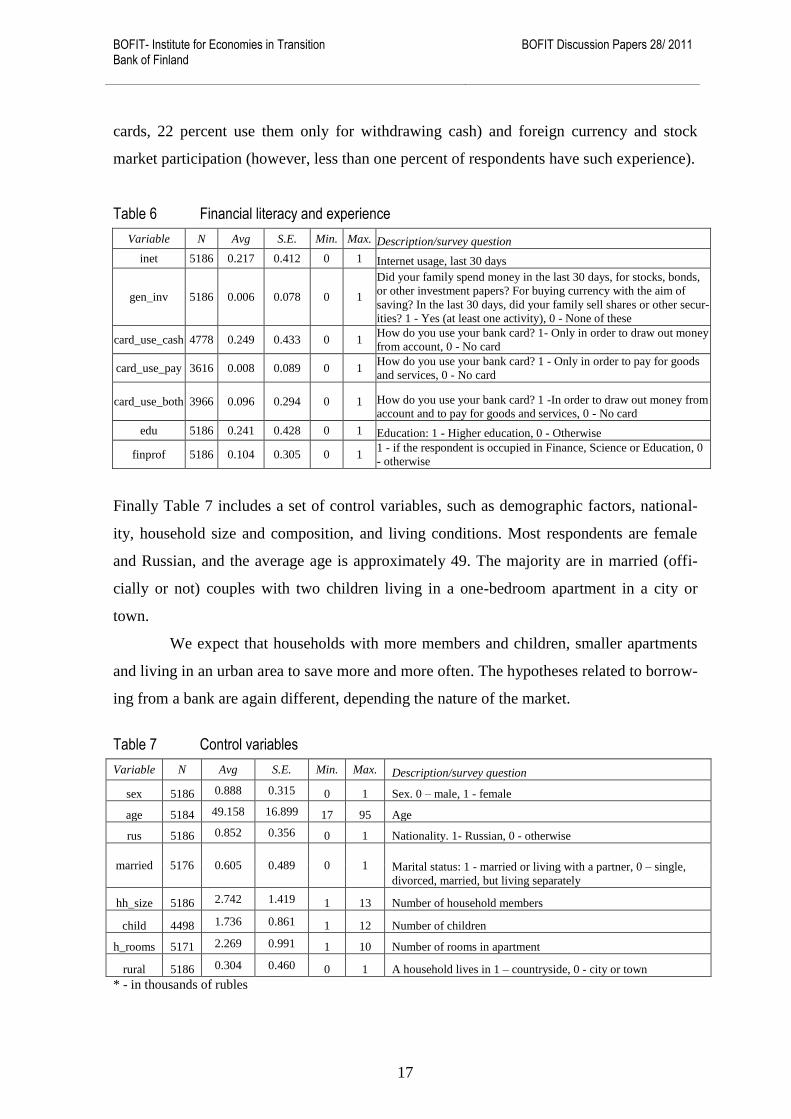
The institutional factors are presented in Table 6. We concentrate on the financial literacy
and financial experience of the head of the household, as these may stimulate the house-
hold to save and/or to borrow. We proxy financial literacy by higher education (includes
one quarter of respondents), employment in finance, education or science (10 percent) and
internet use (22 percent). Experience is proxied by the use of bank cards (30 percent have
BOFIT- Institute for Economies in Transition Bank of Finland
BOFIT Discussion Papers 28/ 2011
17
cards, 22 percent use them only for withdrawing cash) and foreign currency and stock
market participation (however, less than one percent of respondents have such experience).
Table 6 Financial literacy and experience
Variable N Avg S.E. Min. Max. Description/survey question
inet 5186 0.217 0.412 0 1 Internet usage, last 30 days
gen_inv 5186 0.006 0.078 0 1
Did your family spend money in the last 30 days, for stocks, bonds,
or other investment papers? For buying currency with the aim of
saving? In the last 30 days, did your family sell shares or other secur-
ities? 1 - Yes (at least one activity), 0 - None of these
card_use_cash 4778 0.249 0.433 0 1 How do you use your bank card? 1- Only in order to draw out money
from account, 0 - No card
card_use_pay 3616 0.008 0.089 0 1 How do you use your bank card? 1 - Only in order to pay for goods
and services, 0 - No card
card_use_both 3966 0.096 0.294 0 1 How do you use your bank card? 1 -In order to draw out money from
account and to pay for goods and services, 0 - No card
edu 5186 0.241 0.428 0 1 Education: 1 - Higher education, 0 - Otherwise
finprof 5186 0.104 0.305 0 1 1 - if the respondent is occupied in Finance, Science or Education, 0
- otherwise
Finally Table 7 includes a set of control variables, such as demographic factors, national-
ity, household size and composition, and living conditions. Most respondents are female
and Russian, and the average age is approximately 49. The majority are in married (offi-
cially or not) couples with two children living in a one-bedroom apartment in a city or
town.
We expect that households with more members and children, smaller apartments
and living in an urban area to save more and more often. The hypotheses related to borrow-
ing from a bank are again different, depending the nature of the market.
Table 7 Control variables
Variable N Avg S.E. Min. Max. Description/survey question
sex 5186 0.888 0.315 0 1 Sex. 0 – male, 1 - female
age 5184 49.158 16.899 17 95 Age
rus 5186 0.852 0.356 0 1 Nationality. 1- Russian, 0 - otherwise
married 5176 0.605 0.489 0 1 Marital status: 1 - married or living with a partner, 0 – single,
divorced, married, but living separately
hh_size 5186 2.742 1.419 1 13 Number of household members
child 4498 1.736 0.861 1 12 Number of children
h_rooms 5171 2.269 0.991 1 10 Number of rooms in apartment
rural 5186 0.304 0.460 0 1 A household lives in 1 – countryside, 0 - city or town
* - in thousands of rubles

Maria Semenova Save or borrow - what determines Russian households’ financial strategies?
18
3 Becoming a saver or a borrower: results
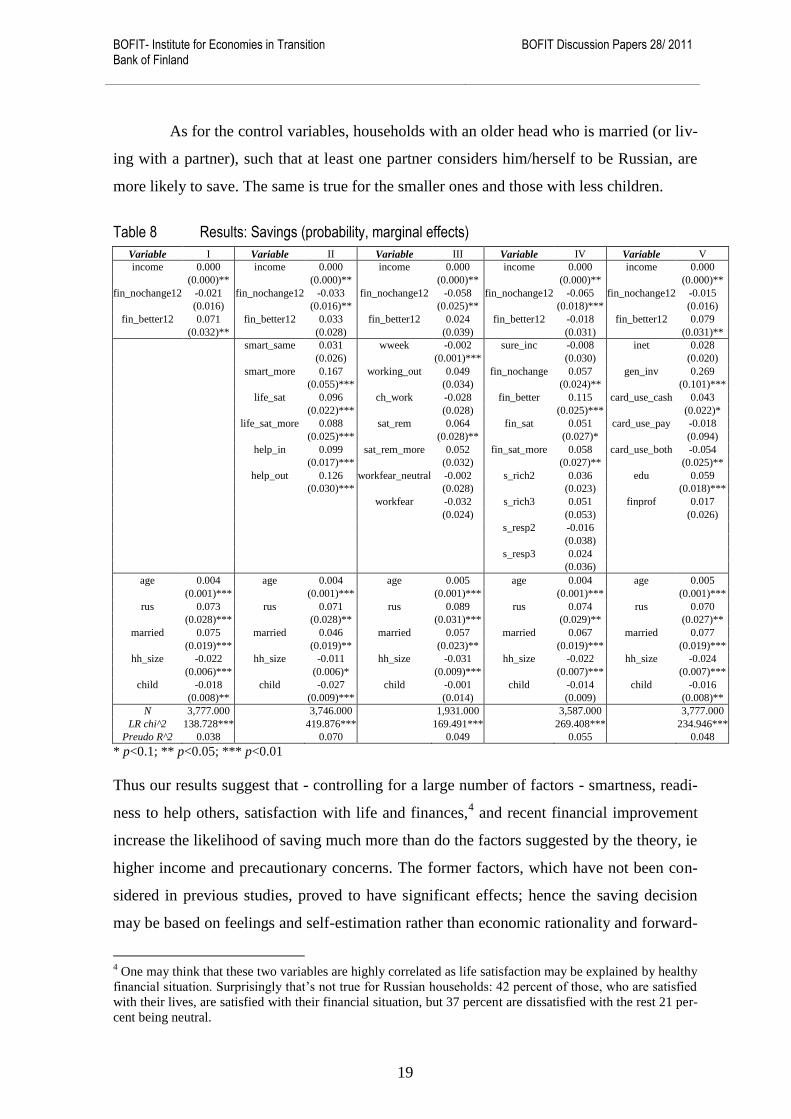
The results for probability of positive savings regressions are presented in Table 83. As the
inter-temporal theory suggests, higher current income increases the probability of saving.
However, the coefficient is very low, so that the economic significance is likely to be mi-
nor. Moreover, expectations about future incomes have a U-shaped effect. Compared to
respondents who expect a deterioration in family finances during the next year, households
expecting no change save less, as predicted by the theory. At the same time, respondents
who expect an increase in wealth save more. Thus the influence of future income is not
fully in accord with the predictions of inter-temporal choice theory.
Respondents‟ personal characteristics proved to be important for the propensity to
save. Controlling for income variables and other basics (age, nationality, marital status,
household size, number of children), the respondents who seem to be the smartest and who
are satisfied with their lives and are used to helping other people (even non-household-
members) are more likely to save.
Working heads of household are more likely to save if they enjoy a shorter work
week or are satisfied with their remuneration. Surprisingly, the fear of being fired does not
stimulate saving.
The personal perception of the household‟s financial situation is significant for the
propensity to save, unlike the perception of financial situation compared to other house-
holds. Those who enjoy stable or improving financial conditions as well as those who are
satisfied with them are more likely to save. The explanation for this could be that they ac-
cumulate a precautionary buffer in the current situation of financial well-being. On the
other hand, feeling richer than others does not stimulate saving.
Finally, financial literacy (in terms of experience and education) promotes saving.
The propensity to save is higher if the head of household has a higher education or the
household has some experience in dealing with financial markets, as is the case for posses-
sion of bank cards and their use in acquiring cash (adding a payment function, however,
reduces the propensity to save). But the use of internet or being in a financial profession
has no effect on savings.
3 Only statistically significant control variables are reported.
BOFIT- Institute for Economies in Transition Bank of Finland
BOFIT Discussion Papers 28/ 2011
19
As for the control variables, households with an older head who is married (or liv-
ing with a partner), such that at least one partner considers him/herself to be Russian, are
more likely to save. The same is true for the smaller ones and those with less children.
Table 8 Results: Savings (probability, marginal effects)
Variable I Variable II Variable III Variable IV Variable V
income 0.000 income 0.000 income 0.000 income 0.000 income 0.000
(0.000)** (0.000)** (0.000)** (0.000)** (0.000)**
fin_nochange12 -0.021 fin_nochange12 -0.033 fin_nochange12 -0.058 fin_nochange12 -0.065 fin_nochange12 -0.015
(0.016) (0.016)** (0.025)** (0.018)*** (0.016)
fin_better12 0.071 fin_better12 0.033 fin_better12 0.024 fin_better12 -0.018 fin_better12 0.079
(0.032)** (0.028) (0.039) (0.031) (0.031)**
smart_same 0.031 wweek -0.002 sure_inc -0.008 inet 0.028
(0.026) (0.001)*** (0.030) (0.020)
smart_more 0.167 working_out 0.049 fin_nochange 0.057 gen_inv 0.269
(0.055)*** (0.034) (0.024)** (0.101)***
life_sat 0.096 ch_work -0.028 fin_better 0.115 card_use_cash 0.043
(0.022)*** (0.028) (0.025)*** (0.022)*
life_sat_more 0.088 sat_rem 0.064 fin_sat 0.051 card_use_pay -0.018
(0.025)*** (0.028)** (0.027)* (0.094)
help_in 0.099 sat_rem_more 0.052 fin_sat_more 0.058 card_use_both -0.054
(0.017)*** (0.032) (0.027)** (0.025)**
help_out 0.126 workfear_neutral -0.002 s_rich2 0.036 edu 0.059
(0.030)*** (0.028) (0.023) (0.018)***
workfear -0.032 s_rich3 0.051 finprof 0.017
(0.024) (0.053) (0.026)
s_resp2 -0.016
(0.038)
s_resp3 0.024
(0.036)
age 0.004 age 0.004 age 0.005 age 0.004 age 0.005
(0.001)*** (0.001)*** (0.001)*** (0.001)*** (0.001)***
rus 0.073 rus 0.071 rus 0.089 rus 0.074 rus 0.070
(0.028)*** (0.028)** (0.031)*** (0.029)** (0.027)**
married 0.075 married 0.046 married 0.057 married 0.067 married 0.077
(0.019)*** (0.019)** (0.023)** (0.019)*** (0.019)***
hh_size -0.022 hh_size -0.011 hh_size -0.031 hh_size -0.022 hh_size -0.024
(0.006)*** (0.006)* (0.009)*** (0.007)*** (0.007)***
child -0.018 child -0.027 child -0.001 child -0.014 child -0.016
(0.008)** (0.009)*** (0.014) (0.009) (0.008)**
N 3,777.000 3,746.000 1,931.000 3,587.000 3,777.000
LR chi^2 138.728*** 419.876*** 169.491*** 269.408*** 234.946***
Preudo R^2 0.038 0.070 0.049 0.055 0.048
* p<0.1; ** p<0.05; *** p<0.01
Thus our results suggest that - controlling for a large number of factors - smartness, readi-
ness to help others, satisfaction with life and finances,4 and recent financial improvement
increase the likelihood of saving much more than do the factors suggested by the theory, ie
higher income and precautionary concerns. The former factors, which have not been con-
sidered in previous studies, proved to have significant effects; hence the saving decision
may be based on feelings and self-estimation rather than economic rationality and forward-
4 One may think that these two variables are highly correlated as life satisfaction may be explained by healthy
financial situation. Surprisingly that‟s not true for Russian households: 42 percent of those, who are satisfied
with their lives, are satisfied with their financial situation, but 37 percent are dissatisfied with the rest 21 per-
cent being neutral.

Maria Semenova Save or borrow - what determines Russian households’ financial strategies?
20
looking expectations. Although the regression dealing with financial literacy provides a
slightly weaker explanation of the data, it seems to show the significance of the factor with
the greatest influence - financial literacy due to financial experience and education. This
corresponds with the results for US data by Han and Sherraden (2009), who however use
different measures of financial literacy.
In analyzing borrowers‟ behavior we concentrate on bank loans. Table 9 presents
the results.
We start with the basic income variables. Households expecting stable or higher
incomes in future are more likely to be borrowers. This corresponds well with inter-
temporal choice theory. At the same time current income has a positive influence on this
probability (albeit very small and unstable). This could mean that supply-side factors out-
weigh demand-side factors: households with lower incomes may be rationed even if they
have a certain demand for bank loans, as current income is one of the most frequently ap-
plied criteria for banks‟ lending decisions.
Personal characteristics are not significant, with one exception: those ready to
help other people outside the household are more likely to borrow. Nor are employment
characteristics important. The only factor that influences the probability of becoming a
bank client is the length of the work week: the more the working hours, the higher the
probability. This can also add to the supply-side story: those who work more may be con-
sidered more reliable borrowers.
Respondents who are satisfied with their household‟s financial situation are less
likely to have a bank loan. Thus a bank loan seems to be a source of dissatisfaction to the
borrower. Quite naturally those who are not quite sure about household income are less
likely to become borrowers.
Financial literacy, proxied by occupation and experience, proved to be significant:
those who actively use bank cards and have finance-related jobs are more likely to be bank
clients.
As for controls, the households with a female, younger or married head or that in-
clude more children or are larger are all more likely to borrow from the bank. This profile
is the opposite of a saving household, and accords better with the demand-side group of
factors.
Thus our results suggest that behind the fact of a household being a bank borrower
is a mixture of supply-side (current and future income) and demand-side factors (larger

BOFIT- Institute for Economies in Transition Bank of Finland
BOFIT Discussion Papers 28/ 2011
21
households with more children). The largest effect is, however, provided by financial liter-
acy (as in case of savings).
Table 9 Results: Bank loans (probability, marginal effects)
Variable I Variable II Variable III Variable IV Variable V
income 0.000 income 0.000 income 0.000 income 0.000 income 0.000
(0.000) (0.000) (0.000)* (0.000) (0.000)
fin_nochange12 0.047 fin_nochange12 0.045 fin_nochange12 0.069 fin_nochange12 0.050 fin_nochange12 0.054
(0.021)** (0.020)** (0.031)** (0.025)** (0.022)**
fin_better12 0.067 fin_better12 0.061 fin_better12 0.104 fin_better12 0.077 fin_better12 0.072
(0.025)*** (0.025)** (0.036)*** (0.028)*** (0.026)***
smart_same 0.040 wweek 0.003 sure_inc -0.077 inet 0.003
(0.035) (0.001)*** (0.037)** (0.021)
smart_more 0.009 working_out 0.010 fin_nochange 0.026 gen_inv -0.032
(0.053) (0.057) (0.022) (0.092)
life_sat 0.019 ch_work 0.015 fin_better 0.043 card_use_cash 0.097
(0.023) (0.035) (0.022)* (0.023)***
life_sat_more 0.004 sat_rem -0.030 fin_sat -0.068 card_use_pay 0.423
(0.019) (0.038) (0.019)*** (0.128)***
help_in 0.047 sat_rem_more -0.029 fin_sat_more -0.084 card_use_both 0.162
(0.019)** (0.031) (0.020)*** (0.044)***
help_out 0.095 workfear_neutral -0.018 s_rich2 0.032 edu -0.008
(0.040)** (0.042) (0.021) (0.016)
workfear 0.004 s_rich3 0.040 finprof 0.060
(0.034) (0.044) (0.028)**
s_resp2 -0.017
(0.035)
s_resp3 0.011
(0.034)
sex 0.085 sex 0.085 sex 0.099 sex 0.071 sex 0.089
(0.020)*** (0.020)*** (0.040)** (0.021)*** (0.020)***
age -0.008 age -0.008 age -0.008 age -0.007 age -0.007
(0.001)*** (0.001)*** (0.001)*** (0.001)*** (0.001)***
married 0.056 married 0.045 married 0.079 married 0.052 married 0.055
(0.019)*** (0.018)** (0.031)** (0.020)*** (0.019)***
hh_size 0.030 hh_size 0.034 hh_size 0.016 hh_size 0.025 hh_size 0.032
(0.009)*** (0.009)*** (0.014) (0.009)*** (0.009)***
child 0.025 child 0.021 child 0.045 child 0.030 child 0.022
(0.010)** (0.010)** (0.016)*** (0.010)*** (0.009)**
N 3,777.000 3,746.000 1,931.000 3,587.000 3,777.000
LR chi^2 1,619.170*** 3,332.863*** 266.841*** 2,078.436*** 2,405.767***
Preudo R^2 0.125 0.131 0.055 0.130 0.140
* p<0.1; ** p<0.05; *** p<0.01
Who are more likely to say they are going to borrow from a bank during the next 12
month, given that a crisis is in the offing (see Table 10)? These are younger households
with more children and a readiness to help people outside the household. What undermines
the incentives to borrow are satisfaction with remuneration from employment and fear of
being fired. Satisfaction with the household‟s current financial situation, in contrast, makes
future borrowings more probable. The same effect obtains for the use of bank cards for
cash withdrawals or for both withdrawals and payments. The effects of the significant vari-
ables, however, do not differ greatly from each other and are not very strong.

Maria Semenova Save or borrow - what determines Russian households’ financial strategies?
22
Table 10 Results: Next year bank loans (probability, marginal effects)
Variable I Variable II Variable III Variable IV Variable V
income 0.000 income 0.000 income 0.000 income 0.000 income 0.000
(0.000)* (0.000) (0.000)* (0.000) (0.000)
fin_nochange12 -0.000 fin_nochange12 0.000 fin_nochange12 0.001 fin_nochange12 0.001 fin_nochange12 0.001
(0.007) (0.007) (0.015) (0.006) (0.006)
fin_better12 0.009 fin_better12 0.006 fin_better12 0.018 fin_better12 0.003 fin_better12 0.009
(0.009) (0.009) (0.019) (0.008) (0.008)
smart_same 0.006 wweek 0.001 sure_inc -0.014 inet 0.003
(0.013) (0.000)* (0.010) (0.008)
smart_more 0.015 working_out 0.015 fin_nochange 0.002 gen_inv 0.076
(0.025) (0.019) (0.008) (0.049)
life_sat -0.006 ch_work 0.010 fin_better 0.020 card_use_cash 0.016
(0.005) (0.016) (0.011)* (0.007)**
life_sat_more 0.000 sat_rem -0.026 fin_sat -0.001 card_use_pay 0.102
(0.006) (0.009)*** (0.007) (0.071)
help_in 0.014 sat_rem_more -0.009 fin_sat_more -0.006 card_use_both 0.027
(0.007)** (0.011) (0.005) (0.012)**
help_out 0.019 workfear_neutral -0.014 s_rich2 0.004 edu 0.007
(0.018) (0.014) (0.008) (0.006)
workfear -0.028 s_rich3 -0.002 finprof 0.005
(0.011)** (0.010) (0.009)
s_resp2 -0.013
(0.013)
s_resp3 -0.005
(0.012)
age -0.001 -0.001 -0.001 -0.001 -0.001
(0.000)*** (0.000)*** (0.000)*** (0.000)*** (0.000)***
child 0.007 0.007 0.010 0.008 0.007
(0.003)** (0.003)** (0.008) (0.003)*** (0.003)**
N 3,777.000 3,746.000 1,931.000 3,587.000 3,777.000
LR chi^2 151.703*** 150.935*** 140.117*** 175.466*** 343.023***
Preudo R^2 0.068 0.080 0.046 0.081 0.092
* p<0.1; ** p<0.05; *** p<0.01
4 How much to save or to borrow: results
We now consider those who are savers or bank borrowers and analyze the factors that in-
fluence the amounts saved or borrowed. This allows us to analyze exposure to chosen fi-
nancial strategies. We estimate the regressions via Heckman maximum likelihood and thus
obtain coefficients that are conditional on a household choosing a given financial strategy.
We start with savings (see Table 11). Higher income naturally increases total sav-
ings, adding approximately 0.2 ruble to total savings per ruble of household income. This
is comparable to the macro data showing that 14 percent of total income went into savings
in 2009 (see Figure 1)5, up from just 5 percent in 2007 (these data include such house-
holds).

BOFIT- Institute for Economies in Transition Bank of Finland
BOFIT Discussion Papers 28/ 2011
23
Figure 1 Household saving, % of total income
Personal characteristics are significant: those satisfied with their lives, and those helping
relatives outside the household save 8-12.5 and 10 thousand rubles more respectively
(however, these results are not stable). Working conditions and fear of job loss have no ef-
fect at all. However, those satisfied with their remuneration, save 12-14 thousand rubles
more. Those who are neutral about or satisfied with their households‟ financial situation
save 14.5 and 25 thousand rubles respectively.
Financial literacy and experience also boost savings: those with experience in the
financial markets save 44 thousand rubles more, and the use of bank cards for cash with-
drawals adds another 9.5-11 thousand. Respondents with higher education save an addi-
tional 20 thousand rubles, but those working in finance, science or education save 14 thou-
sand rubles less.
Finally, more is saved by households with a male head (this adds approximately
16-19 thousand rubles to total savings), older (each year adds 1126 rubles, but not in all
specifications), owning larger apartments (each room means an additional 8200-9100 ru-
bles in savings), having less children (each additional child means 4-7 thousand less of
savings) and living in an urban area (these households save 13-20 thousand rubles more).
5 Sourse: Russian Federation Federal State Statistics Service (Rosstat).

Maria Semenova Save or borrow - what determines Russian households’ financial strategies?
24
Table 11 Results: Savings (amount)
Variable I Variable II Variable III Variable IV Variable V
income 0.221 income 0.215 income 0.129 income 0.194 income 0.187
(0.124)* (0.116)* (0.092) (0.111)* (0.123)
fin_nochange12 734.798 fin_nochange12 -547.348 fin_nochange12 2,473.641 fin_nochange12 -5,495.845 fin_nochange12 4,423.446
(3,965.883) (4,286.594) (5,144.531) (4,903.290) (4,937.340)
fin_better12 -434.209 fin_better12 -2,981.270 fin_better12 -6,461.444 fin_better12 -14,322.006 fin_better12 3,549.234
(5,080.642) (5,255.210) (5,872.648) (5,448.384)*** (6,058.902)
smart_same 10,856.954 wweek -192.346 sure_inc 5,900.351 inet 3,989.452
(7,302.254) (132.721) (5,774.448) (7,591.615)
smart_more 10,477.382 working_out 11,144.266 fin_nochange -5,021.417 gen_inv 41,298.631
(8,390.087) (10,185.108) (7,351.470) (25,748.483)
life_sat 8,777.912 ch_work -6,352.068 fin_better 580.937 card_use_cash 11,726.088
(4,441.936)** (6,485.151) (9,072.560) (4,198.473)***
life_sat_more 12,457.110 sat_rem 14,502.914 fin_sat 14,444.155 card_use_pay -25,851.893
(3,938.396)*** (6,740.332)** (7,904.701)* (15,216.293)*
help_in 9,727.731 sat_rem_more 12,334.300 fin_sat_more 25,136.741 card_use_both 6,590.737
(4,737.499)** (5,155.260)** (7,596.704)*** (15,188.829)
help_out 4,009.484 workfear_neutral -3,058.471 s_rich2 6,747.703 edu 23,006.061
(5,641.544) (6,810.855) (4,727.529) (7,741.752)***
workfear 5,343.963 s_rich3 11,474.617 finprof -13,567.557
(8,989.467) (11,462.445) (4,576.685)***
s_resp2 -3,736.726
(7,751.597)
s_resp3 549.806
(8,525.247)
sex -19,400.464 -19,630.807 -32,118.577 -19,266.938 -16,104.987
(10,480.912)* (9,843.423)** (24,927.369) (11,182.321)* (9,514.813)*
age 180.937 200.636 1,125.821 161.930 306.265
(200.771) (221.469) (500.263)** (196.762) (191.314)
child -2,840.914 -4,723.881 -7,908.356 -2,906.859 -1,374.594
(1,967.391) (2,742.924)* (3,352.834)** (2,059.982) (1,689.833)
h_rooms 9,108.221 8,446.892 6,568.018 8,702.327 8,828.350
(4,146.965)** (3,839.116)** (7,009.978) (3,990.703)** (4,151.815)**
rural -20,331.983 -18,885.142 -24,089.117 -16,859.977 -12,851.913
(9,359.967)** (8,859.929)** (11,298.367)** (8,289.316)** (6,890.832)*
const 46,777.884 24,910.939 31,139.895 37,337.004 22,577.479
(20,254.136)** (18,909.830) (24,320.345) (21,070.475)* (17,308.738)
AthRho -0.170 -0.158 -0.178 -0.162 -0.158
(0.068)** (0.064)** (0.088)** (0.061)*** (0.062)**
N 3,777.000 3,767.000 3,355.000 3,740.000 3,777.000
Chi^2 59.383*** 182.787*** 75.066*** 251.839*** 210.529***
* p<0.1; ** p<0.05; *** p<0.01
Our results show that most of the factors that increase the probability of saving also in-
crease the exposure to this financial strategy. The exceptions are certain financial literacy
variables: being involved in financial activities increases the probability of saving but not
the amount saved given that the household becomes a saver, in contrast to satisfaction with
life and finances or readiness to help people outside the household.
Now we turn to borrowing. Current and future incomes prove to be among the
factors with the greatest influence: each additional ruble of current income adds 0.7-1 ruble
to total bank borrowing. The effect of the future-income proxy is also quite pronounced:
those expecting stable incomes save an extra 30-55 thousand rubles compared to those ex-
pecting a decrease in income.
BOFIT- Institute for Economies in Transition Bank of Finland
BOFIT Discussion Papers 28/ 2011
25
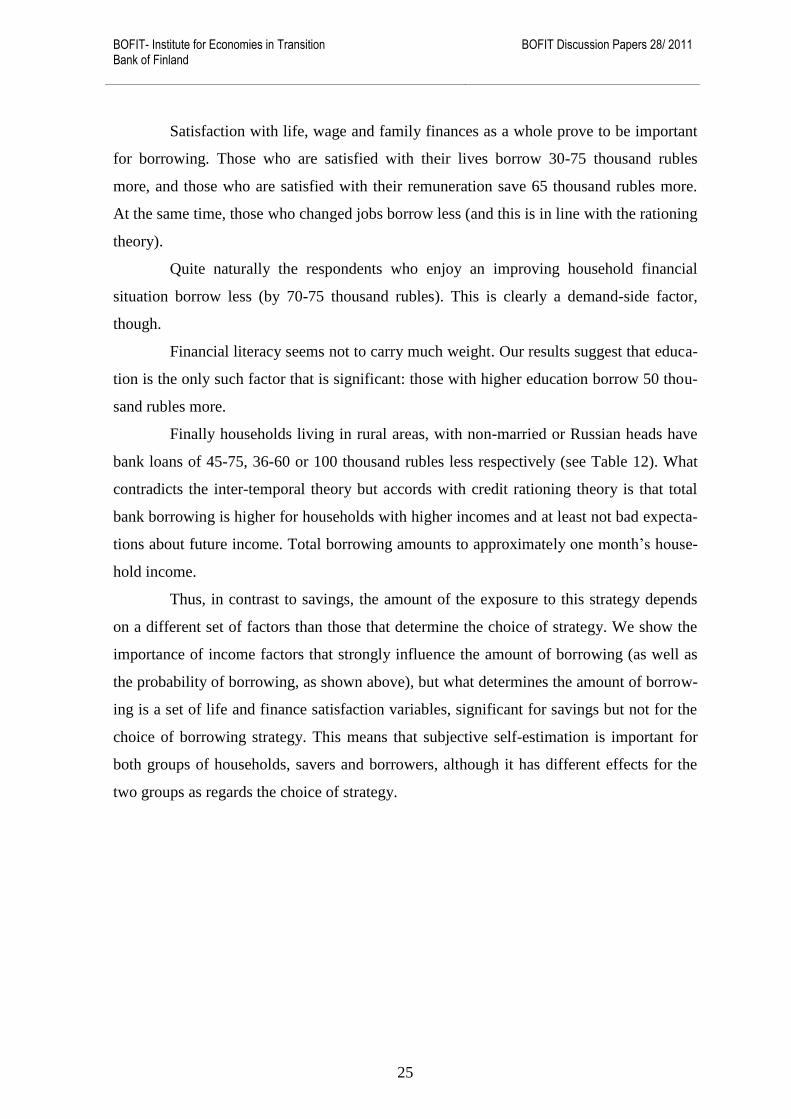
Satisfaction with life, wage and family finances as a whole prove to be important
for borrowing. Those who are satisfied with their lives borrow 30-75 thousand rubles
more, and those who are satisfied with their remuneration save 65 thousand rubles more.
At the same time, those who changed jobs borrow less (and this is in line with the rationing
theory).
Quite naturally the respondents who enjoy an improving household financial
situation borrow less (by 70-75 thousand rubles). This is clearly a demand-side factor,
though.
Financial literacy seems not to carry much weight. Our results suggest that educa-
tion is the only such factor that is significant: those with higher education borrow 50 thou-
sand rubles more.
Finally households living in rural areas, with non-married or Russian heads have
bank loans of 45-75, 36-60 or 100 thousand rubles less respectively (see Table 12). What
contradicts the inter-temporal theory but accords with credit rationing theory is that total
bank borrowing is higher for households with higher incomes and at least not bad expecta-
tions about future income. Total borrowing amounts to approximately one month‟s house-
hold income.
Thus, in contrast to savings, the amount of the exposure to this strategy depends
on a different set of factors than those that determine the choice of strategy. We show the
importance of income factors that strongly influence the amount of borrowing (as well as
the probability of borrowing, as shown above), but what determines the amount of borrow-
ing is a set of life and finance satisfaction variables, significant for savings but not for the
choice of borrowing strategy. This means that subjective self-estimation is important for
both groups of households, savers and borrowers, although it has different effects for the
two groups as regards the choice of strategy.

Maria Semenova Save or borrow - what determines Russian households’ financial strategies?
26
Table 12 Results: Bank loans (amount)
Variable I Variable II Variable III Variable IV Variable V
income 1.011 income 0.993 income 0.746 income 0.770 income 0.922
(0.444)** (0.432)** (0.225)*** (0.248)*** (0.400)**
fin_nochange12 46,904.243 fin_nochange12 39,689.575 fin_nochange12 2,985.971 fin_nochange12 28,435.438 fin_nochange12 54,393.513
(25,155.419)* (22,393.057)* (20,605.238) (22,562.815) (26,010.693)**
fin_better12 6,958.825 fin_better12 -12,052.432 fin_better12 -2,822.769 fin_better12 11,453.488 fin_better12 15,591.580
(16,411.148) (20,971.047) (23,294.855) (20,334.651) (16,418.744)
smart_same 41,481.339 wweek 253.982 sure_inc -1,440.129 inet -10,286.540
(39,451.223) (646.185) (27,270.836) (20,671.273)
smart_more 18,728.166 working_out -29,240.965 fin_nochange -50,172.604 gen_inv -36,431.272
(35,111.079) (20,490.967) (39,465.975) (86,281.854)
life_sat 32,652.522 ch_work -26,993.961 fin_better -69,354.275 card_use_cash -3,695.622
(16,786.941)* (14,963.852)* (40,905.795)* (29,058.517)
life_sat_more 76,391.412 sat_rem 10,455.054 fin_sat 16,330.225 card_use_pay -34,348.924
(33,498.384)** (18,814.269) (15,373.980) (35,178.375)
help_in -29,321.466 sat_rem_more 64,167.718 fin_sat_more 51,346.967 card_use_both 5,934.587
(31,486.493) (27,627.837)** (27,822.439)* (31,097.862)
help_out 620.623 workfear_neutral 15,823.131 s_rich2 19,424.167 edu 103,100.500
(38,455.221) (23,869.812) (12,445.939) (66,133.909)
workfear -1,043.497 s_rich3 31,296.591 finprof -45,069.833
(20,937.157) (58,121.702) (30,214.593)
s_resp2 -22,675.073
(23,645.919)
s_resp3 -29,047.394
(26,699.329)
married 57,961.756 married 59,504.069 married 31,755.201 married 34,471.941 married 58,521.016
(25,737.480)** (29,545.527)** (18,291.700)* (14,281.567)** (25,535.103)**
hh_size -4,735.656 hh_size -5,964.284 hh_size -16,760.103 hh_size -7,358.830 hh_size 423.140
(6,646.650) (6,428.669) (5,956.532)*** (6,283.991) (7,971.849)
child -14,035.594 child -11,871.521 child 3,594.224 child -8,163.776 child -11,552.849
(8,135.162)* (7,665.908) (7,659.214) (5,088.302) (7,842.461)
h_rooms 19,762.199 h_rooms 17,908.077 h_rooms 23,085.275 h_rooms 20,278.853 h_rooms 13,369.638
(8,372.142)** (8,196.321)** (11,643.276)** (8,300.747)** (7,691.421)*
rural -76,702.556 rural -73,340.109 rural -53,936.146 rural -57,336.211 rural -65,250.224
(25,735.403)*** (24,384.119)*** (18,860.233)*** (17,739.808)*** (25,146.822)***
const 105,168.900 23,538.401 91,129.807 176,296.238 68,801.699
(51,488.476)** (79,933.270) (75,756.575) (74,971.004)** (56,411.079)
AthRho -0.022 -0.022 -0.041 -0.053 -0.021
(0.019) (0.018) (0.089) (0.032)* (0.019)
N 4,495.000 4,487.000 4,246.000 4,462.000 4,495.000
Chi^2 53.358*** 67.504*** 108.827*** 99.343*** 67.234***
* p<0.1; ** p<0.05; *** p<0.01
5 Robustness checks: financial strategies at the edge of financial crisis
We also conducted several robustness checks on our results. First, we estimated all the
probit regressions6 for the period just before the financial crisis started, using the “last-30-
days” dependant variables. The results are reported in the Appendix. The significant fac-
tors for savings during the financial crisis do not differ much from those for the probability
of saving (see Table A1). Age, nationality and marital status have the same influence, but
6 We did not reestimate the OLS regressions, as the coefficients would be different due to the shorter period
of financial strategy and would not be comparable to coefficients for stock variables.

BOFIT- Institute for Economies in Transition Bank of Finland
BOFIT Discussion Papers 28/ 2011
27
the effects are more modest. But the number-of- children effect is twice as large. The size
of the household and the place-of-residence type do not influence the propensity to save
more. The inferences from inter-temporal theory are again partly substantiated: richer
households save more while future income has a mixed effect. As for personal characteris-
tics, whether the respondent is smart or helps outsiders has no bearing on crisis-period sav-
ing, in contrast to good times. Employment characteristics seem to be more significant in
the period of financial turmoil. In addition to the above, savings are more probable if the
household‟s members commute to another city to work. Those who changed their em-
ployment are, at least to some extent, less likely to save. It‟s worth noting that even when
the financial crisis unfolded the respondents were not setting aside precautionary savings
for job loss. The perception of the financial situation – personal and social – plays the same
role for savings. The only sign that relative richness is important is that households that
jumped from “poor-rich” to the medium ranking saved with higher probability. Once the
crisis began, financial literacy lost its importance for savings. The only factor that re-
mained significant was the use of bank cards: active users were still less likely to save.
Borrowing during financial crisis depends on a mixture of demand-side and sup-
ply-side factors as well (see Table A2). Borrowers are more likely to be younger respon-
dents owning smaller apartments, but total income influences this probability positively
(while expectations about future income are not significant). Those who seem to be smarter
are less likely to borrow during the crisis, as are those who are satisfied with their wages
and their families‟ financial situation, or at least claim to be aware of the latter. Consider-
ing financial literacy, the situation is very similar to saving in a crisis: internet users as well
as bank card owners that use cards only for cash withdrawals are more likely to borrow.
Another robustness check (not reported here) implied that regional clustering
could be excluded from all the estimations. The results proved to be less stable across
specifications and occasionally less significant. However the main body of the results is
statistically significant at the chosen significance level.
Finally we checked for the robustness of results by running the regressions with
all the independent variables included (except only for employment characteristics, in or-
der not to restrict the sample to employed respondents). Most of the results remain un-
changed and thus seem to be quite robust (see Table A3 in the Appendix).

Maria Semenova Save or borrow - what determines Russian households’ financial strategies?
28
6 Conclusion
In this paper we attempted to determine whether there is a saving-borrowing dichotomy in
the financial strategies of Russian households and to discover what stands behind house-
holds‟ choices to save and to borrow in formal and informal markets. We hypothesize
these factors to include more than current and expected incomes. As numerous empirical
studies have shown, personal, social and institutional characteristics may have even more
influence on households‟ choices. For households that chose one of the strategies analyzed,
we examine the determinants of the exposure, namely, the amount of funds saved, lent or
borrowed. Our unique dataset allows us to find out whether the dependencies obtained are
stable and extend over the financial crisis period, when the households had to change fi-
nancial strategies in the changing circumstances.
Our results suggest that the saver-borrower dichotomy suggested by inter-
temporal consumption theory is well founded only for savings and private borrowing, and
for savings and future bank loans. Bank borrowers are frequently savers at the same time.
Notably, for those who both save and borrow, the amounts of savings and borrowing are
positively correlated. The dichotomy between savings and bank loans, however, appears at
the onset of the financial crisis in Russia.
We show that current income increases the propensities to save and to borrow, but
future income has no unambiguous effect, which again contradicts the inter-temporal the-
ory. Individual characteristics proved to be important: smart respondents, satisfied with
their lives and used to helping other people, are more likely to save. The same is true for
those who are satisfied with their wages. Surprisingly, the fear of job loss does not make
people save more (although it does prevent borrowing from banks). Those who enjoy sta-
ble or improving financial conditions and/or are satisfied with them, are more likely to
save and less likely to borrow.
Those who borrow from banks are exposed mostly to credit rationing, implying
the importance and dominance of demand-side factors (such as current and future incomes,
stable employment, larger apartment etc).
Financial literacy is significant for both saving and bank borrowing. Financial
education and experience increase the propensity to save (except for bank card use, which
curbs saving) and to borrow from a bank.
BOFIT- Institute for Economies in Transition Bank of Finland
BOFIT Discussion Papers 28/ 2011
29
The financial crisis did not greatly change the set of significant factors. The only
exception is financial literacy, which became much less important for the choice of finan-
cial strategy.
Several policy implications may be drawn from our results. As the post-crisis re-
covery is going quite smoothly now in Russia, we can expect the revival of both savings
and bank borrowing. The former will be stimulated by higher incomes as well as better ex-
pectations, life satisfaction, self-confidence, openness and even being in a good mood. But
economic or political instability, heighted public debate about Russia‟s future, or bad pros-
pects may deter saving even if incomes keep rising. The latter is mainly based on economic
factors related to credit rationing and financial literacy. The second factor is important for
savings as well, so that the programs aimed at increasing people‟s financial literacy – now
gaining in popularity across Russia – seem to push in the right direction. But can we attract
additional bank borrowers from an informal market? The answer our results suggest is “not
easily”. These households base their decisions mostly on psychological and social factors,
which are naturally difficult to influence.
We suggest at least two directions for further research. The first involves cross-
country comparisons of household financial strategies. Using similar household surveys
conducted in other countries, it might be possible to identify the factors that are common
for most households and typical for Russia. This may help us to find the “mysterious Rus-
sian soul” in households‟ financial decisions based on psychological factors and using em-
pirical data. Another possible extension of this study would be a detailed analysis of mixed
strategies, namely those of households that choose more than one strategy simultaneously.
The savings of bank borrowers may be explained by either the precautionary motive or by
strict conditions for loan contracts. A mixture of bank and private loans may exist because
of credit rationing or an unwillingness to become an “official” borrower (which may ex-
plain the negative attitudes of some people).

Maria Semenova Save or borrow - what determines Russian households’ financial strategies?
30
References
Attanasio O.P., Banks J. (2001) The assessment: household saving – issues in theory and
policy. Oxford Review of Economic Policy, 17 (1), 1-19
Barnea A., Cronqvist H., Siegel S. (2010) Nature or nurture: What determines investor be-
havior? Journal of Financial Economics, 98(3), 583-604
Callen T., Thimann Ch. (1997) Empirical determinants of Household Saving: Evidence
from OECD Countries., IMF Working Paper № WP/97/181
Deaton A. (1997) The analysis of household surveys. Johns Hopkins University Press, Bal-
timore.
Denizer C., Wolf H.C., Ying Y. (2002) Household Savings in the Transition, Journal of
Comparative Economics, 30(3), 463-475
Diagne A. (1999) Determinants of Household Access to and Participation in Formal and
Informal Credit Markets in Malawi. FCND Discussion Paper №67
Foley M., Pyle W. (2001) Household savings in Russia during the transition. Middlebury
College Economics Discussion Paper №2
Guardiglia A., Kim B.J. (2004) Earnings uncertainty, precautionary saving, and moonlight-
ing in Russia. Journal of Population Economics, 17(2), 289-310
Han C.-K., Sherraden M. (2009) Do institutions really matter for saving among low-
income households? A comparative approach, Journal of Socio-Economics, 38,
475–483
Harris M. N., Loundes J., Webster E. (2002) Determinants of Household Saving in Austra-
lia, The Economic Record, 78(241), 207–223
Kulikov D., Paabut A., Staehr K. (2007) A Microeconometric Analysis of Household Sav-
ing in Estonia: Income, Wealth and Financial Exposure, Eesti Pank Working Pa-
per № 8/2007
Loayza N., Schmidt-Hebbel K., Serven L. (2000) Saving in developing countries: an over-
view. The World Bank economic Review, 14(3), 393-414.
Magri S. (2007) Italian households‟ debt: the participation to the debt market and the size
of the loan, Empirical Economics, 33, 401–426
Miles D. (1997) A Household Level Study of the Determinants of Incomes and Consump-
tion. The Economic Journal, 107(440), 1-25
Schmidt-Hebbel K., Webb S. B., Corsetti G. (1992) Household Saving in Developing
Countries: First Cross-Country Evidence. The World Bank Economic Review,
6(3), 529-547
BOFIT- Institute for Economies in Transition Bank of Finland
BOFIT Discussion Papers 28/ 2011
31
Semenova M. (2008) Information and Deposit Insurance: the Evidence from Russian Mar-
ket for Personal Deposits.Center for Institutional Studies Working Paper
№WP10/2008/01
Stiglitz J.E., Weiss A. (1991) Credit Rationing in Markets with Imperfect Information,
American Economic Review, 71(3), 393-410.
Thaler R. H. (1990) Anomalies: Saving, Fungibility, and Mental Accounts. Journal of
Economic Perspectives, 4(1), 193-205
Thaler R. H. (1994) Psychology and Savings Policies, American Economic Review, 84,
186-192.
Webley P., Nyphos E.K. (2006) Parents' influence on children's future orientation and sav-
ing. Journal of Economic Psychology, 27(1), 140-164
Towards Sustainable Household Consumption? Trends and Policies in OECD Countries
(2002) OECD Publications http://www.ine.gob.mx/descargas/dgipea/towards_sust.pdf

Appendix Table A1 Results: Crisis savings (probability, marginal effects)
Variable I Variable II Variable III Variable IV Variable V income 0.000 income 0.000 income 0.000 income 0.000 income 0.000
(0.000)** (0.000)** (0.000)* (0.000)* (0.000)* fin_nochange12 -0.007 fin_nochange12 -0.015 fin_nochange12 -0.022 fin_nochange12 -0.047 fin_nochange12 -0.002
(0.019) (0.018) (0.024) (0.018)** (0.019) fin_better12 0.103 fin_better12 0.069 fin_better12 0.049 fin_better12 0.004 fin_better12 0.108
(0.025)*** (0.023)*** (0.031) (0.021) (0.025)*** smart_same 0.013 wweek -0.000 sure_inc -0.012 inet 0.030
(0.020) (0.001) (0.021) (0.019)
smart_more 0.058 working_out 0.109 fin_nochange 0.058 gen_inv 0.170
(0.038) (0.041)*** (0.015)*** (0.085)**
life_sat 0.041 ch_work -0.055 fin_better 0.117 card_use_cash 0.018
(0.019)** (0.018)*** (0.021)*** (0.019)
life_sat_more 0.076 sat_rem 0.056 fin_sat 0.032 card_use_pay 0.032
(0.015)*** (0.024)** (0.021) (0.087)
help_in 0.069 sat_rem_more 0.097 fin_sat_more 0.068 card_use_both -0.027
(0.015)*** (0.027)*** (0.022)*** (0.026)
help_out 0.034 workfear_neutral 0.005 s_rich2 0.038 edu 0.036
(0.028) (0.034) (0.014)*** (0.014)***
workfear -0.022 s_rich3 0.056 finprof 0.024
(0.021) (0.039) (0.022)
s_resp2 0.027
(0.033)
s_resp3 0.037 (0.035)
sex -0.022 -0.021 -0.027 -0.023 -0.019 (0.018) (0.017) (0.026) (0.019) (0.018)
age 0.003 0.003 0.003 0.003 0.003 (0.000)*** (0.000)*** (0.001)*** (0.000)*** (0.000)***
rus 0.043 0.041 0.041 0.049 0.041 (0.015)*** (0.015)*** (0.021)* (0.014)*** (0.015)***
married 0.037 0.017 0.014 0.027 0.037 (0.013)*** (0.014) (0.018) (0.014)* (0.013)***
hh_size -0.008 -0.000 -0.013 -0.007 -0.009 (0.005)* (0.005) (0.007)** (0.005) (0.005)*
child -0.029 -0.035 -0.021 -0.028 -0.028 (0.006)*** (0.007)*** (0.011)** (0.007)*** (0.006)***
h_rooms 0.005 -0.000 -0.002 0.003 0.003 (0.006) (0.006) (0.010) (0.007) (0.007)
rural -0.014 -0.009 -0.035 -0.012 -0.001 (0.013) (0.013) (0.017)** (0.014) (0.014)
N 3,777.000 3,746.000 1,931.000 3,587.000 3,777.000 LR chi^2 114.665*** 295.031*** 300.211*** 327.537*** 280.249***
Preudo R^2 0.040 0.062 0.061 0.067 0.048 * p<0.1; ** p<0.05; *** p<0.01

Table A2 Results: Crisis bank loans (probability, marginal effects)
Variable I Variable II Variable III Variable IV Variable V income 0.000 income 0.000 income 0.000 income 0.000 income 0.000
(0.000) (0.000) (0.000)* (0.000) (0.000) fin_nochange12 0.047 fin_nochange12 0.045 fin_nochange12 0.069 fin_nochange12 0.050 fin_nochange12 0.054
(0.021)** (0.020)** (0.031)** (0.025)** (0.022)** fin_better12 0.067 fin_better12 0.061 fin_better12 0.104 fin_better12 0.077 fin_better12 0.072
(0.025)*** (0.025)** (0.036)*** (0.028)*** (0.026)*** smart_same 0.040 wweek 0.003 sure_inc -0.077 inet 0.003 (0.035) (0.001)*** (0.037)** (0.021) smart_more 0.009 working_out 0.010 fin_nochange 0.026 gen_inv -0.032 (0.053) (0.057) (0.022) (0.092) life_sat 0.019 ch_work 0.015 fin_better 0.043 card_use_cash 0.097 (0.023) (0.035) (0.022)* (0.023)*** life_sat_more 0.004 sat_rem -0.030 fin_sat -0.068 card_use_pay 0.423 (0.019) (0.038) (0.019)*** (0.128)*** help_in 0.047 sat_rem_more -0.029 fin_sat_more -0.084 card_use_both 0.162 (0.019)** (0.031) (0.020)*** (0.044)*** help_out 0.095 workfear_neutral -0.018 s_rich2 0.032 edu -0.008 (0.040)** (0.042) (0.021) (0.016) workfear 0.004 s_rich3 0.040 finprof 0.060 (0.034) (0.044) (0.028)**
s_resp2 -0.017
(0.035)
s_resp3 0.011
(0.034) sex 0.085 0.085 0.099 0.071 0.089
(0.020)*** (0.020)*** (0.040)** (0.021)*** (0.020)*** age -0.008 -0.008 -0.008 -0.007 -0.007
(0.001)*** (0.001)*** (0.001)*** (0.001)*** (0.001)*** rus 0.031 0.028 0.029 0.034 0.028
(0.029) (0.028) (0.039) (0.030) (0.029) married 0.056 0.045 0.079 0.052 0.055
(0.019)*** (0.018)** (0.031)** (0.020)*** (0.019)*** hh_size 0.030 0.034 0.016 0.025 0.032
(0.009)*** (0.009)*** (0.014) (0.009)*** (0.009)*** child 0.025 0.021 0.045 0.030 0.022
(0.010)** (0.010)** (0.016)*** (0.010)*** (0.009)** h_rooms 0.014 0.013 0.005 0.013 0.011
(0.010) (0.011) (0.017) (0.011) (0.011) rural -0.040 -0.038 -0.007 -0.033 -0.011
(0.033) (0.032) (0.058) (0.034) (0.033) N 3,777.000 3,746.000 1,931.000 3,587.000 3,777.000
LR chi^2 1,619.170*** 3,332.863*** 266.841*** 2,078.436*** 2,405.767*** Preudo R^2 0.125 0.131 0.055 0.130 0.140
* p<0.1; ** p<0.05; *** p<0.01

Table A3 Results: Regressions with all independent variables Panel A: Marginal effects Panel B: Linear effects (for amounts)
Variable savings crisis savings bank loans crisis bank
loans next-year borrowing Variable savings crisis savings bank loans crisis bank
loans income 0.000 0.000 0.000 0.000 0.000 income 0.161 0.085 0.710 0.960
(0.000)** (0.000) (0.000) (0.000) (0.000) (0.108) (0.065) (0.231)*** (0.038)*** fin_nochange12 -0.058 -0.041 0.059 0.059 0.003 fin_nochange12 -1,645.206 -2,242.415 34,534.391 -32,229.987
(0.019)*** (0.019)** (0.025)** (0.025)** (0.005) (4,540.892) (1,471.979) (22,594.676) (45,443.848) fin_better12 -0.017 0.008 0.085 0.085 0.003 fin_better12 -8,483.670 1,197.032 16,081.285 -23,925.537
(0.029) (0.021) (0.029)*** (0.029)*** (0.008) (5,854.963) (1,557.050) (18,997.086) (44,157.949) sex -0.007 -0.022 0.076 0.076 -0.002 sex -16,246.940 -980.252 -32,742.749 16,506.951
(0.017) (0.018) (0.021)*** (0.021)*** (0.006) (9,852.134)* (1,596.877) (52,077.514) (44,519.640) age 0.004 0.003 -0.007 -0.007 -0.001 age 249.577 -37.515 -77.675 27.684
(0.001)*** (0.001)*** (0.001)*** (0.001)*** (0.000)*** (193.581) (87.507) (519.161) (669.381) rus 0.067 0.044 0.028 0.028 0.004 rus -7,171.407 -5,790.641 -16,524.439 -12,863.536
(0.029)** (0.013)*** (0.029) (0.029) (0.006) (7,621.520) (4,761.736) (27,358.933) (29,446.138) married 0.051 0.017 0.040 0.040 0.006 married -2,060.191 -753.839 35,302.868 1,917.268
(0.018)*** (0.015) (0.019)** (0.019)** (0.005) (4,765.617) (1,728.529) (12,907.490)*** (19,048.876) hh_size -0.013 -0.003 0.032 0.032 -0.001 hh_size 1,903.122 1,528.460 -5,068.026 -2,823.035
(0.007)* (0.005) (0.009)*** (0.009)*** (0.002) (1,837.415) (1,229.663) (6,061.865) (14,610.430) child -0.021 -0.032 0.022 0.022 0.007 child -2,534.468 -292.140 -6,944.748 -23,476.082
(0.009)** (0.007)*** (0.010)** (0.010)** (0.003)** (2,215.789) (1,127.000) (5,589.132) (14,922.094) h_rooms -0.007 -0.001 0.010 0.010 -0.003 h_rooms 8,214.731 2,540.587 15,704.039 16,644.478
(0.010) (0.006) (0.011) (0.011) (0.002) (3,791.672)** (1,857.661) (7,202.786)** (16,078.365) rural 0.044 -0.005 -0.002 -0.002 -0.000 rural -9,282.947 3,422.110 -44,009.213 -2,394.474
(0.028) (0.015) (0.034) (0.034) (0.006) (5,969.912) (1,445.583)** (17,889.622)** (18,265.583) smart_same 0.024 0.016 0.043 0.043 0.005 smart_same 5,897.169 1,404.001 3,117.730 5,781.416
(0.027) (0.021) (0.037) (0.037) (0.013) (6,658.900) (1,357.856) (37,727.955) (23,645.810) smart_more 0.156 0.060 0.004 0.004 0.010 smart_more 1,314.542 5,371.375 -27,778.404 46,996.585
(0.057)*** (0.041) (0.051) (0.051) (0.020) (7,690.320) (2,794.082)* (38,868.503) (59,202.842) life_sat 0.063 0.015 0.028 0.028 -0.006 life_sat 5,224.851 1,306.076 27,796.711 6,481.053
(0.018)*** (0.017) (0.022) (0.022) (0.005) (4,713.926) (1,323.384) (15,586.892)* (30,965.835) life_sat_more 0.033 0.026 0.013 0.013 -0.002 life_sat_more -1,510.686 -126.882 44,734.349 19,027.199
(0.023) (0.016)* (0.020) (0.020) (0.007) (4,460.726) (1,027.993) (19,500.556)** (45,933.542) help_in 0.090 0.056 0.043 0.043 0.012 help_in 8,086.566 1,337.083 -3,822.068 -12,515.828
(0.017)*** (0.014)*** (0.020)** (0.020)** (0.006)** (4,829.179)* (1,386.160) (12,968.119) (11,731.248) help_out 0.112 0.024 0.080 0.080 0.014 help_out -859.382 2,491.344 1,046.879 -36,139.182
(0.029)*** (0.027) (0.038)** (0.038)** (0.017) (6,799.984) (1,557.478) (35,416.139) (22,035.056) sure_inc 0.004 -0.009 -0.074 -0.074 -0.012 sure_inc 10,004.242 349.607 -3,554.463 -6,359.169
(0.030) (0.023) (0.036)** (0.036)** (0.010) (5,379.557)* (1,584.036) (26,918.709) (17,459.122) fin_nochange 0.047 0.053 0.020 0.020 0.001 fin_nochange -5,484.816 1,161.800 -56,940.632 9,430.536
(0.022)** (0.016)*** (0.021) (0.021) (0.007) (6,409.745) (1,855.961) (39,997.447) (24,747.324) fin_better 0.100 0.106 0.030 0.030 0.017 fin_better 422.212 -173.293 -75,666.178 -4,394.198
(0.024)*** (0.022)*** (0.021) (0.021) (0.010)* (8,683.540) (2,201.610) (40,991.189)* (30,775.769) fin_sat 0.036 0.026 -0.070 -0.070 0.000 fin_sat 12,940.198 3,260.541 3,127.201 -11,181.087
(0.025) (0.020) (0.018)*** (0.018)*** (0.007) (7,749.487)* (1,780.908)* (16,361.936) (24,992.150) fin_sat_more 0.050 0.055 -0.086 -0.086 -0.007 fin_sat_more 23,593.185 2,440.867 30,617.496 57,284.790
(0.024)** (0.022)** (0.020)*** (0.020)*** (0.005) (7,932.774)*** (1,320.909)* (26,498.798) (54,074.961) s_rich2 0.023 0.029 0.017 0.017 0.003 s_rich2 5,628.519 -772.165 17,027.319 -833.871
(0.023) (0.013)** (0.021) (0.021) (0.007) (4,352.386) (1,188.819) (12,190.954) (24,690.914) s_rich3 0.030 0.036 0.025 0.025 -0.003 s_rich3 10,378.805 6,461.692 33,369.305 -59,208.627
(0.047) (0.035) (0.044) (0.044) (0.009) (10,765.221) (5,929.376) (60,084.529) (39,354.154) s_resp2 -0.022 0.024 -0.026 -0.026 -0.011 s_resp2 -5,300.378 -326.777 -27,701.184 14,812.271
(0.039) (0.034) (0.035) (0.035) (0.011) (7,040.579) (2,030.876) (22,469.272) (23,761.681) s_resp3 -0.003 0.025 -0.003 -0.003 -0.006 s_resp3 -1,458.866 1,379.463 -39,829.392 29,355.703
(0.038) (0.036) (0.035) (0.035) (0.010) (7,427.456) (1,660.736) (24,370.774) (30,518.120) inet 0.023 0.016 0.002 0.002 0.002 inet 6,277.393 -2,205.408 4,734.184 27,370.184
(0.021) (0.018) (0.019) (0.019) (0.007) (8,101.670) (1,930.901) (13,842.550) (31,433.464) gen_inv 0.222 0.114 -0.034 -0.034 0.031 gen_inv 43,913.810 29,732.934 -20,940.259 0.000
(0.104)** (0.082) (0.093) (0.093) (0.029) (26,644.230)* (16,561.029)* (76,274.084) (0.000) card_use_cash 0.032 0.013 0.090 0.090 0.012 card_use_cash 9,411.050 664.871 14,641.103 -3,522.797
(0.019) (0.019) (0.023)*** (0.023)*** (0.006)** (3,630.316)*** (1,398.691) (20,369.371) (19,111.373) card_use_pay 0.006 0.046 0.396 0.396 0.094 card_use_pay -20,470.821 6,559.879 -23,923.191 2,643.647
(0.096) (0.086) (0.132)*** (0.132)*** (0.066) (15,532.917) (4,660.482) (35,328.156) (42,072.773) card_use_both -0.065 -0.037 0.171 0.171 0.026 card_use_both 5,645.624 -858.481 34,314.360 -39,974.145
(0.023)*** (0.021)* (0.046)*** (0.046)*** (0.012)** (14,035.715) (1,900.515) (23,744.837) (36,215.993) edu 0.036 0.020 -0.006 -0.006 0.004 edu 21,886.638 -2,075.639 47,819.725 -67,364.836
(0.017)** (0.014) (0.016) (0.016) (0.005) (8,096.613)*** (2,032.233) (19,015.960)** (36,706.119)* finprof -0.003 0.009 0.054 0.054 0.004 finprof -13,921.682 1,972.874 -12,481.699 8,422.320
(0.027) (0.022) (0.027)** (0.027)** (0.009) (5,655.728)** (1,627.020) (16,912.745) (34,035.251) N 3,560.000 3,560.000 3,560.000 3,560.000 3,560.000 const 5,979.193 -196.043 124,581.155 29,135.426
LR chi^2 1,519.011*** 3,828.079*** 12,600.097*** 12,600.097*** 1,944.021*** (20,810.691) (8,266.817) (81,479.457) (71,794.271) Preudo R^2 0.083 0.081 0.149 0.149 0.108 AthRho -0.149 -0.047
* p<0.1; ** p<0.05; *** p<0.01 (0.056)*** (0.028)* N 3,731.000 462.000 4,455.000 98.000 Chi^2 0.369*** . 0.757***

Earlier BOFIT Discussion Papers For a complete list of Discussion Papers published by BOFIT, see
www.bof.fi/bofit
2011
No 1 Aaron Mehrotra and Jenni Pääkkönen: Comparing China's GDP statistics with coincident indicators No 2 Marco Lo Duca and Tuomas Peltonen: Macro-financial vulnerabilities and future financial stress - Assessing systemic risks and predicting systemic events No 3 Sabine Herrmann and Dubravko Mihaljek: The determinants of cross-border bank flows to emerging markets: New empirical evidence on the spread of financial crises No 4 Rajeev K. Goel and Aaron Mehrotra: Financial settlement modes and corruption: Evidence from developed nations No 5 Aaron Mehrotra, Riikka Nuutilainen and Jenni Pääkkönen: Changing economic structures and impacts of shocks - evidence from a DSGE model for China No 6 Christophe J. Godlewski, Rima Turk-Ariss and Laurent Weill Do markets perceive sukuk and conventional bonds as different financing instruments? No 7 Petr Jakubik: Households’ response to economic crisis No 8 Wing Thye Woo: China's economic growth engine: The likely types of hardware failure, software failure and power supply failure No 9 Juan Carlos and Carmen Broto: Flexible inflation targets, forex interventions and exchange rate volatility in emerging countries No 10 Andrei Yakovlev: State-business relations in Russia in the 2000s: From the capture model to a variety of exchange models? No 11 Olena Havrylchyk: The effect of foreign bank presence on firm entry and exit in transition economies No 12 Jesús Crespo Cuaresma, Markus Eller and Aaron Mehrotra: The Economic transmission of fiscal policy shocks from Western to Eastern Europe No 13 Yu-Fu Chen, Michael Funke and Aaron Mehrotra: What drives urban consumption in mainland China? The role of property price dynamics No 14 Mikael Mattlin and Matti Nojonen: Conditionality in Chinese bilateral lending No 15 John Knight and Wei Wang: China's macroeconomic imbalances: causes and consequences No 16 Gregory C Chow, Changjiang Liu and Linlin Niu: Co-movements of Shanghai and New York stock prices by time-varying regressions No 17 Yanbing Zhang, Xiuping Hua, Liang Zhao: Monetary policy and housing prices; a case study of Chinese experience in 1999-2010 No 18 Peter Sarlin, Tuomas A. Peltonen: Mapping the state of financial stability No 19 Zhichao Zhang, Nan Shi, Xiaoli Zhang: China’s New exchange rate regime, optimal basket currency and currency diversification No 20 Elena B. Deryugina, Alexey A. Ponomarenko: Identifying structural shocks behind loan supply fluctuations in Russia No 21 Dong He and Honglin Wang: Dual-track interest rates and the conduct of monetary policy in China No 22 Xinhua He, Duo Qin and Yimeng Liu: Exchange rate misalignments: A comparison of China today against recent historical experiences of Japan, Germany, Singapore and Taiwan No 23 Vladimir Mau: The role of state and creation of a market economy in Russia No 24 Elena Fedorova: Transfer of financial risk in emerging eastern European stock markets: A sectoral perspective No25 Yin-Wong Cheung, Eiji Fujii: Exchange Rate Misalignment Estimates – Sources of Differences No26 William Pyle: The ownership of industrial land in Russian cities: Explaining patterns of privatization across regions and firms No 27 Anne-Laure Delatte, Julien Fouquau and Carsten A. Holz: Explaining money demand in China during the transition from a centrally planned to a market-based monetary system No 28 Maria Semenova: Save or borrow - what determines Russian households’ financial strategies?

Bank of Finland BOFIT – Institute for Economies in Transition
PO Box 160
FIN-00101 Helsinki
+ 358 10 831 2268
http://www.bof.fi/bofit