save nature to survive protein and isozyme patterns of ... supplement/93sup06 n. b. pawar.pdf ·...
TRANSCRIPT

NSave Nature to Survive
9(3): 1165-1170, 2014 (Supplement on Plant Pathology)www.thebioscan.in
1165
PROTEIN AND ISOZYME PATTERNS OF RHIZOCTONIA
BATATICOLA ISOLATES CAUSING CHICKPEA ROOT ROT
N. B. PAWAR1* AND Y. V. INGLE2
1Cotton Improvement Project, MPKV, Rahuri Dist. Ahmednagar - 4137222Regional Research Center, Amravati - 444 603 (M.S.)e-mail: [email protected]
INTRODUCTION
The cultivated chickpea (Cicer arietinum L.), was one of thefirst grain legumes domesticated in the old world. It is nowwidely cultivated in Europe, Persia, Egypt, India, Central andSouthern America, Australia and parts of Africa and in Indiachickpea is primarily grown as Rabi (post rainy) season cropand occupies about 37% of the area under pulses and con-tributes almost 50 percent of total pulse production. Chickpeaproductivity however, remained virtually stagnant over recentdecades because of its susceptibility to the insect pests anddiseases besides other factors. Chickpea is prone to severalfungal diseases, amongst them, dry root rot caused by Rhizoc-tonia bataticola (Taub) Briton-Jones [=Macrophominaphaseolina (Tassi) Goid] is one of the major production con-straints that causes 10-20 percent annual loss (Vishwadharand Chaudhary, 2001). The information is not available inrespect of virulence/pathotypes of R. bataticola prevalentacross the country and its correlation with morphologicalvariability, if any. SDSPAGE fingerprinting is also an ideal,economical and less time consuming method for studyingmicroorganism variation and identification (Panda et al.,2013). Moreover, Gel electrophoresis of proteins has beenwidely used for studying variation in fungal populations.Hussein et al. (2000) used cluster analysis to compare pro-tein banding patterns obtained by sodium dodecyl sulfate-polyacrylamide gel electrophoresis (SDS-PAGE) from 17 iso-lates of R. solani. Keeping this in view, investigation was un-dertaken to co-relate pathogenic variability among the iso-
lates of R. bataticola collected from different chickpea-grow-ing regions of Maharashtra with their biochemical variation(SDS-PAGE), isozyme analysis (Esterase, PPO and PO).
MATERIALS AND METHODS
Chickpea plants showing typical root rot symptoms werecollected from different locations of Maharashtra and isolationswere made on PDA medium. R. bataticola isolates were testedfor their virulence by sick soil method on susceptible varietyJG-62 according to the pot-culture inoculation method of Neneand Haware (1980). The isolates of R. bataticola weretentatively divided into five groups on the basis of virulence(Table 1).
Quantitative Assay of Protein and Isozymes
Protein and enzyme extraction
Pure culture of R. bataticola isolates was inoculated on PDAmedium and seven days old growth were scrapped with thehelp of scrapper. Mycelium (100 mg) was homogenized in 1mL sodium phosphate buffer by motorized homogenizer for8 minutes. The mycelial extract was transferred to 1.5 mLcentrifuge tubes. The samples in the tubes were centrifuged at10000 rpm for 45 minutes at 4ºC using Remi (C-24). The clearsupernatant was collected and used as protein and enzymesource for electrophoretic studies. Entire extraction procedurewas done under cold condition. A protein concentration ofmycelial homogenate was determined by Bradford method(1976) by using Bovine Serum Albumin (BSA) as a standard
ABSTRACT
Marked variations among different isolates of Rhizoctonia bataticola collected from various locations of Maharashtrawere studied in respect of protein and isozyme analysis on the basis of pathogenecity. Protein content in differentisolates of R. bataticola ranged from 0.756 mg to 1.021 mg/100 mg mycelium and maximum protein content wasobserved in R
26 highly pathogenic isolate. The peroxidase activities was ranged between 39.35 to 69.79 U min-1
mg-1 protein and polyphenol oxidase activities from 0.17 to 1.10 U min-1 mg-1 protein among different isolates of
R. bataticola. The maximum PPO activities was recorded in highly pathogenic isolate R34
of Aurangabad. Moreover,
the maximum esterase activities among R. bataticola isolates was observed in moderately pathogenic R10
isolate of
Buldhana district (9.92 μm min-1 mg-1 protein). Electrophoretic studies by using SDS-PAGE revealed that, seven
soluble proteins bands between molecular weights 58.88 to 102.3 KDa and 0.05 to 0.25 Rf values were detected
among the isolates of R.bataticola, however, weakly pathogenic isolates (R14
, R19
and R24
) are identical for
expressing a common protein band of 0.15 Rf. The only common band of esterase (0.045 Rf) was noticed in
slightly pathogenic isolates (R8, R
41 and R
47) which was absent in other isolates and the presence of common PPO
band 0.024 Rf in all isolates of highly pathogenic isolates (R26
, R34
and R54
), indicates variability among isolates.
Peroxidase as molecular marker also differentiates variability but existence was in traces i.e. maximum one band
in most of the isolates, except isolates R41
(0.034 and 0.103 Rf) and R34
(0.034 and 0.092) which forms two bands,
while no band was noticed in R54
isolate from Satara district.
KEYWORDS
EsterasePeroxidasePolyphenol oxidaseProtein
R. bataticola
SDS-PAGE
Received on :01.05.2014
Accepted on :24.07.2014
*Correspondingauthor

1166
N. B. PAWAR AND Y. V. INGLE
protein to construct the standard curve.
Esterase activity
Esterase activity was measured by microplate assay as perprocedure of Dary et al. (1990). Three sets of 50 mL of differentconcentration of a napthol (5-50 nm) per well were loadedfollowed by 100 ml phosphate buffer (100 mM, pH 7). Aftergentle manual shaking, 100 mL of staining solution (0.8 mgFast Brilliant Blue/ml of phosphate buffer (100 mM, pH 7) with0.5% sodium dodocyl sulfate) was added in each well. Theplates were incubated in dark at 20ºC for 30 min and wereread in microplate reader (Metertech S960, USA) equippedwith 600 nm filter. A standard graph was drawn by plottingmean values of concentration verses mean values of opticaldensity.
Polyphenol oxidase assay
Polyphenol oxidase (PPO) activity was determined as per theprocedure given by Mayer et al. (1965). Enzyme extract wasused as enzyme source. The reaction mixture consisted of200 mL of enzyme extract and 1.5 ml of 0.1 M sodiumphosphate buffer (pH 6.5). For reaction, 200 mL of 0.01 Mcatechol was added and the enzyme activity, i.e. change inabsorbance of reaction mixture at 495 nm were recorded.One unit of enzyme activity was defined as the amount ofenzyme required to increase the absorbance by 0.01 /min.(Coseteng and Lee, 1987).
Peroxidase assay
Peroxidase activity was determined according to Retig (1974)method. The reaction mixture contained 4.0 ml; 0.2 Mphosphate buffer (pH 5.8), 0.1mL, 0.2 M guaicol, 1.0mL, 0.38M hydrogen peroxide (H
2O
2) and enzyme extract 500 μL. The
reaction was carried out at 30ºC. Absorbance readings, withU 2000 spectrophotometer (Hitachi make) at 470 nm werenoted. One unit of enzyme activity was defined as the amountof enzyme required to increase the absorbance by 0.01 / min(Deepa and Arumughan, 2002).
Electrophoresis
Electrophoresis of protein and isozyme in polyacrylamide gelwas carried out in buffer gel (native PAGE) in vertical gelelectrophoresis using the procedure given by Sadasivam and
Manickam (1996). After the complete run the gel was removed
carefully between the plates, subsequently the gel was stained
in appropriate staining solution. After visualization of bands,the gel was photographed. The migration distance of eachband and tracking dye was recorded. The migration wasexpressed as the ratio of the distance traveled by the protein/isozyme to the tracking dye from the point of application. Thisfactor is known as relative mobility. Using the Rf values,zymograms were prepared pictorially.
Native PAGE for protein was carried out using 5% stackingand 10% resolving gel and for isozyme 5% stacking and 6%resolving gel was used.
Staining and destaining for protein
First, dye was dissolved in methanol and staining solution
was prepared for observation of protein bands. The gels wereimmersed in staining solution for overnight. Then stained gelswere transferred to a suitable container containing destainingsolution for 12 hours. Dye that is not bound to proteins wasthus removed and proteins fractionated into bands were seenblue coloured.
Staining of esterase isozyme (Vallejos, 1983)
The gel was incubated in a staining solution of ?-naphthylacetate (30 mg in 3 ml acetone) was first dissolved in acetoneand then solution of fast blue BB salt (100 mg in 100 ml, of 0.1M SPB pH7) was added. The blackish/ brown esterase bandswere developed after 15 minutes.
Staining of polyphenol oxidase isozyme
The isozyme of polyphenol oxidase was localized onpolyacrylamide gel as per the procedure suggested by Park etal. (1980). The gel was incubated in 0.03 m catechol containing0.25 per cent phenylene diamine in citrate phosphate buffer,pH 6 (0.1 m citric acid solution, 2.10g in 100mL) + 0.2msolution of dibasic sodium phosphate, 3.56 g in 100 ml) forone hour.
Staining of peroxidase isozyme
The isozyme bands of peroxidase (Nov Acky and Hampton,1968) were localized by first incubating the gel in 0.25 percent guacicol for 30 minutes followed by incubation in 0.3per cent hydrogen peroxide for 15 minutes which showed theappearance of reddish brown bands of peroxidase.
RESULTS AND DISCUSSION
Protein content in different isolates of R. bataticola rangedfrom 0.756 ± 0.003 to 1.021 ± 0.017 mg/100 mg myceliumwith maximum protein (1.021 mg /100 mg mycelium) in highlypathogenic isolate R
26 while minimum in moderately
pathogenic isolate R22
(Table 2) and the higher peroxidaseactivities among R. bataticola isolates was recorded in highlypathogenic isolate R
34 (69.79 U min -1 mg-1 protein) and low in
moderately pathogenic isolate R
22 (39.35 U min-1 mg-1 protein).
However, the PPO activities in R. bataticola isolates wereranged from 0.17 to 1.10 U min-1 mg-1 protein with maximumactivities in highly
pathogenic isolate R
34 and minimum in
strongly pathogenic isolate R
47, whereas maximum esterase
activities was observed in moderately pathogenic isolate R
10
(9.92 μm min-1 mg-1 protein) and minimum in highly pathogenic
isolate R26
(3.01 μm min -1 mg-1 protein). The quantitativeestimation of protein, peroxidase, esterase and polyphenoloxidase in mycelial extract of R. bataticola isolates, revealedthat their content varies from isolate to isolate. The markedvariation in protein content and highly pathogenic ability ofR. bataticola isolates with higher content of protein in R
26
isolate and enzymes (peroxidase and polyphenol oxidase) inR
34 isolates were on the same line as reported by Asoufil et al.,
(2007) and Mondal et al. (2013) while working on the R.
solani and Sclerotinia sclerotirium isolates, respectively.
Protein and isozyme studies by Polyacrylamide GelElectrophoresis (PAGE)
Polyacrylamide Gel Electrophoresis (PAGE) was used to tostudy the variation in protein and isozyme patterns of differentisolates of R. bataticola.
Distance traveled by protein / isozyme
Distance traveled by tracking dye Relative front (Rf) =
1167
PROTEIN AND ISOZYME PATTERNS
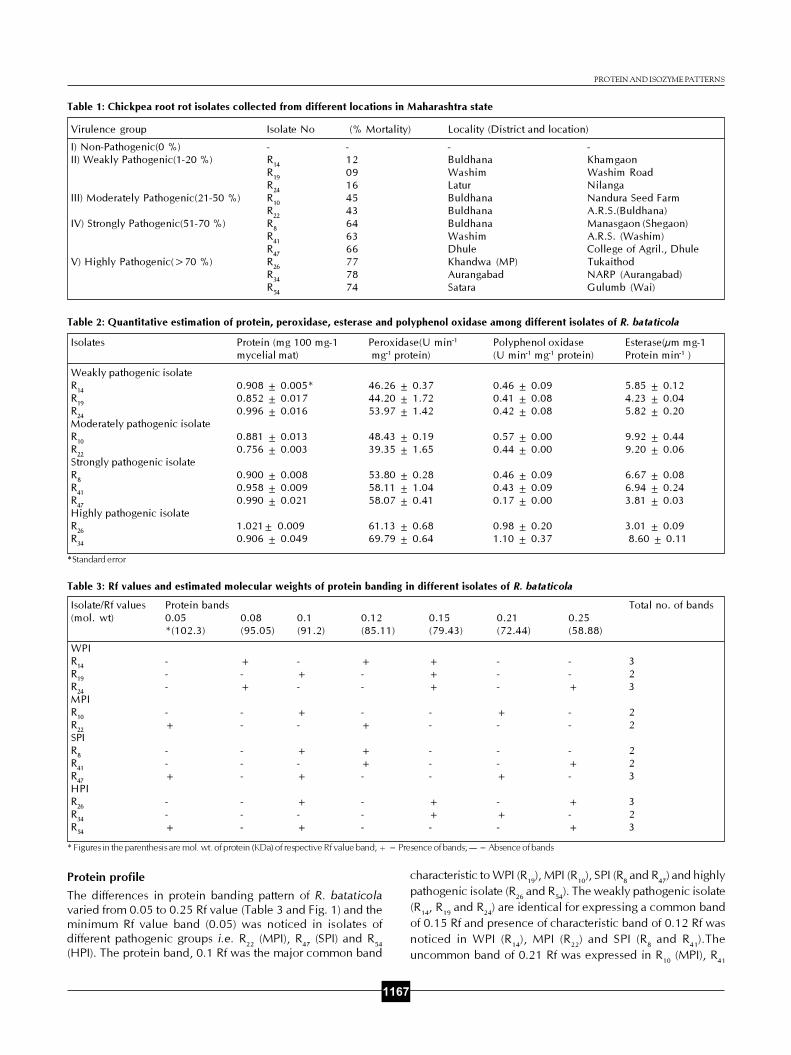
Protein profile
The differences in protein banding pattern of R. bataticolavaried from 0.05 to 0.25 Rf value (Table 3 and Fig. 1) and theminimum Rf value band (0.05) was noticed in isolates ofdifferent pathogenic groups i.e. R
22 (MPI), R
47 (SPI) and R
54
(HPI). The protein band, 0.1 Rf was the major common band
characteristic to WPI (R19
), MPI (R10
), SPI (R8 and R
47) and highly
pathogenic isolate (R26
and R54
). The weakly pathogenic isolate
(R14
, R19
and R24
) are identical for expressing a common band
of 0.15 Rf and presence of characteristic band of 0.12 Rf was
noticed in WPI (R14
), MPI (R22
) and SPI (R8 and R
41).The
uncommon band of 0.21 Rf was expressed in R10
(MPI), R41
Table 1: Chickpea root rot isolates collected from different locations in Maharashtra state
Virulence group Isolate No (% Mortality) Locality (District and location)
I) Non-Pathogenic(0 %) - - - -II) Weakly Pathogenic(1-20 %) R
1412 Buldhana Khamgaon
R19
09 Washim Washim RoadR
2416 Latur Nilanga
III) Moderately Pathogenic(21-50 %) R10
45 Buldhana Nandura Seed FarmR
2243 Buldhana A.R.S.(Buldhana)
IV) Strongly Pathogenic(51-70 %) R8
64 Buldhana Manasgaon (Shegaon)R
4163 Washim A.R.S. (Washim)
R47
66 Dhule College of Agril., DhuleV) Highly Pathogenic(>70 %) R
2677 Khandwa (MP) Tukaithod
R34
78 Aurangabad NARP (Aurangabad)R
5474 Satara Gulumb (Wai)
Table 2: Quantitative estimation of protein, peroxidase, esterase and polyphenol oxidase among different isolates of R. bataticola
Isolates Protein (mg 100 mg-1 Peroxidase(U min-1 Polyphenol oxidase Esterase(μm mg-1mycelial mat) mg-1 protein) (U min-1 mg-1 protein) Protein min-1 )
Weakly pathogenic isolate
R14
0.908 ± 0.005* 46.26 ± 0.37 0.46 ± 0.09 5.85 ± 0.12
R19
0.852 ± 0.017 44.20 ± 1.72 0.41 ± 0.08 4.23 ± 0.04
R24
0.996 ± 0.016 53.97 ± 1.42 0.42 ± 0.08 5.82 ± 0.20
Moderately pathogenic isolate
R10
0.881 ± 0.013 48.43 ± 0.19 0.57 ± 0.00 9.92 ± 0.44
R22
0.756 ± 0.003 39.35 ± 1.65 0.44 ± 0.00 9.20 ± 0.06
Strongly pathogenic isolate
R8
0.900 ± 0.008 53.80 ± 0.28 0.46 ± 0.09 6.67 ± 0.08
R41
0.958 ± 0.009 58.11 ± 1.04 0.43 ± 0.09 6.94 ± 0.24
R47
0.990 ± 0.021 58.07 ± 0.41 0.17 ± 0.00 3.81 ± 0.03
Highly pathogenic isolate
R26
1.021± 0.009 61.13 ± 0.68 0.98 ± 0.20 3.01 ± 0.09
R34
0.906 ± 0.049 69.79 ± 0.64 1.10 ± 0.37 8.60 ± 0.11
*Standard error
Table 3: Rf values and estimated molecular weights of protein banding in different isolates of R. bataticola
Isolate/Rf values Protein bands Total no. of bands
(mol. wt) 0.05 0.08 0.1 0.12 0.15 0.21 0.25
*(102.3) (95.05) (91.2) (85.11) (79.43) (72.44) (58.88)
WPI
R14
- + - + + - - 3
R19
- - + - + - - 2
R24
- + - - + - + 3
MPIR
10- - + - - + - 2
R22
+ - - + - - - 2SPI
R8
- - + + - - - 2R
41- - - + - - + 2
R47
+ - + - - + - 3HPIR
26- - + - + - + 3
R34
- - - - + + - 2R
54+ - + - - - + 3
* Figures in the parenthesis are mol. wt. of protein (KDa) of respective Rf value band; + = Presence of bands; — = Absence of bands

1168
(SPI) and R34
(HPI). The findings were in accordance with the
work of Martin and Pagare (2012) showed several bands ofwater soluble fractions of lens protein ranging from 70-13.5kDa and 74-13.5 kDa in P. ticto and R. daniconus, respectivelyby SDS-PAGE.
Molecular weight (KDa)
In the present study Fermentas make unstained proteinmolecular weight marker with sharp bands in the range of14.4 KDa to 11.6 KDa was loaded in the electrophoresisassembly along with samples of R. bataticola for estimation ofmolecular weight (KDa). The molecular weight proteins in R.bataticola isolates varied from 58.88 to 102.3 KDa (Table 3).Among WPI lower mol. wt. protein, 58.88 was noticed in R
24
isolate and higher of 95.05 KDa in R14
and R24
isolates, while79.43 KDa proteins was observed in all isolates (R
14, R
19 and
R24
). Strongly pathogenic isolate (R8 and R
41) were similar for
expressing 85.11 KDa proteins and R8 and R
47 for 91.20 KDa
proteins and highly pathogenic isolate (R26
and R54
) havingtwo equal bands of 58.88 and 91.20 KDa proteins and 79.43
Table 4: Rf values of esterase banding pattern in R. bataticola isolates
Isolate/ Isozyme bands Total no.Rf values of bands
0.034 0.045 0.099 0.315 0.341 0.352 0.364 0.371 0.438 0.466 0.477 0.483 0.494 0.506 0.539 0.944WPIR
14+ - - - - - + - - - + - - - - - 3
R19
+ - - - - - + - - - + - - - - - 3R
24- - + - - - + - - - - + - - + + 5
MPIR
10+ - - - - - + - - - - - - + - - 3
R22
- - - - + - - - - + - - - - - - 2SPIR
8- + - - - + - - - + - - - - - - 3
R41
- + - + - - - - - - - - - + - - 3R
47- + - - - - - + - - - - + - - - 3
HPIR
26- - + + - - - - - - - - + - - - 3
R34
- - - - + - - - - - - - - + - + 3R
54+ - - - - - + - + - - - - - - - 3
+ = Presence of bands; — = Absence of bands; WPI- Weakly Pathogenic Isolate; MPI- Moderately Pathogenic Isolate; SPI- Strongly Pathogenic Isolate; HPI- Highly; Pathogenic Isolate
Table 5: Rf values of polyphenol oxidase banding pattern in R. bataticola isolates
Isolate / Rf values Isozyme bands Total no. of
bands
0.024 0.036 0.044 0.056 0.131 0.144 0.202 0.222 0.226 0.244
WPI
R14
- - + - + - - - - + 3
R19
- + - - - + - + - - 3
R24
+ - - - + - - - + - 3
MPI
R10
- - + - - + - - - + 3
R22
- - + - + - - + - - 3
SPI
R8
- - - + - + - - - + 3
R41
- + - - + - - - - + 3
R47
- + - - + - - - + - 3
HPI
R26
+ - - - + - - - + - 3
R34
+ - - - + - - - - + 3
R54
+ - - - + - + - - - 3
+ = Presence of bands; — = Absence of bands
KDa in both R26
and R34
isolates, however HPI R54
havinghigher mol. wt. protein of 102.3 KDa. Thus, variation in theprotein concentration among the isolates was observed in thepresent study. Similar observations on variations in the proteincontent were made on F. oxysporum f. sp. carthami(Raghuwanshi and Dake, 2005) and Fusarium oxysporuminfecting FCV Tobacco in Karnataka (Sumana and Devki,2014).
Esterase
The results presented in Table 4 revealed that the esterasebanding pattern in all isolates of R. bataticola varied from0.034 to 0.944 Rf and maximum five esterase bands wasnoticed in WPI R
24 (Rf value range from 0.099 to 0.944 Rf) (Fig.
2). The band of 0.0341 Rf was exhibited in WPI (R14
and R19
),MPI (R
10) and HPI (R
54) and one common band of 0.045 Rf was
noticed in SPI (R8, R
41 and R
47) which was absent in other
isolates. The presence of 0.364 Rf band in WPI (R14
, R19
andR
24) and 0.477 Rf band in WPI (R
14 and R
19) showed the
uniqueness in pathogenic groups. However, the bands 0.352,
N. B. PAWAR AND Y. V. INGLE

1169
Table 6: Rf values of peroxidase banding pattern in R. bataticola
isolates
Isolate / Isozyme bands Total no.Rf values of bands
0.023 0.034 0.046 0.092 0.103WPIR
14- + - - - 1
R19
- - + - - 1R
24- - + - - 1
MPIR
10- + - - - 1
R22
- + - - - 1SPIR
8+ - - - - 1
R41
- + - - + 2R
47- - + - - 1
HPIR
26- - + - - 1
R34
- + - + - 2R
54- - - - - 0
+ = Presence of bands; — = Absence of bands
Figure 2:Esterase is ozymes electrophoregrem in the is olates osRhizo Rhizoctonia bataticola is olates
ISOLATES
WPI MPI SPI HPI
R14
R19
R24
R10
R22
R8
R41
R47
R20
R34
R55
Figure 1: Protein electrophoregram of Rhizoctonia bataticola is nativepage
ISOLATES
WPI MPI SPI HPI
M R14
R19
R24
R10
R22
R8
R41
R47
R20
R34
R55
Figure 3: Polyphenol oxidas is ozymes electrophoregram in the isolates of rhizoctonia bataticola is olates
ISOLATES
WPI MPI SPI HPI
R14
R19
R24
R10
R22
R8
R41
R47
R20
R34
R55
Figure 4: Peroxidase is ozymes electrophoregram in the is olates ofrhizoctonia bataticola is olates
ISOLATES
WPI MPI SPI HPI
R14
R19
R24
R10
R22
R8
R41
R47
R20
R34
R55
0.371, 0.438, 0.483 and 0.539 Rf expressed in one isolateonly and absent in other isolates. Thus, no consistentappearance of esterase isoenzyme bands was visualized inthe different pathogenic groups, which indicates variabilityamong isolates of R. bataticola.
Polyphenol oxidase
Ten PPO bands within range of 0.024 to 0.244 Rf were presentin 11 isolates of R. bataticola with most common band of0.131 Rf in MPI (R
14 and R
24), MPI (R
22), SPI (R
41 and R
47) and
HPI (R26
, R34
and R54
) isolates (Table 5 and Fig. 3). The 0.024 Rfband was present in all isolates of HPI and 0.044 Rf band inMPI (R
10 and R
22) support the uniqueness in R. bataticola
isolates based on their pathogenic ability. However, the bandof maximum 0.244 Rf was noticed in MPI (R
10), SPI (R
8 and R
41)
and HPI (R34
). The banding pattern of PPO showed variationwith respect to isolates tested and also no consistency in theappearance of band was noticed.
Peroxidase
The peroxidase banding pattern in case of R. bataticolarevealed that may isolates produced only one band, except
PROTEIN AND ISOZYME PATTERNS

1170
isolates R41
(0.034 and 0.103 Rf) and R34
(0.034 and 0.092)forms two bands, while no band was noticed in R
54 isolate
(Table 6 and Fig. 4). The band of Rf value 0.034 was present inR
14, R
10, R
22, R
41 and R
34 isolates and 1.046 Rf band in R
19, R
24,
R26
and R47
isolates. The isolates of R. bataticola do not showedany variation in respect of peroxidase banding pattern as pervirulence of isolates.
Thus, marked variation among different pathogenic groups inrespect of protein profile relates the existence of variabilityamong the isolates of R. bataticola causing chickpea root rot.The findings of Mandal et al. (1994) and Giri (2003) are in the
similar line of present results; while working on protein andisozyme pattern of Fusarium spp. Yehia et al. (2007) also
revealed the polymorphism among R. solani isolates using
esterase and peroxidase enzyme. Mahmoud et al. (2012)electrophoresed soluble proteins of the 21 isolates of
Rhizoctonia solani by using SDS-PAGE and these isolates were
categorized into three anastomosis groups base on proteinbanding patterns. Similarly, variations among different isolatesof Fusarium ciceri were studied in respect of protein andisozyme analysis by Pawar and Mane (2014).
Although our electrophoresis study was insufficient to makeany inferences concerning the contribution of the observedgenetic diversity to population structure in this study, butseveral relationships between protein and isozyme profilingdata were used as to tool to assess the extent of variability.
REFERENCES
Asoufil, H., Hameed, K. M. and Mahasneh, A. 2007. The Cellulase
and Pectinase activities associated with the virulence of Indigenous
Sclerotinia sclerotiorum isolates in Jordan Valley. Plant. Pathol. J.
23(4): 233-238.
Bradford, M. M. 1976. A rapid and sensitive method for the
quantification of microgram quantities of protein utilizing the principle
of protein dye banding. Anal. Biochem. 72: 248-254.
Dary, O., Georghiou, G. P., Parsons, E. and Pasteur, N. 1990.
Microplate adoption of gomori’s assay for quantitative determination
of general esterase activity in single insects. J. Econ. Entomol. 83(6):2187-2192
Giri, G. K. 2003. Pathogenic variability in Fusarium udum Butler.Ph.D (Agri.) Thesis (Unpubl.) Dr. PDKV, Akola
Hussein, E. M., Allam, A. D., Aly, A. A. and Amein, A. M. 2000.Separation by protein electrophoresis of Rhizoctonia spp. isolatedfrom cotton seedlings. J. Agric. Sci. Mansoura Univ. 25: 4035-4046
Mahmoud, M. A., Al-Sohaibani, S. A., Abdelbacki, A. M. M., Al-Othman1, M. R., Abd El- Aziz, A. R. M., Kasem, K. K., Mikhail, M. S.,Sabet, K. K., Omar, M. R. and Hussein E. M. 2012. Molecularcharacterization of the pathogenic plant fungus Rhizoctonia solani(Ceratobasidiaceae) isolated from Egypt based on protein and PCR-
RAPD profiles. Genet. Mol. Res. 11(4): 3585-3600.
Mandal, Q. A., Din, G. E. and Moahammed, S. A. 1994.Electrophoresis analysis of Pathogeneic and non pathogenic strains of
Fusarium oxysporum. Rivista di Pathologia vegetable. 4(2): 59-68.
Martin, E. R. and Pagare, S. D. 2012. Comparative electrophoretic
studies of lens protein isolated from Puntius ticto (Hamilton 1822)
and Rasbora daniconus (Hamilton 1822). The Bioscan. 7(4): 571-
574
Mayer, A. M., Harel, E. and Shaul, R. B. 1965. Assay of catechol
oxidase critical comparison methods. Phytochem. 5: 782-789.
Mondal, A., Dutta, S., Kuiry, S. P., Chakraborty, D., Nandi, S., Das,S., Ray, S. K. and Chaudhuri, S. 2013. The biochemical constituents
and Pectinase activities associated with the virulence of Rhizoctonia
solani isolates in rice in West Bengal, India. African J. Agri. Res.
8(23): 3029-3035.
Nene, Y. L. and Haware, M. P. 1980. Screening chickpea for resistance
to wilt. Plant Dis. 66: 379-380.
Nov Acky, M. N. and Hamptom, R. E. 1968. Peroxidase isozymes in
virus infected plants. Phytopathology. 58: 301-305.
Panda Amrita, K., Bisht, S. S. and Panigrahi, A. K. 2013. Bio-chemical
and molecular characterization of Thermophiles from hot water spring
of Southern Odisha. Special issue, Vol. III: The Ecoscan. 133-145.
Park, Y. K., Sato, H. H., Almedia, T. D. and Moretti, R. H. 1980.
Polyphenol Oxidase of mango variety, Haden. J. of Food Sci. 45:1619-1621.
Pawar, N. B. and Mane, S. S. 2014. Protein and isozyme patterns of
Fusarium oxysporum f. sp. ciceri isolates causing chickpea wilt. Ind.
Phytopath. 67(3): 234-237.
Raghuwanshi, K. S and Dake, G. N. 2005. Variability in PAGE Protein
pattern of safflower wilt Pathogen Fusarium oxysporum f. sp. carthami
J. Mycol. Pl. Pathol. 35(1): 122-124.
Retig, N. 1974. Change in peroxidase and polyphenol oxidase
associated with natural and induced resistance of tomato to Fusarium
wilt. Physiol. Plant Pathol. 4: 145-150.
Sadasivam, S. and Manickam, A. 1996. In-Biochemical method. II
Edn. (p) ltd. Publishers and TNAU. Coimbatore.
Sumana, K. and Devaki, N. S. 2014. Morphological and biochemical
variations of Fusarium oxysporum infecting FCV Tobacco in Karnataka.
Int. J. Agril. Res. 4(1): 51-58.
Vallejos, E. 1983. Enzyme activity staining. In: Isozymes in plant
Genetics and Breeding. (Eds. Tanskely, S. D. and T. J. Orton). Part A.
Elsevier Science Publication, B. V. Amesterdam. pp. 469-511.
Vishwadhar and Chaudhary, R. G. 2001. Disease resistance in pulse
crop-current status and future approaches. In: The Role of Resistance
in Intensive Agriculture (S.Nagarajan and D.P. Singh, eds). Kalyani
publisher, New Delhi, pp.144-157.
Yehia, A. G., Mahmoud, M. Reda Gaffar and Mubarak, H. M. 2007.Genetic diversity among Nile Delta isolates of Rhizoctiria solani
Kuhn based on pathogenesis, compatibilty, isozyme analysis and total
protein pattern. Turk J. Bot. 31: 19-29.
N. B. PAWAR AND Y. V. INGLE