save money and the environment: environmental compliance
TRANSCRIPT


KPPCKentucky’s Resource Center forEnvironmental Sustainability
Environmental Compliance Training for
Correctional FacilitiesJuly 15, 2009
Rebecca Cash, P.E., CEM, Engineer
Save Money and the EnvironmentSave Money and the Environment

What Is KPPC?What Is KPPC?
KPPC is a non-profit organization established in 1994 through a legislative mandate
Statewide technical assistance & outreach programs
Based at the University of Louisville’s J.B. Speed School of Engineering
Represents the University of Louisville as a nationally recognized Center of Excellence
Provides hands-on training for students through the Cooperative Education Program at SSoE
2

KPPCKPPCMission
KPPC is Kentucky’s primary resource to help businesses, industries and other organizations develop environmentally sustainable, cost-saving solutions for improved efficiency.
Based at the University of Louisville J.B. Speed School of Engineering, KPPC provides technical information and assistance that is free, confidential and non-regulatory.
3
Pollution PreventionPollution Prevention
Source ReductionPurchasing food in bulkNon-disposable plates, cups and silverwarePurchasing goods in returnable containersUtilizing green products for cleaningRepair and reuse of textilesRepair and reuse of electronics
4
Pollution PreventionPollution Prevention
RecyclingPaperMetal
• Aluminum• Steel
PlasticsElectronics
CompostingFood WasteYard Trimmings
5

Sampson Correctional InstitutionSampson Correctional Institution
Vermi-CompostingReduction of 45 tons/year of organic waste biosolids2 units handling 480-700 lbs/day food wasteReduction of 5 - 8 yd3 dumpsters per week to a 34 yd3 compactor emptied monthly
Waste ReductionKitchen staff conducted audit to reduce food waste
6
Sampson Correctional InstitutionSampson Correctional Institution
RecyclingBaling and recycling of 1 ton steel, ¼ ton plastic, 1,200 tons aluminum cans and 3.2 tons cardboardRevenue of $2,200 per month
Staff and inmates utilize plastic/glass drink containers from aluminum can revenue
Results86% reduction in solid wastes resulting in $74,000/yr in cost savings
7

Brown Creek Correctional InstituteBrown Creek Correctional InstituteSource Reduction
Bulk storage of cleaning suppliesIndividual milk cartons replaced with bladder dispenserReplacing foam cups with reusable cupsElectric hand dryers replacing paper towels
Composting Vermi, static pile, and in-vessel compostingWastes from food services, vegetable garden and greenhouses, dryer lint, hair from barber shop, and eggshells
8

Brown Creek Correctional InstituteBrown Creek Correctional Institute
Recycling and Reuse Hand sorting and recycling of aluminum and steel cans, plastic containers, office paper, mixed paper and cardboardReuse of food service items, inmate clothing, and serviceable materialOld broomsticks and wood pallets used as tomato stakesRecycling of meat and bone scraps, cooking grease, and used motor oil
9
Brown Creek Correctional InstituteBrown Creek Correctional Institute
Cost SavingsTrash pick-ups reduced from twice weekly to once per month with $1,056/month savingsTrash quantity reduced by 67% from 28 tons to 9 tons per monthClothing recovery reduced clothing expenditures by $48,000/year
10

Tennessee Dept. Of CorrectionsTennessee Dept. Of Corrections
Computer Recycling 65 tons of computers refurbishedRepairing 2,332 PC units from 3 computer repair and reuse centersComputers were placed into public schools
CompostingComposted 1,600 tons of organic materialsUtilized compost on-siteSaved $460,433 in disposal and compost costs
11
Tennessee Dept. Of CorrectionsTennessee Dept. Of Corrections
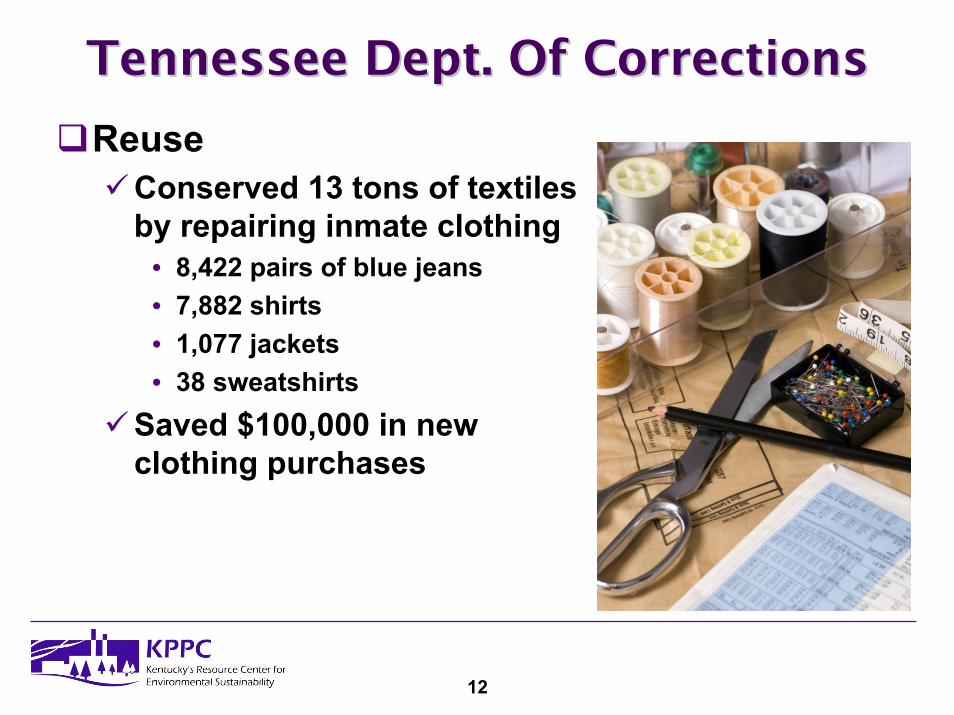
ReuseConserved 13 tons of textiles by repairing inmate clothing
• 8,422 pairs of blue jeans• 7,882 shirts• 1,077 jackets• 38 sweatshirts
Saved $100,000 in new clothing purchases
12

Georgia Dept. Of CorrectionsGeorgia Dept. Of Corrections
Composting and Recycling at 6 PrisonsFood waste and yard trimmings compostedRecycling of aluminum, cardboard, paper, plastics and steelRevenues from recyclables offset program costs Diverted 8,564 tons from the landfill saving $357,000 in landfill tipping feesCompost saved $100,000/yr on fertilizer costsInmates involved in the program gained marketable job skills
13
Energy EfficiencyEnergy Efficiency
Energy efficiency is a true "pollution prevention" technique, because at its core is source reduction and improved production
efficiency. Improvements to process efficiency result in the decreased use of
materials, labor, and wastes. The efficient use of energy results in decreased use of
resources, less air pollution, and therefore, cost savings.-Virginia Department of Environmental Quality
14

KPPCKPPC’’s Energy Assistance Models Energy Assistance Model
Phase 1: “Tabletop” Assessment - 12-month energy bill analysis:
Billing errorsTariff comparison/evaluationInterruptible powerContract demandLoad shifting, load sheddingPower factor penalties/correctionMinimum billing provisions
15
KPPCKPPC’’s Energy Assistance Models Energy Assistance Model
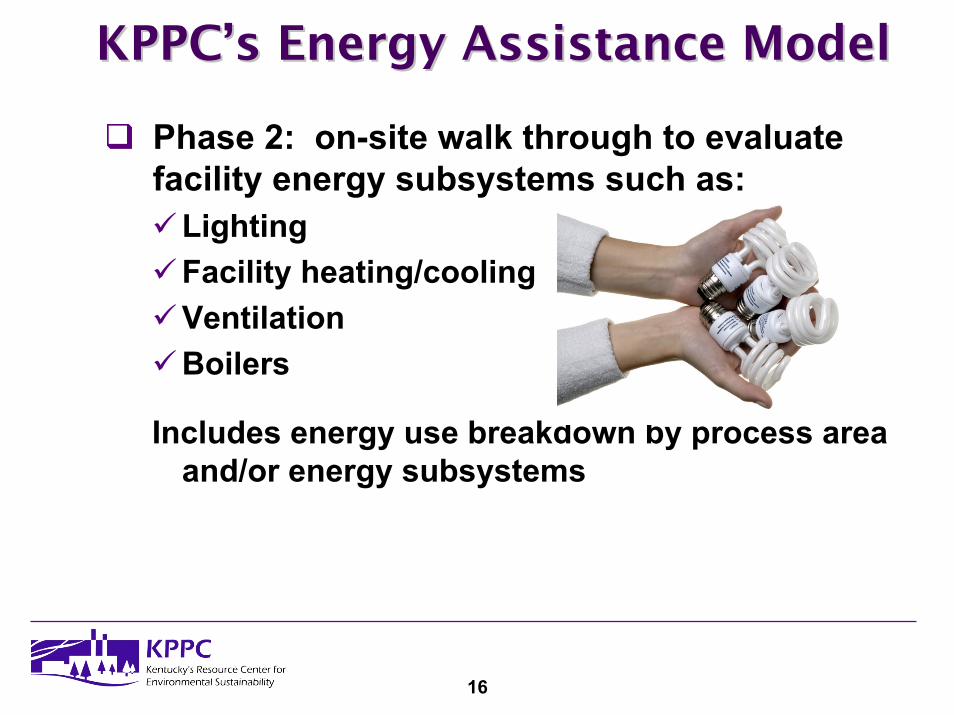
Phase 2: on-site walk through to evaluate facility energy subsystems such as:
LightingFacility heating/coolingVentilationBoilers
Includes energy use breakdown by process area and/or energy subsystems
16

Energy Bill AnalysisEnergy Bill Analysis
Essential component of any energy management program
Continuing account of energy use and cost
Keeping up-to-date records of monthly energy consumption and associated costs
A separate record will be required for each type of energy used, i.e., gas, electric, oil, etc.
A single energy unit should be used to express the heating values of the various fuel sources (MMBtu)
17
If you can’t measure it, you can’t manage it!
Energy Units Energy Units –– Electricity AnalogyElectricity Analogy
18
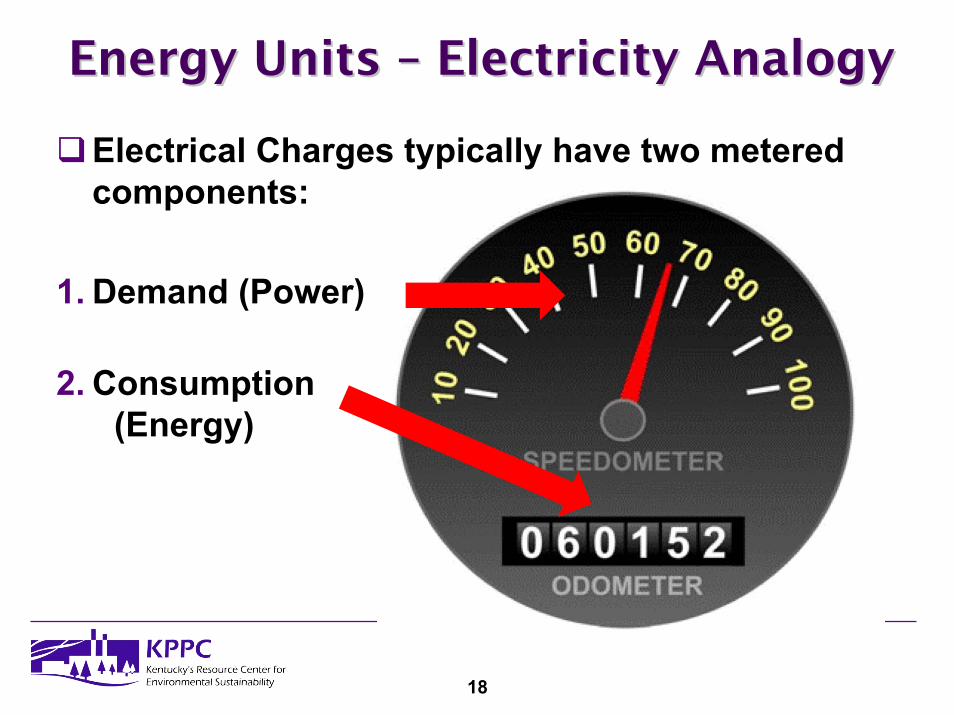
Electrical Charges typically have two metered components:
1. Demand (Power)
2. Consumption(Energy)

Billing & Rate StructureBilling & Rate StructureUtility companies classify electric and natural gas service according to Rate types
Potential Rate Examples: Residential; General Service; Commercial; Industrial
Riders modify the structure of a Rate and based upon specific qualifications of the customer
Potential Rider Examples: Interruptible; HLF (High Load Factor);TOD (Time-of-Day); Green Energy
Tariff Rates & Riders:State Public Service Commission WebsitesUtility Website
19

20

Power FactorPower FactorLow Power Factor (PF) Penalty
Typically caused by using magnetic devices such as light ballasts, motors, transformers…Assessed when below 80% or 90%
Three Effects of Low PF(<80%)Robs the Distribution System of CapacityHigher Currents = High Voltage Drop & Electrical System LossesBilling Penalty ($)
Improvements:Capacitors, High-PF Motors and Lighting Ballasts
21

Other Clauses And ConsiderationsOther Clauses And Considerations
Contract Demand – minimum monthly billing demand and excess demand charge
Demand Ratchet – billing mechanism that selects the highest demand from the current month or previous month(s)
Sometimes a percentage of the highest demand recorded in the previous 11 months is used.
22

Other Clauses And ConsiderationsOther Clauses And ConsiderationsMinimum Energy Charge – typically based upon a contract demand.
Ex. Contract Demand 500 kW x 400 Hours = 200,000 kWh200,000 kWh x Energy Price (~$0.06 kWh) = $12,000
Time of DayEstablishes a daily time period in which the peak demand is measuredCan also be used to establish peak and non-peak energy usage charge (Time of Use)
23

Natural Gas ServiceNatural Gas Service
Natural Gas Charges typically have two components on the bill:
Supply – The purchase cost for the physical natural gas supplied by the utility (local distribution company).
Distribution/Transportation – The cost to deliver the physical natural gas through the utility’s distribution system to the customer.
24

25

Natural Gas ServiceNatural Gas Service
Generally, in the State of KY you have to take utility-supplied gas, unless you are behind a utility that offers third-party supply for “large” customers“Large” is defined separately by each participating utility
i.e., LG&E requires that you average 50 MCF/day through a single meter or 50,000 MCF/yr
Either way, you will still have to pay the utility for transporting the gas to you
26

Billing & Rate StructureBilling & Rate Structure
“As a result of your analysis, ICS did switch to a more economical electrical rate structure that will save us over $11,000 per year. The Vice President of Operations was able to get a rebate in excess of $13,000 and have our two companies metered together so that we can enjoy the optimal rate structure as well with an estimated savings of $17,800 for the upcoming year for both companies.”
27

Energy Bill Analysis Leads Where? Energy Bill Analysis Leads Where? Trends and irregularities in energy usage and costs can be detectedTrack energy use, demand and cost
Normalize to occupancy/production/temperatureCommon tools:
SpreadsheetsEnergy Star Portfolio ManagerUtility websites Energy Service• Web-based utility tracking & reporting services• Real-time energy tracking services
28
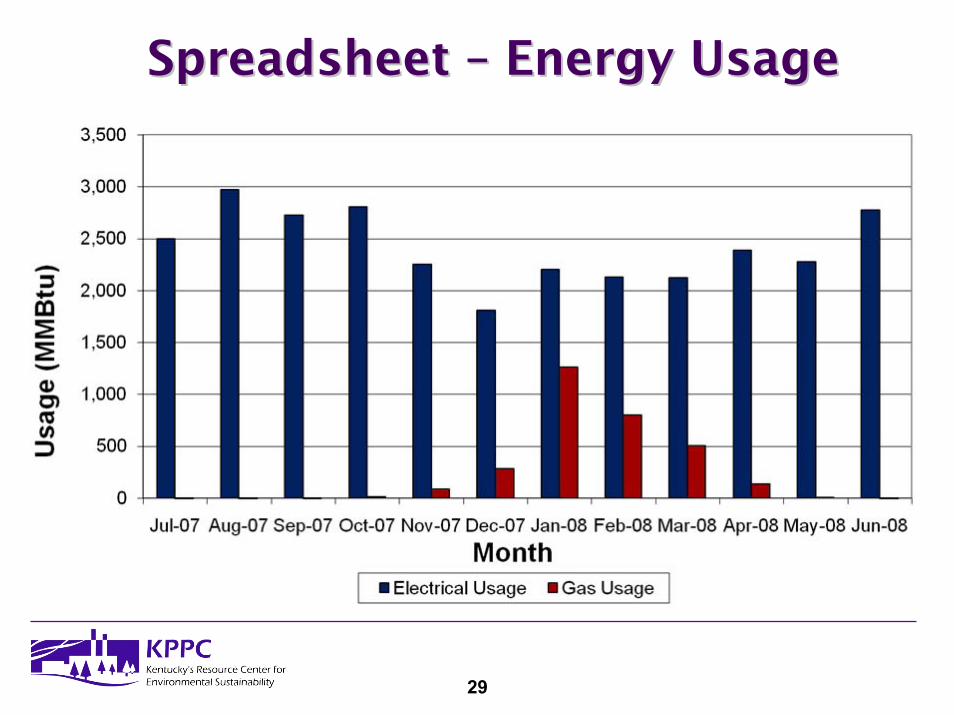
Spreadsheet Spreadsheet –– Energy UsageEnergy Usage
29

Spreadsheet Spreadsheet –– Monthly Demand Monthly Demand Interval Data 2DInterval Data 2D
30
M-F

31
Phase II Phase II -- Where Does the Energy Go?Where Does the Energy Go?
Lights?
Hot Water?
AC?Computers?
Kitchen?

Typical Energy Use Breakdown Typical Energy Use Breakdown ––KY County PrisonKY County Prison
32

Conduct AnConduct AnEnergy Efficiency (E2) AuditEnergy Efficiency (E2) Audit
Identify and form an E2 audit team Gather pre-assessment informationConduct on-site facility visitIdentify energy conservation measures (ECMs)
Include both energy and cost savingsDetermine if ECMs are economically feasible
33

Assessment BenefitsAssessment Benefits
EconomicLower energy bills (usage and demand)Lower operating and maintenance (O&M) costs
Improve occupant environmentImprove comfort levelReduce environmental impactDevelop benchmarks
Energy ($/production unit, $/ft2)Demand (kw/month)
34

WhoWho’’s On The E2 Audit Team?s On The E2 Audit Team?
Facility PersonnelEnergy managerPlant/building managerMaintenance/custodial managerProduction managerMaintenance/custodianBilling/accounting
Equipment Vendors and SuppliersTechnical Assistance Provider or Consultant
35

Confirm The PrioritiesConfirm The Priorities
Save money?Improve comfort?Improve indoor air quality?Increase employee productivity?Opportunities to showcase?Reduce environmental impact?
36

Gather Site InformationGather Site Information
Talk with facility personnel to determine operating schedules and any known energy issuesConduct lighting, HVAC, and plug load equipment inventories, if not already completedRead equipment nameplates
37

38
Energy OpportunitiesEnergy Opportunities
No CostIncidental activitiesNo purchases requiredMinimal labor required
Low CostPurchases within existing O&M budgetSome dedicated labor needed
Capital CostSometimes it takes money to save money
Establish And Communicate A PolicyEstablish And Communicate A Policy
Connect it to the business planObjectives, roles, responsibilities, guidelinesTemperature set pointsComputer useBenchmarkingAwareness and trainingEnergy efficiency committee
39

Benchmark Your FacilityBenchmark Your Facility
Portfolio Manager
Energy Watchdog
Advantage IQ
MS Excel
40
Obtain And Analyze Load Profiles Obtain And Analyze Load Profiles
Benchmark all buildings firstSelect high energy-consuming building areas (kBtu/ft, kWh/production unit, etc.)Request a load profile from utility company
You can also build a load profile if they only will give you the raw interval data
Analyze power demand patternsLook for load-shedding and/or load-shifting opportunities
41

Motors
Target large motors with high annual operating hoursConsider Variable Frequency Drives (VFDs) and other controlsLook for improperly sized motorsEstablish a motor policy
Include rewind vs. replace decision guidelines Account for electricity cost, annual operating hours, critical motors
42

Ensure Key Maintenance Ensure Key Maintenance Activities Are PerformedActivities Are Performed
Filter changingFan belt replacementsCoil cleaningAC condensation drip pansDuct leak preventionBoiler system maintenance
Air/fuel mixtureCondensate recoveryPipe insulationSteam traps
43

Provide Energy Efficiency TrainingProvide Energy Efficiency Training
Types of TrainingAwareness – policies, practices, projects, general conceptsEducation – methods, techniques, procedures, technical conceptsJob-specific technical – maintenance, custodians, food service, admin, teachers, non-instructional staffTask-specific technical – designated person, checklist, specific instructions, schedule
44

Assign Responsibility For Common AreasAssign Responsibility For Common Areas
HallwaysMulti-purpose roomsCafeteriasAuditoriumsRestroomsProduction areasMeeting areasWarehouseStorage areas
ACME Company
Common Areas ChecklistSpace: Cafeteria
Monitor: Anita Jones
X Lights
X Doors/Windows
N/A Computers
XTemperature Settings
N/A Water Fixtures
N/A Exhaust Fans
Notes:
45

Control Exhaust FansControl Exhaust Fans
If the facility’s ventilation system is off, the exhaust fans can create negative air pressure
Outside air seeps in through openings in the building envelope and brings in air that affects building temperature and humidity
46
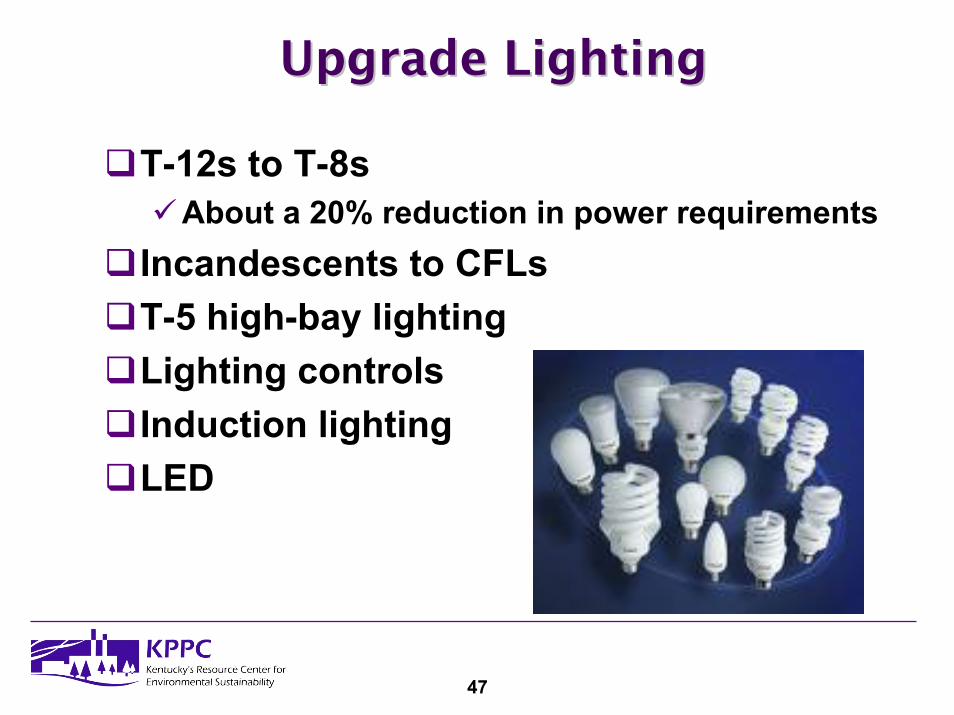
Upgrade LightingUpgrade Lighting
T-12s to T-8sAbout a 20% reduction in power requirements
Incandescents to CFLsT-5 high-bay lightingLighting controlsInduction lightingLED
47

Establish A Plug Load PlanEstablish A Plug Load Plan
PC power settingsPC security patch managementVending machine power controlStandby power
Use of power stripsUnplug if not usingOffice equipmentENERGY STAR rated
Seasonal shutdownRefrigeratorsKitchen equipmentWater heaters
48

Replace Exit Signs With LEDReplace Exit Signs With LED
Can be done with in-house maintenance staffAdd to your Preventative Maintenance programCan be done in conjunction with retrofit projectsLife cycle is more than 200,000 hoursYou probably have more than you think, and the savings are 24/365
49

Install Programmable Thermostats Install Programmable Thermostats
Identify good candidate areasRestrooms Other common areas
Check for compatibility with HVAC systemEnsure optimal settings, setbacks, and time schedulingConsider reasonable overrides
Every 1°F ≈ 1% Savings
50
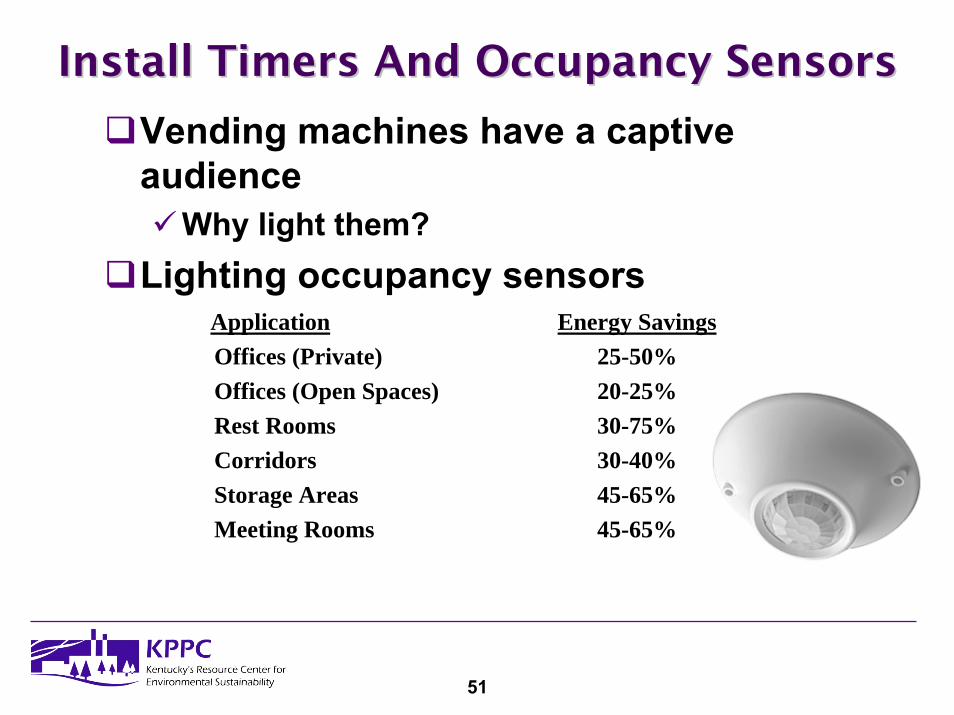
Install Timers And Occupancy Sensors Install Timers And Occupancy Sensors
Vending machines have a captive audience
Why light them?Lighting occupancy sensors
51
Application Energy SavingsOffices (Private) 25-50%Offices (Open Spaces) 20-25%Rest Rooms 30-75%Corridors 30-40%Storage Areas 45-65%Meeting Rooms 45-65%

Use Enhanced Auditing ToolsUse Enhanced Auditing Tools
Upgrades BAS to enable trending analysisUtility bill analysisSubmeteringPower monitoringData loggersInfrared thermography
Roof & wallsHVAC ductsElectrical system
52
Implement Building Commissioning Implement Building Commissioning
Can cost from $25k - $85k, but still have paybacks of 1 - 3 yearsCan uncover multiple issues
Simultaneous heating and coolingDefective or out-of-calibration sensorsBAS not programmed effectivelyOperating systems not optimizedOwners operating requirements not followedSet points incorrect or overlappingImproper control of outside airBuilding envelope failuresSpace use changes
Consider building automation system (BAS) to maintain commissioned settings
53

Install Mechanical System UpgradesInstall Mechanical System Upgrades
System controls (occupancy, CO2, etc.)Variable Speed Drives (VSDs) for fans and pumpsUpgraded AC systemsUpgrade to properly sized, high-efficiency boilerInstall a flue gas analyzer to adjust boiler mix ratioRepair leaking steam trapsInstall a heat recovery system
54
Building Envelope ProjectsBuilding Envelope Projects
Outside air dampersCool roofsSolar tube daylightingWindow filmsInsulation repairs/upgradesAir duct sealing/insulation
Due to possibly longer payback periods,consider bundling these with other projects
55
Adopt A PreventativeAdopt A PreventativeMaintenance ProgramMaintenance Program
Move beyond reactive and routine maintenancePM program components
Overview – objectives, cost, benefitsSystems and equipment inventoryInspection program – evaluate physical and functional conditions, note optimization needsPM scheduleHazard awarenessStandard operating process for work orders
56

Prioritize AppropriatelyPrioritize Appropriately
57
CAPITALPROJECTS1 – 10 YEAR
Utility Rate Options0 – 1 YEAR PAYBACK
COST - BENEFIT RATIO
LOW COST
HIGH COST
Move up the opportunity hierarchy!Move up the opportunity hierarchy!
Operating & Maint< 3 YEAR PAYBACK
Demand-side
Supply-side

KPPC Contact InfoKPPC Contact Info
Rebecca Cash [email protected]
Kentucky Pollution Prevention Center (KPPC)University of LouisvilleLouisville, Kentucky 40292
Phone: (800) 334-8635 Ext. 8520965 or(502) 852-0965
Fax: (502) 852-0964
Web Site: www.kppc.org
58