savannah river site environmental report 2019
TRANSCRIPT

SRNS-RP-2020-00064
2019
S AVA N N A H R I V E R S I T EEnvironmental Report

Savannah River Site employees took the photographs featured on the cover of the 2019 SRS Environmental Report as part of the Site’s pilot run of Snap SRS. The employee-driven competition cost-effectively promotes Site pride of ownership, improves facility appearances, and boosts workplace morale through art. The 2019 contest drew 246 photographs. Three Snap photographs taken onsite and in the community have been incorporated into the cover design.
Front Cover—Pollinator Fire Burst, taken by Karyn Bland, Savannah River Nuclear Solutions, LLC Back Cover—Sunset Over the River, Local Scenery winning selection, taken by Mark Amidon, Savannah River National Laboratory Front and Back Cover Background—Rushing Water, taken by Laura Russo, Savannah River Nuclear Solutions, LLC
For more information about this report contact:
Teresa Eddy Savannah River Nuclear Solutions, LLC Building 730-4B, Savannah River Site Aiken, SC 29808 Telephone: 803-952-8253 E-mail address: [email protected]
or go to the SRS Environmental Report webpage at http://www.srs.gov/general/pubs/ERsum/index.html and under the SRS Environmental Report 2019, complete the electronic Customer Satisfaction Survey.
This document was prepared in conjunction with work accomplished under Contract No. DE-AC09-08SR22470 with the U.S. Department of Energy. This work was conducted under an agreement with, and funded by, the U.S. Government. Neither the U.S. Government nor its employees, nor any of its contractors or subcontractors or their employees, makes any expressed or implied 1) warranty or assumes any legal liability for the accuracy or completeness—or for the use or results of such use—of any information, product, or process disclosed; or 2) representation that such use or results of such use would not infringe on privately owned rights; or 3) endorsement or recommendation of any specifically identified commercial product, process, or service. Any views and opinions of authors expressed in this document do not necessarily state or reflect those of the U.S. Government, or of its contractors or subcontractors.

SRNS-RP-2020-00064
Savannah River Site
Environmental Report 2019
Prepared by Savannah River Nuclear Solutions, LLC Savannah River Site Aiken, SC 29808

This page intentionally left blank

Environmental Report 2019 (SRNS-RP-2020-00064) i
nvironmental Compliance and Area Completion Projects within the Savannah River Nuclear Solutions, LLC (SRNS), produces this document. Savannah River Site (SRS) acknowledges with deep appreciation the efforts of the following individuals, who provided valuable resources, information,
technical data, or management, administrative, field, or other support for the SRS Site Environmental Report 2019 (contributors are with SRNS unless otherwise noted):
Jesse Baxley Kane Bice Jeri Buczek Daryl Doman James Hall Tim Hartley Jason Hyer Joyce Hopperton, Centerra-SRS
Natalia Johnson Bill Lewis Michael Lott Lisa McCullough Grace Miller Winston Moore Cap Nguyen Jesse Pierce
Kimberly Price Shane Shull Daniel Silver Mark Spires Rebecca Sturdivant Jason Walker Elizabeth Wooten
Special thanks to Vicky Sutton-Jackson, University of Georgia’s Savannah River Ecology Laboratory, for her support in providing contributions from SREL. Special thanks to Catherine Thomas, North Wind, for providing technical editing of this report. Her talent and diligence bring clarity to technical and complicated topics.
Thanks to Rachel Baker, Roy Blackwell, Jeff Bussey, and Robert Seremak for providing computer hardware and software support. Thanks to Daniel Campbell for reviewing and approving the release of this document and all supporting documents. Marvin Stewart is acknowledged with appreciation for providing Internet expertise and computer software support.
Appreciation is extended to the SRS Annual Site Environmental Report Team, who, individually and as a group, dedicated a large portion of their time and attention to seeking out, collecting, and confirming the information that went into this report. A special thank you to Martha Thompson, whose attention to detail ensures thoroughness and accuracy; and Teresa Eddy, the SRNS Environmental Monitoring Program manager, led and supported the group, interfacing with DOE-SR and regulators to present the information in this year’s report.
The ASER development team extends its sincere gratitude to Karen Vangelas for leading and managing the preparation of this report for the past five years. Karen retired in May after 30 years of service at SRS. Her hard work and dedication have improved the ASER for public use while also meeting DOE expectations. Karen's professionalism has been inspirational and will have an impact on the ASER program and the SRS Environmental Monitoring Program long past the publication of this year’s annual report. Greta Fanning has taken over as project lead, expertly and diligently guiding the document into publication.
E Acknowledgements
Karen Vangelas
Acknowledgements
ii Savannah River Site
2019 SRS Environmental Report Team

Acknowledgements
Environmental Report 2019 (SRNS-RP-2020-00064) iii0470)
Chapter Authors and Contributors
Ch. 1 Introduction
Martha Thompson, SRNS, Chapter Lead
LeighAnne Clifton, SRNS
Ch. 2 Environmental Management System
Ted Millings, SRNS, Chapter Lead
Lance Cramer, SRNS
Earl Joyner, SRNS
Ch. 3 Compliance Summary
LeighAnne Clifton, SRNS, Chapter Lead
Rob Backer, SRNS
Sarita Berry, SRNS
Susan Cornwell, SRNS
Lance Cramer, SRNS
Charlie Davis, USFS-SR
Katie Davis, SRNS
Keith Dyer, SRNS
Greta Fanning, SRNS
Jim Fudge, SRNS
Keith Liner, SRR
Shelia McFalls, SRNS
Ted Millings, SRNS
Donald Mosser, SREL
Angela Pizzino, SRNS
Carlton Shealy, SRNS
Jason Shirley, SRNS
Daniel Skiff, SRR
Keith Stephenson, SRARP
Kim Wolfe, SRNS
Jared Wicker, SRNS
Josh Yon, SRNS
Don Zahaba, SRNS
Ch.4 Nonradiological Environmental Monitoring Program
Lori Coward, SRNS, Chapter Lead
Greta Fanning, SRNS
Karen Vangelas, SRNS
Josh Yon, SRNS
Ch. 5 Radiological Environmental Monitoring Program
Eric Doman, SRNS, Chapter Lead
Lori Coward, SRNS
Teresa Eddy, SRNS
Timothy Jannik, SRNL
Brian Price, SRNS
Martha Thompson, SRNS
Karen Vangelas, SRNS
Jason Walker, SRNS
Ch. 6 Radiological Dose Assessment
Timothy Jannik, SRNL, Chapter Lead
Kenneth L. Dixon, SRNL
Brooke Stagich, SRNL
Ch. 7 Groundwater Management Program
Sadika O’Quinn, SRNS, Chapter Lead
Mark Amidon, SRNL Kevin Boerstler, SRNS Ciera Burns, SRNS Bryce Garner, SRNS Terry Killeen, SRNS Branden Kramer, SRNS Ashley Shull, SRNS Justin Steadman, SRNS Jeff Thibault, SRNS Jim Ullerly, North Wind Adam Willey, SRNS
Acknowledgements
iv Savannah River Site
Ch. 8 Quality Assurance
Brian Price, SRNS, Chapter Lead
Lori Coward, SRNS
Teresa Eddy, SRNS
Siobhan Kitchen, SRNS
Dennis Knapp, SRNS
Ted Millings, SRNS
Richard A. Warren, SRNS
Maatsi Ndingwan, in coordination with Amy Boyette, James DeMass, Angelia Holmes, and Jimmy McMillian, facilitated the DOE review and approval.
Maatsi Ndingwan

Environmental Report 2019 (SRNS-RP-2020-00064) v
he SRS Environmental Report for calendar year 2019 is an overview of environmental management activities conducted on and in the vicinity of SRS from January 1 through December 31, 2019. This report includes the following:
• A summary of implemented environmental management systems that facilitate sound stewardship practices and demonstrate compliance with applicable environmental regulations and laws intended to protect air, water, land, and other natural and cultural resources that SRS operations have impacted.
• A summary of the results of nonradiological parameters. These results are compared to permit limits and applicable standards.
• A summary of the results of effluent monitoring and environmental surveillance of air, water, soil, vegetation, biota, and agricultural products to determine radioactivity in these media. SRS compares the results with historical data and background measurements, and to applicable standards and requirements in order to verify that SRS does not adversely impact the environment or the health of humans or biota.
• A discussion of the potential doses to members of the public from radioactive releases from SRS operations compared to applicable standards and regulations, and from special-case exposure scenarios.
• An explanation of the quality assurance and quality control program, which ensures that samples and data SRS collects and analyzes are reported with utmost confidence.
Highlights The U.S. Department of Energy (DOE) Order 231.1B (Environment, Safety, and Health Reporting) requires Annual Site Environmental Reports (ASERs) to assess field environmental program performance, sitewide environmental monitoring and surveillance effectiveness, and to confirm sites are complying with environmental standards and requirements.
ASERs are prepared in a manner that addresses likely public concerns and to solicit feedback from the public and other stakeholders. Savannah River Site (SRS) began publishing ASERs in 1959.
Readers can find the SRS Environmental Report on the World Wide Web at the following address:
http://www.srs.gov/general/pubs/ERsum/index.html
T
To Our Readers

To Our Readers
vi Savannah River Site
The report addresses three general levels of reader interest:
1) The first is a brief summary with a “take-home” conclusion. This is presented in the “Highlights” text box at the beginning of each chapter. There are no technical tables, figures, or graphs in the “Highlights.”
2) The second level is a more in-depth discussion with figures, summary tables, and summary graphs accompanying the text. The chapters of the annual report represent this level, which requires some familiarity with scientific data and graphs.
3) The third level includes links to supplemental and technical reports and websites that support the annual report. The links to these reports may be found in the chapters or on the SRS Environmental Report 2019 webpage. Many of the reports mentioned in Chapter 3, Compliance Summary, are submitted to meet compliance requirements and are not available on the SRS Environmental Report 2019 webpage or through direct links. These reports may be obtained through a Freedom of Information Act request.
When a regulation or DOE Order requires reporting on a fiscal year (FY) basis, the information in this report is reported by FY. This allows for consistency with existing documentation. FY reporting is typically found in Chapter 2, Environmental Management System, and Chapter 3, Compliance Summary.
The SRS Environmental Report webpage contains reports from multiple years with the 2019 report being the latest. The report folders feature:
• The full report with hyperlinks to supplemental information or reports • Maps with environmental sampling locations for the various media samples. These figures are
identified as “Maps Figure” within the text of the report • Annual reports from SRS organizations
SRNS develops this report as the management and operations contractor to the DOE at SRS. In addition to SRNS, the contributors to the annual report include Savannah River Remediation, LLC (SRR); Parsons Government Services, Inc.; U.S. Department of Energy, Savannah River Operations Office (DOE-SR); Centerra-SRS; Ameresco Federal Solutions; Savannah River Ecology Laboratory (SREL); and U.S. Department of Agriculture (USDA) Forest Service-Savannah River (USFS-SR).
Environmental Report 2019 (SRNS-RP-2020-00064) vii
Acknowledgements ...................................................................................................................................... i
To Our Readers ............................................................................................................................................ v
Table of Contents ....................................................................................................................................... vii
List of Figures .............................................................................................................................................. xi
List of Tables ............................................................................................................................................. xiii
Acronyms and Abbreviations ...................................................................................................................... xv
Sampling Location Information ................................................................................................................ xxv
1 Introduction ........................................................................................................................................ 1-1
1.1 History .................................................................................................................................... 1-1
1.2 Mission and Current Operation ............................................................................................. 1-2
1.3 Site Location, Demographics, and Environment .................................................................... 1-3
1.4 DOE-EM Primary Site Activities .............................................................................................. 1-5
1.5 NNSA Primary Site Activities ................................................................................................. 1-8
1.6 Special Environmental Studies .............................................................................................. 1-9
2 Environmental Management System .................................................................................................. 2-1
2019 Highlights....................................................................................................................... 2-1
2.1 SRS Environmental Management System .............................................................................. 2-2
2.2 EMS Implementation ............................................................................................................ 2-3
2.3 Sustainability and Stewardship Goals and Implementation .................................................. 2-5
2.4 EMS Best Practices ............................................................................................................... 2-17
3 Compliance Summary ......................................................................................................................... 3-1
2019 Highlights....................................................................................................................... 3-1
3.1 Introduction ........................................................................................................................... 3-3
3.2 Federal Facility Agreement ................................................................................................... 3-3
3.3 Regulatory Compliance ........................................................................................................ 3-9
Table of Contents

Table of Contents
viii Savannah River Site
3.4 Major DOE Orders for Environmental Compliance ............................................................ 3-25
3.5 Regulatory Self-Disclosures ................................................................................................ 3-26
3.6 Environmental Audits ......................................................................................................... 3-26
3.7 Key Federal Laws Compliance Summary ............................................................................. 3-29
3.8 Environmental Compliance Summary ................................................................................. 3-31
4 Nonradiological Environmental Monitoring Program ........................................................................ 4-1
2019 Highlights ...................................................................................................................... 4-1
4.1 Introduction ........................................................................................................................... 4-2
4.2 Calculated Air Emissions ........................................................................................................ 4-3
4.3 Water Monitoring .................................................................................................................. 4-4
4.4 Precipitation Chemistry and Deposition .............................................................................. 4-13
5 Radiological Environmental Monitoring Program .............................................................................. 5-1
2019 Highlights ...................................................................................................................... 5-1
5.1 Introduction ........................................................................................................................... 5-2
5.2 SRS Offsite Monitoring ......................................................................................................... 5-4
5.3 Air Pathway ........................................................................................................................... 5-5
5.4 Water Pathway ................................................................................................................... 5-14
5.5 Aquatic Food Products ........................................................................................................ 5-26
5.6 Wildlife Surveillance ........................................................................................................... 5-27
6 Radiological Dose Assessment ............................................................................................................ 6-1
2019 Highlights ...................................................................................................................... 6-1
6.1 Introduction ........................................................................................................................... 6-2
6.2 What is Radiation Dose? ........................................................................................................ 6-3
6.3 Calculating Dose .................................................................................................................... 6-3
6.4 Offsite Representative Person Dose Calculation Results ....................................................... 6-7
6.5 Sportsman Dose Calculation Results ................................................................................... 6-15
6.6 Release of Material Containing Residual Radioactivity ....................................................... 6-17

Table of Contents
Environmental Report 2019 (SRNS-RP-2020-00064) ix
6.7 Radiation Dose to Aquatic and Terrestrial Biota ................................................................. 6-18
7 Groundwater Management Program ................................................................................................. 7-1
2019 Highlights....................................................................................................................... 7-1
7.1 Introduction ........................................................................................................................... 7-1
7.2 Groundwater at SRS ............................................................................................................... 7-2
7.3 Groundwater Protection Program at SRS .............................................................................. 7-3
8 Quality Assurance ............................................................................................................................... 8-1
2019 Highlights....................................................................................................................... 8-1
8.1 Introduction ........................................................................................................................... 8-1
8.2 Background ............................................................................................................................ 8-2
8.3 Quality Assurance Program Summary ................................................................................... 8-3
8.4 Environmental Monitoring Program QA Activities ................................................................ 8-4
8.5 Environmental Monitoring Program QC Activities................................................................. 8-5
8.6 Records Management ............................................................................................................ 8-8
Appendix A: Environmental Management System ................................................................................... A-1
Appendix B: Environmental Surveillance Media and Sampling Frequencies ........................................... B-1
Appendix C: Nonradiological Environmental Monitoring Program Supplemental Information .............. C-1
Appendix D: Radiological Environmental Monitoring Program Supplemental Information .................... D-1
Appendix E: Groundwater Management Program Supplemental Information ........................................ E-1
Appendix F: Glossary ................................................................................................................................. F-1
Appendix G: References ............................................................................................................................ G-1
Appendix H: Units of Measure .................................................................................................................. H-1

Table of Contents
x Savannah River Site
This page intentionally left blank
Environmental Report 2019 (SRNS-RP-2020-00064) xi
Figure 1-1 The Savannah River Site and Surrounding Area ................................................................... 1-4
Figure 2-1 Integrated Safety Management System Continual Improvement Framework
within the ISO 14001 Environmental Management System ................................................ 2-3
Figure 2-2 GSA Fuel Consumption by Type, FY 2009 to FY 2019 ......................................................... 2-13
Figure 2-3 SRS Performance in Meeting Fleet Management and Transportation Goals .................... 2-14
Figure 3-1 Pathway for Processing and Dispositioning Radioactive Liquid Waste at SRS ..................... 3-6
Figure 4-1 Types and Typical Locations of Nonradiological Sampling ................................................... 4-3
Figure 4-2 NPDES Industrial Wastewater Outfall Sampling Locations .................................................. 4-5
Figure 4-3 NPDES Industrial Stormwater Outfall Sampling Locations ................................................... 4-6
Figure 4-4 Nonradiological Surface Water Sampling Locations ............................................................ 4-9
Figure 4-5 Nonradiological Sediment Sampling Locations ................................................................. 4-11
Figure 4-6 Average Mercury Concentration of Fish Species in the Savannah River,
Adjacent to the Savannah River Site ................................................................................. 4-12
Figure 5-1 Types and Typical Locations of Radiological Sampling ......................................................... 5-3
Figure 5-2 10-Year History of SRS Annual Tritium Releases to the Air .................................................. 5-7
Figure 5-3 Percent of Tritium Released to the Air for 2018 and 2019 .................................................. 5-7
Figure 5-4 Air Sampling Locations Surrounding SRS up to 25 Miles ...................................................... 5-9
Figure 5-5 Radiological Liquid Effluent Sampling Locations ............................................................... 5-14
Figure 5-6 10-Year History of Direct Releases of Tritium to SRS Streams .......................................... 5-15
Figure 5-7 Radiological Surface Water Sampling Locations ............................................................... 5-16
Figure 5-8 10-Year Trend of Tritium in Pen Branch and Fourmile Branch ......................................... 5-19
Figure 5-9 Tritium Migration from SRS Seepage Basins and SWDF to SRS Streams .......................... 5-19
Figure 5-10 SRS Tritium Transport Summary ....................................................................................... 5-22
Figure 5-11 Offsite Drinking Water Sampling Locations....................................................................... 5-24
Figure 5-12 Tritium in Offsite Drinking Water and River Mile 141.5 .................................................... 5-25
Figure 5-13 Historical Trend of Average Cesium-137 Concentrations in Deer Tissue (1965–2019) .... 5-29
Figure 6-1 Exposure Pathways to Humans from Air and Liquid Effluents ............................................. 6-4
Figure 6-2 2007–2011 Wind Rose Plot for H Area ................................................................................. 6-5
Figure 6-3 Savannah River Annual Average Flow Rates Measured by USGS at River Mile 118.8 ......... 6-6
List of Figures

List of Figures
xii Savannah River Site
Figure 6-4 Radionuclide Contributions to the 2019 SRS Total Liquid Pathway Dose of 0.16 mrem (0.0016 mSv) ............................................................................................... 6-10
Figure 6-5 Radionuclide Contributions to the 2019 SRS Total Air Pathway Dose of 0.018 mrem (0.00018 mSv) ........................................................................................... 6-12
Figure 6-6 10-Year History of SRS Maximum Potential All-Pathway Doses ........................................ 6-14 Figure 7-1 Groundwater at SRS .............................................................................................................. 7-3 Figure 7-2 How Contamination Gets to Soil and Groundwater ............................................................ 7-4 Figure 7-3 Groundwater Plumes at SRS ................................................................................................ 7-6 Figure 7-4 Location of Site Boundary Wells at SRS—Between A/M Areas and Jackson, South Carolina ....................................................................................................... 7-8 Figure 7-5 Location of Monitoring Wells Sampled for Tritium in Burke and Screven Counties, Georgia ................................................................................................. 7-11 Figure 7-6 Tritium Concentration in Wells Sampled in Burke and Screven Counties, Georgia .......... 7-12 Figure 7-7 Solvent Removed from A/M-Area Groundwater Plume .................................................... 7-14 Figure 8-1 Interrelationship between QA/QC Activities ....................................................................... 8-3

Environmental Report 2019 (SRNS-RP-2020-00064) xiii
Table 2-1 FY 2019 Sustainability Goals, Metrics, and SRS Performance ...................................................... 2-7
Table 2-2 SRNS Recycling and Sustainability in FY 2019 by Amount.......................................................... 2-12
Table 3-1 Summary of Quantities of Asbestos Materials Removed in 2019.............................................. 3-14
Table 3-2 Summary of 2019 NEPA Reviews .............................................................................................. 3-20
Table 3-3 SRS Permits ................................................................................................................................ 3-25
Table 3-4 Summary of 2019 External Agency Audits/Inspections of the SRS Environmental Program
and Results ................................................................................................................................. 3-27
Table 3-5 Status of Key Federal Environmental Laws Applicable to SRS ................................................... 3-29
Table 3-6 NOV/NOAV Summaries, 2015–2019 .......................................................................................... 3-31
Table 5-1 SRS Offsite Radiological Sample Distribution by State ................................................................. 5-4
Table 5-2 SRS Radiological Atmospheric Releases for CY 2019.................................................................... 5-6
Table 5-3 Air Sampling Media ...................................................................................................................... 5-8
Table 5-4 SRS Radiological Liquid Effluent Releases of Radioactive Material for CY 2019 ........................ 5-15
Table 5-5 Radionuclide Concentrations Summary for Stormwater Basins for CY 2019 ............................ 5-17
Table 5-6 Radionuclide Concentrations in the Primary SRS Streams by Location for CY 2019.................. 5-18
Table 5-7 Radionuclide Concentrations in the Savannah River for CY 2019 .............................................. 5-20
Table 5-8 Liquid Tritium Releases and Transport ....................................................................................... 5-22
Table 5-9 Maximum Cesium-137 Concentration in Sediments Collected in 2019 ..................................... 5-24
Table 5-10 Aquatic Products Collected by SRS in 2019 for the Radiological Environmental Monitoring Program ...................................................................................................................................... 5-26
Table 5-11 Location and Fish Type for the Maximum Detected Concentration of Specific Radionuclides Measured in Flesh Samples Collected in 2019 .......................................................................... 5-27
Table 5-12 Cesium-137 Results for Laboratory and Field Measurements in Wildlife for CY 2019 ............. 5-28
Table 6-1 Regional Water Supply Service ..................................................................................................... 6-6
Table 6-2 2019 Liquid Release Source Term and 12-Month Average Downriver Radionuclide Concentrations Compared to the EPA’s Drinking Water Maximum Contaminant
Levels (MCL) ................................................................................................................................. 6-8
Table 6-3 Potential Dose to the Representative Person from SRS Liquid Releases in 2019 ........................ 6-9
Table 6-4 Potential Doses to the Representative Person and to the MEI from SRS Air Releases
in 2019 and Comparison to the Applicable Dose Limit ............................................................. 6-11
Table 6-5a Potential Dose to the Representative Person from all Standard Pathways in 2019 .................. 6-14
Table 6-5b Potential Collective Dose to the 50-Mile Population Surrounding SRS, Including the People Served by the Downriver Drinking Water Plants ........................................................................ 6-14
Table 6-6 2019 Sportsman Doses Compared to the DOE Dose Limit ........................................................ 6-16
List of Tables
List of Tables
xiv Savannah River Site
Table 7-1 Typical Contaminants of Concern at SRS ..................................................................................... 7-9
Table 7-2 Summary of the Maximum Contaminant Concentrations for Major Areas within SRS .............. 7-9
Table 8-1 Summary of Laboratory Blind and Duplicate Sample Analyses ................................................... 8-6
Table 8-2 Summary of Trip and Field Blank Sample Analyses ..................................................................... 8-7
Appendix Table B-1 SRS Nonradiological Media and Sampling Frequencies .................................................. B-1
Appendix Table B-2 SRS Radiological Media and Sampling Frequencies ........................................................ B-2
Appendix Table C-1 River and Stream Water Quality Summary Results ........................................................ C-1
Appendix Table C-2 Summary of Nonradiological Results for Sediments Collected from the Savannah River,
SRS Streams, and Stormwater Basins ............................................................................. C-5
Appendix Table C-3 Summary of Detected Metal Results for Freshwater Fish Tissue Collected from the Savannah River ......................................................................................................... C-8
Appendix Table C-4 Summary of Detected Metal Results for Saltwater Fish Tissue Collected from the Savannah River between River Miles 0–8, Near Savannah, Georgia ....................... C-9
Appendix Table D-1 Summary of Radioactive Atmospheric Releases by Source ........................................... D-2
Appendix Table D-2 Summary of Air Effluent DOE DCS Sum of Fractions ...................................................... D-5
Appendix Table D-3 Summary of Tritium in Environmental Air ..................................................................... D-6
Appendix Table D-4 Summary of Tritium in Rainwater ................................................................................... D-7
Appendix Table D-5 Summary of Radionuclides in Environmental Air ........................................................... D-8
Appendix Table D-6 Summary of Gamma Surveillance ................................................................................. D-10
Appendix Table D-7 Summary of Radionuclides in Soil ................................................................................. D-11
Appendix Table D-8 Summary of Radionuclides in Grassy Vegetation ......................................................... D-12
Appendix Table D-9 Summary of Radionuclides in Foodstuffs ..................................................................... D-13
Appendix Table D-10 Summary of Radionuclides in Dairy ........................................................................... D-15
Appendix Table D-11 Radiation in Liquid Source Releases .......................................................................... D-16
Appendix Table D-12 Summary of Liquid Effluent DOE DCS Sum of Fractions by Facility ............................ D-17
Appendix Table D-13 Summary of Radionuclides in Sediments.................................................................... D-18
Appendix Table D-14 Summary of Radionuclides in Drinking Water ............................................................ D-20
Appendix Table D-15 Summary of Radionuclides in Freshwater Fish ........................................................... D-23
Appendix Table D-16 Summary of Radionuclides in Saltwater Fish .............................................................. D-26
Appendix Table D-17 Summary of Radionuclides in Shellfish ....................................................................... D-27
Appendix Table D-18 Summary of Radionuclides in Wildlife ........................................................................ D-28
Appendix Table E-1 Summary of Documents that Report Groundwater Monitoring Data ............................ E-1

Environmental Report 2019 (SRNS-RP-2020-00064) xv
A ALARA As Low As Reasonably Achievable
ANSI American National Standards Institute
ARP Actinide Removal Process
ARP/MCU Actinide Removal Process and Modular Caustic Side Solvent Extraction Unit
ASER Annual Site Environmental Report
ASME American Society of Mechanical Engineers
B BAT Best Available Technology
BJWSA Beaufort-Jasper Water & Sewer Authority
BLLDF Barnwell Low-Level Disposal Facility
BWRE Bulk Waste Removal Efforts
C C&D Construction and Demolition
CA Composite Analysis
CAA Clean Air Act
CEI Compliance Evaluation Inspection
CERCLA Comprehensive Environmental Response, Compensation, and Liability Act
CFR Code of Federal Regulations
CMP Chemicals, Metals, and Pesticides
CO Carbon Monoxide
COC Contaminant of Concern
CWA Clean Water Act
Acronyms and Abbreviations

Acronyms and Abbreviations
xvi Savannah River Site
CX Categorical Exclusion
CY Calendar Year
D DCS Derived Concentration Standard
DOE United States Department of Energy
DOE-EM United States Department of Energy-Environmental Management
DOE-SR United States Department of Energy-Savannah River Operations Office
DOECAP DOE Consolidated Audit Program
DWPF Defense Waste Processing Facility
E EA Environmental Assessment
ECA Environmental Compliance Authority
ECHO Enforcement and Compliance History Online
ECM Energy Conservation Measure
EDAM Environmental Dose Assessment Manual
EEC Environmental Evaluation Checklist
EIS Environmental Impact Statement
EISA Energy Independence Security Act
EM Environmental Management
EMP Environmental Monitoring Program
EMS Environmental Management System
EPA U.S. Environmental Protection Agency
EPCRA Emergency Planning and Community Right-to-Know Act
EPEAT Electronic Product Environmental Assessment Tool

Acronyms and Abbreviations
Environmental Report 2019 (SRNS-RP-2020-00064) xvii
EPP Environmentally Preferable Purchasing
ESA Endangered Species Act
ESPC Energy Saving Performance Contracting
ETP Effluent Treatment Project
F FERC Federal Energy Regulatory Commission
FFA Federal Facility Agreement
FFCA Federal Facility Compliance Act
FGR Federal Guidance Report
FIFRA Federal Insecticide, Fungicide, and Rodenticide Act
FONSI Finding of No Significant Impact
FR Federal Register
FRR SNF Foreign Research Reactor Spent Nuclear Fuel
FY Fiscal Year
G GHG Greenhouse Gas
GOSB OU G-Area Oil Seepage Basin Operable Unit
GTCC Greater-Than-Class C
H HLW High-Level Waste
HWMF Hazardous Waste Management Facility
HVAC Heating, Ventilation, and Air Conditioning

Acronyms and Abbreviations
xviii Savannah River Site
I I&D Industrial and Domestic
ICRP International Commission on Radiological Protection
ILA Industrial, Landscaping, and Agricultural
IMNM Interim Management of Nuclear Materials
ISMS Integrated Safety Management System
ISO International Organization for Standardization
L LED Light-Emitting Diode
LLRW Low-Level Radioactive Waste
LLW Low-Level Waste
M MACT Maximum Achievable Control Technology
MAPEP Mixed Analyte Performance Evaluation Program
MBTA Migratory Bird Treaty Act
MCL Maximum Contaminant Level
MCU Modular Caustic Side Solvent Extraction Unit
MDA Minimum Detectable Activity
MDN Mercury Deposition Network
MEI Maximally Exposed Individual
MEK Methyl Ethyl Ketone
MFFF Mixed Oxide Fuel Fabrication Facility
MOX Mixed Oxide
Acronyms and Abbreviations
Environmental Report 2019 (SRNS-RP-2020-00064) xix
Mrem Millirem
MWMF Mixed Waste Management Facility
N NA-MRF North Augusta, South Carolina Material Recovery Facility
NADP National Atmospheric Deposition Program
NDAA National Defense Authorization Act
NEPA National Environmental Policy Act
NESHAP National Emission Standards for Hazardous Air Pollutants
NHPA National Historic Preservation Act
NNIPS Non-native Invasive Plant Species
NNSA National Nuclear Security Administration
NOA Notice of Availability
NOAV Notice of Alleged Violation
NOV Notice of Violation
NPDES National Pollutant Discharge Elimination System
NQA Nuclear Quality Assurance
NRC Nuclear Regulatory Commission
NSPS New Source Performance Standards
NTN National Trends Network
NWP Nationwide Permit
O ODS Ozone-Depleting Substances
OEIS Overseas Environmental Impact Statement
ORPS Occurrence Reporting and Processing System
OSLD Optically Stimulated Luminescence Dosimeters

Acronyms and Abbreviations
xx Savannah River Site
P PA Performance Assessment
PCB Polychlorinated Biphenyl
PCE Tetrachloroethylene
PFAS Per- and Polyfluoroalkyl Substances
pH Potential of Hydrogen
PMI Project Management Institute
Pu Plutonium
PUE Power-Usage Effectiveness
Q QA Quality Assurance
QC Quality Control
R RCRA Resource Conservation and Recovery Act
RESRAD RESidual RADioactivity
RICE Reciprocating Internal Combustion Engine
RM River Mile
ROD Record of Decision
RPD Relative Percent Difference
RSL Regional Screening Levels
RSV Refinement Screening Values

Acronyms and Abbreviations
Environmental Report 2019 (SRNS-RP-2020-00064) xxi
S SA Supplement Analysis
SARA Superfund Amendment and Reauthorization Act of 1986
SCDHEC South Carolina Department of Health and Environmental Control
SCEEP South Carolina Environmental Excellence Program
SDF Saltstone Disposal Facility
SDU Saltstone Disposal Unit
SDWA Safe Drinking Water Act
SEER Seasonal Energy Efficiency Ratio
SME Subject Matter Expert
SNAP Significant New Alternatives Policy
SNF Spent Nuclear Fuel
SPCC Spill Prevention, Control, and Countermeasure
SRARP Savannah River Archaeological Research Program
SREL Savannah River Ecology Laboratory
SRIP Sustainability Report and Implementation Plan
SRNL Savannah River National Laboratory
SRNS Savannah River Nuclear Solutions, LLC
SRR Savannah River Remediation LLC
SRS Savannah River Site
SRSCRO Savannah River Site Community Reuse Organization
SSP Site Sustainability Plan
SST Solvent Storage Tanks
STP Site Treatment Plan
SWDF Solid Waste Disposal Facility
SWPF Salt Waste Processing Facility

Acronyms and Abbreviations
xxii Savannah River Site
SWPPP Stormwater Pollution Prevention Plan
T TCCR Tank Closure Cesium Removal
TCE Trichloroethylene
TLD Thermoluminescent Dosimeter
TNX 678T Facilities
TRI Toxic Release Inventory
TRU Transuranic
TSCA Toxic Substances Control Act
TSDF Treatment, Storage, and Disposal Facilities
TSS Total Suspended Solids
U URMA Underground Radioactive Material Area
U.S. United States
USACE United States Army Corps of Engineers
USDA United States Department of Agriculture
USFS-SR United States Forest Service-Savannah River
USGS United States Geological Survey
UST Underground Storage Tank
V VEGP Vogtle Electric Generating Plant
VOC Volatile Organic Compound
VSDS Visual Survey Data System
Acronyms and Abbreviations
Environmental Report 2019 (SRNS-RP-2020-00064) xxiii
W WCS Waste Control Specialists
WIPP Waste Isolation Pilot Plant
WSB Waste Solidification Building
WSRC Westinghouse Savannah River Company
WTP Water Treatment Plant

Acronyms and Abbreviations
xxiv Savannah River Site
This page intentionally left blank

Environmental Report 2019 (SRNS-RP-2020-00064) xxv
Note: This section contains sampling location abbreviations used in the text and on the sampling location maps. It also contains a list of sampling locations known by more than one name. (See next page.)
Location Abbreviations Location Name/Other Applicable Information
4M Fourmile 4MB Fourmile Branch (Fourmile Creek) 4MC Fourmile Creek BDC Beaver Dam Creek BG Burial Ground BLTW Burke and Screven Counties Wells (Georgia) EAV E-Area Vaults FM Four Mile FMB Fourmile Branch (Fourmile Creek) GSTW Burke and Screven Counties Wells (Georgia) HP HP (sampling location designation only; not an actual
abbreviation) HWY Highway JAX SRS Boundary Wells KP Kennedy Pond L3R Lower Three Runs MCQBR McQueens Branch MHTW Burke and Screven Counties Wells (Georgia) MPTW Burke and Screven Counties Wells (Georgia) MSB SRS Boundary Wells NSB L&D New Savannah Bluff Lock & Dam (Augusta Lock and
Dam) PAR “P” and “R” Pond PB Pen Branch RM River Mile SC Steel Creek SWDF Solid Waste Disposal Facility TB Tims Branch TC Tinker Creek TNX Multipurpose Pilot Plant Campus TR Burke and Screven Counties Wells (Georgia) U3R Upper Three Runs VEGP Vogtle Electric Generating Plan (Plant Vogtle)
Sampling Location Information

Sampling Location Information
xxvi Savannah River Site
Sampling Locations Known by More Than One Name Augusta Lock and Dam; New Savannah River Lock & Dam Beaver Dam Creek; 400-D Fourmile Creek-2B; Fourmile Creek at Road C Fourmile Creek-3A; Fourmile Creek at Road C Lower Three Runs-2; Lower Three Runs at Patterson Mill Road Lower Three Runs-3; Lower Three Runs at Highway 125 Pen Branch-3; Pen Branch at Road A-13-2 R Area downstream of R-1; 100-R River Mile 118.8; U.S. Highway 301 Bridge Area; Highway 301, US 301, Georgia Welcome Center at Highway 301 River Mile 129.1; Lower Three Runs Mouth River Mile 141.5; Steel Creek Boat Ramp River Mile 150.4; Vogtle Discharge River Mile 152.1; Beaver Dam Creek Mouth River Mile 157.2; Upper Three Runs Mouth River Mile 160.5; Demier Landing Steel Creek at Road A; Steel Creek-4; Steel Creek-4 at Road A; Steel Creek at Highway 125 Tims Branch at Road C; Tims Branch-5 Tinker Creek at Kennedy Pond; Tinker Creek-1 Upper Three Runs-4; Upper Three Runs-4 at Road A; Upper Three Runs at Road A; Upper Three Runs at Hwy 125 Upper Three Runs-1A; Upper Three Runs-1A at Road 8-1 Upper Three Runs-3; Upper Three Runs-3 at Road C

Environmental Report 2019 (SRNS-RP-2020-00064) 1-1
Chapter 1: Introduction
1 ON19SRRINTRODUCTION
1.1 HISTORY
SRS is a DOE site in the western region of South Carolina, along the Savannah River. The U.S. Atomic Energy Commission (the precursor to DOE) constructed SRS in the early 1950s to produce materials used to create nuclear weapons during the Cold War. Over the following decades, five nuclear reactors produced these materials. Several of the support facilities continue to operate, although the reactors ceased operating by 1988. In 1972, DOE named SRS the nation’s first National Environmental Research Park, an outdoor ecological research laboratory.
he Savannah River Site (SRS) Environmental Report is the primary document that the U.S. Department of Energy (DOE) uses to inform the public of environmental performance and conditions at SRS. This report meets the requirements of DOE Order 231.1B, Environment, Safety, and Health Reporting. The Site Environmental Report also is the principal document that demonstrates how the Site complies with the requirements of DOE Order 458.1, Radiation Protection of the Public and the Environment.
This document summarizes SRS’s environmental information and data to achieve the following:
• Highlight significant Site programs • Report environmental occurrences and responses • Describe SRS’s compliance with environmental standards and requirements • Describe SRS’s Environmental Management System and sustainability
performance • Provide the results from monitoring material containing residual radioactivity
before its release from SRS
T
Chapter Background This chapter presents the following:
• A brief history of SRS, along with a summary of its current missions • Highlights of SRS organizations and their primary responsibilities • Descriptions of the physical characteristics and attributes of the
environment in and around SRS • Updates of SRS’s primary mission and annual programs

Introduction
1-2 Savannah River Site
As Dr. J. Walter Joseph, III, cofounder and director of the SRS Heritage Foundation and SRS retiree, describes in the Savannah River Site at 50, “The history of the Savannah River Site can be divided into two stages: the period in which it was known as the Savannah River Plant, a ground-breaking facility for the research and production of nuclear materials, and the time in which it was identified as the Savannah River Site, when responsibilities shifted from research and production to research, production and remediation.” E. I. du Pont de Nemours Company was the operating contractor through the years the Site was called the Savannah River Plant. Beginning in 1989, when the Westinghouse Savannah River Company (WSRC) became the operating contractor, the Site became known as the Savannah River Site. In 2008, the Site contract transitioned from WSRC to two contractors, Savannah River Nuclear Solutions LLC (SRNS) as the management and operating contractor, and Savannah River Remediation LLC (SRR) as the liquid waste operations contractor. Both contracts were ongoing in 2019.
1.2 MISSION AND CURRENT OPERATION
The SRS mission is to safely and efficiently operate SRS to protect the public health and the environment while supporting the nation's nuclear deterrent programs and transforming the Site for future use. The Site is a long-term national asset in the areas of environmental stewardship, innovative technology, national security, and energy independence. The current main activities involve treating and processing waste, environmental cleanup and remediation, tritium processing, and protecting nuclear material.
The DOE Office of Environmental Management (DOE-EM) and the National Nuclear Security Administration (NNSA) oversee the Site mission. These two DOE Program Offices direct the Savannah River Operations Office (DOE-SR). DOE-EM is the property owner and oversees cleanup of the environmental legacy waste. NNSA is responsible for the defense programs and nuclear nonproliferation elements of the national security missions. SRS executes the mission with the support of contractors and their subcontractors, universities, and federal agencies. Several of the contractors directly support both the DOE-EM and NNSA programs, with other members of the mission execution team supporting environmental resource management.
SRNS, SRR, and Centerra-SRS directly support both the DOE-EM and NNSA missions. In addition to its role as the management and operating contractor, SRNS supports SRS missions through the Savannah River National Laboratory. As the liquid waste operations contractor, SRR is responsible for treating and disposing of radioactive liquid waste and operationally closing waste tanks. Centerra-SRS is the Site’s protective force.
To support the cleanup of SRS’s legacy waste, Parsons Government Services, Inc. is designing, constructing, and commissioning the Salt Waste Processing Facility (SWPF), a key component in processing and dispositioning radioactive liquid waste.
The DOE Office of Environmental Management manages the Savannah River Site and its environmental resources. The U.S. Department of Agriculture (USDA) Forest Service-Savannah River (USFS-SR), the University of Georgia, the University of South Carolina, and Ameresco support DOE-EM in managing and conserving the Site’s environmental resources. Through an interagency agreement with DOE-Savannah River, USFS-SR manages SRS’s natural resources. For more than 65 years, the University of Georgia has

Introduction
Environmental Report 2019 (SRNS-RP-2020-00064) 1-3
managed the Savannah River Ecology Laboratory (SREL), independently evaluating the environmental risk associated with Site activities. Since 1978, the University of South Carolina has managed the Savannah River Archaeological Research Program (SRARP), a research unit that provides the technical expertise to manage SRS cultural resources. Ameresco Federal Solutions supports SRS’s environmental resource management by supplying biomass-generated steam to SRS. This effort has allowed SRS to discontinue using coal to generate steam.
1.3 SITE LOCATION, DEMOGRAPHICS, AND ENVIRONMENT
SRS borders the Savannah River and encompasses about 310 square miles in the South Carolina counties of Aiken, Allendale, and Barnwell. SRS is about 12 miles south of Aiken, South Carolina, and 15 miles southeast of Augusta, Georgia (Figure 1-1). The Savannah River flows along the Site’s southwestern border. On Figure 1-1, the capital letters within SRS borders identify operational areas referenced in this report.
Based on the U.S. Census Bureau’s 2010 data, the population within a 50-mile radius of the center of SRS is about 781,060 people. This translates to an average population density of about 104 people per square mile outside the SRS boundary, with the largest concentration in the Augusta metropolitan area.
1.3.1 Water Resources
SRS activities potentially impact water resources including the Savannah River, Site streams, and the underlying groundwater. The Savannah River bounds SRS on the southwest for 35 river miles. The upriver boundary of SRS is about 160 river miles from the Atlantic Ocean. The nearest downriver municipal facility that uses the river as a drinking water source (Beaufort-Jasper Water and Sewer Authority’s Purrysburg Water Treatment Plant) is about 90 river miles from the Site. Commercial fishermen, sport fishermen, and boaters also use the river. The river is not currently used for any large-scale irrigation projects downriver of the Site. The groundwater at SRS migrates through the subsurface, primarily discharging into the Savannah River and its tributaries. SRS uses groundwater for both industrial processes and drinking water.
1.3.2 Geology
SRS is located on the southeastern Atlantic Coastal Plain, in an area named the Aiken Plateau. The center of SRS is about 25 miles southeast of the geologic fall line that separates the Coastal Plain from the Piedmont. The Aiken Plateau slopes gently to the southeast and is generally well drained, although many poorly drained depressions exist. Elliptical-shaped Carolina Bays, for example, are common on the Aiken Plateau. All major streams on SRS originate onsite, except for Upper Three Runs, which begins above the Site. All onsite streams drain into the Savannah River (Denham, 1995).
An Aerial View of a Carolina Bay at SRS

Introduction
1-4 Savannah River Site
Figure 1-1 The Savannah River Site and Surrounding Area

Introduction
Environmental Report 2019 (SRNS-RP-2020-00064) 1-5
With nearly three centuries of available historic and contemporary seismic data, the Charleston and Summerville areas remain the most seismically active region affecting SRS. However, levels of earthquake activity within this region are usually low, with magnitudes generally less than or equal to 3.0 on the Richter scale.
1.3.3 Land and Forest Resources
About 10% of SRS’s land is industrial; the remaining 90% consists of natural and managed forests that the USFS-SR plants, maintains, and harvests. SRS consists of four major forests: 1) mixed pine-hardwoods, 2) sandhills pine savanna, 3) bottomland hardwoods, and 4) swamp floodplain forests. These forests, as well as Carolina Bays, are accessible to the public when visiting the Crackerneck Wildlife Management Area and Ecological Reserve near Jackson, South Carolina. Carolina Bays provide important wetland habitat and refuge for many plants and animals. As many as 300 Carolina Bays exist on SRS.
1.3.4 Animal and Plant Life
SRS is home to many varieties of plants and animals, including
• More than 100 species of reptiles and amphibians
• Approximately 50 species of mammals • Nearly 100 species of fish • Nearly 600 species of aquatic insects • Approximately 1,500 species of plants, of
which at least 40 are of state or regional concern
SRS also maintains habitat for more than 250 species of birds, some of which are migratory and do not make SRS their permanent home. Additionally, the Site provides habitat for federally listed as threatened or endangered animal and plant species, including the wood stork, the red-cockaded woodpecker, the pondberry, the gopher tortoise, and the smooth purple coneflower.
1.4 DOE-EM PRIMARY SITE ACTIVITIES
The Environmental Management Program oversees many Site activities. The following sections highlight key activities. SRS’s website has additional information on these activities.
1.4.1 Nuclear Materials Stabilization
In the past, the mission of the F- and H-Area facilities was to produce materials for nuclear weapons and isotopes for both medical and National Aeronautics and Space Administration applications. Central to these facilities were the canyons, where the Site chemically separated radionuclides from nuclear fuels. The end of the Cold War in 1991 shifted that mission to stabilizing nuclear materials and providing safe interim storage or disposal. SRS completed its production mission at F Canyon in 2002 and deactivated it in 2006.
A Wild Turkey is One of the Many Bird Species at SRS
Introduction
1-6 Savannah River Site
Since 2003, H Canyon has recovered highly enriched uranium from various sites across the DOE complex. DOE now uses H Canyon to blend down highly enriched uranium into low-enriched uranium fuel. Blending down, or down blending, as it is sometimes referred to, mixes the uranium with natural uranium to not only make it undesirable to use in nuclear weapons, but also to make it useable for commercial nuclear reactors.
1.4.2 Nuclear Materials Consolidation and Storage
The K-Area Complex is NNSA’s facility to safely store non-pit plutonium, pending disposition. The principal operations building formerly housed K Reactor, which produced nuclear materials to support the United States for nearly four decades during the Cold War. DOE has revitalized this robust structure to safely store nuclear materials. Additionally, NNSA uses the K-Area Complex to perform inspections to confirm that the plutonium is stored safely and to dilute plutonium to prepare it for disposal as transuranic waste at the Waste Isolation Pilot Plant (WIPP) near Carlsbad, New Mexico.
1.4.3 Spent Nuclear Fuel Storage
SRS supports the DOE National Security mission by safely receiving and storing spent fuel elements from foreign and domestic research reactors, pending disposition. Currently, SRS stores spent nuclear fuel at the L-Area Complex.
1.4.4 Waste Management
SRS manages radiological and nonradiological waste created by legacy operations, as well as newly generated waste created by ongoing Site operations.
1.4.4.1 Radioactive Liquid Waste Management
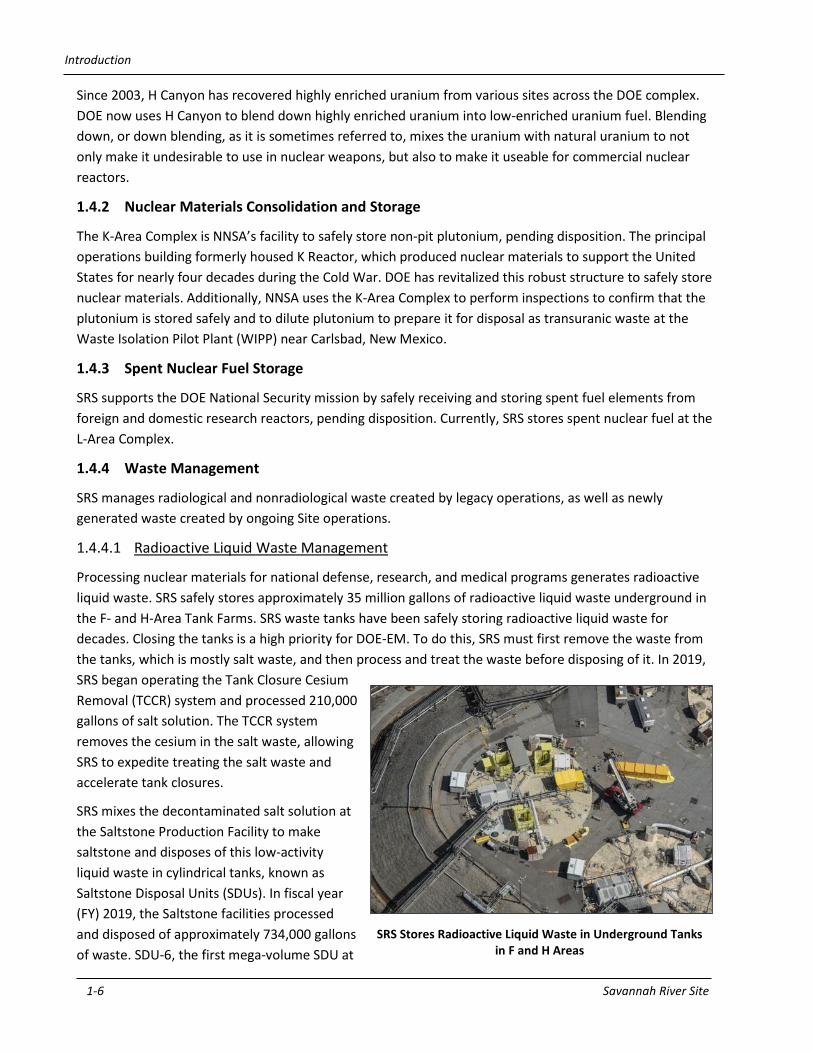
Processing nuclear materials for national defense, research, and medical programs generates radioactive liquid waste. SRS safely stores approximately 35 million gallons of radioactive liquid waste underground in the F- and H-Area Tank Farms. SRS waste tanks have been safely storing radioactive liquid waste for decades. Closing the tanks is a high priority for DOE-EM. To do this, SRS must first remove the waste from the tanks, which is mostly salt waste, and then process and treat the waste before disposing of it. In 2019, SRS began operating the Tank Closure Cesium Removal (TCCR) system and processed 210,000 gallons of salt solution. The TCCR system removes the cesium in the salt waste, allowing SRS to expedite treating the salt waste and accelerate tank closures.
SRS mixes the decontaminated salt solution at the Saltstone Production Facility to make saltstone and disposes of this low-activity liquid waste in cylindrical tanks, known as Saltstone Disposal Units (SDUs). In fiscal year (FY) 2019, the Saltstone facilities processed and disposed of approximately 734,000 gallons of waste. SDU-6, the first mega-volume SDU at
SRS Stores Radioactive Liquid Waste in Underground Tanks in F and H Areas

Introduction
Environmental Report 2019 (SRNS-RP-2020-00064) 1-7
SRS, received the saltstone for disposal. In 2019, SRS continued constructing SDU-7, the second of seven SRS mega-volume SDUs. Site preparation for the next two mega-vaults, SDU-8 and SDU-9, also began in 2019.
SRS uses the Defense Waste Processing Facility (DWPF) to process high-activity waste from the Tank Farms. Since DWPF began operating in March 1996, it has produced more than 16 million pounds of glass—immobilizing 61.7 million curies of radioactivity—and pouring more than 4,200 canisters. DWPF in FY 2019 produced 34 canisters of glass, weighing more than 126,000 pounds and immobilizing approximately 643,000 curies of radioactivity.
1.4.4.2 Solid Waste Management
SRS manages the following types of solid waste:
• Low-level waste—including ordinary items, such as coveralls, gloves, and hand tools—contaminated with small amounts of radioactive material
• Transuranic (TRU) waste, which contains alpha-emitting isotopes with an atomic number greater than that of uranium (92)
• Hazardous waste (nonradiological), which is any toxic, corrosive, reactive, or ignitable material that could affect human health or the environment
• Mixed waste, which contains both hazardous and radioactive components
• Sanitary waste, which, like ordinary municipal waste, is neither radioactive nor hazardous
• Construction and demolition waste
To meet environmental and regulatory requirements, SRS treats, stores, and disposes of all low-level radioactive and hazardous waste that it generates. The Site also emphasizes recycling and minimizing waste to reduce the waste volume that SRS must manage.
SRS packages TRU waste and transports it in U.S. Department of Transportation-approved containers for underground disposal at WIPP, DOE’s geologic repository. SRS began shipping TRU waste to WIPP in May 2001 and has made more than 1,650 shipments. SRS made five TRU shipments in 2019.
DOE conducts annual reviews to ensure that Site operations are within DOE’s performance standards. The annual reviews for the E-Area Low-Level Waste Facility Performance Assessment (PA) and the Saltstone Disposal Facility PA showed that SRS continued to operate these facilities in a safe and protective manner.
1.4.5 Waste Site Remediation and Closure
Past operations at SRS have released hazardous and radioactive substances to soil, which subsequently have ended up in the groundwater. SRS’s Area Completion Projects is responsible for and focuses on reducing the footprint of legacy waste at SRS’s contaminated waste sites and obsolete facilities. SRS cleans up contamination in the environment by treating or immobilizing the source of the contamination, mitigating contamination transport through soil and groundwater, and slowing the movement of contamination that has already migrated from the source. Cleanup includes capping inactive waste sites;

Introduction
1-8 Savannah River Site
installing and operating efficient groundwater treatment units; removing and disposing of contaminated material; and using natural remedies, such as bioremediation (using naturally occurring microbes).
During 2019, SRS remediated the G-Area Oil Seepage Basin Operable Unit and the Wetland Area at Dunbarton Bay. In addition, SRS installed remediation technologies at the C-Area Groundwater Operable Unit and P-Area Groundwater Operable Unit. These technologies will work with the environment to destroy the organic solvents transported by groundwater.
1.4.6 Environmental Monitoring
SRS has an extensive environmental monitoring program, with records and documents from 1951, prior to the start of Site operations. Beginning in 1959, SRS made offsite environmental surveillance data available to the public. SRS reported onsite and offsite environmental monitoring separately until 1985, when it merged data from both programs into one publicly available document, the U.S. Department of Energy Savannah River Plant Environmental Report for 1985.
SRS continues to conduct an extensive environmental monitoring program to determine impacts, if any, from SRS to the surrounding communities and the environment, both on and offsite. In addition to the onsite environmental monitoring the Site conducts, SRS also monitors a 2,000-square-mile area beyond the Site boundary. This area includes neighboring cities, towns, and counties in South Carolina and Georgia. SRS collects thousands of samples of air, rainwater, surface water, drinking water, groundwater, food products, wildlife, soil, sediment, and vegetation. The Site checks these samples for radionuclides, metals, and other chemicals that could be in the environment because of SRS activities.
1.5 NNSA PRIMARY SITE ACTIVITIES
NNSA operates tritium facilities at SRS to supply and process tritium, a radioactive form of hydrogen gas that is a vital component of nuclear weapons. SRS also plays a critical role in NNSA's nonproliferation missions, helping the United States meet its commitments to security and disposing of plutonium and uranium.
1.5.1 Tritium Processing
SRS has the nation’s only facility for extracting, recycling, purifying, and reloading tritium. SRS replenishes tritium by recycling it from existing warheads and by extracting it from target rods irradiated in nuclear reactors that the Tennessee Valley Authority operates. SRS purifies recycled and extracted gases to produce tritium suitable for use.
In 2019, SRS repurposed a previously dormant industrial furnace, dedicating it to increase the amount of tritium it can extract from target rods that have been irradiated in a Tennessee Valley Authority commercial power nuclear reactor. With two, instead of one, operating furnaces, the Site enhanced the
G-Area Oil Seepage Basin Operable Unit Remediation

Introduction
Environmental Report 2019 (SRNS-RP-2020-00064) 1-9
operational flexibility and capability needed to perform multiple extractions annually, positioning it to meet the important national mission of nuclear deterrence now and in the coming years.
SRS tritium facilities are part of the NNSA’s Defense Program at SRS. The Defense Programs page of SRS’s website includes more information.
1.5.2 Nuclear Nonproliferation
Since 1999 the NNSA Nuclear Nonproliferation Program had been working to design and build the Mixed Oxide (MOX) Fuel Fabrication Facility (MFFF), which would have converted surplus weapons-grade plutonium into fuel for commercial facilities to generate electricity. DOE decided to terminate the project in October 2018. On March 29, 2019, SRNS accepted custodianship and operational responsibility for the MFFF facility and began preparations for future use.
The NNSA Materials Management and Minimization Program is preparing surplus weapons-grade plutonium for disposal at WIPP, the federal geologic repository, using the dilute and dispose approach. The Surplus Plutonium Disposition Project will expand the current SRS down-blending capability prepare additional surplus plutonium for disposal at WIPP.
1.6 SPECIAL ENVIRONMENTAL STUDIES
SRS provides a unique setting for environmental study. Several organizations at SRS—the University of Georgia Savannah River Ecology Laboratory (SREL), U.S. Department of Agriculture (USDA) Forest Service-Savannah River (USFS-SR), Savannah River Archeological Research Program (SRARP), and Savannah River National Laboratory (SRNL)—conduct research to support a better understanding of human impact on both plants and animals.
SREL, USFS-SR, and SRARP provide annual reports on the environmental studies and research they conduct on SRS. These annual reports are on the SRS Environmental Report 2019 webpage. These reports present and discuss environmental studies and research that occurred during the reporting year. Special environmental studies and research directly impacting the SRS environmental monitoring program and dose calculations are presented and discussed in their respective chapters.

Introduction
1-10 Savannah River Site
This page intentionally left blank
Environmental Report 2019 (SRNS-RP-2020-00064) 2-1
Chapter 2: Environmental
Management System
T he Savannah River Site (SRS) Environmental Management System (EMS)
implements the U.S. Department of Energy (DOE) commitment to sound
environmental stewardship policy and practices. These safeguards protect air,
water, land, and other natural, archaeological, and cultural resources that SRS
construction, operations, maintenance, and decommissioning potentially affect.
The EMS plans and evaluates SRS activities to protect public health and the
environment, prevent pollution, and comply with applicable environmental and
cultural resource protection requirements. SRS activities demonstrate the Site’s
commitment to minimize waste, manage water, foster renewable energy,
reduce greenhouse gases, acquire sustainable services, remediate with a focus
on sustainability, and observe best management practices, all vital components
of environmental management. The SRS Site Sustainability Plan contains more
information on DOE and SRS goals and the progress made toward achieving
those goals.
2019 Highlights
DOE sets objectives for carrying out its mission in an environmentally
sustainable manner that supports a policy of national energy security and
addresses global environmental challenges. SRS continues to make substantial
progress in meeting the goals for the Site. Below are the highlights of the
program:
• Pollution Prevention and Waste Minimization—SRS recycled 54%
(454 metric tons) of nonhazardous solid waste.
• Greenhouse Gas Reduction—SRS continued to reduce greenhouse
gas emissions, exceeding federal goals. The Site has reduced
emissions by 78% since 2008.
• Transportation and Fleet Management—SRS continued to exceed its
fleet management goals. More than 98% of the current fleet of light-
duty vehicles are hybrid, electric, or vehicles that use E85 (85%
ethanol, 15% unleaded gasoline) fuel.
• Awards—SRS received the 2019 Smart Business Recycling Award from
South Carolina Department of Health and Environmental Control
(SCDHEC) for several initiatives and the DOE Sustainability
Performance Office’s 2019 Sustainability Award for using drones at
post-closure waste sites.
Environmental Management System
2-2 Savannah River Site
2.1 SRS ENVIRONMENTAL MANAGEMENT SYSTEM
DOE Order 436.1, Departmental Sustainability, requires federal
facilities to use environmental management systems. SRS
implements an EMS using the International Organization of
Standardization (ISO) 14001:2015 standard to fulfill compliance
obligations and address risks and opportunities. By design,
the “Plan-Do-Check-Act” approach of the ISO 14001:2015
standard continually improves environmental performance.
The SRS EMS has two areas of focus: environmental compliance
and environmental sustainability. Environmental compliance
consists of regulatory compliance and monitoring programs
that implement federal, state, and local requirements,
agreements, and permits. Environmental sustainability
promotes and integrates initiatives such as energy and natural
resource conservation, waste minimization, green remediation,
and using sustainable products and services.
2.1.1 SRS Environmental Policy
The goal of the SRS Environmental Policy is to protect the public
and future generations from any impacts from Site operations.
SRS commits to this by doing the following:
• Promoting sound environmental stewardship
• Preventing pollution onsite and in surrounding communities
• Conducting science and energy research
• Continuing the nation’s national security mission
SRS accomplishes this through:
• Complying with environmental laws and regulations
• Continuing process improvements
• Conducting safe operations
• Communicating with the workforce, public, and stakeholders.
2.1.2 Integration with Integrated Safety Management System
SRS incorporates the Integrated Safety Management System (ISMS) with EMS to provide a
comprehensive framework under which it manages the environmental, safety, and health programs.
This makes it possible for the Site to accomplish all work while protecting the public, workers, and the
environment. The integration confirms that SRS can evaluate work and associated hazards, and that the
Site tailors standards, practices, and controls in a DOE-approved safety management system. Figure 2-1
depicts the relationship between ISMS and EMS and how both management systems integrate.
Chapter 2—Key Terms
Environmental impacts are any
positive or negative changes to the
environment caused by an
organization’s activities, products, or
services.
Environmental objectives define the organization’s environmental goals.
Environmental sustainability is
interacting responsibly with the
environment to conserve natural
resources and promote long-term
environmental quality. It includes
reducing the amount of waste
produced, using less energy, and
developing processes that maintain
the long-term quality of the
environment.

Environmental Management System
Environmental Report 2019 (SRNS-RP-2020-00064) 2-3
ISMS execution comprises five functions: 1)
defining scope of work, 2) analyzing hazards, 3)
developing and implementing controls, 4)
performing work, and 5) providing feedback and
improvement. Likewise, SRS implements ISO 14001
and accomplishes the EMS goals using
the Plan-Do-Check-Act approach, where:
• Plan—encompasses defining work scope
and objectives, identifying environmental
aspects and analyzing hazards, and
developing controls
• Do—encompasses implementing these
controls and performing the work
(operations)
• Check—involves evaluating performance
(feedback), management reviews
• Act—embodies corrective actions,
improvements, and incorporating lessons
learned into practices
2.2 EMS IMPLEMENTATION
The Plan-Do-Check-Act approach is interactive and iterative through the various work activities and
functions including policies, programs, and processes. It also is an integral part of the overall
management of the Site’s environmental compliance and performance.
2.2.1 Plan
The Site establishes environmental goals, objectives, and targets for each project and activity. Before
SRS undertakes any actions or projects, it evaluates associated environmental aspects and their impacts
(or potential environmental hazards) to ensure that SRS can control or mitigate the hazard or risk to
reduce or eliminate impacts to the environment. The Site performs these evaluations against all
applicable federal and state regulations, state permits, and local laws. These regulations and permits are
the foundation for internal manuals, standard operating procedures, and standard requirement-
implementing documents. SRS uses the National Environmental Policy Act (NEPA) planning tool for all
federally proposed actions to take place onsite. The SRS Environmental Evaluation Checklist is a tool the
Site uses to evaluate all activities and projects to ensure the proposed actions consider and mitigate
environmental aspects as necessary.
Another aspect of planning involves training personnel. Training includes sitewide-, task-, and project-
specific training. SRS trains all employees annually on various policies and job-related requirements. The
Site requires General Employee Training and Consolidated Annual Training at a minimum for every
employee so they will be aware of the potential hazards and risks associated with work onsite. Task- and
project-specific training includes skills development and safe-work practices.
Figure 2-1 Integrated Safety Management System
Continual Improvement Framework within the ISO 14001 Environmental Management System

Environmental Management System
2-4 Savannah River Site
Incorporating training and evaluating environmental aspects and their impacts into work planning
ensures SRS will perform mission activities in a manner that protects the public, workers, and the
environment. Additionally, the Site generates regular and routine employee communications as a
reminder of the SRS commitment to sustainability and the environment.
2.2.2 Do
Environmental Compliance Authorities (ECAs) and Environmental Subject Matter Experts (SMEs) support
the facilities and programs with identifying and carrying out their environmental responsibilities. The
SMEs communicate environmental regulatory requirements and required document submittals to the
United States Environmental Protection Agency (EPA), the South Carolina Department of Health and
Environmental Control (SCDHEC), and other stakeholders. The ECAs works with the facilities to ensure
that they implement the requirements.
SRS develops this report and makes it public to summarize in a single document the Site’s environmental
performance on various applicable federal and state regulations, state permits , and local laws.
Chapter 3, Compliance Summary, of this report summarizes SRS’s environmental compliance and
provides the number of NEPA reviews, the number of SRS construction and operating permits, and the
status of key federal environmental laws. Chapter 7, Groundwater Management Program, identifies SRS
efforts to monitor, conserve, and protect groundwater, and to restore contaminated SRS groundwater
to EPA drinking-water quality standards while conforming to state and federal laws.
The Site develops and conducts emergency drills and exercises by implementing the EMS and ISMS
principles and tools. Some of these drills include local, state, and federal emergency response
organizations. Throughout the year, the Site performs safety drills to ensure maximum participation for
various weather, nuclear incident, environmental release, and fire scenarios.
2.2.3 Check
SRS assesses and evaluates internal work to ensure that personnel are performing it as planned and that
Site operations are not adversely impacting worker and public health and the environment. The
environmental monitoring and environmental surveillance programs at SRS follow applicable
requirements to collect and analyze samples across SRS and within a 25-mile radius extending from the
center of the Site to ensure that the radiation dose to members of the public and radioactive releases to
the environment are kept as low as reasonably achievable. Chapters 4, 5, and 6 of this report document
the nonradiological environmental monitoring program, radiological environmental monitoring
program, and the radiological dose assessment, respectively.
The Site also performs management field observations and program assessments to detect potential
issues early to prevent performance shortfalls and to identify processes, practices, behaviors, roles,
responsibilities, and organizational expectations that SRS needs to improve. Chapter 8 of this report,
Quality Assurance, documents how SRS ensures the accuracy of its environmental data.
Various regulators also perform external assessments. SCDHEC performs several inspections and audits
annually to verify that the Site is complying with state permits. EPA also participates on Federal Facility
Act-driven inspections and, on a determined frequency, participates alongside SCDHEC in the

Environmental Management System
Environmental Report 2019 (SRNS-RP-2020-00064) 2-5
compliance evaluation inspections for waste management. Chapter 3, Compliance Summary, has a list
and results of the annual external agency audits and inspections for the SRS Environmental Program.
Every three years, as required by the ISO 14001 standard, a qualified party outside the control or scope
of the EMS must perform a formal EMS audit. The Savannah River Nuclear Solutions, LLC (SRNS) EMS
(which covers Savannah River Remediation LLC [SRR]) conforms to ISO 14001, while Centerra-SRS (SRS’s
protective force services contractor) is registered to the ISO 14001 standard. SRNS’s and Centerra’s next
EMS audit will take place in 2021.
The Environmental Surveillance Oversight Program, a nonregulatory division at SCDHEC, is a check on
the SRS environmental monitoring and surveillance program that independently monitors and oversees
the effectiveness of SRS environmental monitoring for the public.
2.2.4 Act
SRS enhances environmental performance and the health of the EMS through corrective actions and
continual improvement. The Site establishes, implements, and maintains the corrective action program
in accordance with an internal manual for contractor assurance. It deals with actual or potential
conditions of nonconformity, such as Notices of Violation (NOVs) from the state or findings and
opportunities for improvement from internal assessments and audits. Chapter 8, Quality Assurance,
provides an annual summary of improvements to the Site’s Environmental Monitoring Program and
laboratory performance in various proficiency and certification programs.
Communication is vital throughout all operations, environmental concerns, safety, and emergency
preparedness in order to facilitate feedback and to incorporate lessons learned for improvement. This
report and the accompanying summary report also serve as communication tools with stakeholders
(such as the public, academia, SRS Citizen’s Advisory Board, regulators, and other DOE sites) and to
facilitate communication with the community.
2.3 SUSTAINABILITY AND STEWARDSHIP GOALS AND IMPLEMENTATION
DOE Order 436.1, Departmental Sustainability, defines requirements and responsibilities for DOE sites to
manage sustainability and ensure that they are carrying out the DOE mission in a sustainable manner
that addresses energy efficiency goals, greenhouse gas reductions, waste minimization, and pollution
prevention. SRS has integrated environmental stewardship projects into many remediation and closure
activities, addressing requirements for resource conservation, pollution reduction, and environmental
surveillance.
The Executive Order No. 13834, Efficient Federal Operation, signed in May 2018, sets forth energy and
environmental performance goals—based on statutory requirements—for agencies with respect to
managing facilities, vehicles, and operations. Sustainability reporting in this chapter is in accordance to
this executive order. The Office of Federal Sustainability issued instructions for this Executive Order in
April 2019.

Environmental Management System
2-6 Savannah River Site
SRS uses the Site Sustainability Plan (SSP)
to implement the sustainability goals
outlined in DOE’s Sustainability Report
and Implementation Plan (SRIP). The SRIP
is the action plan for DOE to carry out
Executive Order 13834, Efficient Federal
Operations. The goals, which DOE sets
annually for all sites, include the
following:
• Reducing total energy use
• Increasing renewable energy use
• Reducing water use
• Purchasing environment-friendly,
or “green,” products and services
• Reducing solid waste generation
• Increasing the number of
sustainable buildings
• Reducing fleet and petroleum use
• Using energy-compliant
electronic devices
ISO 14001:2015 requires that SRS establish and document measurable environmental objectives
consistent with SRS’s Environmental Policy and SRS’s strategic direction. Appendix A presents these
objectives in the FY 2019 EMS Goals and Objectives flowchart. This chart names sustainability goals as
well as environmental compliance goals for 2019, identifies the related environmental objectives and
strategies for implementation, and provides the status of SRS’s progress toward achieving them. This
chapter contains additional information on how SRS is making progress in supporting DOE objectives.
The following topics summarize the major accomplishments the SSP discusses. Updated annually, the
SRS SSP outlines the strategies in place and identifies the Site’s contributions toward meeting DOE’s
sustainability targets outlined in the SRIP. DOE maintains an online graphical dashboard that tracks the
progress of facilities in the complex in meeting their sustainability goals. The DOE’s Sustainability
Dashboard is the source of the goal performance information in Table 2-1. This table summarizes
specific metrics and SRS’s FY 2019 performance against the sustainability goals to complement the more
general discussion in the text that follows.
Sustainability Goals
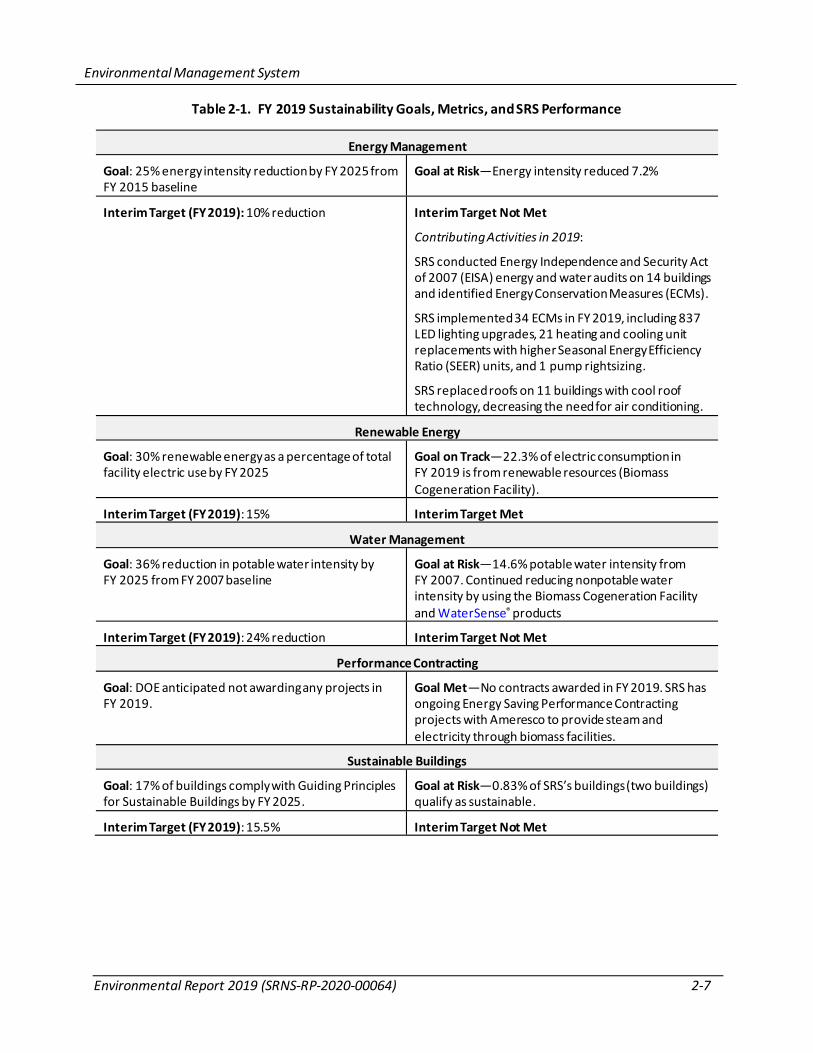
Environmental Management System
Environmental Report 2019 (SRNS-RP-2020-00064) 2-7
Table 2-1. FY 2019 Sustainability Goals, Metrics, and SRS Performance
Energy Management
Goal: 25% energy intensity reduction by FY 2025 from FY 2015 baseline
Goal at Risk—Energy intensity reduced 7.2%
Interim Target (FY 2019): 10% reduction Interim Target Not Met
Contributing Activities in 2019:
SRS conducted Energy Independence and Security Act of 2007 (EISA) energy and water audits on 14 buildings and identified Energy Conservation Measures (ECMs).
SRS implemented 34 ECMs in FY 2019, including 837 LED lighting upgrades, 21 heating and cooling unit replacements with higher Seasonal Energy Efficiency Ratio (SEER) units, and 1 pump rightsizing.
SRS replaced roofs on 11 buildings with cool roof technology, decreasing the need for air conditioning.
Renewable Energy
Goal: 30% renewable energy as a percentage of total facility electric use by FY 2025
Goal on Track—22.3% of electric consumption in FY 2019 is from renewable resources (Biomass Cogeneration Facility).
Interim Target (FY 2019): 15% Interim Target Met
Water Management
Goal: 36% reduction in potable water intensity by FY 2025 from FY 2007 baseline
Goal at Risk—14.6% potable water intensity from FY 2007. Continued reducing nonpotable water intensity by using the Biomass Cogeneration Facility and WaterSense® products
Interim Target (FY 2019): 24% reduction Interim Target Not Met
Performance Contracting
Goal: DOE anticipated not awarding any projects in FY 2019.
Goal Met—No contracts awarded in FY 2019. SRS has ongoing Energy Saving Performance Contracting projects with Ameresco to provide steam and electricity through biomass facilities.
Sustainable Buildings
Goal: 17% of buildings comply with Guiding Principles for Sustainable Buildings by FY 2025.
Goal at Risk—0.83% of SRS’s buildings (two buildings) qualify as sustainable.
Interim Target (FY 2019): 15.5% Interim Target Not Met
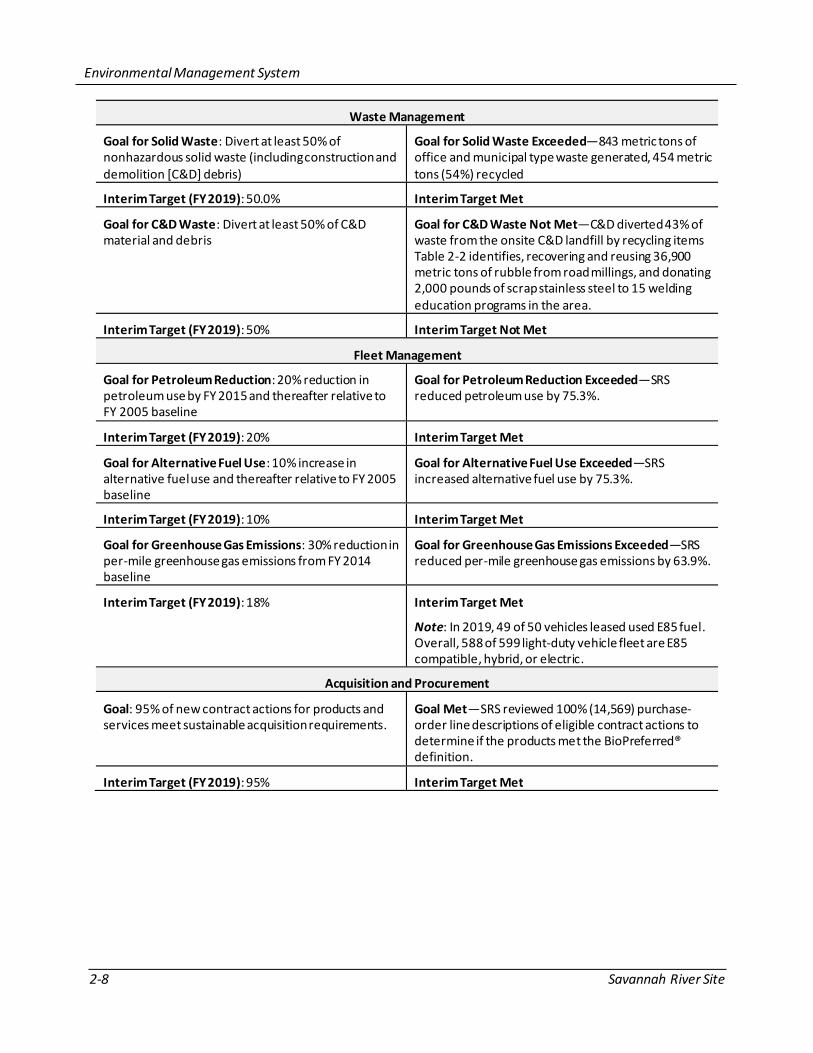
Environmental Management System
2-8 Savannah River Site
Waste Management
Goal for Solid Waste: Divert at least 50% of nonhazardous solid waste (including construction and demolition [C&D] debris)
Goal for Solid Waste Exceeded—843 metric tons of office and municipal type waste generated, 454 metric tons (54%) recycled
Interim Target (FY 2019): 50.0% Interim Target Met
Goal for C&D Waste: Divert at least 50% of C&D material and debris
Goal for C&D Waste Not Met—C&D diverted 43% of waste from the onsite C&D landfill by recycling items Table 2-2 identifies, recovering and reusing 36,900 metric tons of rubble from road millings, and donating 2,000 pounds of scrap stainless steel to 15 welding education programs in the area.
Interim Target (FY 2019): 50% Interim Target Not Met
Fleet Management
Goal for Petroleum Reduction: 20% reduction in petroleum use by FY 2015 and thereafter relative to FY 2005 baseline
Goal for Petroleum Reduction Exceeded—SRS reduced petroleum use by 75.3%.
Interim Target (FY 2019): 20% Interim Target Met
Goal for Alternative Fuel Use: 10% increase in alternative fuel use and thereafter relative to FY 2005 baseline
Goal for Alternative Fuel Use Exceeded—SRS increased alternative fuel use by 75.3%.
Interim Target (FY 2019): 10% Interim Target Met
Goal for Greenhouse Gas Emissions: 30% reduction in per-mile greenhouse gas emissions from FY 2014 baseline
Goal for Greenhouse Gas Emissions Exceeded—SRS reduced per-mile greenhouse gas emissions by 63.9%.
Interim Target (FY 2019): 18% Interim Target Met
Note: In 2019, 49 of 50 vehicles leased used E85 fuel. Overall, 588 of 599 light-duty vehicle fleet are E85 compatible, hybrid, or electric.
Acquisition and Procurement
Goal: 95% of new contract actions for products and services meet sustainable acquisition requirements.
Goal Met—SRS reviewed 100% (14,569) purchase-order line descriptions of eligible contract actions to determine if the products met the BioPreferred® definition.
Interim Target (FY 2019): 95% Interim Target Met

Environmental Management System
Environmental Report 2019 (SRNS-RP-2020-00064) 2-9
Electronics Stewardship
Goal for Environmentally Sustainable Electronics Acquisition: 100% of eligible electronics procurements must be environmentally sustainable (for example, Electronic Product Environmental Assessment Tool [EPEAT]).
Goal for Environmentally Sustainable Electronics Acquisition on Track—98.7% of eligible electronics procured (including 2,841 computers purchased) are environmentally sustainable; 98.6% of electronics meet EPEAT standards with all 442 cellular phones meeting EPEAT Gold.
Interim Target (FY 2019): 95% Interim Target Met
Goal for Disposal of Electronics: 100% of electronics disposed through government programs and certified recyclers
Goal for Disposal of Electronics Met—100% of used electronics are either donated to schools and nonprofit organizations or recycled by authorized recycling companies.
Interim Target (FY 2019): 100%
Interim Target Met
Note: SRS recycled 117,590 pounds of scrap electronics in CY 2019.
Goal for Power Management: 100% of eligible computers (desktops and laptops) and monitors implement and actively use power management features.
Goal for Power Management on Track—99.9% of eligible desktops, laptops, and monitors have power management enabled.
Interim Target (FY 2019): 100% Interim Target Not Met
Goal for Duplex Printing: 100% of eligible printers implement and actively use duplex printing features.
Goal for Duplex Printing Met—All eligible computers and imaging equipment are set up to automatically print on both sides of paper.
Interim Target (FY 2019): 100% Interim Target Met
Data Center Efficiency
Goal: Implement practices that promote energy efficient management of servers and federal data centers.
Goal on Track—SRS is establishing power usage effectiveness (PUE) for data centers that have meters to obtain a baseline of energy use effectiveness.
Resiliency
Goal: Enhance the resilience of the federal infrastructure and operations and enable more effective accomplishment of its mission.
Goal Met—SRS completed a study on climate, projecting higher temperatures and humidities that will allow for a vulnerability assessment of specific Site assets. SRS also conducted multiple facility and sitewide drills and exercises.
Greenhouse Gas Management
Goal for Direct GHG Emissions: 50% reduction in direct greenhouse gas (GHG) emissions by FY 2025 from FY 2008 baseline
Goal for Direct GHG Emissions Exceeded—SRS reduced direct GHG emissions by 70.5%.
Interim Target (FY 2019): 31% reduction Interim Target Met
Goal for Indirect GHG Emissions: 25% reduction in indirect GHG emissions by FY 2025 from FY 2008 baseline
Goal for Indirect GHG Emissions Exceeded—SRS reduced indirect GHG emissions by 86.2%.
Interim Target (FY 2019): 13% Interim Target Met

Environmental Management System
2-10 Savannah River Site
2.3.1 Energy Management
Executive Order No. 13834, Efficient Federal Operations, directs agencies to meet statutory
requirements regarding reducing the amount of energy per square foot (energy intensity) used in an
identified class of buildings and to establish an agency target for decreasing energy intensity annually.
In order to reduce energy intensity, SRS has implemented a wide variety of energy-efficient strategies.
These include upgrading utility systems; minimizing boiler water use for winter heating; operating the
Biomass Cogeneration Facility and the biomass steam plants in A Area, K Area, and L Area; using more
energy-efficient equipment in facilities (for example, lighting timers, lighting sensors, and programmable
thermostats); and upgrading various small-scale light fixtures to light-emitting diodes (LEDs). SRS has
also reduced the overall square footage of the Site by deactivating and decommissioning many facilities,
including entire areas (such as TNX), multiple buildings, land, and associated waste disposal areas.
Additionally, SRS has consolidated employee-occupied office space into fewer buildings.
Another effective strategy SRS uses to improve energy intensity is conducting energy and water audits
of buildings under Section 432 of the Energy Independence and Security Act of 2007 (EISA). Under this
program, SRS has identified 63 Site buildings that are responsible for 76.3% of the Site’s energy
consumption. Focusing on these buildings allows EISA audits, which identify energy conservation
measures (ECMs), to be most effective.
2.3.2 Renewable Energy
Executive Order No. 13834, Efficient Federal Operations , directs agencies to meet statutory
requirements relating to the consumption of renewable energy and electricity. As identified in the DOE
Sustainability Performance Division Sustainability Dashboard, the goal is for SRS to increase renewable
energy as a percentage of total agency electric consumption. SRS has exceeded the renewable energy
goal by generating power onsite from biomass. SRS no longer uses coal to generate energy. Using
renewable energy at the Site is a high-level priority. The Biomass Cogeneration Facility, which uses wood
chips as its primary fuel source and fuel oil and tires as a secondary fuel source, is in its eighth year of
fully operating and plays a significant role in supporting renewable goals.
2.3.3 Water Management
Executive Order No. 13834, Efficient Federal Operations, requires agencies to reduce potable and
nonpotable water use and to comply with stormwater management requirements. The Site has been
significantly decreasing its potable water use over many years. By installing a new SRS primary domestic
water system and continuing to replace old and leaky piping, the Site has saved several hundred million
gallons of water annually. SRS also installed water meters on the main supply lines and periodically
conducts a water balance to monitor use and help detect leaks.
The FY 2007 baseline for the water management sustainability goal does not account for potable water
conservation efforts such as the new primary domestic water system installed prior to 2007. It will be
more difficult for SRS to decrease potable water usage in the future because it has already achieved
large decreases in the programs that have the biggest impact. Potable water use fluctuates from year-
to-year based on various factors, such as the number of employees and the amount of potable water
used for nonpotable purposes.

Environmental Management System
Environmental Report 2019 (SRNS-RP-2020-00064) 2-11
SRS has been using WaterSense® products and other water-conserving products, including low-flow
toilet flush valves, low-flow urinal flush valves, and low-flow faucets. In recent years, the Site has
substituted several hundred less-efficient faucets and flush valves with more-efficient low-flow units as
they needed replacing.
Executive Order No. 13834 requires DOE as an agency to reduce nonpotable water consumption—
mostly industrial, landscaping, and agricultural (ILA) water—but there are no specific targets. DOE has
achieved long-term reductions in ILA water due to the biomass facility operating, which consumes
significantly less water than the previously used coal-fired power plant.
2.3.4 Performance Contracting
Executive Order 13834, Efficient Federal Operations, requires agencies to utilize performance
contracting to achieve energy, water, building modernization, and infrastructure goals. The executive
order requires agencies to set annual targets for the number of awarded contracts and the investment
value each fiscal year.
SRS has used Energy Saving Performance Contracting (ESPC) to engage Ameresco Federal Solutions in
several projects that conserve energy and water. ESPC funds energy- and water-saving building
improvements with future energy savings. Ameresco Federal Solutions, tasked with the DOE’s largest‐
ever ESPC project, operates the Biomass Cogeneration Facility at SRS. This facility produces steam and
electricity on a 24‐hour, full‐time basis. Through an ESPC project, Ameresco also operates steam-only
biomass plants for heating buildings in two areas at SRS.
2.3.5 Sustainable Buildings
Executive Order 13834, Efficient Federal Operations, requires agencies to ensure that new construction
and major renovations conform to applicable building energy-efficiency requirements and sustainable
design principles, consider building efficiency when renewing or entering into leases, implement space
utilization and optimization practices, and annually assess and report on building conformance to
sustainable metrics.
In general, SRS’s aging buildings are not cost-effective to upgrade, and the executive order emphasizes
maintenance, repairs, and ECMs (for example, LED upgrades and more efficient heating ventilation, and
air conditioning [HVAC] systems) identified in EISA audits.
2.3.6 Waste Management
Executive Order 13834, Efficient Federal Operations, requires agencies
to implement waste prevention and recycling and comply with all
federal requirements for solid, hazardous, and toxic waste
management and disposal.
Pollution prevention is a commitment in the SRS Environmental Policy
as required under the ISO 14001:2015 standard. Environmentally safe
and cost-effective reuse or recycling diverts pollutants and wastes
from the waste stream. Pollution prevention at SRS reduces wastes,
mitigates health risks, and protects the environment.

Environmental Management System
2-12 Savannah River Site
SRS uses the North Augusta Material Recovery Facility (NA-MRF) to recycle office paper and municipal-
type waste. In addition, SRS contracts with a third party to shred and recycle sensitive office paper. SRS
continues to work with NA-MRF to enhance the process to attain and improve upon a 50% recovery
rate. SRS continues to monitor this waste stream for opportunities to recycle materials.
Other waste streams at SRS include construction and demolition (C&D) debris and universal waste. C&D
debris includes waste generated from constructing, remodeling, repairing and deconstructing buildings,
roads, bridges, and drainage and sewage systems. This debris is often concrete, asphalt, glass, metal,
plastic, and land-clearing scrap. SRS works to improve the diversion rate of waste streams from the C&D
landfill. For example, SRS continues concrete and asphalt recovery and recycles rubble from scraping
and repaving roads onsite. The Site otherwise would treat the rubble as waste and send it to the onsite
C&D landfill. SRS uses some of this recovered material for beneficial reuse both onsite to improve
secondary roads and offsite to improve county roads. Universal waste include batteries, mercury-
containing equipment, and light bulbs. It must be recycled when generated by businesses, otherwise the
waste must be sent to a RCRA-permitted facility. Table 2-2 breaks down the recycled waste amounts for
2019. Please note that amounts are reported for calendar year 2019 to be consistent with waste
minimization reporting to SCDHEC.
Items Recycled Onsite in FY 2019 Amount Recycled
Silver Fixative 458 pounds
Rechargeable Batteries 4,194.5 pounds
Lead Salvage 0 pounds
Fluorescent Tubes 11, 560 pounds
Batteries (lead acid) 92,720 pounds
Furniture and Cabinets 405,250 pounds
Mixed Metal 1,050,020 pounds
Mixed Paper 922,557 pounds
Used Tires 31,680 pounds
Used Motor Oil 140,000 pounds
Consumer Electronics (including cell phones) 117,590 pounds
Toner Cartridges 31,784 pounds
Industrial Sludge (land applied) 62,400 pounds
Universal Waste Mercury Containing Devices 35.5 pounds
Asphalt 85,560,000 pounds
Table 2-2 SRNS Recycling and Sustainability in 2019 by Amount
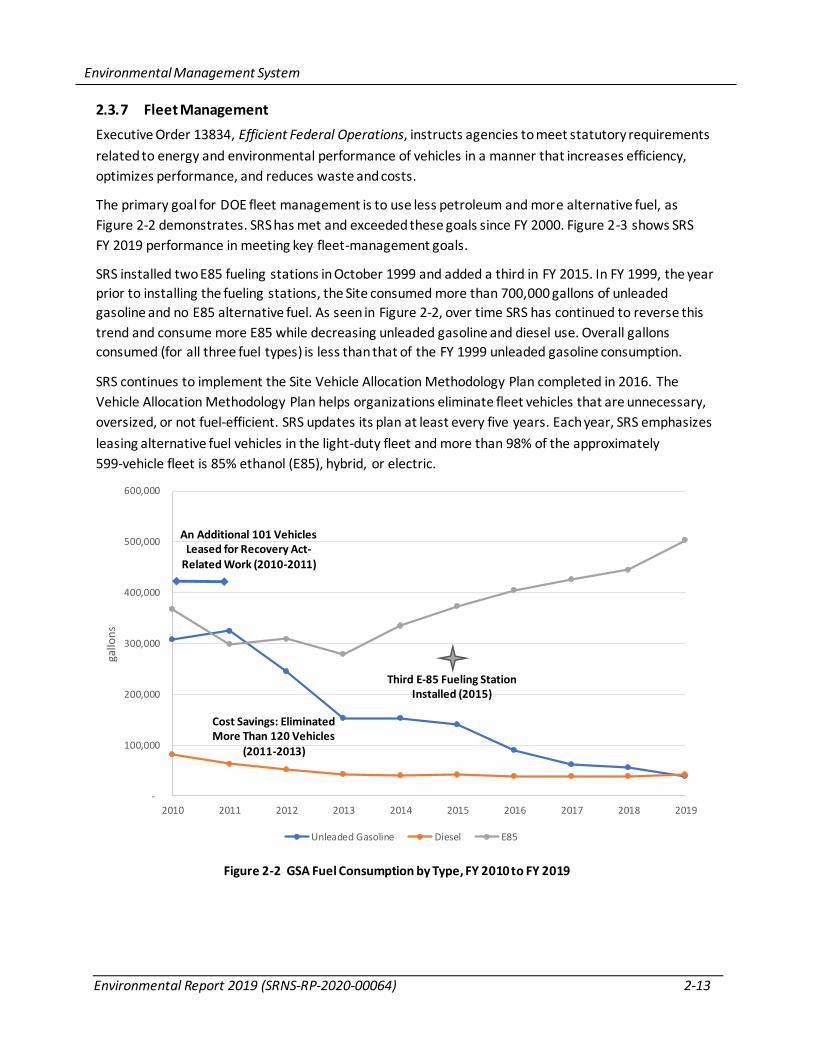
Environmental Management System
Environmental Report 2019 (SRNS-RP-2020-00064) 2-13
2.3.7 Fleet Management
Executive Order 13834, Efficient Federal Operations, instructs agencies to meet statutory requirements
related to energy and environmental performance of vehicles in a manner that increases efficiency,
optimizes performance, and reduces waste and costs.
The primary goal for DOE fleet management is to use less petroleum and more alternative fuel, as
Figure 2-2 demonstrates. SRS has met and exceeded these goals since FY 2000. Figure 2-3 shows SRS
FY 2019 performance in meeting key fleet-management goals.
SRS installed two E85 fueling stations in October 1999 and added a third in FY 2015. In FY 1999, the year
prior to installing the fueling stations, the Site consumed more than 700,000 gallons of unleaded
gasoline and no E85 alternative fuel. As seen in Figure 2-2, over time SRS has continued to reverse this
trend and consume more E85 while decreasing unleaded gasoline and diesel use. Overall gallons
consumed (for all three fuel types) is less than that of the FY 1999 unleaded gasoline consumption.
SRS continues to implement the Site Vehicle Allocation Methodology Plan completed in 2016. The
Vehicle Allocation Methodology Plan helps organizations eliminate fleet vehicles that are unnecessary,
oversized, or not fuel-efficient. SRS updates its plan at least every five years. Each year, SRS emphasizes
leasing alternative fuel vehicles in the light-duty fleet and more than 98% of the approximately
599-vehicle fleet is 85% ethanol (E85), hybrid, or electric.
Figure 2-2 GSA Fuel Consumption by Type, FY 2010 to FY 2019
-
100,000
200,000
300,000
400,000
500,000
600,000
2010 2011 2012 2013 2014 2015 2016 2017 2018 2019
gallo
ns
Unleaded Gasoline Diesel E85
An Additional 101 Vehicles Leased for Recovery Act-
Related Work (2010-2011)
Third E-85 Fueling Station Installed (2015)
Cost Savings: Eliminated More Than 120 Vehicles
(2011-2013)

Environmental Management System
2-14 Savannah River Site
2.3.8 Acquisition and Procurement
Executive Order 13834, Efficient Federal Operations, requires agencies to acquire, use, and dispose of
products and services (including electronics) according to statutory mandates for purchasing preference,
federal acquisition regulation requirements, and other applicable federal procurement policies. The DOE
goal is to track and make improvements with targets to be determined. These statutory mandates
require purchases to include:
• Products that meet minimum requirements for recycled
content as the U.S. EPA identifies
• Products that the United States Department of Agriculture
(USDA) designates as biobased or BioPreferred®
• Products that the U.S. EPA’S ENERGY STAR® program or the Federal Energy Management
Program designate as having the potential to generate significant energy savings
Agencies must also maximize substituting alternatives to ozone-depleting substances identified under
the U.S. EPA’s Significant New Alternatives Policy (SNAP).
SRS procurement personnel review purchase-order line descriptions of eligible contract actions to
determine whether the product meets the USDA’s definition of BioPreferred®.
Procurement has established sustainable practices related to purchasing environmentally preferable
products (EPP) to meet sustainable acquisition requirements. The EPP purchases have led to practices,
as outlined below:
• The SRS Chemical Management Center reviews and approves chemical acquisitions. This review
monitors hazardous chemicals use and, where appropriate, recommends EPPs.
Figure 2-3 SRS Performance in Meeting Fleet Management and Transportation Goals
3020
10
7563.9
75.3 75.3
98
0
20
40
60
80
100
Fleet-wide Per-mileGHG Emssions (%
Reduction by FY 2025)
Reduction in AnnualPetroleum
Consumption (%Reduction Against FY
2005 Baseline)
Annual Increase inAlternate Fuel
Consumption (%Increase Against FY
2005 Baseline)
Percent Light duty Vehicle Aquisitions
being Alternate Fuel—
FY 2019 Goal
Goal 30 20 10 75
FY 2019 63.9 75.3 75.3 98
Per
cen
tage
Environmental Management System
Environmental Report 2019 (SRNS-RP-2020-00064) 2-15
• SRS has procured EPP substitutions under various new and existing contracts, including bulk
janitorial supplies (cleaners, paper products) and safety items (earplugs, filters).
2.3.9 Electronics Stewardship
Executive Order 13834, Efficient Federal Operations, instructs agencies to
manage electronics to reduce energy and environmental impacts.
SRS implements many strategies to reduce energy use, waste, and costs
associated with electronics by:
• Purchasing computers rather than leasing
• Procuring desktops, laptops, and monitors that meet EPEAT standards
and copiers that are ENERGY STAR-compliant
• Setting up all eligible computers and imaging equipment to automatically print on both sides of
paper (duplex printing)
• Programming all eligible desktops, laptops, and monitors to default to power-save mode when
in standby
The Site either recycles or reuses electronics in an environmentally sound manner by donating to
schools and nonprofit organizations or by recycling through authorized vendors. SRS recently extended
the “workstation refresh cycle” from three to five years. This is the timeframe for replacing a computer.
A longer timeframe reduces the number of computers being retired and the amount of generated scrap
electronics.
2.3.10 Data Center Efficiency
Data centers are energy-intensive operations that contribute to agency energy and water use and costs.
Executive Order 13834, Efficient Federal Operations, encourages implementing practices that promote
managing servers and federal data centers energy-efficiently.
One measure of energy efficiency for data centers is power-usage effectiveness (PUE), which is the ratio
of total energy used by a computer data center facility to the energy delivered to the computing
equipment. While no specific target PUEs have been set, agencies are collecting data. Of the nine data
centers at SRS, two have established PUEs. Other data centers do not have electrical meters, so
determining PUE is not yet possible.
2.3.11 Resiliency
Executive Order 13834 directs agencies to prioritize actions that enhance the resilience of federal
infrastructure and operations. Resilience is the ability of an agency to adapt to changing conditions and
withstand or recover from disruptions. SRS ensures that federal operations and facilities can continue to
protect and serve citizens in a changing climate. SRS uses global climate model projections and data as
the starting point to assess the impact of climate change to Site buildings and outdoor workers and has
developed studies that describe the specific threat to Site operations posed by climate change. The SRS
Emergency Response Organization also has regularly scheduled facility and sitewide drills and exercises

Environmental Management System
2-16 Savannah River Site
involving accidents, spills, and natural disaster scenarios to better respond and recover from such
disruptions should they occur.
2.3.12 Greenhouse Gas Management
Executive Order 13834, Efficient Federal Operations, directs agencies to track and report on a variety of
performance measures, including greenhouse gas (GHG) emissions. The DOE goal is to continue to track
and reduce GHG.
SRS continues to reduce GHG as reported in previous years’ SRS Environmental Reports. Scope 1 GHG
emissions consist of direct emissions from sources that DOE owns or controls, such as onsite combustion
of fossil fuels and fleet fuel consumption. Scope 2 GHG emissions consist of indirect emissions from
sources that DOE owns or controls, such as emissions from generating electricity, heat, or steam DOE
purchased from a utility provider. Scope 3 GHG emissions are from sources DOE does not own or
directly control but are related to DOE activities, such as employee travel and commuting.
The following inventoried sources at SRS
currently generate Scope 1 and 2 emissions:
• Purchased electricity
• Wood (biomass)
• Fuel oil
• Propane
• Gasoline
• Diesel
• E85 (ethanol)
• Jet fuel
• Fugitive emissions
SRS continues to substantially reduce Scope 1 and 2 GHGs due to Biomass Cogeneration Facility and
three additional biomass facilities, one each in A Area, L Area, and K Area. DOE tracks GHG data from
various impact sources (such as Site energy use, alternative workplace arrangements and space
optimization, as well as vehicle and equipment use). SRS continues to reduce Scope 3 GHG emissions by
such efforts as using webinars and conference calls to reduce business travel and by promoting
employee carpooling.
Biomass Cogeneration Facility

Environmental Management System
Environmental Report 2019 (SRNS-RP-2020-00064) 2-17
2.4 EMS BEST PRACTICES
2.4.1 2019 Department of Energy Sustainability
Award
The Sustainability Performance Division recognized SRS
for its innovative approach to sustainability by using aerial
drones to monitor vegetation growth on top of two
closed reactor buildings. Instead of using helicopters, as
previously done, aerial drones equipped with high-
resolution video cameras allowed for more-effective
surveillance of the buildings and for remotely performed
surveillance and maintenance, keeping workers safe.
2.4.2 2019 South Carolina Department of Health and Environmental Control Smart Business
Recycling Award
SCDHEC awarded SRS the Smart Business Award to recognize
its outstanding waste reduction and recycling effort. The
award acknowledges SRS for the many waste-reduction and
energy-efficient programs, including the onsite biomass
facility. The focus is on acquiring alternative fuel vehicles,
using drones instead of helicopters (a recycling rate [58% in 2018] above the South Carolina recycling
rate goal of 40%), and using road millings to improve secondary roads both offsite and onsite.
2.4.3 Sustainability Campaign
SRS continues to implement its “One Simple Act of Green” environmental awareness campaign. The
program empowers SRS employees with the information, tools, and programs needed to reduce the
Site’s footprint on the environment. Employees practice simple acts, such as turning off lights when
leaving a room or workspace, which promote environmental stewardship.
2.4.4 Earth Day
SRS hosted an Earth Day celebration onsite on April 22, 2019
with approximately 400 employees attending. The theme,
“Save Our Species,” was consistent with National Earth Day.
The exposition-format event included exhibits on the
importance of pollinators, the Migratory Bird Treaty Act, and
a demonstration of environmental monitoring techniques.
There was broad participation from organizations internal to
SRS (Savannah River Remediation, Savannah River Ecology
Laboratory, USDA Forest Service-Savannah River) and
external to SRS (SCDHEC, the Aiken Beekeepers, and the
Clemson Cooperative Extension).
Drone’s View of P Reactor
SRS Employees Visit an Earth Day Booth
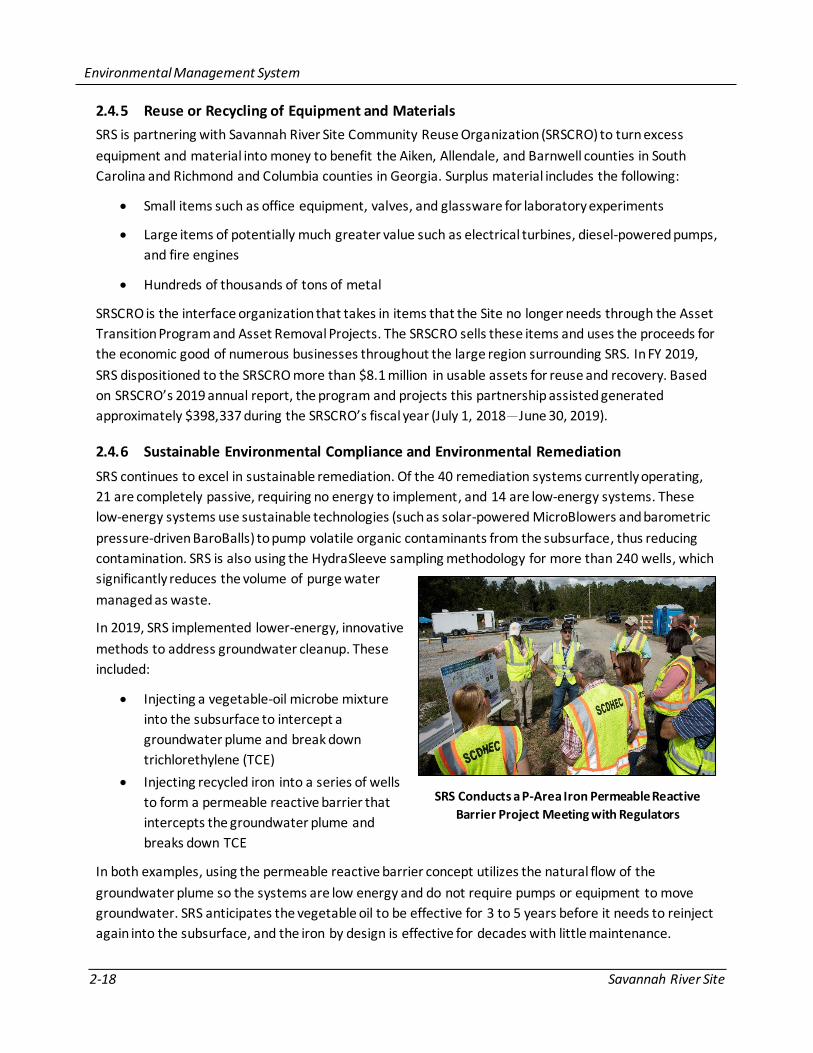
Environmental Management System
2-18 Savannah River Site
2.4.5 Reuse or Recycling of Equipment and Materials
SRS is partnering with Savannah River Site Community Reuse Organization (SRSCRO) to turn excess
equipment and material into money to benefit the Aiken, Allendale, and Barnwell counties in South
Carolina and Richmond and Columbia counties in Georgia. Surplus material includes the following:
• Small items such as office equipment, valves, and glassware for laboratory experiments
• Large items of potentially much greater value such as electrical turbines, diesel-powered pumps,
and fire engines
• Hundreds of thousands of tons of metal
SRSCRO is the interface organization that takes in items that the Site no longer needs through the Asset
Transition Program and Asset Removal Projects. The SRSCRO sells these items and uses the proceeds for
the economic good of numerous businesses throughout the large region surrounding SRS. In FY 2019,
SRS dispositioned to the SRSCRO more than $8.1 million in usable assets for reuse and recovery. Based
on SRSCRO’s 2019 annual report, the program and projects this partnership assisted generated
approximately $398,337 during the SRSCRO’s fiscal year (July 1, 2018—June 30, 2019).
2.4.6 Sustainable Environmental Compliance and Environmental Remediation
SRS continues to excel in sustainable remediation. Of the 40 remediation systems currently operating,
21 are completely passive, requiring no energy to implement, and 14 are low-energy systems. These
low-energy systems use sustainable technologies (such as solar-powered MicroBlowers and barometric
pressure-driven BaroBalls) to pump volatile organic contaminants from the subsurface, thus reducing
contamination. SRS is also using the HydraSleeve sampling methodology for more than 240 wells, which
significantly reduces the volume of purge water
managed as waste.
In 2019, SRS implemented lower-energy, innovative
methods to address groundwater cleanup. These
included:
• Injecting a vegetable-oil microbe mixture
into the subsurface to intercept a
groundwater plume and break down
trichlorethylene (TCE)
• Injecting recycled iron into a series of wells
to form a permeable reactive barrier that
intercepts the groundwater plume and
breaks down TCE
In both examples, using the permeable reactive barrier concept utilizes the natural flow of the
groundwater plume so the systems are low energy and do not require pumps or equipment to move
groundwater. SRS anticipates the vegetable oil to be effective for 3 to 5 years before it needs to reinject
again into the subsurface, and the iron by design is effective for decades with little maintenance.
SRS Conducts a P-Area Iron Permeable Reactive
Barrier Project Meeting with Regulators

Environmental Management System
Environmental Report 2019 (SRNS-RP-2020-00064) 2-19
SRS continues to deploy remotely operated devices (drones and wireless stormwater sampling
equipment) discussed in the 2018 SRS Environmental Report. Not only do these devices address
environmental compliance, improve worker safety, and increase productivity, but they also decrease
vehicle and fuel use, thereby supporting fleet management goals.
2.4.7 Challenges and Barriers to Implementation
In 2019, SRS continued to make progress conserving and managing resources to meet the sustainability
goals in the Site Sustainability Plan. However, aging infrastructure continually poses challenges to
initiating sustainable projects. Achieving new goals is becoming significantly difficult with the high cost
of implementing sustainability upgrades at SRS’s many aging facilities (administrative, shops,
laboratories, warehouses). SRS reduces potable water use by continuing to install water-efficient toilet
systems when repairs indicate the need. However, site-wide retrofitting with low-flow flush valves and
faucets is not cost-effective. Likewise, SRS reduces energy intensity when possible in maintenance and
repair situations through such actions as replacing fluorescent lighting with more efficient LED lighting,
replacing HVAC systems with higher-SEER units, and rightsizing pumps. Retrofitting entire buildings or
systems is not typically cost-effective. Sustainability efforts related to energy management will require
additional guidance as SRS conducts EISA audits for Site infrastructure and performs feasibility studies
on possible energy projects with limited resources and competing priorities.
While successfully implementing the latest version (2015) of the ISO 14001 standard in 2018, SRS
identified program challenges with the 2015 standard including leadership engagement in the EMS
program to communicate the importance of EMS to all personnel. This work continued in 2019 as SRS
integrated and promoted awareness of EMS principles in daily work practices.
The Site will continue to study, track, and discuss the sustainability requirements of Executive Order
13834, Efficient Federal Operations, to ensure implementation. For example, as discussed previously,
while SRS is inserting sustainable acquisition clauses in all applicable solicitations, there is work to be
done tracking sustainable acquisition purchases (BioBased, SNAP, and others). SRS continues to
determine and implement ways to increase end-user awareness of sustainable acquisitions.
The EMS program will require ongoing multidisciplinary (environmental compliance, procurement,
sustainability personnel) involvement to facilitate further awareness at the working level and to increase
the value of the management system in Site business practices.

Environmental Management System
2-20 Savannah River Site
This page intentionally left blank

Environmental Report 2019 (SRNS-RP-2020-00064) 3-1
Chapter 3: Compliance Summary
3 COMPLIANCE SUMMARY he Savannah River Site (SRS) implements programs to meet the requirements of applicable federal and state environmental laws and regulations, as well as U.S. Department of Energy (DOE) Orders, notices, directives, policies, and guidance. The Site’s goal is to comply with regulatory requirements and eliminate or minimize any environmental impacts. SRS continues its decades-long commitment to protect human health and the environment.
2019 Highlights Permitting
SRS managed more than 630 operating and construction permits. SRS received one Notice of Violation (NOV). More information on the NOV can be found below and in Section 3.3.7.1.1.
Remediation (Environmental Restoration and Cleanup) As of December, SRS completed the cleanup of 410 of the 515 waste units containing or having contained solid or hazardous waste. An additional eight waste units are currently being remediated.
Tank Closure (Radioactive Liquid Waste Processing and Dispositioning)
• The Tank Closure Cesium Removal (TCCR) system began operating in January and treated 210,000 gallons of salt solution during the year.
• The Actinide Removal Process and Modular Caustic Side Solvent Extraction Unit (ARP/MCU) processed 404,000 gallons of salt solution in fiscal year (FY) 2019.
• The Defense Waste Processing Facility (DWPF) filled 34 canisters with 126,783 pounds of glass waste mixture, immobilizing 643,624 curies of high-level radioactive waste.
• The Saltstone facilities processed 734,391 gallons of low-activity waste in FY 2019.
• Bulk Waste Removal Efforts (BWRE) in Tank 10 were completed one month ahead of the Federal Facility Act (FFA) deadline.
Radioactive Waste Management
• The annual reviews for the E-Area Low-Level Waste Facility Performance Assessment (PA) and the Saltstone Disposal Facility PA showed that SRS continued to operate these facilities in a safe and protective manner.
• SRS sent five transuranic waste (TRU) shipments to the Waste Isolation Pilot Plant (WIPP) for deep geologic disposal.
T

Compliance Summary
3-2 Savannah River Site
3-2 Savannah River Site
2019 Highlights (continued) Resource Conservation and Recovery Act (RCRA)
• In October, SRS submitted the Closure Certification Report for the Solvent Storage Tanks (SSTs) to South Carolina Department of Health and Environmental Control (SCDHEC).
• SCDHEC conducted a compliance evaluation inspection at selected RCRA facilities on May 22 and May 23 and did not note any deficiencies.
• SCDHEC performed a Comprehensive Groundwater Monitoring Evaluation on April 22 and 23, inspecting groundwater monitoring systems and corrective actions at the M-Area and Metallurgical Laboratory Hazardous Waste Management Facilities, Sanitary Landfill, Mixed Waste Management Facility, and F- and H-Areas Hazardous Waste Management Facilities. It found one broken monitoring well sign, and the facility promptly replaced the sign. The inspection did not reveal any other problems or concerns.
• During the SCDHEC annual Underground Storage Tank (UST) inspection on October 30, all 19 of the USTs were in compliance.
Air Quality and Protection
• SRS met all Clean Air Act requirements.
Water Quality and Protection
• All 41 SRS Industrial stormwater outfalls in the General Permit covered under a Stormwater Pollution Prevention Plan (SWPPP) complied with plan requirements. The SWPPP describes how SRS prevents contamination and controls sedimentation and erosion.
• In November, SRS received an NOV for failing to comply with the reporting requirement of the National Pollutant Discharge (NPDES) Permit. SRS identified and initiated corrective actions. SRS has resolved all matters SCDHEC raised in the NOV. There are no further enforcement actions.
Radiation Protection of the Public and the Environment
SRS air and water discharges containing radionuclides were well below the DOE public dose limit of 100 mrem per year. (Chapter 6, Radiological Dose Assessment explains the public dose.)
Environmental Protection and Resource Management
• SRS conducted 836 National Environmental Policy Act (NEPA) reviews to identify potential environmental impacts from proposed federal activities. SRS identified 755 of these as categorical exclusions that did not require action from the Site under NEPA.

Compliance Summary
Environmental Report 2019 (SRNS-RP-2020-00064) 3-3
3.1 INTRODUCTION
Complying with environmental regulations and DOE Orders is integral to SRS operations. This chapter summarizes how SRS complies with applicable environmental regulations and programmatic requirements.
3.2 FEDERAL FACILITY AGREEMENT
The 1993 Federal Facility Agreement (FFA) for the Savannah River Site, a tri-party agreement between DOE, EPA, and SCDHEC, integrates CERCLA and RCRA requirements to achieve a comprehensive remediation strategy and to coordinate administrative and public participation requirements. The FFA governs remedial actions, sets annual work priorities, and establishes milestones for cleanup and tank closure. SRS conducts remediation and closure activities identified in the FFA in accordance with applicable regulations, whether they are from the state, the federal government, or both. Additional information regarding the FFA commitments discussed in this section can be found on the SRS and SRR web pages.
3.2.1 Remediation (Environmental Restoration and Cleanup)
SRS has 515 waste units subject to the FFA, including RCRA/CERCLA units, Site Evaluation Areas, and facilities covered by the SRS RCRA permit. At the end of FY 2019, SRS had completed the surface and groundwater cleanup of 410 of these units and was in the process of remediating an additional eight units. Appendix C, RCRA/CERCLA Units List; Appendix G, Site Evaluation List; and Appendix H, Solid Waste Management Units Evaluation of the FFA list all of SRS’s 515 waste units. The Federal Facility Agreement Annual Progress Report for Fiscal Year 2019 explains the status of FFA activities at SRS for FY 2019.
CERCLA and the National Oil and Hazardous Substances Pollution Contingency Plan require remedy reviews every five years for sites that have hazardous substances remaining at levels that do not allow for
2019 Highlights (continued) • SRS continued to comply with many other federal laws, including the Emergency
Planning and Community Right-to-Know Act (EPCRA); the Superfund Amendments and Reauthorization Act (SARA) Title III; the Endangered Species Act (ESA); the Federal Insecticide, Fungicide, and Rodenticide Act (FIFRA); the National Historic Preservation Act (NHPA); and the Migratory Bird Treaty Act (MBTA).
Release Reporting
SRS did not have any releases exceeding the Comprehensive Environmental Response, Compensation, and Liability Act (CERCLA) Reportable Quantity.
External Environmental Audits and Inspections The Environmental Protection Agency (EPA) and SCDHEC conducted audits, inspections, and site visits of various SRS environmental programs to ensure regulatory compliance. The Federal Energy Regulatory Commission (FERC) performed a dam safety inspection in March.

Compliance Summary
3-4 Savannah River Site
3-4 Savannah River Site
unrestricted use of the area after a remedy is in place. Due to the rising number of SRS remedial decisions requiring five-year remedy reviews and new EPA guidance and format requirements, the DOE, EPA, and SCDHEC agreed in 2014 to submit future SRS Five-Year Remedy Review Reports in a phased approach rather than combining all operable unit (OU) reviews into a single document. The OUs are in groups of the following remedy types: 1) native soil cover and land-use controls, 2) groundwater, 3) engineered cover systems, 4) geosynthetic or stabilization and solidification cover systems, and 5) operating equipment. In order to ensure that SRS completes reviews of all remedy types within five years, it looks at a different remedy type each of the five years. The Site evaluates remedies to determine if they are functioning as designed and are still protecting human health and the environment.
SRS prepared the following reports to satisfy the CERCLA requirements:
• Sixth Five-Year Remedy Review Report for Savannah River Site Operable Units with Native Soil Covers and/or Land Use Controls: SCDHEC and EPA approved on August 7, 2019. SRS issued it to the public on November 5, 2019.
• Sixth Five-Year Remedy Review Report for Savannah River Site Operable Units with Groundwater Remedies. DOE submitted it to SCDHEC and EPA on December 19, 2019.
During FY 2019, SRS remediated the G-Area Oil Seepage Basin Operable Unit (GOSB OU) and the Wetland Area at Dunbarton Bay. In addition, it conducted removal actions at the C-Area Groundwater OU and P-Area Groundwater OU. Chapter 7, Groundwater Management Program provides information regarding these removal actions.
G-Area Oil Seepage Basin OU
SRS completed remediation of the GOSB OU in December 2019. Construction of the remedy began in September 2019. The basin was filled with 1,400 tons of stone, followed by 7,000 cubic yards of dirt, and then capped with grass sod.
The Site constructed the basin, spanning approximately 0.4 acres and extending to a depth of up to 10 feet, during SRS plant construction (1951-1956) for liquid waste disposal. It later received sanitary wastewater from treatment plants in Central Shops until the early 1990s. In the early 2000s, investigations found low levels of pesticides and herbicides in the soils at the bottom of the basin. Now, the basin is filled
The GOSB OU is Just One of Several Remediated Waste Units at SRS

Compliance Summary
Environmental Report 2019 (SRNS-RP-2020-00064) 3-5
with clean soil mounded underneath a grass cover, eliminating the risk to human health and ecology in the area. The Post Construction Report/Corrective Measures Implementation Report/Remedial Action Completion Report (Revision 0), which will describe the remedy and final state, is being prepared and will be submitted to SCDHEC and EPA by September 2020.
Wetland Area at Dunbarton Bay
SRS workers excavated about 29,000 cubic yards of coal ash from a now-defunct powerhouse that created electricity and steam for P Reactor, when it was operable. For more than three decades, the powerhouse supported plutonium production for the nation’s nuclear defense program.
Basin remediation had been part of a larger project to decommission P and R Reactors. The powerhouse provided electricity to both reactors. The Site disposed of the ash byproduct in the basin.
Relocating the ash, which extended from a basin to nearby wetlands in a layer up to 3 feet thick, to a permitted landfill was a significant step toward completing DOE-Environmental Management’s environmental cleanup mission at SRS.
Workers used heavy equipment to remove the soil and ash one acre at a time in order to minimize erosion. A dominant feature and concern of the cleanup area was the Carolina bay, known locally as Dunbarton Bay. Carolina bays are elliptical depressions in the land that are typically marshy, rich in biodiversity, and ecologically sensitive. A variety of trees grow in and around these depressions.
SRS worked with representatives from state and federal agencies to preserve the bay. SRS controlled ash removal to protect Dunbarton Bay’s sensitive ecosystem from damage construction caused. With the ash removed, SRS restored the excavation site, with the expectation that one day it will return as a hardwood forest instead of a wetland area.
3.2.2 Tank Closure (Radioactive Liquid Waste Processing and Dispositioning)
SRS generates liquid radioactive waste as a byproduct of processing nuclear materials. The Site stores the waste in underground waste tanks grouped into two tank farms (F-Tank Farm and H-Tank Farm). While in the tanks, a sludge settles on the bottom of the tank, and a liquid salt waste rises to the top. The waste removed from the tanks feeds the sludge and salt waste processing programs, as Figure 3-1 depicts.
Work in Progress at Wetland Area at Dunbarton Bay

Compliance Summary
3-6 Savannah River Site
3-6 Savannah River Site
Figure 3-1 Pathway for Processing and Dispositioning Radioactive Liquid Waste at SRS
SRS
Liqu
id W
aste
Pro
gram

Compliance Summary
Environmental Report 2019 (SRNS-RP-2020-00064) 3-7
3.2.2.1 Tank Closure
SRR operates the F-Tank Farm and H-Tank Farm under the SCDHEC industrial wastewater regulations; however, the FFA Section IX, High-Level Radioactive Waste Tank System(s), establishes requirements for preventing and mitigating releases from these tank systems. The FFA also contains enforceable closure schedules for the liquid waste tanks. Tank closures are subject to DOE Order 435.1, Radioactive Waste Management; federal regulations; and Section 3116 of the Ronald W. Reagan National Defense Authorization Act (NDAA) for Fiscal Year 2005.
NDAA Section 3116(a) is legislation that allows the Secretary of Energy to consult with the Nuclear Regulatory Commission (NRC) to determine that certain waste from spent fuel reprocessing is not high-level radioactive waste and does not need to be disposed of in a deep geologic repository. The NRC coordinates with SCDHEC to monitor the steps DOE takes to dispose of the waste to assess whether it is complying with the performance objectives of 10 Code of Federal Regulations (CFR) Part 61, Subpart C. Additionally, the EPA may participate in the NRC monitoring. Section 3116 Determination for Closure of F-Tank Farm at the Savannah River Site and Section 3116 Determination for Closure of H-Tank Farm at the Savannah River Site demonstrate that the stabilized tanks and ancillary structures in the F-Tank Farm and H-Tank Farm meet the necessary criteria and will not need to be permanently isolated at a deep geologicrepository.
During 2019, DOE supported the NRC in its F- and H-Tank Farm monitoring role under Section 3116 of the NDAA by providing routine documentation (for example, groundwater monitoring reports, performance assessment [PA] maintenance plan), as the NRC requested. The NRC conducted one onsite observation visit for F- and H-Tank Farms during 2019 and did not identify any issues. Prior to SRS closing the tanks, they undergo an extensive waste removal process that includes specialized mechanical cleaning and isolation from the waste transfer and chemical systems. Once these steps are complete, DOE receives regulatory confirmation that the tanks are ready to be stabilized by grouting.
The first step in this process is Bulk Waste Removal Efforts (BWRE). Preparing for BWRE is typically a multiyear engineering and waste removal process that involves installing specialized equipment that meets strict nuclear safety standards. DOE completed BWRE in Tank 10 in October 2019, one month ahead of the FFA deadline. There were no other FFA tank closure commitments required for 2019, and the follow-up negotiations are scheduled to be completed in 2022 for additional tank closures.
3.2.2.2 Salt Processing
SRS is using several processes to dispose of the salt waste from the liquid waste tanks, as Figure 3-2 shows. The Actinide Removal Process and Modular Caustic Side Solvent Extraction Unit (ARP/MCU) is an interim salt waste processing system. SCDHEC permitted ARP/MCU under South Carolina industrial wastewater regulations. The salt form of the liquid waste is 90% of the waste volume stored in the tanks and contains about half of the radioactivity. The ARP/MCU process removes actinides, strontium, and cesium from the salt waste taken from the liquid waste tank farms. In FY 2019, the MCU processed about 404,000 gallons of salt solution. SRS sends the higher activity portion of the salt waste—a very small stream—to the Defense Waste Processing Facility (DWPF) and the remaining portion, a low-activity salt solution, to the Saltstone facilities. In May 2019, the ARP/MCU facility received its last transfer of salt solution and subsequently underwent a final de-inventory and flushing process. The facilities then underwent lay-up activities to be

Compliance Summary
3-8 Savannah River Site
3-8 Savannah River Site
put in a safe, stable suspended operational configuration, which allowed for final Salt Waste Processing Facility (SWPF) tie-ins to be completed.
SRS procured the Tank Closure Cesium Removal (TCCR) system to treat salt waste, increase salt processing capability, and to expedite tank closure. The Site completed TCCR design and fabrication in 2017, and installation and readiness assessments in 2018. The TCCR started operating in January 2019 and processed 210,000 gallons of salt solution in 2019.
3.2.2.3 Salt Disposition
After ARP/MCU and TCCR interim processing, the decontaminated salt solution undergoes processing into grout waste at the Saltstone Production Facility and is disposed of in the Saltstone Disposal Facility (SDF). SCDHEC permits the SDF to operate under South Carolina solid waste industrial landfill regulations. SRS disposes of treated low-level salt waste in the SDF, based on the Secretary of Energy’s determination pursuant to Section 3116 Determination for Salt Waste Disposal at the Savannah River Site. NDAA Section 3116(b) requires the NRC, in coordination with SCDHEC, to monitor the disposal actions DOE takes to assess whether it is complying with the objectives of 10 CFR Part 61.
During 2019, DOE supported the NRC’s monitoring of SDF under Section 3116 of the NDAA by providing routine documentation (for example, groundwater monitoring reports, PA maintenance plan), as the NRC requested. The NRC made one onsite observation visit for salt waste disposal during 2019.
In FY 2019, Saltstone facilities processed and disposed of 734,391 gallons of waste. In 2019, SRS continued the permanent disposal of the grout waste in cylindrical concrete Saltstone Disposal Units (SDUs), including SDU-6, the 32.8 million-gallon, 375-foot in diameter rubber-lined mega vault. SRS was constructing SDU-7 in 2019, another mega-vault, with an anticipated completion date of mid-2020 and conducting site preparation for the next two mega-vaults, SDU-8 and SDU-9.
3.2.2.4 Sludge Waste Processing—Vitrification of High-Activity Waste
SCDHEC permits DWPF to operate under South Carolina industrial wastewater regulations. The sludge waste makes up less than 10% of the waste volume stored in the tanks and contains about half of the
Ion Exchange Column Installed at TCCR
Saltstone Disposal Units Being Constructed Next to SDU-6
Compliance Summary
Environmental Report 2019 (SRNS-RP-2020-00064) 3-9
radioactivity, as Figure 3-1 shows. At DWPF, SRS combines the high-activity portion of both the sludge and salt waste from the Tank Farms with frit before sending the mixture to the plant’s melter. The melter heats the waste/frit mixture to nearly 2,100 degrees Fahrenheit, until molten. The resulting glass-waste mixture is poured into stainless steel canisters to cool and harden. This process, called “vitrification,” immobilizes the radioactive waste into a solid glass form suitable for long-term storage and disposal. SRS stores these canisters temporarily in the Glass Waste Storage Buildings, in preparation for final disposal in a federal repository.
During FY 2019, DWPF produced 34 canisters of 126,783 pounds of glass, immobilizing 643,624 curies of radioactivity. Since DWPF began operating in March 1996, it has produced more than 4,200 canisters of 16 million pounds of glass, immobilizing 61.7 million curies of radioactivity.
3.2.2.5 Low-Level Liquid Waste Treatment
The F- and H-Area Effluent Treatment Project (ETP) treats low-level radioactive wastewater from the Tank Farms. ETP removes chemical and radioactive contaminants from the water before releasing it into Upper Three Runs Creek, an onsite stream that flows to the Savannah River. The point of discharge is a South Carolina National Pollutant Discharge Elimination System (NPDES)-permitted outfall. ETP processed more than 6.5 million gallons of treated wastewater in FY 2019. SCDHEC permitted the ETP under the South Carolina industrial wastewater regulations. ETP remained in compliance with the industrial wastewater permit and the NPDES permit throughout 2019.
3.3 REGULATORY COMPLIANCE
This section summarizes how SRS complies with the applicable federal and state environmental laws and regulations.
3.3.1 Atomic Energy Act/DOE Order 435.1, Radioactive Waste Management
SRS waste and materials management is complex and includes numerous facilities that DOE Orders and federal and state regulations govern. DOE Order 435.1 covers all radioactive waste management (low-level waste [LLW], high-level waste [HLW], and transuranic [TRU] waste) to protect the public, workers, and the environment. LLW is the only one of these waste types SRS disposes of onsite, at the E-Area Low-Level Waste Facility and the Saltstone Disposal Facility. LLW is radioactive waste not classified as HLW or TRU waste and not containing any Resource Conservation and Recovery Act (RCRA) hazardous waste.
DOE Manual 435.1-1, Radioactive Waste Management Manual, requires DOE to prepare performance assessments (PAs) to evaluate the potential impacts of low-level radioactive waste disposal and closure activities (for example, Tank Farms) to the workers, the public, and the environment. The PAs provide the technical basis and evaluation needed to demonstrate compliance with DOE Order 435.1. The Order also requires a composite analysis (CA) to assess the combined impact of multiple LLW disposal facilities and other interacting sources of radioactive material after closure.
SRS performs a comprehensive annual PA review for disposal facilities. This review ensures any developing information does not alter the original PA conclusions and that there is a reasonable expectation the facility will continue to meet the performance objectives of the DOE Order. In addition, SRS performs an annual CA review to evaluate the adequacy of the 2010 SRS CA and verify that SRS conducted activities within the bounds of the 2010 analysis. The FY 2019 annual reviews for the E-Area Solid Waste

Compliance Summary
3-10 Savannah River Site
3-10 Savannah River Site
Management Facility, the Saltstone Disposal Facility, and the SRS CA determined that SRS continues to comply with the performance objectives of DOE Order 435.1. Based on the reporting and approval cycle for the PA and CA annual reviews, there is a one-year lag in reporting this information in the SRS Annual Site Environmental Report.
TRU waste is another category of radioactive waste that SRS generates. DOE Orders define TRU waste as waste containing more than 100 nanocuries of alpha-emitting transuranic isotopes (elements with atomic numbers greater than uranium) per gram of waste with radiological half-lives greater than 20 years. At SRS, TRU waste consists of clothing, tools, rags, residues, debris, and other items contaminated with trace amounts of plutonium. SRS TRU waste is sent to the Waste Isolation Pilot Plant (WIPP), a deep geologic repository located near Carlsbad, New Mexico for permanent disposal. Many different federal and state agencies (EPA, NRC, DOE, and the State of New Mexico), along with multiple regulations, govern TRU waste management and disposal. SRS manages TRU waste under DOE Orders and federal and state hazardous waste regulations. SRS sent five TRU shipments to WIPP for disposal in 2019.
3.3.2 Resource Conservation and Recovery Act (RCRA)
RCRA establishes regulatory standards for generating, transporting, storing, treating, and disposing of solid waste, hazardous waste (such as flammable or corrosive liquids), and underground storage tanks. SRS has a RCRA hazardous waste permit, multiple solid waste permits, and multiple underground storage tank permits, as identified in Section 3.3.10.
3.3.2.1 Hazardous Waste Permit Activities
The EPA authorizes SCDHEC to regulate hazardous waste and the hazardous components of mixed waste. SCDHEC issued a RCRA hazardous waste permit to SRS.
SRS closed the Solvent Storage Tanks (SSTs) that the RCRA permit included and submitted the final certification of closure to SCDHEC in October 2019. Upon the acceptance of the closure certification, the volume associated with SRS’s RCRA permit for the SSTs will be terminated; all other volumes of the permit remain in effect. The area surrounding the SSTs will remain an Underground Radioactive Material Area (URMA) designation until final closure.
Packaging Waste for Shipment to WIPP

Compliance Summary
Environmental Report 2019 (SRNS-RP-2020-00064) 3-11
3.3.2.2 Solid Waste Permit Activities
SRS has solid waste permits for the 632-G Construction and Demolition Debris Landfill, the 288-F Industrial Solid Waste Landfill, and the Z-Area Saltstone Industrial Solid Waste Landfill (see Section 3.2.2.3). All the solid waste landfills were active in 2019, and SRS operated them in compliance with their permits. The SCDHEC quarterly landfill inspections in 2019 did not find any issues.
3.3.2.3 Underground Storage Tank Permits
Subtitle I of RCRA regulates 19 USTs containing usable petroleum products. These tanks require an annual compliance certificate from SCDHEC. The October 30, 2019 annual inspection found all tanks in compliance.
3.3.3 Federal Facility Compliance Act (FFCA)
The FFCA was signed into law in October 1992 as an amendment to the Solid Waste Disposal Act. It adds provisions to apply certain requirements and sanctions to federal facilities. SRS obtained and implemented a Site Treatment Plan (STP) Consent Order (95-22-HW, as amended) in 1995, as required by the FFCA. The consent order required annual updates to the STP. SCDHEC executed A Statement of Mutual Understanding for Cleanup Credits in October 2003, allowing SRS to earn credits for certain accelerated cleanup actions. Credits can then be applied to the STP commitment schedules. Following a revision to the STP in 2011, SRS prepared and submitted the first five-year STP update to SCDHEC in November 2016. SCDHEC finalized and approved the update in October 2018. In February 2019, SRS formally asked to go back to an annual update instead of the once-every-five-years frequency. Additionally, SRS proposed reducing the scope of update due to the decreasing quantities of waste included in the STP. SCDHEC agreed with SRS’s proposal, and SRS submitted the Site Treatment Plan, 2019 Update on November 13, 2019.
SRS and SCDHEC held STP Cleanup Credit validation meetings in February, May, August, and November. SRS earned 1,055 validated Cleanup Credits during FY 2019.
3.3.4 Toxic Substances Control Act (TSCA)
SRS complies with TSCA regulations when storing and disposing of lead, asbestos, and organic chemicals, including polychlorinated biphenyl compounds (PCBs). SRS disposes of routinely generated nonradioactive PCBs at an offsite EPA-approved disposal facility within the regulatory defined period of one year from the date of generation. SRS made two shipments of PCB waste to offsite hazardous waste facilities in 2019. SRS also generates radioactive waste contaminated with PCBs. Low-level radioactive PCB bulk product waste is
Solvent Storage Tanks, Before and After Closure

Compliance Summary
3-12 Savannah River Site
3-12 Savannah River Site
disposed of onsite. PCB waste that is contaminated with TRU requires disposal at WIPP. SRS made two shipments of PCB-containing waste to WIPP in 2019.
As required by the TSCA regulations, SRS submitted the 2019 annual report of onsite PCB disposal activities to EPA on May 11, 2020.
3.3.5 South Carolina Infectious Waste Management Regulation
SRS generates a large quantity of infectious waste registered under the SCDHEC Infectious Waste Management Program. SRS has a vendor contracted to pick up infectious waste every four weeks. In 2019, the vendor picked up 14 shipments. Once offsite, the vendor treats and disposes of the waste in accordance with the SCDHEC regulations. In 2019, SRS managed all infectious wastes in compliance with the state regulations. SCDHEC did not inspect the SRS Infectious Waste Management Program during 2019.
3.3.6 Air Quality and Protection
3.3.6.1 Clean Air Act (CAA)
EPA has delegated regulatory authority for all types of air emissions to SCDHEC. SRS is required to comply with SCDHEC Regulation 61-62, Air Pollution Control Regulations and Standards. SRS facilities currently have the following seven air permits regulating activities on the Site:
• Part 70 Air Quality Permit (TV-0080-0041) • 784-7A Biomass Boiler Construction Permit (TV-0080-0041a-CG-R1) • 784-7A Oil Boiler Construction Permit (TV-0080-0041a-CF-R1) • Building 235-F D&D Construction Permit (TV-0080-0041-C1) • N-Area Lead Melters Construction Permit (TV-0080-0041-C2) • Saltstone Baghouse CD-B 0017 Construction Permit (TV-0080-0041-C3) • Ameresco Federal Solutions, Inc. (“Ameresco”) Biomass Facilities Permit (TV-0080-0144)
Under the CAA, SRS is considered a “major source” of nonradiological air emissions and, therefore, falls under the CAA Part 70 Operating Permit Program. The Part 70 Operating Permit regulates stationary sources with the potential to emit five tons or more per year of any criteria pollutant (six of the most common air pollutants: ozone precursors, particulate matter, carbon monoxide, nitrogen oxides, sulfur dioxide, and lead). These major stationary sources are subject to operating and emission limits, as well as emissions monitoring and record-keeping requirements.
The EPA sets the National Ambient Air Quality Standards air pollution control standards, and SCDHEC regulates them. The Air Quality Permit requires SRS to demonstrate compliance through air dispersion modeling and by submitting an emissions inventory of air pollutant emissions every three years.
The current CAA Air Quality Permit (TV-0080-0041) expired on March 31, 2008. SRS submitted a complete renewal application of the current permit prior to the expiration date. SCDHEC granted an application shield, effective on September 21, 2007, allowing the Site to continue operating under the expired permit. In 2019, the Site continued to operate under the expired Part 70 Air Quality Permit.

Compliance Summary
Environmental Report 2019 (SRNS-RP-2020-00064) 3-13
3.3.6.2 Accidental Release Prevention Program
The CAA Amendments of 1990, Section 112(r) requires any facility that maintains specific hazardous or extremely hazardous chemicals in quantities above specified threshold values to develop a risk management plan. SRS has maintained hazardous and extremely hazardous chemical inventories below each threshold value; therefore, the CAA does not require SRS to develop a risk management plan. Additionally, no reportable 112(r)-related hazardous or extremely hazardous chemical releases occurred at SRS in 2019.
3.3.6.3 Ozone-Depleting Substances
Section 608 of the CAA prohibits the knowing release of refrigerant during maintenance, service, repair, or disposal of air-conditioning and refrigeration equipment. Refrigerants include ozone-depleting substances and substitute refrigerants such as hydrofluorocarbons. Releases of chemical gases widely used as refrigerants, insulating foams, solvents, and fire extinguishers cause ozone depletion or contribute to greenhouse gas emissions. SRS complies with 40 CFR Part 82 in 2019 to ensure it did not knowingly or willfully release refrigerants into the atmosphere.
3.3.6.4 Air Emissions Inventory
SCDHEC Regulation 61-62.1, Section III (Emissions Inventory), requires SRS to compile an air emissions inventory in order to locate all sources of air pollution and to define and characterize the various types and amounts of pollutants.
The schedule for submitting the inventory is either every year or every three years, depending upon the emission thresholds in the regulations. SRS emissions have dropped below the threshold that requires an annual air emissions inventory; therefore, SRS reports on a three-year cycle rather than annually for permit TV-0080-0041. SRS was not required to submit an air emissions inventory for 2019, and will submit the next required inventory for 2020 before March 31, 2021.
3.3.6.5 National Emission Standard for Hazardous Air Pollutants (NESHAP)
NESHAP is a CAA-implementing program that sets air quality standards for hazardous air pollutants, such as radionuclides, benzene, Reciprocating Internal Combustion Engines (RICE) emissions, and asbestos.
3.3.6.5.1 NESHAP Radionuclide Program
SRS complies with the NESHAP Radionuclide Program by performing all required inspections and maintaining monitoring systems. Additionally, Subpart H of the NESHAP regulations requires SRS to determine and report annually (by June 30) the highest effective radiological dose from airborne emissions to any member of the public at an offsite point. SRS transmitted the SRS Radionuclide Air Emissions Annual Report for 2019 on June 18, 2020 to EPA, SCDHEC, and DOE Headquarters.
During 2019, SRS estimated the maximally exposed individual effective dose equivalent to be less than 1% of the EPA standard of 10 millirem (mrem) per year. Chapter 6, Radiological Dose Assessment, contains details on this dose calculation.

Compliance Summary
3-14 Savannah River Site
3-14 Savannah River Site
3.3.6.5.2 NESHAP Nonradionuclide Program
In 2013, New Source Performance Standards (NSPS) under NESHAP were added (or became effective) for RICE equipment such as portable generators, emergency generators, and compressors. In 2019, SRS continued to operate in compliance with NSPS and NESHAP standards.
3.3.6.5.3 NESHAP Asbestos Abatement Program
Work involving asbestos at SRS falls under SCDHEC and federal regulations. These activities—operation and maintenance repairs, removing asbestos, and demolishing buildings—require an asbestos notification, a renovation permit, or a demolition permit.
SRS issued 281 asbestos notifications and conducted five permitted renovations and demolitions involving asbestos in 2019. Table 3-1 summarizes these removals. Certified personnel removed and disposed of friable (easily crumbled or pulverized) and nonfriable asbestos. Both disposal sites for nonradiological asbestos waste are SCDHEC-approved landfills for disposing of regulated and nonregulated asbestos.
SRS maintains a SCDHEC Temporary Storage Containment Area License that facilitates removing and disposing of waste generated from nonradiological operations and maintenance and minor and small projects. Additionally, SRS maintains a SCDHEC Asbestos Group License that allows Savannah River Nuclear Solutions, LLC (SRNS) and Savannah River Remediation LLC (SRR) to operate as long-term, in-house asbestos abatement contractors for DOE-Savannah River.
Table 3-1 Summary of Quantities of Asbestos Materials Removed in 2019
Asbestos Type Nonradiological, Friable
Nonradiological, Nonfriable
Radiologically Contaminated Asbestos
Linear Feet Disposed 113 459 50
Square Feet Disposed 292 12,406 18
Cubic Feet Disposed 0 53 0
Disposal Site Three Rivers Solid Waste Authority
Landfill
SRS Construction and Demolition Landfill
SRS E-Area Low-Level Waste Facility
3.3.7 Water Quality and Protection
3.3.7.1 Clean Water Act (CWA)
Except for Ameresco, which has its own CWA National Pollutant Discharge Elimination System (NPDES) permit, SRS operated pursuant to the following CWA permits in 2019:
• Land Application Permit (ND0072125) • General Permit for Stormwater Discharges Associated with Industrial Activities (Except
Construction) (SCR000000) • Permit for Discharge to Surface Waters (SC0000175) • Permit for Discharge to Surface Waters (SC0047431) • General Permit for Stormwater Discharges from Construction Activities (SCR100000)
Compliance Summary
Environmental Report 2019 (SRNS-RP-2020-00064) 3-15
• General Permit for Utility Water Discharges (SCG250000) • General Permit for Discharges from Application of Pesticides (SCG160000) • General Permit for Vehicle Wash Water Discharges (SCG750000) • General Permit for Land Disturbing Activities at SRS
Information on these permits is available at the EPA’s Enforcement and Compliance History Online (ECHO) database.
3.3.7.1.1 National Pollutant Discharge Elimination System (NPDES)
SCDHEC administers the NPDES program, which protects surface waters by limiting releases of pollutants into streams, reservoirs, and wetlands. As explained in the previous section, SCDHEC issued multiple NPDES permits to SRS to govern different types of discharges to surface water. A major goal of the NPDES program is to control or eliminate discharges of toxic pollutants, oil, hazardous substances, sediment, and contaminated stormwater to protect the quality of our nation’s water. To achieve this goal, SCDHEC requires SRS to prepare the following plans:
• Best Management Practices Plan to identify and control the discharge of hazardous and toxic substances;
• Stormwater Pollution Prevention Plan (SWPPP) to address the potential discharge of pollutants in stormwater;
• Spill Prevention, Control, and Countermeasures Plan to minimize the potential for discharges of oil, including petroleum, fuel oil, sludge, and oily wastewater.
SRS has two NPDES permits for industrial activities that discharge to surface water: one covering D Area (Permit No. SC0047431) and the other for the remainder of the Site (Permit No. SC0000175). Throughout the year, SRS monitors 28 NPDES-permitted industrial wastewater outfalls across the Site on a frequency the permits specify. Monitoring requirements vary from as much as once a day at some locations to once a quarter at others, although typically they are conducted once a month. For each outfall, SRS measures physical, chemical, and biological parameters and reports them to SCDHEC in SRS monthly discharge monitoring reports, as required by the permits. Chapter 4, Nonradiological Environmental Program, provides additional information about sampling NPDES permits require of SRS to remain compliant.
The following are highlights of the NPDES program at SRS:
• SCDHEC did not conduct any NPDES compliance evaluation inspections in 2019. • The 2019 update to the SRS SWPPP contains information on the 39 SRS industrial stormwater
outfalls and outfall facilities. • SCDHEC did not require construction stormwater monitoring on any of the active construction
projects underway at SRS during 2019. • SRS undertakes construction, operating, and closure permitting of industrial wastewater treatment
facilities pursuant to the CWA and the South Carolina Pollution Control Act. Facilities permitted are broad in scope and include those involved with groundwater remediation, radioactive liquid waste processing, and nuclear nonproliferation. In 2019, SCDHEC issued an Approval to Place Into Operation for the following projects: 1) Salt Waste Processing Facility East & West Transfer Lines Tie-In, 2) Salt Waste Processing Facility, 3) Salt Waste Processing Facility Next Generation Solvent

Compliance Summary
3-16 Savannah River Site
3-16 Savannah River Site
Cold Chemical Feed Facility, and 4) Actinide Removal Process/Modular Caustic Side Solvent Extraction Suspended Operations Mode. In addition, SCDHEC issued a construction permit for an additional recovery well for the M-1 Air Stripper remediation system. SCDHEC also approved closing two permits related to the D-Area ash basins and the F-Area Neutralization System.
• In November 2019, SRS received an NOV for failing to comply with the reporting requirement of the NPDES Permit. The Site violated the monitoring and reporting requirements of the NPDES Industrial Wastewater Discharge Permit by exceeding a hold time for a sample analysis. On August 7, 2019, SRS discovered that two H-16 Outfall NPDES samples collected during the first two weeks of July were not analyzed for mercury (Hg) within the 28-day sample hold-time specified by the EPA laboratory method in place to analyze samples. SRS’s Environmental Compliance notified SCDHEC verbally and through normal routine reporting, via the Discharge Monitoring Report of industrial discharges. A fact-finding meeting identified corrective actions to improve procedures. These improvements are underway.
Chapter 4 of this report summarizes the sampling results of both industrial and stormwater outfalls.
3.3.7.1.2 Section 404(e) Dredge and Fill Permits
Wetlands make up 25% of the total SRS area, or 48,973 acres. SRS wetlands account for more than 80% of the wetlands across the entire DOE complex nationwide. The Clean Water Act, under Section 404, requires SRS to obtain a permit when it will conduct work in a wetland area. The U.S. Army Corps of Engineers authorizes development in wetlands through a Nationwide Permit (NWP) program. The program is for projects that have minimal impact on the aquatic environment.
SRS wetlands staff reviewed 91 site-use applications for potential wetland impacts and helped review pertinent Environmental Evaluation Checklists (EECs) in 2019. During this time, SRS conducted the following actions under the NWP program:
• Constructed the Mixed Waste Management Facility phytoremediation pond on an intermittent tributary to Four Mile Branch, authorized by the U.S. Army Corps of Engineers under NWP 38, Cleanup of Hazardous and Toxic Waste
• Replaced a culvert on Road 15-32 under NWP 3, Maintenance
• Removed Environmental Sampling Structure 606-2G under NWP 5, Scientific Measurement Devices
• Improved pedestrian access at Environmental Sampling Station PB-3 under NWP 5
• Installed Well CRW-028C in wetlands adjacent to a Castor Creek tributary under NWP 5
• Improved pedestrian access by installing rock at the H Base Injection Project under NWP 5
3.3.7.2 Safe Drinking Water Act (SDWA)
SCDHEC regulates drinking water facilities under the SDWA. SRS uses groundwater sources to supply drinking water to onsite facilities. The A-Area drinking water system supplies most Site areas. Remote facilities, such as field laboratories, barricades, and pump houses, use small drinking water systems or bottled water. All 2019 bacteriological samples for drinking water that SRS collected met state and federal drinking water quality standards.
Compliance Summary
Environmental Report 2019 (SRNS-RP-2020-00064) 3-17
SCDHEC requires SRS to collect 10 bacteriological samples each month from the domestic water system that supplies drinking water to most areas at SRS. SRS usually exceeds this requirement by collecting 15 samples each month from various areas. All samples have bacteriological analyses. The sample results consistently meet SCDHEC and EPA drinking water quality standards, confirming the absence of harmful bacteria.
In 2019, SRS sampled for lead and copper at 30 locations across the Site. The results of this sampling event met all state and federal drinking water standards. SRS samples domestic water systems for lead and copper on a three-year, rotating cycle. Based on this cycle, SRS will sample 30 locations across the Site for lead and copper in 2022.
SCHDEC conducted an inspection of the A-Area drinking water system in 2019 and gave it its highest rating of “satisfactory.” SCDHEC generally inspects systems of this classification every two years. SRS expects the next inspection in 2021.
3.3.7.3 Groundwater Management
The South Carolina Groundwater Use and Reporting Act declares that the groundwater resources of the State be put to beneficial use and requires that a Groundwater Management Plan be developed for each capacity use area. The act requires that a groundwater withdrawal permit be in place to withdraw or use groundwater equal to or greater than 3 million gallons in any month in these areas. On November 8, 2018, the SCDHEC Board approved the Western Capacity Use Area. SRS is situated within the Western Capacity Use Area; therefore, SRS pursued and received groundwater withdrawal permits from the SCDHEC Bureau of Water for groundwater systems located in D Area and A Area.
3.3.8 Environmental Protection and Resource Management
3.3.8.1 National Environmental Policy Act (NEPA)
The NEPA process identifies the potential environmental consequences of proposed federal activities and the alternatives that support informed environmentally sound decision-making regarding designing and implementing the proposed activities.
The NEPA program complies with 10 CFR Part 1021, National Environmental Policy Act Implementing Procedures. SRS initiates the required NEPA evaluation by completing an EEC for new projects or changes to existing projects. SRS uses the EEC to review the proposed action, identify any potential environmental concerns, and determine the appropriate level of NEPA review required for the proposed activity.
SRS conducted 836 NEPA reviews of proposed activities in 2019 (Table 3-2). Categorical exclusion determinations accounted for approximately 90% of completed reviews. Additional information on SRS NEPA activities may be found on the SRS NEPA web page.
The following major NEPA reviews were either completed or in progress in 2019:
• Supplement Analysis of the Final Long-Term Management and Storage of Elemental Mercury Environmental Impact Statement (DOE/EIS-0423-SA-01) and Record of Decision ([ROD], 84 Federal Register [FR] 66890). In January 2011, DOE issued the Final Long-Term Management and Storage of Elemental Mercury Environmental Impact Statement (Mercury Storage EIS) (DOE/EIS-0423). SRS was one of seven candidate locations (not the Preferred Alternative) that DOE evaluated for
Compliance Summary
3-18 Savannah River Site
3-18 Savannah River Site
elemental mercury storage. In 2013, DOE issued the Final Long-Term Management and Storage of Elemental Mercury Supplemental Environmental Impact Statement (DOE/EIS-0423-S1), which analyzed three additional locations for a long-term elemental mercury storage facility(facilities), all of which are in the vicinity of the Waste Isolation Pilot Plant (WIPP) near Carlsbad, New Mexico, and updated the occupational and public health and safety impact analysis and socioeconomics and environmental justice analyses. In June 2019, DOE prepared a Supplement Analysis (SA) that evaluated changes in environmental conditions at the Waste Control Specialists (WCS) facility in Andrews, Texas. DOE did not evaluate SRS in the SA. In December 2019, DOE issued a ROD identifying WCS as the selected location for elemental mercury storage. At this time, DOE is no longer considering SRS as an alternative location.
• Supplement Analysis for the Foreign Research Reactor Spent Nuclear Fuel Acceptance Program (DOE/EIS-0218-SA-8). In April 2019, DOE/National Nuclear Security Administration (NNSA) issued a SA to evaluate the extension of the Foreign Research Reactor Spent Nuclear Fuel (FRR SNF) Acceptance Program through May 12, 2029, and implementation of the Policy on Exemptions to the FRR SNF Acceptance Program. DOE/NNSA concluded that the impacts of the proposed action would be within the range of impacts analyzed in the FRR SNF EIS (DOE/EIS-0218). SRS is one of the three sites previously evaluated for the receipt and transfer/storage of FRR SNF. The majority of the FRR SNF that is the subject of the SA would be shipped to SRS. Receipt and storage operations and practices would not change as a result of implementing the Policy on Exemptions, and the quantity of material received and stored at SRS would be less than that analyzed in the FRR SNF EIS.
• Supplemental Notice Concerning U.S. Department of Energy Interpretation of High-Level Radioactive Waste (84 FR 26835). On June 5, 2019, DOE issued the Supplemental Notice Concerning U.S. Department of Energy Interpretation of High-Level Radioactive Waste. DOE is initiating a NEPA process separately to study potential environmental impacts associated with implementing the interpretation to dispose of certain waste from SRS at a commercial disposal facility located outside South Carolina and licensed by either the Nuclear Regulatory Commission (NRC) or an Agreement State under 10 CFR Part 61 to receive low-level radioactive waste. If, in the future, DOE proposes an additional action to which NEPA would apply, such as implementation of this interpretation with respect to other specific wastes, DOE will likewise analyze such a proposal pursuant to NEPA.
• Draft Environmental Assessment for the Commercial Disposal of Defense Waste Processing Facility Recycle Wastewater from the Savannah River Site; Aiken and Barnwell Counties, South Carolina (DOE/EA-2115). On December 10, 2019, DOE published a Notice of Availability ([NOA], 84 FR 67438) for the Draft Environmental Assessment. DOE is evaluating disposing of up to 10,000 gallons of stabilized (grouted) Defense Waste Processing Facility (DWPF) recycle wastewater from SRS at a commercial low-level radioactive waste (LLW) disposal facility located outside of South Carolina, licensed by either the NRC or an Agreement State under NRC’s regulations regarding licensing requirements for land disposal of radioactive waste. The DWPF recycle wastewater would be treated, characterized, and if the performance objectives and waste acceptance criteria of a specific disposal facility are met, DOE could consider whether to dispose of the waste as LLW
Compliance Summary
Environmental Report 2019 (SRNS-RP-2020-00064) 3-19
under DOE’s high-level radioactive (HLW) interpretation. The HLW interpretation does not change or revise any current policies or other legal requirements with respect to HLW. As a result of this NEPA process, DOE may consider actions, if any, are necessary and appropriate to implement any decision to dispose of the DWPF recycle wastewater as LLW. DOE extended the public comment period from the original due date of January 9, 2020 to February 10, 2020, in response to reviewers’ requests.
• Draft Supplement Analysis of the Complex Transformation Supplemental Programmatic Environmental Impact Statement (DOE/EIS-0236-S4-SA-02). On June 28, 2019, DOE/NNSA issued an NOA for a Draft SA regarding the production of plutonium pits. NNSA prepared the SA to determine if the Final Complex Transformation Supplemental Programmatic EIS (DOE/EIS-0236-S4) should be supplemented, a new EIS should be prepared, or if no further NEPA analysis is required. NNSA is proposing to produce a minimum of 50 pits per year at a repurposed Mixed-Oxide Fuel Fabrication Facility at SRS and a minimum of 30 pits per year at Los Alamos National Laboratory, with additional surge capacity at each site, if needed, to meet the requirements of producing pits at a rate of no fewer than 80 pits per year by 2030. The Draft SA preliminarily concluded that further NEPA documentation at a programmatic level is not required. NNSA committed to preparing a site-specific analysis prior to initiating pit production at SRS.
• Notice of Intent to Prepare an Environmental Impact Statement for Plutonium Pit Production at the Savannah River Site (84 FR 26849; DOE/EIS-0541). On June 10, 2019, DOE/NNSA announced its intent to prepare an EIS to evaluate the potential environmental impacts of alternatives for plutonium pit production at SRS. On June 27, 2019, NNSA held a public scoping meeting inviting the public to submit comments until July 25, 2019, to assist in identifying environmental issues and in determining the appropriate scope of the SRS EIS. Input from the scoping meeting will assist NNSA in formulating the proposed action, refining the alternatives, and defining the scope of EIS analysis. Following the scoping period and, after consideration of comments received during the scoping, NNSA will prepare a Draft EIS. NNSA will announce the availability of the draft in the Federal Register and local media outlets. Comments received on the Draft EIS will be considered and addressed in the Final EIS. NNSA will issue a ROD no sooner than 30 days after the EPA publishes an NOA of the Final EIS.
• Notice of Intent to Prepare an Environmental Impact Statement for a Versatile Test Reactor (84 FR 38021; DOE/EIS-0254). On August 5, 2019, the DOE Office of Nuclear Energy announced its intent to prepare an EIS to evaluate potential environmental impacts of alternatives for a versatile reactor-based fast neutron source facility and associated facilities for the preparation, irradiation, and postirradiation examination of test and experimental fuels and materials. SRS will be evaluated as an alternative support facility to be used for the fabrication of the driver fuel for the test reactor.
• Notice of Intent to Prepare an Environmental Impact Statement for the Disposal of Decommissioned, Defueled Ex-Enterprise (CVN 65) and Its Associated Naval Reactor Plants (84 FR 25243; EIS-0254). On May 31, 2019, the Department of Navy, with DOE as a cooperating agency, announced its intent to prepare an Environmental Impact Statement/Overseas Environmental

Compliance Summary
3-20 Savannah River Site
3-20 Savannah River Site
Impact Statement (EIS/OEIS) to evaluate potential environmental impacts of alternatives for disposal of the decommissioned, defueled ex-Enterprise (CVN 65) aircraft carrier, including its reactor plants. SRS will be evaluated as an alternative for a disposal facility for low-level radioactive waste packages of disassembled reactor plants.
The Environmental Assessment for the South Carolina Army National Guard Proposal to Construct and Operate Training Facilities and Infrastructure on 750 Acres at the Department of Energy Savannah River Site (DOE/EA-1999) is in progress and is not counted in the Table 3-2 total.
Table 3-2 Summary of 2019 NEPA Reviews
3.3.8.2 Emergency Planning and Community Right-to-Know (EPCRA)/Superfund Amendment Reauthorization Act (SARA) Title III
EPCRA requires facilities to notify state and local emergency planning entities about their hazardous chemical inventories and to report releases of hazardous chemicals. The Pollution Prevention Act of 1990 expanded the EPCRA-mandated Toxic Release Inventory (TRI) report to include waste management. SRS complies with the applicable EPCRA reporting requirements and incorporates the applicable TRI chemicals into its pollution prevention programs.
As required by Section 312, Chemical Inventory Reporting of EPCRA, SRS completes an annual Tier II Chemical Inventory Report for all hazardous chemicals exceeding specified quantities present at SRS during the calendar year. SRS submitted the 2019 hazardous chemical storage information to state and local authorities on February 14, 2020. The report included 60 reportable chemical categories, the same as the previous year.
As required by Section 313, Toxic Chemical Release Inventory, of EPCRA, SRS must file an annual TRI report each year by July 1 for the previous year. SRS calculates chemical releases to the environment for each regulated chemical and reports those above each threshold value to EPA. SRS submitted the 2019 TRI report on June 25, 2020 for each of the following regulated chemicals: ammonia, chromium compounds, lead compounds, mercury compounds, naphthalene, nitrate compounds, nitric acid, and sodium nitrite. Details are on the EPA Toxic Release Inventory Program website.
Type of National Environmental Policy Act (NEPA) Review Number
Categorical Exclusion Determinationsa 755
“All No” Environmental Evaluation Checklist (EEC) Determinationsa 59
Previous NEPA Reviewa 20
Environmental Impact Statement (EIS) 0
Supplement Analysis (SA) 1
Interim Action 0
Revised Finding of No Significant Impact 0
Environmental Assessment 1
Total 836 a Proposed action that requires no further NEPA action

Compliance Summary
Environmental Report 2019 (SRNS-RP-2020-00064) 3-21
3.3.8.3 Federal Insecticide, Fungicide, and Rodenticide Act (FIFRA)
The objective of FIFRA is to provide federal control of pesticide distribution, sale, and use. The EPA must register all pesticides used in the United States. Use of each registered pesticide must be consistent with use directions contained on the package’s label. SRS must comply with FIFRA and, on a state level, the South Carolina Pesticide Control Act.
SRS must also comply with the South Carolina NPDES General Permit for discharges from the application of pesticides. This permit authorizes applying pesticides to surface water according to limitations set forth in the NPDES general permit.
SRS procedures implement the FIFRA requirements for pesticide application, application recordkeeping, storage, and disposing of empty containers and excess pesticides. General-use pesticides (ready-to-use products that are available for public use) are applied at SRS per the label instructions. SRS applies restricted-use pesticides on a very limited basis, following label requirements and using state-certified pesticide applicators. SRS generates and maintains application records for general use and restricted use pesticides for each application.
3.3.8.4 Endangered Species Act (ESA)
The ESA designates and protects wildlife, fish, and plants in danger of becoming extinct. This federal law also protects and conserves their critical habitats. Several federally listed animal species exist at SRS, including the wood stork, the red-cockaded woodpecker, the shortnose sturgeon, and the Atlantic sturgeon, as well as plant species, including the pondberry and the smooth coneflower.
In addition, SRS is home to the gopher tortoise, a candidate for protection under the ESA. SRS is the only DOE site to conduct experimental translocations of gopher tortoises, where they are captured, transported, and released to another location. Conservation organizations use protocols developed during these SRS translocation studies to establish viable populations elsewhere in the species’ range.
South Carolina’s State Wildlife Action Plan of 2015 recognizes additional plants and animals not on the federal list to encourage conservation of these species. Those found on SRS include the Carolina gopher frog and the southern hognose, as well as numerous other animals and plants considered species of conservation concern. The United States Forest Service-Savannah River (USFS-SR) considers these species sensitive and takes that into consideration when developing forest management plans. While the bald eagle is no longer on the federally listed endangered or threatened species list, the Bald and Golden Eagle Protection Act protects nesting bald eagles and wintering golden eagles. Bald eagles nest on SRS and are considered year-round residents; golden eagles use SRS as a wintering habitat. The 2019 mid-winter bald eagle survey reported eight bald eagles and four golden eagles on SRS.
The USFS-SR actively manages more than 65,000 acres in the red-cockaded woodpecker habitat management areas by using prescribed fire or by mechanical or chemical treatments to control vegetation. These methods create and improve habitat by restoring the natural fire regime, improving native plant diversity in the understory, and enhancing the native longleaf pine and wiregrass communities. Additionally, the USFS-SR inserts artificial cavities into living pine trees to supplement the available cavities for roosting and nesting. From 1985 through FY 2019, active red-cockaded woodpecker clusters increased from 3 to 152 due to successful habitat restoration. As of 2019, the USFS-SR managed 152 cluster sites for the red-cockaded woodpecker, with an average expected population growth rate of 5% each year. The

Compliance Summary
3-22 Savannah River Site
3-22 Savannah River Site
growth rate over the past five years at SRS has been an outstanding average of 12%. In addition to managing endangered wildlife species, the USFS-SR actively manages six endangered plant populations: four smooth coneflower and two pondberry.
During FY 2019, while implementing the United States Department of Energy Natural Resources Management Plan for SRS, USFS-SR developed one SRS watershed management plan for standard USFS-SR project plans, resulting in one biological evaluation for timber, research, and wildlife-related management. The biological evaluation determined that forest implementation plans are not likely to adversely affect federally listed endangered or threatened species due to beneficial, insignificant, or discountable effects.
3.3.8.5 Migratory Bird Treaty Act (MBTA)
The MBTA prohibits taking, possessing, importing, exporting, transporting, selling, purchasing, bartering, or offering for sale any migratory bird or its eggs, parts, and nests, except as authorized by the U.S. Department of the Interior under a valid permit. To support migratory bird monitoring, a one-day Christmas Bird Count is conducted annually in December. The 2019 count found 98 species. A one-day bald eagle survey is conducted every year in January. The 2019 bald eagle survey found eight eagles.
In 2019, SRS conducted walkdowns of 66 bird nests at 43 locations for MBTA compliance. The walkdowns identified 38 active nests with incubating eggs or chicks and 28 nests without eggs or chicks. The active nests were being used by Northern mockingbirds (Mimus polyglottos), Eastern bluebirds (Sialia sialis), barn swallows (Hirundo rustica), house finches (Haemorhous mexicanus), killdeers (Charadrius vociferous), common grackles (Quiscalus quiscula), black vultures (Coragyps atratus), and purple martins (Progne subis).
SRNS allowed active nests to complete the nesting cycle and barricaded them when deemed appropriate, with two exceptions. SRNS removed an active common grackle nest from a crane at F-Tank Farm in an active radiological work area executed by Savannah River Remediation under permit authorization from the U.S. Fish and Wildlife Service. SRNS also successfully relocated an active purple martin nest located in an aviation marker globe on an electrical line in the K-Area Criticality Control Overpack Pad Project work area.
Also in 2019, USFS-SR found an osprey (Pandion haliaetus) nest on a platform staff built in 2014. This marked the fifth year that ospreys nested on the platform after their nest had been moved from a power pole at the L-Lake Dam.
3.3.8.6 Invasive Species Management
The purpose of Executive Order 13751, Safeguarding the Nation from the Impacts of Invasive Species, is to prevent the introduction and spread of invasive species, and to support efforts to eradicate and control established invasive species. The Site is surveying invasive plant and animal species and taking steps to control their populations.
Purple Martin in Flight

Compliance Summary
Environmental Report 2019 (SRNS-RP-2020-00064) 3-23
Many of the former home and community sites that area residents left nearly 70 years ago to allow for the government to construct the Savannah River Site have since become primary sources of non-native invasive plant species (NNIPS). Escaping cultivation and containment for decades, aggressive plant species such as Chinese privet, (Ligustrum sinensis), wisteria (Wisteria sinensis), chinaberry (Melia azedarach), and kudzu (Pueraria montana) now threaten native species onsite. Invasive species such as these are a major threat to National Forests in the 21st century. NNIPS contribute to long-term ecosystem degradation due to the loss of diversity and their direct competition with native species. They also provide unwanted ladder fuels that can increase fire intensity during prescribed burning or wildfire.
Prior to 2012, there had been no sitewide effort to document NNIPS as part of the watershed prescription process. However, recently conducted plant surveys include recording observations and locations for NNIPS. This information is now being captured geospatially to include in compartment stand maps and geographic information system layers for management planning. Historical records and image interpretations from photos and maps, compartment folders, and stand exam data helped to identify developed openings, old home sites, and community places (churches, schools, cemeteries) that may contain robust sources of introduced NNIPS communities.
The USFS-SR annually contracts botanical surveys of 5,000 to 7,000 acres, which include 40-50 species of plants considered to be non-native and invasive. USFS-SR chemically treats an average of 57 acres each year to control across target areas that either contain former homesites and community areas or that are in proximity to red-cockaded woodpecker colony sites. When a forest stand is cut and regenerated, the USFS treats any NNIPS populations discovered as part of the site preparation for replanting.
Wild pigs are considered an invasive species in the United States and abroad. As of 2016, the U.S. Department of Agriculture estimated that in the United States alone, these animals cost $1.5 billion each year in damages and control costs. On SRS, wild pigs present safety hazards due to vehicle collisions and disease transmission, and ecological impacts by negatively affecting water quality, disturbing soil, and constantly threatening rare and endangered plant populations. The USFS-SR has two dedicated wildlife technicians who oversee two wildlife contractors who trap and remove wild pigs on SRS. In 2019, USFS-SR removed 1,410 pigs primarily through baiting and trapping. Additionally, USFS-SR and the Southern Research Station, part of the U.S. Forest Service Research and Development organization, are collaborating with the Savannah River Ecology Laboratory to research ways to control the wild pig population.
3.3.8.7 National Historic Preservation Act (NHPA)
The NHPA requires all federal agencies to consider the impacts to historic properties in all their undertakings. SRS ensures it complies with the NHPA through several processes. For example, SRS uses the Site Use Program, the Cold War Programmatic Agreement, and SRS’s Cold War Built Environment Cultural
Wisteria (Wisteria sinensis)
Compliance Summary
3-24 Savannah River Site
3-24 Savannah River Site
Resource Management Plan to ensure it is complying with NHPA. The Savannah River Archaeological Research Program (SRARP) guides DOE in managing its cultural resources to ensure it fulfills its compliance commitments. SRARP also serves as a primary organization to investigate archaeological research problems associated with cultural development within the Savannah River valley. DOE uses the results to help manage more than 2,000 known archaeological sites at SRS.
SRARP evaluates and documents all locations DOE is considering for activities, such as construction, to ensure that they do not affect archaeological or historic sites. In FY 2019, SRARP investigated 524 acres of land on SRS for cultural resource management, including conducting 22 field surveys and testing. It recorded 16 newly discovered sites and revisited 10 previously recorded sites.
3.3.9 Release Reporting
Federally permitted releases to the air, water, and land must comply with legally enforceable licenses, permits, regulations, or orders. If an unpermitted release to the environment of an amount greater than or equal to a reportable quantity of a hazardous substance (including radionuclides) occurs, EPCRA, Comprehensive Environmental Response, Compensation, and Liability Act (CERCLA), Clean Water Act (CWA), and the Clean Air Act (CAA) require SRS send a notice to the National Response Center and applicable state agencies.
SRS did not have any reportable releases in 2019.
3.3.10 Permits
SRS had 634 construction and operating permits in 2019 that specified operating levels to each permitted source. Table 3-3 identifies the number of permits by the permit type.
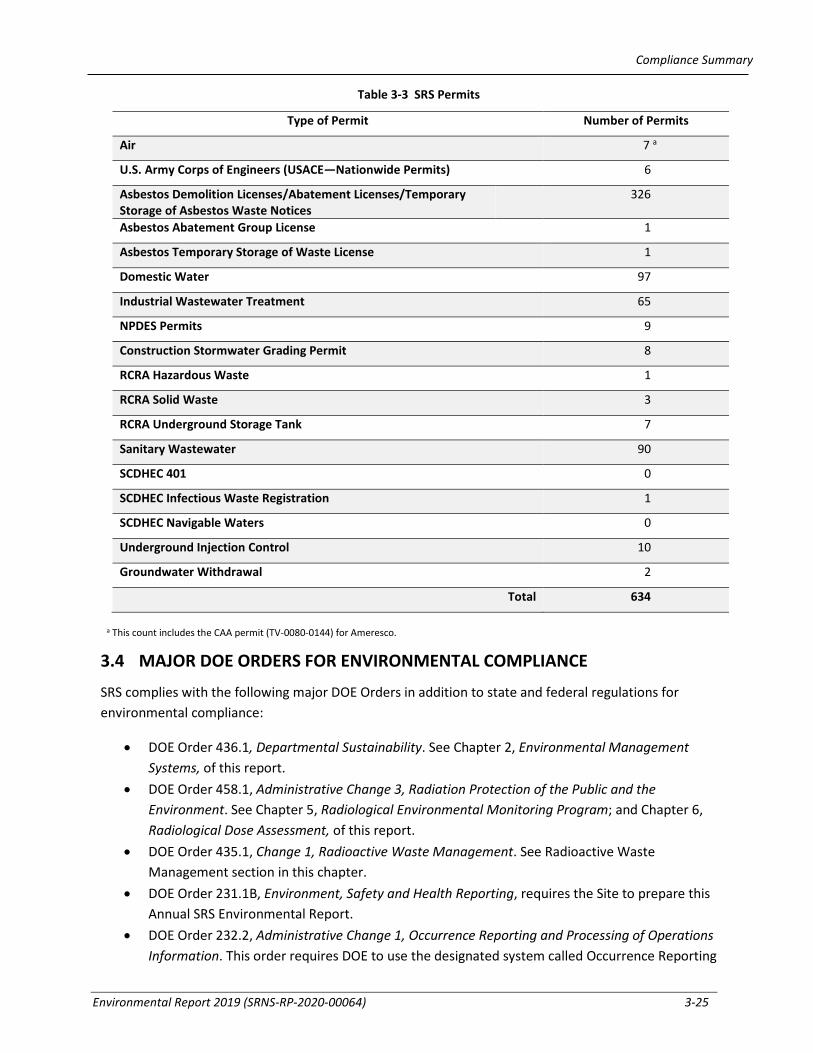
Compliance Summary
Environmental Report 2019 (SRNS-RP-2020-00064) 3-25
Table 3-3 SRS Permits
a This count includes the CAA permit (TV-0080-0144) for Ameresco.
3.4 MAJOR DOE ORDERS FOR ENVIRONMENTAL COMPLIANCE
SRS complies with the following major DOE Orders in addition to state and federal regulations for environmental compliance:
• DOE Order 436.1, Departmental Sustainability. See Chapter 2, Environmental Management Systems, of this report.
• DOE Order 458.1, Administrative Change 3, Radiation Protection of the Public and the Environment. See Chapter 5, Radiological Environmental Monitoring Program; and Chapter 6, Radiological Dose Assessment, of this report.
• DOE Order 435.1, Change 1, Radioactive Waste Management. See Radioactive Waste Management section in this chapter.
• DOE Order 231.1B, Environment, Safety and Health Reporting, requires the Site to prepare this Annual SRS Environmental Report.
• DOE Order 232.2, Administrative Change 1, Occurrence Reporting and Processing of Operations Information. This order requires DOE to use the designated system called Occurrence Reporting
Type of Permit Number of Permits
Air 7 a
U.S. Army Corps of Engineers (USACE—Nationwide Permits) 6
Asbestos Demolition Licenses/Abatement Licenses/Temporary Storage of Asbestos Waste Notices
326
Asbestos Abatement Group License 1
Asbestos Temporary Storage of Waste License 1
Domestic Water 97
Industrial Wastewater Treatment 65
NPDES Permits 9
Construction Stormwater Grading Permit 8
RCRA Hazardous Waste 1
RCRA Solid Waste 3
RCRA Underground Storage Tank 7
Sanitary Wastewater 90
SCDHEC 401 0
SCDHEC Infectious Waste Registration 1
SCDHEC Navigable Waters 0
Underground Injection Control 10
Groundwater Withdrawal 2
Total 634

Compliance Summary
3-26 Savannah River Site
3-26 Savannah River Site
and Processing System (ORPS). The ORPS ensures that the DOE complex and the NNSA are informed of events that could adversely affect the health and safety of the public and workers, the environment, DOE missions, or DOE’s credibility.
• DOE Order 226.1B, Implementation of Department of Energy Oversight Policy. This order requires DOE to provide oversight related to protecting the public, workers, environment, and national security assets effectively through continuous improvement.
3.5 REGULATORY SELF-DISCLOSURES
SRS made no regulatory self-disclosures in 2019.
3.6 ENVIRONMENTAL AUDITS
SCDHEC, EPA, the Nuclear Regulatory Commission (NRC), and the United States Army Corps of Engineers (USACE) inspected and audited the SRS environmental program for regulatory compliance. Table 3-4 summarizes the results of the 2019 audits and inspections.
During 2019, the SRS Independent Evaluation Board evaluated field implementation of selected Environmental Protection requirements as part of the overall field execution reviews of several facilities. Each review identified several findings and opportunities for improvement. Also during 2019, the DOE Office of Enterprise Assessment (EA-30) performed an Assessment of Radioactive Waste Management at SRS. The assessment concluded that SRS’s waste management program ensures proper characterization, packaging, and shipping of radioactive waste for disposal, and that both DOE-Environmental Management and NNSA provide adequate operational awareness of these activities.
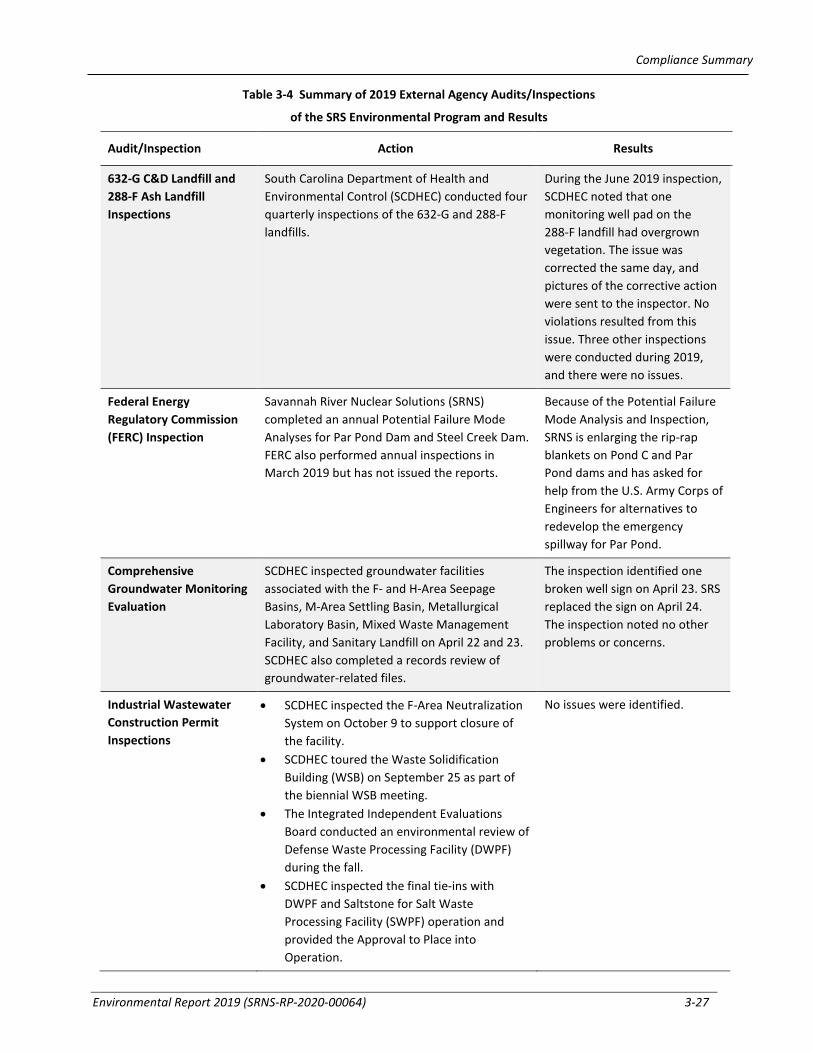
Compliance Summary
Environmental Report 2019 (SRNS-RP-2020-00064) 3-27
Table 3-4 Summary of 2019 External Agency Audits/Inspections
of the SRS Environmental Program and Results
Audit/Inspection Action Results
632-G C&D Landfill and 288-F Ash Landfill Inspections
South Carolina Department of Health and Environmental Control (SCDHEC) conducted four quarterly inspections of the 632-G and 288-F landfills.
During the June 2019 inspection, SCDHEC noted that one monitoring well pad on the 288-F landfill had overgrown vegetation. The issue was corrected the same day, and pictures of the corrective action were sent to the inspector. No violations resulted from this issue. Three other inspections were conducted during 2019, and there were no issues.
Federal Energy Regulatory Commission (FERC) Inspection
Savannah River Nuclear Solutions (SRNS) completed an annual Potential Failure Mode Analyses for Par Pond Dam and Steel Creek Dam. FERC also performed annual inspections in March 2019 but has not issued the reports.
Because of the Potential Failure Mode Analysis and Inspection, SRNS is enlarging the rip-rap blankets on Pond C and Par Pond dams and has asked for help from the U.S. Army Corps of Engineers for alternatives to redevelop the emergency spillway for Par Pond.
Comprehensive Groundwater Monitoring Evaluation
SCDHEC inspected groundwater facilities associated with the F- and H-Area Seepage Basins, M-Area Settling Basin, Metallurgical Laboratory Basin, Mixed Waste Management Facility, and Sanitary Landfill on April 22 and 23. SCDHEC also completed a records review of groundwater-related files.
The inspection identified one broken well sign on April 23. SRS replaced the sign on April 24. The inspection noted no other problems or concerns.
Industrial Wastewater Construction Permit Inspections
• SCDHEC inspected the F-Area Neutralization System on October 9 to support closure of the facility.
• SCDHEC toured the Waste Solidification Building (WSB) on September 25 as part of the biennial WSB meeting.
• The Integrated Independent Evaluations Board conducted an environmental review of Defense Waste Processing Facility (DWPF) during the fall.
• SCDHEC inspected the final tie-ins with DWPF and Saltstone for Salt Waste Processing Facility (SWPF) operation and provided the Approval to Place into Operation.
No issues were identified.

Compliance Summary
3-28 Savannah River Site
3-28 Savannah River Site
Table 3-4 Summary of 2019 External Agency Audits/Inspections
of the SRS Environmental Program and Results (continued)
Audit/Inspection Action Results
SCDHEC Sanitary Survey of SRS Drinking Water Systems
SCDHEC inspects the wells, tanks, and treatment systems supporting the A-Area drinking water system biannually.
SCDHEC conducted a Sanitary Survey of SRS A-Area Drinking Water System in 2019 and received a “Satisfactory” rating
Interim Sanitary Landfill and the F-Area Railroad Crosstie Pile Landfill Post-Closure Inspection
SCDHEC conducted an annual review of the landfills. SCDHEC identified no issues.
Air Compliance Inspection SCDHEC did not conducted an onsite inspection during 2019.
Resource Conservation and Recovery Act (RCRA) Compliance Evaluation Inspection (CEI)
SCDHEC inspected six facilities and reviewed SRS’s Hazardous Waste Program requirements (that is, RCRA notifications and reports to SCDHEC, manifests, contingency plans, training records, internal inspections, and waste documentation) during its May 22-23 CEI.
SCDHEC did not observe any deficiencies during the inspection.
Underground Storage Tank (UST) CEI
SCDHEC inspected 19 USTs on October 30 No issues were identified.
Z-Area Saltstone Solid Waste Landfill Inspections
SCDHEC performed monthly inspections of the Saltstone Disposal Facility (SDF). This included reviewing facility procedures and performing walk downs of the SDF.
No issues were noted.
National Pollutant Discharge Elimination System (NPDES) Compliance Evaluation Inspection (3560)
SCDHEC performed monthly inspections of the SDF. This included reviewing facility procedures and performing walk downs of the SDF.
No issues were noted.
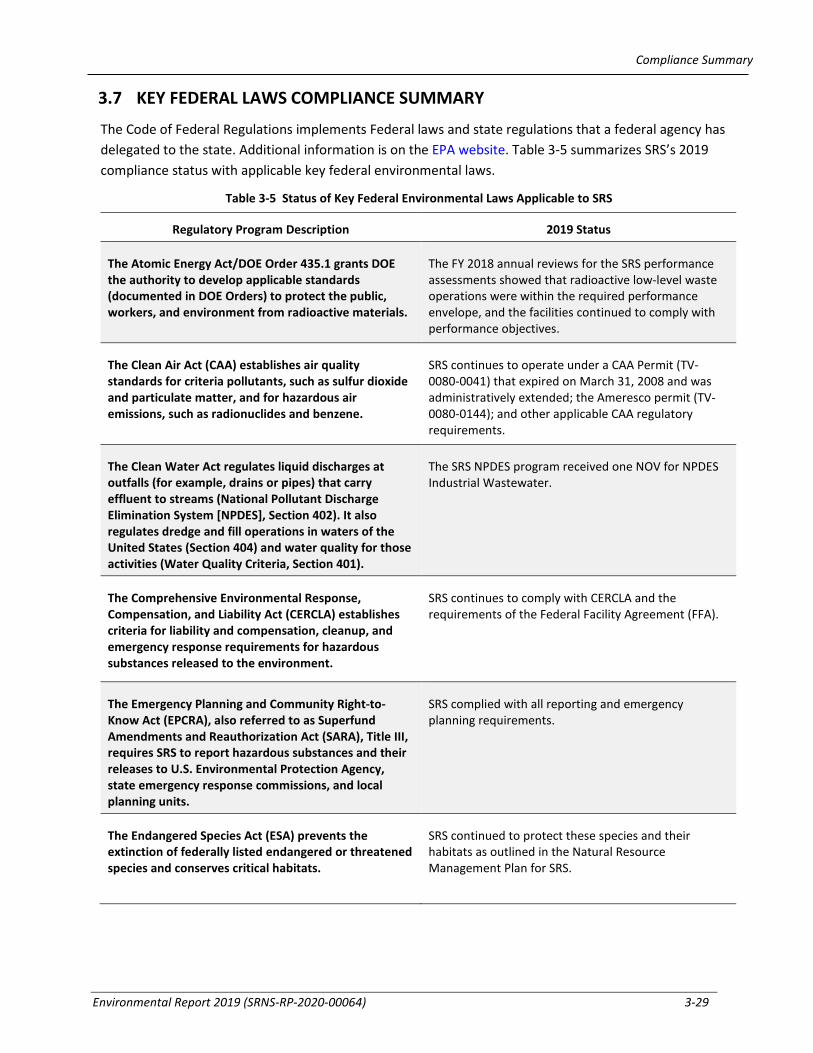
Compliance Summary
Environmental Report 2019 (SRNS-RP-2020-00064) 3-29
3.7 KEY FEDERAL LAWS COMPLIANCE SUMMARY
The Code of Federal Regulations implements Federal laws and state regulations that a federal agency has delegated to the state. Additional information is on the EPA website. Table 3-5 summarizes SRS’s 2019 compliance status with applicable key federal environmental laws.
Table 3-5 Status of Key Federal Environmental Laws Applicable to SRS
Regulatory Program Description 2019 Status
The Atomic Energy Act/DOE Order 435.1 grants DOE the authority to develop applicable standards (documented in DOE Orders) to protect the public, workers, and environment from radioactive materials.
The FY 2018 annual reviews for the SRS performance assessments showed that radioactive low-level waste operations were within the required performance envelope, and the facilities continued to comply with performance objectives.
The Clean Air Act (CAA) establishes air quality standards for criteria pollutants, such as sulfur dioxide and particulate matter, and for hazardous air emissions, such as radionuclides and benzene.
SRS continues to operate under a CAA Permit (TV-0080-0041) that expired on March 31, 2008 and was administratively extended; the Ameresco permit (TV-0080-0144); and other applicable CAA regulatory requirements.
The Clean Water Act regulates liquid discharges at outfalls (for example, drains or pipes) that carry effluent to streams (National Pollutant Discharge Elimination System [NPDES], Section 402). It also regulates dredge and fill operations in waters of the United States (Section 404) and water quality for those activities (Water Quality Criteria, Section 401).
The SRS NPDES program received one NOV for NPDES Industrial Wastewater.
The Comprehensive Environmental Response, Compensation, and Liability Act (CERCLA) establishes criteria for liability and compensation, cleanup, and emergency response requirements for hazardous substances released to the environment.
SRS continues to comply with CERCLA and the requirements of the Federal Facility Agreement (FFA).
The Emergency Planning and Community Right-to-Know Act (EPCRA), also referred to as Superfund Amendments and Reauthorization Act (SARA), Title III, requires SRS to report hazardous substances and their releases to U.S. Environmental Protection Agency, state emergency response commissions, and local planning units.
SRS complied with all reporting and emergency planning requirements.
The Endangered Species Act (ESA) prevents the extinction of federally listed endangered or threatened species and conserves critical habitats.
SRS continued to protect these species and their habitats as outlined in the Natural Resource Management Plan for SRS.
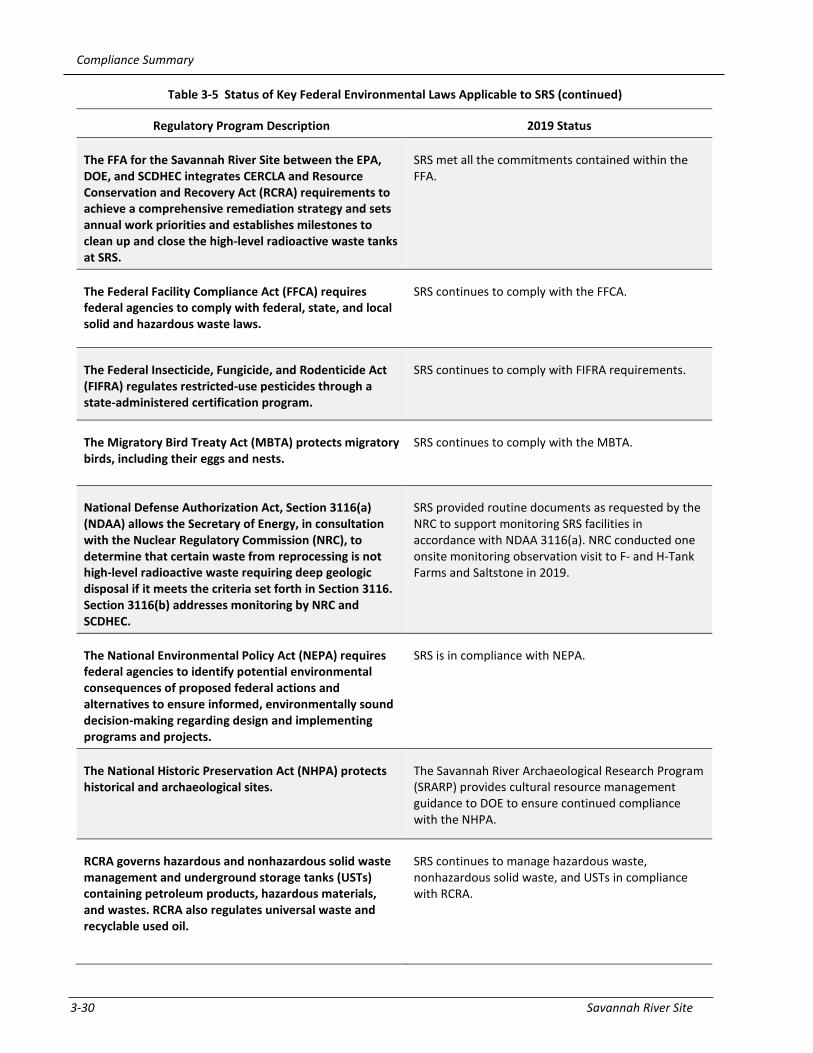
Compliance Summary
3-30 Savannah River Site
3-30 Savannah River Site
Table 3-5 Status of Key Federal Environmental Laws Applicable to SRS (continued)
Regulatory Program Description 2019 Status
The FFA for the Savannah River Site between the EPA, DOE, and SCDHEC integrates CERCLA and Resource Conservation and Recovery Act (RCRA) requirements to achieve a comprehensive remediation strategy and sets annual work priorities and establishes milestones to clean up and close the high-level radioactive waste tanks at SRS.
SRS met all the commitments contained within the FFA.
The Federal Facility Compliance Act (FFCA) requires federal agencies to comply with federal, state, and local solid and hazardous waste laws.
SRS continues to comply with the FFCA.
The Federal Insecticide, Fungicide, and Rodenticide Act (FIFRA) regulates restricted-use pesticides through a state-administered certification program.
SRS continues to comply with FIFRA requirements.
The Migratory Bird Treaty Act (MBTA) protects migratory birds, including their eggs and nests.
SRS continues to comply with the MBTA.
National Defense Authorization Act, Section 3116(a) (NDAA) allows the Secretary of Energy, in consultation with the Nuclear Regulatory Commission (NRC), to determine that certain waste from reprocessing is not high-level radioactive waste requiring deep geologic disposal if it meets the criteria set forth in Section 3116. Section 3116(b) addresses monitoring by NRC and SCDHEC.
SRS provided routine documents as requested by the NRC to support monitoring SRS facilities in accordance with NDAA 3116(a). NRC conducted one onsite monitoring observation visit to F- and H-Tank Farms and Saltstone in 2019.
The National Environmental Policy Act (NEPA) requires federal agencies to identify potential environmental consequences of proposed federal actions and alternatives to ensure informed, environmentally sound decision-making regarding design and implementing programs and projects.
SRS is in compliance with NEPA.
The National Historic Preservation Act (NHPA) protects historical and archaeological sites.
The Savannah River Archaeological Research Program (SRARP) provides cultural resource management guidance to DOE to ensure continued compliance with the NHPA.
RCRA governs hazardous and nonhazardous solid waste management and underground storage tanks (USTs) containing petroleum products, hazardous materials, and wastes. RCRA also regulates universal waste and recyclable used oil.
SRS continues to manage hazardous waste, nonhazardous solid waste, and USTs in compliance with RCRA.

Compliance Summary
Environmental Report 2019 (SRNS-RP-2020-00064) 3-31
Table 3-5 Status of Key Federal Environmental Laws Applicable to SRS (continued)
Regulatory Program Description 2019 Status
The Safe Drinking Water Act (SDWA) protects drinking water and public drinking water resources.
All drinking water samples taken in 2019 met drinking water quality standards.
The Toxic Substances Control Act (TSCA) regulates polychlorinated biphenyls (PCBs), radon, asbestos and lead, and requires users to evaluate and notify EPA when new chemicals are used and significant new uses of existing chemicals occur.
SRS managed all TSCA-regulated materials in compliance with all requirements. The 2019 annual PCB report was submitted on May 11, 2020.
3.8 ENVIRONMENTAL COMPLIANCE SUMMARY
SRS was not involved in any environmental lawsuits during 2019. SRS received one NOV in 2019, which is discussed in Section 3.3.2.3. Table 3-6 summarizes the NOVs/NOAVs SRS received from 2015–2019.
Table 3-6 NOV/NOAV Summaries, 2015–2019
Program Area
Notice of Violation (NOV)/Notice of Alleged Violation (NOAV)
2015 2016 2017 2018 2019
Clean Air Act (CAA) 1 0 3 1a 0
Clean Water Act (CWA) 0 1 2 0 1
Resource Conservation and Recovery Act (RCRA)
0 0 0 1b 0
Comprehensive Environmental Response, Compensation, and Liability Act (CERCLA)
0 0 0 0 0
Others 0 0 0 0 0
Total 1 1 5 2 1 aThis NOV was issued to Ameresco, a direct contractor to DOE. bNOAV

Compliance Summary
3-32 Savannah River Site
3-32 Savannah River Site
This page intentionally left blank
Environmental Report 2019 (SRNS-RP-2020-00064) 4-1
2019 Highlights
Effluent Releases
• Nonradiological effluent releases for all categories except industrial wastewater met permit limits and applicable standards.
• SRS reported only 4 exceptions out of 2,638 analyses at SRS National Pollutant Discharge Elimination System (NPDES) industrial wastewater outfalls, a 99.8% compliance rate.
• All SRS industrial stormwater outfalls under the NPDES permit were compliant.
Onsite Drinking Water
All SRS drinking water systems complied with South Carolina Department of Health and Environmental Control (SCDHEC) and U.S. Environmental Protection Agency (EPA) water quality standards.
Surveillance Program
• SRS industrial wastewater and industrial stormwater discharges are not significantly affecting the water quality of onsite streams and the Savannah River.
• Sediment results from SRS streams, stormwater basins, and the Savannah River were consistent with the background control locations and were comparable with historical levels.
• Fish flesh sample results were consistent with historical levels.
he Savannah River Site (SRS) nonradiological environmental monitoring program serves two purposes: it confirms the Site is complying with state and federal regulations and permits, and it monitors any effects SRS has on the environment, both onsite and offsite. SRS monitors permitted point-source discharges from onsite facilities for nonradiological parameters to ensure it is complying with regulations and permit requirements. SRS collects and analyzes environmental media such as air, water, sediment, and fish for nonradiological parameters to evaluate the effect of Site operations on the environment.
T
Chapter 4: Nonradiological Environmental Monitoring Program

Nonradiological Environmental Monitoring Program
4-2 Savannah River Site
4.1 INTRODUCTION
Environmental monitoring programs at SRS examine both radiological and nonradiological constituents that Site activities could release into the environment. Chapter 5, Radiological Environmental Monitoring Program, discusses the radiological components of this monitoring program, while this chapter focuses on the nonradiological constituents.
The nonradiological monitoring program collects and analyzes air, water, sludge, sediment, and fish samples from numerous locations throughout SRS and the surrounding area. The program consists of two focus areas: 1) effluent monitoring, and 2) environmental surveillance. The objective of the effluent monitoring program is to demonstrate the Site is complying with permits, and the focus of the environmental surveillance program is to assess the environmental impacts of Site operations on the surrounding area. SRS determines sampling frequency and analyses based on permit-mandated monitoring requirements and federal regulations.
SRS conducts nonradiological environmental monitoring on the following categories:
• Atmospheric (airborne emissions and precipitation with a special focus on mercury deposition) • Water (wastewater, stormwater, sludge, onsite drinking water, and river and stream water
quality) • River, stream, and stormwater basin sediment • Fish
Figure 4-1 shows the types and typical locations (for example, upstream and downstream of SRS influence) of the nonradiological sampling SRS performs.
This chapter summarizes the nonradiological environmental monitoring programs and data results. Section 8.4, Environmental Monitoring Program QA Activities, and Section 8.5, Environmental Monitoring Program QC Activities, summarize the quality assurance and quality control practices that support the sampling and analysis reported in this chapter. Appendix Table B-1 of this document summarizes the nonradiological surveillance sampling media and frequencies.
Chapter 4—Key Terms
Effluent is a release to the environment of treated or untreated water or air from a pipe or a stack. Liquid effluent flows into a body of water, such as a stream or lake. Airborne effluent (also called emission) discharges into the air.
Effluent monitoring is the collection of samples or data from the point a facility discharges liquids or releases gases.
Environmental surveillance is the collection of samples beyond the effluent discharge points and from the surrounding environment.
Outfall is a place where treated or untreated water flows out of a pipe or ditch.
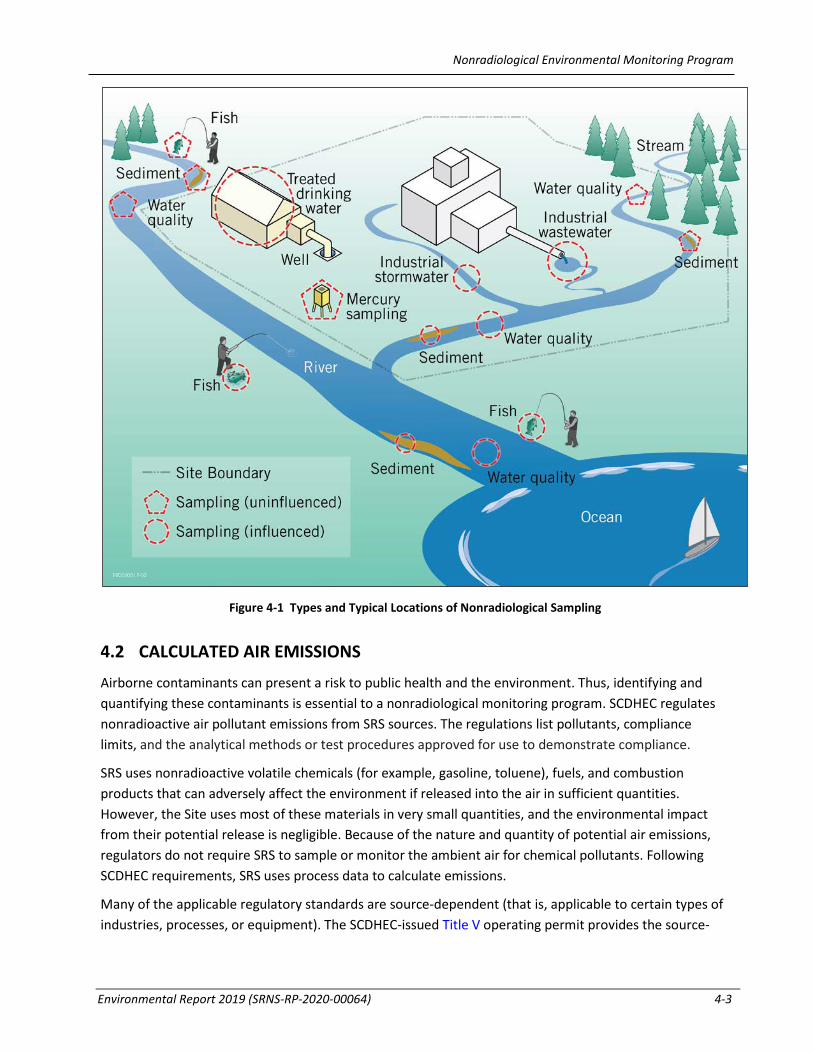
Nonradiological Environmental Monitoring Program
Environmental Report 2019 (SRNS-RP-2020-00064) 4-3
Figure 4-1 Types and Typical Locations of Nonradiological Sampling
4.2 CALCULATED AIR EMISSIONS
Airborne contaminants can present a risk to public health and the environment. Thus, identifying and quantifying these contaminants is essential to a nonradiological monitoring program. SCDHEC regulates nonradioactive air pollutant emissions from SRS sources. The regulations list pollutants, compliance limits, and the analytical methods or test procedures approved for use to demonstrate compliance.
SRS uses nonradioactive volatile chemicals (for example, gasoline, toluene), fuels, and combustion products that can adversely affect the environment if released into the air in sufficient quantities. However, the Site uses most of these materials in very small quantities, and the environmental impact from their potential release is negligible. Because of the nature and quantity of potential air emissions, regulators do not require SRS to sample or monitor the ambient air for chemical pollutants. Following SCDHEC requirements, SRS uses process data to calculate emissions.
Many of the applicable regulatory standards are source-dependent (that is, applicable to certain types of industries, processes, or equipment). The SCDHEC-issued Title V operating permit provides the source-

Nonradiological Environmental Monitoring Program
4-4 Savannah River Site
specific limits for operating facilities, source sampling, testing, monitoring, and reporting frequency. SRS demonstrates it is complying with these regulations by performing air dispersion modeling and submitting to SCDHEC an emissions inventory of air pollutant emissions. SRS uses SCDHEC- and EPA-approved calculations that include source-operating parameters—such as operating hours, process throughput, and EPA-approved emission factors—to determine facility source emissions. SRS then compares the total actual annual emissions for each source to the emission limits contained in applicable permits. Chapter 3, Compliance Summary, Section 3.3.6.4, Air Emissions Inventory, discusses emissions reporting.
4.3 WATER MONITORING
SRS nonradiological water monitoring includes collecting water, sludge, and sediment samples and performing field measurements on various water sources onsite and from the Savannah River. The sample results enable SRS personnel to evaluate whether there is long-term buildup of pollutants downstream of discharge points and determine whether SRS is complying with permit requirements. SRS also collects and analyzes fish from the Savannah River to evaluate metal uptake in the flesh. SRS monitors groundwater, as Chapter 7, Groundwater Management Program, discusses.
4.3.1 Wastewater, Stormwater, and Sludge Monitoring
Nonradiological surface water monitoring primarily consists of sampling water discharges (industrial wastewater and industrial stormwater) associated with SRS NPDES-permitted outfalls. SRS monitors nonradiological liquid discharges to surface waters through the NPDES program, as mandated by the Clean Water Act. The NPDES permit program controls water pollution by regulating point sources that discharge pollutants into waters of the United States.
SCDHEC administers the NPDES permit program and is responsible for permitting, compliance tracking, monitoring, and enforcing the program. The permits SCDHEC issues to SRS provide specific requirements for sampling locations, collection methods, analytes required at an individual outfall, monitoring frequency, permit limits for each analyte, and analytical and reporting methods.
SRS collects NPDES samples in the field according to 40 CFR 136, Guidelines Establishing Test Procedures for the Analysis of Pollutants. This document lists specific methods for sample collecting and preserving, and acceptable analytical methods for the type of pollutant.
Wastewater
In 2019, SRS monitored 28 industrial wastewater outfalls for physical and chemical properties, including flow, dissolved oxygen, potential hydrogen (pH), ammonia, biochemical oxygen demand, fecal coliform, metals, oil and grease, volatile organic compounds, and total suspended solids (TSS). Figure 4-2 shows these locations. The permits specify how often SRS is to monitor the outfalls. Typically, SRS took samples at the locations once a month, although some locations required monitoring as frequently as once a day and others as infrequently as once a quarter. As specified by permits, SRS collected either grab samples (individual sample collected all at one time) or composite samples (a mixture of grab samples collected over a specific period, typically 24 hours). SRS reported results to SCDHEC in required monthly discharge
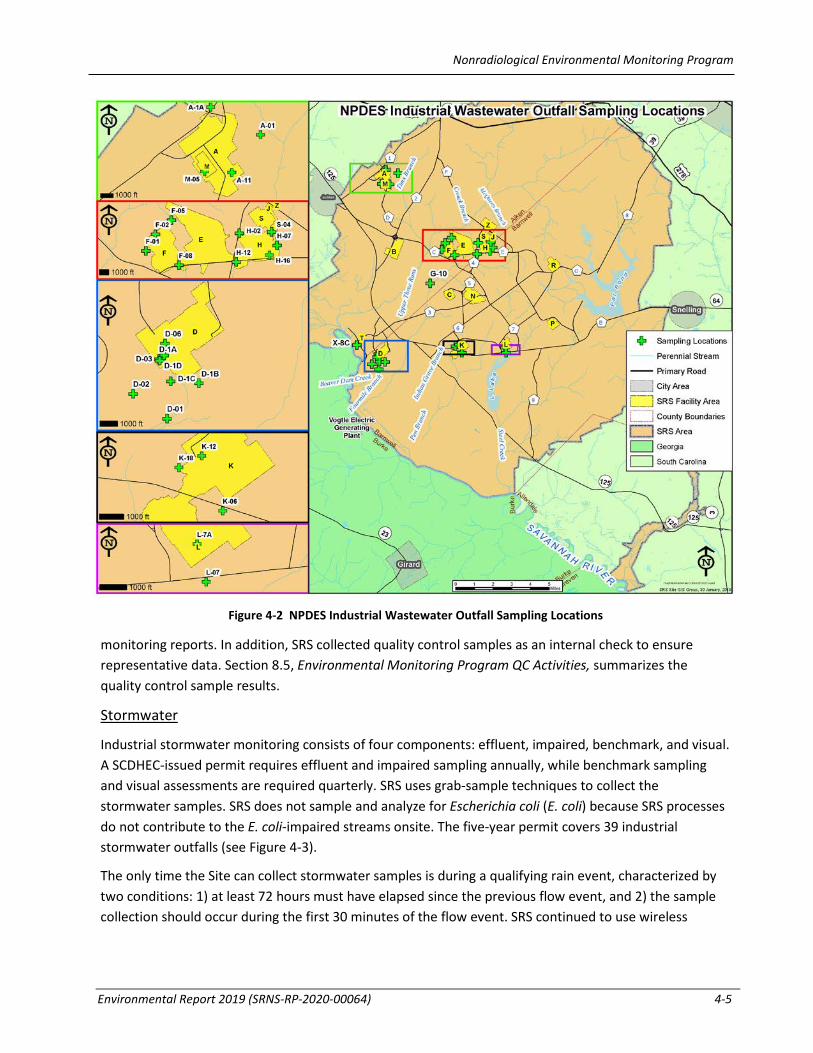
Nonradiological Environmental Monitoring Program
Environmental Report 2019 (SRNS-RP-2020-00064) 4-5
monitoring reports. In addition, SRS collected quality control samples as an internal check to ensure representative data. Section 8.5, Environmental Monitoring Program QC Activities, summarizes the quality control sample results.
Stormwater
Industrial stormwater monitoring consists of four components: effluent, impaired, benchmark, and visual. A SCDHEC-issued permit requires effluent and impaired sampling annually, while benchmark sampling and visual assessments are required quarterly. SRS uses grab-sample techniques to collect the stormwater samples. SRS does not sample and analyze for Escherichia coli (E. coli) because SRS processes do not contribute to the E. coli-impaired streams onsite. The five-year permit covers 39 industrial stormwater outfalls (see Figure 4-3).
The only time the Site can collect stormwater samples is during a qualifying rain event, characterized by two conditions: 1) at least 72 hours must have elapsed since the previous flow event, and 2) the sample collection should occur during the first 30 minutes of the flow event. SRS continued to use wireless
Figure 4-2 NPDES Industrial Wastewater Outfall Sampling Locations
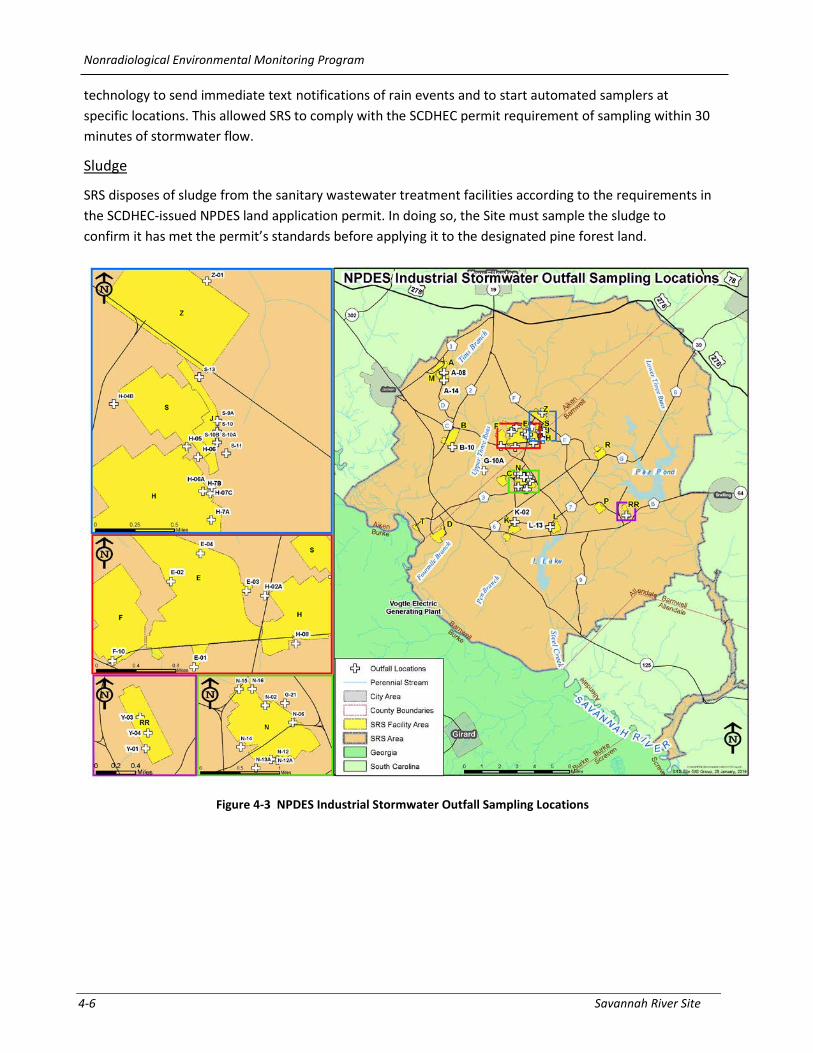
Nonradiological Environmental Monitoring Program
4-6 Savannah River Site
technology to send immediate text notifications of rain events and to start automated samplers at specific locations. This allowed SRS to comply with the SCDHEC permit requirement of sampling within 30 minutes of stormwater flow.
Sludge
SRS disposes of sludge from the sanitary wastewater treatment facilities according to the requirements in the SCDHEC-issued NPDES land application permit. In doing so, the Site must sample the sludge to confirm it has met the permit’s standards before applying it to the designated pine forest land.
Figure 4-3 NPDES Industrial Stormwater Outfall Sampling Locations
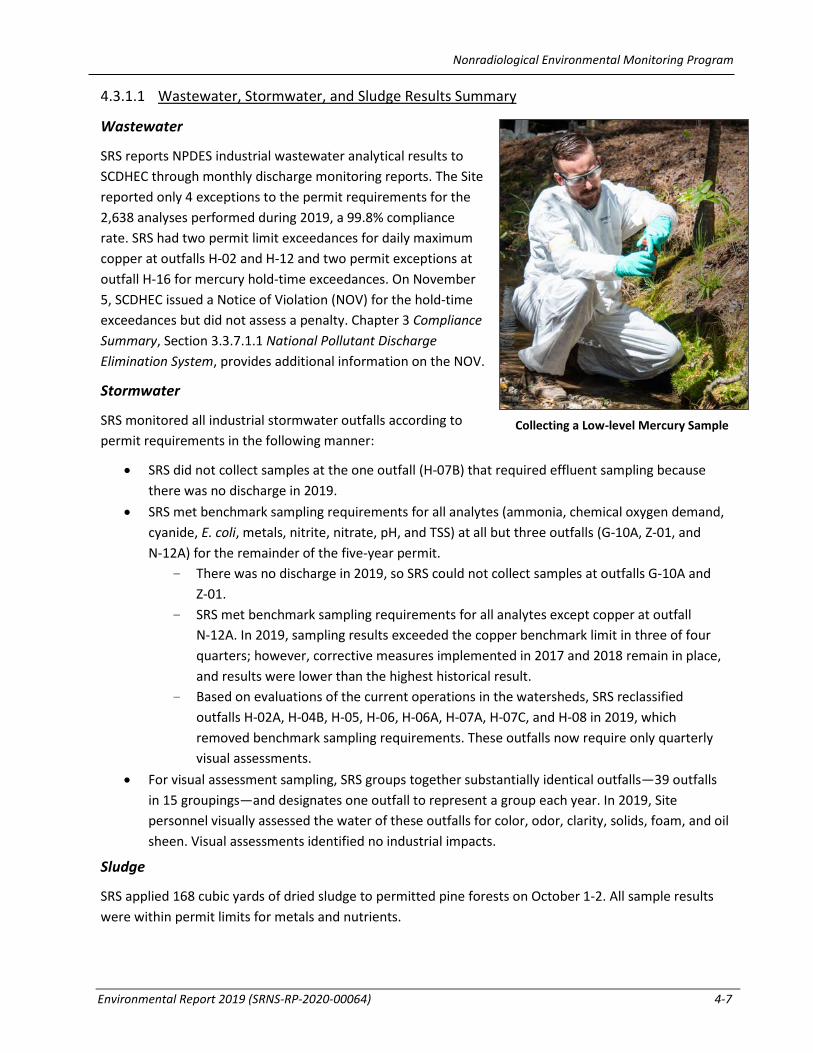
Nonradiological Environmental Monitoring Program
Environmental Report 2019 (SRNS-RP-2020-00064) 4-7
4.3.1.1 Wastewater, Stormwater, and Sludge Results Summary
Wastewater
SRS reports NPDES industrial wastewater analytical results to SCDHEC through monthly discharge monitoring reports. The Site reported only 4 exceptions to the permit requirements for the 2,638 analyses performed during 2019, a 99.8% compliance rate. SRS had two permit limit exceedances for daily maximum copper at outfalls H-02 and H-12 and two permit exceptions at outfall H-16 for mercury hold-time exceedances. On November 5, SCDHEC issued a Notice of Violation (NOV) for the hold-time exceedances but did not assess a penalty. Chapter 3 Compliance Summary, Section 3.3.7.1.1 National Pollutant Discharge Elimination System, provides additional information on the NOV.
Stormwater
SRS monitored all industrial stormwater outfalls according to permit requirements in the following manner:
• SRS did not collect samples at the one outfall (H-07B) that required effluent sampling because there was no discharge in 2019.
• SRS met benchmark sampling requirements for all analytes (ammonia, chemical oxygen demand, cyanide, E. coli, metals, nitrite, nitrate, pH, and TSS) at all but three outfalls (G-10A, Z-01, and N-12A) for the remainder of the five-year permit.
- There was no discharge in 2019, so SRS could not collect samples at outfalls G-10A and Z-01.
- SRS met benchmark sampling requirements for all analytes except copper at outfall N-12A. In 2019, sampling results exceeded the copper benchmark limit in three of four quarters; however, corrective measures implemented in 2017 and 2018 remain in place, and results were lower than the highest historical result.
- Based on evaluations of the current operations in the watersheds, SRS reclassified outfalls H-02A, H-04B, H-05, H-06, H-06A, H-07A, H-07C, and H-08 in 2019, which removed benchmark sampling requirements. These outfalls now require only quarterly visual assessments.
• For visual assessment sampling, SRS groups together substantially identical outfalls—39 outfalls in 15 groupings—and designates one outfall to represent a group each year. In 2019, Site personnel visually assessed the water of these outfalls for color, odor, clarity, solids, foam, and oil sheen. Visual assessments identified no industrial impacts.
Sludge
SRS applied 168 cubic yards of dried sludge to permitted pine forests on October 1-2. All sample results were within permit limits for metals and nutrients.
Collecting a Low-level Mercury Sample

Nonradiological Environmental Monitoring Program
4-8 Savannah River Site
4.3.2 Onsite Drinking Water Monitoring
SRS uses groundwater sources to supply drinking water to onsite facilities. The A-Area treatment plant supplies most of SRS’s drinking water. The Site also has 4 smaller drinking water facilities, each serving fewer than 25 people.
SCDHEC requires SRS to collect 10 bacteriological samples each month from the A-Area treatment plant to ensure that domestic water from that system meets SCDHEC and EPA bacteriological drinking water quality standards. SRS exceeds this requirement by collecting 15 samples each month from various areas.
4.3.2.1 Drinking Water Results Summary
All drinking water bacteriological samples that SRS collected in 2019 met the state and federal drinking water quality standards.
4.3.3 River and Stream Water Quality Surveillance
South Carolina Regulation 61-69, Classified Waters, classifies SRS streams and the Savannah River as “freshwaters.” Freshwaters, as defined in Regulation 61-68, Water Classifications and Standards, (SCDHEC 2014) support the following:
• Primary and secondary contact recreation and as a drinking water source after conventional treatment in accordance with SCDHEC requirements
• Fishing and the survival and propagation of a balanced indigenous aquatic community of fauna and flora
• Industrial and agricultural uses
SRS surveys river and stream water quality to identify: 1) any degradation that could be attributable to the water discharges Site NPDES permits regulate, and 2) materials coming from inadvertent releases at sources other than routine release points.
SRS sampled 10 onsite streams and 5 Savannah River locations for various physical and chemical properties, including temperature, hardness, dissolved oxygen, pH, herbicides, metals, nitrate, nitrite, pesticides, phosphorus, polychlorinated biphenyls (PCBs), total organic carbon, and TSS. Figure 4-4 shows the sampling locations. U3R-0 continued to replace upstream location U3R-1A on Upper Three Runs Creek to alleviate the potential impacts to water quality results from the bridgework along the stream. The river and stream sampling locations are upstream from, adjacent to, and downstream from the Site. SRS compares results to background levels of chemicals from natural sources and from contaminants produced by municipal sewage plants, medical facilities, and other upstream industrial facilities to assess the environmental impacts of Site operations on the surrounding area. SRS samples the water quality locations monthly and semiannually by the conventional grab-collection technique. In 2019, SRS reduced the sampling frequency of PCBs, pesticides, and herbicides from quarterly to semiannually to match SCDHEC’s sampling frequency. SCDHEC also collects samples at several onsite stream locations. Most of them share locations with SRS samples as a quality-control check of the SRS program. SRS collects quality control samples throughout the year, as documented in Section 8.5, Environmental Monitoring Program QC Activities.

Nonradiological Environmental Monitoring Program
Environmental Report 2019 (SRNS-RP-2020-00064) 4-9
Figure 4-4 Nonradiological Surface Water Sampling Locations

Nonradiological Environmental Monitoring Program
4-10 Savannah River Site
4.3.3.1 River and Stream Water Quality Results Summary
SRS analyzed 4,569 individual samples collected from the 15 stream- and river-water quality locations during 2019, with 2,847 of 3,165 (90%) meeting South Carolina Freshwater Quality Standards, as available. (Not all analytes sampled have a standard.) Averages for each river and stream location met standards for dissolved oxygen, temperature, cadmium, chromium, lead, mercury, nickel, nitrate, nitrite, zinc, pesticides, herbicides, and PCBs. Appendix Table C-1 summarizes the analytical results. These results continue to indicate that SRS discharges are not significantly affecting the water quality of onsite streams or the Savannah River.
4.3.4 Sediment Sampling
SRS’s nonradiological sediment surveillance program measures the concentrations of various inorganic contaminants that Site releases deposit in stormwater basins, stream systems, and the Savannah River, where they accumulate or disperse. In 2019, SRS changed the list of contaminants it analyzed for to align with the EPA’s sediment refinement screening values (RSVs) for Hazardous Waste Sites Non-Narcotic Modes of Action outlined in the Region 4 Ecological Risk Assessment Supplemental Guidance. RSVs are screening values from other sources or modifications to screening values that reflect site-specific conditions. This change eliminated cyanide and magnesium and added antimony.
The nonradiological sediment program collects sediment samples annually at various Site stream, stormwater basin, and Savannah River locations (Figure 4-5). The locations vary from year-to-year, depending on the rotation schedule agreed upon with SCDHEC. SRS collects duplicate samples to assess quality control, as documented in Section 8.5, Environmental Monitoring Program QC Activities.
4.3.4.1 Stream and River Sediment Results Summary
SRS collected and analyzed 367 individual sediment samples from 23 locations (12 from streams, 3 from stormwater basins, and 8 from the Savannah River). SRS measured aluminum, antimony, arsenic, barium, cadmium, chromium, copper, iron, lead, manganese, mercury, nickel, selenium, silver, uranium, and zinc. Many of these are trace metals that occur naturally in soils and sediments. Ninety-seven percent (357 of 367 analyses) of the 2019 results met the EPA Region 4 Sediment RSVs. Barium accounted for 9 of the 10 samples that exceeded its RSV (60 mg/kg). SRS considers these barium exceedances as background, as evidenced by Agency for Toxic Substances and Disease Registry 2007 Toxicological Profile for Barium (mean values ranging between 265 and 835 mg/kg), and similar results in both control locations and in historical trending. Appendix Table C-2 summarizes the analytical results. All results compare to those of the previous five years and demonstrate SRS activities are not significantly affecting the metals concentrations of onsite basins and streams, or the Savannah River.
Splitting a Sediment Sample with SCDHEC

Nonradiological Environmental Monitoring Program
Environmental Report 2019 (SRNS-RP-2020-00064) 4-11
Figure 4-5 Nonradiological Sediment Sampling Locations
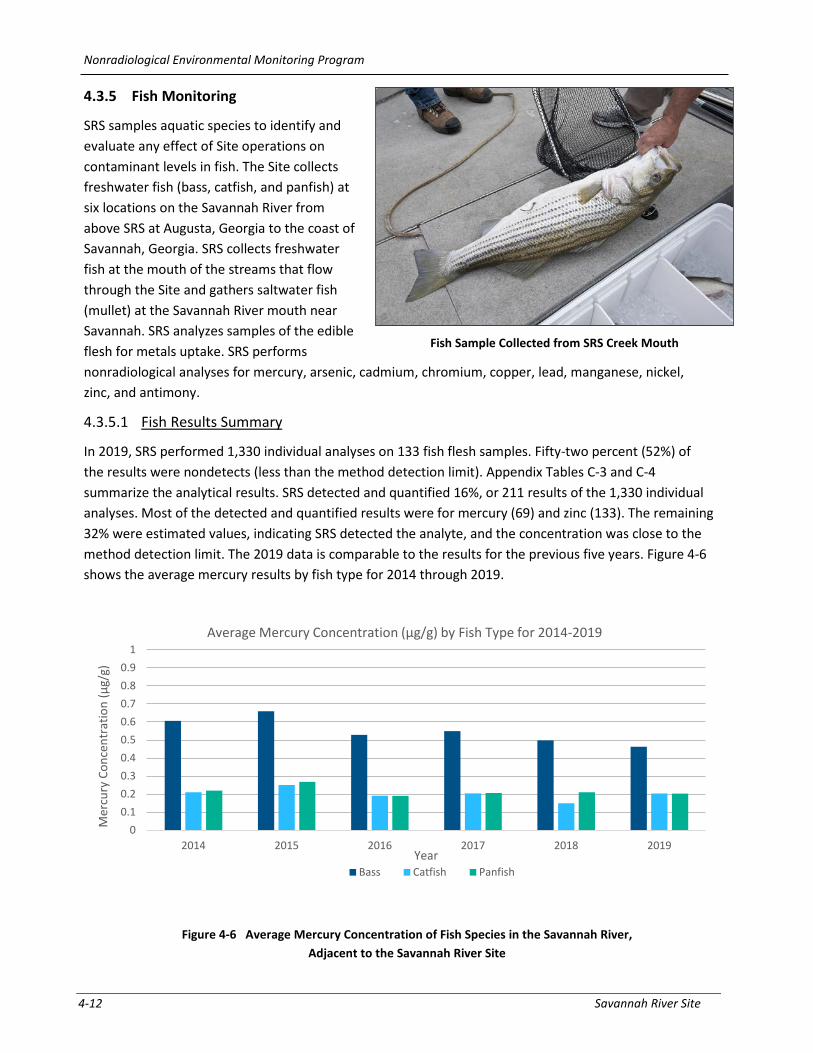
Nonradiological Environmental Monitoring Program
4-12 Savannah River Site
4.3.5 Fish Monitoring
SRS samples aquatic species to identify and evaluate any effect of Site operations on contaminant levels in fish. The Site collects freshwater fish (bass, catfish, and panfish) at six locations on the Savannah River from above SRS at Augusta, Georgia to the coast of Savannah, Georgia. SRS collects freshwater fish at the mouth of the streams that flow through the Site and gathers saltwater fish (mullet) at the Savannah River mouth near Savannah. SRS analyzes samples of the edible flesh for metals uptake. SRS performs nonradiological analyses for mercury, arsenic, cadmium, chromium, copper, lead, manganese, nickel, zinc, and antimony.
4.3.5.1 Fish Results Summary
In 2019, SRS performed 1,330 individual analyses on 133 fish flesh samples. Fifty-two percent (52%) of the results were nondetects (less than the method detection limit). Appendix Tables C-3 and C-4 summarize the analytical results. SRS detected and quantified 16%, or 211 results of the 1,330 individual analyses. Most of the detected and quantified results were for mercury (69) and zinc (133). The remaining 32% were estimated values, indicating SRS detected the analyte, and the concentration was close to the method detection limit. The 2019 data is comparable to the results for the previous five years. Figure 4-6 shows the average mercury results by fish type for 2014 through 2019.
00.10.20.30.40.50.60.70.80.9
1
2014 2015 2016 2017 2018 2019
Mer
cury
Con
cent
ratio
n (µ
g/g)
Year
Average Mercury Concentration (µg/g) by Fish Type for 2014-2019
Bass Catfish Panfish
Fish Sample Collected from SRS Creek Mouth
Figure 4-6 Average Mercury Concentration of Fish Species in the Savannah River, Adjacent to the Savannah River Site
Nonradiological Environmental Monitoring Program
Environmental Report 2019 (SRNS-RP-2020-00064) 4-13
4.4 PRECIPITATION CHEMISTRY AND DEPOSITION
The SRS nonradiological air monitoring program collects samples and data to calculate air emissions from Site sources and for the National Atmospheric Deposition Program (NADP). The NADP monitors the geographic distribution of specific airborne contaminants to better understand their effects on the environment. The NADP publishes data one year after analyzing all samples from its network of collection locations. The NADP data and geographic deposition maps are available on its maps and data webpage.
SRS sponsors a collection station to support the NADP. This station, near the center of SRS at the Savannah River National Laboratory Central Climatology Facility, collects weekly precipitation (rain, sleet, and snow) samples and submits them to NADP laboratories for chemical analysis. Since 2001, this station has been part of the Mercury Deposition Network (MDN) of the NADP. The MDN provides data on the geographic distributions and trends of mercury in precipitation. Natural sources, including volcanoes and wildfires, emit mercury into the atmosphere and surface waters. Mercury also occurs naturally in some soils, yet most of the attention on mercury in the environment focuses on anthropogenic sources: coal combustion, medical waste incineration, and chlorine production, among others. The MDN is the only network providing a long-term record of mercury concentrations in North American precipitation. All monitoring sites follow standard procedures and have uniform precipitation collectors and gauges. Beginning in 2012, the National Trends Network (NTN) added the station at SRS. This network tracks changes in acid rain.
Sample analysis associated with the NTN includes free acidity (pH), conductivity, calcium, magnesium, sodium, potassium, sulfate, nitrate, chloride, and ammonium. In addition to supporting national-scale observations relating to trends in precipitation chemistry, results from this surveillance provide specific information related to the chemistry of precipitation at SRS. NTN data is available on the NADP website.
Nonradiological Environmental Monitoring Program
4-14 Savannah River Site
This page intentionally left blank

Environmental Report 2019 (SRNS-RP-2020-00064) 5-1
he purpose of the Savannah River Site (SRS) Radiological Environmental Monitoring Program is twofold: it monitors any effects SRS has on the environment, and it demonstrates the Site is complying with applicable U.S. Environmental Protection Agency (EPA), South Carolina Department of Health and Environmental Control (SCDHEC), and U.S. Department of Energy (DOE) regulations and standards. Monitoring substantiates that SRS operations pose no risk to the surrounding population. As part of this program, the Site collects thousands of samples throughout the year and analyzes them for radionuclides that could be present from releases due to SRS operations. The Site collects samples both onsite and in the communities surrounding SRS. State and federal regulations drive some of the monitoring SRS conducts. DOE Orders 231.1B, Environment, Safety and Health Reporting, and 458.1, Radiation Protection of the Public and the Environment, also address environmental monitoring requirements.
2019 Highlights Air Pathway—All air contaminants SRS released were below applicable permit and regulation limits. Radiological results for surveillance media associated with the airborne pathway were within historical levels.
Water Pathway—Water contaminants SRS released were all below applicable standards. Radiological results for surveillance media associated with the liquid pathway were within historical levels.
Wildlife Surveillance—All harvested animals SRS monitored during the annual onsite hunts were below the applicable standard. SRS monitored the deer, feral hogs, turkeys, and coyotes harvested during the hunts and released 235 animals.
T
Chapter 5: Radiological Environmental Monitoring Program
Radiological Environmental Monitoring Program
5-2 Savannah River Site
5.1 INTRODUCTION
Environmental monitoring at SRS examines both radiological and nonradiological constituents that the Site could release to the environment. This chapter discusses radiological monitoring at SRS; Chapter 4, Nonradiological Environmental Monitoring Program, presents the nonradiological monitoring.
The SRS Radiological Environmental Monitoring Program monitors radiological contaminants from both air and liquid sources, as well as collects and analyzes environmental samples from numerous locations throughout the Site and the surrounding area. SRS measures tritium in most sample media as it is a significant contributor to potential dose to the public. The Radiological Environmental Monitoring Program has two focus areas: 1) effluent monitoring, and 2) environmental surveillance. SRS determines sampling frequency and analyses based on permit-mandated monitoring requirements, federal regulations, and DOE Orders.
In accordance with DOE Order 458.1, SRS evaluates the effluent monitoring program by comparing the annual average concentrations to the DOE-derived concentration standards (DCSs). DOE’s Derived Concentration Technical Standard (DOE 2011) establishes numerical standards for DCSs to implement DOE Order 458.1. DCSs are radiological quantities for specific radionuclides specific to a surface or concentration used in surveying or characterizing radiation to comply with DOE Order 458.1. SRS demonstrates DCS compliance when the sum of the ratios of each radionuclide’s observed concentration to its corresponding DCS does not exceed 1.00. This sum is called the “sum of fractions.” The DCSs are applicable at the point of discharge, and SRS uses them to screen existing effluent treatment systems to determine if they are appropriate and effective. SRS uses the same DCSs as reference concentrations to conduct environmental protection programs. All DOE sites use these DCSs.
The SRS surveillance program samples the types of media that Site releases, as measured in the effluent monitoring program, may impact. Figure 5-1 shows the liquid and airborne pathways, as well as the types of media sampled through those pathways.
Chapter 5—Key Terms
Actinides are a group of radioactive metallic elements with an atomic number between 89 and 103. Within this chapter, laboratory analysis of actinides generally refers to the elements uranium, plutonium, americium, and curium.
Derived concentration standard (DCS) is the concentration of a radionuclide, measured at the discharge point, in air or water effluents that—under conditions of continuous exposure for one year (annual ingestion of water, submersion in air, or inhalation)—would result in a dose of 100 mrem. This assumption of direct exposure to discharge point effluents is extremely unlikely and ensures that the DCSs are highly conservative.
Dose is a general term for the quantity of radiation (energy) absorbed.
Effluent monitoring collects samples or data from the point a facility discharges liquids or releases gases.
Environmental monitoring encompasses both effluent monitoring and environmental surveillance.
Environmental surveillance collects samples beyond the effluent discharge points and from the surrounding environment.
Exposure pathway is the way that releases of radionuclides into the water and air could impact a person.

Radiological Environmental Monitoring Program
Environmental Report 2019 (SRNS-RP-2020-00064) 5-3
SRS conducts environmental monitoring of the following:
• Air (stack emissions and ambient air) • Rainwater • Vegetation • Soil • Surface water (stream, river, and stormwater basins) • Drinking water • Stream, basin, and river sediment • Aquatic food products • Wildlife • Food products (milk, meat, fruit, nuts, grains, and vegetables)
Sampling results provide the data needed to assess the exposure pathways for the people living near SRS, as documented in Chapter 6, Radiological Dose Assessment.
Appendix Table B-2 of this document summarizes the radiological surveillance sampling media and frequencies.
Figure 5-1 Types and Typical Locations of Radiological Sampling

Radiological Environmental Monitoring Program
5-4 Savannah River Site
5.2 SRS OFFSITE MONITORING
Offsite monitoring involves collecting and analyzing samples of air, river water, soil, sediment, vegetation, milk, food products, fish, and other media from many locations. SRS analyzes these samples for radioactive contaminants to monitor any effects the Site has on the environment and to assess long-term trends of the contaminants in the environment. SRS collects samples beyond the Site perimeter in Georgia and in South Carolina at 25- and 100-mile intervals from the Site. Additionally, SRS collects samples at several population centers in Georgia and in South Carolina.
SRS monitors the Savannah River at River Mile (RM) 141.5, locations downriver of each SRS stream entry point, and above the Site at RM 161 as a control location. Media-specific chapter figures and Environmental Maps show offsite environmental sampling locations. Chapter 7, Groundwater Management Program, provides information on SRS groundwater monitoring. Table 5-1 summarizes SRS offsite radiological sampling performed in Georgia and South Carolina, excluding samples collected in the Savannah River.
Table 5-1 SRS Offsite Radiological Sample Distribution by State
Environmental Sampling Media Approximate Number of Samples (Number of Locations)
South Carolina Georgia
Air Filters 26 (1) 52 (2)
Silica Gel 26 (1) 52 (2)
Ambient Gamma Radiation Monitoring 56 (7) 32 (4)
Rainwater 13 (1) 26 (2)
Food Products 20 (20) 5 (5)
Milk 16 (4) 12 (3)
Soil 4 (4) 2 (2)
Grassy Vegetation 1 (1) 2 (2)
Drinking Water 24 (2) 0 (0)
Total 186 (41) 183 (22)
Note: This table excludes groundwater monitoring locations and samples that Chapter 7, Groundwater Management Program, discusses, as well as samples collected from the Savannah River.

Radiological Environmental Monitoring Program
Environmental Report 2019 (SRNS-RP-2020-00064) 5-5
5.3 AIR PATHWAY
The media in this section support the air pathway dose assessment discussed in Chapter 6, Radiological Dose Assessment.
5.3.1 Air Monitoring
SRS monitors the air to determine whether airborne radionuclides from SRS emissions have reached the environment in measurable quantities and to ensure that radiation exposure to the public remains below regulatory limits. SRS performs effluent monitoring of airborne radionuclides at the point of discharge from operating SRS facilities. This monitoring complies with radiation dose limits that the EPA and DOE established to protect the public. SRS conducts additional air sampling at surveillance stations onsite, along the SRS perimeter, and within communities surrounding SRS. Radionuclides in and around the SRS environment are both from SRS operations and from sources not related to the Site. The sources not associated with SRS include 1) naturally occurring radioactive material, 2) past atmospheric testing of nuclear weapons, 3) offsite nuclear power plant operations, and 4) offsite medical and industrial activities. Krypton-85 and tritium in the elemental (hydrogen gas) and oxide (water vapor) forms make up most of the radionuclide emissions from SRS to the air. The amount of krypton-85 and tritium released from SRS varies yearly, based on mission activities and on the annual production schedules of the processing facilities.
5.3.2 Airborne Emissions
EPA’s National Emission Standards for Hazardous Air Pollutants (NESHAP) program establishes the limits for radionuclide emissions, detailing the methods for estimating and reporting radioactive emissions from DOE-owned or operated sources. SCDHEC issues Clean Air Act Part 70 Air Quality Permits to regulate radioactive airborne pollutant emissions for each major source of airborne emissions on SRS. Each permit has specific limitations and monitoring requirements.
SRS quantifies the total amount of radioactive material released to the environment by the following methods:
• Data obtained from monitored air effluent release points (stacks or vents) • Calculated releases of unmonitored radioisotopes from spent fuel dissolution • Estimates for unmonitored sources based on approved EPA calculation methods
SRS monitors the emissions from process area stacks at facilities that release, or have the potential to release, airborne radioactive materials. SRS typically uses laboratory analyses of samples to determine concentrations of radionuclides in airborne emissions. The Site collects airborne effluent samples on filter papers for particulates, on charcoal sampling media for gaseous iodine, and in a bubbler solution for airborne tritium. Depending on the processes involved, SRS may also use real-time instruments to monitor instantaneous and cumulative releases (of tritium, for example) to the air.
The dissolution of spent nuclear fuel in the H-Canyon facility releases krypton-85, carbon-14, and tritium. SRS calculates these emissions and includes them with the monitored releases.
Each year, SRS calculates radionuclide release estimates (in curies [Ci]) from unmonitored diffuse and point sources. Point sources include stacks or other exhaust points, such as vents. In contrast, emissions from

Radiological Environmental Monitoring Program
5-6 Savannah River Site
diffuse sources are not actively ventilated or exhausted. Diffuse emissions may originate from a larger area and not from a single location. SRS diffuse sources include research laboratories, disposal sites and storage tanks, and deactivation and decommissioning activities. The emissions calculated from unmonitored releases use the methods contained in Appendix D of EPA’s NESHAP regulations (EPA 2002). Because these methods employ conservative assumptions, they generally overestimate actual emissions. Although SRS does not monitor these releases at their source, it uses onsite and offsite environmental surveillance to assess the impact, if any, of unmonitored releases.
5.3.2.1 Airborne Emissions Results Summary
Appendix Table D-1 presents SRS radioactive release totals from monitored and unmonitored (calculated) sources, while Table 5-2 provides a summary for the calendar year (CY). During the past 10 years, the total annual tritium release has ranged from about 9,000 to 40,000 Ci per year, with an annual average tritium release of 24,100 Ci (Figure 5-2). The 2019 SRS tritium releases totaled 9,250 Ci, which is the lowest in 10 years. The 76% decrease in tritium releases was due to there being no major maintenance activities in the Tritium Facility in 2019 as conducted in 2018. Additionally, the amount of tritium released during routine operations at SRS fluctuates due to changes in SRS missions and in the annual production schedules of the tritium-processing facilities.
In 2019, tritium and krypton-85 accounted for a majority of the total radiation SRS operations released to the air. Tritium-processing facilities are responsible for most of the SRS tritium releases, and the reprocessing of highly enriched uranium at H-Area separations facilities is responsible for all krypton-85 releases. Tritium releases from the separations areas are a combination of releases from the tritium-processing facilities and the dissolution in H Canyon. Appendix Table D-1 and Figures 5-2 and 5-3 show the tritium releases from the separations areas, legacy reactor facilities, and unmonitored sources.
Table 5-2 SRS Radiological Atmospheric Releases for CY 2019
Release Type Totals (curies)
Tritium 9.25E+03
Krypton-85 (85Kr) 1.07E+04
Short-Lived Fission and Activation Products (half-life < 3 hr)a,b 2.00E-08
Fission and Activation Products (half-life > 3 hr)a,b 5.73E-02
Total Radio-iodine 9.99E-03
Total Radio-strontiumc 4.54E-03
Total Uranium 6.41E-05
Plutoniumd 4.34E-04
Other Actinides 2.33E-04
Other 4.00E-02
a ICRP 107 Half-life data, Nuclear Decay Data for Dosimetric Calculations (2008) b IAEA Common Fission and Activation Products c Includes unidentified beta releases d Includes unidentified alpha releases
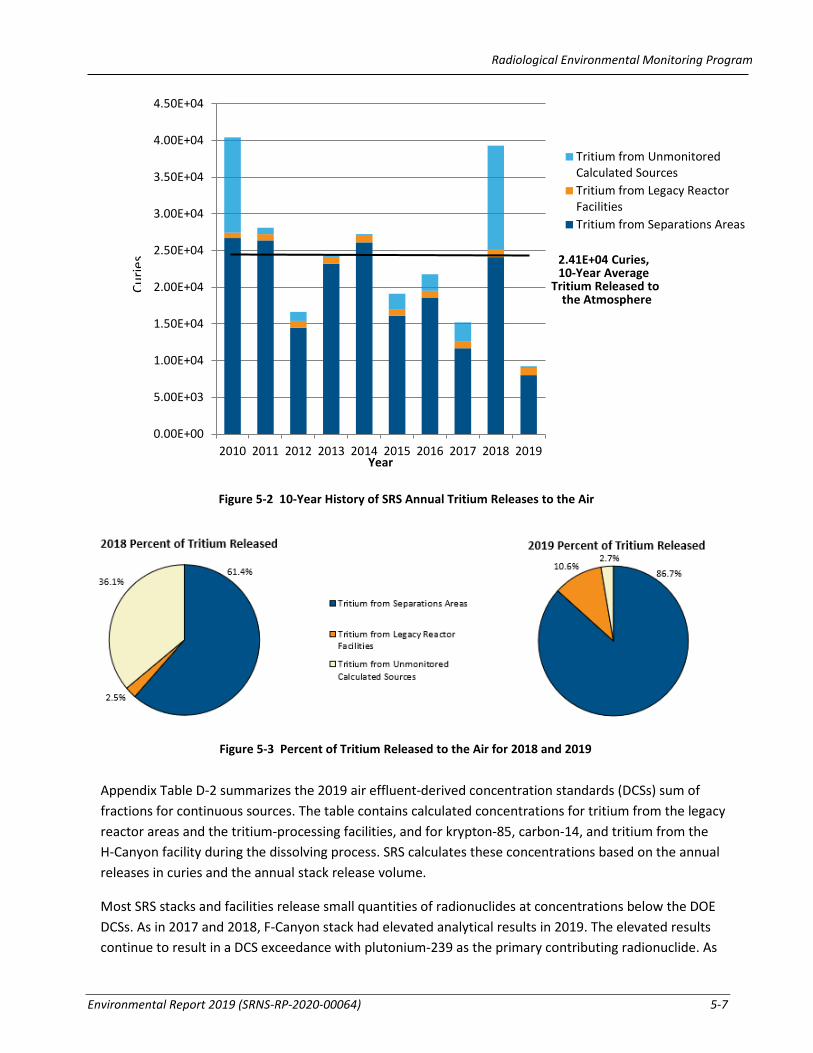
Radiological Environmental Monitoring Program
Environmental Report 2019 (SRNS-RP-2020-00064) 5-7
Appendix Table D-2 summarizes the 2019 air effluent-derived concentration standards (DCSs) sum of fractions for continuous sources. The table contains calculated concentrations for tritium from the legacy reactor areas and the tritium-processing facilities, and for krypton-85, carbon-14, and tritium from the H-Canyon facility during the dissolving process. SRS calculates these concentrations based on the annual releases in curies and the annual stack release volume.
Most SRS stacks and facilities release small quantities of radionuclides at concentrations below the DOE DCSs. As in 2017 and 2018, F-Canyon stack had elevated analytical results in 2019. The elevated results continue to result in a DCS exceedance with plutonium-239 as the primary contributing radionuclide. As
0.00E+00
5.00E+03
1.00E+04
1.50E+04
2.00E+04
2.50E+04
3.00E+04
3.50E+04
4.00E+04
4.50E+04
2010 2011 2012 2013 2014 2015 2016 2017 2018 2019Year
Tritium from UnmonitoredCalculated SourcesTritium from Legacy ReactorFacilitiesTritium from Separations Areas
Curie
s 2.41E+04 Curies, 10-Year Average
Tritium Released tothe Atmosphere
Figure 5-2 10-Year History of SRS Annual Tritium Releases to the Air
Figure 5-3 Percent of Tritium Released to the Air for 2018 and 2019

Radiological Environmental Monitoring Program
5-8 Savannah River Site
mentioned earlier in the chapter, compliance with the DCS is when the sum of the ratios of each radionuclide’s observed concentration to its corresponding DCS does not exceed 1.00. The DCS sum of fractions exceedance for 2019 is 2.08 and has decreased from 5.80 in 2017 and 3.19 in 2018. SRS continues to monitor and evaluate emissions from the facility and will determine whether the Site needs to take action to further reduce releases.
Because of the nature of several SRS facilities operations, tritium oxide releases exceeded DOE’s tritium air DCS. However, DOE recognizes that tritium oxide, which is essentially water vapor, cannot be filtered or removed from the effluent. Therefore, DOE Order 458.1 specifically exempts tritium from Best Available Technology considerations but not from environmental As Low As Reasonably Achievable (ALARA) requirements that Site procedures implement. However, the Site maintains tritium releases according to the ALARA principle to comply with DOE Order 458.1. The ALARA process manages radiological activities so that doses to members of the public (both individual and collective) and releases to the environment are kept as low as reasonably achievable.
5.3.3 Air Surveillance
Beyond the operational facilities, SRS maintains a network of 14 air sampling stations (Figure 5-4 and Environmental Maps, Radiological Air Surveillance Sampling Locations) in and around SRS to monitor concentrations of radionuclides in the air and rainwater. The air contains radionuclides in various forms (gaseous, particulate matter, water vapor). Rainwater can redeposit radionuclides from the air onto the ground, and vegetation or soil can eventually absorb the radionuclides.
The sampling stations are at locations on and off the Site. Onsite stations are at the center of the Site and around the perimeter. Offsite sampling stations are 25 miles from the Site in population centers and at a control location, the U.S. Highway 301 Bridge at the Georgia Welcome Center in Screven County. SRS operations are not likely to affect the control location. SRS placed air-sampling stations near the Site boundary and beyond to be representative of the atmospheric distribution of airborne releases in the environment. Each air sampling station collects air and rainwater samples as Table 5-3 lists below.
SRS selected the radionuclides presented in Table 5-3 based on known SRS airborne emission sources. Background levels in the air consist of naturally occurring radionuclides (for example, uranium, thorium, and radon) and radionuclides from global fallout due to historical nuclear weapons testing related to the Cold War (for example, strontium-89,90, and cesium-137 [a manmade gamma-emitting radionuclide]).
Table 5-3 Air Sampling Media
Media Purpose Radionuclides
Glass-Fiber Filter Airborne particulate matter Gamma-emitting radionuclides, gross alpha/beta emitting radionuclides,
actinides, strontium-89,90
Charcoal Canister Gaseous states of radioiodine Iodine-129
Silica Gel Tritiated water vapor Tritium
Rainwater Tritium in rainwater Tritium
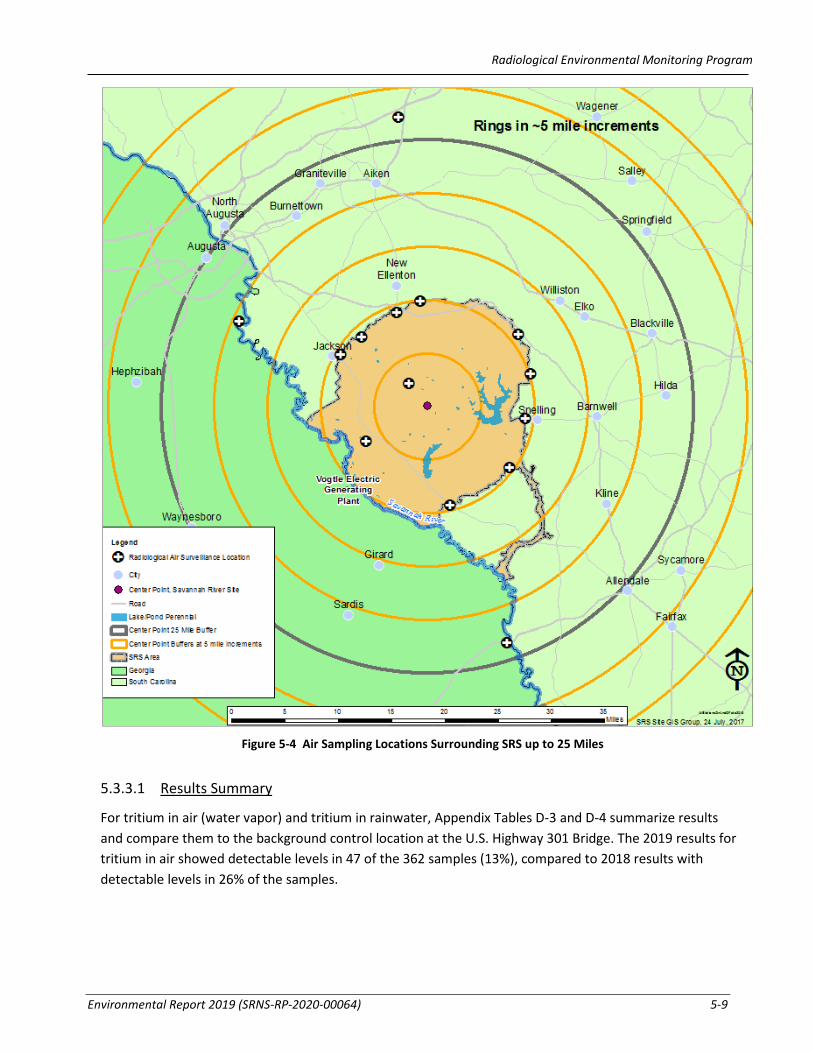
Radiological Environmental Monitoring Program
Environmental Report 2019 (SRNS-RP-2020-00064) 5-9
5.3.3.1 Results Summary
For tritium in air (water vapor) and tritium in rainwater, Appendix Tables D-3 and D-4 summarize results and compare them to the background control location at the U.S. Highway 301 Bridge. The 2019 results for tritium in air showed detectable levels in 47 of the 362 samples (13%), compared to 2018 results with detectable levels in 26% of the samples.
Figure 5-4 Air Sampling Locations Surrounding SRS up to 25 Miles

Radiological Environmental Monitoring Program
5-10 Savannah River Site
The 2019 results for tritium in rainwater showed detectable levels in 16 of the 179 rainwater samples (9%), as compared to 2018 results with detectable levels in 15% of the samples. As in previous years, the 2019 values were highest near the center of SRS and decreased with distance from the Site.
In 2018, tritium in air and rainwater were above the 5-year average due to maintenance at the tritium-processing facilities. However, in 2019 tritium results for air and rainwater resumed normal trends.
Charcoal canisters analyzed quarterly for radioiodine showed one detection of iodine-129 at the Jackson air station during the second quarter of 2019. Charcoal canister results for radioiodine were within the trend levels for the previous 10 years. Glass fiber filter results for gamma-emitting radionuclides showed no detects of cesium-137 and no detects of cobalt-60 at any air surveillance stations during 2019. Glass-fiber filter results for gamma-emitting radionuclides were within the trend levels for the previous 10 years. All offsite location results were near the levels observed at the control location at the U.S. Highway 301 bridge.
SRS also selected offsite and plant perimeter glass fiber filter samples for actinide and Sr-89/90 analysis. Sample selection was dependent on dates of elevated concentrations at F-Canyon stack and the wind direction during the corresponding time period. Actinide and Sr-89/90 analysis was also performed on glass fiber filter samples collected biweekly at the Burial Ground North onsite. All glass fiber filter results are shown in Appendix Table D-5 and are within the trend levels for the previous 10 years.
5.3.4 Ambient Gamma Surveillance
Since 1965, SRS has been monitoring ambient (surrounding) environmental gamma exposure rates using dosimeters, which are passive devices that measure the exposure from ionizing radiation. In 2019, SRS transitioned from thermoluminescent dosimeters (TLDs) to optically stimulated luminescence dosimeters (OSLDs). OSLDs prove to have a higher and more accurate absorption rate to radiation exposure, are more efficient, and are reusable. The Site uses data from the OSLDs to determine the impact of Site operations on the gamma exposure to the public and the environment and to evaluate trends in exposure levels. Other uses include supporting routine and emergency response dose calculations. Comparisons of TLD and OSLD data from the first and second quarters of 2019 have shown OSLDs to have approximately a 20% higher ambient gamma absorption than TLDs, favoring a much more conservative exposure rate.
An extensive OSLD network in and around SRS monitors external ambient gamma exposure rates (Environmental Maps, SRS Optically Stimulated Luminescent Dosimeter [OSLD] Sampling Locations). The
Technician Verifying Equipment Readings at Air Monitoring Station

Radiological Environmental Monitoring Program
Environmental Report 2019 (SRNS-RP-2020-00064) 5-11
SRS ambient gamma radiation-monitoring program has four subprograms: 1) Site perimeter stations, 2) population centers, 3) air surveillance stations, and 4) onsite perimeter stations co-located with Georgia Power’s Vogtle Electric Generating Plant’s stations. SRS conducts most gamma exposure monitoring onsite and at the SRS perimeter.
SRS monitors offsite in population centers located near the Site boundary, with limited monitoring beyond at the three 25-mile air surveillance stations.
5.3.4.1 Ambient Gamma Results Summary
Appendix Table D-6 summarizes the gamma results. Ambient gamma exposure rates at all OSLD monitoring locations show some variation based on location and natural levels of background radiation in the environment. In 2019, ambient gamma exposure rates onsite varied between 71.8 mR/yr at location NRC2 (onsite southwest) and 151 mR/yr at the BGN (onsite center of the Site). Rates at population centers ranged from 92.3 mR/yr at the Windsor, South Carolina, location to 157 mR/yr at the Girard, Georgia, location.
Consistent with the previous five-year trends, ambient gamma results indicate that no significant difference in average annual dose rates exists between monitoring networks. Ambient dose rates in population centers are slightly elevated compared to the other monitoring networks, as expected, because materials present in buildings and roadways contribute to the natural background radiation.
5.3.5 Soil Surveillance
SRS conducts soil surveillance to provide the following:
• Data for long-term trending of radioactivity deposited from atmospheric fallout (both wet and dry deposition)
• Information on the concentrations of radioactive materials in the environment
In 2019, SRS collected soil samples from 5 onsite locations, 10 Site perimeter locations, and 6 offsite locations (Environmental Maps, Radiological Soil Sampling Locations). One sampling location at Creek Plantation Trail 6 was inaccessible due to vegetation overgrowth. Radionuclide concentrations in soil vary greatly among locations because of differences in the patterns, retention, and transport of rainfall in different types of soils. Therefore, a direct comparison of year-to-year data could be misleading. However, SRS evaluates the data for long-term trends.
Sampling technicians use hand augers, shovels, or other similar devices to collect soil samples to a depth of 6 inches at each sampling location. The technicians mix the soil samples from one sampling location to ensure they are homogeneous when the laboratory analyzes them for gross alpha, gross beta, gamma-emitting radionuclides, strontium-89,90, and actinides (including neptunium).
SRS Measures Environmental Gamma Exposure Rates from OSLDs Placed Across Site
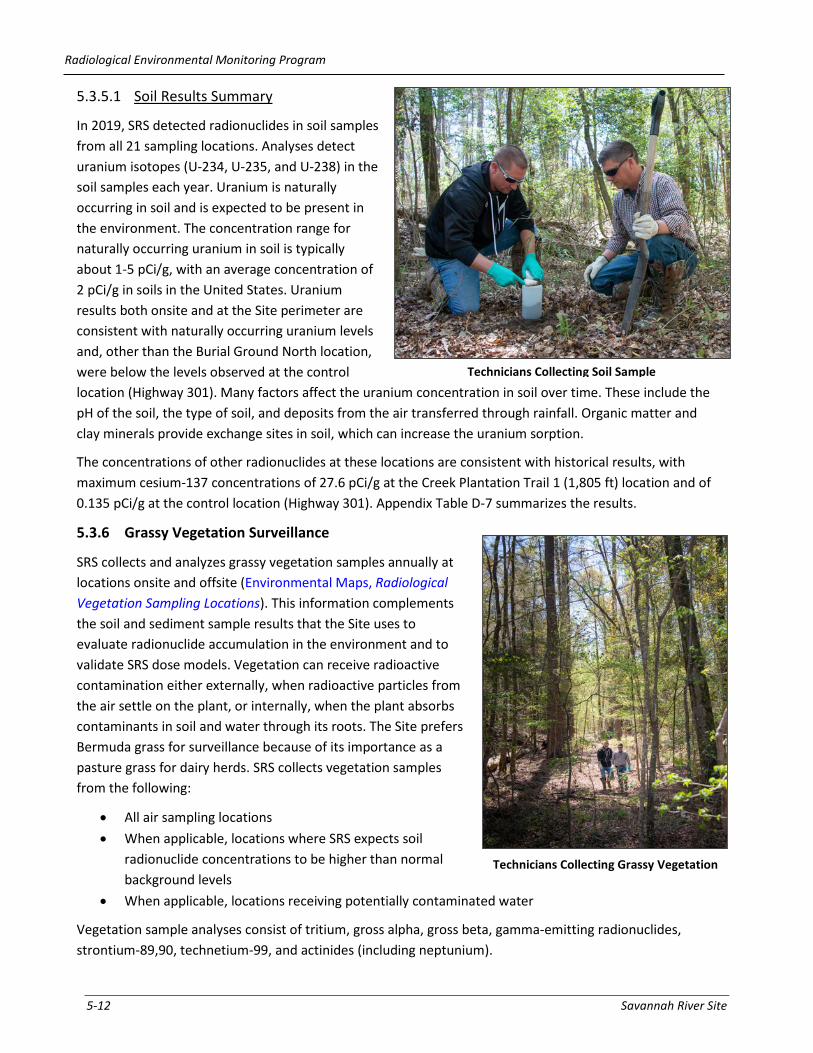
Radiological Environmental Monitoring Program
5-12 Savannah River Site
5.3.5.1 Soil Results Summary
In 2019, SRS detected radionuclides in soil samples from all 21 sampling locations. Analyses detect uranium isotopes (U-234, U-235, and U-238) in the soil samples each year. Uranium is naturally occurring in soil and is expected to be present in the environment. The concentration range for naturally occurring uranium in soil is typically about 1-5 pCi/g, with an average concentration of 2 pCi/g in soils in the United States. Uranium results both onsite and at the Site perimeter are consistent with naturally occurring uranium levels and, other than the Burial Ground North location, were below the levels observed at the control location (Highway 301). Many factors affect the uranium concentration in soil over time. These include the pH of the soil, the type of soil, and deposits from the air transferred through rainfall. Organic matter and clay minerals provide exchange sites in soil, which can increase the uranium sorption.
The concentrations of other radionuclides at these locations are consistent with historical results, with maximum cesium-137 concentrations of 27.6 pCi/g at the Creek Plantation Trail 1 (1,805 ft) location and of 0.135 pCi/g at the control location (Highway 301). Appendix Table D-7 summarizes the results.
5.3.6 Grassy Vegetation Surveillance
SRS collects and analyzes grassy vegetation samples annually at locations onsite and offsite (Environmental Maps, Radiological Vegetation Sampling Locations). This information complements the soil and sediment sample results that the Site uses to evaluate radionuclide accumulation in the environment and to validate SRS dose models. Vegetation can receive radioactive contamination either externally, when radioactive particles from the air settle on the plant, or internally, when the plant absorbs contaminants in soil and water through its roots. The Site prefers Bermuda grass for surveillance because of its importance as a pasture grass for dairy herds. SRS collects vegetation samples from the following:
• All air sampling locations • When applicable, locations where SRS expects soil
radionuclide concentrations to be higher than normal background levels
• When applicable, locations receiving potentially contaminated water
Vegetation sample analyses consist of tritium, gross alpha, gross beta, gamma-emitting radionuclides, strontium-89,90, technetium-99, and actinides (including neptunium).
Technicians Collecting Soil Sample
Technicians Collecting Grassy Vegetation

Radiological Environmental Monitoring Program
Environmental Report 2019 (SRNS-RP-2020-00064) 5-13
5.3.6.1 Grassy Vegetation Results Summary
SRS collected all annual samples. SRS detected various radionuclides in the grassy vegetation samples collected during 2019 at all air sampling locations (1 onsite, 10 at the perimeter, and 3 offsite). Appendix Table D-8 summarizes the results. All radionuclides are within the trends of the previous 10 years for all locations.
5.3.7 Terrestrial Food Surveillance
SRS personnel collect terrestrial food products grown and consumed in the communities surrounding the Site, as well as fish and shellfish caught from the Savannah River. They analyze these samples for radionuclides. The results reveal whether radionuclides are present in the environment. Tritium releases from SRS and non-SRS sources are the primary contributors to tritium in food products.
Agricultural products, livestock, and game animals that humans eat may contain radionuclides. Livestock and game animals may be exposed if the radionuclides are in the air. Radionuclides in the air can settle on grass, which animals can eat. If humans consume the meat of these exposed animals, they become exposed to radiation. Dairy cows are also livestock of concern to SRS because they produce milk that humans consume, leading to potential radiation exposure. SRS samples milk, meat, fruit, nuts, grains, and vegetables based on the potential to transport radionuclides to humans through the food chain.
Local gardens, farms, and dairies are the source of the terrestrial food products. SRS collects beef, watermelon, and greens annually. Site personnel also collect two specific crops a year, rotating through a variety of vegetables, grains, and nuts. Once a quarter, the Site collects either cow or goat milk samples. Food product samples come from each of the four quadrants surrounding SRS, which extend up to 10 miles from the Site boundary. Additionally, SRS collects a control sample to the southeast at a distance between 10 miles and 25 miles from the Site boundary.
Laboratory analysis of the food samples include gamma-emitting radionuclides, tritium, strontium-89,90, technetium-99, gross alpha, gross beta, and actinides (including neptunium). Laboratory analysis of the dairy samples include gamma-emitting radionuclides, tritium, and strontium-89,90.
5.3.7.1 Terrestrial Food Results Summary
In 2019, SRS sampled milk and the following terrestrial foodstuffs: greens, watermelons, beef, cabbage, grains. Based on availability, the collected grains were wheat and rye. SRS collected all food types from all four quadrants and the control area. Appendix Tables D-9 and D-10 summarize the foodstuffs and dairy results. The analytical results of the routine terrestrial foodstuffs and milk are consistent with 10-year trends. Results for most foodstuffs (76% for terrestrial foodstuffs and 93% for dairy) did not detect radionuclides. Over half of the detected terrestrial foodstuff results were associated with natural uranium.
Goat Milk is Included in SRS’s Dairy Sampling Program

Radiological Environmental Monitoring Program
5-14 Savannah River Site
5.4 WATER PATHWAY
The media presented in this section support the water pathway dose assessment discussed in Chapter 6, Radiological Dose Assessment. The Environmental Maps, Stream Systems, identifies SRS stream systems included in the pathway.
5.4.1 Liquid Effluents Monitoring Program
SRS routinely samples, analyzes for radionuclides, and monitors flow at each liquid effluent discharge point that releases, or has potential to release, radioactive materials. Figure 5-5 shows the effluent sampling points near SRS facilities.
Figure 5-5 Radiological Liquid Effluent Sampling Locations

Radiological Environmental Monitoring Program
Environmental Report 2019 (SRNS-RP-2020-00064) 5-15
5.4.1.1 Liquid Effluent Results Summary
Appendix Table D-11 provides SRS liquid radionuclide releases for 2019. These releases include direct releases plus the shallow groundwater migration (as discussed in Section 5.4.3) of radioactivity from SRS seepage basins and the Solid Waste Disposal Facility (SWDF). Table 5-4 summarizes the liquid effluent releases of radioactive materials. The direct releases (including migration) of tritium decreased by 20.2% (from 531 Ci in 2018 to 424 Ci).
The total amount of tritium released directly from process areas to SRS streams (not including shallow groundwater migration) during 2019 was 62.1 Ci. This is a decrease from the 91.9 Ci released in 2018. Figure 5-6 presents the tritium released by potential source area and shows that the total direct release of tritium has had a general decreasing trend over the last 10 years.
The DCS sum of fractions for all locations was less than 1.00. Appendix Table D-12 summarizes the 2019 liquid effluent sum of fractions and radionuclides detected at each outfall or facility.
Table 5-4 SRS Radiological Liquid Effluent Releasesa of Radioactive Material for CY 2019
Release Type Totals (curies)
Tritium 4.24E+02 Fission and Activation Products (half-life > 3 hr)b,c 4.02E-02
Total Radioiodine 8.92E-03 Total Radio-strontiumd 6.05E-02
Total Uranium 4.17E-02 Plutoniume 5.32E-03
Other Actinides 9.98E-05 Other 2.32E-03
a Includes direct releases and shallow groundwater migration from SRS seepage basins and SWDF b International Commission on Radiological Protection (ICRP) 107 half-life data, Nuclear Decay Data for Dosimetric Calculations (2008) c International Atomic Energy Agency (IAEA) Common Fission and Activation Products d Includes unidentified beta releases e Includes unidentified alpha releases
0
50
100
150
200
250
300
2010 2011 2012 2013 2014 2015 2016 2017 2018 2019SRNL 0 0.28 0.21 0.12 0 0 0 0.0 0.05 0Legacy Reactor Areas 83 91.5 71.6 116.8 26.1 43.8 45.2 29.9 31.7 19.3Separations Areas 144 46.5 24.1 53.3 14.5 41.8 22.9 35 60.1 42.8
Curies
Notes: 1. The Savannah River National Laboratory contribution to direct releases is minimal; thus, it is not visible on this figure. 2. Tritium releases from the separations areas are from the separations, waste management, and tritium processing facilities.
Figure 5-6 10-Year History of Direct Releases of Tritium to SRS Streams

Radiological Environmental Monitoring Program
5-16 Savannah River Site
5.4.2 Stormwater Basin Surveillance
SRS monitors the accumulated stormwater in the Site’s stormwater basins (Figure 5-7) for gross alpha, gross beta, tritium, strontium, technetium, gamma-emitting radionuclides, and carbon. Additional analytes may include actinides (including neptunium). With no active processes discharging to SRS’s stormwater basins, the accumulations in these basins are mainly stormwater runoff. SRS selects the specific radionuclides for monitoring based on the operational history of each basin. The E-Area basins receive stormwater from SWDF, the E-Area Vault, and stormwater from the controlled clean-soil pit on the east side of E Area. F-Area Pond 400 receives stormwater from F Area and the former Mixed Oxide Fuel Fabrication Facility. Z-Area Stormwater Basin receives stormwater from Z Area (Saltstone processing and disposal facilities). Stormwater basins may release to monitored outfalls during heavy rainfall.
Figure 5-7 Radiological Surface Water Sampling Locations
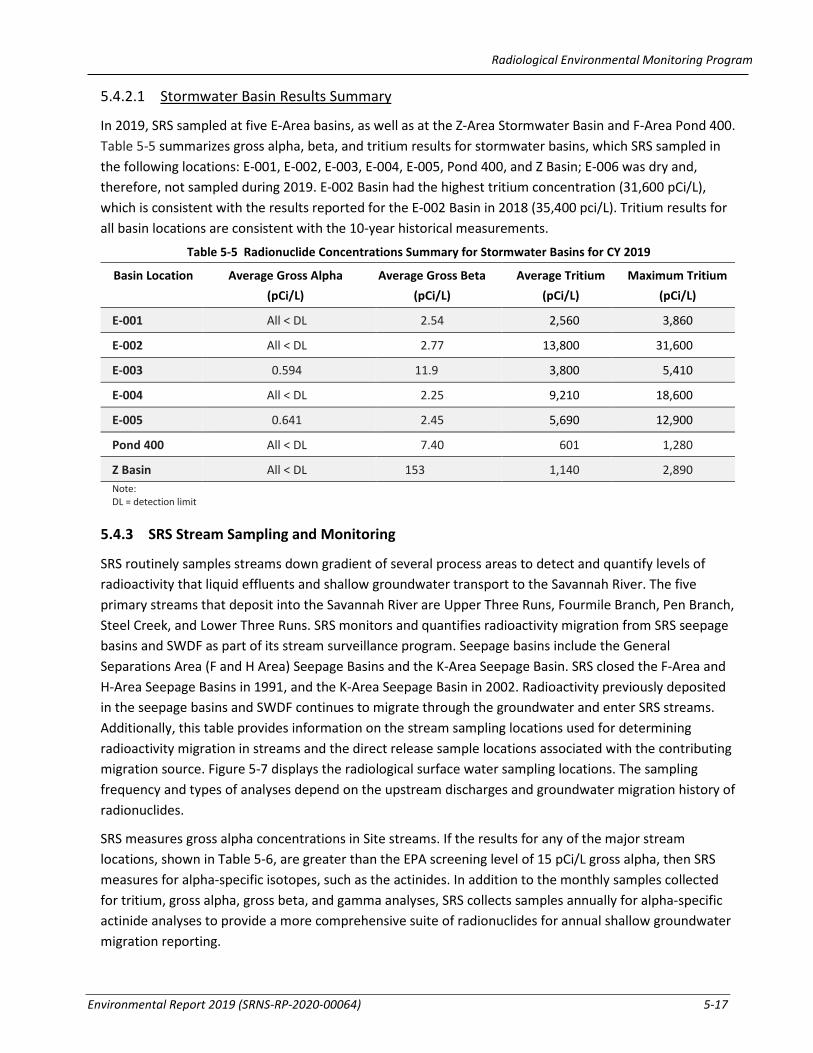
Radiological Environmental Monitoring Program
Environmental Report 2019 (SRNS-RP-2020-00064) 5-17
5.4.2.1 Stormwater Basin Results Summary
In 2019, SRS sampled at five E-Area basins, as well as at the Z-Area Stormwater Basin and F-Area Pond 400. Table 5-5 summarizes gross alpha, beta, and tritium results for stormwater basins, which SRS sampled in the following locations: E-001, E-002, E-003, E-004, E-005, Pond 400, and Z Basin; E-006 was dry and, therefore, not sampled during 2019. E-002 Basin had the highest tritium concentration (31,600 pCi/L), which is consistent with the results reported for the E-002 Basin in 2018 (35,400 pci/L). Tritium results for all basin locations are consistent with the 10-year historical measurements.
Table 5-5 Radionuclide Concentrations Summary for Stormwater Basins for CY 2019
Basin Location Average Gross Alpha (pCi/L)
Average Gross Beta (pCi/L)
Average Tritium (pCi/L)
Maximum Tritium (pCi/L)
E-001 All < DL 2.54 2,560 3,860
E-002 All < DL 2.77 13,800 31,600
E-003 0.594 11.9 3,800 5,410
E-004 All < DL 2.25 9,210 18,600
E-005 0.641 2.45 5,690 12,900
Pond 400 All < DL 7.40 601 1,280
Z Basin All < DL 153 1,140 2,890 Note: DL = detection limit
5.4.3 SRS Stream Sampling and Monitoring
SRS routinely samples streams down gradient of several process areas to detect and quantify levels of radioactivity that liquid effluents and shallow groundwater transport to the Savannah River. The five primary streams that deposit into the Savannah River are Upper Three Runs, Fourmile Branch, Pen Branch, Steel Creek, and Lower Three Runs. SRS monitors and quantifies radioactivity migration from SRS seepage basins and SWDF as part of its stream surveillance program. Seepage basins include the General Separations Area (F and H Area) Seepage Basins and the K-Area Seepage Basin. SRS closed the F-Area and H-Area Seepage Basins in 1991, and the K-Area Seepage Basin in 2002. Radioactivity previously deposited in the seepage basins and SWDF continues to migrate through the groundwater and enter SRS streams. Additionally, this table provides information on the stream sampling locations used for determining radioactivity migration in streams and the direct release sample locations associated with the contributing migration source. Figure 5-7 displays the radiological surface water sampling locations. The sampling frequency and types of analyses depend on the upstream discharges and groundwater migration history of radionuclides.
SRS measures gross alpha concentrations in Site streams. If the results for any of the major stream locations, shown in Table 5-6, are greater than the EPA screening level of 15 pCi/L gross alpha, then SRS measures for alpha-specific isotopes, such as the actinides. In addition to the monthly samples collected for tritium, gross alpha, gross beta, and gamma analyses, SRS collects samples annually for alpha-specific actinide analyses to provide a more comprehensive suite of radionuclides for annual shallow groundwater migration reporting.
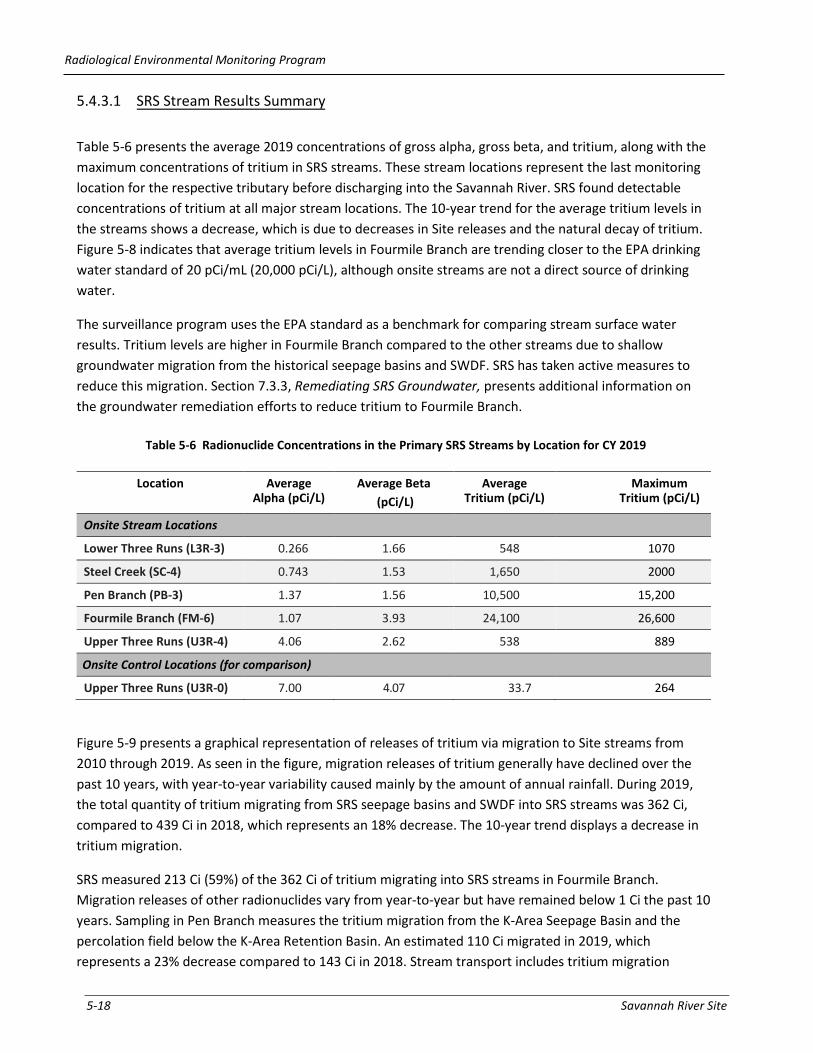
Radiological Environmental Monitoring Program
5-18 Savannah River Site
Figure 5-9 presents a graphical representation of releases of tritium via migration to Site streams from 2010 through 2019. As seen in the figure, migration releases of tritium generally have declined over the past 10 years, with year-to-year variability caused mainly by the amount of annual rainfall. During 2019, the total quantity of tritium migrating from SRS seepage basins and SWDF into SRS streams was 362 Ci, compared to 439 Ci in 2018, which represents an 18% decrease. The 10-year trend displays a decrease in tritium migration.
SRS measured 213 Ci (59%) of the 362 Ci of tritium migrating into SRS streams in Fourmile Branch. Migration releases of other radionuclides vary from year-to-year but have remained below 1 Ci the past 10 years. Sampling in Pen Branch measures the tritium migration from the K-Area Seepage Basin and the percolation field below the K-Area Retention Basin. An estimated 110 Ci migrated in 2019, which represents a 23% decrease compared to 143 Ci in 2018. Stream transport includes tritium migration
Location Average Alpha (pCi/L)
Average Beta (pCi/L)
Average Tritium (pCi/L)
Maximum Tritium (pCi/L)
Onsite Stream Locations
Lower Three Runs (L3R-3) 0.266 1.66 548 1070
Steel Creek (SC-4) 0.743 1.53 1,650 2000
Pen Branch (PB-3) 1.37 1.56 10,500 15,200
Fourmile Branch (FM-6) 1.07 3.93 24,100 26,600
Upper Three Runs (U3R-4) 4.06 2.62 538 889
Onsite Control Locations (for comparison)
Upper Three Runs (U3R-0) 7.00 4.07 33.7 264
5.4.3.1 SRS Stream Results Summary
Table 5-6 presents the average 2019 concentrations of gross alpha, gross beta, and tritium, along with the maximum concentrations of tritium in SRS streams. These stream locations represent the last monitoring location for the respective tributary before discharging into the Savannah River. SRS found detectable concentrations of tritium at all major stream locations. The 10-year trend for the average tritium levels in the streams shows a decrease, which is due to decreases in Site releases and the natural decay of tritium. Figure 5-8 indicates that average tritium levels in Fourmile Branch are trending closer to the EPA drinking water standard of 20 pCi/mL (20,000 pCi/L), although onsite streams are not a direct source of drinking water.
The surveillance program uses the EPA standard as a benchmark for comparing stream surface water results. Tritium levels are higher in Fourmile Branch compared to the other streams due to shallow groundwater migration from the historical seepage basins and SWDF. SRS has taken active measures to reduce this migration. Section 7.3.3, Remediating SRS Groundwater, presents additional information on the groundwater remediation efforts to reduce tritium to Fourmile Branch.
Table 5-6 Radionuclide Concentrations in the Primary SRS Streams by Location for CY 2019

Radiological Environmental Monitoring Program
Environmental Report 2019 (SRNS-RP-2020-00064) 5-19
releases from C-Area, L-Area, and P-Area Seepage Basins (see Section 5.4.5, Tritium Transport in Streams and Savannah River Surveillance, in this chapter).
All radionuclide results (tritium, gross alpha, gross beta, gamma analyses, and actinides) for 2019 showed no elevated levels and are consistent with historical measurements.
Figure 5-8 10-Year Trend of Tritium in Pen Branch and Fourmile Branch
Figure 5-9 Tritium Migration from SRS Seepage Basins and SWDF to SRS Streams

Radiological Environmental Monitoring Program
5-20 Savannah River Site
5.4.4 Savannah River Sampling and Monitoring
SRS routinely samples along the Savannah River at locations up and downstream of SRS tributaries, including at a location where liquid discharges from Vogtle Electric Generating Plant (VEGP) enter the river.
Five locations along the river, as shown in Figure 5-7, continued to serve as environmental surveillance points in 2019. SRS collects samples weekly at these river locations for tritium, gross alpha, gross beta, and gamma analyses. SRS also collects samples annually for strontium, technetium, and actinides to provide a more comprehensive suite of radionuclides.
5.4.4.1 Savannah River Results Summary
Table 5-7 lists the average 2019 concentrations of gross alpha, gross beta, and tritium, and the maximum 2019 concentrations of tritium at river locations. The tritium concentration levels are well below the EPA drinking water standard of 20 pCi/mL (20,000 pCi/L).
Table 5-7 Radionuclide Concentrations in the Savannah River for CY 2019
Location Average Gross Alpha (pCi/L)
Average Gross Beta (pCi/L)
Average Tritium (pCi/L)
Maximum Tritium (pCi/L)
CONTROL (RM-161) 0.122 1.92 84.1 221
RM-150.4 (VEGP) 0.157 1.92 364 2,140
RM-150 0.171 1.92 176 324
RM-141.5 0.175 1.91 237 776
RM-118.8 0.179 1.86 245 605 Tritium is the predominant radionuclide detected above background levels in the Savannah River. The combined SRS, VEGP, and Barnwell Low-Level Disposal Facility (BLLDF) tritium estimates based on concentration results at Savannah River RM 141.5 and average flow rates at RM 141.5 were 1,795 Ci in 2019 compared to 2,500 Ci in 2018. This decrease was due to decreased releases from the tritium-processing facilities. Total releases from VEGP were 1,303 Ci in 2019 compared to 1,314 Ci in 2018. Average radionuclide concentrations for gross alpha, gross beta, tritium, strontium-89,90, technetium-99, actinides, and gamma-emitting radionuclides are consistent with the results from the previous 10 years.
5.4.5 Tritium Transport in Streams and Savannah River Surveillance
Due to the mobility of tritium in water and the amount released over the course of more than 60 years of SRS operations, the Site monitors and compares the amount of tritium measured at various onsite stream sampling locations to that found at the Savannah River sampling locations. The comparison uses the following methods of calculation:
• Direct releases measured at the source—Total direct tritium releases, including releases from facility effluent discharges (discussed in Section 5.4.1) and measured shallow groundwater migration (discussed in Section 5.4.3) of tritium from SRS seepage basins and SWDF
• Stream transport, which measures the amount of tritium leaving the Site—Tritium transport in SRS streams, measured at the last sampling point before entry into the Savannah River. This includes shallow groundwater migration contributions from C-Area, L-Area, and P-Area Seepage Basins.
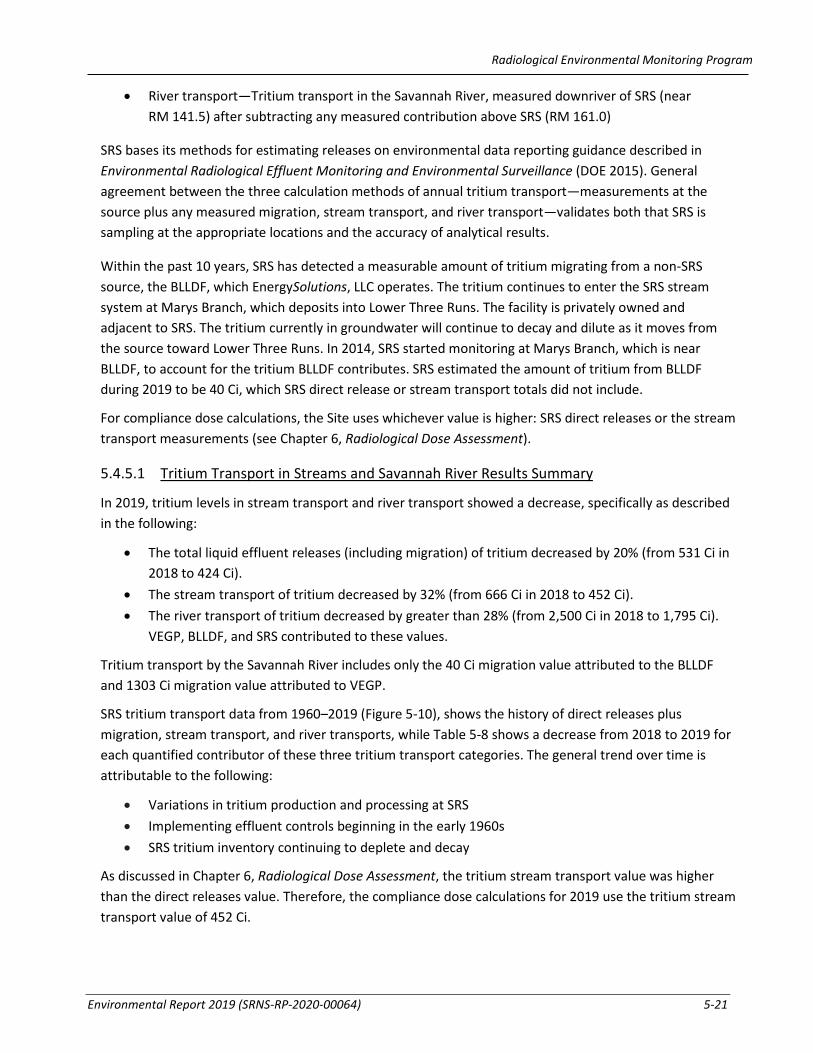
Radiological Environmental Monitoring Program
Environmental Report 2019 (SRNS-RP-2020-00064) 5-21
• River transport—Tritium transport in the Savannah River, measured downriver of SRS (near RM 141.5) after subtracting any measured contribution above SRS (RM 161.0)
SRS bases its methods for estimating releases on environmental data reporting guidance described in Environmental Radiological Effluent Monitoring and Environmental Surveillance (DOE 2015). General agreement between the three calculation methods of annual tritium transport—measurements at the source plus any measured migration, stream transport, and river transport—validates both that SRS is sampling at the appropriate locations and the accuracy of analytical results.
Within the past 10 years, SRS has detected a measurable amount of tritium migrating from a non-SRS source, the BLLDF, which EnergySolutions, LLC operates. The tritium continues to enter the SRS stream system at Marys Branch, which deposits into Lower Three Runs. The facility is privately owned and adjacent to SRS. The tritium currently in groundwater will continue to decay and dilute as it moves from the source toward Lower Three Runs. In 2014, SRS started monitoring at Marys Branch, which is near BLLDF, to account for the tritium BLLDF contributes. SRS estimated the amount of tritium from BLLDF during 2019 to be 40 Ci, which SRS direct release or stream transport totals did not include.
For compliance dose calculations, the Site uses whichever value is higher: SRS direct releases or the stream transport measurements (see Chapter 6, Radiological Dose Assessment).
5.4.5.1 Tritium Transport in Streams and Savannah River Results Summary
In 2019, tritium levels in stream transport and river transport showed a decrease, specifically as described in the following:
• The total liquid effluent releases (including migration) of tritium decreased by 20% (from 531 Ci in 2018 to 424 Ci).
• The stream transport of tritium decreased by 32% (from 666 Ci in 2018 to 452 Ci). • The river transport of tritium decreased by greater than 28% (from 2,500 Ci in 2018 to 1,795 Ci).
VEGP, BLLDF, and SRS contributed to these values.
Tritium transport by the Savannah River includes only the 40 Ci migration value attributed to the BLLDF and 1303 Ci migration value attributed to VEGP.
SRS tritium transport data from 1960–2019 (Figure 5-10), shows the history of direct releases plus migration, stream transport, and river transports, while Table 5-8 shows a decrease from 2018 to 2019 for each quantified contributor of these three tritium transport categories. The general trend over time is attributable to the following:
• Variations in tritium production and processing at SRS • Implementing effluent controls beginning in the early 1960s • SRS tritium inventory continuing to deplete and decay
As discussed in Chapter 6, Radiological Dose Assessment, the tritium stream transport value was higher than the direct releases value. Therefore, the compliance dose calculations for 2019 use the tritium stream transport value of 452 Ci.

Radiological Environmental Monitoring Program
5-22 Savannah River Site
Table 5-8 Liquid Tritium Releases and Transport
Releases/Transport (curies) CY 2018 CY 2019
Liquid Effluent Releases Direct releases 91.9 62.1 Shallow groundwater migration from Separations Areas Basins, K-Area Seepage Basins, and Percolation Field below K-Area Retention Basin
439 362
Total Liquid Effluent Releases (direct releases and migration) 531 424
Total Stream Transport Stream transport and shallow groundwater migration from C-Area, L-Area, and P-Area Seepage Basins
666 452
River Transport SRS contribution 1,150 452 VEGP contribution 1,314 1,303 BLLDF contribution 36 40
Total River Transport (SRS, VEGP, and BLLDF) 2,500 1,795 Note: For compliance dose calculations, the Site uses whichever value is higher: SRS direct releases and migration or the stream transport measurements. Therefore, in 2019, SRS used the total stream transport to calculate the dose. See Chapter 6, Radiological Dose Assessment.
Figure 5-10 SRS Tritium Transport Summary

Radiological Environmental Monitoring Program
Environmental Report 2019 (SRNS-RP-2020-00064) 5-23
5.4.6 Settleable Solids Surveillance
Settleable solids are solids in water that are heavy enough to sink to the bottom of the collection container. SRS evaluates settleable solids in water, in conjunction with routine sediment monitoring, to determine whether a long-term buildup of radioactive materials occurs in stream systems.
The DOE limits for the radioactivity levels in settleable solids are 5 pCi/g above background for alpha-emitting radionuclides and 50 pCi/g above background for beta/gamma-emitting radionuclides. Accurately measuring radioactivity levels in settleable solids is impractical in water samples with low total suspended solids (TSS). In 1995, DOE interpreted the radioactivity levels in settleable solids requirement. The interpretation indicated that TSS levels below 40 parts per million comply with the DOE limits.
To determine compliance with these limits, SRS uses TSS results gathered from radiological liquid effluent locations, National Pollutant Discharge Elimination System (NPDES) outfalls co-located at or near radiological liquid effluent locations, and water quality surveillance locations. If TSS results are regularly greater than 40 parts per million, SRS will investigate the cause and take additional water or sediment samples, or both, if necessary, to ensure compliance.
5.4.6.1 Settleable Solids Results Summary
In 2019, all TSS averages were below the 40 parts per million limit. The TSS results indicate that SRS remains in compliance with DOE’s requirement related to radioactivity levels in settleable solids.
5.4.7 Sediment Sampling
Sediment sample analysis measures the movement, deposition, and accumulation of long-lived radionuclides in streambeds and in the Savannah River bed. Year-to-year differences may be evident because sediment continuously moves and deposits at different locations in the stream and riverbeds (or because of slight variations in sampling locations). The Site can use data obtained to observe long-term environmental trends.
In 2019, SRS collected annual sediment samples at 11 Savannah River locations, 8 basin or pond locations, and 20 onsite streams or swamp discharge locations (Environmental Maps, Radiological Sediment Sampling Locations). The locations vary from year-to-year, depending on the rotation schedule agreed upon with SCDHEC, which duplicates sampling at several locations as a quality control check of the SRS program. SRS also collects duplicate samples to assess quality control, as documented in Section 8.5, Environmental Monitoring Program QC Activities.
5.4.7.1 Sediment Results Summary
Appendix Table D-13 shows the maximum of each radionuclide compared to the applicable SRS control location. The Z-Area Stormwater Basin, a posted soil contamination area, had the maximum cesium-137 concentration of 2,060 pCi/g. Soil contamination areas at SRS are locations where the contamination levels exceed 150 pCi/g for beta and gamma radionuclides. The lowest levels of cesium-137 in river, stream, and basin sediments were below detection. Table 5-9 shows the maximum sediment concentrations.

Radiological Environmental Monitoring Program
5-24 Savannah River Site
Radionuclide concentrations in SRS stream, river, and basin sediment are within historical levels. Results indicate the radioactive materials from effluent release points are not building up in the sediment at the sampling locations.
5.4.8 Drinking Water Monitoring
SRS collects drinking water samples from 10 locations at SRS and at 2 water treatment facilities that use water from the Savannah River as a source of drinking water (Environmental Maps, Domestic Water Systems).
Onsite drinking water sampling consists of samples from the large treatment plant in A Area and from five small systems as well as groundwater samples from four wells. Onsite sample analyses consist of tritium, gross alpha, gross beta, gamma-emitting radionuclides, strontium-89,90, and actinides.
SRS monitors potable water at offsite treatment facilities to ensure that SRS operations do not adversely affect the water supply and to assure that drinking water does not exceed EPA drinking water standards for radionuclides. SRS collects samples offsite from the following two South Carolina locations (Figure 5-11):
• Beaufort-Jasper Water and Sewer Authority’s Purrysburg Water Treatment Plant
• North Augusta Water Treatment Plant
SRS collects treated water from these two treatment plants, which supply water to the public. Offsite sample analyses consist of tritium, gross alpha, and gross beta.
The North Augusta Water Treatment Plant samples determine concentrations in drinking water upstream of SRS. The Beaufort-Jasper Water and Sewer Authority’s Purrysburg Water
Location Maximum Location Maximum Concentration (pCi/g)
Savannah River Sediment Steel Creek River Mouth 1.33E+00
SRS Stream Sediment R Area (Downstream of R-1) 5.10E+01
SRS Basin Sediment Z Basin 2.06E+03
Figure 5-11 Offsite Drinking Water Sampling Locations
Table 5-9 Maximum Cesium-137 Concentration in Sediments Collected in 2019

Radiological Environmental Monitoring Program
Environmental Report 2019 (SRNS-RP-2020-00064) 5-25
Treatment Plant is the furthest downriver sampling location. SRS compares these locations to evaluate potential impacts from upstream sources that include SRS.
5.4.8.1 Drinking Water Results Summary
In 2019, SRS performed gross alpha and gross beta analyses on all onsite and offsite drinking water samples. All results were well below the EPA’s 15 pCi/L alpha concentration limit and 50 pCi/L beta concentration limit. In addition, no onsite or offsite drinking water samples exceeded the 20 pCi/mL (20,000 pCi/L) EPA standard for tritium and no onsite drinking water samples exceeded the 8 pCi/L strontium-89,90 maximum contaminant level.
Figure 5-12 presents the average drinking water tritium concentrations for the local water treatment plants upstream and downstream from SRS compared to the average of weekly river water samples collected at RM 141.5. The average tritium concentration at RM 141.5 is approximately 1.2% of the EPA standard for tritium and decreases slightly at the downstream sampling location.
Sample results did not detect tritium, cobalt-60, cesium-137, strontium 89,90, uranium-235, plutonium-239, and curium-244 in onsite drinking water test locations. Sample results indicated detectable levels of americium-241 in 5 onsite samples, plutonium-238 in 2 onsite samples, uranium-234 in 10 onsite samples, and uranium-238 in 10 onsite samples. Appendix Table D-14 summarizes the results. Americium-241 concentrations are near the method detection limit, and the uranium is natural. All analytical results are well below the EPA standard.
Figure 5-12 Tritium in Offsite Drinking Water and River Mile 141.5
139 237 2290
2000400060008000
100001200014000160001800020000
North Augusta River Mile 141.5 Purrysburg
Triti
um C
once
ntra
tion
(pCi
/L)
Sample Location
Average Drinking Water 2019 Tritium Concentration (pCi/L)
EPA MCL

Radiological Environmental Monitoring Program
5-26 Savannah River Site
5.5 AQUATIC FOOD PRODUCTS
5.5.1 Fish Collection in the Savannah River
SRS collects aquatic food from the Savannah River. Freshwater fish come from six locations on the Savannah River from above SRS at Augusta, Georgia, to the Highway 301 bridge (Environmental Maps, Fish Sampling Locations). Onsite, SRS collects freshwater fish at the mouth of the streams that traverse the Site. Saltwater fish come from the Savannah River mouth near Savannah, Georgia. Additionally, shellfish come from the Savannah River mouth near Savannah or SRS purchases them from vendors in the Savannah area that harvest from local saltwater that waters of the Savannah River potentially influence. Table 5-10 identifies the aquatic products collected in 2019. SRS analyzes both edible (meat and skin only) and nonedible (bone) samples of freshwater and saltwater fish. SRS analyzes only the edible portion of shellfish. Analyses of edible samples of all aquatic species collected include gross alpha, gross beta, gamma-emitting radionuclides (that is, cesium-137 and cobalt-60), strontium-89,90, technetium-99, and iodine-129. Strontium-89,90 is the only analysis SRS conducts on the nonedible samples.
5.5.1.1 Fish in Savannah River Results Summary
In 2019, SRS collected freshwater fish from the six locations, saltwater fish and shrimp from the Savannah River mouth, and obtained crabs in the Savannah area from a supplier that harvests from saltwater potentially influenced by Savannah River water. SRS analyzed 54 freshwater fish composites, 3 saltwater fish composites, and 2 shellfish composites. The freshwater and saltwater composites consisted of three to eight fish each. The two shellfish composites consisted of one bushel of crab and one bushel of shrimp, respectively. The analytical results of the freshwater and saltwater fish, and shellfish collected are consistent with results for the previous 10 years. Most of the results for the specific radionuclides associated with SRS operations were nondetectable (65% for freshwater fish, 83% for saltwater fish, and 100% for shellfish). Table 5-11 lists the maximum concentration for those radionuclides detected in the flesh of all fish types sampled. The table also identifies the fish type and the collection location associated with the maximum concentration for each detected radionuclide. SRS did not detect cobalt-60 and iodine-129 in any fish flesh samples. Appendix Tables D-15, D-16, and D-17 for freshwater fish, saltwater fish and shellfish, respectively, summarize results for all fish and shellfish.
Gross alpha results were below the minimum detectable concentration for all saltwater and freshwater fish and shellfish. Gross beta activity was detectable in all freshwater and saltwater fish, as well as shellfish. The concentrations are consistent with results from the previous 10 years and are likely due to the naturally occurring radionuclide potassium-40.
Determining the potential dose and risk to the public, as reported in Chapter 6, Radiological Dose Assessment, includes data from the fish monitoring.
Freshwater Fish Saltwater Fish Shellfish
Bass Mullet Crab
Catfish Shrimp
Panfish
Table 5-10 Aquatic Products Collected by SRS in 2019 for the Radiological Environmental Monitoring Program

Radiological Environmental Monitoring Program
Environmental Report 2019 (SRNS-RP-2020-00064) 5-27
Table 5-11 Location and Fish Type for the Maximum Detected Concentration of Specific Radionuclides Measured in Flesh Samples Collected in 2019
5.6 WILDLIFE SURVEILLANCE
SRS holds annual hunts to reduce animal-vehicle collisions and control Site deer, coyote, and feral hog populations. The wildlife surveillance program monitors wildlife harvested from SRS and subsequently released to the public. Monitoring assesses any impact of Site operations on the wildlife populations and ensures that no individual exceeds the SRS Annual Administrative Game Animal Release Limit of 22 mrem/yr. Annual game animal hunts for deer, coyote, and feral hogs are open to the public. During 2019, SRS held a turkey hunt for Wounded Warriors and residents with mobility impairments in the spring and 12 game animal hunts in the fall. The Site holds the annual hunts to reduce animal-vehicle collisions and control Site deer, coyote, and feral hog populations.
SRS monitors all animals harvested during the annual hunts to ensure the total dose to any individual is below the SRS 22 mrem/yr limit. SRS uses portable sodium iodide detectors to perform field analyses for cesium-137.
SRS uses the cesium-137 concentration detected in the edible flesh of the animal to calculate dose. SRS assigns a dose to each hunter for every animal harvested if the cesium-137 concentration is above the background concentration of 1.97 picocuries per gram (pCi/g) for hogs (Morrison et al., 2019) and 2.59 pCi/g for the deer and coyote (Aucott et al., 2017). In addition to the field monitoring, SRS collects samples of muscle for laboratory analysis of cesium-137 concentrations in both deer and hogs based on the following: 1) a set frequency, 2) the field measured cesium-137 levels, or 3) exposure limit considerations. These laboratory-analyzed data provide a quality-control check on the field monitoring results.
Cesium-137 is chemically similar to and behaves like potassium in the environment. Cesium-137 has a half-life of about 30 years and tends to persist in soil, where it can readily enter the food chain through plants. Nuclear weapons detonations have distributed it widely throughout the world from 1945 to 1980; it is present at low levels in all environmental media. Flesh sample laboratory analyses also include cobalt-60, strontium-89,90, gross alpha, and gross beta. SRS collects bone samples at the same frequency as the flesh samples and analyzes them in the laboratory for strontium-89,90.
Radionuclide Maximum Concentration Location Fish Type
Cesium-137 0.438 pCi/g Lower Three Runs Creek river mouth
Bass
Strontium-89,90 0.00897 pCi/g Lower Three Runs Creek river mouth
Panfish
Technetium-99 0.139 pCi/g Highway 301 Bridge Area
Bass

Radiological Environmental Monitoring Program
5-28 Savannah River Site
5.6.1 Wildlife Results Summary
During the hunts in 2019, SRS monitored a total of 179 deer, 35 feral hogs, 5 coyotes, and 19 turkeys. SRS did not assign a dose to any hunter during the 2 turkey hunts and 4 of the 12 game animals hunts. This indicates that all animals harvested during those hunts were at or below the background cesium-137 concentration of 1.97 pCi/g for the hogs and 2.59 pCi/g for all other animals. All animals harvested during the 2019 hunts were below the administrative game animal release limit of 22 mrem and were cleared to be released.
SRS collected one nuisance animal, an alligator, from the K-18 basin. Once the alligator was euthanized, the Site sampled its muscle tissue and analyzed it for Co-60, Cs-137, gross alpha activity, and gross beta activity. The results of Co-60 and gross alpha activity were below method detection limits. The concentration of Cs-137 in the alligator flesh was below the average concentrations of the flesh harvested from deer and hogs.
Appendix Table D-18 summarizes the muscle and bone laboratory sample results from a subset of the monitored deer, hogs, and the alligator. As seen in previous years, laboratory analysis detected cesium-137 in muscle tissue. Laboratory analysis detected strontium-89,90, a beta-emitting radionuclide, in bone and in some muscle tissue.
Generally, the cesium-137 concentration field detectors measure is similar to that of laboratory methods. Table 5-12 summarizes all field and laboratory measurements. Average cesium-137 concentrations in deer have indicated an overall decreasing trend for the past 50 years, with relatively little change in the last 10 years.
a During the hunts in 2019, five coyotes were acquired. However, the Site field monitored only two due to encountering equipment issues.
Figure 5-13 shows the historical trend analysis from the Hunter Dose Tracking System (HDTS) for the average cesium-137 concentration in deer tissue from 1965-2019. The HDTS is a two-component system, consisting of: 1) detector, and 2) a database that contains the hunters’ identification numbers and their respective cumulative dose attributed to consuming the flesh of game animals onsite.
Because its chemistry is similar to that of calcium, strontium exists at higher concentration in bone than in muscle tissue. In 2019, all 26 deer bone and all 6 hog bone samples had detectable levels of strontium-89,90. Strontium-89,90 was detected in deer bone with an average of 3.16 pCi/g and a
Number of Animals
Field Monitored
Field Gross Average Cs-137 Conc.
(pCi/g)
Field Maximum
Cs-137 Conc.
(pCi/g)
Number of Samples
Collected for Laboratory
Analysis
Number of
Detected Results
Lab Average Cs-137 Conc.
(pCi/g)
Lab Maximum
Cs-137 Conc.
(pCi/g) Deer 179 1.02 8.47 26 26 0.698 1.35
Hog 35 2.40 13.66 6 6 0.678 2.06
Coyote a 2 2.40 3.14 ----- ----- ----- -----
Turkey 19 1.21 1.39 ----- ----- ----- -----
Alligator 0 ----- ----- 1 1 0.154 0.154
Table 5-12 Cesium-137 Results for Laboratory and Field Measurements in Wildlife for CY 2019

Radiological Environmental Monitoring Program
Environmental Report 2019 (SRNS-RP-2020-00064) 5-29
maximum of 6.32 pCi/g. Strontium-89,90 was detected in hog bone with an average of 1.96 pCi/g and a maximum of 3.73 pCi/g.
For the deer muscle tissue samples, 1 out of the 26 muscle tissue samples had levels greater than the minimum detectable concentration for strontium-89,90, with a maximum concentration of 0.00541 pCi/g. These average results are similar to those of previous years. All cobalt-60 results were not detectable. Gross beta activity, detected in all samples, is consistent with 2008 through 2018 results.
Chapter 6, Radiological Dose Assessment, presents the calculation of dose from consuming wildlife harvested on SRS.
0
5
10
15
20
1965 1970 1975 1980 1985 1990 1995 2000 2005 2010 2015 2020
Aver
age
Cs-1
37 C
once
ntra
tion
inDe
er T
issue
(pCi
/g)
Year
Old HDTS minimum detectable activity (MDA)
New HDTS MDA
Figure 5-13 Historical Trend of Average Cesium-137 Concentration in Deer Tissue (1965—2019)
Radiological Environmental Monitoring Program
5-30 Savannah River Site
This page intentionally left blank

A-6-1 Savannah River Site Environmental Report 2019 (SRNS-RP-2020-00064) 6-1
6 RADIOLOGICAL DOSE ASSESSMENTS
2019 Highlights Dose to the Offsite Representative Person—To comply with the DOE all-pathway dose limit of 100 mrem/yr, SRS conservatively adds the doses to the offsite representative person from both Site liquid and air pathways. In 2019, the dose to the offsite representative person was 0.16 mrem from liquid releases and 0.018 mrem from air releases. The total representative person dose was 0.18 mrem, which is 0.18% of the 100 mrem/yr DOE dose limit.
epartment of Energy (DOE) Order 458.1, “Radiation Protection of the Public and the Environment,” establishes dose limits for the public and plants and animals that are onsite. DOE establishes these dose limits to protect the public and environment from the potential effects of radiation released during radiological operations. To document that radiation exposure does not exceed the DOE public dose limit of 100 millirem/year (mrem/yr), the Savannah River Site (SRS) calculates the potential dose to the public from radioactive releases in air and water through all reasonable exposure pathways. SRS also considers and quantifies exposure pathways that are nontypical and not included in the standard dose calculations to the representative person. These apply to conservative and unlikely scenarios, such as a member of the public eating fish caught only from the mouths of SRS streams, or to special scenarios, such as hunters who participate in onsite hunts. In addition, DOE Order 458.1 establishes authorized surface contamination limits, which allow SRS to release personal and real property unconditionally. SRS performs radiological surveys on all equipment considered for release and follows applicable procedures.
D Chapter 6: Radiological Dose Assessment
Comparison of DOE’s 100 mrem/yr Dose Limit to SRS’s 2019 All-Pathway Dose of 0.18 mrem
Radiological Dose Assessment
6-2 Savannah River Site 6-2 Savannah River Site
6.1 INTRODUCTION
Routine SRS operations release controlled amounts of radioactive materials to the environment through air and water. These releases could expose people offsite to radiation. To confirm that this exposure is below public dose limits, SRS calculates annual dose estimates using environmental monitoring and surveillance data, combined with relevant Site-specific data (such as weather conditions, population characteristics, and river flow). SRS also confirms that the potential doses to plants and animals (biota) living onsite remain below the DOE biota dose limits. This chapter explains radiation doses, describes how SRS calculates doses, and presents the estimated doses from SRS activities for 2019.
Radiological Impact of 2019 Operations at the Savannah River Site (Stagich, Jannik, and Dixon 2020) details SRS dose calculation methods and results. To calculate the potential doses to the public, SRS used the data from the monitoring programs described in Chapter 5, Radiological Environmental Monitoring Program.
2019 Highlights (continued) Sportsman Doses
• Onsite Hunter—SRS conducts annual hunts to control onsite deerand wild hog populations. SRS determines the estimated potentialdose from eating harvested deer or hog meat for every onsitehunter. The maximum potential dose was 17.4 mrem, or 17.4% ofthe 100 mrem/yr DOE dose limit.
• Creek Mouth Fisherman—SRS estimated the maximum potentialdose from fish consumption from bass collected at the mouth ofLower Three Runs at 0.227 mrem. This dose is 0.227% of the100 mrem/yr DOE dose limit. SRS bases this hypothetical dose on thelow probability that, during 2019, a fisherman consumed 53 pounds(lbs) of bass caught exclusively from the mouth of Lower Three Runs.
Release of Material Containing Residual Radioactivity—SRS did not release any real property (land or buildings) in 2019. SRS unconditionally released 10,325 items of personal property (such as tools) from radiological areas. Most of these items did not leave SRS but were reused elsewhere on the Site. Therefore, these items required no additional radiological controls post-survey, as they met DOE Order 458.1 release criteria.
Radiation Dose to Aquatic and Terrestrial Biota— SRS evaluates plant and animal doses for water and land systems using the RESRAD Biota model (version 1.8) (SRS EDAM 2017). This model is a graded approach for evaluating radiation doses to aquatic and terrestrial biota to comply with DOE Order 458.1. For 2019, all SRS water, sediment, and soil locations passed the screening and did not require further assessments.
Environmental Report 2019 (SRNS-RP-2020-00064) 6-3
Radiological Dose Assessment
6.2 WHAT IS RADIATION DOSE?
Radiation dose to a person is the amount of energy the human body absorbs from a radiation source located either inside or outside of the body. SRS typically reports dose in millirem (mrem), which is one-thousandth of a rem. A rem is a standard unit used to measure the amount of radiation deposited in human tissue.
Humans, plants, and animals potentially receive radiation doses from natural and manmade sources. The average annual background dose for all people living in the United States is 625 mrem (NCRP 2009). This includes an average background dose of 311 mrem from naturally occurring radionuclides found in our bodies, in the earth, and from cosmic radiation, such as from the sun. Manmade sources and their doses include medical procedures (300 mrem), consumer products (13 mrem), and industrial and occupational exposures from facilities such as SRS (less than 1 mrem).
DOE has established dose limits to the public so that DOE operations will not contribute significantly to this average annual exposure. DOE Order 458.1 (DOE 2013) establishes 100 mrem/yr (1 millisievert [mSv]/yr) as the annual dose limit to a member of the public. Exposure to radiation primarily occurs through the following pathways, which Figure 6-1 illustrates:
• Inhaling air • Ingesting water and food • Absorbing through skin • Direct (external) exposure to radionuclides in soil, air,
and water
6.3 CALCULATING DOSE
To comply with DOE Order 458.1, SRS can calculate dose to the maximally exposed individual (MEI) or to a representative person. The MEI is usually assumed to be an adult male, and the representative person is representative of all ages and genders of the highly exposed individuals in the population. Since 2012, SRS has used the representative person concept to determine whether the Site is complying with the DOE public dose limit. SRS calculates the representative person dose using site-specific reference person parameters. The SRS representative person falls at the 95th percentile of national and regional data. The applicable national and regional data used are from the U.S. Environmental Protection Agency’s (EPAs) Exposure Factors Handbook, 2011 Edition (EPA 2011).
Chapter 6—Key Terms
Exposure pathway is the way that releases of radionuclides into the water and air could impact a person.
Maximally exposed individual is a hypothetical member of the public (typically an adult male) who lives near the SRS boundary and would, when all potential routes of exposure from a facility’s operations are considered, receive the greatest possible dose equivalent
Reference person is a hypothetical person with average physical and physiological characteristics— including factors such as age and gender—used internationally to standardize radiation dose calculations.
Representative person is a hypothetical individual receiving a dose that is representative of highly exposed individuals in the population. The calculations incorporate age, gender, food and water consumption, and breathing rate. At SRS, the representative person equates to the 95th percentile of applicable national human-use radiation exposure data.

Radiological Dose Assessment
6-4 Savannah River Site
6-4 Savannah River Site
Figure 6-1 Exposure Pathways to Humans from Air and Liquid Effluents
The reference person is weighted based on gender and age. The International Commission on Radiation Protection Publication 89, (ICRP 2002) groups these ages as: Infant (0 years), 1 year, 5 years, 10 years, 15 years, and Adult (17 years and older). The reference person accounts for the fact that younger people are generally more sensitive to radioactivity than older people. SRS also developed human usage parameters at the 50th percentile for calculating dose to a “typical” person when determining population doses. The SRS report Site-Specific Reference Person Parameters and Derived Concentration Standards for SRS (Stone and Jannik 2013) documents SRS-specific reference and typical person usage parameters. The SRS report Land and Water Use Characteristics and Human Health Input Parameters for Use in Environmental Dosimetry and Risk Assessments at the Savannah River Site (Jannik and Stagich 2017) documents all other applicable land- and water-use parameters in the dose calculations. These parameters include local characteristics of food production, river recreational activities, and other human usage parameters required in SRS models to calculate radiation dose exposure.
To determine whether the Site is complying with DOE public dose requirements, SRS calculates the potential doses to members of the public from Site effluent releases of radioactive materials (air and liquid) for the following scenarios:
• Representative person living near the SRS boundary • Adult person working at the Three Rivers Landfill located on SRS (near B Area) • Population living within a 50-mile (80-kilometer [km]) radius of SRS’s H Area
For all routine environmental dose calculations, SRS uses environmental transport and dose models based on codes the Nuclear Regulatory Commission (NRC) developed (NRC 1977). The NRC-based transport models use DOE-accepted methods, consider all significant exposure pathways, and permit detailed

Environmental Report 2019 (SRNS-RP-2020-00064) 6-5
Radiological Dose Assessment
analysis of the effects of routine operations. To demonstrate compliance with DOE Order 458.1, SRS uses the MAXDOSE-SR and POPDOSE-SR codes for air releases (representative person and population, respectively) and LAPTAP XL© for liquid releases. The SRS Environmental Dose Assessment Manual (Jannik 2017) describes these models.
At SRS, the dose to a representative person is based on the following:
1) SRS-specific reference person usage parameters at the 95th percentile of appropriate national or regional data (Stone and Jannik 2013).
2) Reference person (gender- and age-averaged) ingestion and inhalation dose coefficients from the DOE Derived Concentration Technical Standard, DOE-STD-1196-2011 (DOE 2011).
3) External dose coefficients derived from EPA’s Federal Guidance Report (FGR) #15 (EPA 2019). FGR #15 is a revision to FGR #12 (EPA 1993), which incorporated age-specific external dose coefficients. SRS used these age-specific values to develop reference-person external dose coefficients in a method similar to that documented in DOE 2011. SRS started using these newly developed reference person external dose coefficients in 2019. The SRS report Updated External Exposure Dose Coefficients, SRNL-L3200-2020-00014 (Laird and Jannik 2020) documents the external dose coefficients used.
6.3.1 Weather Database
Complete and accurate weather (meteorological) data are important to determine offsite contamination levels. SRS calculated potential offsite doses from radioactive releases to the air with quality-assured weather data from 2007 to 2011 (Viner 2013).
Figure 6-2 presents the H-Area wind rose plot for 2007-2011 and shows the direction and frequency the wind blows. SRS bases its wind rose plot in H Area because it is where most of SRS’s radiological air releases occur. As shown, the wind blows the most towards the East-Northeast sector (about 9% of the time), but there is no strongly prevalent wind direction.
6.3.2 Population Database and Distribution
SRS calculates the collective (population) doses from air releases for the population within a 50-mile radius of the H Area, which is the location of most of the Site’s radiological releases. Based on the U.S. Census Bureau’s 2010 data, the population within a 50-mile radius of H Area is 803,370 people. This translates to about 107 people per square mile outside the SRS boundary, with the largest concentration in the Augusta metropolitan area.
Table 6-1 presents the number of people currently served by the three drinking water supply plants that are downriver of SRS.
Figure 6-2 2007–2011 Wind Rose Plot for H Area (Showing Direction and Frequency Toward Which the Wind Blows)

Radiological Dose Assessment
6-6 Savannah River Site
6-6 Savannah River Site
Table 6-1 Regional Water Supply Service
The total population dose from routine SRS liquid releases is the sum of the following five contributing categories:
1) Consumers of water from Beaufort-Jasper Water and Sewer Authority (BJWSA) 2) Consumers of water from City of Savannah Industrial and Domestic (I&D) Domestic Water Supply
Plant 3) Consumers of fish and invertebrates of Savannah River origin 4) Participants of recreational activities on the Savannah River 5) Gardeners and farmers irrigating foodstuffs with river water near River Mile (RM) 141.5
6.3.3 River Flow Rate Data
The annual rate of flow in the Savannah River, which varies greatly from year to year, is an important criterion for determining down-river concentrations of the contaminants SRS releases. The U.S. Geological Survey (USGS) measures Savannah River flow rates downriver of SRS at its RM 118.8 gauging station near the U.S. Hwy 301 Bridge.
Figure 6-3 provides the river flow rates USGS measured at this location from 1954 to 2019. It also shows that the average river flow rate for these years is about 9,900 cubic feet per second (cfs). However, in the last 10 years, there has been a downward trend in these data, with an average measured flow rate of 8,353 cfs.
Water Supply Plant Nearest City Population Served
City of Savannah I&D Port Wentworth, Georgia 35,000 people
BJWSA Chelsea Water Treatment Plant Beaufort, South Carolina 100,622 people
BJWSA Purrysburg Water Treatment Plant Beaufort, South Carolina 76,538 people
Figure 6-3 Savannah River Annual Average Flow Rates Measured by USGS at River Mile 118.8
0
5,000
10,000
15,000
20,000
25,000
1954 1959 1964 1969 1974 1979 1984 1989 1994 1999 2004 2009 2014 2019
Annu
al A
vera
ge F
low
Rat
e (c
fs)
Year

Environmental Report 2019 (SRNS-RP-2020-00064) 6-7
Radiological Dose Assessment
For 2019, SRS used a calculated “effective” Savannah River flow rate of 8,481 cfs in the dose calculations. The 2019 effective flow rate is about 50% more than the 2018 effective flow rate of 5,667 cfs. This effective flow rate (based on actual measured tritium concentrations in the river) is more conservative than the 2019 USGS measured flow rate of 10,968 cfs (based on daily flow rates). By using a more conservative method, the calculated effective flow rate assumes radioactive material is less diluted and, therefore, increases the estimated potential dose.
6.4 OFFSITE REPRESENTATIVE PERSON DOSE CALCULATION RESULTS
To determine whether the Site is complying with DOE public dose requirements, SRS calculates the potential offsite doses from Site effluent releases of radioactive materials in air and liquid pathways for a representative person living near the SRS boundary. SRS calculates the pathways individually and then adds the two results to obtain the total representative person dose.
6.4.1 Liquid Pathway
6.4.1.1 Liquid Release Source Terms
Table 6-2 shows, by radionuclide, the amount of radioactivity in liquid form that SRS released in 2019. SRS uses these release amounts in the dose calculations. Chapter 5, Radiological Environmental Monitoring Program, discusses these sources of data.
Tritium accounts for more than 99% of the total amount of radioactivity released from the Site to the Savannah River. In 2019, SRS released a total of 452 curies of tritium to the river, a 32% decrease from the 2018 amount of 666 curies. For compliance dose calculations, SRS used the stream transport measurement (452 curies), which was higher than the measured direct release total (424 curies).
During 2019, in addition to the 452 curies SRS released, the Georgia Power Company’s Vogtle Electric Generating Plant (VEGP) released 1,303 curies of tritium to the Savannah River, and about 40 curies migrated from the Barnwell Low-Level Disposal Facility (BLLDF). In Table 6-2, SRS used the “river transport” total of 1795 curies of tritium, which includes SRS, VEGP, and BLLDF contributions. Refer to Chapter 5, Radiological Environmental Monitoring Program, Section 5.4.5 for details concerning these measurements.
Radionuclide Concentrations in Savannah River Water, Drinking Water, and Fish—SRS measures concentrations of tritium in the river water and cesium-137 in fish at several locations along the Savannah River. SRS uses these direct measurements to make dose determinations. The amounts of all other radionuclides SRS released are so small that conventional analytical techniques usually cannot detect their concentration in the Savannah River. SRS calculates the concentrations in the river based on the annual release amounts and river flow rates and then compares them to the Safe Drinking Water Act, 40 CFR 141 (EPA 2000) maximum contaminant level (MCL) for each radionuclide.

Radiological Dose Assessment
6-8 Savannah River Site
6-8 Savannah River Site
Radionuclide Concentrations in River Water and Treated Drinking Water—Table 6-2 shows the measured concentrations of tritium in the Savannah River near RM 141.5 and at the BJWSA Purrysburg Water Treatment Facility, which is representative of the BJWSA Chelsea and the City of Savannah I&D water treatment plants. These downriver tritium concentrations include tritium releases from SRS, the VEGP, and BLLDF. In 2019, the 12-month average tritium concentration measured in Savannah River water near RM 141.5 was 237 picocuries per liter (pCi/L). This concentration is well below EPA’s MCL for tritium of 20,000 pCi/L. Table 6-2 also provides the calculated concentrations for the other released radionuclides and a comparison of these concentrations to EPA’s MCLs. As shown, all radionuclide concentrations are well below the MCLs.
Nuclide Curies Released
12-Month Average Concentration (pCi/L) Below SRSa
BJWSA Purrysburg Plantb
EPA MCLc
H-3d 1.80E+03 2.37E+02 2.29E+02 2.00E+04
C-14 1.53E-02 2.02E-03 1.95E-03 2.00E+03
Sr-90 1.31E-02 1.73E-03 1.67E-03 8.00E+00
Tc-99 1.66E-02 2.19E-03 2.12E-03 9.00E+02
I-129 8.92E-03 1.18E-03 1.14E-03 1.00E+00
Cs-137e 2.10E-01 2.77E-02 2.68E-02 2.00E+02
Ra-226 2.32E-03 3.06E-04 2.96E-04 5.00E+00
U-234 1.93E-02 2.55E-03 2.46E-03 1.03E+01
U-235 3.62E-04 4.78E-05 4.61E-05 4.67E-01
U-238 2.20E-02 2.90E-03 2.80E-03 1.00E+01
Np-237 8.61E-05 1.14E-05 1.10E-05 1.50E+01
Pu-238 1.21E-04 1.60E-05 1.54E-05 1.50E+01
Pu-239 9.38E-06 1.24E-06 1.20E-06 1.50E+01
Am-241 1.16E-05 1.53E-06 1.48E-06 1.50E+01
Cm-244 2.17E-06 2.86E-07 2.77E-07 1.50E+01
Alpha 4.91E-03 6.48E-04 6.26E-04 1.50E+01
Beta 4.18E-02 5.51E-03 5.33E-03 8.00E+00 a Near Savannah River Mile 141.5, downriver of SRS near the Steel Creek mouth b Beaufort-Jasper Water and Sewer Authority, drinking water at the Purrysburg Water Treatment Plant c MCLs for uranium based on radioisotope specific activity X 30 µg/L X isotopic abundance d Actual measurements of the Savannah River water at the various locations are the basis for the tritium concentrations and source term. They
include contributions from VEGP and the BLLDF. In 2019, SRS used the effective river flow rate of 8,481 cfs (see Section 6.3.3) to calculate all other radionuclide concentrations.
e Depending on which value is higher, the Cs-137 release total is based on concentrations measured in Steel Creek fish or on the actual measured effluent + migration release total from the site. (see section “Radionuclide Concentrations in Fish” below)
Table 6-2 2019 Liquid Release Source Term and 12-Month Average Downriver Radionuclide Concentrations Compared to the EPA’s Drinking Water Maximum Contaminant Levels (MCL)

Environmental Report 2019 (SRNS-RP-2020-00064) 6-9
Radiological Dose Assessment
Radionuclide Concentrations in Fish—Consuming fish is an important dose pathway for the representative person. Fish exhibit a high degree of bioaccumulation for certain elements. For cesium (including radioactive isotopes of cesium, such as cesium-137), the bioaccumulation factor for Savannah River fish is estimated at 3,000, meaning that the cesium concentration in fish flesh is about 3,000 times the concentration of cesium found in the water in which the fish live (Carlton et al. 1994).
Because of this high bioaccumulation factor, SRS can detect cesium-137 more easily in fish flesh than in river water. Therefore, when conservative to do so, SRS bases the fish pathway dose from cesium-137 directly on analyzing the fish collected from the location of the hypothetical representative person, which is near the mouth of Steel Creek, at RM 141.5. In 2019, SRS used the Steel Creek fish concentrations to determine the Site’s overall cesium-137 release value of 0.210 Ci, which is conservatively higher than the measured cesium-137 effluent release value of 0.008 Ci.
6.4.1.2 Dose to the Representative Person SRS estimates the 2019 potential dose to the representative person from all liquid pathways (including irrigation) to be 0.16 mrem (0.0016 mSv), which is 17% less than the comparable dose in 2018. Table 6-3 shows that the total liquid pathway dose is 0.16% of the DOE public dose limit of 100 mrem/yr (1 mSv/yr).
About 25% of the 2019 total dose to the representative person is from consuming vegetables that have been grown and meat and milk from animals that have been raised using Savannah River water from RM 141.5. The fish consumption pathway accounted for 63%, and the drinking water pathway accounted for 5%. As Figure 6-4 shows, cesium-137 (69%) and technetium (11%) contributed the most to the liquid pathway dose.
Dose (mrem)
Applicable Limit (mrem)
Percent of Limit (%)
Near Site Boundary (All Liquid Pathways) All Liquid Pathways Except Irrigation
0.11
Irrigation Pathways 0.05
Total Liquid Pathways 0.16 100a 0.16%
a DOE dose limit: 100 mrem/yr (DOE Order 458.1)
SRS Samples Fish from the Savannah River Using Electrofishing Methods. Radionuclide Concentrations
in Fish Harvested from the Steel Creek Mouth are Used in the Representative Person Dose Calculations.
Table 6-3 Potential Dose to the Representative Person from SRS Liquid Releases in 2019

Radiological Dose Assessment
6-10 Savannah River Site
6-10 Savannah River Site
6.4.1.3 Drinking Water Pathway Dose
People living downriver of SRS may receive some dose by drinking water that contains radioactive releases from the Site. Tritium in downriver drinking water represented the highest percentage of the dose (about 78%) customers of the three downriver water treatment plants received.
In 2019, SRS-only releases were responsible for a maximum potential drinking water dose of 0.0076 mrem (0.000076 mSv). This dose is about 37% less than the 2018 dose of 0.012 mrem. SRS attributes this decrease to the 50% increase in the Savannah River effective flow rate during 2019, which caused more dilution. DOE and EPA do not have a specific regulatory drinking water dose limit, but EPA bases its MCLs, as defined in 40 CFR 141 (EPA 2000), on a potential dose of about 4 mrem/yr for beta and gamma emitters. The 2019 maximum drinking water dose of 0.0076 mrem is well below this value.
6.4.1.4 Collective (Population) Dose
SRS calculates the collective drinking water consumption dose for the separate population groups that are customers of the BJWSA and City of Savannah I&D water treatment plants. Calculations of collective doses from agricultural irrigation assume that major food types (vegetables, milk, and meat) grow or originate from animals kept on 1,000-acre parcels of land in the SRS area, with the population within 50 miles of SRS consuming all the food produced on these 1,000-acre parcels.
SRS calculates the collective dose in person-rem as the average dose per typical person, multiplied by the number of people exposed. DOE Order 458.1 requires that SRS calculate and report a collective dose, but there is not a separate collective dose limit for comparison. In 2019, the collective dose from all liquid pathways was 2.1 person-rem (0.021 person-Sv).
6.4.2 Air Pathway
6.4.2.1 Air Release Source Terms
Chapter 5, Radiological Environmental Monitoring Program, documents the 2019 radioactive air release quantities used as the source term in SRS dose calculations. Tritium accounts for most of the dose from SRS air releases.
Tri tium4%
Cs-13769%
Tc-9911%
I-1292%
U-2341%
U-2382%
Ra-2262%
Sr-902%
Alpha2%
Beta5%
Al l Other<1%
Tritium Cs-137 Tc-99 I-129 U-234 U-238 Ra-226 Sr-90 Alpha Beta All Other
Figure 6-4 Radionuclide Contributions to the 2019 SRS Total Liquid Pathway Dose of 0.16 mrem (0.0016 mSv)

Environmental Report 2019 (SRNS-RP-2020-00064) 6-11
Radiological Dose Assessment
6.4.2.2 Air Concentrations
SRS uses calculated radionuclide concentrations instead of measured concentrations for dose determinations because conventional analytical methods do not detect most of the radionuclides SRS released in the air samples collected at the Site perimeter and offsite locations. However, SRS can routinely measure tritium concentrations at locations along the Site perimeter and compare these results with the calculated concentrations to confirm the dose models. In 2019, this comparison showed that the dose models used at SRS were about 1.5 to 2.5 times more conservative than the actual measured tritium concentrations.
6.4.2.3 Dose to the Representative Person
The 2019 estimated dose from air releases to the representative person is 0.018 mrem (0.00018 mSv), 0.18% of the EPA air pathway limit of 10 mrem per year. DOE Order 458.1 requires that all DOE sites comply with EPA’s NESHAP regulations. Table 6-4 compares the representative person dose with the EPA dose limit of 10 mrem/yr. The 2019 dose is 78% lower than the 2018 dose of 0.082 mrem (0.00082 mSv). SRS attributes most of this decrease to the 79% decrease in tritium oxide releases during 2019. Refer to Chapter 5, Radiological Environmental Monitoring Program, Section 5.3.2 for details concerning these measurements. The air pathway representative person is located at the SRS boundary in the north compass point direction, near New Ellenton, South Carolina.
Table 6-4 Potential Doses to the Representative Person and to the MEI from SRS Air Releases in 2019 and Comparison to the Applicable Dose Limit
DOE Representative Person
(MAXDOSE-SR) EPA NESHAP MEI
(CAP88-PC)
Calculated dose (mrem) 0.018 0.018
Applicable Limit (mrem) 10a 10b
Percent of Limit (%) 0.18 0.18
a DOE: DOE Order 458.1 b EPA: (NESHAP) 40 CFR 61, Subpart H
As Figure 6-5 shows, tritium releases were 67% of the air pathway dose to the representative person. Iodine-129 accounted for 23% of the dose. Krypton-85 (3%), cesium-137 (2%), strontium-90 (1%), and plutonium-239 (1%) were the only other individual radionuclides that contributed more than 1% to the representative person dose.
The major ways a representative person received radiation dose from air releases were consuming vegetables (39%), inhalation (30%), and consuming cow milk (22%).
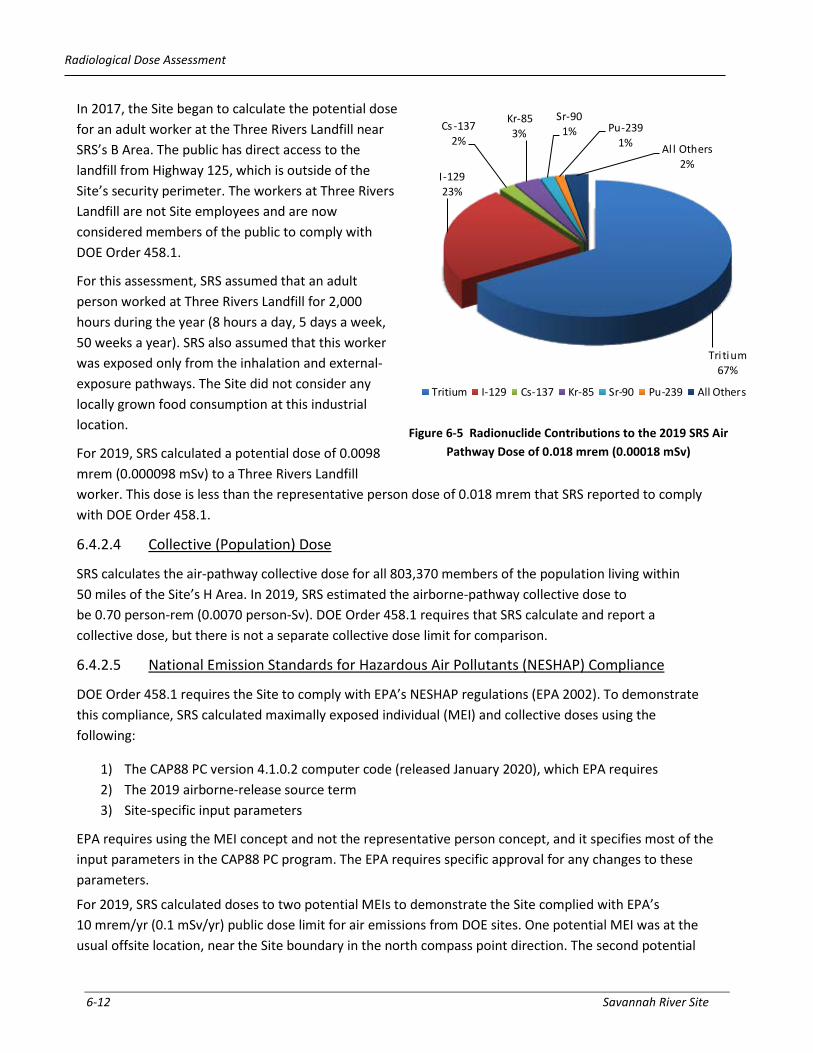
Radiological Dose Assessment
6-12 Savannah River Site
6-12 Savannah River Site
Tri tium67%
I-12923%
Cs-1372%
Kr-853%
Sr-901% Pu-239
1% Al l Others2%
Tritium I-129 Cs-137 Kr-85 Sr-90 Pu-239 All Others
Figure 6-5 Radionuclide Contributions to the 2019 SRS Air Pathway Dose of 0.018 mrem (0.00018 mSv)
In 2017, the Site began to calculate the potential dose for an adult worker at the Three Rivers Landfill near SRS’s B Area. The public has direct access to the landfill from Highway 125, which is outside of the Site’s security perimeter. The workers at Three Rivers Landfill are not Site employees and are now considered members of the public to comply with DOE Order 458.1.
For this assessment, SRS assumed that an adult person worked at Three Rivers Landfill for 2,000 hours during the year (8 hours a day, 5 days a week, 50 weeks a year). SRS also assumed that this worker was exposed only from the inhalation and external-exposure pathways. The Site did not consider any locally grown food consumption at this industrial location.
For 2019, SRS calculated a potential dose of 0.0098 mrem (0.000098 mSv) to a Three Rivers Landfill worker. This dose is less than the representative person dose of 0.018 mrem that SRS reported to comply with DOE Order 458.1.
6.4.2.4 Collective (Population) Dose
SRS calculates the air-pathway collective dose for all 803,370 members of the population living within 50 miles of the Site’s H Area. In 2019, SRS estimated the airborne-pathway collective dose to be 0.70 person-rem (0.0070 person-Sv). DOE Order 458.1 requires that SRS calculate and report a collective dose, but there is not a separate collective dose limit for comparison.
6.4.2.5 National Emission Standards for Hazardous Air Pollutants (NESHAP) Compliance
DOE Order 458.1 requires the Site to comply with EPA’s NESHAP regulations (EPA 2002). To demonstrate this compliance, SRS calculated maximally exposed individual (MEI) and collective doses using the following:
1) The CAP88 PC version 4.1.0.2 computer code (released January 2020), which EPA requires 2) The 2019 airborne-release source term 3) Site-specific input parameters
EPA requires using the MEI concept and not the representative person concept, and it specifies most of the input parameters in the CAP88 PC program. The EPA requires specific approval for any changes to these parameters.
For 2019, SRS calculated doses to two potential MEIs to demonstrate the Site complied with EPA’s 10 mrem/yr (0.1 mSv/yr) public dose limit for air emissions from DOE sites. One potential MEI was at the usual offsite location, near the Site boundary in the north compass point direction. The second potential

Environmental Report 2019 (SRNS-RP-2020-00064) 6-13
Radiological Dose Assessment
MEI was a worker at the Three Rivers Landfill. EPA requires that the Site consider all exposure pathways (including food consumption) for the potential MEI, even for an industrial worker.
NESHAP dose calculations use H Area as the location for all Site releases because a large majority of SRS’s radiological air releases are from the area’s Tritium and Separations facilities (Minter et al. 2018).
SRS estimated the MEI dose at the Site boundary to be 0.0178 mrem (0.000178 mSv). SRS estimated the MEI dose for the Three Rivers Landfill worker to be 0.0176 mrem (0.000176 mSv). For 2019, SRS reported the slightly higher Site boundary dose of 0.0178 mrem for NESHAP compliance. This dose is 0.18% of the 10 mrem/yr EPA limit, as Table 6-4 shows.
The radionuclides that accounted for most of the MEI dose, were tritium oxide (79%), elemental tritium (12.5%), cesium-137 (3.2%), strontium-90 (1.9%), and krypton-85 (1.2%). No other radionuclide contributed more than 1% to the total MEI dose. The 2019 NESHAP compliance dose (MEI dose) is 79% less than the 2018 dose of 0.088 mrem (0.00088 mSv). SRS attributes most of this decrease to the 79% decrease in tritium oxide releases during 2019. Refer to Chapter 5, Radiological Environmental Monitoring Program, Section 5.3.2 for details concerning these measurements.
6.4.3 All-Pathway Doses
6.4.3.1 All-Pathway Representative Person Dose
As stated in DOE Order 458.1, the all-pathway dose limit to a member of the public is 100 mrem/yr. SRS ensures a conservative estimate by combining the representative person airborne all-pathway and liquid all-pathway dose estimates, even though the two estimated doses are for hypothetical individuals living in different geographic locations.
For 2019, the potential representative person all-pathway dose is 0.18 mrem (0.0018 mSv), calculated as 0.16 mrem from liquid pathways plus 0.018 mrem from air pathways. As Table 6-5a shows, the all-pathway representative person dose is 0.18% of the 100 mrem/yr (1 mSv/yr) DOE dose limit. The all-pathway total dose is less than the 2018 total dose of 0.27 mrem (0.0027 mSv). As discussed previously, SRS attributes this decrease in 2019 to reduced tritium releases from the Site and to the increased Savannah River annual flow volume.
Figure 6-6 shows a 10-year history of SRS’s all-pathway (airborne pathways plus liquid pathways) doses to the representative person.
6.4.3.2 All-Pathway Collective (Population) Dose
DOE Order 458.1 requires that SRS calculate and report a collective dose, but there is not a separate collective dose limit for comparison. For 2019, the total potential collective all-pathway dose is 2.8 person-rem (0.028 person-Sv), calculated as 2.1 person-rem from liquid pathways plus 0.7 person-rem from air pathways. To compare, the annual collective dose from natural sources of radiation that the population within the 50-mile radius surrounding SRS’s H Area is about 250,000 person-rem. As Table 6-5b shows, the SRS all-pathway collective dose of 2.8 person-rem is less than 0.01% of the annual collective background dose.

Radiological Dose Assessment
6-14 Savannah River Site
6-14 Savannah River Site
Table 6-5a Potential Dose to the Representative Person from all Standard Pathways in 2019
Pathways Committed Dose
(mrem) Applicable Limit
(mrem) Percent of Limit
(%)
Near Site Boundary (All Pathways)
Total Liquid Pathways 0.16 100a 0.16%
Total Air Pathways 0.018 10a,b 0.18%
Total All Pathways 0.18 100a 0.18% a DOE: DOE Order 458.1 b EPA: (NESHAP) 40 CFR 61, Subpart H
0
0.05
0.1
0.15
0.2
0.25
0.3
2010 2011 2012 2013 2014 2015 2016 2017 2018 2019
MEI
All
Path
way
Dos
e (m
rem
)
YearAir Pathway Doses Liquid Pathway Doses Irrigation Pathway Doses
Pathways Collective Dose (person-rem)
Natural Background Dose (person-rem)
Percent of Natural Background (%)
50-mile Population Dose (All Pathways) Total Liquid Pathways 2.1 Not Applicable Not Applicable
Total Air Pathways 0.7 Not Applicable Not Applicable Total All Pathways 2.8 250,000a < 0.01%
a Calculated as 803,370 people (surrounding SRS population) times 311 mrem (0.311 rem) per person per year, which is the average annual natural background dose for people living in the United States (NCRP 2009).
Table 6-5b Potential Collective Dose to the 50-Mile Population Surrounding SRS, Including the People Served by the Downriver Drinking Water Plants (Based on Dose to a Typical Person from all Standard Pathways in 2019)
Figure 6-6 10-Year History of SRS Maximum Potential All-Pathway Doses
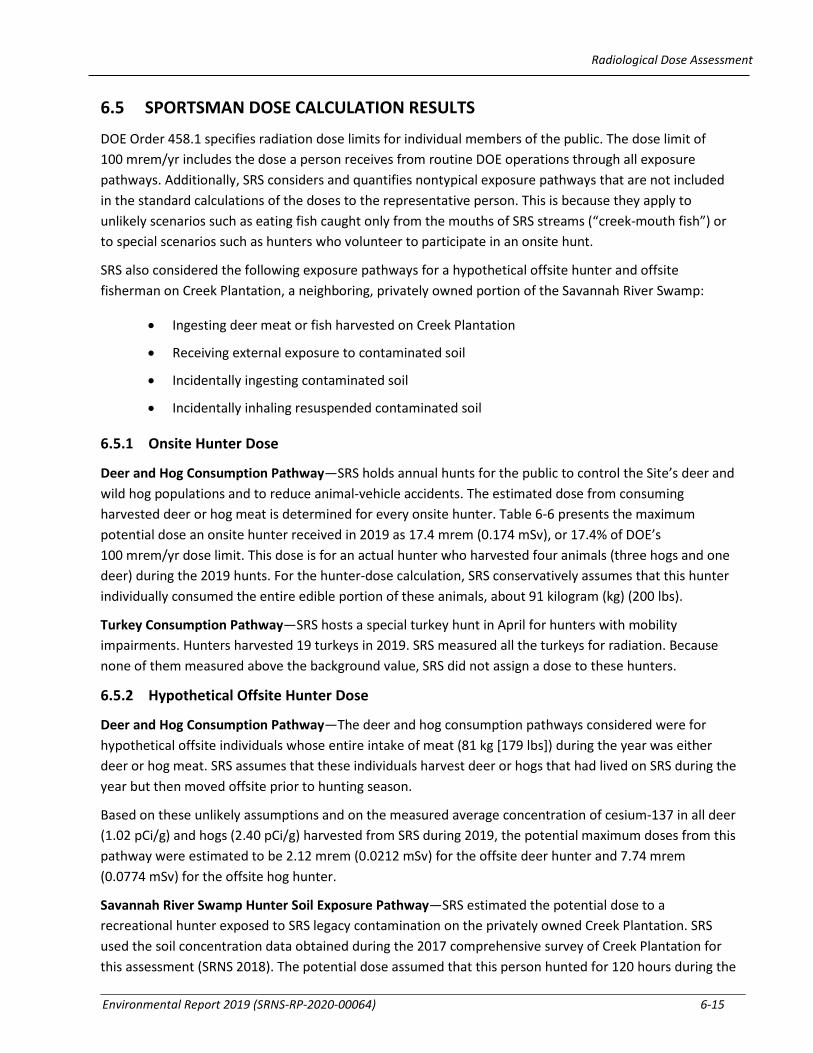
Environmental Report 2019 (SRNS-RP-2020-00064) 6-15
Radiological Dose Assessment
6.5 SPORTSMAN DOSE CALCULATION RESULTS
DOE Order 458.1 specifies radiation dose limits for individual members of the public. The dose limit of 100 mrem/yr includes the dose a person receives from routine DOE operations through all exposure pathways. Additionally, SRS considers and quantifies nontypical exposure pathways that are not included in the standard calculations of the doses to the representative person. This is because they apply to unlikely scenarios such as eating fish caught only from the mouths of SRS streams (“creek-mouth fish”) or to special scenarios such as hunters who volunteer to participate in an onsite hunt.
SRS also considered the following exposure pathways for a hypothetical offsite hunter and offsite fisherman on Creek Plantation, a neighboring, privately owned portion of the Savannah River Swamp:
• Ingesting deer meat or fish harvested on Creek Plantation
• Receiving external exposure to contaminated soil
• Incidentally ingesting contaminated soil
• Incidentally inhaling resuspended contaminated soil
6.5.1 Onsite Hunter Dose
Deer and Hog Consumption Pathway—SRS holds annual hunts for the public to control the Site’s deer and wild hog populations and to reduce animal-vehicle accidents. The estimated dose from consuming harvested deer or hog meat is determined for every onsite hunter. Table 6-6 presents the maximum potential dose an onsite hunter received in 2019 as 17.4 mrem (0.174 mSv), or 17.4% of DOE’s 100 mrem/yr dose limit. This dose is for an actual hunter who harvested four animals (three hogs and one deer) during the 2019 hunts. For the hunter-dose calculation, SRS conservatively assumes that this hunter individually consumed the entire edible portion of these animals, about 91 kilogram (kg) (200 lbs).
Turkey Consumption Pathway—SRS hosts a special turkey hunt in April for hunters with mobility impairments. Hunters harvested 19 turkeys in 2019. SRS measured all the turkeys for radiation. Because none of them measured above the background value, SRS did not assign a dose to these hunters.
6.5.2 Hypothetical Offsite Hunter Dose
Deer and Hog Consumption Pathway—The deer and hog consumption pathways considered were for hypothetical offsite individuals whose entire intake of meat (81 kg [179 lbs]) during the year was either deer or hog meat. SRS assumes that these individuals harvest deer or hogs that had lived on SRS during the year but then moved offsite prior to hunting season.
Based on these unlikely assumptions and on the measured average concentration of cesium-137 in all deer (1.02 pCi/g) and hogs (2.40 pCi/g) harvested from SRS during 2019, the potential maximum doses from this pathway were estimated to be 2.12 mrem (0.0212 mSv) for the offsite deer hunter and 7.74 mrem (0.0774 mSv) for the offsite hog hunter.
Savannah River Swamp Hunter Soil Exposure Pathway—SRS estimated the potential dose to a recreational hunter exposed to SRS legacy contamination on the privately owned Creek Plantation. SRS used the soil concentration data obtained during the 2017 comprehensive survey of Creek Plantation for this assessment (SRNS 2018). The potential dose assumed that this person hunted for 120 hours during the
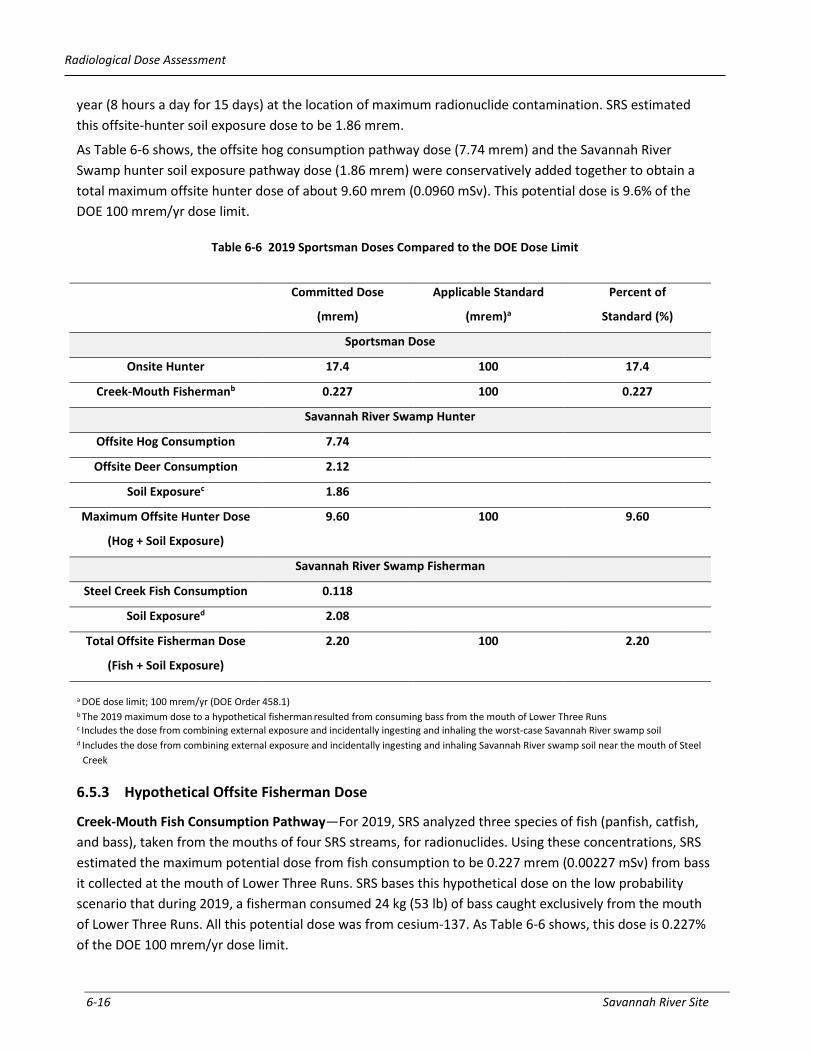
Radiological Dose Assessment
6-16 Savannah River Site
6-16 Savannah River Site
year (8 hours a day for 15 days) at the location of maximum radionuclide contamination. SRS estimated this offsite-hunter soil exposure dose to be 1.86 mrem.
As Table 6-6 shows, the offsite hog consumption pathway dose (7.74 mrem) and the Savannah River Swamp hunter soil exposure pathway dose (1.86 mrem) were conservatively added together to obtain a total maximum offsite hunter dose of about 9.60 mrem (0.0960 mSv). This potential dose is 9.6% of the DOE 100 mrem/yr dose limit.
Table 6-6 2019 Sportsman Doses Compared to the DOE Dose Limit
6.5.3 Hypothetical Offsite Fisherman Dose
Creek-Mouth Fish Consumption Pathway—For 2019, SRS analyzed three species of fish (panfish, catfish, and bass), taken from the mouths of four SRS streams, for radionuclides. Using these concentrations, SRS estimated the maximum potential dose from fish consumption to be 0.227 mrem (0.00227 mSv) from bass it collected at the mouth of Lower Three Runs. SRS bases this hypothetical dose on the low probability scenario that during 2019, a fisherman consumed 24 kg (53 lb) of bass caught exclusively from the mouth of Lower Three Runs. All this potential dose was from cesium-137. As Table 6-6 shows, this dose is 0.227% of the DOE 100 mrem/yr dose limit.
Committed Dose
(mrem)
Applicable Standard
(mrem)a
Percent of
Standard (%)
Sportsman Dose
Onsite Hunter 17.4 100 17.4
Creek-Mouth Fishermanb 0.227 100 0.227
Savannah River Swamp Hunter
Offsite Hog Consumption 7.74
Offsite Deer Consumption 2.12
Soil Exposurec 1.86
Maximum Offsite Hunter Dose
(Hog + Soil Exposure)
9.60 100 9.60
Savannah River Swamp Fisherman
Steel Creek Fish Consumption 0.118
Soil Exposured 2.08
Total Offsite Fisherman Dose
(Fish + Soil Exposure)
2.20 100 2.20
a DOE dose limit; 100 mrem/yr (DOE Order 458.1) b The 2019 maximum dose to a hypothetical fisherman resulted from consuming bass from the mouth of Lower Three Runs c Includes the dose from combining external exposure and incidentally ingesting and inhaling the worst-case Savannah River swamp soil d Includes the dose from combining external exposure and incidentally ingesting and inhaling Savannah River swamp soil near the mouth of Steel
Creek

Environmental Report 2019 (SRNS-RP-2020-00064) 6-17
Radiological Dose Assessment
Savannah River Swamp Fisherman Soil Exposure Pathway—SRS calculated the potential dose to a recreational fisherman exposed to SRS legacy contamination in Savannah River Swamp soil on the privately owned Creek Plantation using the RESidual RADioactivity (RESRAD) code (Yu et al., 2001). SRS assumes that this recreational sportsman fished on the South Carolina bank of the Savannah River near the mouth of Steel Creek for 250 hours during the year.
Using the radionuclide concentrations measured at this location, SRS estimated the potential dose to a fisherman from a combination of 1) external exposure to the contaminated soil, 2) incidental ingestion of the soil, and 3) incidental inhalation of renewed suspension soil to be 2.08 mrem (0.0208 mSv).
As Table 6-6 shows, SRS added the maximum Steel Creek fish consumption dose (0.118 mrem) and the Savannah River Swamp fisherman soil exposure dose (2.08 mrem) to conservatively obtain a total offsite fisherman dose of 2.20 mrem (0.0220 mSv). This potential dose is 2.20% of the DOE 100 mrem/yr dose limit.
6.5.4 Potential Risk from Consumption of SRS Creek-Mouth Fish
During 1991 and 1992, in response to a U.S. House of Representatives Appropriations Committee request for a plan to evaluate risk to the public from fish collected from the Savannah River, SRS developed a fish monitoring plan in conjunction with EPA, Georgia Department of Natural Resources, and South Carolina Department of Health and Environmental Control (SCDHEC). This plan includes assessing radiological risk from consuming Savannah River fish and requires that SRS summarize the results in the SRS Annual Environmental Report. SRS estimated the potential risks using the cancer morbidity risk coefficients from Federal Guidance Report No. 13 (EPA 1999). For 2019, SRS estimated the maximum potential lifetime risk of developing fatal and nonfatal cancer from consuming SRS creek-mouth fish to be 1.72E-07. That is, if 10 million people each received a dose of 0.172 mrem, there is a potential for 2.0 extra cancer incidents.
6.6 RELEASE OF MATERIAL CONTAINING RESIDUAL RADIOACTIVITY
DOE Order 458.1 establishes authorized surface contamination limits for unconditional release of personal and real property. This order defines personal property as “property of any kind, except for real property” and defines real property as “land and anything permanently affixed to the land such as buildings, fences and those things attached to the buildings, such as light fixtures, plumbing and heating fixtures, or other such items, that would be personal property if not attached.” SRS handles the unconditional release of real property on an individual basis that requires DOE approval. SRS did not release any real property in 2019, so the following discussion is associated with release of personal property from SRS. DOE Order 458.1 specifies that the Site must prepare and submit an annual summary of cleared property to the DOE-SR Manager.
6.6.1 Property Release Methodology
SRS uses procedures to govern unconditionally releasing equipment. SRS can release the item after it has a radiological survey if it meets specific documented limits. For items meeting unconditional release criteria, SRS generates a form and attaches it electronically to the applicable radiological survey via the Site’s Visual Survey Data System (VSDS). In some areas, SRS documents equipment and material release directly on the radiological survey form. SRS subsequently compiled these VSDS and survey forms and coordinated a site-wide review to determine the amount of material and equipment SRS released from its facilities in 2019.

Radiological Dose Assessment
6-18 Savannah River Site
6-18 Savannah River Site
These measures ensure that radiological material releases from SRS are consistent with DOE Order 458.1 requirements.
SRS unconditionally released 10,325 items of personal property from radiological areas in 2019. Most of these items did not leave the SRS and were reused elsewhere on the Site. Therefore, all items required no additional radiological controls post-survey as they met DOE Order 458.1 release criteria (DOE Order 458.1 allows using DOE Order 5400.5-derived supplemental limits for unconditionally releasing equipment and materials.)
In 2003, DOE approved an SRS request to use supplemental limits to release material from the Site with no further DOE controls. These supplemental release limits, provided in Table 31 of Radiological Impact of 2019 Operations at the Savannah River Site (Stagich, Jannik, and Dixon 2020), are dose-based and are such that if any member of the public received any exposure, it would be less than 1 mrem/yr. The supplemental limits include both surface and volume concentration criteria. The volume criteria allow SRS the option to dispose of potentially volume-contaminated material in Three Rivers Landfill, an onsite sanitary waste facility. In 2019, SRS did not release any material from the Site using the supplemental release limits volume concentration criteria.
6.7 RADIATION DOSE TO AQUATIC AND TERRESTRIAL BIOTA
DOE Order 458.1 requires that SRS operate in a manner that protects the local biota from adverse effects of radiation and radioactive material releases. To demonstrate it is complying with this requirement, SRS follows the approved DOE Standard, DOE-STD-1153-2019, A Graded Approach for Evaluating Radiation Doses to Aquatic and Terrestrial Biota (DOE 2019).
The biota dose rate limits specified in this standard are the following:
• Aquatic animals: 1.0 rad/day • Riparian animals: 0.1 rad/day • Terrestrial plants: 1.0 rad/day • Terrestrial animals: 0.1 rad/day
6.7.1 DOE Biota Concentration Guides
SRS evaluates plant and animal doses for water and land systems using the RESRAD Biota model (version 1.8) (SRS EDAM 2017), which directly implements the DOE (2019) guidance. The RESRAD Biota model uses a graded approach consisting of three increasingly more detailed steps of analysis:
• Level 1 Screening—uses maximum measured concentrations and conservative default model input parameters
• Level 2 Screening—uses average concentrations or site-specific input parameters, as appropriate • Level 3 Analysis—uses site-specific biota parameters or measured concentrations in the actual
biota living at the assessed location
For water systems (animals and plants who live in the water or along riverbanks), the RESRAD Biota model performs a combined water-plus-sediment evaluation. SRS performed initial (Level 1) screenings in 2019 using radionuclide concentration data from SRS’s 14 onsite, co-located stream and sediment sampling locations. A sum of the fractions less than 1.0 indicates the sampling site has passed its initial pathway

Environmental Report 2019 (SRNS-RP-2020-00064) 6-19
Radiological Dose Assessment
screening, which means that the sampling site did not exceed its biota dose rate limits, and SRS does not have to assess the location further. All SRS aquatic system locations passed the Level 1 screening and did not require further assessment.
To evaluate land-based systems, SRS performed initial (Level 1) screenings using concentration data from the five onsite radiological soil sampling locations. Typically, SRS collects and analyzes only one soil sample per year from each location. For 2019, all land-based locations passed their initial Level 1 pathway screenings.

Radiological Dose Assessment
6-20 Savannah River Site
6-20 Savannah River Site
This page intentionally left blank

Environmental Report for 2019 (SRNS-RP-2020-00064) 7-1
7 GATERMANAGEMENT 7.1 INTRODUCTION Some of SRS’s past operations have released chemicals and radionuclides into the soil and contaminated the groundwater around hazardous waste management facilities and waste disposal sites. Because of these past releases, SRS operates extensive groundwater monitoring and groundwater remediation programs.
The SRS groundwater monitoring program requires regular well sampling to monitor for groundwater contaminants. The well monitoring meets sampling requirements in the Federal Facility Agreement (FFA) for the Savannah River Site (FFA 1993) and in Resource Conservation and Recovery Act (RCRA) permits, and ensures the Site is meeting South Carolina Department of Health and Environmental Control (SCDHEC) and U.S. Environmental Protection Agency (EPA) drinking water quality standards. SRS uses SCDHEC-certified laboratories to analyze groundwater samples.
2019 Highlights Drinking Water Standards—The data show no exceedances of drinking water standards (measured by maximum contaminant limit [MCLs] or regional screening levels [RSLs]) in SRS boundary wells near A/M Area.
Groundwater Contaminant Removal—SRS removed 12,952 pounds (lbs) of volatile organic compounds (VOCs) from groundwater and the vadose zone and prevented 51 curies of tritium from reaching SRS streams.
Offsite Groundwater Monitoring (Georgia)—For more than 15 years, tritium detections in Georgia groundwater monitoring wells have been well below the MCL for tritium (20 pCi/mL). This data supports the conclusions drawn from a U.S. Geological Survey that indicate there is no mechanism by which groundwater could flow under the Savannah River and contaminate Georgia wells (Cherry 2006).
he purpose of the Savannah River Site’s (SRS’s) groundwater management program is to protect, monitor, remediate, and use groundwater. With this focus, the program accomplishes the following:
• Ensures future groundwater contamination does not occur
• Monitors groundwater to identify areas of contamination
• Remediates groundwater contamination as needed
• Conserves groundwater
T
Chapter 7: Groundwater Management Program

Groundwater Management Program
7-2 Savannah River Site
The monitoring data show that most of the contaminated groundwater is in the central area of SRS, and none extends beyond the SRS boundary. Groundwater contamination at SRS is primarily limited to the Upper Three Runs/Steed Pond Aquifers and the Gordon/Lost Lake Aquifers (Figure 7-1). SRS submits summaries of groundwater data to regulatory agencies, and, if necessary, remediates or removes the contamination. Appendix E lists the documents that SRS submits to the regulatory agencies reporting groundwater monitoring data.
SRS uses several technologies to remediate groundwater that exceeds the MCLs or the RSLs. Remediation includes closing waste units to reduce the potential for contaminants to reach groundwater, actively treating contaminated water, and employing passive and natural (attenuation) remedies.
Groundwater remediation at SRS focuses on VOCs and tritium. VOCs in groundwater, mainly trichloroethylene (TCE) and tetrachloroethylene (PCE), originate from their use as degreasing agents in industrial work at SRS. Tritium in groundwater is a byproduct of nuclear materials production at SRS. Corrective measures at SRS range from active treatment, such as using oxidants to destroy the VOCs in place, to passive measures, such as monitored natural attenuation and phytoremediation (using trees and plants to remove or break down contaminants). These practices are removing VOCs from the groundwater and effectively reducing tritium releases into SRS streams and the Savannah River.
7.2 GROUNDWATER AT SRS
The groundwater flow system at SRS consists of the following four major aquifers separated by confining units:
• Upper Three Runs/Steed Pond
• Gordon/Lost Lake
• Crouch Branch
• McQueen Branch
Chapter 7—Key Terms Aquifer is an underground water supply found in porous rock, sand, gravel, etc. Attenuation is a reduction of groundwater contaminants over time due to naturally occurring physical, chemical, and biological processes. Confining Unit is the opposite of an aquifer. It is a layer of rock or sand that limits groundwater movement in and out of an aquifer. Contaminants of Concern are contaminants found at the unit that have undergone detailed analysis and have been found to present a potential threat to human health and the environment. Groundwater is water found underground in cracks and spaces in soil, sand, and rocks. Maximum Contaminant Level (MCL) is the highest level of a contaminant allowed in drinking water. Plume is a volume of contaminated water originating at a waste source (for example, a hazardous waste disposal site). It extends downward and outward from the waste source. Recharge occurs when water from the surface travels down into the subsurface, replenishing the groundwater. Regional Screening Level (RSL) is the risk-based concentration derived from standardized equations combining exposure assumptions with toxicity data. Remediation cleans up sites contaminated with waste due to historical activities. Surface water is water found above ground (for example, streams, lakes, wetlands, reservoirs, and oceans). Vadose Zone is the subsurface layer below the land surface and above the water table. The vadose zone has a low water-compared-to-saturated zone; therefore, it is also referred to as being unsaturated. Waste Unit is an area that is, or may be, posing a threat to human health or the environment. It ranges in size from a few square feet to tens of acres and includes basins, pits, piles, burial grounds, landfills, tank farms, disposal facilities, process facilities, and contaminated groundwater.

Groundwater Management Program
Environmental Report 2019 (SRNS-RP-2020-00064) 7-3
Groundwater flow in recharge areas generally migrates downward and laterally. It eventually flows into the Savannah River and its tributaries or migrates into the deeper regional flow system. Figure 7-1 presents a three-dimensional block diagram of these units at SRS and the generalized groundwater flow patterns within those units. Water moving from the ground’s surface into the aquifers can carry contamination along with it, resulting in underground plumes of contaminated water (Figure 7-2).
7.3 GROUNDWATER PROTECTION PROGRAM AT SRS
SRS has designed and implemented a groundwater protection program to prevent new releases to groundwater and to remediate contaminated groundwater to meet federal and state laws and regulations, U.S. Department of Energy (DOE) Orders, and SRS policies and procedures. It accomplishes the following:
• Protects groundwater
• Monitors groundwater
• Remediates groundwater
• Conserves groundwater
Figure 7-1 Groundwater at SRS

Groundwater Management Program
7-4 Savannah River Site
7.3.1 Protecting SRS Groundwater
SRS groundwater management focuses on preventing and monitoring groundwater contamination, protecting the public and environment from contamination, and preserving groundwater quality for future use. Groundwater protection is performed through the following:
• Preventing or controlling groundwater contamination sources from construction sites, hazardous waste management facilities, and waste units
• Monitoring groundwater and surface water to detect contaminants
• Reducing contaminants via a groundwater cleanup program
7.3.2 Monitoring SRS Groundwater
The purpose of monitoring groundwater is to observe and evaluate changes in the groundwater quality over time and to establish, as accurately as possible, the baseline quality of the groundwater occurring naturally in the aquifers. The SRS groundwater monitoring program includes two primary components: groundwater contaminant source monitoring and groundwater surveillance monitoring. SRS evaluates groundwater-monitoring data frequently to identify whether new groundwater contamination exists or if should modify the current monitoring program.
SRS uses groundwater-monitoring data to determine the effects of Site operations on groundwater quality. The program supports the following critical activities:
• Complying with environmental regulations and DOE directives
• Evaluating the status of groundwater plumes
Figure 7-2 How Contamination Gets to Soil and Groundwater

Groundwater Management Program
Environmental Report 2019 (SRNS-RP-2020-00064) 7-5
• Evaluating potential impacts from activities planned near or within the groundwater plume footprint
• Enhancing groundwater remediation through basic and applied research projects
Monitoring the groundwater around SRS facilities, waste disposal sites, and associated streams is the best way to detect and track contaminant migration. Through careful monitoring and analysis, SRS implements appropriate remedial or corrective actions. Figure 7-3 shows the groundwater plumes associated with SRS.
As a result of discussions with EPA and SCDHEC, SRS adds emerging contaminants to analyte lists when historical or process knowledge indicates that a contaminant could now be of concern. Emerging contaminants are chemicals that have been detected in drinking water supplies, but their risk to human health and the environment is not fully understood. 1,4-Dioxane is one of the emerging contaminants that SRS monitors regularly in conjunction with VOC plumes. During 2019, SRS began assessing the past and present use of per- and polyfluoroalkyl substances (PFAS) at the Site. PFAS are a category of manmade chemicals, another family of emerging contaminants of concern. Initial groundwater sampling will begin in 2020, along with continued assessments of past use. The EPA, SCDHEC, and the Interstate Technology Regulatory Council webpages have current information on the state of knowledge and regulatory status of PFAS.
7.3.2.1 Groundwater Surveillance Monitoring
Surveillance monitoring at SRS focuses on collecting and analyzing data to characterize the groundwater flow and the presence or absence of contaminants. Characterization at SRS includes the following activities:
• Collecting soil and groundwater samples to determine the extent of contamination
• Obtaining geologic soil cores or seismic profiles to better determine underground structural features, as warranted
• Installing wells to periodically collect water-level measurements and groundwater samples
• Developing maps to help define groundwater flow
• Performing calculations based on water elevation data to estimate groundwater velocities
• Analyzing regional groundwater to provide a comprehensive understanding of SRS groundwater movement—and specifically contaminant movement—near facilities, individual waste units, and at the Site boundary
Checking a Passive Soil Vapor Extraction Well (top photo)
and Sampling Equipment (lower photo)

Groundwater Management Program
7-6 Savannah River Site
• Characterizing regional surface water flow to assess contaminant risk to perennial streams, which receive groundwater flow.
Figure 7-3 Groundwater Plumes at SRS

Groundwater Management Program
Environmental Report 2019 (SRNS-RP-2020-00064) 7-7
7.3.2.2 2019 Groundwater Data Summary
SRS uses more than 150 wells to monitor a significant plume beneath A/M Area. Some of these monitoring wells lie within a half-mile of the northwestern boundary of SRS. The direction of groundwater flow in the area parallels the Site boundary; however, groundwater flow direction can fluctuate. Because of this, SRS concentrates on the groundwater results from the wells along the Site boundary, as well as those between A/M Area and the nearest population center, Jackson, South Carolina (Figure 7-4). The data show no exceedances of drinking water standards (MCLs or RSLs) in SRS boundary wells near A/M Area. No detectable contamination exists in most of these SRS boundary wells.
Although most SRS-contaminated groundwater plumes do not approach the Site boundary, the potential to affect Site streams exists when contaminated groundwater flows into nearby streams. SRS monitors and evaluates groundwater contamination that flows into Site streams and remediates it as appropriate. In conjunction with stream monitoring, as discussed in Chapter 5, Radiological Environmental Monitoring Program, Section 5.4.3, SRS Stream Sampling and Monitoring, SRS conducts extensive monitoring near SRS waste units and operating facilities, regardless of their proximity to the boundary. Savannah River Site Groundwater Management Strategy and Implementation Plan (SRNS 2017) contains details concerning groundwater monitoring and conditions at individual sites.
Table 7-1 identifies the typical contaminants of concern (COCs) found in SRS groundwater and their significance. These COCs are a result of historical SRS operations that released chemicals and radionuclides into the soil and groundwater near hazardous waste management facilities and waste disposal sites. Table 7-2 presents a general summary of the most common contaminants found in groundwater at SRS facility areas, based on 2019 monitoring data, and compares the maximum concentrations to the appropriate drinking water standards. Table 7-2 shows the major COCs in the groundwater beneath SRS, including common degreasers (TCE and PCE) and radionuclides (tritium, gross alpha, and nonvolatile beta emitters).
Since the early 1990s, SRS has directed considerable effort to assessing the likelihood of flow beneath the Savannah River from South Carolina to Georgia. A groundwater model developed by the U.S. Geological Survey indicates there is no mechanism by which groundwater could flow under the Savannah River and contaminate Georgia wells (Cherry 2006). SRS continues to monitor for tritium in groundwater wells in Georgia (Figure 7-5) by collecting samples annually during the second half of the year. Detections of tritium in groundwater in these Georgia offsite wells have been below 1.5 pCi/mL (1,500 pCi/L) since 1999 (Figure 7-6). The MCL, or drinking water standard, for tritium is 20 pCi/mL (20,000 pCi/L). The 2019 results had no detectable concentrations of tritium.

Groundwater Management Program
7-8 Savannah River Site
Figure 7-4 Location of Site Boundary Wells at SRS—Between A/M Area and Jackson, South Carolina

Groundwater Management Program
Environmental Report 2019 (SRNS-RP-2020-00064) 7-9
Table 7-1 Typical Contaminants of Concern at SRS
Contaminants Sources Limits, Exposure Pathways, and Health Effects
Gross Alpha Alpha radiation emits positively charged particles from the radioactive decay of certain elements including uranium, thorium, and radium. Alpha radiation in drinking water can be in the form of dissolved minerals or a gas (radon).
MCL is 15 pCi/L. An alpha particle cannot penetrate a piece of paper or human skin. It causes increased risk of cancer through ingestion or inhalation.
Nonvolatile Beta Beta decay commonly occurs among neutron-rich fission byproducts produced in nuclear reactors.
MCL is 4 mrem/yr. It causes increased risk of cancer through ingestion, inhalation, or dermal exposure.
Tritium Radioactive isotope of hydrogen with a half-life of 12.3 years. It emits a very weak beta particle and behaves like water.
MCL is 20 pCi/mL. It primarily enters the body when people swallow tritiated water. It causes increased risk of cancer through ingestion, inhalation, or dermal exposure.
Trichloroethene/ Tetrachloroethene
VOCs used primarily to remove grease from fabricated metal parts.
MCL is 5 µg/L. It causes increased risk of cancer through ingestion, inhalation, or dermal exposure.
Vinyl Chloride VOC formed as a degradation product of TCE/PCE.
MCL is 2 µg/L. It causes increased risk of cancer through ingestion, inhalation, or dermal exposure.
1,4-Dioxane Synthetic industrial chemical used as a stabilizer for VOCs to reduce degradation.
RSL for tap water is 0.46 µg/L. It causes increased risk of cancer through ingestion, inhalation, or dermal exposure.
Table 7-2 Summary of the Maximum Contaminant Concentrations for Major Areas within SRS
Location Major Contaminant Units 2019 Max
Concentration Well MCL/ RSL Likely Stream
Endpoints A/M Area Tetrachloroethylene µg/L 110,000 MSB101CC 5 Tims
Branch/Upper Three Runs in Swamp in West
Trichloroethylene µg/L 28,700 MSB107CC 5 1,4-Dioxane µg/L 100 ARP 1A 6.1a
C Area Tetrachloroethylene µg/L 8.05 CRP 5C 5 Fourmile Branch and Castor Creek Trichloroethylene µg/L 2,000 CRP 20CU 5
Tritium pCi/mL 4,940 CRW023C 20 CMP Pits (G Area)
Tetrachloroethylene µg/L 1,940 CMP 34D 5 Pen Branch Trichloroethylene µg/L 795 CMP 35D 5 Lindane µg/L 29.8 CMP 35D 0.2
D Area Beryllium µg/L 133 DCB 23C 4 Savannah River Swamp Tetrachloroethylene µg/L 8.73 DCB 45C 5
Trichloroethylene µg/L 115 DCB 62 5 Vinyl Chloride µg/L 19.1 DOB 15 2 Tritium pCi/mL 238 DCB 26AR 20
E-Area MWMF
Trichloroethylene µg/L 353 BSW 4D2 5 Upper Three Runs/Crouch Branch in North; Fourmile Branch in South
1,4-Dioxane µg/L 580 BSW 6C3 6.1a Tritium pCi/mL 18,400 BSW 4D2 20 Nonvolatile Beta pCi/L 31.9 SEP002B 50b Gross Alpha pCi/L 14 BSW 8D3 15
F Area Trichlorethylene µg/L 22.7 FBP 43DL 5
Fourmile Branch Tritium pCi/mL 93.7 FGW012C 20 Gross Alpha pCi/L 1,380 FGW005C 15 Nonvolatile Beta pCi/L 1,250 FGW005C 50b

Groundwater Management Program
7-10 Savannah River Site
Table 7-2 Summary of the Maximum Contaminant Concentrations for Major Areas within SRS (continued)
Location Major Contaminant Units 2019 Max
Concentration Well MCL/ RSL Likely Stream
Endpoints
F-Area HWMF
Trichloroethylene µg/L 15.4 FSB 78C 5
Fourmile Branch Tritium pCi/mL 1,190 FSB 78C 20 Gross Alpha pCi/L 410 FSB 94DR 15 Nonvolatile Beta pCi/L 693 FSB 94C 50b
F-Area Tank Farm
Tritium pCi/mL 3.14 FTF 19 20 Fourmile Branch/ Upper Three Runs Nonvolatile Beta pCi/L 746 FTF 28 50b
Manganese µg/L 219 FTF009R 430
H Area
Trichloroethylene µg/L 4.1 HGW 2D 5 Upper Three Runs/ Crouch Branch in North; Fourmile Branch in South
Gross Alpha pCi/L 27.9 HAA 15A 15 Nonvolatile Beta pCi/L 93.5 HAA 13A 50b Tritium pCi/mL 25.2 HGW 2D 20
H-Area HWMF
Trichloroethylene µg/L 195 HSB120C 5
Fourmile Branch Tritium pCi/mL 1,300 HSB129C 20 Gross Alpha pCi/L 32.9 HSB102D 15 Nonvolatile Beta pCi/L 373 HSB 68DR 50b
H-Area Tank Farm
Tritium pCi/mL 47.1 HAA 12C 20 Fourmile Branch/ Upper Three Runs Nonvolatile Beta pCi/L 21.1 HAA 4D 50b
Manganese µg/L 458 HAA 10D 430
K Area Tetrachloroethylene µg/L 6.33 KDB 1 5
Indian Grave Branch Trichloroethylene µg/L 2.7 KRP 9 5 Tritium pCi/mL 2,570 KRB 19D 20
L Area Tetrachloroethylene µg/L 48 LSW 25DL 5
L Lake Trichloroethylene µg/L 4.7 LSW030DL 5 Tritium pCi/mL 390 LSW 25DL 20
P Area Trichloroethylene µg/L 7,730 P003L 5
Steel Creek Tritium pCi/mL 14,300 PSB002B 20
R Area
Trichloroethylene µg/L 22 RAG008B 5 Mill Creek in Northwest; Tributaries of PAR Pond
Tritium pCi/mL 769 RDB 3D 20 Carbon-14 pCi/L 144 RDB 3D 2,000 Strontium-90c pCi/L 135 RSE 10 8
Sanitary Landfill
1,4-Dioxane µg/L 140 LFW 62C 6.1a Upper Three Runs Trichloroethylene µg/L 5.35 LFW 32 5
Vinyl Chloride µg/L 13.3 LFW 10A 2 TNX Trichloroethylene µg/L 6.71 TRW 2 5 Savannah River
Z Area
Technetium-99 pCi/L 99.5 ZBG002C 900
Upper Three Runs Nitrate-Nitrate as Nitrogen mg/L 5.4 ZBG002D 10
Nonvolatile Beta pCi/L 74.2 ZBG002D 50b Notes: MWMF is the Mixed Waste Management Facility; HWMF is the Hazardous Waste Management Facility; TNX is the 678-T facilities; CMP is the Chemicals, Metals, and Pesticides Pits. µg = micrograms a The 1,4-Dioxane standard is a RCRA-permitted Groundwater Protection Standard. b The MCL for nonvolatile beta activity (pCi/L or pCi/mL) equivalent to 4 mrem/yr varies according to which specific beta emitters are present in the
sample. At SRS this value equates to 50 pCi/L. c At R Area, strontium-90 is sampled every two years. It was last sampled in 2019.

Groundwater Management Program
Environmental Report 2019 (SRNS-RP-2020-00064) 7-11
Figure 7-5 Location of Monitoring Wells Sampled for Tritium in Burke and Screven Counties, Georgia

Groundwater Management Program
7-12 Savannah River Site
Figure 7-6 Tritium Concentration in Wells Sampled in Burke and Screven Counties, Georgia

Groundwater Management Program
Environmental Report 2019 (SRNS-RP-2020-00064) 7-13
7.3.3 Remediating SRS Groundwater
SRS’s environmental remediation program has been in place for more than 20 years. The Federal Facility Agreement (FFA) for the Savannah River Site (FFA 1993) specifies that RCRA and the Comprehensive Environmental Response, Compensation, and Liability Act regulate remediating and monitoring contaminated groundwater. Remediation focuses on removing mass, reducing contaminant levels, and reducing the exposure of humans and the environment to contaminants that exceed either the MCLs or RSLs. Table 7-2 identifies the MCLs and RSLs for the primary contaminants of concern in SRS groundwater.
For each remediation project, SRS determines the degree to which the groundwater is contaminated. After completing this evaluation, SRS and the regulatory agencies decide upon a strategy for remediating the groundwater.
SRS often applies remedial actions to the groundwater contamination source. For instance, SRS widely uses soil vapor extraction, a technology that extracts contaminated soil vapor from the vadose (unsaturated) zone to remove VOCs. This technology minimizes the VOCs that will reach the water table. Recently, SRS has emphasized converting soil vapor extraction (SVE) systems requiring permanent electrical power to passive systems using solar power or barometric pumping.
SRS implements several groundwater remedial technologies. These technologies manage the rate the contaminants move and reduce the risk of contaminant exposure to human health and ecological receptors. Thirty-nine remediation systems are currently operating. In 2019, SRS removed 12,952 lbs of VOCs from the groundwater and the vadose zone and prevented 51 curies of tritium from reaching SRS streams (SRNS 2020). SRS has worked for more than 20 years to reduce the tritium flux to Fourmile Branch. Since 2000, SRS has reduced the tritium flux to Fourmile Branch by almost 70% using groundwater remedial technologies (subsurface barriers and water capture with phyto-irrigation). The MWMF Phytoremediation Project has the largest tritium reductions of the technologies currently in use on the Site.
A/M Area is SRS’s largest groundwater plume, as shown in Figure 7-3. The earliest identified contamination in the A/M Area plume is associated with the M-Area and Metallurgical Laboratory Hazardous Waste Management Facility (HWMF), located in the general proximity of the “M” shown in Figure 7-4. Remediation at these two facilities began in 1983, when SRS pumped groundwater from wells to an above-ground treatment system, followed by SVE, and then by thermal treatment, as shown in Figure 7-7. As of 2019, these technologies have removed 1.56 million pounds of solvent, consisting of TCE and PCE.
Treatment technologies that SRS has recently implemented to address VOCs include the in-place injection of oxidants and adding carbon source and microbes to stimulate bioremediation to intercept and destroy VOCs transported by groundwater. An innovative technology the Savannah River National Laboratory (SRNL) developed at SRS to address VOC contamination is humate amendment injection. Humate is an agricultural organic amendment. Humate injection consists of adding dissolved humate directly to the contaminated aquifer. This technology increases the sorption of TCE to aquifer sediment and biodegrades the TCE in the naturally oxygen-rich groundwater. A study investigating using humate amendments to enhance the attenuation of the VOCs began in 2017 and is in progress for the southern sector of the A/M Area plume. Humate injection is expected to continue into 2020.
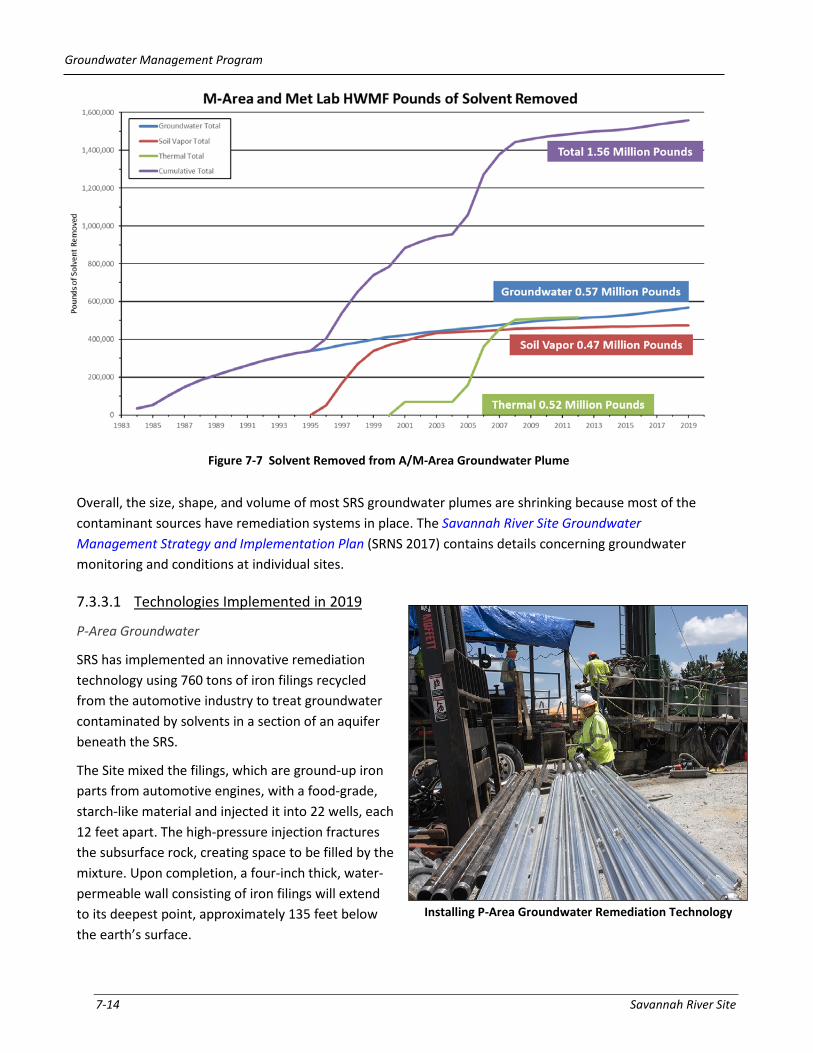
Groundwater Management Program
7-14 Savannah River Site
Overall, the size, shape, and volume of most SRS groundwater plumes are shrinking because most of the contaminant sources have remediation systems in place. The Savannah River Site Groundwater Management Strategy and Implementation Plan (SRNS 2017) contains details concerning groundwater monitoring and conditions at individual sites.
7.3.3.1 Technologies Implemented in 2019
P-Area Groundwater
SRS has implemented an innovative remediation technology using 760 tons of iron filings recycled from the automotive industry to treat groundwater contaminated by solvents in a section of an aquifer beneath the SRS.
The Site mixed the filings, which are ground-up iron parts from automotive engines, with a food-grade, starch-like material and injected it into 22 wells, each 12 feet apart. The high-pressure injection fractures the subsurface rock, creating space to be filled by the mixture. Upon completion, a four-inch thick, water-permeable wall consisting of iron filings will extend to its deepest point, approximately 135 feet below the earth’s surface.
Figure 7-7 Solvent Removed from A/M-Area Groundwater Plume
Installing P-Area Groundwater Remediation Technology

Groundwater Management Program
Environmental Report 2019 (SRNS-RP-2020-00064) 7-15
Groundwater will flow through the 264-foot long, 23,000-square foot metal wall, which neutralizes the solvents. SRS completed the water-permeable wall in December 2019.
C-Area Groundwater
SRS removed 99% of the degreasing chemicals found in the groundwater during an earlier cleanup action that used high-voltage electricity to heat the subsurface, vaporizing the trichloroethylene (TCE), which was then extracted. However, TCE in the groundwater from C Reactor to Castor Creek still exists in a narrow plume about one mile long.
In 2019, SRS implemented a low-cost, low-energy cleanup method using native microorganisms and emulsified edible oils at C Area to safely reduce the discharge of TCE from groundwater into Castor Creek. Extensive study and testing have proven that a certain type of microbe native to this area actively degrades TCE. SRNS and SRNL collaborated to develop, test, and deploy the emulsified edible oil in T Area. SRNL began studying this treatment option in 2006, followed by a treatability study in T Area in 2008, with additional injections occurring 2010, 2013, and 2015. Based on the successful results in T Area, SRS implemented this remediation at C Area to address the TCE plume.
At C Area, SRS injected approximately 36,000 gallons of edible oil (vegetable oil) mixed with water, a pH buffer, vitamin B12, and vitamin C through 15 injection wells or pipes (one row of 5 locations; one row of 10 locations) driven into the earth to a precise depth within the aquifer below. The injected oil and microbes thoroughly mix with the groundwater moving through this area and coat particles of sand and clay in the subsurface. The TCE in the groundwater adheres to the oil, where microbes consume both, resulting in harmless compounds.
Conservative estimates indicate the Site will treat more than 1 million gallons of groundwater per year. Remediating the groundwater using microbes and oil costs 30-60% less than many traditional types of TCE remediation at SRS.
7.3.4 Conserving SRS Groundwater
As in the past, SRS continues to report its drinking and process water use to SCDHEC. In 2019, SRS used 2.45 million gallons of water per day. Information on SRS water conservation is in Chapter 2, Environmental Management System.
SRS manages its own drinking and process water supply from groundwater beneath the Site. Approximately 40 production wells in widely scattered locations across the Site supply SRS domestic and process water systems. Eight of these wells are domestic water systems that supply drinking water. The other 32 wells provide water for all SRS facility operations. The SRS Environmental Report for 2019 webpage contains a map of SRS domestic water systems under the Environmental Maps heading.
SRNS Employees Take Baseline Groundwater Samples Prior to the Start of the C-Area Cleanup Project

Groundwater Management Program
7-16 Savannah River Site
The A-Area domestic water system now supplies treated water to most Site areas. The system is made up of a treatment plant, distribution piping, elevated storage tanks, and a well network. The wells range in capacity from 200 to 1,500 gallons per minute. Remote facilities, such as field laboratories, barricades, and pump houses, use small drinking water systems and bottled water. SRS domestic water systems meet state and federal drinking water quality standards. SCDHEC samples the systems quarterly for chemical analyses. Monitoring the A-Area water system for bacteria occurs monthly. SCDHEC performs sanitary surveys every two years on the A-Area system and inspects the smaller systems every three years. All 2019 water samples complied with SCDHEC and EPA water quality standards. Information on compliance activities associated with the SRS drinking water system is in Chapter 3, Compliance Summary, Section 3.3.7.2, Safe Drinking Water Act (SDWA).
A, F, H, and S Areas have process water systems to meet SRS demands for boiler feedwater, equipment cooling water, facility washdown water, and makeup water. SRS uses the makeup water for cooling towers, fire storage tanks, chilled-water-piping loops, and Site test facilities. Process water wells ranging in capacity from 100 to 1,500 gallons per minute supply water to these systems. In K Area, L Area, and Z Area, the domestic water system supplies the process water system. At some locations, the process water wells pump to ground-level storage tanks, where SRS implements corrosion control measures. At other locations, the wells directly pressurize the process water distribution piping system without supplemental treatment.

Environmental Report 2019 (SRNS-RP-2020-00064) 8-1
8.1 INTRODUCTION
SRS implements and conducts its QA program to comply with the following regulations: 1) DOE Order 414.1D, Quality Assurance, 2) American Society of Mechanical Engineers (ASME) Nuclear Quality Assurance (NQA) standards NQA-1-2008 with the NQA-1a-2009 Addenda, QA Requirements for Nuclear Facility Applications, and 3) 10 CFR 830, Nuclear Safety Management. In addition, specific programs may have other QA requirements from outside organizations. For example, under the tank closure program and area completion projects, the U.S. Environmental Protection Agency (EPA) and the State of South Carolina require DOE to develop and follow a project-specific sampling and analysis plan and a QA program plan. DOE has QA programs to verify the integrity of analyses from both onsite and subcontracted offsite
2019 Highlights Analytical Laboratory Quality Assurance—SRS continued to use South Carolina Department of Health and Environmental Control (SCDHEC)-certified laboratories to analyze environmental monitoring samples that it reports to SCDHEC.
The U.S. Department of Energy (DOE) Consolidated Audit Program (DOECAP) requires the analytical laboratories providing service to DOE have accreditation through the program. In 2019, three SRS subcontract laboratories that analyzed the environmental samples reported in this document continued to maintain their accreditation, as required to provide analytical services to SRS.
Annually, the DOECAP audits facilities that provide service to DOE. In 2019, DOECAP audited one treatment, storage, and disposal facility (TSDF) and determined this facility to be in good standing and eligible to continue to provide services to DOE
Quality Control Activities—QC samples identified no defects affecting the analytical results of the surveillance and monitoring programs. Onsite and subcontracted laboratories reported acceptable proficiency and maintained SCDHEC certification for all analyses.
he Savannah River Site (SRS) Quality Assurance (QA)/Quality Control (QC) program objectives verify SRS products and services meet or exceed customers’ requirements and expectations. The Environmental Monitoring Program has multiple QA requirements for collecting samples, analyzing and reporting data, and managing records. It is important to confirm the accuracy of sample results so SRS can confidently assess the impacts Site activities may have on human health and the environment.
T Chapter 8: Quality Assurance

Quality Assurance
- 8-2 Savannah River Site
laboratories, and to ensure it is complying with the quality-control program requirements.
The SRS Environmental Monitoring Program uses and disseminates high-quality data to promote environmental stewardship and support other Site missions. The environmental monitoring QA/QC program improves the methods and techniques used to both collect and analyze the environmental data and to prevent errors in generating the data. The QA/QC program includes continuous assessments, precision checks, and accuracy checks, as Figure 8-1 shows. Through an ongoing process, the results of activities in one area provide input to assessments or checks conducted in the other two areas. The result is high-quality data. By combining continuous assessment of field, laboratory, and data management performance with checks for accuracy and precision, SRS ensures that all monitoring and surveillance data accurately represent conditions at SRS. The glossary contains definitions for each term Figure 8-1 presents.
Some elements of the QA/QC program are inherent within environmental monitoring standard procedures and practices. SRS personnel evaluate these elements as part of the continuous assessment process. The DOECAP focuses on assessing specific QA/QC program elements.
8.2 BACKGROUND
DOE Order 414.1D, Quality Assurance, requires an integrated system of management ensuring that the results of the Environmental Monitoring Program meet the requirements of federal and state regulations and DOE Order 458.1, Radiation Protection of the Public and the Environment. SRS uses field and laboratory procedures to guide activities such as collecting samples, analyzing samples, evaluating data, and reporting results. SRS uses an integrated testing system to ensure the integrity of analyses SRS and offsite laboratories perform. This testing includes internal laboratory QA and QC tests and testing associated with state and national testing programs, such as the Mixed Analyte Performance Evaluation Program (MAPEP). In addition, SRS uses QA and QC procedures to verify and control environmental monitoring. Together, these quality measures ensure that the resulting data representatively reflects SRS operational impacts on the health and safety of the public, workers, and the environment.
Chapter 8—Key Terms Quality assurance is an integrated system of management activities involving planning, implementing, documenting, assessing, reporting, and improving quality to ensure quality in the processes through which products are developed. The goal of QA is to improve processes so that defects do not arise when the product is produced. It is proactive.
Quality control is a set of activities that ensure quality in products by identifying defects in the actual products. The goal of QC is to identify and correct defects in the finished product before it is made available to the customer. QC is a reactive process.
In summary, quality assurance makes sure an entity is doing the right things, the right way; quality control makes sure these results are what the entity expected.

Quality Assurance
Environmental Report 2019 (SRNS-RP-2020-00064) 8-3
8.3 QUALITY ASSURANCE PROGRAM SUMMARY
The SRS environmental monitoring QA/QC program focuses on minimizing errors through ongoing assessment and control of the program components. The QA and QC activities are interdependent.
For example, QC identifies an ongoing problem with the quality of the product and alerts QA personnel that there is a problem in the process. QA determines the root cause and extent of the problem and changes the process to eliminate the problem, prevent reoccurrences, and improve product quality.
QA focuses on the processes implemented to produce the data presented in this report. SRS continuously evaluates the Environmental Monitoring Program to identify and implement improvements to the monitoring program. The QA efforts associated with the Environmental Monitoring Program that lead to program improvements are as follows:
• Implement monitoring program changes • Perform DOECAP audits of commercial TSDFs SRS waste generators used • Ensure commercial analytical laboratories maintain DOECAP accreditation
QC activities are the tests and checks that ensure SRS is complying with defined standards. The ongoing QC associated with the Environmental Monitoring Program includes the following:
• Participate in MAPEP by laboratories that perform analytical measurements on SRS samples • Participate in proficiency testing for laboratories performing National Pollutant Discharge
Elimination System (NPDES) and drinking water analyses • Collect and analyze QC samples (duplicates and blind samples) associated with field sampling • Analyze QC samples (blanks, laboratory control samples, duplicates, spikes, and others) associated
with laboratory analysis
Figure 8-1 Interrelationship between QA/QC Activities
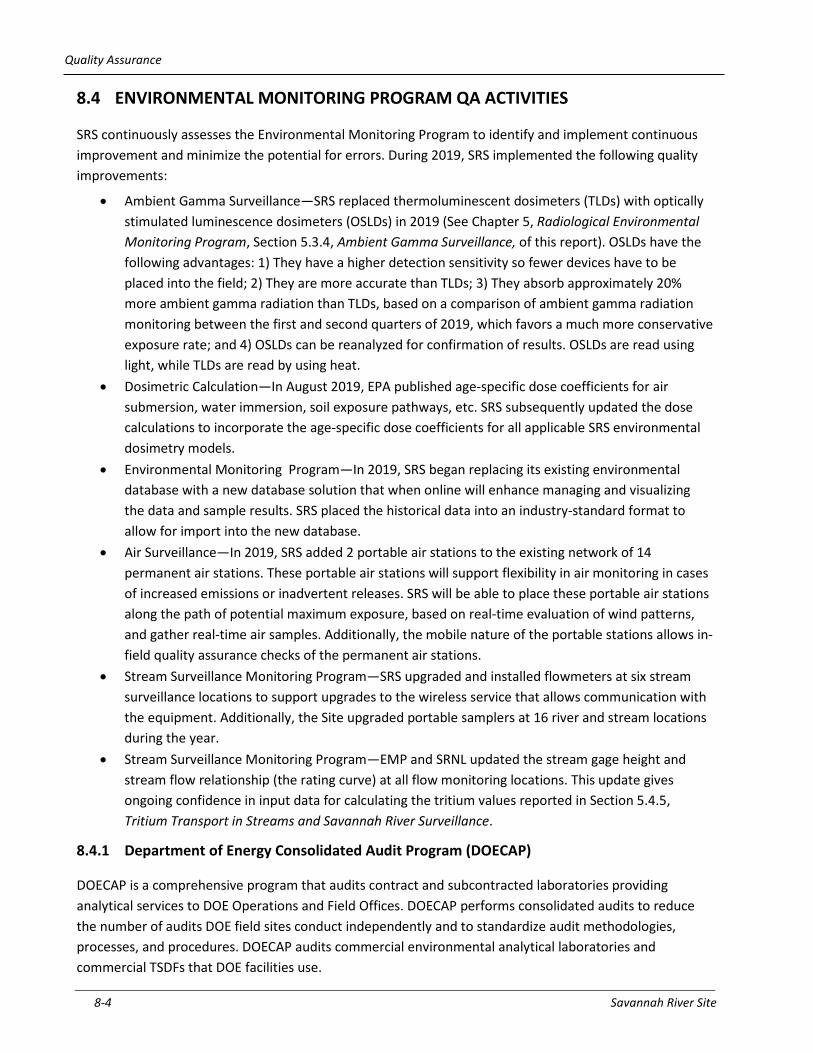
Quality Assurance
- 8-4 Savannah River Site
8.4 ENVIRONMENTAL MONITORING PROGRAM QA ACTIVITIES
SRS continuously assesses the Environmental Monitoring Program to identify and implement continuous improvement and minimize the potential for errors. During 2019, SRS implemented the following quality improvements:
• Ambient Gamma Surveillance—SRS replaced thermoluminescent dosimeters (TLDs) with optically stimulated luminescence dosimeters (OSLDs) in 2019 (See Chapter 5, Radiological Environmental Monitoring Program, Section 5.3.4, Ambient Gamma Surveillance, of this report). OSLDs have the following advantages: 1) They have a higher detection sensitivity so fewer devices have to be placed into the field; 2) They are more accurate than TLDs; 3) They absorb approximately 20% more ambient gamma radiation than TLDs, based on a comparison of ambient gamma radiation monitoring between the first and second quarters of 2019, which favors a much more conservative exposure rate; and 4) OSLDs can be reanalyzed for confirmation of results. OSLDs are read using light, while TLDs are read by using heat.
• Dosimetric Calculation—In August 2019, EPA published age-specific dose coefficients for air submersion, water immersion, soil exposure pathways, etc. SRS subsequently updated the dose calculations to incorporate the age-specific dose coefficients for all applicable SRS environmental dosimetry models.
• Environmental Monitoring Program—In 2019, SRS began replacing its existing environmental database with a new database solution that when online will enhance managing and visualizing the data and sample results. SRS placed the historical data into an industry-standard format to allow for import into the new database.
• Air Surveillance—In 2019, SRS added 2 portable air stations to the existing network of 14 permanent air stations. These portable air stations will support flexibility in air monitoring in cases of increased emissions or inadvertent releases. SRS will be able to place these portable air stations along the path of potential maximum exposure, based on real-time evaluation of wind patterns, and gather real-time air samples. Additionally, the mobile nature of the portable stations allows in-field quality assurance checks of the permanent air stations.
• Stream Surveillance Monitoring Program—SRS upgraded and installed flowmeters at six stream surveillance locations to support upgrades to the wireless service that allows communication with the equipment. Additionally, the Site upgraded portable samplers at 16 river and stream locations during the year.
• Stream Surveillance Monitoring Program—EMP and SRNL updated the stream gage height and stream flow relationship (the rating curve) at all flow monitoring locations. This update gives ongoing confidence in input data for calculating the tritium values reported in Section 5.4.5, Tritium Transport in Streams and Savannah River Surveillance.
8.4.1 Department of Energy Consolidated Audit Program (DOECAP)
DOECAP is a comprehensive program that audits contract and subcontracted laboratories providing analytical services to DOE Operations and Field Offices. DOECAP performs consolidated audits to reduce the number of audits DOE field sites conduct independently and to standardize audit methodologies, processes, and procedures. DOECAP audits commercial environmental analytical laboratories and commercial TSDFs that DOE facilities use.

Quality Assurance
Environmental Report 2019 (SRNS-RP-2020-00064) 8-5
8.4.1.1 DOECAP Laboratory Audits
The DOECAP laboratory audit program is a formal accreditation program that DOE requires of commercial laboratories that perform analyses for the DOE Complex. A DOECAP-approved third-party accreditation body must assess a laboratory for it to receive and maintain DOECAP accreditation. The DOECAP-approved accreditation bodies evaluate laboratories based on technical capability and competence, along with their proficiency in complying with DOE QA requirements. The accreditation bodies assess how well the laboratories document incoming samples, calibrate instruments, adhere to analytical procedures, verify data, issue data reports, manage records, perform nonconformance and corrective actions, perform preventative maintenance, and dispose of samples. Within these topics, auditors evaluate how the laboratories use control charts, control standards, chemical recoveries, performance evaluation samples, and laboratory procedures.
In 2019, the three subcontracted laboratories that analyze the environmental samples documented in this annual report maintained their accreditation and continued to provide service to DOE and SRS.
8.4.1.2 DOECAP TSDF Audits
DOECAP performs annual audits of the commercial TSDFs SRS uses to treat and dispose of mixed and hazardous waste. These reviews ensure that TSDFs are meeting contract requirements and are complying with applicable local, state, and federal regulations. DOECAP uses functional area checklists to conduct the following audits: QA, analytical data quality, environmental compliance, radiological controls, waste operations, safety and industrial hygiene, and transportation.
In 2019, SRS provided three auditors that participated in the DOECAP audit of one commercial TSDF. A review of the final audit report of the commercial TSDF indicated that there were no significant findings that would cause SRS waste generators to discontinue using the commercial TSDF.
8.5 ENVIRONMENTAL MONITORING PROGRAM QC ACTIVITIES
An important part of SRS Environmental Monitoring Program QC activities is to ensure that personnel collect and analyze samples to the highest standard and without errors. The Site collects quality control samples and analyzes them to identify any collection and analysis errors. All laboratories analyzing samples for the SRS Environmental Monitoring Program must participate in QC programs that either SCDHEC or DOE directs.
8.5.1 QC Sampling
SRS personnel collect and transport several types of QC samples, including blinds, field duplicates, trip blanks, and field blanks throughout the year to determine the source of any measurement error.
SRS personnel routinely analyze blind samples (a sample with a composition known to the submitter, but not to the analyst) of field measurements of potential of hydrogen (pH) to assess the quality and reliability of field data measurements. Twenty-four blind sample results were within the acceptable limit of less than

Quality Assurance
- 8-6 Savannah River Site
0.4 standard unit difference between the original and blind samples. Analysis of blind samples tests the analyst’s proficiency in performing the specified analysis.
During intra-laboratory checks performed for the NPDES industrial wastewater program, SRS personnel collect blind and duplicate field samples for at least 10% of each outfall’s required frequency. For example, if an outfall has a monthly sampling requirement, then SRS collects two blinds and two duplicates during the year. SRS onsite and subcontracted laboratories also analyze duplicate samples for the water quality (nonradiological) program. Each month, SRS collects duplicate samples at one river and one stream location to verify analytical results. SRS also collects duplicate samples for both the radiological and nonradiological sediment samples.
The relative percent difference (RPD) between each sample result and the result of the corresponding blind or duplicate (when both values are at least five times above the detection limit) should be less than or equal to 20%. Table 8-1 summarizes 1) the blind and duplicate sample analyses associated with the NPDES industrial wastewater program, 2) the blind and duplicate sample analyses associated with the river and stream water quality program, 3) both the nonradiological and radiological blind and duplicate sample analyses for river, stream, and basin sediment programs, and 4) the number of impacted analytes per program and sample type. This table addresses analyses both SRS and offsite subcontracted laboratories conduct. Processing duplicate samples evaluates the accuracy of the analytical and measurement methods the laboratories use. Ninety-six percent of the blind samples, 98% of the NPDES duplicate samples, 92% of the water quality duplicate samples, 79% of the nonradiological sediment duplicate samples, and 95% of the radiological sediment duplicate samples met the acceptable difference limit. Reasons for results differing for the programs include analytical uncertainties associated with the measurements, such as the precision of the analytical instruments and detection limits of the analytical instruments.
Although results indicate there were some differences between the quality control samples and their corresponding compliance samples, they did not impact conclusions made with the data. The results
Program and Sample Type Number of Analyses
Number of Analyses within Acceptable Limits
(RPD between results < 20%)
Number of Analyses Outside Acceptable
Limits (RPD between results > 20%)
Number of
Impacted Analytes
NPDES Blind 200 192 8 2
NPDES Duplicate 222 218 4 1
Water Quality River/Stream Duplicate
1,080 1,040 40 6
Nonradiological River/Stream/Basin Sediment Duplicate
96 76 20 7
Radiological River/Stream/Basin Sediment Duplicate
42 40 2 1
Table 8-1 Summary of Laboratory Blind and Duplicate Sample Analyses

Quality Assurance
Environmental Report 2019 (SRNS-RP-2020-00064) 8-7
indicate that in 2019 there were no consistent problems with either sample collection or laboratory analysis techniques.
Table 8-2 summarizes the results of field and trip blank analyses associated with the NPDES program. Field blanks determine whether the field sampling and sample processing environments have contaminated the sample. A trip blank documents contamination associated with shipping and field-handling procedures. The analytical results indicate neither sampling nor shipping techniques contributed to contaminants in the actual samples as discussed in Chapter 4, Nonradiological Environmental Monitoring Program.
Table 8-2 Summary of Trip and Field Blank Sample Analyses
Program and Sample Type Number of Samples Analyzed Number of Samples with Results Below Detection Limits
NPDES Trip Blank 42 42
NPDES Field Blank 10 10
8.5.2 Laboratory Proficiency Testing
8.5.2.1 Nonradiological Methods Proficiency Testing
SRS laboratories performing NPDES and drinking water analyses maintained state certification for all analyses after achieving acceptable results in SCDHEC-required proficiency testing. Proficiency testing is also known as comparative testing and evaluates a laboratory’s performance against pre-established criteria by testing the same samples at other laboratories and comparing the results. South Carolina State Regulation 61-81, State Environmental Laboratory Certification Program, requires the testing. All laboratories used proficiency-testing providers that SCDHEC approved.
During 2019, onsite and subcontracted laboratories participated in water pollution and water supply performance evaluation studies. Onsite laboratories reported proficiency of 100%, and subcontracted laboratories reported proficiency greater than 90% for the parameters tested for NPDES and drinking water laboratories. Both onsite and subcontracted laboratories maintained SCDHEC certification for all analyses at SRS.
The laboratories develop corrective actions for the failed analyses that they document and submit to SCDHEC, along with passing proficiency testing results for those analyses. The objective of the corrective actions is to prevent a reoccurrence of failed analyses, if any. These corrective actions may include modifying sample preparation or analysis procedures. The underlying reasons for the unacceptable measurements did not affect the analyses provided to SRS in support of the NPDES and drinking water monitoring programs.

Quality Assurance
- 8-8 Savannah River Site
8.5.2.2 Radiological Methods Proficiency Testing
All laboratories with licenses to handle and analyze radioactive materials must participate in MAPEP to support DOE’s Environmental Management activities. MAPEP is a laboratory comparison program that tracks performance accuracy and tests the quality of environmental data reported to DOE. One SRS laboratory and two SRS contracted laboratories continue to participate in MAPEP, analyzing MAPEP performance evaluation samples including water, soil, air filter, and vegetation matrices for stable inorganic, organic, and radioactive elements representative of those at DOE sites.
MAPEP offered two separate studies in 2019. Both MAPEP studies included soil, vegetation, water, air filter, and unknown matrix test samples. The SRS Environmental Laboratory participated in the two studies, receiving 99% acceptable results in both MAPEP 40 and MAPEP 41 studies. One of two unacceptable values for the year, U-238 in MAPEP 40, was due to a transcription error, which would not impact normal samples. The second was a false positive result.
Two SRS subcontracted laboratories also participated in the MAPEP 40 studies, receiving 100% acceptable results for both water and soil matrices. Only one SRS subcontracted laboratory participated in the MAPEP 41 study, receiving 99% acceptable results for both water and soil matrices. SRS sent all applicable environmental samples to the subcontracted laboratory, which continued to successfully participate in the MAPEP program.
When a laboratory fails an analysis, it will develop corrective actions for that failed analysis to prevent a reoccurrence. These corrective actions may include modifying procedures for preparing and analyzing samples.
8.6 RECORDS MANAGEMENT
Environmental Monitoring Program documentation is an important part of the SRS environmental program. The SRS Environmental Report is the public record of the SRS Environmental Monitoring Program’s performance. SRS compiles it every year following guidelines in DOE Order 231.1B, Environment, Safety, and Health Reporting.
The SRS Environmental Report communicates results of the Environmental Monitoring Program, and groundwater management and compliance programs to government agencies and the public. In addition to the SRS Environmental Report, SRS generates various records and reports to document SRS nonradiological and radiological environmental programs, groundwater management, and Site compliance with applicable regulations. SRS maintains these documents and the records generated as part of the SRS Environmental Monitoring Program, in accordance with SRS records management procedures.

Environmental Report 2019 (SRNS-RP-2020-00064) A-1 Appendix A
Appendix A: Environmental Management System

Appendix A: Environmental Management System
A-2 Savannah River Site
This page intentionally left blank
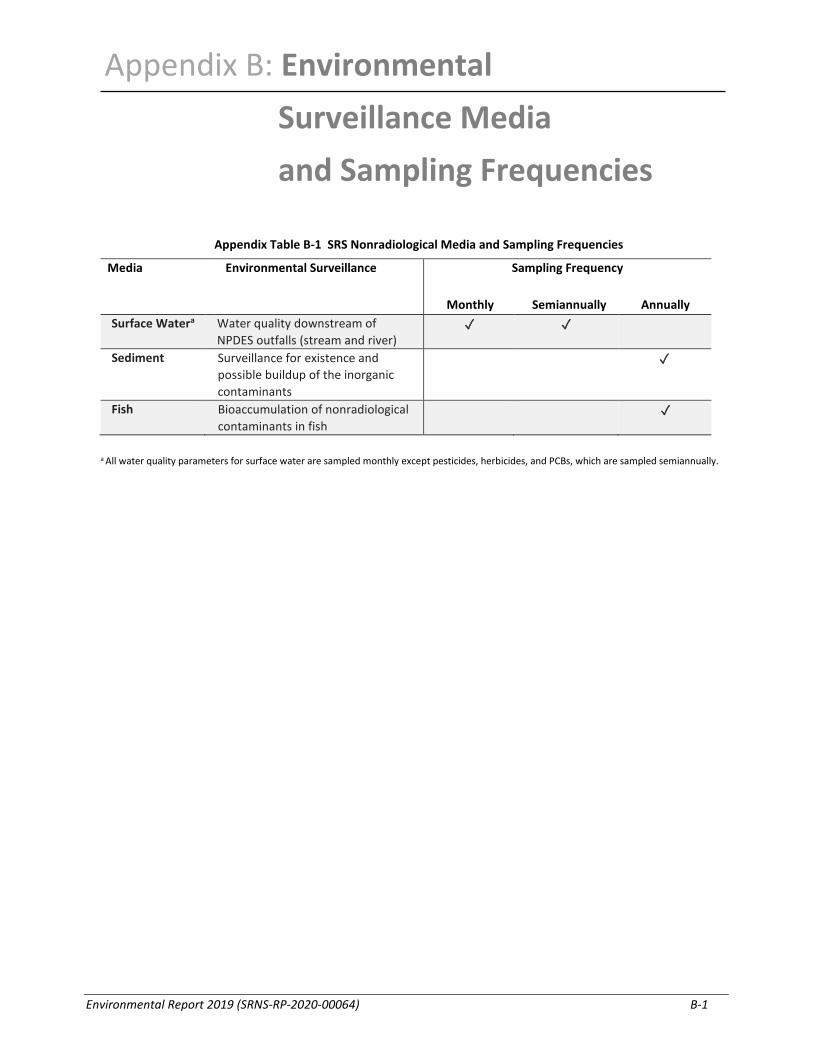
Environmental Report 2019 (SRNS-RP-2020-00064) B-1
Appendix Table B-1 SRS Nonradiological Media and Sampling Frequencies
Media Environmental Surveillance Sampling Frequency
Monthly Semiannually Annually Surface Watera Water quality downstream of
NPDES outfalls (stream and river) ✓ ✓
Sediment Surveillance for existence and possible buildup of the inorganic contaminants
✓
Fish Bioaccumulation of nonradiological contaminants in fish
✓
a All water quality parameters for surface water are sampled monthly except pesticides, herbicides, and PCBs, which are sampled semiannually.
Appendix B: Environmental Surveillance Media and Sampling Frequencies

Appendix B: Environmental Surveillance Media and Sampling Frequencies
B-2 Savannah River Site
Appendix Table B-2 SRS Radiological Media and Sampling Frequencies
Media Environmental Surveillance
Sampling Frequency
Weekly Bi-Weekly Monthly Quarterly Annually
Air Airborne particulate matter ✓ Gaseous state of radioiodine
✓
Tritiated water vapor ✓ Tritium in rainwater ✓
Soil Radionuclide deposition into soils
✓
Food Products
Radionuclides uptake in the food chain
✓
Vegetation Radionuclide uptake in plants
✓
TLDs Ambient gamma radiation monitoring
✓
Water Onsite drinking water ✓ ✓ Offsite drinking water ✓ Onsite surface water (Streams and basins)
✓ ✓ ✓
Savannah River ✓ ✓ Sediment Radionuclides in
streambeds, the Savannah River bed, and SRS basin beds
✓
Fish and Shellfish
Radionuclides in freshwater fish, saltwater fish, and shellfish
✓
Wildlife Radionuclides in onsite deer, feral hogs, turkey, and coyotes during SRS-sponsored hunts
✓

Environmental Report 2019 (SRNS-RP-2020-00064) C-1
Appendix B Appendix Table C-1 River and Stream Water Quality Results Summary Five river and 10 stream locations were sampled monthly in 2019, totaling 306 samples per analyte (except TB-5, which had 285 samples due to “no flow” on 11/19) or 4,569 records. Field duplicates are not included in the generation of these tables. DL-Detection Limit DO-Dissolved Oxygen TOC-Total Organic Carbon TSS-Total Suspended Solids Notes:
1. The DO value in the maximum column is a minimum value because the South Carolina Freshwater Quality Standard is based on a minimum value.
2. The pH value in the average column is a minimum value because the South Carolina Freshwater Quality Standard includes minimum and maximum limits.
Appendix C: Nonradiological Environmental Monitoring Program Supplemental Information

Appendix C: Nonradiological Environmental Monitoring Program Supplemental Information
C-2 Savannah River Site
Four River Locations Plus One Control
Analyte SC Freshwater
Quality Std. (µg/L) Unit
Number of Results
Outside Std.
Number of Results
> DL
Control
Highest River Location RM 161.0
Avg.a Max.b Avg.a Max.b DO c min. 4.0 mg/L 0 of 60
8.9 7.1 RM-129.1 8.3 RM-129.1 6.3
pH d 6.0-8.5 SU 2 of 60 5.99 7.4 RM-118.8 5.95 RM-118.8 7.4
Temperature < 5° F (2.8° C) above nat. cond. and not
> 90° F (32.2° C) ° C 1 of 60 19 26 RM-118.8,
RM-141.5 20 RM-141.5 34
Aluminum 87 e µg/L 41 of 60 46 of 60 214 821 RM-141.5 292 RM-129.1 762
Beryllium none µg/L no standard 4 of 60 All < DL RM-141.5 0.2 RM-141.5 0.6
Cadmium 0.1 µg/L 2 of 60 16 of 60 0.1 0.1 RM-141.5 0.1 RM-141.5 0.12
Chromium 11 µg/L 0 of 60 1 of 60 All < DL RM-141.5 2 RM-141.5 3
Copper 2.9 µg/L 1 of 60 5 of 60 All < DL RM-141.5 2.2 RM-141.5 3.9
Hardness (total) none mg/L no standard 58 of 60 16 22 RM-129.1 29 RM-129.1 60
Iron 1,000 f µg/L 0 of 60 60 of 60 357 840 RM-129.1 524 RM-141.5 748
Lead 0.54 µg/L 4 of 60 60 of 60 0.25 0.81 RM-118.8 0.26 RM-150.4 0.64
Manganese none µg/L no standard 60 of 60 71 145 RM-150.4 68 RM-150.4 104
Mercury 0.91 µg/L 0 of 60 0 of 60 All < DL All < DL All < DL
Nickel 16 µg/L 1 of 60 7 of 60 3 5 RM-129.1 8 RM-129.1 61
Nitrate-Nitrogen 1 g mg/L 0 of 60 60 of 60 0.3 0.4 RM-118.8 0.3 RM-118.8 0.5
Nitrite-Nitrogen 1 g mg/L 0 of 60 60 of 60 0.01 0.01 RM-150.4 0.01 RM-141.5 0.01
Thallium none µg/L no standard 6 of 60 All < DL RM-141.5 13 RM-141.5 23
TOC none mg/L no standard 60 of 60 3 4 RM-129.1 4 RM-129.1 11
Phosphorus 0.06 mg/L 47 of 60 58 of 60 0.16 0.33 RM-118.8 0.13 RM-118.8, RM-129.1 0.25
TSS none mg/L no standard 59 of 60 5 20 RM-118.8 7 RM-118.8 17
Zinc 37 µg/L 0 of 60 42 of 60 5 10 RM-118.8 5 RM-141.5 14

Appendix C: Nonradiological Environmental Monitoring Program Supplemental Information
Environmental Report 2019 (SRNS-RP-2020-00064) C-3
Eight Stream Locations Plus Two Controls
Analyte
SC Freshwater Quality Std.
(µg/L) Unit
Number of Results
Outside Std.
Number of Results
> DL
Highest Stream Location Control TC-1 Control U3R-0
Avg.a Max.b Avg.a Max.b Avg.a Max b
DO c min. 4.0 mg/L 5 of 119
8.5 6.4 8.6 7.5 FMC-2 4.5 FMC-2 1.2
pH d 6.0-8.5 SU 18 of 119 5.8 8.3 5.6 8.1 FMC-2 5.2 SC-4 8.0
Temperature < 5° F (2.8° C) above nat. cond. and not
> 90° F (32.2° C) ° C 0 of 119 18 18 23 SC-4 21 SC-4 30
Aluminum 87 5 µg/L 51 of 119 69 of 119 103 306 155 451 PB-3 219 TB-5 1,480
Beryllium none µg/L no standard 10 of 119 All < DL 0.1 0.1 U3R-4 0.1 U3R-4 0.2
Cadmium 0.1 µg/L 5 of 119 18 of 119 0.06 0.12 All < DL FMC-2 0.07 SC-4 0.3
Chromium 11 µg/L 0 of 119 2 of 119 All < DL All < DL TB-5 2 TB-5 2
Copper 2.9 µg/L 4 of 119 5 of 119 All < DL All < DL FMC-2 3.1 FMC-2 9.6
Hardness (total) none mg/L no standard 92 of 119 13 20 4 12 L3R-2 41 L3R-2 62
Iron 1,0006 µg/L 39 of 119 119 of 119 475 966 423 839 FM-2B 4,354 FM-2B 13,100
Lead 0.54 µg/L 9 of 119 117 of 119 0.21 0.38 0.36 0.85 TB-5 0.37 TB-5 1.72
Manganese none µg/L no standard 119 of 119 25 56 9 18 FM-2B 283 FM-2B 942
Mercury 0.91 µg/L 0 of 119 7 of 119 All < DL All < DL FMC-2 0.02 FMC-2 0.04
Nickel 16 µg/L 0 of 119 17 of 119 3 5 3 5 TB-5 4 FMC-2 9
Nitrate-Nitrogen 1g mg/L 0 of 119 118 of 119 0.1 0.2 0.4 0.5 FM-6 0.6 FMC-2 0.9
Nitrite-Nitrogen 1g mg/L 0 of 119 46 of 119 0.004 0.012 0.004 0.016 FMC-2 0.01 FMC-2 0.04
Thallium none µg/L no standard 11 of 119 13 16 14 27 FMC-2 13 FMC-2 22
TOC none mg/L no standard 119 of 119 4 9 2 10 FMC-2 8 U3R-4 20
Phosphorus 0.06 mg/L 85 of 119 99 of 119 0.14 0.33 0.06 0.12 TB-5 0.16 TB-5 0.44
TSS none mg/L no standard 115 of 119 5 14 6 16 FM-2B 17 TB-5 108

Appendix C: Nonradiological Environmental Monitoring Program Supplemental Information
C-4 Savannah River Site
Analyte
SC Freshwater Quality Std.
(µg/L) Unit
Number of Results
Outside Std.
Number of Results
> DL
Highest Stream Location Control TC-1 Control U3R-0
Avg.a Max.b Avg.a Max.b Avg.a Max b
Zinc 37 µg/L 3 of 119 98 of 119 4 8 6 17 L3R-2 16 FMC-2 53
Note: The following pesticides, herbicides and PCBs were sampled semiannually in 2019: Aldrin, Aroclor 1016, Aroclor 1221, Aroclor 1232, Aroclor 1242, Aroclor 1248, Aroclor 1254, Aroclor 1260, alpha-BHC, beta-BHC, delta-BHC, gamma-BHC (Lindane), Chlordane, 4,4'-DDD, 4,4'-DDE, 4,4'-DDT, Dieldrin, Endosulfan I, Endosulfan II, Endosulfan sulfate, Endrin, Endrin aldehyde, Heptachlor, Heptachlor epoxide, Toxaphene, 2,4-D and 2,4,5-TP (Silvex). 810 analytical records were reviewed. All results were < DL. a When results fell below the detection limit, the detection limit value was used to determine average b Maximum detected value c Min. (versus Max.) value reported d Min. (versus Avg.) value reported e EPA Region 4 Ecological Risk Assessment Supplemental Guidance, March 2018 Update f EPA National Recommended Water Quality Criteria - Aquatic Life g Per SCDHEC Environmental Surveillance and Oversight Program 2017 Data Report (CR-004111 2/19)

Appendix C: Nonradiological Environmental Monitoring Program Supplemental Information
Environmental Report 2019 (SRNS-RP-2020-00064) C-5
Appendix Table C-2 Summary of Nonradiological Results for Sediments Collected from the
Savannah River, SRS Streams, and Stormwater Basins
SRS collected annual sediment samples at 23 locations in 2019: 8 Savannah River, 12 stream, and 3 stormwater basins, totaling 367 analytes. Locations sampled are as follows: Savannah River locations (BDC RM, RM 118.7, RM 129, RM 150.2, RM 150.4 [Vogtle discharge], RM 157.2, RM 161.0, and SC RM), SRS Stream locations (BDC, FMC @ Rd A, L3R-1A, L3R-2, McQB at MO, McQB below Z-Basin, PB @ Rd A, SC-4, TC-1, U3R-0, U3R-3 and U3R-4), and SRS Stormwater Basin locations (E-004, E-05, and E-06). The control location for the river samples is RM 161.0. The control locations for the stream and stormwater basin sediment samples is TC-1 and U3R-0.
The table compares all results to EPA Region 4 Refinement Screening Values (RSVs) for sediment and shows the maximum value of each analyte for the river, stream, and stormwater basin samples. Locations exceeding RSVs are shown in red text. One analyte, uranium, was not sampled at McQB below Z Basin due to an administrative error; results from previous years were well below its RSV.
River Sediment Results
Seven River Locations Plus One Control
Analyte Number of Detected Results
Control RM 161.0 (mg/kg)
Location of Maximum
Result
Maximum Conc
(mg/kg)
EPA Region 4 RSV for Sediment
(mg/kg)
Number of Results > RSV
Aluminum 8 of 8 7,800 RM 157.2 40,000 58,000 0
Arsenic 6 of 8 1 RM 157.2 3 33 0
Barium 8 of 8 62 RM 157.2 170 60 7
Chromium 8 of 8 11 RM 157.2 38 111 0
Copper 8 of 8 5 RM 157.2 26 149 0
Iron 8 of 8 9,800 RM 157.2 28,000 40,000 0
Lead 8 of 8 5 RM 157.2 26 128 0
Manganese 8 of 8 570 BDC RM & RM 118.7
1,100 1,100 0
Nickel 8 of 8 4.3 RM 157.2 19 48.6 0
Zinc 8 of 8 20 RM 157.2 78 459 0
Note:
Antimony, cadmium, mercury, selenium, silver, and uranium were nondetects.

Appendix C: Nonradiological Environmental Monitoring Program Supplemental Information
C-6 Savannah River Site
Stream Sediment Results
10 Stream Locations Plus 2 Controls
Analyte Number of Detected Results
Control TC-1
(mg/kg)
Control U3R-0
(mg/kg)
Location of Maximum
Result
Maximum Conc
(mg/kg)
EPA Region 4 RSV for Sediment
(mg/kg)
Number of Results > RSV
Aluminum 12 of 12 2,900 5,000 BDC 42,000 58,000 0
Arsenic 6 of 12 < DL < DL McQB at MO 6 33 0
Barium 12 of 12 39 58 McQB at MO 170 60 2
Cadmium 2 of 12 < DL < DL FMC @ Rd A 0.4 5 0
Chromium 12 of 12 5 8 McQB at MO 37 111 0
Copper 11 of 12 2 4 McQB at MO 40 149 0
Iron 12 of 12 1,900 3,100 McQB at MO 26,000 40,000 0
Lead 12 of 12 5 12 McQB at MO 21 128 0
Manganese 12 of 12 63 12 FMC @ Rd A 403 1,100 0
Mercury 7 of 12 < DL < DL L3R-1A 0.2 1.1 0
Nickel 11 of 12 2.5 < DL McQB at MO 17.0 48.6 0
Selenium 2 of 12 < DL < DL McQB below Z-Basin
3.3 2.9 1
Zinc 12 of 12 10 8 McQB at MO 99 459 0
Note: Antimony, silver, and uranium were nondetects.
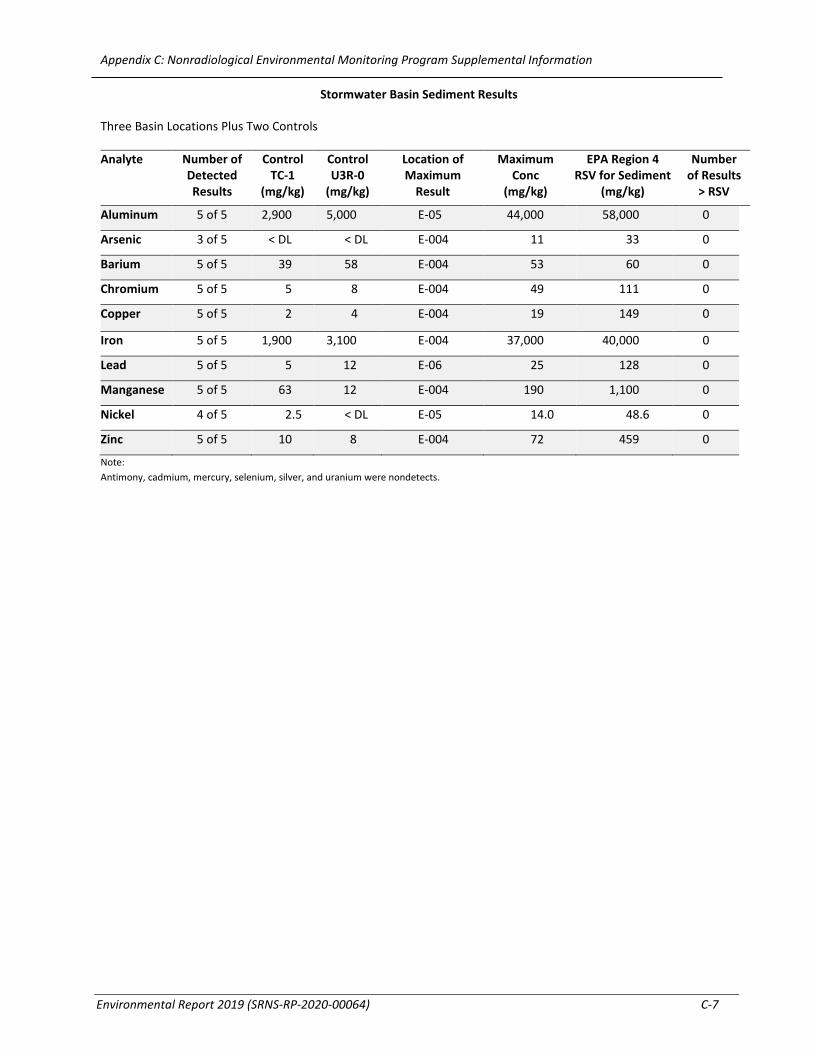
Appendix C: Nonradiological Environmental Monitoring Program Supplemental Information
Environmental Report 2019 (SRNS-RP-2020-00064) C-7
Stormwater Basin Sediment Results
Three Basin Locations Plus Two Controls
Analyte Number of Detected Results
Control TC-1
(mg/kg)
Control U3R-0
(mg/kg)
Location of Maximum
Result
Maximum Conc
(mg/kg)
EPA Region 4 RSV for Sediment
(mg/kg)
Number of Results
> RSV
Aluminum 5 of 5 2,900 5,000 E-05 44,000 58,000 0
Arsenic 3 of 5 < DL < DL E-004 11 33 0
Barium 5 of 5 39 58 E-004 53 60 0
Chromium 5 of 5 5 8 E-004 49 111 0
Copper 5 of 5 2 4 E-004 19 149 0
Iron 5 of 5 1,900 3,100 E-004 37,000 40,000 0
Lead 5 of 5 5 12 E-06 25 128 0
Manganese 5 of 5 63 12 E-004 190 1,100 0
Nickel 4 of 5 2.5 < DL E-05 14.0 48.6 0
Zinc 5 of 5 10 8 E-004 72 459 0
Note: Antimony, cadmium, mercury, selenium, silver, and uranium were nondetects.
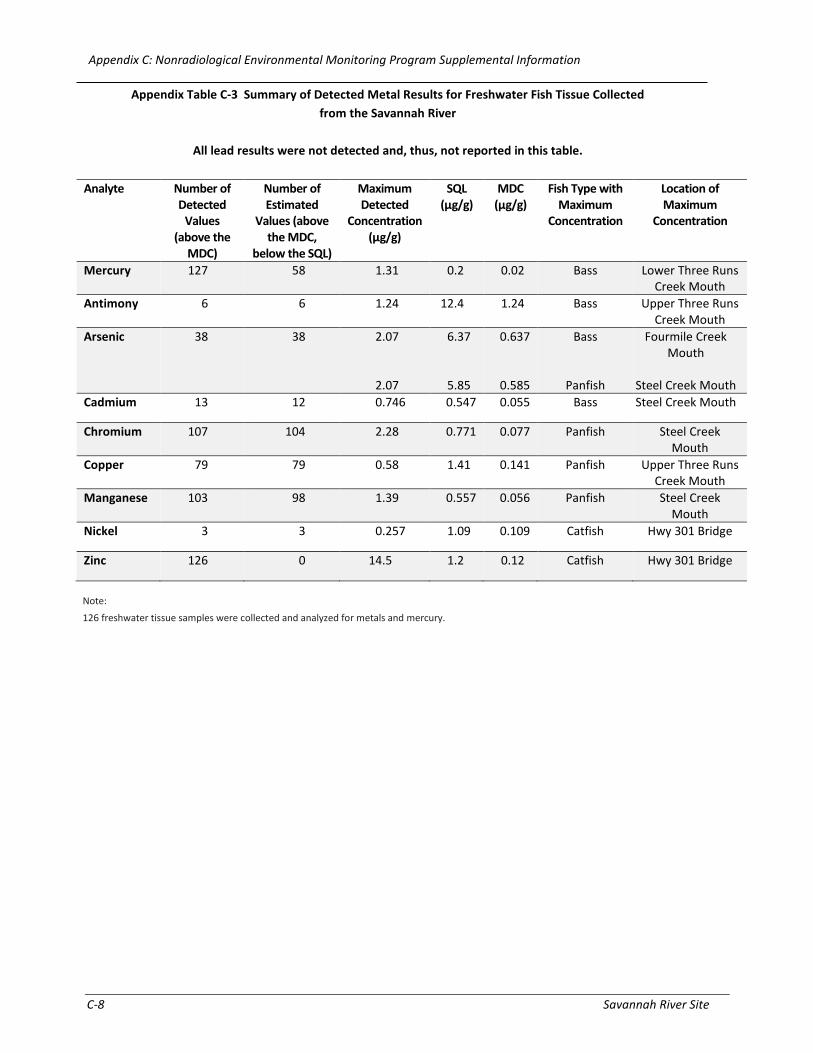
Appendix C: Nonradiological Environmental Monitoring Program Supplemental Information
C-8 Savannah River Site
Appendix Table C-3 Summary of Detected Metal Results for Freshwater Fish Tissue Collected from the Savannah River
All lead results were not detected and, thus, not reported in this table.
Analyte Number of
Detected Values
(above the MDC)
Number of Estimated
Values (above the MDC,
below the SQL)
Maximum Detected
Concentration (µg/g)
SQL (µg/g)
MDC (µg/g)
Fish Type with Maximum
Concentration
Location of Maximum
Concentration
Mercury 127 58 1.31 0.2 0.02 Bass Lower Three Runs Creek Mouth
Antimony 6 6 1.24 12.4 1.24 Bass Upper Three Runs Creek Mouth
Arsenic 38 38 2.07
2.07
6.37
5.85
0.637
0.585
Bass
Panfish
Fourmile Creek Mouth
Steel Creek Mouth
Cadmium 13 12 0.746 0.547 0.055 Bass Steel Creek Mouth
Chromium 107 104 2.28 0.771 0.077 Panfish Steel Creek Mouth
Copper 79 79 0.58 1.41 0.141 Panfish Upper Three Runs Creek Mouth
Manganese 103 98 1.39 0.557 0.056 Panfish Steel Creek Mouth
Nickel 3 3 0.257 1.09 0.109 Catfish Hwy 301 Bridge
Zinc 126 0 14.5 1.2 0.12 Catfish Hwy 301 Bridge
Note:
126 freshwater tissue samples were collected and analyzed for metals and mercury.

Appendix C: Nonradiological Environmental Monitoring Program Supplemental Information
Environmental Report 2019 (SRNS-RP-2020-00064) C-9
Appendix Table C-4 Summary of Detected Metal Results for Saltwater Fish Tissue Collected from the Savannah River between River Miles 0–8, Near Savannah, Georgia
All antimony, cadmium, lead, mercury, and nickel results were not detected and, thus, not
reported in this table.
All Results are for Mullet.
Analyte Number of Detected Values (above the MDC)
Number of Estimated Values (above the MDC,
below the SQL)
Maximum Detected
Concentration (µg/g)
SQL (µg/g)
MDC (µg/g)
Arsenic 2 2 0.671 5.39 0.539 Chromium 7 7 0.184 0.573 0.057 Copper 7 7 0.226 1.31 0.131 Manganese 6 6 0.103 0.571 0.057 Zinc 7 0 4.28 1.41 0.141
Note: Seven saltwater tissue samples were collected and analyzed for metals and mercury.
Appendix C: Nonradiological Environmental Monitoring Program Supplemental Information
C-10 Savannah River Site
This page intentionally left blank
Environmental Report 2019 (SRNS-RP-2020-00064) D-1
Appendix D: Radiological Environmental Monitoring Program Supplemental Information Appendix C Radiological Environmental Mo
Negative values are reported in tables in this appendix. Background counts are subtracted from the sample counts. Negative values occur when the background count is greater than the sample count. Background counts reflect naturally occurring radionuclides and cosmic radiation that is detected by laboratory instrumentation.

Appendix D: Radiological Environmental Monitoring Program Supplemental Information
D-2 Savannah River Site
Appendix Table D-1 Summary of Radioactive Atmospheric Releases by Source
All values under the “Calculated” column through “Totals” column are reported in curies.a
In the Calculated column, blanks indicate the radionuclide is not present. In the facility (Reactors, Separations, SRNL) columns, a blank indicates the radionuclide was not analyzed. A 0.00E+00 in the facility columns indicates the result was not significant.
Radionuclide Half-Life
Time Interval b Calculated c Reactors Separations d SRNL Total
Gases and Vapors H-3 (oxide) 12.3 y 2.46E+02 9.85E+02 6.71E+03
7.94E+03
H-3 (elemental) 12.3 y
1.31E+03
1.31E+03 H-3 Total 12.3 y 2.46E+02 9.85E+02 8.02E+03
9.25E+03
C-14 5700 y 9.48E-08
5.00E-02
5.00E-02 Hg-203 46.6 d 6.51E-10
6.51E-10
Kr-85 10.8 y
1.07E+04
1.07E+04 I-129 1.57E+07 y 4.31E-05
9.95E-03 8.67E-07 9.99E-03
I-131 8.02 d 7.01E-10
7.01E-10 Particles
Ag-110m 250 d 1.48E-11
1.48E-11 Am-241 432 y 1.13E-05 0.00E+00 6.07E-06
1.73E-05
Am-243 7370 y 3.97E-09
3.97E-09 Ba-133 10.5 y 7.74E-07
7.74E-07
Cd-109 461 d 1.68E-08
1.68E-08 Ce-139 138 d 6.71E-10
6.71E-10
Ce-141 32.5 d 4.94E-11
4.94E-11 Ce-144 285 d 2.00E-08
2.00E-08
Cf-249 351 y 7.89E-12 7.89E-12 Cf-251 900 y 1.78E-11 1.78E-11 Cm-243 29.1 y 2.90E-09
2.90E-09
Cm-244 18.1 y 2.75E-07 0.00E+00 2.39E-08
2.99E-07 Co-57 272 d 6.41E-10
6.41E-10
Co-58 70.9 d
1.04E-06
1.04E-06 Co-60 5.27 y 6.30E-07 0.00E+00 0.00E+00 0.00E+00 6.30E-07 Cs-134 2.06 y 4.32E-07
4.32E-07
Cs-137 30.2 y 3.84E-03 0.00E+00 3.42E-05 0.00E+00 3.88E-03 Eu-152 13.5 y 1.90E-09
1.90E-09
Eu-154 8.59 y 3.56E-07
3.56E-07 Eu-155 4.76 y 1.18E-07
1.18E-07
F-18 110 m 4.00E-02
4.00E-02
Fe-55 2.74 y 8.04E-09
8.04E-09 Mn-54 312 d 6.01E-10
6.01E-10

Appendix D: Radiological Environmental Monitoring Program Supplemental Information
Environmental Report 2019 (SRNS-RP-2020-00064) D-3
Appendix Table D-1 Summary of Radioactive Atmospheric Releases by Source (continued)
Radionuclide Half-Life Time Interval b
Calculated c Reactors Separations d SRNL Total
Particles Nb-94 2.03E+04 y 2.42E-07 2.42E-07 Nb-95 35.0 d 3.63E-07 3.63E-07 Ni-59 1.01E+05 y 5.76E-11
5.76E-11
Ni-63 100 y 7.41E-09
7.41E-09 Np-237 2.14E+06 y 1.55E-06 0.00E+00 6.80E-08
1.61E-06
Pa-233 27.0 d 1.42E-06
1.42E-06 Pb-212 10.6 h 8.43E-07
8.43E-07
Pm-147 2.62 y 2.89E-06
2.89E-06 Pm-148m 41.3 d 1.90E-12
1.90E-12
Pr-144 17.3 m 2.00E-08
2.00E-08 Pu-236 2.86 y 5.52E-10
5.52E-10
Pu-238 87.7 y 3.13E-05 4.42E-10 4.39E-06
3.57E-05 Pu-239 2.41E+04 y 6.84E-05 0.00E+00 7.01E-05
1.38E-04
Pu-240 6560 y 7.68E-06
7.68E-06 Pu-241 14.4 y 2.07E-04
2.07E-04
Pu-242 3.75E+05 y 3.28E-06
3.28E-06 Ra-226 1600 y 5.97E-07
5.97E-07
Ra-228 5.75 y 5.93E-07
5.93E-07 Rh-106 e 29.8 s 3.05E-06
3.05E-06
Ru-103 39.3 d 5.11E-10
5.11E-10 Ru-106 374 d 3.05E-06
3.05E-06
Sb-125 2.76 y 1.18E-06
1.18E-06 Sb-126 e 12.4 d 1.70E-07
1.70E-07
Se-79 2.95E+05 y 4.90E-09
4.90E-09 Sm-151 90 y 2.89E-06
2.89E-06
Sn-113 115 d 8.31E-10
8.31E-10 Sn-123 129 d 6.66E-12
6.66E-12
Sn-126 2.30E+05 y 1.70E-07
1.70E-07 Sr-85 64.8 d 7.61E-10
7.61E-10
Sr-89 50.5 d 5.99E-10
5.99E-10 Sr-90 28.8 y 3.32E-03 0.00E+00 3.21E-05
3.35E-03
Tc-99 2.11E+05 y 5.08E-05
5.08E-05 Te-127 9.35 h 1.04E-11
1.04E-11
Te-129 69.6 m 1.05E-12
1.05E-12 Th-228 1.91 y 1.34E-08 2.69E-09
1.61E-08
Th-229 7340 y 1.34E-09
1.34E-09 Th-230 7.54E+04 y 9.73E-11 6.51E-09
6.61E-09
Th-231 25.5 h 2.12E-04
2.12E-04 Th-232 1.41E+10 y 9.86E-12 3.13E-09
3.14E-09
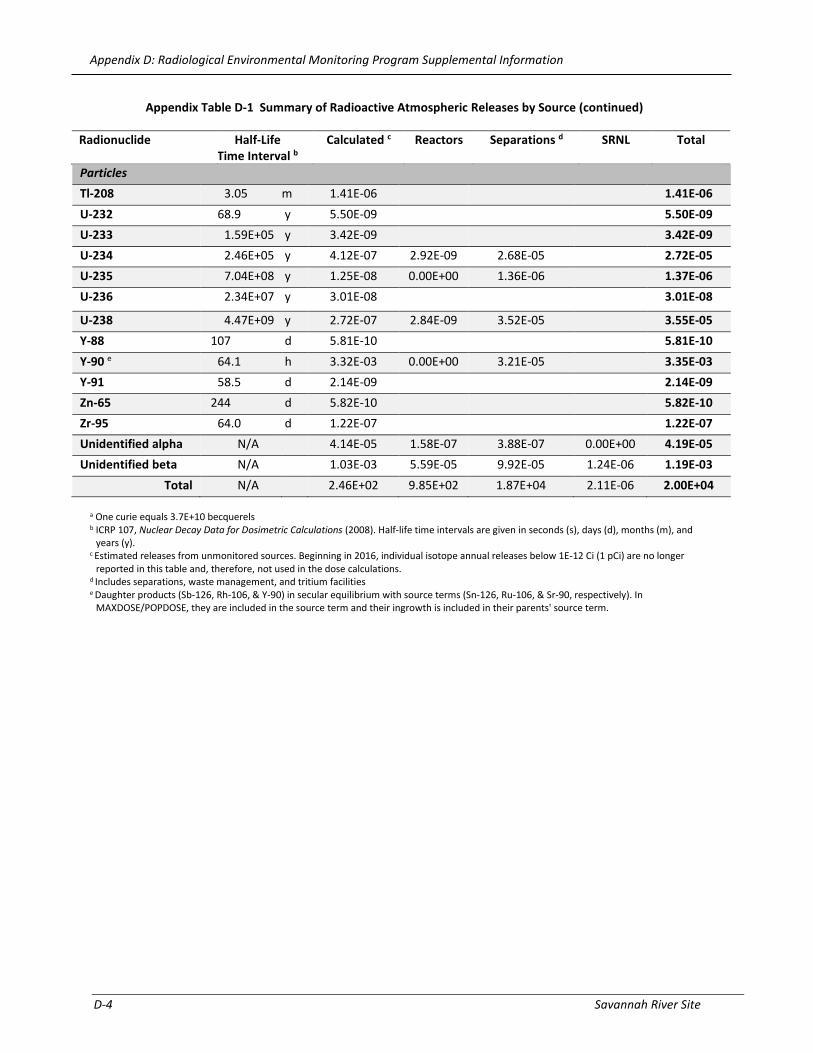
Appendix D: Radiological Environmental Monitoring Program Supplemental Information
D-4 Savannah River Site
Appendix Table D-1 Summary of Radioactive Atmospheric Releases by Source (continued)
Radionuclide Half-Life
Time Interval b Calculated c Reactors Separations d SRNL Total
Particles Tl-208 3.05 m 1.41E-06
1.41E-06
U-232 68.9 y 5.50E-09
5.50E-09 U-233 1.59E+05 y 3.42E-09
3.42E-09
U-234 2.46E+05 y 4.12E-07 2.92E-09 2.68E-05
2.72E-05 U-235 7.04E+08 y 1.25E-08 0.00E+00 1.36E-06
1.37E-06
U-236 2.34E+07 y 3.01E-08
3.01E-08
U-238 4.47E+09 y 2.72E-07 2.84E-09 3.52E-05
3.55E-05 Y-88 107 d 5.81E-10
5.81E-10
Y-90 e 64.1 h 3.32E-03 0.00E+00 3.21E-05
3.35E-03 Y-91 58.5 d 2.14E-09 2.14E-09 Zn-65 244 d 5.82E-10 5.82E-10 Zr-95 64.0 d 1.22E-07 1.22E-07 Unidentified alpha N/A
4.14E-05 1.58E-07 3.88E-07 0.00E+00 4.19E-05
Unidentified beta N/A
1.03E-03 5.59E-05 9.92E-05 1.24E-06 1.19E-03 Total N/A
2.46E+02 9.85E+02 1.87E+04 2.11E-06 2.00E+04
a One curie equals 3.7E+10 becquerels b ICRP 107, Nuclear Decay Data for Dosimetric Calculations (2008). Half-life time intervals are given in seconds (s), days (d), months (m), and
years (y). c Estimated releases from unmonitored sources. Beginning in 2016, individual isotope annual releases below 1E-12 Ci (1 pCi) are no longer
reported in this table and, therefore, not used in the dose calculations. d Includes separations, waste management, and tritium facilities e Daughter products (Sb-126, Rh-106, & Y-90) in secular equilibrium with source terms (Sn-126, Ru-106, & Sr-90, respectively). In
MAXDOSE/POPDOSE, they are included in the source term and their ingrowth is included in their parents' source term.

Appendix D: Radiological Environmental Monitoring Program Supplemental Information
Environmental Report 2019 (SRNS-RP-2020-00064) D-5
Appendix Table D-2 Summary of Air Effluent DOE DCS Sum of Fractions
As discussed in Chapter 5, SRS evaluates the effluent monitoring program by comparing the annual average concentrations to the DOE derived concentration standards (DCSs). DOE’s Derived Concentration Technical Standard, DOE-STD-1196-2011 (DOE 2011) establishes numerical standards for DCSs to support implementing DOE Order 458.1. This table presents the air effluent DCS sum of fractions for continuously monitored sources. Discussion regarding the 291-F sum of fractions exceedance can be found in Section 5.3.2.1.
Facility (Sampling Location) Radionuclides Included in the DCS Sum of Fractions
DCS Sum of Fractions DCS Sum of Fractions Excluding Tritium
A Area (791-A Sandfilter Discharge)
I-129 1.28E-04 1.28E-04
C Area (C-Area Main Stack) H-3 (oxide) 1.78E+00 0.00E+00
F Area (235-F Sandfilter Discharge)
Sr-89/90, U-234, U-238, Pu-238, Pu-239
4.02E-03 4.02E-03
F Area (291-F Stack Isokinetic)
Sr-89/90, I-129, Cs-137, U-234, U-235, Np-237, U-238, Pu-238, Pu-239, Am-241, Cm-244
2.08E+00 2.08E+00
F Area (772-4F Stack) U-234, U-238, Pu-238, Pu-239, Am-241
2.01E-03 2.01E-03
H Area (291-H Stack Isokinetic)
H-3 (oxide), C-14, Kr-85,Co-58, Sr-89/90, I-129, Cs-137, U-234, U-238, Pu-238, Pu-239, Am-241
9.68E-02 9.68E-02
K Area (K-Area Main Stack) H-3 (oxide) 1.78E+00 0.00E+00 L Area (L-Area Disassembly) H-3 (oxide) 1.76E+00 0.00E+00 L Area (L-Area Main Stack) H-3 (oxide) 1.97E+00 0.00E+00 Tritium (232-H) H-3 (elemental), H-3 (oxide) 1.82E+01 0.00E+00 Tritium (233-H) H-3 (elemental), H-3 (oxide) 2.69E+00 0.00E+00 Tritium (234-H) H-3 (elemental), H-3 (oxide) 5.75E+00 0.00E+00 Tritium (238-H) H-3 (oxide) 3.27E+00 0.00E+00 Tritium (264-H) H-3 (elemental), H-3 (oxide) 5.01E+00 0.00E+00

Appendix D: Radiological Environmental Monitoring Program Supplemental Information
D-6 Savannah River Site
Appendix Table D-3 Summary of Tritium in Environmental Air
Samples were collected approximately every 2 weeks at each of the 14 locations. Two samples were not collected due to field retrieval errors: Burial Ground North Nov. 20 to Dec. 4 and D Area June 5–19. Bolded minimum and maximum concentration results were reported as detected. Minimum and maximum concentrations not bolded indicate the result was less than the analytical method detection limit or the uncertainty is large. The results at the following locations were all not detected: Site Perimeter (Allendale Gate, East Talatha, and Patterson Mill Road) and 25-Mile Radius (Highway 301 @ State Line). The Highway 301 @ State Line location is the control location.
Location Number of Detected Results
Mean Concentration
(pCi/m3)
Minimum Concentration
(pCi/m3)
Maximum Concentration
(pCi/m3) Onsite Burial Ground North
25 of 25 2.37E+02 3.65E+01 7.49E+02
Site Perimeter Barnwell Gate 4 of 26 2.58E+00 -9.16E+00 1.34E+01 D Area 5 of 25 4.83E+00 -7.27E+00 1.48E+01 Darkhorse @ Williston Gate
2 of 26 3.65E+00 -8.68E+00 1.18E+01
Green Pond 2 of 26 4.33E+00 -3.57E+00 1.81E+01 Highway 21/167 1 of 26 2.81E+00 -6.16E+00 1.02E+01 Jackson 2 of 26 4.09E+00 -5.30E+00 1.25E+01 Talatha Gate 4 of 26 5.25E+00 -6.68E+00 3.14E+01 25-Mile Radius Aiken Airport 1 of 26 2.97E+00 -7.24E+00 1.42E+01 Augusta Lock & Dam 614
1 of 26 2.52E+00 -9.68E+00 1.10E+01

Appendix D: Radiological Environmental Monitoring Program Supplemental Information
Environmental Report 2019 (SRNS-RP-2020-00064) D-7
Appendix Table D-4 Summary of Tritium in Rainwater
Samples were collected approximately every 4 weeks at each of the 14 locations for a total of 13 samples at each site. However, in October 2019, Allendale Gate, Barnwell Gate, and D Area had minimal rainfall, and no sample could be collected for a total of 12 samples for the year. Bolded minimum and maximum concentration results were reported as detected. Minimum and maximum concentrations not bolded indicate the result was less than the analytical method detection limit or the uncertainty is large. The results at the following locations were all not detected: Site Perimeter (Allendale Gate, Barnwell Gate, Darkhorse @ Williston Gate, East Talatha, Green Pond, Highway 21/167, Jackson, and Patterson Mill Road) and 25-Mile Radius (Augusta Lock and Dam 614, Aiken Airport, and Highway 301 @ State Line). The Highway 301 @ State Line location is the control location.
Location Number of Detected Results
Mean Concentration
(pCi/L)
Minimum Concentration
(pCi/L)
Maximum Concentration
(pCi/L) Onsite
Burial Ground North
13 of 13 1.88E+03 4.30E+02 3.81E+03
Site Perimeter
D Area 1 of 12 8.17E+01 -1.24E+02 5.32E+02
Talatha Gate 2 of 13 5.95E+01 -1.74E+02 3.89E+02

Appendix D: Radiological Environmental Monitoring Program Supplemental Information
D-8 Savannah River Site
Appendix Table D-5 Summary of Radionuclides in Environmental Air
Glass fiber filter samples were collected approximately every 2 weeks at each of the 14 locations. Samples from all locations were analyzed biweekly for gamma emitting radionuclides, gross alpha, and gross beta. The onsite Burial Ground North is the only location where samples were analyzed for actinides and strontium-89/90 biweekly. Due to lab prep and analysis errors, americium-241 was not reported in 4 of 26 samples, and plutonium results were not reported in 3 of 26 samples at Burial Ground North. One sample from every perimeter location and 25-mile radius location was chosen for actinide and strontium-89/90 analysis, based on elevated releases at F-Canyon stack during 2019.
Bolded concentration results were reported as detected. Concentrations not bolded indicate the result was less than the analytical method detection limit or that the uncertainty is large.
Cobalt-60 and cesium-137 results were not detected for any samples collected biweekly.
Biweekly Samples: All Locations
Radionuclide Number of Detected Results
Location of Minimum
Concenration
Minimum Concentration
(pCi/m3)
Location of Maximum Concentration
Maximum Concentration
(pCi/m3) Gross Alpha 363 of 364 Aiken Airport 1.04E-04 Augusta Lock & Dam 3.38E-03
Gross Beta 364 of 364 Patterson Mill Road
5.76E-03 Augusta Lock & Dam 2.84E-02
Cm-244 and Sr-89/90 results were not detected for site Burial Ground North; thus, they were not reported in the table Biweekly Actinide and Sr-89/90 Samples.
Biweekly Actinide and Sr-89/90 Samples
Location: Burial Ground North
Radionuclide Number of
Detected Results
Mean Concentration
(pCi/m3)
Minimum Concentration
(pCi/m3)
Maximum Concentration
(pCi/m3)
U-234 25 of 26 2.36E-05 3.68E-06 5.46E-05
U-235 1 of 26 1.69E-06 -1.11E-06 5.49E-06
U-238 25 of 26 1.91E-05 3.38E-06 3.32E-05
Pu-238 3 of 23 2.13E-06 -1.15E-06 1.27E-05
Pu-239 1 of 23 1.24E-06 -1.03E-06 6.00E-06
Am-241 8 of 22 4.46E-06 1.83E-06 1.27E-05
U-235, Pu-239, Sr-89/90, and Cm-244 results were not detected for the annual sites; thus, they were not reported in the table Annual Actinide and Sr-89/90 Samples.

Appendix D: Radiological Environmental Monitoring Program Supplemental Information
Environmental Report 2019 (SRNS-RP-2020-00064) D-9
Annual Actinide and Sr-89/90 Samples
U-234 U-238 Pu-238 Am-241
Location Number of Samples
Concentration (pCi/m3)
Concentration (pCi/m3)
Concentration (pCi/m3)
Concentration (pCi/m3)
Allendale Gate 1 1.22E-05 1.05E-05 8.22E-06 1.26E-05
Barnwell Gate 1 3.65E-05 2.84E-05 0.00E+00 8.46E-06
D Area 1 1.10E-05 7.27E-05 0.00E+00 2.64E-06
Darkhorse @ Williston Gate
1 3.97E-05 2.12E-05 2.70E-06 4.70E-06
East Talatha 1 2.84E-05 3.19E-05 -7.46E-07 -1.75E-07
Green Pond 1 3.46E-05 1.94E-05 0.00E+00 -1.51E-07
Highway 21/167
1 2.76E-05 2.52E-05 6.76E-07 4.78E-06
Jackson 1 2.95E-05 2.57E-05 -6.97E-07 3.41E-06
Patterson Mill Road
1 2.84E-05 2.05E-05 4.57E-06 4.89E-06
Talatha Gate 1 3.14E-05 1.70E-05 0.00E+00 5.62E-06
Aiken Airport 1 2.60E-05 2.03E-05 1.21E-06 1.63E-07
Augusta Lock and Dam 614
1 3.00E-05 2.39E-05 1.35E-06 3.54E-06
Highway 301 @ State Line (Control Location)
1 3.54E-05 2.10E-05 1.89E-06 5.78E-06

Appendix D: Radiological Environmental Monitoring Program Supplemental Information
D-10 Savannah River Site
Appendix Table D-6 Summary of Gamma Surveillance
Samples were collected approximately every quarter (12 weeks) at each of 50 locations. Typically, two samples are collected from each location. This was the case in 2019, except for Population Center location McBean, where one sample was missing during the retrieval of third-quarter samples.
Station Location
Type
Percent of
Stations
Quarter 1 Average mR/day
Quarter 2 Average mR/day
Quarter 3 Average mR/day
Quarter 4 Average mR/day
Annual Total
Average mR/year
Annual Minimum mR/year
Annual Maximum mR/year
Population Centers
9 0.33 0.38 0.40 0.41 135.2 92.3 157.0
Site Perimeter
9 0.27 0.31 0.34 0.35 115.2 101.1 129.3
Air Surveillance Stations
14 0.29 0.32 0.35 0.36 120.7 100.7 150.7
Plant Vogtle Vicinity
18 0.26 0.31 0.33 0.32 109.6 71.8 138.03
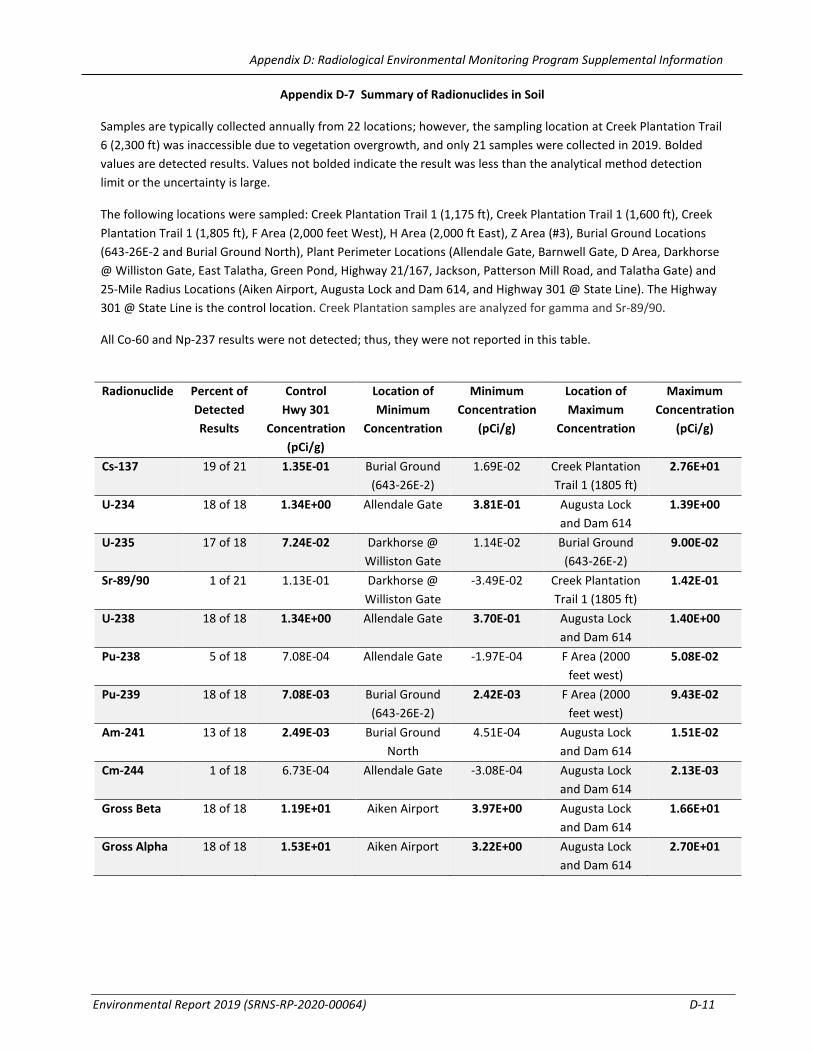
Appendix D: Radiological Environmental Monitoring Program Supplemental Information
Environmental Report 2019 (SRNS-RP-2020-00064) D-11
Appendix D-7 Summary of Radionuclides in Soil
Samples are typically collected annually from 22 locations; however, the sampling location at Creek Plantation Trail 6 (2,300 ft) was inaccessible due to vegetation overgrowth, and only 21 samples were collected in 2019. Bolded values are detected results. Values not bolded indicate the result was less than the analytical method detection limit or the uncertainty is large.
The following locations were sampled: Creek Plantation Trail 1 (1,175 ft), Creek Plantation Trail 1 (1,600 ft), Creek Plantation Trail 1 (1,805 ft), F Area (2,000 feet West), H Area (2,000 ft East), Z Area (#3), Burial Ground Locations (643-26E-2 and Burial Ground North), Plant Perimeter Locations (Allendale Gate, Barnwell Gate, D Area, Darkhorse @ Williston Gate, East Talatha, Green Pond, Highway 21/167, Jackson, Patterson Mill Road, and Talatha Gate) and 25-Mile Radius Locations (Aiken Airport, Augusta Lock and Dam 614, and Highway 301 @ State Line). The Highway 301 @ State Line is the control location. Creek Plantation samples are analyzed for gamma and Sr-89/90.
All Co-60 and Np-237 results were not detected; thus, they were not reported in this table.
Radionuclide Percent of
Detected Results
Control Hwy 301
Concentration (pCi/g)
Location of Minimum
Concentration
Minimum Concentration
(pCi/g)
Location of Maximum
Concentration
Maximum Concentration
(pCi/g)
Cs-137 19 of 21 1.35E-01 Burial Ground (643-26E-2)
1.69E-02 Creek Plantation Trail 1 (1805 ft)
2.76E+01
U-234 18 of 18 1.34E+00 Allendale Gate 3.81E-01 Augusta Lock and Dam 614
1.39E+00
U-235 17 of 18 7.24E-02 Darkhorse @ Williston Gate
1.14E-02 Burial Ground (643-26E-2)
9.00E-02
Sr-89/90 1 of 21 1.13E-01 Darkhorse @ Williston Gate
-3.49E-02 Creek Plantation Trail 1 (1805 ft)
1.42E-01
U-238 18 of 18 1.34E+00 Allendale Gate 3.70E-01 Augusta Lock and Dam 614
1.40E+00
Pu-238 5 of 18 7.08E-04 Allendale Gate -1.97E-04 F Area (2000 feet west)
5.08E-02
Pu-239 18 of 18 7.08E-03 Burial Ground (643-26E-2)
2.42E-03 F Area (2000 feet west)
9.43E-02
Am-241 13 of 18 2.49E-03 Burial Ground North
4.51E-04 Augusta Lock and Dam 614
1.51E-02
Cm-244 1 of 18 6.73E-04 Allendale Gate -3.08E-04 Augusta Lock and Dam 614
2.13E-03
Gross Beta 18 of 18 1.19E+01 Aiken Airport 3.97E+00 Augusta Lock and Dam 614
1.66E+01
Gross Alpha 18 of 18 1.53E+01 Aiken Airport 3.22E+00 Augusta Lock and Dam 614
2.70E+01

Appendix D: Radiological Environmental Monitoring Program Supplemental Information
D-12 Savannah River Site
Appendix Table D-8 Summary of Radionuclides in Grassy Vegetation
Samples are collected annually from 14 locations. Bolded values are detected results. Values not bolded indicate the result was less than the analytical method detection limit or the uncertainty is large. All results for Co-60, U-235, Np-237, Pu-238, Pu-239, Am-241, Cm-244, and gross alpha were not detected; thus, they were not reported in this table.
The following locations are sampled: Control (Highway 301 at the SC/GA State line), Onsite location (Burial Ground North), Site Perimeter locations (Allendale Gate, Barnwell Gate, D Area, Darkhorse @ Williston Gate, East Talatha, Green Pond, Highway 21/167, Jackson, Patterson Mill Road, Talatha Gate), and 25-Mile Radius Locations (Aiken Airport and the Augusta Lock and Dam 614).
Radionuclide Percent of Detected Results
Control (Highway 301) Concentration
(pCi/g)
Location of Minimum
Concentration
Minimum Concentration
(pCi/g)
Location of Maximum
Concentration
Maximum Concentration
(pCi/g)
H-3 2 of 14 2.76E-02 Darkhorse @ Williston Gate
-2.66E-02 Burial Ground North
1.11E+00
Cs-137 7 of 14 3.38E-02 Augusta Lock & Dam
614
-6.41E-02 Allendale Gate 8.08E-01
Sr-89/90 10 of 14 1.38E-01 Talatha Gate 1.25E-02 Highway 21/167
4.54E-01
U-234 14 of 14 7.32E-03 Augusta Lock and Dam 614
5.05E-03 Highway 21/167
1.54E-02
U-238 14 of 14 3.97E-03 East Talatha 4.97E-03 Highway 21/167
1.37E-02
Tc-99 14 of 14 4.32E-01 Jackson 2.20E-01 Highway 21/167
7.89E-01
Gross Beta 14 of 14 1.56E+01 Darkhorse @ Williston Gate
5.73E+00 Augusta Lock & Dam 614
1.96E+01

Appendix D: Radiological Environmental Monitoring Program Supplemental Information
Environmental Report 2019 (SRNS-RP-2020-00064) D-13
Appendix Table D-9 Summary of Radionuclides in Foodstuffs
Samples of five foodstuffs are collected annually from five regions surrounding SRS. Beef, greens, and fruit are collected each year. Six foodstuffs are collected on a rotating three-year cycle. Cabbage and grains were the rotational crop samples collected in 2019. The collected grains were rye and wheat, based on availability. Bolded minimum and maximum concentration results were reported as detected. Minimum and maximum concentrations not bolded indicate the result was less than the analytical method detection limit, or the uncertainty is large.
Food Type Nuclide Number of Samples
Number of Results
> Detection Limit
Mean Sample Concentration
(pCi/g)
Minimum Sample
Concentration (pCi/g)
Maximum Sample
Concentration (pCi/g)
Beef
H-3 5 1 2.65E-02 -9.81E-03 7.22E-02
Tc-99 5 1 3.95E-02 7.32E-03 9.78E-02
U-234 5 1 1.87E-04 1.24E-05 8.24E-04
U-235 5 1 3.53E-05 9.62E-06 9.16E-05
U-238 5 4 1.87E-04 7.78E-06 6.70E-04
Gross Beta 5 5 1.58E+00 1.25E+00 1.86E+00
Cs-137, Co-60, Np-237, Pu-238, Pu-239, Am-241, Cm-244, Sr-89,90, and gross alpha were not detected in beef.
H-3 5 1 3.82E-02 2.86E-03 9.54E-02
Greens
Cs-137 5 5 2.99E-02 1.18E-02 8.30E-02
Sr-89,90 5 5 1.17E-01 4.08E-02 2.08E-01
Tc-99 5 4 4.62E-01 1.24E-01 1.05E+00
U-234 5 5 1.13E-02 2.81E-03 3.95E-02
U-235 5 1 5.78E-04 5.62E-05 1.98E-03
U-238 5 5 1.12E-02 2.20E-03 4.27E-02
Pu-238 5 1 2.94E-04 9.05E-05 6.68E-04
Gross Beta 5 5 2.25E+01 1.65E+01 2.78E+01
Co-60, Np-237, Pu-239, Am-241, Cm-244, and gross alpha were not detected in greens.
Fruit (watermelon)
Sr-89,90 5 1 3.75E-03 4.84E-04 8.57E-03
Gross Beta 5 5 1.18E-01 7.78E-02 2.00E-01 H-3, Cs-137, Co-60, Np-237, Pu-238, Pu-239, Am-241, Cm-244, U-234, U-235, U-238, Tc-99, and gross alpha were not detected in fruit.
Cabbage
Cs-137 5 1 1.24E-02 -2.59E-03 3.14E-02
Sr-89,90 5 2 4.23E-02 1.39E-02 1.07E-01
Tc-99 5 5 8.17E-01 3.59E-01 1.60E+00
U-234 5 5 5.86E-02 1.69E-03 2.24E-01
U-235 5 4 3.20E-03 2.67E-04 9.70E-03
U-238 5 5 5.89E-02 2.97E-03 2.25E-01
Pu-238 5 2 2.88E-04 -7.38E-05 6.70E-04
Np-237 5 1 3.09E-04 -4.76E-06 6.92E-04
Am-241 5 1 2.50E-04 0.00E+00 4.84E-04
Gross Beta 5 5 1.83E+01 1.57E+01 2.43E+01
H-3, Co-60, Pu-239, Cm-244, and gross alpha were not detected in cabbage.
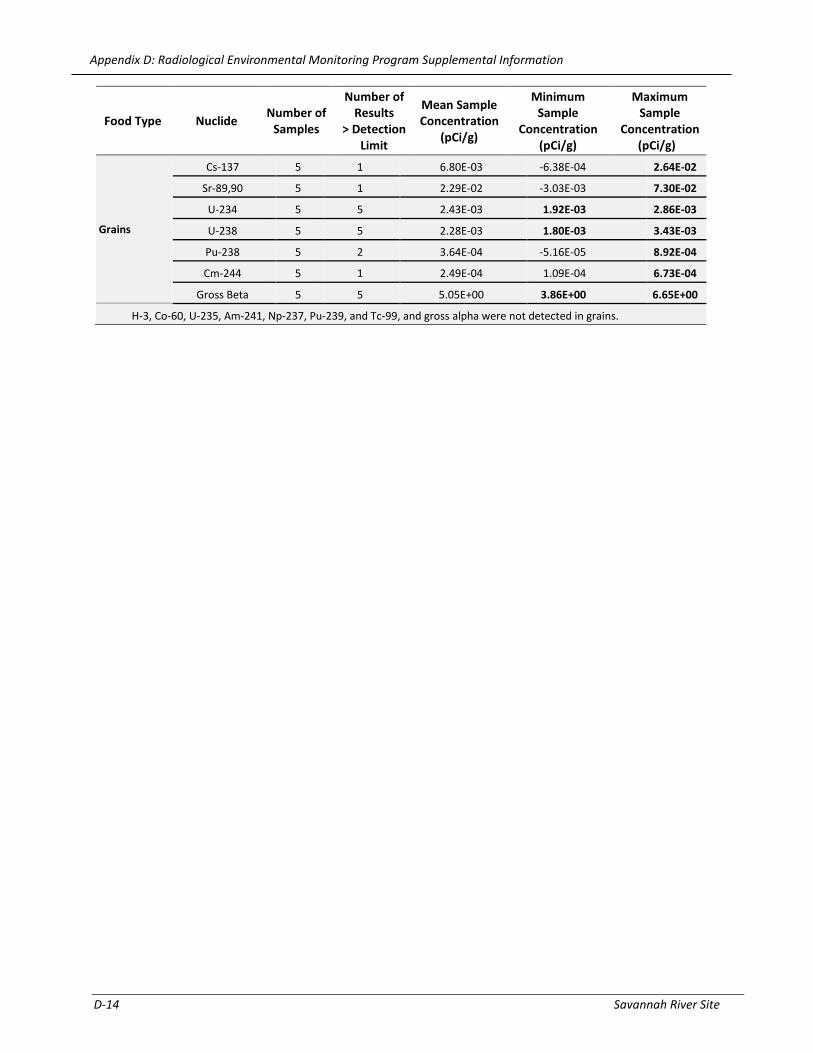
Appendix D: Radiological Environmental Monitoring Program Supplemental Information
D-14 Savannah River Site
Food Type Nuclide Number of Samples
Number of Results
> Detection Limit
Mean Sample Concentration
(pCi/g)
Minimum Sample
Concentration (pCi/g)
Maximum Sample
Concentration (pCi/g)
Grains
Cs-137 5 1 6.80E-03 -6.38E-04 2.64E-02
Sr-89,90 5 1 2.29E-02 -3.03E-03 7.30E-02
U-234 5 5 2.43E-03 1.92E-03 2.86E-03
U-238 5 5 2.28E-03 1.80E-03 3.43E-03
Pu-238 5 2 3.64E-04 -5.16E-05 8.92E-04
Cm-244 5 1 2.49E-04 1.09E-04 6.73E-04
Gross Beta 5 5 5.05E+00 3.86E+00 6.65E+00
H-3, Co-60, U-235, Am-241, Np-237, Pu-239, and Tc-99, and gross alpha were not detected in grains.

Appendix D: Radiological Environmental Monitoring Program Supplemental Information
Environmental Report 2019 (SRNS-RP-2020-00064) D-15
Appendix Table D-10 Summary of Radionuclides in Dairy
SRS collects cow and goat milk samples from dairies in communities surrounding the Site. The number listed in parentheses in the “location” column indicates the number of dairies in the named state that provide samples to SRS.
Bolded minimum and maximum concentration results were reported as detected. Minimum and maximum concentrations not bolded indicate the result was less than the analytical method detection limit or the uncertainty is large. All Co-60 results were not detected and, thus, not reported in this table.
Location Nuclide Number of Samples
Number of Results
> Detection Limit
Mean Sample Concentration
(pCi/L)
Minimum Sample
Concentration (pCi/L)
Maximum Sample
Concentration (pCi/L)
SC–Dairies (4) cow milk H-3 14 0 SC–Dairies (1) goat milk H-3 2 0 GA–Dairies (3) cow milk H-3 12 1 5.55E+01 -6.32E+01 2.04E+02 SC–Dairies (4) cow milk Cs-137 14 0 SC–Dairies (1) goat milk Cs-137 2 2 7.13E+00 6.68E+00 7.57E+00 GA–Dairies (3) cow milk Cs-137 12 0 SC–Dairies (4) cow milk Sr-90 14 2 5.44E-01 -3.54E-01 3.16E+00 SC–Dairies (1) goat milk Sr-90 2 2 1.77E+00 9.51E-01 2.58E+00 GA–Dairies (3) cow milk Sr-90 12 1 2.95E-01 -1.94E-01 1.29E+00
.

Appendix D: Radiological Environmental Monitoring Program Supplemental Information
D-16 Savannah River Site
Appendix Table D-11 Radiation in Liquid Source Releases
All values under the “Reactors,” “Separations,” “SRNL,” and the “Totals” column are reported in curies. a
Tritium is the main contributing radionuclide in liquid source releases. Although the remaining radionuclides are contributors, their contributions in liquid source releases are minimal.
In the facility (Reactor, Separations, SRNL) columns, a blank indicates the radionuclide was not analyzed. A 0.00E+00 in the facility columns indicates the result was not significant.
All Co-60 results were not detected; thus, they were not reported in this table.
Radionuclide Half-Life Time Interval b
Reactors (Ci)
Separations c
(Ci) SRNL
(Ci) Totals
(Ci) H-3 d y 1.29E+02
2.9
0.00E+00
4.24E+02 C-14 5,700 y 1.5
3.25E-04
1.53E-02 Sr-90 28.8 y 0.00E+00 1.3
1.31E-02 Tc-99 2.11E+05 y 1.6
0.00E+00
1.66E-02 I-129 1.57E+07 y 8.9
0.00E+00
8.92E-03 Cs-137 e 30.2 y 0.00E+00 8.2
0.00E+00
8.24E-03 Ra-226 1,600 y 2.3
2.32E-03 U-234 2.46E+05 y 1.9
6.90E-05
1.93E-02 U-235 7.04E+08 y 3.5
3.96E-06
3.62E-04 U-238 4.47E-09 y 2.2
5.28E-05
2.20E-02 Np-237 2.14E+06 y 8.6
8.61E-05 Pu-238 87.7 y 1.0
1.45E-05
1.21E-04 Pu-239 2.41E+04 y 5.4
3.92E-06
9.38E-06 Am-241 432 y 1.1
1.16E-05 Cm-244 18.1 y 2.1
2.17E-06 Alpha f 3.86E-03
4.8
5.66E-04
4.91E-03 Beta-Gamma g 3.82E-02
2.58E
11.06E-03
4.18E-02 Sum 4.24E+02 a One curie equals 3.7E+10 becquerels
b ICRP 107, Nuclear Decay Data for Dosimetric Calculations (2008). Half-life time intervals are given in years (y). c Includes separations, waste management, and tritium processing facilities. d The tritium release total, which includes direct + migration releases, is used in the dose calculations for SRS impacts. e Depending on which value is higher, the Cs-137 release total is based on concentrations measured in Steel Creek mouth fish
near RM 141.5 or on the actual measured effluent release total from the Site. Refer to Chapter 6, Radiological Dose Assessment, for more information.
f,g For dose calculations, unidentified alpha and beta/gamma releases are assumed to be Pu-239 and Sr-90, respectively.
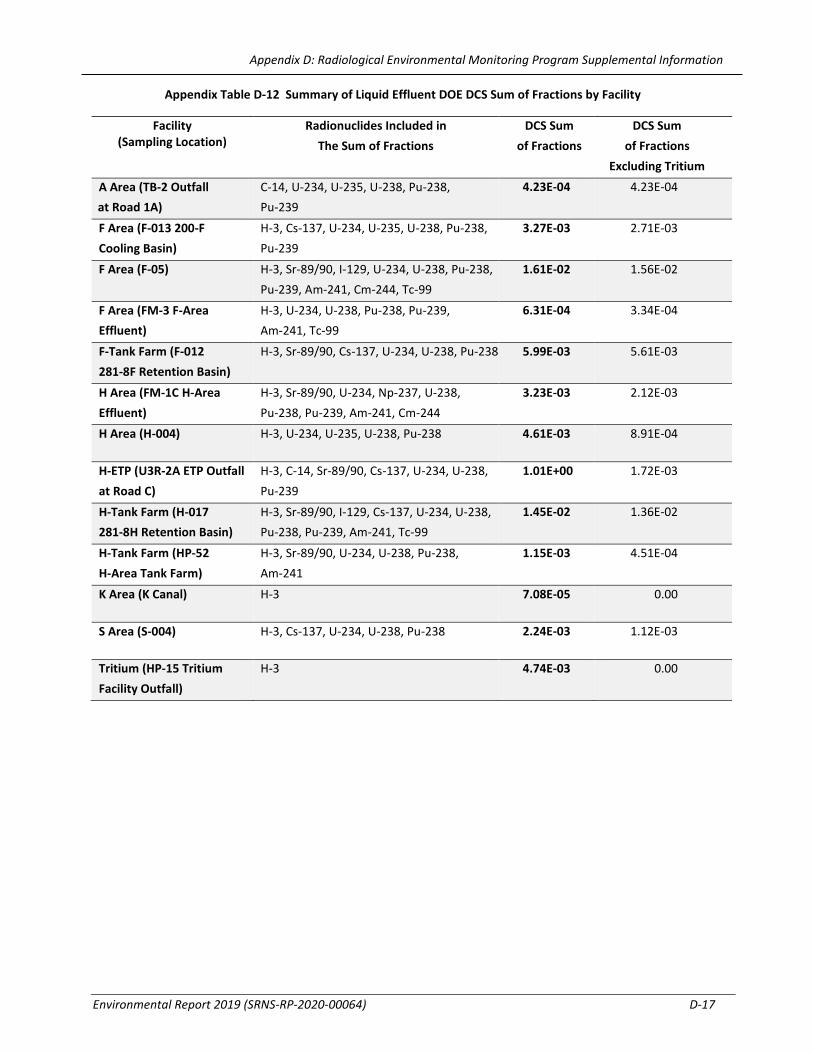
Appendix D: Radiological Environmental Monitoring Program Supplemental Information
Environmental Report 2019 (SRNS-RP-2020-00064) D-17
Appendix Table D-12 Summary of Liquid Effluent DOE DCS Sum of Fractions by Facility
Facility (Sampling Location)
Radionuclides Included in The Sum of Fractions
DCS Sum of Fractions
DCS Sum of Fractions
Excluding Tritium A Area (TB-2 Outfall at Road 1A)
C-14, U-234, U-235, U-238, Pu-238, Pu-239
4.23E-04
4.23E-04
F Area (F-013 200-F Cooling Basin)
H-3, Cs-137, U-234, U-235, U-238, Pu-238, Pu-239
3.27E-03
2.71E-03
F Area (F-05) H-3, Sr-89/90, I-129, U-234, U-238, Pu-238, Pu-239, Am-241, Cm-244, Tc-99
1.61E-02
1.56E-02
F Area (FM-3 F-Area Effluent)
H-3, U-234, U-238, Pu-238, Pu-239, Am-241, Tc-99
6.31E-04
3.34E-04
F-Tank Farm (F-012 281-8F Retention Basin)
H-3, Sr-89/90, Cs-137, U-234, U-238, Pu-238,
5.99E-03
5.61E-03
H Area (FM-1C H-Area Effluent)
H-3, Sr-89/90, U-234, Np-237, U-238, Pu-238, Pu-239, Am-241, Cm-244
3.23E-03
2.12E-03
H Area (H-004) H-3, U-234, U-235, U-238, Pu-238 4.61E-03
8.91E-04
H-ETP (U3R-2A ETP Outfall at Road C)
H-3, C-14, Sr-89/90, Cs-137, U-234, U-238, Pu-239
1.01E+00
1.72E-03
H-Tank Farm (H-017 281-8H Retention Basin)
H-3, Sr-89/90, I-129, Cs-137, U-234, U-238, Pu-238, Pu-239, Am-241, Tc-99
1.45E-02
1.36E-02
H-Tank Farm (HP-52 H-Area Tank Farm)
H-3, Sr-89/90, U-234, U-238, Pu-238, Am-241
1.15E-03
4.51E-04
K Area (K Canal) H-3 7.08E-05
0.00
S Area (S-004) H-3, Cs-137, U-234, U-238, Pu-238 2.24E-03
1.12E-03
Tritium (HP-15 Tritium Facility Outfall)
H-3 4.74E-03
0.00

Appendix D: Radiological Environmental Monitoring Program Supplemental Information
D-18 Savannah River Site
Appendix Table D-13 Summary of Radionuclides in Sediments
SRS collected annual sediment samples at 39 locations in 2019—11 Savannah River, 20 stream, and 8 stormwater basins, totaling 462 analytes. Locations sampled are as follows: Savannah River locations (mouths of Beaver Dam Creek [BDC] and Steel Creek [SC], River Miles [RM] 118.7, 129, 134.0, 150.2, 150.4, 151, 157.2, 160.5, and 161.0), SRS Stream locations (downstream of R-1, FM-2, FM-3A, FM-A7, FM-A7A, FMC @ Rd A, FMC Swamp, L3R-1A , L3R-2, McQB at MO, McQB below Z Basin, PB @ Rd A, PB Swamp, SC-2A, SC-4, TB-5, TC-1, U3R-0, U3R-3, and U3R-4), and SRS Stormwater Basin locations (E-001, E-002, E-003, E-004, E-005, E-006, Pond 400, and Z Basin).
Bolded concentration results were reported as detected. Concentrations not bolded indicate the result was less than the analytical method detection limit or the uncertainty is large.
The streams and stormwater basins have the same control locations, TC-1 and U3R-0. The river control location is RM 161.0.
For the river sediment analyses, all results for Co-60, Cm-243/244, Np-237, and Sr-90 were below the detection limit. For the stream sediment, all results for Co-60 were below the detection limit. For the basin sediment, all results for Co-60 and Np-237 were below the detection limit. Therefore, these results are not presented in the sediment tables below.
River Sediment Results
10 River Locations Plus 1 Control
Analyte Number > DL
Control RM 161.0 (pCi/g)
Location of Maximum Result
Maximum Result (pCi/g)
Americium-241 3 of 10 8.22E-04 RM 150.2 7.50E-03
Cesium-137 7 of 11 5.91E-02 SC RM 1.33E+00
Gross Alpha 11 of 11 1.39E+01 RM 157.2 2.04E+01
Nonvolatile Beta 11 of 11 2.27E+01 RM 134 2.57E+01
Plutonium-238 2 of 10 1.63E-03 RM 129 2.08E-03
Plutonium-239/240 2 of 10 1.82E-03 RM 118.7 5.39E-03
Uranium-233/234 10 of 10 9.14E-01 RM 150.2 1.84E+00
Uranium-235 10 of 10 2.21E-02 RM 150.2 1.05E-01
Uranium-238 10 of 10 1.01E+00 RM 150.2 2.02E+00

Appendix D: Radiological Environmental Monitoring Program Supplemental Information
Environmental Report 2019 (SRNS-RP-2020-00064) D-19
Stream Sediment Results
18 Stream Locations Plus 2 Controls (Some locations only sampled for Cs-137, Co-60, gross alpha and nonvolatile beta)
Stormwater Basin Sediment Results
Eight Basin Locations Plus Two Controls
Analyte Number >DL
Control TC-1 (pCi/g)
Control U3R-0 (pCi/g)
Location of Maximum Result
Maximum Result (pCi/g)
Americium-241 6 of 10 6.36E-03 1.82E-03 Pond 400 3.54E-02 Cesium-137 4 of 10 4.39E-02 8.28E-02 Z Basin 2.06E+03 Curium-243/244 3 of 10 1.64E-03 6.58E-03 Pond 400 5.55-03 Gross Alpha 10 of 10 1.57E+01 3.02E+01 Pond 400 2.72E+01 Nonvolatile Beta 10 of 10 1.25E+01 1.78E+01 Z-Area Basin 1.98E+03 Plutonium-238 4 of 10 3.78E-03 1.32E-03 E-001 2.63E-01 Plutonium-239/240 6 of 10 3.98E-03 4.12E-03 Pond 400 1.78E-01 Strontium-90 2 of 10 1.32E-01 1.32E-01 E-003 7.75E-01 Uranium-233/234 10 of 10 1.15E+00 1.26E+00 Pond 400 2.26E+00 Uranium-235 9 of 10 4.87E-02 7.33E-02 Pond 400 1.03-01 Uranium-238 10 of 10 1.08E+00 1.40E+00 Pond 400 2.11E+00
Analyte Number >DL
Control TC-1 (pCi/g)
Control U3R-0 (pCi/g)
Location of Maximum Result
Maximum Result (pCi/g)
Americium-241 10 of 16 6.36E-03 1.82E-03 FM-A-7A 5.79E-02 Cesium-137 17 of 20 4.39E-02 8.28E-02 Downstream of R-1 5.10E+01 Curium-243/244 6 of 16 1.64E-03 6.58E-03 FM-A-7A 5.14E-02 Gross Alpha 20 of 20 1.57E+01 3.02E+01 TB-5 3.79E+01 Neptunium-237 3 of 16 4.73E-03 1.49E-03 FMC Swamp 5.49E-03 Nonvolatile Beta 20 of 20 1.25E+01 1.78E+01 Downstream of R-1 6.71E+01 Plutonium-238 8 of 16 3.78E-03 1.32E-03 FM-2 4.20E-01 Plutonium-239/240 13 of 16 3.98E-03 4.12E-03 McQB @MO 8.60E-02 Strontium-90 1 of 16 1.32E-01 1.32E-01 FMC Swamp 2.78E-01 Uranium-233/234 16 of 16 1.15E+00 1.26E+00 TB-5 6.22E+00 Uranium-235 15 of 16 4.87E-02 7.33E-02 TB-5 3.23-01 Uranium-238 16 of 16 1.08E+00 1.40E+00 TB-5 6.18E+00
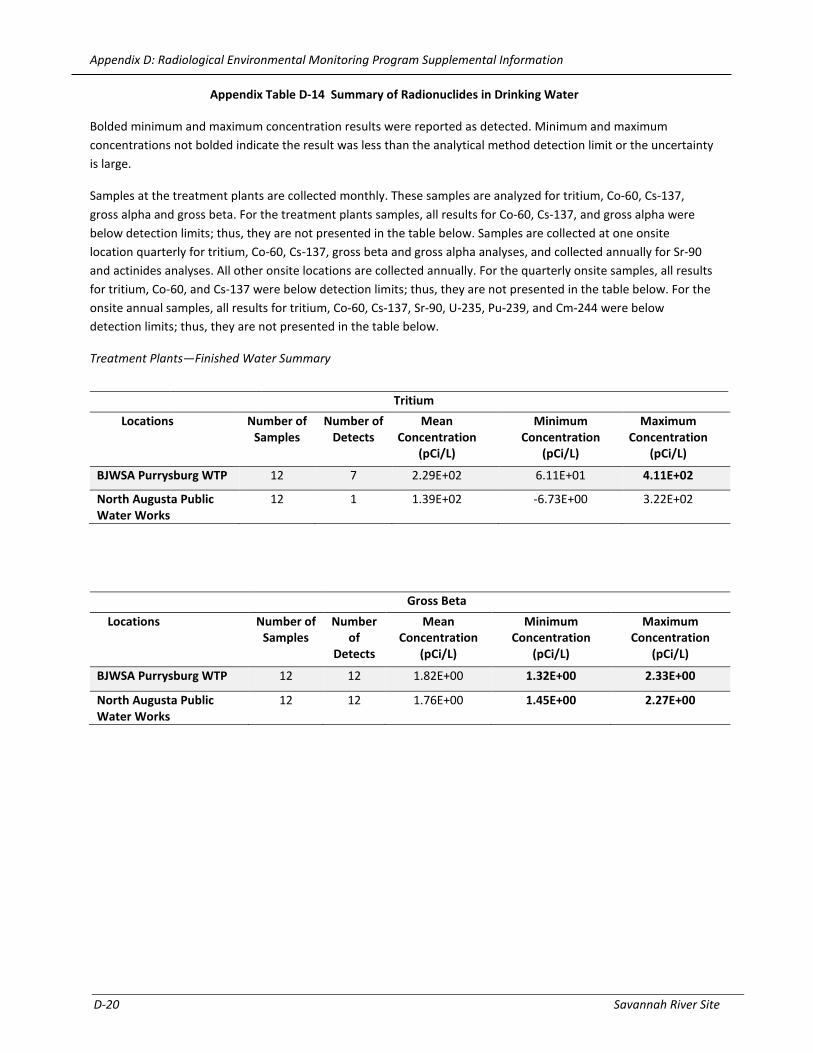
Appendix D: Radiological Environmental Monitoring Program Supplemental Information
D-20 Savannah River Site
Appendix Table D-14 Summary of Radionuclides in Drinking Water
Bolded minimum and maximum concentration results were reported as detected. Minimum and maximum concentrations not bolded indicate the result was less than the analytical method detection limit or the uncertainty is large.
Samples at the treatment plants are collected monthly. These samples are analyzed for tritium, Co-60, Cs-137, gross alpha and gross beta. For the treatment plants samples, all results for Co-60, Cs-137, and gross alpha were below detection limits; thus, they are not presented in the table below. Samples are collected at one onsite location quarterly for tritium, Co-60, Cs-137, gross beta and gross alpha analyses, and collected annually for Sr-90 and actinides analyses. All other onsite locations are collected annually. For the quarterly onsite samples, all results for tritium, Co-60, and Cs-137 were below detection limits; thus, they are not presented in the table below. For the onsite annual samples, all results for tritium, Co-60, Cs-137, Sr-90, U-235, Pu-239, and Cm-244 were below detection limits; thus, they are not presented in the table below.
Treatment Plants—Finished Water Summary
Tritium
Locations Number of Samples
Number of Detects
Mean Concentration
(pCi/L)
Minimum Concentration
(pCi/L)
Maximum Concentration
(pCi/L)
BJWSA Purrysburg WTP 12 7 2.29E+02 6.11E+01 4.11E+02
North Augusta Public Water Works
12 1 1.39E+02 -6.73E+00 3.22E+02
Gross Beta Locations Number of
Samples Number
of Detects
Mean Concentration
(pCi/L)
Minimum Concentration
(pCi/L)
Maximum Concentration
(pCi/L)
BJWSA Purrysburg WTP 12 12 1.82E+00 1.32E+00 2.33E+00
North Augusta Public Water Works
12 12 1.76E+00 1.45E+00 2.27E+00

Appendix D: Radiological Environmental Monitoring Program Supplemental Information
Environmental Report 2019 (SRNS-RP-2020-00064) D-21
Onsite Location Summary—Quarterly Samples
Gross Beta
Location Number of
Samples
Number of
Detects
Mean Concentration
(pCi/L)
Minimum Concentration
(pCi/L)
Maximum Concentration
(pCi/L)
782-3A quarterly 4 4 8.82E-01 5.54E-01 1.14E+00
Gross Alpha
Location
Number of
Samples
Number of
Detects
Mean Concentration
(pCi/L)
Minimum Concentration
(pCi/L)
Maximum Concentration
(pCi/L) 782-3A quarterly 4 2 3.50E-01 2.47E-01 5.49E-01
Onsite Location Summary—Annual Samples
U-234 U-238 Pu-238 Am-241
Location Number of Samples
Concentration (pCi/L)
Concentration (pCi/L)
Concentration (pCi/L)
Concentration (pCi/L)
617-8G 1 2.70E-02 2.19E-02 1.18E-02 5.30E-03
681-3G Dom. Water Faucet
1 1.75E-02 2.16E-02 1.68E-03 1.29E-02
704-16G 1 1.21E-02 1.05E-02 1.02E-02 1.71E-02
709-1G 1 2.59E-02 2.49E-02 1.16E-03 2.86E-03
737-G 1 1.78E-02 1.36E-02 5.46E-04 1.02E-02
782-3A (annual) 1 2.34E-02 7.08E-02 5.32E-04 8.43E-03
905-112G Well 1 3.95E-02 4.73E-02 -2.78E-03 4.92E-03
905-113G Well 1 3.35E-02 2.32E-02 2.20E-03 5.46E-03
905-125B 1 1.88E-02 3.30E-02 1.78E-03 3.57E-03
905-67B 1 1.15E-02 1.69E-02 -1.22E-03 8.30E-03
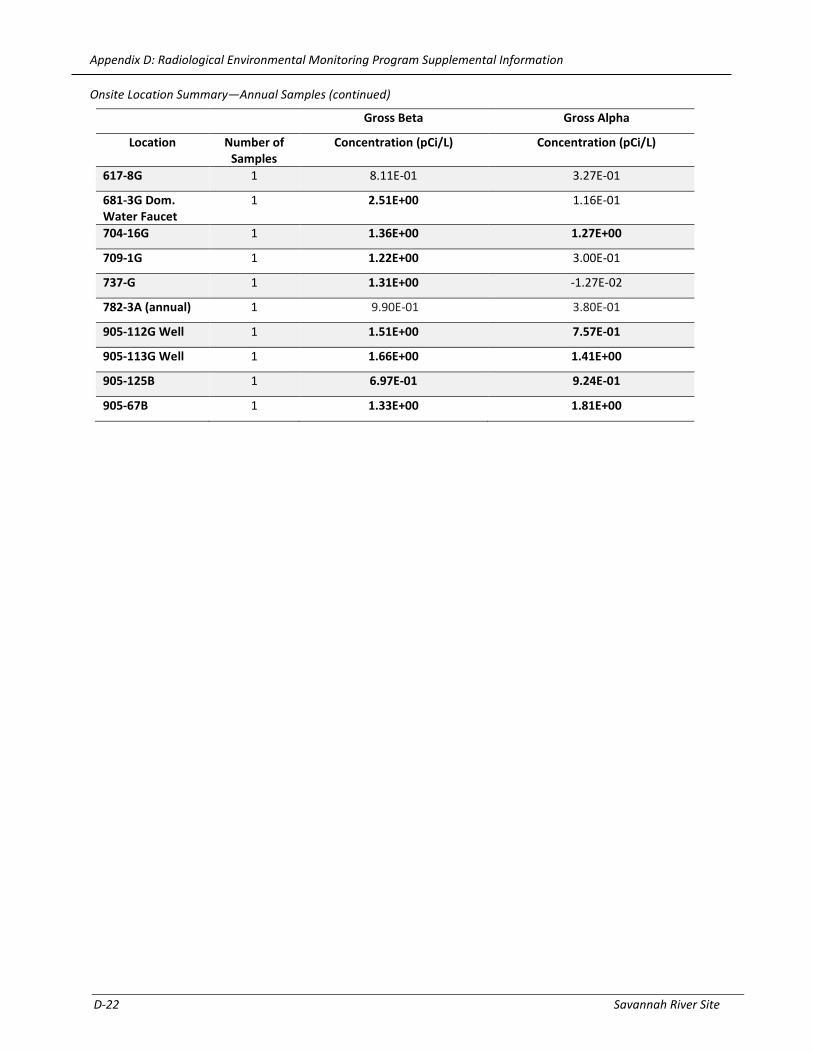
Appendix D: Radiological Environmental Monitoring Program Supplemental Information
D-22 Savannah River Site
Onsite Location Summary—Annual Samples (continued)
Gross Beta Gross Alpha
Location Number of Samples
Concentration (pCi/L) Concentration (pCi/L)
617-8G 1 8.11E-01 3.27E-01
681-3G Dom. Water Faucet
1 2.51E+00 1.16E-01
704-16G 1 1.36E+00 1.27E+00
709-1G 1 1.22E+00 3.00E-01
737-G 1 1.31E+00 -1.27E-02
782-3A (annual) 1 9.90E-01 3.80E-01
905-112G Well 1 1.51E+00 7.57E-01
905-113G Well 1 1.66E+00 1.41E+00
905-125B 1 6.97E-01 9.24E-01
905-67B 1 1.33E+00 1.81E+00
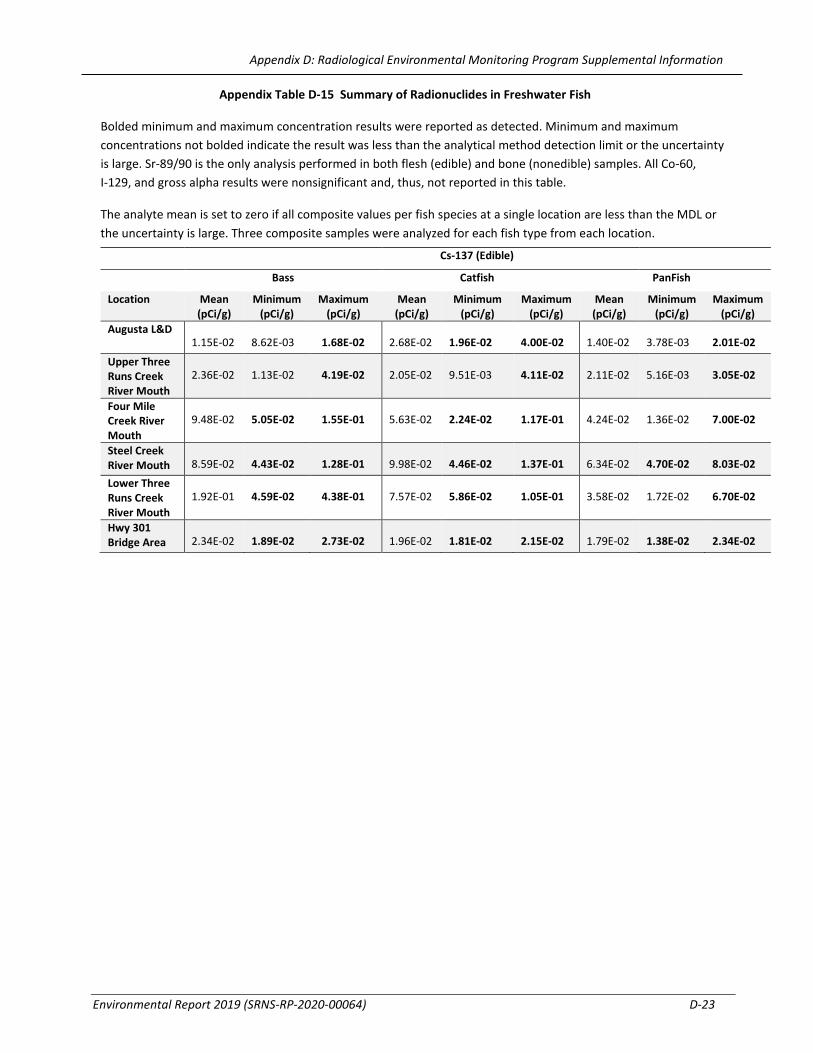
Appendix D: Radiological Environmental Monitoring Program Supplemental Information
Environmental Report 2019 (SRNS-RP-2020-00064) D-23
Appendix Table D-15 Summary of Radionuclides in Freshwater Fish
Bolded minimum and maximum concentration results were reported as detected. Minimum and maximum concentrations not bolded indicate the result was less than the analytical method detection limit or the uncertainty is large. Sr-89/90 is the only analysis performed in both flesh (edible) and bone (nonedible) samples. All Co-60, I-129, and gross alpha results were nonsignificant and, thus, not reported in this table.
The analyte mean is set to zero if all composite values per fish species at a single location are less than the MDL or the uncertainty is large. Three composite samples were analyzed for each fish type from each location.
Cs-137 (Edible)
Bass Catfish PanFish
Location Mean (pCi/g)
Minimum (pCi/g)
Maximum (pCi/g)
Mean (pCi/g)
Minimum (pCi/g)
Maximum (pCi/g)
Mean (pCi/g)
Minimum (pCi/g)
Maximum (pCi/g)
Augusta L&D 1.15E-02 8.62E-03 1.68E-02 2.68E-02 1.96E-02 4.00E-02 1.40E-02 3.78E-03 2.01E-02
Upper Three Runs Creek River Mouth
2.36E-02 1.13E-02 4.19E-02 2.05E-02 9.51E-03 4.11E-02 2.11E-02 5.16E-03 3.05E-02
Four Mile Creek River Mouth
9.48E-02 5.05E-02 1.55E-01 5.63E-02 2.24E-02 1.17E-01 4.24E-02 1.36E-02 7.00E-02
Steel Creek River Mouth 8.59E-02 4.43E-02 1.28E-01 9.98E-02 4.46E-02 1.37E-01 6.34E-02 4.70E-02 8.03E-02
Lower Three Runs Creek River Mouth
1.92E-01 4.59E-02 4.38E-01 7.57E-02 5.86E-02 1.05E-01 3.58E-02 1.72E-02 6.70E-02
Hwy 301 Bridge Area 2.34E-02 1.89E-02 2.73E-02 1.96E-02 1.81E-02 2.15E-02 1.79E-02 1.38E-02 2.34E-02

Appendix D: Radiological Environmental Monitoring Program Supplemental Information
D-24 Savannah River Site
Sr-89/90 (Edible)
Bass Catfish Panfish Location Mean
(pCi/g) Minimum
(pCi/g) Maximum
(pCi/g) Mean (pCi/g)
Minimum (pCi/g)
Maximum (pCi/g)
Mean (pCi/g)
Minimum (pCi/g)
Maximum (pCi/g)
Augusta L&D 3.14E-03 7.35E-04 4.51E-03 0.00E+00 -3.16E-04 2.34E-03 0.00E+00 4.73E-04 2.31E-03
Upper Three Runs Creek River Mouth
0.00E+00 1.32E-03 3.05E-03 0.00E+00 2.33E-04 1.34E-03 0.00E+00 -1.52E-03 3.11E-03
Four Mile Creek River Mouth
2.74E-03 2.18E-03 3.08E-03 0.00E+00 5.97E-04 1.43E-03 3.18E-03 2.35E-03 4.43E-03
Steel Creek River Mouth
2.46E-03 1.48E-03 3.41E-03 0.00E+00 -5.73E-04 2.73E-03 0.00E+00 4.76E-05 2.46E-03
Lower Three Runs Creek River Mouth
0.00E+00 2.20E-03 2.56E-03 0.00E+00 4.89E-04 1.94E-03 5.46E-03 2.20E-03 8.97E-03
Hwy 301 Bridge Area
0.00E+00 1.13E-03 2.22E-03 1.85E-03 8.59E-04 2.62E-03 4.83E-03 3.59E-03 7.08E-03
Sr-89/90 (Nonedible)
Bass Catfish Panfish
Location Mean (pCi/g)
Minimum (pCi/g)
Maximum (pCi/g)
Mean (pCi/g)
Minimum (pCi/g)
Maximum (pCi/g)
Mean (pCi/g)
Minimum (pCi/g)
Maximum (pCi/g)
Augusta L&D 5.33E-01 3.43E-01 7.19E-01 6.50E-01 5.30E-01 7.51E-01 8.77E-01 7.46E-01 1.01E+00
Upper Three Runs Creek River Mouth
8.30E-01 6.51E-01 9.35E-01 7.54E-01 5.70E-01 9.73E-01 6.78E-01 5.27E-01 8.16E-01
Four Mile Creek River Mouth
2.04E+00 1.12E+00 2.92E+00 7.94E-01 4.73E-01 9.86E-01 8.70E-01 7.43E-01 1.07E+00
Steel Creek River Mouth
8.16E-01 6.51E-01 9.43E-01 7.44E-01 5.78E-01 8.54E-01 8.39E-01 6.95E-01 9.35E-01
Lower Three Runs Creek River Mouth
5.38E-01 4.16E-01 6.22E-01 7.11E-01 6.32E-01 7.68E-01 8.18E-01 7.14E-01 8.76E-01
Hwy 301 Bridge Area
6.59E-01 5.86E-01 7.65E-01 7.80E-01 6.65E-01 8.51E-01 9.65E-01 9.16E-01 1.04E+00

Appendix D: Radiological Environmental Monitoring Program Supplemental Information
Environmental Report 2019 (SRNS-RP-2020-00064) D-25
Tc-99 (Edible)
Bass Catfish Panfish
Location Mean (pCi/g)
Minimum (pCi/g)
Maximum (pCi/g)
Mean (pCi/g)
Minimum (pCi/g)
Maximum (pCi/g)
Mean (pCi/g)
Minimum (pCi/g)
Maximum (pCi/g)
Augusta L&D
0.00E+00 3.81E-02 5.41E-02 5.65E-02 3.32E-02 7.22E-02 0.00E+00 5.22E-02 5.65E-02
Upper Three Runs Creek River Mouth
0.00E+00 -1.48E-02 7.32E-02 0.00E+00 3.84E-02 7.24E-02 0.00E+00 -2.10E-02 6.19E-02
Four Mile Creek River Mouth
0.00E+00 -4.49E-02 5.27E-02 0.00E+00 -7.62E-03 7.14E-03 0.00E+00 -1.68E-02 2.04E-02
Steel Creek River Mouth
5.86E-02 4.03E-02 8.49E-02 0.00E+00 5.35E-03 3.78E-02 0.00E+00 3.62E-02 6.03E-02
Lower Three Runs Creek River Mouth
0.00E+00 1.53E-02 6.14E-02 0.00E+00 3.11E-02 6.68E-02 0.00E+00 -8.59E-03 3.70E-02
Hwy 301 Bridge Area
9.48E-02 5.22E-02 1.39E-01 8.02E-02 6.24E-02 1.15E-01 9.99E-02 8.97E-02 1.19E-01
Gross Beta (Edible)
Bass Catfish Panfish
Location Mean (pCi/g)
Minimum (pCi/g)
Maximum (pCi/g)
Mean (pCi/g)
Minimum (pCi/g)
Maximum (pCi/g)
Mean (pCi/g)
Minimum (pCi/g)
Maximum (pCi/g)
Augusta L&D
2.09E+00 1.91E+00 2.22E+00 2.12E+00 2.01E+00 2.34E+00 1.59E+00 1.35E+00 1.95E+00
Upper Three Runs Creek River Mouth
2.37E+00 2.11E+00 2.51E+00 2.45E+00 2.18E+00 2.62E+00 2.08E+00 1.84E+00 2.41E+00
Four Mile Creek River Mouth
1.93E+00 1.89E+00 1.98E+00 1.74E+00 1.36E+00 2.22E+00 1.67E+00 1.52E+00 1.82E+00
Steel Creek River Mouth
2.66E+00 2.46E+00 2.76E+00 2.45E+00 2.01E+00 2.86E+00 2.25E+00 2.18E+00 2.31E+00
Lower Three Runs Creek River Mouth
1.90E+00 1.66E+00 2.27E+00 1.89E+00 1.72E+00 2.07E+00 1.32E+00 1.16E+00 1.61E+00
Hwy 301 Bridge Area
2.30E+00 1.86E+00 3.14E+00 2.03E+00 1.94E+00 2.22E+00 1.40E+00 1.15E+00 1.53E+00

Appendix D: Radiological Environmental Monitoring Program Supplemental Information
D-26 Savannah River Site
Appendix Table D-16 Summary of Radionuclides in Saltwater Fish
Bolded minimum and maximum concentration results were reported as detected. Minimum and maximum concentrations not bolded indicate the result was less than the analytical method detection limit or the uncertainty is large. Sr-89/90 is the only analysis performed in both flesh (edible) and bone (nonedible) samples. Results of all samples for Co-60, Cs-137, I-129, Sr-89/90 (in flesh), and gross alpha were below method detection limits.
All saltwater fish are collected at the location designated as River Miles 0–8 (mouth of Savannah River).
Marine Mullet
Analyte Number of Samples
Number of Results >
Detection Limit
Mean (pCi/g)
Minimum (pCi/g)
Maximum (pCi/g)
Tc-99 3 1 7.25E-02 6.95E-02 7.62E-02 Sr-89/90 Nonedible
3 2 3.22E-01 2.76E-01 3.46E-01
Gross Beta 3 3 2.59E+00 2.36E+00 2.70E+00

Appendix D: Radiological Environmental Monitoring Program Supplemental Information
Environmental Report 2019 (SRNS-RP-2020-00064) D-27
Appendix Table D-17 Summary of Radionuclides in Shellfish
Bolded minimum and maximum concentration results were reported as detected. Minimum and maximum concentrations not bolded indicate the result was less than the analytical method detection limit or the uncertainty is large. All Co-60, Cs-137, I-129, Tc-99, Sr-89/90, and gross alpha results were not detected; thus, they were not reported in this table.
All shellfish are collected at the location designated as River Miles 0-8 (at the mouth of Savannah River).
The species of shellfish collected in 2019 were shrimp and crab.
Nuclide Number of
Samples Number of Results > Detection
Limit
Mean Concentration
(pCi/g)
Minimum Concentration
(pCi/g)
Maximum Concentration (pCi/g)
Gross B 2 2 1.22E+00 9.57E-01 1.49E+00

Appendix D: Radiological Environmental Monitoring Program Supplemental Information
D-28 Savannah River Site
Appendix Table D-18 Summary of Radionuclides in Wildlife
Bolded concentration results were reported as detected. Minimum and maximum concentrations not bolded indicate the result was less than the analytical method detection limit or the uncertainty is large. All Co-60 results were below detection limits and, thus, are not reported in this table.
Sample Type Nuclide Number
of Samples
Number of Results > Detection
Limit
Mean Sample Concentration
(pCi/g)
Minimum Sample
Concentration (pCi/g)
Maximum Sample
Concentration (pCi/g)
Deer Flesh Cs-137 26 26 6.98E-01 2.73E-01 1.35E+00 Hog Flesh Cs-137 6 6 6.77E-01 3.41-02 2.06E+00 Alligator Flesh Cs-137 1 1 1.54E-01 1.54E-01 1.54E-01
Deer Flesh Sr-89/90 26 1 1.57E-03 -2.10E-03 5.41E-03 Hog Flesh Sr-89/90 6 0 1.10E-03 -1.74E-03 4.05E-03 Deer Bone Sr-89/90 26 26 3.16E+00 1.15E+00 6.32E+00 Hog Bone Sr-89/90 6 6 1.96E+00 7.24E-01 3.73E+00

Environmental Report 2019 (SRNS-RP-2020-00064) E-1
Appendix D Groundwater Management Program Appendix Table E-1 Summary of Documents that Report Groundwater Monitoring Data
Document Title Submittal Frequency
Data Report for the C-Area Groundwater (CAGW) Operable Unit Annual K-Area Burning/Rubble Pit (131-K) and Rubble Pile (631-20G) (KBRP), L-Area Burning/Rubble Pit (131-L), Gas Cylinder Disposal Facility (131-2L) and L-Area Rubble Pile (131-3L) (LBRP), and P-Area Burning/Rubble Pit (131-P) (PBRP) Operable Units Combined Groundwater Monitoring Report Sampling Summary
Annual
Annual Comprehensive TNX Area Groundwater Monitoring and Remedial Action Effectiveness Interim Report
Annual
R-Area Groundwater Effectiveness Monitoring Report in Support of R-Area Operable Unit
Biennial
Effectiveness Monitoring Report (EMR) for Monitored Natural Attenuation (MNA) at the L-Area Southern Groundwater (LASG) Operable Unit
Biennial
Five-Year Remedy Review Report for Savannah River Site Operable Units Phased - Annual D-Area Groundwater Operable Unit Annual Groundwater Mixing Zone Report for the D-Area Oil Seepage Basin Annual Groundwater Mixing Zone Sampling Summary Report for the R-Reactor Seepage Basin, 108-4R Overflow Basin Operable Unit
Biennual
632-G C&D Class Two Landfill Groundwater Monitoring Report Biannual N-Area Heating Oil (NHO) Plume Groundwater Monitoring Report Annual Z-Area Saltstone Disposal Facility Groundwater Monitoring Report Biannual 288-F Class Two Landfill Annual Groundwater Monitoring Report Biannual Interim Sanitary Landfill (Class Three) Annual Groundwater Monitoring Report
Biannual
Annual M Area and Metallurgical Laboratory Hazardous Waste Management Facilities Groundwater Monitoring and Corrective Action Report
Annual
Annual Corrective Action Report for the F-Area Hazardous Waste Management Facility, the H-Area Hazardous Waste Management Facility, and the Mixed Waste Management Facility
Annual
Performance Evaluation Report for the M-Area Inactive Process Sewer Lines (MIPSL) (081-M) Operable Unit
Annual
Performance Evaluation Report for the A-Area Burning/Rubble Pit (731-A, 731-1A) and Rubble Pit (731-2A) and the Miscellaneous Chemical Basin/Metals Burning Pit (731-4A, 731-5A) Operable Unit
Annual
Appendix E: Groundwater Management Program Supplemental Information

Appendix E: Groundwater Management Program Supplemental Information
E-2 Savannah River Site
Appendix Table E-1 Summary of Documents that Report Groundwater Monitoring Data (continued)
Document Title Submittal Frequency
Effectiveness Monitoring Report (EMR) for the Monitored Natural Attenuation (MNA) at the Chemicals, Metals, and Pesticides (CMP) Pits Operable Unit
Annual
Biennial Effectiveness Monitoring Report (EMR) for Monitored Natural Attenuation (MNA) at the C-Area Burning/Rubble Pit (131-C) and Old C-Area Burning/Rubble Pit (NBN) Operable Unit
Biennial
Scoping Summary for the General Separations Area Eastern Groundwater Operable Unit
Annual
Scoping Summary for the General Separations Area Western Groundwater Operable Unit
Annual
Performance Evaluation Report for the A-Area Miscellaneous Rubble Pile (731-6A) Operable Unit
Annual
Sanitary Landfill Groundwater Monitoring and Corrective Action Report Annual Annual Groundwater Monitoring Report for the F- and H-Area Radioactive Liquid Waste Tank Farms
Annual
SRS Environmental Report Not applicablea a The SRS Environmental Report is not submitted to the regulatory agencies as a regulatory requirement. The report is a publicly available
document. The SRS -Environmental Report summarizes information on offsite wells and onsite wells that are not included in regulatory submittals.

Environmental Report 2019 (SRNS-RP-2020-00064) F-1
A accuracy—Closeness of the result of a measurement to the true value of the quantity.
actinide—Group of radioactive metallic elements of atomic number 89 through 103. Laboratory analysis of actinides by alpha spectrometry generally refers to the elements plutonium, americium, uranium, and curium but may also include neptunium and thorium.
activity—See radioactivity.
alpha particle—Positively charged particle emitted from the nucleus of an atom having the same charge and mass as that of a helium nucleus (two protons and two neutrons)
ambient—Existing in the surrounding area. Completely enveloping.
ambient air—Surrounding atmosphere as it exists around people, plants, and structures.
analyte—Constituent or parameter that is being analyzed.
analytical detection limit—Lowest reasonably accurate concentration of an analyte that can be detected; this value varies depending on the method, instrument, and dilution used.
aquifer—Saturated, permeable geologic unit that can transmit significant quantities of water under ordinary hydraulic gradients.
Area Completion Project—U.S. Department of Energy program that directs the assessment and cleanup of inactive waste units and groundwater (remediation) contaminated as a result of nuclear-related activities.
Atomic Energy Agency—Federal agency created in 1946 to manage the development, use, and control of nuclear energy for military and civilian application. It was abolished by the Energy Reorganization Act of 1974 and succeeded by the Energy Research and Development Administration. Functions of the Energy Research and Development Administration eventually were taken over by the U.S. Department of Energy and the U.S. Nuclear Regulatory Commission.
audit—A systematic evaluation to determine the conformance to quantitative specifications of some operational function or activity.
Appendix F: Glossary

Appendix F: Glossary
F-2 Savannah River Site
B
Background control location—A sampling point that is not impacted by SRS operations.
background radiation—Naturally occurring radiation, fallout, and cosmic radiation. Generally, the lowest level of radiation obtainable within the scope of an analytical measurement, that is, a blank sample.
Benchmark — A standard or point of reference against which things may be compared or assessed.
Best Available Technology (BAT) —The preferred technology for treating a particular process liquid waste. BAT is not a specific level of treatment but the conclusion of a selection process that includes several treatment alternatives. The selection process looks at factors related to technology, economics, public policy, and other parameters.
best management practices—Sound engineering practices that are not required by regulation or by law.
beta particle—Negatively charged particle emitted from the nucleus of an atom. It has a mass and charge equal to those of an electron.
Biobased products—Products derived from plants and other renewable agricultural, marine, and forestry materials that provide an alternative to conventional petroleum-derived products.
Biopreferred® —A program the U.S. Department of Agriculture (USDA) manages to increase the purchase and use of biobased products. The program's purpose is to spur economic development, create new jobs, and provide new markets for farm commodities. For more information, please see the USDA website.
biota—Plant and animal life.
blind sample—A subsample for analysis with a composition known to the submitter. The analyst or laboratory may know the identity of the sample, but not its composition. It tests the analyst’s or laboratory’s proficiency in the execution of the measurement process.
C
calibration—Process of applying correction factors to equate a measurement to a known standard. Generally, a documented measurement control program of charts, graphs, and data that demonstrate that an instrument is properly calibrated.
canyon—Two facilities located at SRS where nuclear materials are chemically recovered and purified. They are called “canyons” because of their similarity to how a canyon looks, open space with high wall-like mountains on either side of a valley.

Appendix F: Glossary
Environmental Report 2019 (SRNS-RP-2020-00064) F-3
Carolina bay—Type of shallow depression commonly found on the coastal Carolina plains. Carolina bays are typically circular or oval. Some are wet or marshy, while others are dry.
categorical exclusion—Categories of actions that do not individually or cumulatively have a significant effect on the human environment and for which, therefore, neither an environmental assessment nor an environmental impact statement is required.
Central Savannah River Area—Eighteen-county area in Georgia and South Carolina surrounding Augusta, Georgia. The Savannah River Site is included in the Central Savannah River Area. Counties are Richmond, Columbia, McDuffie, Burke, Emanuel, Glascock, Jenkins, Jefferson, Lincoln, Screven, Taliaferro, Warren, and Wilkes in Georgia and Aiken, Edgefield, Allendale, Barnwell, and McCormick in South Carolina.
chlorocarbons—Compounds of carbon and chlorine, or carbon, hydrogen, and chlorine, such as carbon tetrachloride, chloroform, tetrachloroethylene, etc. They are among the most significant and widespread environmental contaminants. Classified as hazardous wastes, chlorocarbons may have a tendency to cause detrimental effects, such as birth defects.
cleanup—Actions taken to deal with release or potential release of hazardous substances. This may mean complete removal of the substance; it also may mean stabilizing, containing, or otherwise treating the substance so that it does not affect human health or the environment.
closure—Control of a hazardous waste management facility under Resource Conservation and Recovery Act requirements.
compliance—Fulfillment of applicable requirements of a plan or schedule ordered or approved by government authority.
composite—A blend of more than one portion to be used as a sample for analysis.
Comprehensive Environmental Response, Compensation, and Liability Act (CERCLA)—This Act addresses the cleanup of hazardous substances and establishes a National Priority List of sites targeted for assessment and, if necessary, restoration (commonly known as “Superfund”).
concentration—Amount of a substance contained in a unit volume or mass of a sample.
conductivity—Measure of water’s capacity to convey an electric current. This property is related to the total concentration of the ionized substances in water and the temperature at which the measurement is made.
contamination—State of being made impure or unsuitable by contact or mixture with something unclean, bad, etc.
contaminant pathway—The way contaminants move and settle in the environment after release from operating facilities to the air and water.
Appendix F: Glossary
F-4 Savannah River Site
continuous assessment—Evaluation of a program or employee carried out on a fixed interval (for example, weekly, monthly, annually)
control chart—A graph of some measurement plotted over time or sequence of sampling, together with control limit(s) and, usually, a central line and warning limit(s). Control charts provide a graphical representation of accuracy and precision, a long-term mechanism for self-evaluation of analytical data, and an assessment of analytical capability of the laboratory analyst.
control standard—A standard prepared independently of and run with the calibration. It is used to verify the accuracy of the calibration.
cool roof—A thick white rubber-type roof that lowers the temperature of standard roofs from about 150 degrees Fahrenheit to 100 degrees or less.
criteria pollutant—Six common air pollutants found all over the United States. They are particle pollution (often referred to as particulate matter), ground-level ozone, carbon monoxide, sulfur dioxide, nitrogen oxides, and lead. The Clean Air Act requires the Environmental Protection Agency to set National Ambient Air Quality Standards for these six pollutants.
curie—Unit of radioactivity. One curie is defined as 3.7 x 10¹⁰ (37 billion) disintegrations per second. Several fractions and multiples of the curie are commonly used:
• kilocurie (kCi)—103 Ci, one thousand curies; 3.7 x 10¹³ disintegrations per second. • millicurie (mCi)—10-3 Ci, one-thousandth of a curie; 3.7 x 10⁷ disintegrations per second. • microcurie (µCi)—10-6 Ci, one-millionth of a curie; 3.7 x 10⁴ disintegrations per second. • picocurie (pCi)—10-12 Ci, one-trillionth of a curie; 0.037 disintegrations per second.
D
DCS sum of fractions—The sum of the ratios of the average concentration of each radionuclide to its corresponding DCS value. (See below for definition of DCS-derived concentration standard.)
decay (radioactive)—Spontaneous transformation of one radionuclide into a different radioactive or nonradioactive nuclide, or into a different energy state of the same radionuclide.
deactivation—The process of placing a facility in a stable and known condition, including removing hazardous and radioactive materials to ensure adequate protection of the worker, public health and safety, and the environment, thereby limiting the long-term cost of surveillance and maintenance.
decommissioning—Process that takes place after deactivation and includes surveillance and maintenance, decontamination, and dismantlement.
decontamination—The removal or reduction of residual radioactive and hazardous materials by mechanical, chemical, or other techniques to achieve a stated objective or end condition.

Appendix F: Glossary
Environmental Report 2019 (SRNS-RP-2020-00064) F-5
derived concentration standard (DCS)—Concentration of a radionuclide in air or water that, under conditions of continuous exposure for one year by one exposure mode (that is, ingestion of water, submersion in air, or inhalation), would result in an effective dose equivalent of 0.1 rem (1 mSv). The guides for radionuclides in air and water are given in U.S. Department of Energy Derived Concentration Technical Standard (DOE-STD-1196-2011) (DOE 2011).
detection limit—See analytical detection limit, lower limit of detection, minimum detectable concentration.
detector—Material or device (instrument) that is sensitive to radiation and can produce a signal suitable for measurement or analysis.
disposal—Permanent or temporary transfer of U.S. Department of Energy control and custody of real property to a third party, which thereby acquires rights to control, use, or relinquish the property.
disposition—Those activities that follow completion of program mission including, but not limited to, surveillance and maintenance, deactivation, and decommissioning.
dissolved oxygen—Desirable indicator of satisfactory water quality in terms of low residuals of biologically available organic materials. Dissolved oxygen prevents the chemical reduction and subsequent leaching of iron and manganese from sediments.
DOECAP—A comprehensive audit program for contract laboratories with the intent of conducting consolidated audits to eliminate redundant audits previously conducted independently by DOE field element sites and to achieve standardization in audit methodology, processes, and procedures.
dose—Energy imparted to matter by ionizing radiation. The unit of absorbed dose is the rad, equal to 0.01 joules per kilogram in any medium.
• absorbed dose—Quantity of radiation energy absorbed by an organ, divided by the organ’s mass. Absorbed dose is expressed in units of rad (or gray) (1 rad = 0.01 Gy).
• equivalent dose—Product of the absorbed dose (rad) in tissue and a radiation weighting factor. Equivalent dose is expressed in units of rem (or sievert) (1 rem = 0.01 sievert).
• effective dose—Sum of the dose equivalents received by all organs or tissues of the body after each one has been multiplied by an appropriate tissue weighting factor.
• committed effective dose—Is the effective dose integrated over time, usually 50 years. Committed effective dose is expressed in units of rem (or sievert).
• collective dose—Sum of the effective dose of all individuals in an exposed population within a 50-mile (80-km) radius and expressed in units of person-rem (or person-sievert). The 50-mile distance is measured from a point located centrally with respect to major facilities or U.S. Department of Energy program activities.
dosimeter—Portable detection device for measuring the total accumulated exposure to ionizing radiation.

Appendix F: Glossary
F-6 Savannah River Site
drinking water standards—Federal primary drinking water standards, both proposed and final, as set forth by the Environmental Protection Agency.
duplicates or duplicate results—Results derived by taking a portion of a primary sample and performing the same analysis on that portion that is performed on the primary sample.
E
effluent—A release of treated or untreated water or air from a pipe or a stack to the environment. Liquid effluent flows into a body of water such as a stream or lake. Airborne effluent (also called emission) discharges into the atmosphere.
effluent monitoring—Collection and analysis of samples or measurements of liquid and gaseous effluents to characterize and quantify the release of contaminants, assess radiation exposures to members of the public, and demonstrate compliance with applicable standards.
emission—A release of a gas.
ENERGY STAR®—A U.S. Environmental Protection Agency program that helps businesses and individuals save money and protect the climate through energy efficiency. For more information, please visit the ENERGY STAR website.
environmental compliance—Actions taken in accordance with government laws, regulations, orders, etc., that apply to Site operations’ effects on onsite and offsite natural resources and on human health; used interchangeably in this document with regulatory compliance.
environmental monitoring—Vital role in determining health and safety issues for the purpose of public health or environmental health. Environmental monitoring at Savannah River Site includes effluent monitoring and environmental surveillance with the dual purpose of 1) showing compliance with federal, state, and local regulations, as well as with U.S. Department of Energy orders, and 2) monitoring any effects of Site operations on onsite and offsite natural resources and on human health.
environmental occurrence—Any sudden or sustained deviation from a regulated or planned performance at a DOE operation that has environmental protection and compliance significance.
environmental surveillance—Collection and analysis of samples of air, water, soil, foodstuffs, biota, and other media from U.S. Department of Energy sites and their environs and the measurement of external radiation to demonstrate compliance with applicable standards, assess radiation exposures to members of the public, and assess effects, if any, on the local environment.
EPEAT—A product database that registers products based on the devices’ ability to meet various criteria developed and agreed upon by diverse stakeholders to address the full lifecycle of an electronic product. This system ensures all products listed in the EPEAT database truly represent environmental leadership. For more information, please visit the EPEAT website.

Appendix F: Glossary
Environmental Report 2019 (SRNS-RP-2020-00064) F-7
exception (formerly “exceedance”)—Term used by the Environmental Protection Agency and the South Carolina Department of Health and Environmental Control that denotes a reported value is more than the guide limit. This term is found on the discharge monitoring report forms that are submitted to the Environmental Protection Agency or the South Carolina Department of Health and Environmental Control.
exclusion or exclusion device—Material or equipment used for wildlife control. These devices may be used to deter animal use of an area, to provide a method of collecting animals, or to provide a means of exit for an animal.
exposure (radiation)—Incidence of radiation on living or inanimate material by accident or intent. Background exposure is the exposure to natural background ionizing radiation. Occupational exposure is the exposure to ionizing radiation that takes place during a person’s working hours. Population exposure is the exposure to the total number of persons who inhabit an area.
exposure pathway—The way that a person could be impacted from releases of radionuclides into the water and air. F
fallout—The settling to the ground of airborne particles ejected into the atmosphere from the earth by explosions, eruptions, forest fires, etc. or from human production activities such as found at nuclear facilities.
Federal Facility Agreement (FFA)—Agreement negotiated among the U.S. Department of Energy, the U.S. Environmental Protection Agency, and the South Carolina Department of Health and Environmental Control, specifying how the Savannah River Site will address contamination or potential contamination to meet regulatory requirements at Site waste units identified for evaluation and, if necessary, cleanup.
feral hog—Hog that has reverted to the wild state from domestication.
field duplicate—An independent sample collected as closely as possible to the same point in space and time as the original sample. The duplicate and original are two separate samples taken from the same source, stored in separate containers, and analyzed independently.
fiscal year—An established period of time when an organization's annual financial records start and end. In the federal government, this period is from October 1 to September 30.
fugitive greenhouse gas emissions—The inadvertent release of greenhouse gases to the atmosphere from various facilities or activities. Some common sources include leaks or releases from valves, pumps, compressors, flanges from refrigeration, and air conditioning systems.
Appendix F: Glossary
F-8 Savannah River Site
G
global fallout—Radioactive debris from atmospheric weapons tests that has been deposited on the earth’s surface after being airborne and cycling around the earth.
grab sample—Sample collected instantaneously with a glass or plastic bottle placed below the water surface to collect surface water samples (also called dip samples).
graded approach (to sampling)—A decision process in which the requirements on the system vary with the risk of exposure to radionuclides.
gross alpha and beta releases—The total alpha-emitting and beta-emitting activity determined at each effluent location.
ground shine—Exposure to gamma radiation produced by radioactive materials on the ground surface is called ground shine and it contributes to external dose.
groundwater—Water found underground in cracks and spaces in soil, sand, and rocks.
H
half-life (radiological)—Time required for half of a given number of atoms of a specific radionuclide to decay. Each nuclide has a unique half-life.
hazardous waste—Any waste that is a toxic, corrosive, reactive, or ignitable material that could affect human health or the environment.
I
impaired water— Water for which technology-based regulations and other required controls are not stringent enough to meet the water quality standards set by states.
International Organization for Standardization (ISO)—Creates documents that provide requirements, specifications, guidelines, or characteristics that can be used consistently to ensure that materials, products, processes, and services are compatible with their purpose. For more information, please visit the ISO website.
intralaboratory checks—Compare performance within a laboratory by analyzing duplicate and blind samples throughout the year.

Appendix F: Glossary
Environmental Report 2019 (SRNS-RP-2020-00064) F-9
isotope—Each of two or more forms of the same element that contain equal numbers of protons but different numbers of neutrons in their nuclei and, hence, differ in relative atomic mass but not in chemical properties; in particular, a radioactive form of an element. L
legacy—Anything handed down from the past; inheritance, as of nuclear waste.
low-level waste—Waste that includes protective clothing, tools, and equipment that have become contaminated with small amounts of radioactive material.
lower limit of detection—Smallest concentration or amount of an analyte that can be reliably detected in a sample at a 95% confidence level.
M
manmade radiation—Radiation from sources such as consumer products, medical procedures, and nuclear industry.
MAPEP—A laboratory comparison program that tracks performance accuracy and tests the quality of environmental data reported to DOE.
maximally exposed individual—Hypothetical individual who remains in an uncontrolled area and would, when all potential routes of exposure from a facility’s operations are considered, receive the greatest possible dose equivalent.
maximum contaminant level—The maximum allowable concentration of a drinking water contaminant as legislated through the Safe Drinking Water Act.
mercury—Silver-white, liquid metal solidifying at -38.9°C to form a tin-white, ductile, malleable mass. It is widely distributed in the environment and biologically is a nonessential or nonbeneficial element. Human poisoning due to this highly toxic element has been clinically recognized.
migration—Transfer or movement of a material through the soil or groundwater.
minimum detectable concentration (radionuclides)—Smallest amount or concentration of a radionuclide that can be distinguished in a sample by a given measurement system at a preselected counting time and at a given confidence level.
minimum detectable concentration (chemicals)—Smallest amount or concentration of a chemical that can be distinguished in a sample by a given measurement system at a given confidence level.
mixed waste—Waste that has both hazardous and radioactive components.

Appendix F: Glossary
F-10 Savannah River Site
monitoring—Process whereby the quantity and quality of factors that can affect the environment or human health are measured periodically to regulate and control potential impacts.
N
nonroutine radioactive release—Unplanned or nonscheduled release of radioactivity to the environment.
nuclide—Atom specified by its atomic weight, atomic number, and energy state. A radionuclide is a radioactive nuclide.
O
organic—Of, relating to, or derived from living organisms (plant or animal).
optically stimulated luminescence dosimeter (OSLD)— A reusable passive device that measures the exposure from ionizing radiation. In 2019, SRS transitioned from TLDs to OSLDs to obtain a higher and more accurate absorption rate to radiation exposure.
outfall—Place where treated or untreated water flows out of a pipe to mix with water from a water body, such as a stream or lake.
P
parameter—Analytical constituent; chemical compound(s) or property for which an analytical request may be submitted.
passive device—A device that does not require a source of energy for its operation.
PCB bulk product waste—Waste derived from products manufactured to contain PCBs in a nonliquid state at 50 ppm or greater. Typical examples are caulk, pain, and sealants.
performance evaluation (PE) sample—A sample, the composition of which is unknown to the analyst, that is provided to test whether the analyst or laboratory can produce analytical results within specified performance limits.
person-rem—Collective dose to a population group. For example, a dose of 1 rem to 10 individuals results in a collective dose of 10 person-rem.
pH—Measure of the hydrogen ion concentration in an aqueous solution (acidic solutions, pH <7; basic solutions, pH>7; and neutral solutions, pH 7).

Appendix F: Glossary
Environmental Report 2019 (SRNS-RP-2020-00064) F-11
piezometer—Instrument used to measure the potentiometric surface of the groundwater. Also, a well designed for this purpose.
plume—Volume of contaminated water originating at a waste source for example, a hazardous waste disposal site). It extends downward and outward from the waste source.
plume shine—Exposure to gamma radiation from airborne radioactive materials is called plume shine (sometimes called cloud shine or sky shine), and it contributes to external dose.
point source—Any defined source of emission to air or water such as a stack, air vent, pipe, channel, or passage to a water body.
population dose—See collective dose equivalent under dose.
potable water—Water that is safe to drink.
practical quantitation—The lowest level a laboratory can quantify with 99% confidence.
precision—A estimate of the degree to which a set of observations or measurements of the property, usually obtained under similar conditions agree. It is a data quality indicator.
process sewer—Pipe or drain, generally located underground, used to carry off either process water or waste matter, or both.
proficiency testing—An evaluation of a laboratory’s performance against preestablished criteria by means of interlaboratory comparison. It is also known as comparative testing.
purge—To remove water prior to sampling, generally by pumping or bailing.
Q
quality assurance (QA)—An integrated system of management activities involving planning, implementation, documentation, assessment, reporting, and quality improvement to ensure quality in the processes by which products are developed.
quality control (QC)—A set of activities for ensuring quality in products by identifying defects in the actual products.
R
rad—Unit of absorbed dose deposited in a volume of material.
radioactivity—Spontaneous emission of radiation, generally alpha or beta particles, or gamma rays, from the nucleus of an unstable isotope.

Appendix F: Glossary
F-12 Savannah River Site
radioisotopes—Radioactive isotopes.
radionuclide—Unstable nuclide capable of spontaneous transformation into other nuclides by changing its nuclear configuration or energy level. This transformation is accompanied by the emission of photons or particles.
Recovery criteria—The ratio of the observed mean result and the value of a standard reference person—A hypothetical age and gender averaged individual that is a combination of human (male and female) physical and physiological characteristics arrived at by international consensus to standardize radiation dose calculations.
RCRA/CERCLA Units—Units subject to the remedial action process established in the Federal Facilities Agreement.
Regional Screening Level (RSL)—The risk-based concentration derived from standardized equations combining exposure assumptions with toxicity data.
regulatory compliance—Actions taken in accordance with government laws, regulations, orders, etc., that apply to Savannah River Site operations’ effects on onsite and offsite natural resources and on human health; used interchangeably in this document with environmental compliance.
release—Any discharge to the environment. Environment is broadly defined as any water, land, or ambient air.
rem—Unit of dose equivalent (absorbed dose in rads times the radiation quality factor). Dose equivalent frequently is reported in units of millirem (mrem), which is one thousandth of a rem.
remediation—Assessment and cleanup of sites contaminated with waste due to historical activities.
representative person—A hypothetical individual receiving a dose that is representative of the more highly exposed individuals in the population.
Resource Conservation and Recovery Act (RCRA)—Federal legislation that regulates the transport, treatment, and disposal of solid and hazardous wastes. This act also requires corrective action for releases of hazardous waste at inactive waste units.
retention basin—Unlined basin used for emergency, temporary storage of potentially contaminated cooling water from chemical separations activities.
routine radioactive release—Planned or scheduled release of radioactivity to the environment.
S
seepage basin—Excavation that receives wastewater. Insoluble materials settle out on the floor of the basin and soluble materials seep with the water through the soil column, where they are removed partially by ion exchange with the soil. Construction may include dikes to prevent overflow or surface runoff.

Appendix F: Glossary
Environmental Report 2019 (SRNS-RP-2020-00064) F-13
SEER—Seasonal Energy Efficiency Ratio—This is a measure of equipment energy efficiency over the cooling season. It represents the total cooling of a central air conditioner or heat pump during the normal cooling season as compared to the total electric energy input consumed during the same period.
sensitivity—Capability of methodology or instruments to discriminate between samples with differing concentrations or containing varying amounts of an analyte.
sievert—The International System of Units (SI) derived unit of dose equivalent. It attempts to reflect the biological effects of radiation as opposed to the physical aspects, which are characterized by the absorbed dose, measured in gray. One sievert is equal to 100 rem.
significant analytical result—Indicates that the result is statistically significant or is at or above the detection limit of the applicable radioanalytical method, or both.
Silvex— A herbicide and a plant growth regulator. It has been banned for use as a herbicide in the United States since 1985.
site stream—Any natural stream on the Savannah River Site. Surface drainage of the Site is via these streams to the Savannah River.
source—Point or object from which radiation or contamination emanates.
source term—Quantity of radioactivity (released in a set period of time) that is traceable to the starting point of an effluent stream or migration pathway.
spent nuclear fuel—Used fuel elements from reactors.
splits or split sample—Two or more representative portions taken from a single sample and analyzed by different analysts or laboratories. Split samples are used to replicate the measurement of the parameters of interest.
SRS Community Reuse Organization (SRSCRO)—A nonprofit organization charged with developing and implementing strategy to diversify the economy in the five South Carolina and Georgia counties surrounding the Site. For more information, please see the SRSCRO website.
stable—Not radioactive or not easily decomposed or otherwise modified chemically.
stack—Vertical pipe or flue designed to exhaust airborne gases and suspended particulate matter.
standard deviation—Indication of the dispersion of a set of results around their average.
statistical data evaluation—A collection of methods used to process large amounts of data and report overall trends.
stormwater runoff—Surface streams that appear after precipitation.
Superfund—See Comprehensive Environmental Response, Compensation, and Liability Act (CERCLA).

Appendix F: Glossary
F-14 Savannah River Site
surface water—Water that has not penetrated below the surface of the ground.
T
tank farm—Interconnected underground tanks used for storage of high-level radioactive liquid wastes.
temperature—Thermal state of a body, considered with its ability to communicate heat to other bodies.
terrestrial—Living on or growing from the land.
thermoluminescent dosimeter (TLD)—A passive device that measures the exposure from ionizing radiation.
total dissolved solids—Dissolved solids and total dissolved solids are terms generally associated with freshwater systems; they consist of inorganic salts, small amounts of organic matter, and dissolved materials.
total phosphorus—May occasionally stimulate excessive or nuisance growths of algae and other aquatic plants when concentrations exceed 25 mg/L at the time of the spring turnover on a volume-weighted basis in lakes or reservoirs.
total suspended particulates—Refers to the concentration of particulates in suspension in the air, regardless of the nature, source, or size of the particulates.
translocation—The deliberate movement of organisms from one site for release in another. It must be intended to yield a measurable conservation benefit at the levels of a population, species or ecosystem, and not only provide benefit to translocated individuals.
transport pathway—Pathway by which a released contaminant is transported physically from its point of discharge to a point of potential exposure to humans. Typical transport pathways include the atmosphere, surface water, and groundwater.
transuranic waste—Solid radioactive waste containing primarily alpha-emitting elements heavier than uranium.
trend—General drift, tendency, or pattern of a set of data plotted over time.
tritium—Elemental form of the radioactive isotope of hydrogen and occurs as a gas.
tritium oxide—Water in which the tritium isotope has replaced a hydrogen atom. Stack releases of tritium oxide typically occur as water vapor.
turbidity—Measure of the concentration of sediment or suspended particles in solution.

Appendix F: Glossary
Environmental Report 2019 (SRNS-RP-2020-00064) F-15
U
unidentified alpha and beta releases—The unspecified alpha and beta releases that are conservatively determined at each effluent location by subtracting the sum of the individually measured alpha-emitting (for example, plutonium-239 and uranium-235) and beta-emitting (for example, cesium-137 and strontium-90) radionuclides from the measured gross alpha and beta values, respectively. Unidentified alpha and beta releases also include naturally occurring radionuclides, such as uranium, thorium, radon progeny, and potassium-40.
utility water—Once-through noncontact cooling water, recirculated noncontact cooling water, boiler blowdown, steam condensate, air conditioning condensate, and other uncontaminated heating, ventilation, and air conditioning or compressor condensates.
V
volatile organic compounds—Broad range of organic compounds, commonly halogenated, that vaporize at ambient, or relatively low, temperatures (for example, acetone, benzene, chloroform, methyl alcohol).
W
waste management—The U.S. Department of Energy uses this term to refer to the safe, effective management of various kinds of nonhazardous, hazardous, and radioactive waste generated at DOE facilities.
waste unit—A particular area that is or may be posing a threat to human health or the environment. Waste units range in size from a few square feet to tens of acres and include basins, pits, piles, burial grounds, landfills, tank farms, disposal facilities, process facilities, and groundwater contamination.
waste stream—Waste material generated from a single process or from an activity that is similar in material, physical form, isotopic makeup, and hazardous constituents.
WaterSense®—A U.S. Environmental Protection Agency partnership that offers ways to increase water efficiency through products and services. For more information, please visit the U.S. EPA website.
water table—Planar, underground surface beneath which earth materials, such as soil or rock, are saturated with water.
Waters of the State—Surface or underground water within the jurisdiction of the state, as defined in the South Carolina Pollution Control Act.

Appendix F: Glossary
F-16 Savannah River Site
weighting factor—Value used to calculate dose equivalents. It is tissue-specific and represents the fraction of the total health risk resulting from uniform, whole-body irradiation that could be attributed to that particular tissue. The weighting factors used in this report are recommended by the International Commission on Radiological Protection (Publication 26).
wetland—Lowland area, such as a marsh, swamp, bog, Carolina bay, floodplain bottom, where land is covered by shallow water at least part of the year and is characterized by somewhat mucky soil.

Environmental Report 2019 (SRNS-RP-2020-00064) G-1
Aucott et al. 2017. Aucott, T.J., A.D. Brand, D.P. DiPrete, T.S. Whiteside. “Improvements to the Hunter Dose Tracking System,” SRNL-STI-2017-00091, Savannah River National Laboratory, Savannah River Site, Aiken, SC
Carlton et al. 1994. Carlton, W.H., C.E. Murphy, Jr., and A.G. Evans. “Radiocesium in the Savannah River Site Environment,” Health Physics, Volume 67, Number 3, Williams & Wilkins, Baltimore, MD
Cherry 2006. Cherry, G.S. “Simulation and Particle Tracking Analysis of Ground-Water Flow near the Savannah River Site, Georgia and South Carolina, 2002, and for Selected Ground-Water Management Scenarios, 2002 and 2020,” Scientific Investigations Report, 2006-5195, U.S. Geological Survey, Reston, VA
Denham 1995. Denham, M.E. “SRS Geology/Hydrogeology Environmental Information Document,” WSRC-TR-95-0046, Westinghouse Savannah River Company, Savannah River Site, Aiken, SC
DOE 2011. U.S. Department of Energy. “DOE Derived Concentration Technical Standard,” DOE-STD-1196-2011, Washington, DC
DOE 2013. U.S. Department of Energy. “Radiation Protection of the Public and the Environment,” DOE Order 458.1, Change 3; 2013, Washington, DC
DOE 2015. U.S. Department of Energy. “Environmental Radiological Effluent Monitoring and Environmental Surveillance,” DOE Handbook, DOE-HDBK-1216-2015, Washington, DC
DOE 2019. U.S. Department of Energy. “A Graded Approach for Evaluating Radiation Doses to Aquatic and Terrestrial Biota,” DOE-STD-1153-2019, Washington, DC
EPA 1993. U.S. Environmental Protection Agency. “External Exposure to Radionuclides in Air, Water, and Soil,” Federal Guidance Report No. 12, USEPA 402-R-93-081, Sept. 1993, Washington, DC
EPA 1999. U.S. Environmental Protection Agency. “Cancer Risk Coefficients for Environmental Exposure to Radionuclides,” Federal Guidance Report No.13, USEPA 402-R-99-001, Sept. 1999, Washington, DC
EPA 2000. U.S. Environmental Protection Agency. “National Primary Drinking Water Regulations,” Title 40 Code of Federal Regulations, Part 141, December 2000, Washington, DC
EPA 2002. U.S. Environmental Protection Agency. “National Emission Standards for Hazardous Air Pollutants,” Title 40 Code of Federal Regulations, Part 61, Subpart H, July 2002, Washington, DC
EPA 2011. U.S. Environmental Protection Agency. “Exposure Factor Handbook,” National Center for Environmental Assessment, Office of Research and Development, Sept. 2011, Washington, DC
EPA 2019. U.S. Environmental Protection Agency. “External Exposure to Radionuclides in Air, Water and Soil,” Federal Guidance Report No. 15, USEPA402/R19/002 Aug. 2019, Washington, DC
FFA 1993. “Federal Facility Agreement for the Savannah River Site,” Administrative Docket Number 89-05-FF, WSRC-OS-94-42, Effective Date: August 16, 1993, Savannah River Site, Aiken, SC
Appendix G: References

Appendix G: References
G-2 Savannah River Site
ICRP 2002. International Commission on Radiation Protection, “Basic Anatomical and Physiological Data for Use in Radiological Protection Reference Values,” Annals of the ICRP 32, Publication 89, Elmsford, NY
ICRP 2008. International Commission on Radiation Protection, “Nuclear Decay Data for Dosimetric Calculation,” Annals of the ICRP 38(3), Publication 107, Elmsford, NY
Jannik 2017. Jannik, G.T. “Environmental Dose Assessment Manual,” SRNL-TR-2010-00274 Revision 2, October 25, 2017, Savannah River National Laboratory, Savannah River Site, Aiken SC
Jannik and Stagich 2017. Jannik, G.T., B. Stagich. “Land and Water Use Characteristics and Human Health Input Parameters for Use in Environmental Dosimetry and Risk Assessments at the Savannah River Site—2017 Update,” SRNL-STI-2016-00456, Revision 1, May 2017, Savannah River National Laboratory, Savannah River Site, Aiken, SC
Laird and Jannik 2020. Laird, M.G., G.T. Jannik. “Updated External Exposure Dose Coefficients,” SRNL-L3200-2020-00014, May 2020, Savannah River National Laboratory, Savannah River Site, Aiken, SC
Minter et al 2018. Minter, K.M., G.T. Jannik, B.H. Stagich, K.L. Dixon, and J.R. Newton. “Comparison of the Current Center of the Site Annual NESHAP Dose Modeling at the Savannah River Site with Other Assessment Methods,” Health Physics Society, Health-Physics.com, 408-413
Morrison et al 2019. Morrison, C., S. Hitchens, T. Edwards, J. Mayer, and K. Minter. “Determining CS-137 Background Bodyburdens for Wild Pigs at Savannah River Site,” SRNL-TR-2019-00193, Savannah River National Laboratory, Savannah River Site, Aiken, SC
NCRP 2009. National Council on Radiation Protection and Measurements, “Ionizing Radiation Exposure of the Population of the United States.” NCRP Report 160, Bethesda, MD
NRC 1977. U.S. Nuclear Regulatory Commission. “Regulatory Guide 1.109 - Calculation of Annual Doses to Man from Routine Releases of Reactor Effluents for the Purpose of Evaluating Compliance with 10 CFR 50, Appendix I,” Revision 1, Washington, DC
SCDHEC 2014. South Carolina Department of Health and Environmental Control. “Water Classifications and Standards,” South Carolina Code of Regulations, R.61-68, Columbia, SC
SRNS 2017. Savannah River Nuclear Solutions, LLC. “Groundwater Management Strategy and Implementation Plan (U),” WSRC-RP-2006-4074, Updated October 2017, Savannah River Site, Aiken, SC
SRNS 2018. Savannah River Nuclear Solutions, LLC. “Environmental Report for 2017,” SRNS-RP-2018-00470, Savannah River Site, Aiken, SC
SRNS 2020. Savannah River Nuclear Solutions, LLC. “Annual Corrective Action Report for the F-Area Hazardous Waste Facility and the Mixed Waste Facility (U),” SRNS-RP-2020-00166, Savannah River Site, Aiken, SC
Appendix G: References
Environmental Report 2019 (SRNS-RP-2020-00064) G-3
SRS EDAM 2017. Savannah River National Laboratory. “Environmental Dose Assessment Manual,” SRNL-TR-2010-00274, Revision 2, October 2017, Savannah River National Laboratory, Aiken, SC
SRS EM Plan 2017. Savannah River Nuclear Solutions, LLC, “Savannah River Site Environmental Monitoring Program Management Plan,” SRS Manual 3Q1-101, Revision 9, Savannah River Site, Aiken, SC
Stagich, Jannik, and Dixon 2020. Stagich, B., G.T. Jannik, and K.L. Dixon. “Radiological Impact of 2019 Operations at the Savannah River Site,” SRNL-STI-2020-00241, Rev. 0, Savannah River National Laboratory, Savannah River Site, Aiken, SC
Stone and Jannik 2013. Stone, D.K. and G.T. Jannik. “Site Specific Reference Person Parameters and Derived Concentration Standards for the Savannah River Site,” SRNL-STI-2013-00115, Savannah River National Laboratory, Aiken, SC
Viner 2013. Viner, B.J. “Summary of Data and Steps for Processing the 2007-2011 SRS Meteorological Database,” SRNL-STI-2013-00268, Savannah River Laboratory, Aiken, SC, July 2013
Yu et al. 2001. C. Yu, A.J. Zielen, J.J. Cheng, D.J. LePoire, E. Gnanapragasam, S. Kamboj, Amish, A. Wallo III, W.A. Williams, and H. Peterson. “User’s Manual for RESRAD,” Version 6, Environmental Assessment Division, Argonne National Laboratory, Argonne, IL, July 2001
Appendix G: References
G-4 Savannah River Site
This page intentionally left blank

Environmental Report 2019 (SRNS-RP-2020-00064) H-1
Symbol Name Symbol Name
Temperature Concentration
°C degrees Celsius ppb parts per billion
°F degrees Fahrenheit ppm parts per million
Time Rate
d day cfs cubic feet per second
h hour gpm gallons per minute
y year Conductivity
Length µmho micromho
cm centimeter Radioactivity
ft foot Ci curie
in inch Ci/mL curie per millilter
km kilometer cpm counts per minute
m meter mCi millicurie
mm millimeter µCi microcurie
µm micrometer pCi picocurie
Mass pci/L picocurie per liter
g gram Bq becquerel
kg kilogram Radiation Dose
mg milligram mrad millirad
µg microgram mrem millirem
Area Sv sievert
mi² square mile mSv millisievert
ft² square foot µSv microsievert
Volume R roentgen
gal gallon mR milliroentgen
L liter µR microroentgen
mL milliliter Gy gray
Appendix H: Units of Measure

Appendix H: Units of Measure
H-2 Savannah River Site
Fractions and Multiples of Units Multiple Decimal Equivalent Prefix Symbol Report
Format 10⁶ 1,000,000 mega- M E+06 10³ 1,000 kilo- k E+03 10² 100 hecto- h E+02 10 10 deka- da E+01
10¯¹ 0.1 deci- d E-01 10¯² 0.01 centi- c E-02 10¯³ 0.001 milli- m E-03 10¯⁶ 0.000001 micro- µ E-06 10¯⁹ 0.000000001 nano- n E-09 10¯¹² 0.000000000001 pico- p E-12 10¯¹⁵ 0.000000000000001 femto- f E-15 10¯¹⁸ 0.000000000000000001 atto- a E-18
Conversion Table (Units of Radiation Measure) Current System Systeme International Conversion
curie (Ci) becquerel (Bq) 1 Ci = 3.7x10¹⁰ Bq rad (radiation absorbed dose) gray (Gy) 1 rad = 0.01 Gy rem (roentgen equivalent man) sievert (Sv) 1 rem = 0.01 Sv
Conversion Table Multiply By To Obtain Multiply By To Obtain in 2.54 cm cm 0.394 in ft 0.305 m m 3.28 ft mi 1.61 km km 0.621 mi lb 0.4536 kg kg 2.205 lb liq qt-US 0.945 L L 1.057 liq qt-US ft² 0.093 m² m² 10.764 ft² mi² 2.59 km² km² 0.386 mi² ft³ 0.028 m³ m³ 35.31 ft³ d/m 0.450 pCi pCi 2.22 d/m pCi 10¯⁶ µCi µCi 10⁶ pCi pCi/L (water) 10¯⁹ µCi/mL (water) µCi/mL (water) 10⁹ pCi/L (water) pCi/m³ (air) 10¯¹² µCi/mL (air) µCi/mL (air) 10¹² pCi/m³ (air)

Savannah River Site - Aiken, South Carolina