saturation monitoring with the rst reservoir...
TRANSCRIPT

January 1994
Saturation Monitoring With theRST Reservoir Saturation Tool
Bob AdolphChristian StollerHouston, Texas, USA
Jerry BradyARCO Alaska, Inc.Anchorage, Alaska, USA
Charles FlaumMontrouge, France
Chuck MelcherBrad RoscoeRidgefield, Connecticut, USA
Amal VittachiDeWayne SchnorrAnchorage, Alaska
For help in preparation of this article, thanks to DarwinEllis and Jeff Schweitzer, Schlumberger-Doll Research,Ridgefield, Connecticut, USA; and Mohamed Watfa, AbuDhabi, U.A.E.In this article, ELAN (Elemental Log Analysis), CNL(Compensated Neutron Log), Gradiomanometer, RST(Reservoir Saturation Tool), GST (Induced Gamma RaySpectrometry Tool), Dual-Burst and TDT (Thermal DecayTime) are marks of Schlumberger. Macintosh is a mark ofApple Computer, Inc. VAX is a mark of Digital Equip-ment Corporation.1. Steinman DK, Adolph RA, Mahdavi M, Marienbach E,
Preeg WE and Wraight PD: “Dual-Burst ThermalDecay Time Logging Principles,” paper SPE 15437,presented at the 61st SPE Annual Technical Confer-ence and Exhibition, New Orleans, Louisiana, USA,October 5-8, 1986.
2. Woodhouse R and Kerr SA: “The Evaluation of OilSaturation Through Casing Using Carbon-OxygenLogs,” paper SPE 17610, presented at the SPE Interna-tional Meeting on Petroleum Engineering, Tianjin,China, November 1-4, 1988.
The RST Reservoir Saturation Tool combines the logging capabilities of tra-
ditional methods for evaluating saturation in a tool slim enough to pass
through tubing. Now saturation measurements can be made without killing
the well to pull tubing and regardless of the well’s salinity.
Determining hydrocarbon and water satura-tions behind casing plays a major role inreservoir management. Saturation measure-ments over time are useful for tracking reser-voir depletion, planning workover andenhanced recovery strategies, and diagnos-ing production problems such as waterinflux and injection water breakthrough.
Traditional methods of evaluating satura-tion—thermal decay time logging1 and car-bon/oxygen (C/O) logging2—are limited tohigh-salinity and nontubing wells, respec-tively. The RST Reservoir Saturation Toolovercomes these limitations by combiningboth methods in a tool slim enough to fitthrough tubing.3 The RST tool eliminatesthe need for killing the well and pulling tub-ing. This saves money, avoids reinvasion ofperforated intervals, and allows the well tobe observed under operating conditions(next page). Moreover, it provides a log ofthe borehole oil fraction, or oil holdup,even in horizontal wells. To understand theoperation and versatility of the RST toolrequires an overview of existing saturationmeasurements and their physics.4
3. Audah T and Chardac J-L: “Reservoir Fluid MonitoringUsing Through-Tubing Carbon/Oxygen Tools,” Trans-actions of the SPWLA 34th Annual Logging Sympo-sium, Calgary, Alberta, Canada, June 13-16, 1993,paper LL.Stoller C, Scott HD, Plasek RE, Lucas AJ and AdolphRA: “Field Tests of a Slim Carbon/Oxygen Tool forReservoir Saturation Monitoring,” paper SPE 25375,presented at the SPE Asia Pacific Oil and Gas Confer-ence and Exhibition, Singapore, February 8-10, 1993. Scott HD, Stoller C, Roscoe BA, Plasek RE and AdolphRA: “A New Compensated Through-TubingCarbon/Oxygen Tool for Use in Flowing Wells,”Transactions of the SPWLA 32nd Annual LoggingSymposium, Midland, Texas, USA, June 16-19, 1991,paper MM.
The Saturation BluesIn a newly drilled well, openhole resistivitylogs are used to determine water and hydro-carbon saturations. But once the hole iscased, saturation monitoring has to rely ontools such as the TDT Dual-Burst ThermalDecay Time tool or, for C/O logging, theGST Induced Gamma Ray SpectrometryTool, which can “see” through casing.
The Dual-Burst TDT tool looks at the rateof thermal neutron absorption, described bythe capture cross section Σ of the formation,to infer water saturation (terms in bold areexplained in “Gamma Ray Spectrometry ata Glance,” page 38). A high absorption rateindicates saline water, which contains chlo-rine, a very efficient, abundant thermal-neu-tron absorber. A low absorption rate indi-cates fresh water or hydrocarbon.
The TDT technique provides good satura-tion measurements when formation watersalinity is high, constant and known. But oilproduction from an increasing number ofreservoirs is now maintained by water injec-tion. This reduces or alters formation watersalinity, posing a problem for the TDT tool.
29
Roscoe BA, Stoller C, Adolph RA, Boutemy Y, Cheese-borough JC III, Hall JS, McKeon DC, Pittman D, See-man B and Thomas SR: “A New Through-Tubing Oil-Saturation Measurement System,” paper SPE 21413,presented at the SPE Middle East Oil Show, Bahrain,November 16-19, 1991.
4. For more on nuclear logging:Ellis DV: Well Logging for Earth Scientists. New York,New York, USA: Elsevier, 1987.Tittman J: Geophysical Well Logging. Orlando,Florida, USA: Academic Press, Inc., 1986.Ellis D, Grau J, Schweitzer J and Hertzog R: “Basics ofNuclear Logging,” Oilfield Review 35, no. 3 (July1987): 4-10.

Dep
th, f
t
X700
X800
X900
0 1.0 0.1 0.6 -20 120 100 0Flowing Flowing
Borehole Oil Holdup Flowing
Sw Flowing
Shut-In Shut-InBorehole Oil
Holdup Shut-InSw
Shut-In
Dolomite
Limestone
Oil
Water
Volumetric Analysis
Near Carbon/Oxygen Ratio
Far Carbon/Oxygen Ratio
nComparing RST logs run in the same Middle East well during shut-in (red) and flowing(blue) conditions. Production is from a vertical, 6-in. diameter, openhole completion.
Tracks 1 and 2 show the carbon/oxygen logging ratio curves for both the near andfar detectors. Tracks 3 and 4 show the RST interpretation (borehole oil holdup andwater saturation logs). Track 5 is the volumetric analysis.
Both the near and far C/O ratios show a sharp increase at X848 ft, indicating an oil-water interface in the borehole. Above 850 ft, the C/O ratios from both detectorsincrease steadily, showing the depths at which the oil is produced.
The borehole oil holdup during flowing indicates that most of the oil is produced fromthe interval X728 to X750. The water saturation curves separate from X770 to X850 ft,indicating that oil from the borehole reinvaded the formation while the well was shut-in. After the shut-in period, when the well flowed, the formation water flushed out theoil, as shown by the increased water saturation and verified by the flowing borehole oilholdup. The volumetric analysis from openhole ELAN Elemental Log Analysis interpre-tation indicates substantial oil saturation in the upper half of the reservoir.
30
In low-salinity water (less than 35,000 partsper million), the tool cannot accurately dif-ferentiate between oil and water, whichhave similar neutron capture cross sections.
When the salinity of the formation wateris too low or unknown, C/O logging can beused. C/O logging measures gamma raysemitted from inelastic neutron scattering todetermine relative concentrations of carbonand oxygen in the formation. A high C/Oratio indicates oil-bearing formations; a lowC/O ratio indicates water- or gas-bearingformations (next page, top).
The major drawback to C/O logging toolshas been their large diameters. Producingwells must be killed and production tubingremoved to accommodate tools with diame-ters of nearly 4 in. [10 cm]. In addition, thetools have slow logging speeds and aremore sensitive to borehole fluid than forma-tion fluid, which affects the precision of thesaturation measurement.
As Easy as RSTThe RST tool directly addresses these short-comings and can perform either C/O orTDT logging (see “Logging the RST Tool inPrudhoe Bay,” page 32). It comes in twodiameters—111/16 in. (RST-A) and 21/2 in.(RST-B)—and can be combined with otherproduction logging tools (next page,bottom). The RST-A tool logs up to fourtimes faster than the GST tool. The RST-Btool—the only C/O tool that can log flowingwells—makes passes at speeds comparableto the GST tool.
Both versions have two gamma ray detec-tors. In the RST-A tool, both detectors are onthe tool axis, separated by neutron andgamma ray shielding. In the RST-B tool, thedetectors are offset from the tool axis andshielded to enhance the near detector’sborehole sensitivity and the far detector’sformation sensitivity. This allows the forma-tion oil saturation and borehole oil holdupto be derived from the same RST-B C/Omeasurement. Because of size constraints,such detector shielding is not possible withthe RST-A tool. An independent determi-nation of borehole fluid holdup is thenneeded, for example from the Gradioma-nometer tool run on the same logging suiteor by logging shut-in.
For both tools, the detector crystal iscerium-doped gadolinium oxyorthosilicate(GSO), one of a new generation of scintilla-tion crystals that outperforms the sodium-
(continued on page 34)
Oilfield Review

nCombining the diagnostic capabilities of C/O logging and TDT logging with theRST-B tool in a Middle East observationwell. From left to right: Track 1 showsopenhole fluid analysis. Track 2 showsC/O logs from the near and far detectorsand oil holdup. Track 3 shows the fluidanalysis based on C/O logging. Track 4shows the log of Σ. Track 5 shows a com-bined C/O and Σ fluid analysis.
The observation well contained water inthe borehole over the entire interval, sothe oil holdup value was set to 0. The C/Ofluid analysis, used to distinguish betweenoil and water, shows only a small oildepletion from X190 ft to X250 ft and alarge oil depletion from X140 ft to X170 ft.By itself, however, C/O logging cannotdifferentiate between injection and con-nate water. To accomplish this, a log of Σis used in conjunction with the C/O logs.The Σ log can differentiate between oiland salt water but not oil and fresh water.The revised interpretation indicates for-mation water from X170 to X210 ft and awater injection breakthrough from X140 toX170 ft. Interpretation based on Σ alonewould have identified the water injectionbreakthrough as oil.
nThe dual-detector RST-A and RST-B tools.
p.u. % p.u. c.u. p.u.
Ratio
Pore Volume Borehole Oil Holdup
C/O Far
C/O Near
Movable Oil
Residual Oil
Open Hole Carbon/Oxygen Carbon/Oxygen and ∑
Pore Volume Pore Volume
Connate Water
Mixed Water
Remaining Oil
∑ From RST
Remaining Oil
Connate Water
Injection WaterRatio
Dep
th, f
t
X150
0
X200
X250
50
0 0.5
050 1030 050-20 120aaaaaaaaaaaaaaaaaaaaaaaaaaaaaaaaaaaaaaaaaaaaaaaaaaaaaaaaaaaaaaaaaaaaaaaaaaaaaaaaaaaaaaaaaaaaaaaaaaaaaaElectronics
Photomultipliertube
GSO detector(far)
Shielding
GSO detector(near)
Neutrongenerator
Electronics
Photomultipliertube
111/16 in. 21/2 in.RST-A Sonde RST-B Sonde
Top View
Side View
Far
Near
31January 1994

Logging the RST Tool in Prudhoe Bay
Borehole Oil Holdup Flowing
Gamma Ray
Connate Water
Injection Water and Gas
Gas
OilD
epth
, ft
0 100
50 0
40 0
Per
fsP
erfs
p.u.
GAPI p.u.X1000
X1100
X1200
GOC
Porosity
OWC
Prudhoe Bay, the largest oil field in North Amer-
ica, contained 20 billion stock tank barrels when
it was discovered in 1968.1 Most of the hydrocar-
bons are in the Ivishak Sandstone. The main
recovery methods used in Prudhoe Bay are grav-
ity drainage, gas injection, aquifer influx, water-
flooding and miscible gas flooding. Over time,
the expansion of gas above and water below the
oil column has produced mobile oil lenses that
are elusive to tap. The salinity of injected water
is low, creating conditions suited to C/O logging
with the RST tool.2
As the Prudhoe Bay field matures, increasing
gas and water production is exceeding the capac-
ity of surface handling facilities, thus limiting oil
production. No pipeline exists for the gas, so it
must be reinjected. Wells with declining oil pro-
duction and increasing gas and water production
are typically worked over or produced intermit-
tently. Extending the life and economic viability
of these marginal wells relies on reducing gas
and water production and maximizing oil produc-
tion by producing bypassed oil zones.
RST data were used to reduce water cut in a
BP well with a 250-ft [76-m] oil-bearing sand-
stone interval (right). Openhole logs from 1983
(not shown) marked the original oil-water contact
1. Shirzadi SG and Lawal AS: “Multidisciplinary Approach for Tar-geting New Wells in the Prudhoe Bay Field,” paper SPE 26093,presented at the SPE Western Regional Meeting, Anchorage,Alaska, USA, May 26-28, 1993.
2. Vittachi A and Schnorr D: “Reservoir Oil Saturation MonitoringThrough Casing With New Carbon/Oxygen Measurements,”Transactions of the SPWLA 34th Annual Logging Symposium,Calgary, Alberta, Canada, June 13-16, 1993, paper HHH. Dupree JH and Cunningham AB: “The Application ofCarbon/Oxygen Logging Technology to the Ivishak Sandstone,Prudhoe Bay, Alaska,” paper SPE 19615, presented at the 64thSPE Annual Technical Conference and Exhibition, San Antonio,Texas, USA, October 8-11, 1989.
32
nReducing water cut. The left track shows the gammaray and borehole oil holdup logs measured with the wellproducing. The borehole oil holdup curve shows no oilproduction below 1170 ft.
The right track is an ELAN Elemental Log Analysisoutput based on openhole and RST fluid data. It indi-cates oil depletion below 1170 ft. After the lower perfo-rated interval was plugged, production increased from220 BOPD oil with 94% water cut to 300 BOPD oil withnegligible water cut.
(OWC) at X1250 ft and the original gas-oil contact
(GOC) at X1050 ft.
By 1992, production rates fell, indicating
severe reservoir depletion. The well was produc-
ing 3750 B/D of fluids with a 94% water cut. Pro-
duction was 220 BOPD and the gas/oil ratio
(GOR) was 1115 ft3 of gas per barrel of oil. The
RST tool was run to evaluate hydrocarbon distri-
bution and locate fluid contacts.
C/O data measured with the well flowing were
combined with CNL Compensated Neutron Log
data as input to the ELAN Elemental Log Analysis
program (right track). The resulting fluid analysis
confirmed oil depletion over both perforated
intervals and identified the current GOC at X1110
ft. The borehole oil holdup log showed oil pro-
duction from perforations above X1170 ft and was
used to identify the present OWC at that depth.
The lower perforations were not producing any
oil. After these were plugged, the well produced
300 BOPD of oil with negligible water cut.
Locating Bypassed Oil
In early 1992, ARCO drilled and perforated a
sidetrack well in an area of Prudhoe Bay under-
going waterflooding. Less than six months later,
production was 90% water with less than 200
BOPD, as expected. The original perforations
extended from X415 to X440 ft (next page). C/O
logging measurements were made In the shut-in
well with three different tools—the RST tool and
two sondes from other service companies.
The RST results confirmed depletion over the
perforated interval (Tracks 2 and 3). Effects of the
miscible gas flood sweep are apparent through-
out the reservoir. The total inelastic count rate
ratio of the near and far detectors indicates quali-
tatively the presence of gas in the reservoir. In
Oilfield Review

addition, differences between the openhole fluid
analysis and the RST fluid analysis were
assumed to be gas.
One potential bypassed zone, A, was identified
from X280 to X290 ft. A second zone, B, based on
the openhole logs and a C/O log from another ser-
vice company, was proposed from X220 to X230
ft. The RST log shows Zone B to contain more gas
and water than Zone A.
After assessing the openhole logs and the
three C/O logs, ARCO decided to perforate Zone
B. The initial production was 1000 BOPD with a
75% water cut. Production declined to 200 BOPD
with more than 95% water cut in a matter of
weeks. The decline prompted ARCO to perforate
Zone A, commingling production from earlier per-
forations. Production increased to an average of
600 BOPD and the water cut decreased to 90%.
Subsequent production logs confirm that Zone A
is producing oil and gas and Zone B is producing
all of the water with some oil.
33January 1994
nFinding bypassed oilzones. ARCO ran threeC/O logging tools with thewell shut-in over the sameinterval in search ofbypassed oil. Track 1includes the gamma ray,count-rate ratio betweennear and far detectors(CRRA) and the boreholeoil holdup curves. Track 2shows the RST oil satura-tion and gas saturationcurves. Track 3 shows theRST fluid analysis. Track 4is openhole log data.
The RST data identifiedZone A as the best zonefor perforating. Interpreta-tion based on logs from anon-RST C/O logging toolidentified Zone B for per-foration, which the RSTdata show to be mostlywater. Zone B was perfo-rated first, producing 200BOPD with more than95% water cut in a matterof weeks as a result ofwater coning into the per-foration. When Zone Awas perforated, oil pro-duction increased to anaverage of 600 BOPD witha reduced water cut of90%. All water productionwas identified as fromZone B.
Per
fs
GasSaturation
OilSaturation
CRRA
Gamma Ray
Connate Water
Gas
Oil
Porosity
OpenholeData
Sand
Bound Water
Shale
Lithology
4.0 2.6
0 150GAPI0 1 40 0 0 10p.u.
Dep
th, f
t
X100
X200
X300
X400
B
A
GOC
iodide [NaI] crystal conventionally used forgamma ray detection (see “New Scintilla-tion Detectors,” page 35). Several propertiesof GSO allow for a smaller diameter detec-tor crystal than if NaI were used, and hencea smaller diameter tool.
Modes of OperationFlexibility is a key advantage of the RSTtool. It operates in three modes that can bechanged in real time while logging:
•inelastic-capture mode•capture-sigma mode•sigma mode.
Inelastic-capture mode: The inelastic-cap-ture mode offers C/O measurements fordetermining saturations when the formationwater salinity is unknown, varying or toolow for TDT logging. In addition to C/O log-ging, thermal neutron capture gamma-rayspectra are recorded after the neutron burst.Elemental yields from these spectra providelithology, porosity and apparent water salin-ity information.
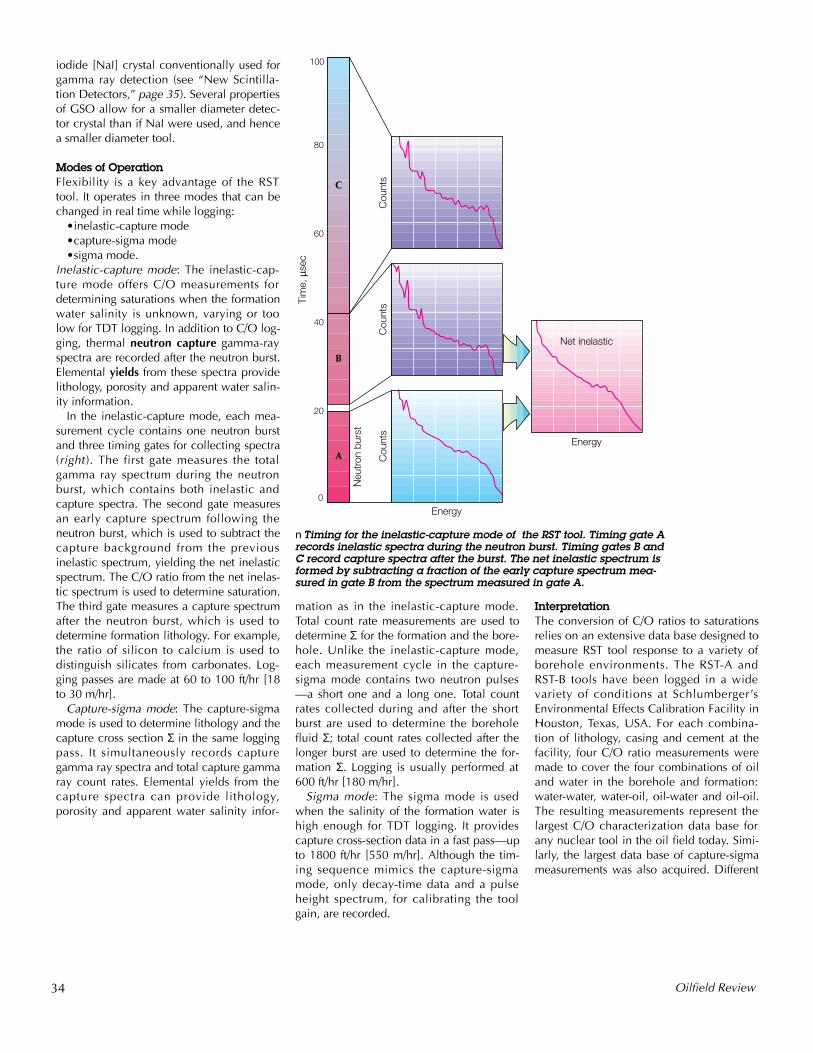
In the inelastic-capture mode, each mea-surement cycle contains one neutron burstand three timing gates for collecting spectra(right ). The first gate measures the totalgamma ray spectrum during the neutronburst, which contains both inelastic andcapture spectra. The second gate measuresan early capture spectrum following theneutron burst, which is used to subtract thecapture background from the previousinelastic spectrum, yielding the net inelasticspectrum. The C/O ratio from the net inelas-tic spectrum is used to determine saturation.The third gate measures a capture spectrumafter the neutron burst, which is used todetermine formation lithology. For example,the ratio of silicon to calcium is used todistinguish silicates from carbonates. Log-ging passes are made at 60 to 100 ft/hr [18to 30 m/hr].
Capture-sigma mode: The capture-sigmamode is used to determine lithology and thecapture cross section Σ in the same loggingpass. It simultaneously records capturegamma ray spectra and total capture gammaray count rates. Elemental yields from thecapture spectra can provide lithology,porosity and apparent water salinity infor-
mation as in the inelastic-capture mode.Total count rate measurements are used todetermine Σ for the formation and the bore-hole. Unlike the inelastic-capture mode,each measurement cycle in the capture-sigma mode contains two neutron pulses—a short one and a long one. Total countrates collected during and after the shortburst are used to determine the boreholefluid Σ; total count rates collected after thelonger burst are used to determine the for-mation Σ. Logging is usually performed at600 ft/hr [180 m/hr].
Sigma mode: The sigma mode is usedwhen the salinity of the formation water ishigh enough for TDT logging. It providescapture cross-section data in a fast pass—upto 1800 ft/hr [550 m/hr]. Although the tim-ing sequence mimics the capture-sigmamode, only decay-time data and a pulseheight spectrum, for calibrating the toolgain, are recorded.
InterpretationThe conversion of C/O ratios to saturationsrelies on an extensive data base designed tomeasure RST tool response to a variety ofborehole environments. The RST-A andRST-B tools have been logged in a widevariety of conditions at Schlumberger’sEnvironmental Effects Calibration Facility inHouston, Texas, USA. For each combina-tion of lithology, casing and cement at thefacility, four C/O ratio measurements weremade to cover the four combinations of oiland water in the borehole and formation:water-water, water-oil, oil-water and oil-oil.The resulting measurements represent thelargest C/O characterization data base forany nuclear tool in the oil field today. Simi-larly, the largest data base of capture-sigmameasurements was also acquired. Different
34 Oilfield Review
Cou
nts
Cou
nts
Cou
nts
Energy
Energy
Net inelastic
Tim
e, µ
sec
100
80
60
40
20
0
Neu
tron
bur
st
C
B
A
nTiming for the inelastic-capture mode of the RST tool. Timing gate Arecords inelastic spectra during the neutron burst. Timing gates B andC record capture spectra after the burst. The net inelastic spectrum isformed by subtracting a fraction of the early capture spectrum mea-sured in gate B from the spectrum measured in gate A.

What Makes a Great Crystal?
Scintillation detectors are so named because
they generate flashes of light when struck by
gamma rays (for details on how scintillator crys-
tals work, see “Gamma Ray Spectrometry at a
Glance,” page 38).1 Most of the properties that
make a crystal desirable for logging are those
that maximize the intensity of these flashes and
the number of counts.2 In addition, crystals
should be rugged, not cracking on impact, and
unaffected by moisture.
A crystal of high density and high atomic num-
ber provides more opportunity for interaction with
incident gamma rays, maximizing count rates.
Crystal volume also affects performance. A big-
ger crystal intercepts more gamma rays, thereby
increasing count rates. It also decreases the
probability that a gamma ray will escape the
crystal after one or two scatterings.
A high light-flash intensity produces large volt-
ages that are easily measured, improving energy
resolution, and makes the detector more sensi-
tive to low-energy gamma rays. If at all possible,
the light-flash intensity and duration should be
relatively unaffected by temperature change. This
eliminates the need for temperature control hard-
ware downhole.
C/O logging and thermal decay time logging
expose the crystal to high instantaneous gamma
ray fluxes during or immediately after the neutron
burst. The light flashes must have a short enough
duration to avoid “piling up” on one another,
which produces false pulse amplitudes and
counting rates.
Once a light flash has been generated, the
goal is to get as much light as possible to the
photomultiplier tube (PMT). To prevent internal
absorption of light, the crystal should be trans-
parent to the light it generates. Because light
generated by the crystal must eventually pass
through the window of the photomultiplier tube,
the index of refraction of the crystal and window
should be similar to maximize light transmission.
The photocathode of the PMT must be highly
responsive to the wavelength of the crystal
light to maximize the number of photoelectrons
it ejects.
The New Detectors
For nearly 45 years, thallium-doped sodium
iodide (NaI) has been the gamma ray detector of
choice for nuclear logging. It is widely used to
determine formation density and chemical com-
position, salinity through casing, and mineralogy.
NaI excels in intensity of light flash and tempera-
ture stability. Although new crystals literally do
not outshine NaI, they do bring increased detec-
tion efficiency, greater ruggedness, reduced sen-
sitivity to humidity, and the ability to handle
much higher counting rates without pileup (see
“Comparison of Scintillation Crystals,” above).
Bismuth germanate (BGO) was first manufac-
tured commercially in the early 1970s, providing
higher counting rates than NaI that result in bet-
35January 1994
Running the RST tool through tubing would not be possible without a scintillation crystal called cerium-doped
gadolinium oxyorthosilicate (GSO), one of several new crystals finding its way to the oil patch. Developing
these crystals for borehole detectors requires coupling a knowledge of nuclear physics with sophisticated
crystal-growing techniques.
New Scintillation Detectors
1. For a discussion of scintillation spectrometry:Knoll GF: Radiation Detection and Measurement. New York,New York, USA: John Wiley and Sons, 1989.Birks JB and Fry D: The Theory and Practice of ScintillationCounting. London, England: Pergamon Press, 1964.
2. Melcher CL, Schweitzer JS, Manente RA and Peterson CA:“Applications of Single Crystals in Oil Well Logging,” Journal ofCrystal Growth 109 (1991): 37-42.
Comparison of Scintillation CrystalsCrystal Density
g/cm3
3.67 51 1.85 100 6.5 230 No No No
Yes
No
Depends onapplication
Yes
Yes
Yes
Yes
No
Yes
300
56 and 600
40
9.3
8.0
10
15
20
75
2.15
1.85
1.82
75
59
66
7.13
6.71
7.40
Effective Atomic Number Z
RefractiveIndex
RelativeLight FlashIntensity
EnergyResolution@662keV1, %
Light FlashDecay Time2
ns
Rugged Unaffected By Moisture
DewarSystemRequired
NaI(Tl)
BGO
GSO
LSO
1. Energy resolution refers to the commonly used relative “full width at half maximum” for the 137Cesium gamma ray peak at 662 keV.Sharply defined spectral peaks indicate good energy resolution.
2. Decay time is the time constant for the exponential decay of the light flash. Faster decay times are preferred.

ter precision (right). Its use in the Hostile Natural
Gamma Ray Sonde (HNGS) offers the choice of
faster logging or improved statistical precision in
estimates of thorium, uranium and potassium.
BGO’s high detection efficiency is also used in a
33/8-in. neutron-induced spectrometry tool.3 In
general, higher count rates and improved spec-
tral peak-to-Compton ratios more than compen-
sate for the main limitation of BGO, low intrinsic
resolution. GSO and BGO crystals generally give
better precision than similarly sized NaI crystals
in estimating element concentrations from neu-
tron-induced capture gamma ray spectra. The
poor temperature response of BGO, however,
requires the use of a Dewar flask. BGO can also
experience pileup problems.
The RST tool is the first commercial logging
tool to use the GSO crystal, which was developed
by the Hitachi Chemical Co., Ltd. in the early
1980s.4 The high density and high atomic number
of GSO make for a smaller diameter detector than
NaI, and hence a smaller diameter tool (top).5
The high density also improves the crystal’s
ability to detect gamma rays, particularly high-
energy ones.
GSO has a detection efficiency nearly as high
as BGO’s but can operate at higher temperatures
without a bulky Dewar flask. It produces signifi-
cantly less pulse pileup during the neutron burst.
Because the light output from GSO is lower than
for NaI, the RST tool employs a newly designed,
sensitive PMT.
A new member of the scintillation detector
family was developed two year ago by scientists
at Schlumberger-Doll Research, Ridgefield, Con-
necticut, USA. They found that cerium-doped
lutetium oxyorthosilicate (LSO), a cousin of GSO,
promises to be the best scintillator for many
applications.6 Although still in development, this
scintillator combines high counting efficiency
with a light-flash intensity nearly that of NaI and
five times that of BGO. It is unaffected by mois-
ture, is rugged and can handle higher counting
rates free of pileup than other scintillators under
consideration for borehole use. The light gener-
ated by an LSO crystal, similar in wavelength
to that of NaI, works well with existing photo-
cathode materials.
Competing crystals are breaking the near
monopoly held by NaI for over four decades,
though the price is high. The pair of GSO scintil-
lators in the RST tool costs about $10,000 at pre-
sent. But an expanding market is likely to result
in improved production methods and reduced
prices. These new scintillators are sure to make
further inroads on NaI’s territory. Crystal research
and development are continuing and new crystals
with special properties may be added to this
expanding list of exotic detectors.—JT, TAL
combinations of formation and boreholesalinities were used to generate over 1000 Σmeasurements for each tool.
The C/O data base is used to calibrate theC/O ratio (COR) model to a particular log-ging environment. The COR model relatesmeasured C/O ratios to the porosity, oil sat-uration, lithology, oil density, oil holdup,borehole diameter and casing weight anddiameter. Once calibrated, the model isinverted to solve for fluid volumes,5 andthese values are further refined using alphaprocessing, described below. The oil vol-umes are then converted to saturations.
Alpha Processing: Windows Versus YieldsSchlumberger’s traditional approach to pro-cessing C/O logging data, the C/Oyieldsapproach, is to determine the carbon andoxygen yields from the measured inelasticspectrum, and then use their ratio to deter-mine oil volume, then saturation. TheC/Oyields approach provides good accuracybut reduced precision.6 Advantages of thismethod are ease of use and interpretation.
Because the contribution of carbon to thetotal spectrum is relatively small, however,good statistics require long measurementtimes or slow logging speeds. To shortenmeasurement times without sacrificing pre-cision, a “windows” approach has beenadopted. Windows are sections of the spec-trum most influenced by changes in carbonand oxygen and least influenced bychanges in other elements (next page, left).The ratio of the gamma ray counts from the“carbon window” to counts in the ”oxygenwindow” is then used to determine a moreprecise saturation.
The C/Owindows approach provides goodprecision but poor accuracy. It improves thestatistics of the measurements because thetotal counts in the windows are high. Butinterpretation is more difficult. For example,in a clean, water-bearing sand and a water-filled borehole, the C/Oyields ratio would bezero, whereas the C/Owindows ratio is non-zero. The ratio produced by the windowsmethod must be calibrated with ratios mea-
36 Oilfield Review
3. Jacobson LA, Beals R, Wyatt, DF Jr and Hrametz A: “ResponseCharacterization of an Induced Gamma Spectrometry ToolUsing a Bismuth Germanate Scintillator,” Transactions of theSPWLA 32nd Annual Logging Symposium,Midland, Texas,USA, June 16-19, 1991, paper LL.
4. Takagi K and Fukazawa T: “Cerium-activated GD2SiO5 SingleCrystal Scintillator,” Applied Physics Letters 42 (1983): 43-45.
5. Melcher CL, Schweitzer JS, Utsu R and Akiyama S: “ScintillationProperties of GSO,” IEEE Transactions of Nuclear Science 37,no. 2 (April 1990): 161-164.
6. Melcher CL and Schweitzer JS: “A Promising New Scintillator:Cerium-Doped Lutetium Oxyorthosilicate,” Nuclear Instrumentsand Methods in Physics Research A 314 (1992): 212-214.
nQuantifying BGO’s statistical advantage.Uncertainties for thorium (Th), uranium(U) and potassium (K) outputs are pre-sented for 1-sec accumulations in a stan-dard shale. Standard deviations of Th, Uand K concentration estimates drop by 30to 40 % when a BGO detector is usedinstead of a NaI detector.
nComparison of aGSO crystal used inthe RST tool andthe larger NaI crys-tal used in the GSTtool. GSO’s higherdensity and higheratomic numberallow it to functionin the small diame-ter RST tool.
BGO vs. NaI
BGO NaIUncertainties
Th
U
K
2.82 ppm
1.51 ppm
0.51%
4.63 ppm
2.61 ppm
0.74%
Th = 12 ppm, U = 6 ppm, K = 2%

sured under known conditions. Ideally, thewindows-based C/O tool would be loggedfirst in a known water-bearing zone to deter-mine a zero carbon value, then logged in azone of known oil saturation to obtain asecond calibration point.
Alpha processing for the RST tool com-bines the accuracy of the yields ratio with theprecision of the windows ratio to obtain satu-ration results in the minimum time. It calcu-lates the volume of oil (the product of poros-ity and oil saturation) from the C/Owindowsmethod—the windows oil volume, and thevolume of oil from the C/Oyields method—theyields oil volume. The difference betweenthese volumes is tracked and used to adjustthe windows oil volume. Alpha processing isapplied over a specified number of levels,known as the alpha filter length.
Planning the RST JobWith nuclear tools like the RST tool, carefuljob planning can significantly affect the pre-cision—and the cost—of the final answer.To facilitate planning an RST job, a softwareprogram called RST Job Planner is used todetermine the logging speed and number ofpasses needed to produce results accordingto clients’ specifications. Versions of RST JobPlanner can run on VAX computers at thefield logging interpretation center (FLIC) oron a Macintosh computer. The Macintoshversion is available to clients.
RST Job Planner requires a variety of inputparameters, including tool type, lithology,porosity, oil gravity (referred to as carbondensity value—CDV), casing size andweight, borehole diameter, number of levelsfor alpha processing and number of levels ofvertical averaging. In addition, clients spec-ify the precision, or standard deviation ofthe answer, in terms of a percent saturation.
The output consists of station times andlogging speeds in a table showing two levelsof confidence,7 68% and 95% (above). Thisallows the client to weigh precision needsagainst logging costs. Higher precisionrequires slower logging speeds. The fastestlogging option, however, may not always bethe most cost-effective for the client. Whilethe RST-B tool typically logs at less than halfthe rate of the RST-A, it can minimize thetime a well is off-line and avoid problemsassociated with reinvasion from shut-in.
Future of the RST ToolWith the RST tool’s accuracy, precision andversatility for saturation monitoringunmatched in the oil field, applications forthe tool continue to grow. The RST tool hasrecently provided holdup measurements inhorizontal and through-tubing wells. Aporosity measurement determined from aratio of the count rates in the near and fardetectors will soon be added to the sigmamode. Software is being developed that willconvert between RST and TDT logs,enhancing the value of RST logs in Σ-moni-toring programs. In addition, the RST tool’sresponse to gas is being studied. Theseongoing projects, plus experimental use ofthe RST tool in uncharacterized environ-ments by innovative field engineers andclients, promise an exciting future for thisnewest saturation monitoring device. —TAL
37January 1994
nInelastic spectra measured with thefar detector of the RST tool in an oiland water tank. Shaded areas indicatethe carbon and oxygen windows usedto improve measurement statistics.
nThe RST Job Planner software for planning RST jobs on the Macintosh. The field engi-neer or client specifies the many input parameters, including RST tool type, lithology,saturation precision and alpha processing level, to calculate corresponding loggingspeeds with the RST tool. CDV stands for oil gravity. Logging speeds are reported fortwo levels of confidence, 68% and 95%. The use of alpha processing increases loggingspeeds by improving measurement statistics.
5. Oil volume is the volume of formation taken up by oil.It can be expressed as porosity times oil saturation.
6. Accuracy refers to how close the mean value of ameasurement is to the true value. Consider aspeedometer that always registers 10 miles per hour(mph). It is inaccurate when the car is traveling 60mph but accurate when the car travels 10 mph. Precision refers to the spread of individual measure-ments from the mean. A precise system producesresults with very little spread. The broken speedometeris very precise, since it always gives the same mea-surement of 10 mph.
7. A precision of ± one standard deviation correspondsto 68% confidence; ± two standard deviations corre-spond to 95% confidence and ± three standard devia-tions correspond to 99.9% confidence.
Cou
nts
0 2 4 6 8
Energy, MeV
Carbon Oxygen
Oxygen
Carbon

38
The interactions and measurements associated with gamma ray spectrometry may be confusing to nonexperts in nuclear logging.
Simply put, gamma ray spectrometry measures gamma rays (counts) in time and gamma ray energies. Some elements emit
gamma rays naturally; others can be bombarded with neutrons to induce gamma ray emissions. Each element produces
characteristic gamma rays of specific energies. Moreover, the number of characteristic gamma rays produced is proportional to
the abundance of the element. Naturally occurring and induced gamma rays may be counted and sorted according to energy.
This produces a gamma ray spectrum that can be processed, or decoded, to identify the elements and their concentrations.
Gamma Ray Spectrometry at a Glance
The starting point for induced gamma ray
spectrometry is the generation of neutrons. Like
its predecessors, the RST tool uses a downhole
accelerator to emit pulses of high-energy
neutrons into the formation. This device creates
14-million electron volt (MeV) neutrons by
accelerating deuterium ions into a tritium target.
Ion source
Filament Magnet Target
Downhole Acceleratorn
1
The neutrons primarily interact with formation
nuclei in three ways:
In elastic neutron-scattering, the neutron
bounces off the bombarded nucleus without
exciting or destablizing it. With each elastic
interaction, the neutron loses energy. Hydrogen,
with the mass of its nucleus equal to that of a
neutron, is very good at slowing down neutrons.
Hence, how efficiently a formation slows down
neutrons generally indicates the abundance of
hydrogen. Because hydrogen is most abundant in
pore fluids, neutron slowdown indicates porosity.
Elastic Neutron Scattering
n
2
In inelastic neutron
scattering, the neutron
bounces off the nucleus,
but excites it into quickly
giving off what are
called inelastic gamma
rays. The measurement
of gamma ray energies
from inelastic neutron
scattering yields the
relative concentrations
of carbon and oxygen,
which are then used to
determine water
saturation.
Inelastic Neutron Scattering
n n
Inelastic gamma rays
3
In neutron absorption, the nucleus absorbs the neutron and becomes
excited, typically emitting capture gamma rays. Neutron absorption, or
neutron capture, is most common after a neutron has been slowed by
elastic and inelastic interactions to thermal energies of about 0.025 eV.
The measurement of capture gamma ray energies is used to estimate the
abundances of elements most likely to capture a neutron—silicon, calcium,
chlorine, hydrogen, sulfur, iron, titanium and gadolinium.
Neutron Absorption
n
Slowneutron
Excitednucleus
Capturegamma ray
4
Oilfield Review

A decrease in the production rate of capture
gamma rays over time, as measured with the
TDT tool, is proportional to the absorption rate of
thermal neutrons. This decay is basically
exponential and accounts for both the absorption
and diffusion of neutrons in the formation. The
slope of a semilog plot of gamma ray counts
versus time yields the capture cross section Σ of
the formation. Expressed in capture units, the
capture cross section expresses the probability
that a neutron passing through a cross-sectional
area of a material will be captured.
Cou
nts
Long burst
Time, µsec0 500 1000 1500
Short burst
5
A pulsed neutron source and “time-gated” detectors
solve the difficulty of distinguishing gamma rays of
nearly the same energy from two different interactions.
Inelastic gamma rays occur during the neutron pulse;
capture gamma rays occur later, after the neutrons have
been slowed down. A typical timing cycle takes
advantage of this by scheduling the first measurement
gate during the neutron pulse and subsequent
measurement gates at later times. Which interactions,
and hence, which elements contribute to the spectra,
depend largely on the sequence and duration of pulsed
neutron bursts and timing gates.
0 20 100Neutron
burst
Time, µsec Neutronburst
Inelastic InelasticEarlycapture
Latecapture
6
A gamma ray is detected when its interactions with the detector crystal create
electrons and holes that excite the crystal into generating flashes of light
(scintillations). The intensity of these scintillations is related to the energy of
the bombarding gamma ray. Most gamma rays lose some of their energy on
the way to the detector because they scatter randomly, create new particles
or disappear.
The light flashes pass through a window at one end of the crystal and
fall on the photocathode surface of a photomultiplier tube, liberating
electrons via the photoelectric effect. The tube amplifies the electronic
charges about 200,000 times and provides a current signal large enough to
be analyzed by downhole electronics.
Photomultiplier Tube
Gammaray
Scintillationmaterial
Photocathodesurface
Photoelectron
Window
Collector
7
39
As with any other nuclear logging tool, the gamma ray spectra collected by
the RST tool must be processed to identify the elements that contributed to
the spectra and their abundances. This is possible because each element
produces a characteristic set of gamma ray peaks.
A library of standard elemental spectra is used to determine the
individual elemental contributions. Each standard elemental spectrum
represents the response of a tool to a particular element. A computer
determines the linear combination of these elemental standards that best
fits the measured spectrum and calculates the elemental yields. A yield is
the fractional contribution of an element to the total observed spectrum,
after subtracting off the capture background. It is proportional to the
abundance of the element.
1 2 3 4 5 6 7 8
Energy, MeV
Cou
nts
OxygenSiliconTool backgroundCalciumIronCarbon
8