saturation in v-calib led scans calice ahcal – main meeting 2010/07/05 jaroslav zalesak analysis...
TRANSCRIPT
1
Saturation in V-calib LED scans
CALICE AHCAL – Main Meeting 2010/07/05Jaroslav Zalesak
• analysis still in progress but gives global results• FNAL & CERN Vcalib data• Temperature corrected results• Analysis improvement (fit ranges)• New data just being measured (W-AHCAL)
5.7.2010 CALICE - HCAL Jara Zalesak, DESY, Hamburg
Jara Zalesak, DESY, Hamburg 2
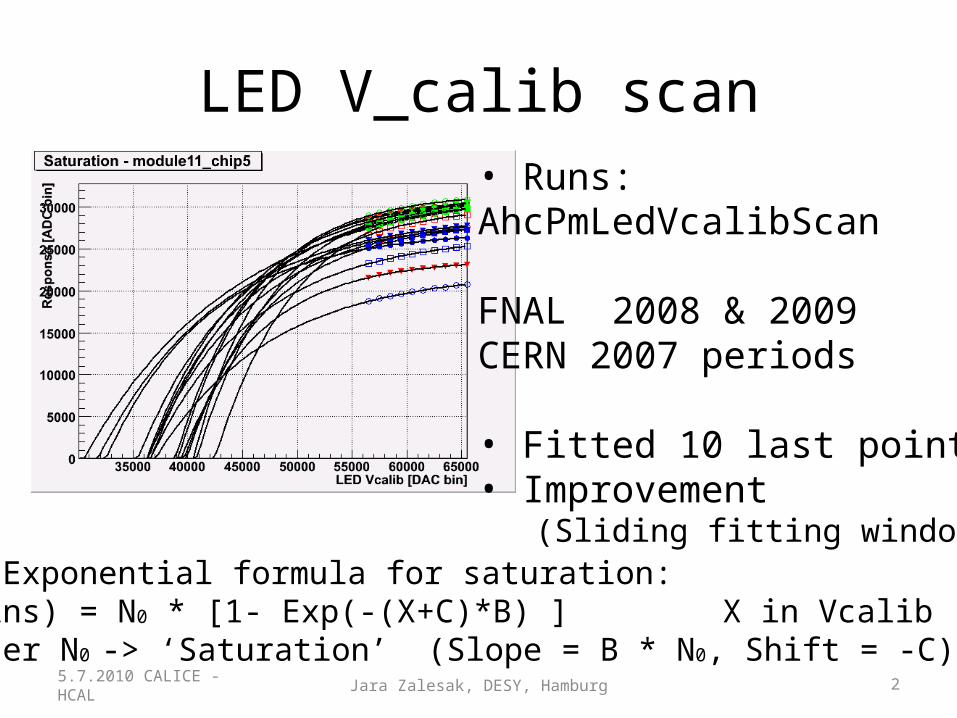
LED V_calib scan• Runs:AhcPmLedVcalibScan
FNAL 2008 & 2009CERN 2007 periods
• Fitted 10 last points• Improvement (Sliding fitting window)
• Simple Exponential formula for saturation:• F(ADCbins) = N0 * [1- Exp(-(X+C)*B) ] X in Vcalib (DAC) bins• Parameter N0 -> ‘Saturation’ (Slope = B * N0, Shift = -C)
5.7.2010 CALICE - HCAL
Jara Zalesak, DESY, Hamburg 3
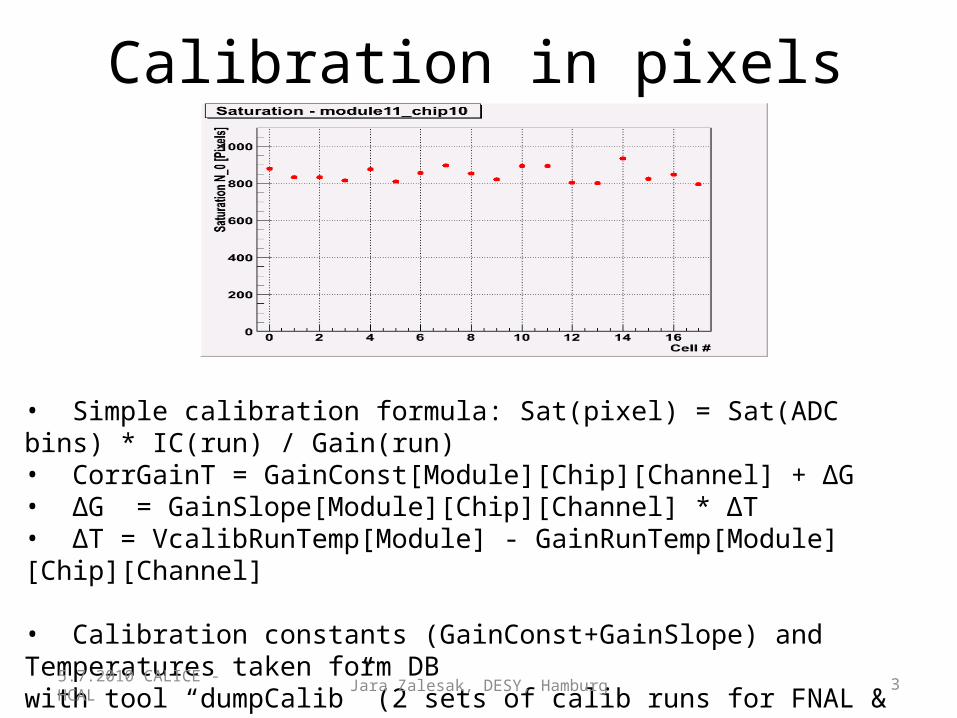
Calibration in pixels
• Simple calibration formula: Sat(pixel) = Sat(ADC bins) * IC(run) / Gain(run) • CorrGainT = GainConst[Module][Chip][Channel] + ΔG• ΔG = GainSlope[Module][Chip][Channel] * ΔT• ΔT = VcalibRunTemp[Module] - GainRunTemp[Module][Chip][Channel]
• Calibration constants (GainConst+GainSlope) and Temperatures taken form DB with tool “dumpCalib” (2 sets of calib runs for FNAL & CERN, resp.)
5.7.2010 CALICE - HCAL
Jara Zalesak, DESY, Hamburg 4
Procedure• Good runs: FNAL 144, CERN 66 (full Vcalib range)• Good events - curves:– Tags: graph, fit function, Chi2(Ndf !=0) available– Calibration constants, slopes & Temperatures exist in DB for ch.– No saturated curves: no ADC saturation + smooth increasing fce– Fit parameters lay in (wide) ranges: saturation, shift, slope, errors– At least one good fitted curve among run in the groups
FNAL: 6361 & CERN: 6211 channels (of tot. 7608)
• sample runs #500722 & #330710: 3783 & 3512 ch.
5.7.2010 CALICE - HCAL

Jara Zalesak, DESY, Hamburg 5
Performance & Stability
5.7.2010 CALICE - HCAL
144 fits (FNAL) for each channel
• for ‘good’ runssimilar behaviour
(variations in y-axis
scale factors)
• application of Cal &T to have unique curves

Jara Zalesak, DESY, Hamburg 6
Results I: ADCbins,Pixels,PixelsT…
5.7.2010 CALICE - HCAL
FNAL ADC bins FNAL Pixels
FNAL TempCorr PixelsTCERN TempCorr PixelsT

Jara Zalesak, DESY, Hamburg 75.7.2010 CALICE - HCAL
Results II: Temperature correction
Temperature corr
RMS = 0.7%RMS = 2.7%
Jara Zalesak, DESY, Hamburg 85.7.2010 CALICE - HCAL
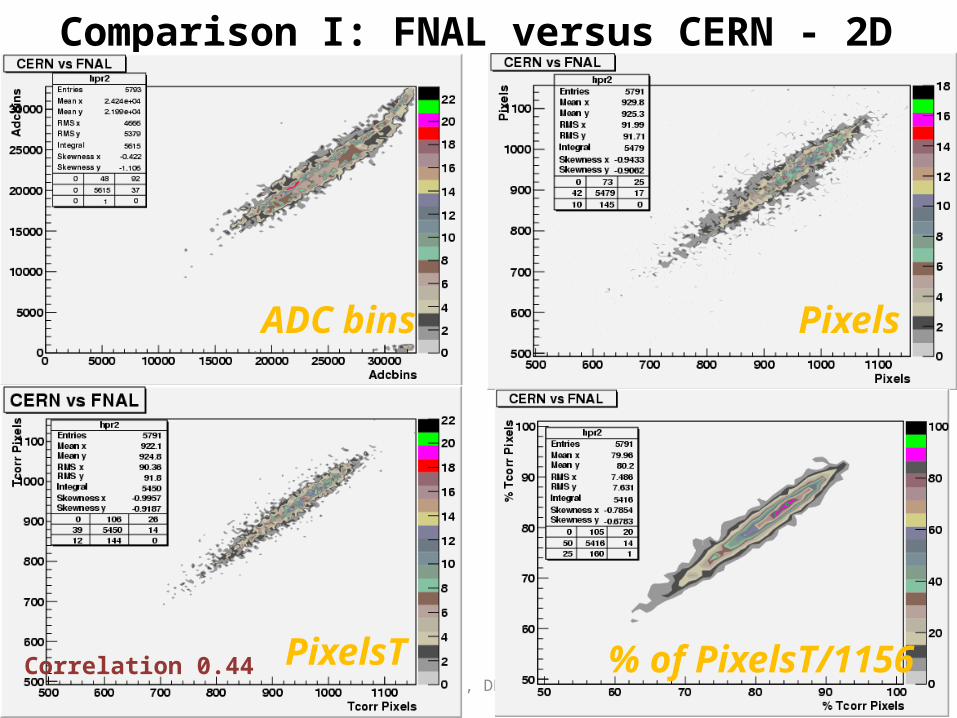
Comparison I: FNAL versus CERN - 2D
ADC bins Pixels
PixelsT % of PixelsT/1156Correlation 0.44
Jara Zalesak, DESY, Hamburg 95.7.2010 CALICE - HCAL
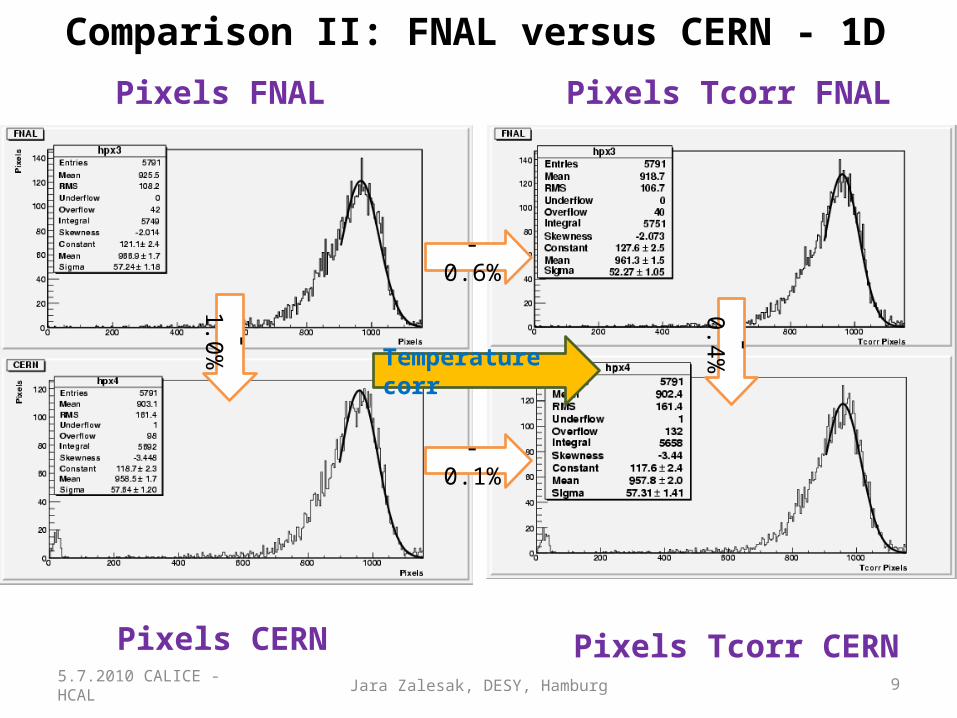
Comparison II: FNAL versus CERN - 1DPixels FNAL
Pixels CERN
Pixels Tcorr FNAL
Pixels Tcorr CERN
Temperature corr
- 0.6%
- 0.1%
- 1.0%
- 0.4%
Jara Zalesak, DESY, Hamburg 105.7.2010 CALICE - HCAL
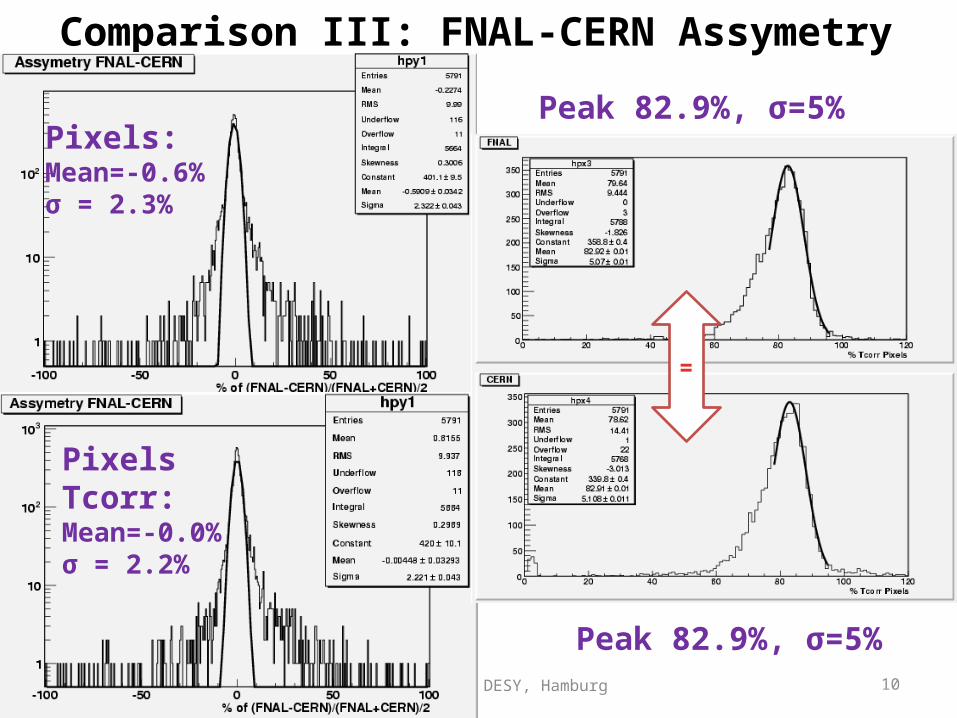
Comparison III: FNAL-CERN Assymetry
Pixels:Mean=-0.6%σ = 2.3%
Pixels Tcorr:Mean=-0.0%σ = 2.2%
Peak 82.9%, σ=5%
Peak 82.9%, σ=5%
=
Jara Zalesak, DESY, Hamburg 11
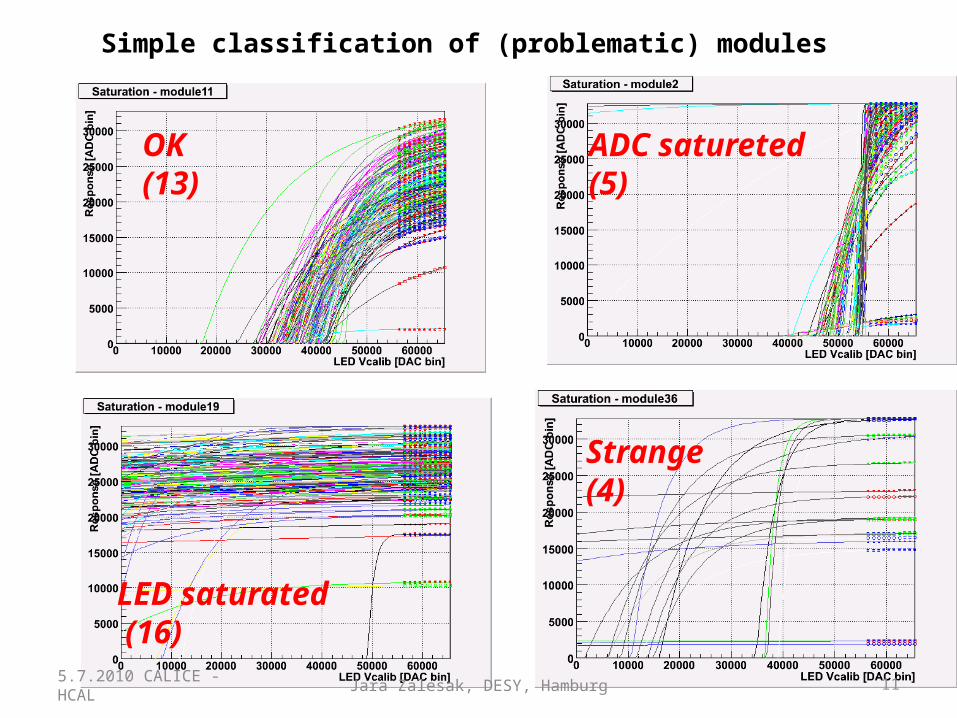
OK (13)
ADC satureted(5)
LED saturated (16)
Strange (4)
5.7.2010 CALICE - HCAL
Simple classification of (problematic) modules

Jara Zalesak, DESY, Hamburg 125.7.2010 CALICE - HCAL
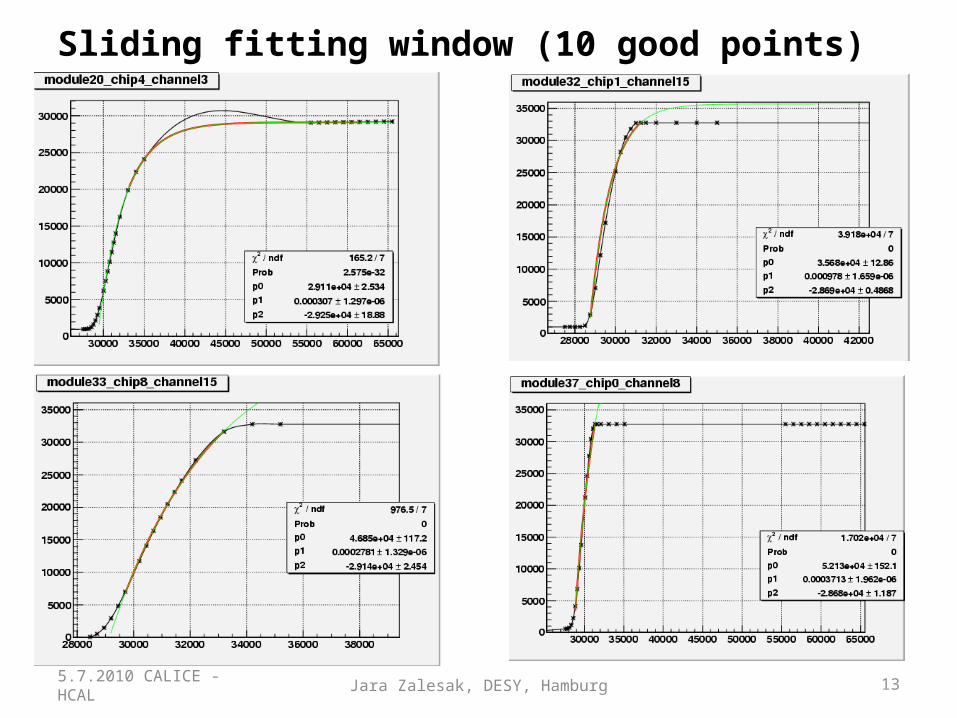
Sliding fitting window (10 good points)
Saturated channels excluded
Jara Zalesak, DESY, Hamburg 135.7.2010 CALICE - HCAL
Sliding fitting window (10 good points)
Jara Zalesak, DESY, Hamburg 145.7.2010 CALICE - HCAL
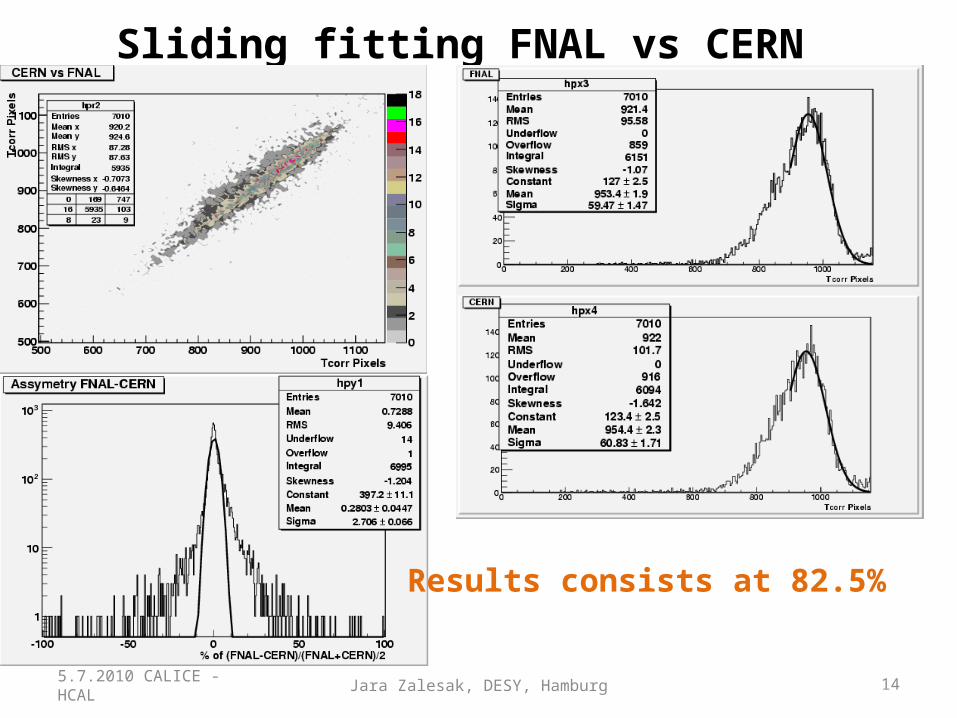
Sliding fitting FNAL vs CERN
Results consists at 82.5%

155.7.2010 CALICE - HCAL Jara Zalesak, DESY, Hamburg
Sliding fitting FNAL vs FNAL
Results consists at 83% Difference 0.2%

Jara Zalesak, DESY, Hamburg 16
Conclusion
5.7.2010 CALICE - HCAL
Analysis gives global results for SiPM saturation curves over all available PmVcalibScan runs from TB at CERN & FNAL 2007-09 Performance is improved with averaging of the results over all runs from both periods up to 6360 (84%) ch. after sel. criteria The calibration and Temperature correction seem to work very well and improve measured results Both data sets FNAL & CERN give consistent results Most probable value over all channels at level of 83% of 1156px Still remaining outliers channels which are not fitted properly
After applying sliding fitting range get similar results in global
Jara Zalesak, DESY, Hamburg 17
ToDo & Issues
The measurement of the saturation curves is being done with re-commission of PPT for W-AHCAL 2010 tests at CERN Much more data points taken for curves to cover all ranges (154 each 250 Vcalib bins) some data are already stored, need to update DB and do gain calibration
5.7.2010 CALICE - HCAL

Jara Zalesak, DESY, Hamburg 18
BACK UP
5.7.2010 CALICE - HCAL
Jara Zalesak, DESY, Hamburg 195.7.2010 CALICE - HCAL
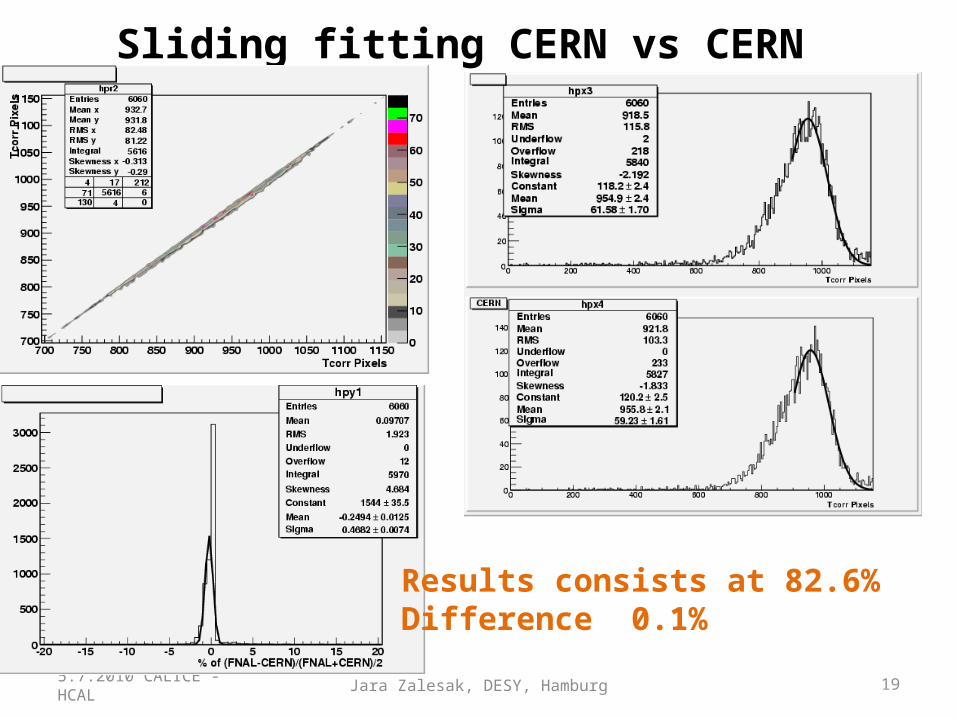
Sliding fitting CERN vs CERN
Results consists at 82.6% Difference 0.1%