satellite center the preparatory office for meteorological satellite center was established. 1977...
TRANSCRIPT

Meteorological Satellite CenterAddress: 3-235 Nakakiyoto, Kiyose-shi
Tokyo 204-0012, Japan
phone: +81-42-493-1111
URL: http://mscweb.kishou.go.jp/index.htm
Command and Data Acquisition StationAddress: 1440-1 Mamedo, Hatoyama-machi, hiki-gun
Saitama 350-0324, Japan
phone: +81-49-296-2625
Meteorological Satellite Center
Command and Data Acquisition Station
JMA’s mascotHarerun
気 象 庁
Japan Meteorological Agency
Meteorological Satellite Center

Himawari 2 (GMS-2)(06 UTC, 21 December, 1981)
As weather affects agriculture, industry, transportation and everyday activities, it has a significant influence on people’s lives. The Himawari geostationary meteorological satellite carries an imaging sensor that continuously captures images of the earth over the western Pacific region from space day and night. These images provide information on clouds, the atmosphere and land/sea surfaces, and are used for weather analysis, weather forecasting and climate/environment monitoring. Himawaricontributes in particular to the prevention and mitigation of disasters by providing the images to be used for advance warning of potentially devastating phenomena such as typhoons, thunderstorms, strong winds, torrential rains and heavy snow.
SPACE-BASED GLOBAL OBSERVING SYSTEM 1HIMAWARI AND ITS FUNCTIONS 3GEOSTATIONARY METEOROLOGICAL SATELLITE SYSTEM 5RADIO TELECOMMUNICATIONS WITH HIMAWARI 7COMPUTER SYSTEM TO PROCESS SATELLITE DATA 9DISSEMINATION OF IMAGERY DATA 11MONITORING METEOROLOGICAL PHENOMENA FROM SPACE 13DETERMINATION OF METEOROLOGICAL PARAMETERS 17DATA COLLECTION SYSTEM 21INTERNATIONAL ACTIVITIES 22HISTORY OF HIMAWARI 23HISTORY OF METEOROLOGICAL SATELLITE CENTER 25ORGANIZATION, ABBREVIATIONS 26
CONTENTS
Himawari (GMS)(00 UTC, 6 April, 1978)
Himawari 3 (GMS-3)(06 UTC, 27 September, 1984)
Himawari 7 (MTSAT-2)(03 UTC, 1 July, 2010)
Himawari 4 (GMS-4)(00 UTC, 14 December, 1989)
Himawari 5 (GMS-5)(00 UTC, 21 June, 1995)
Himawari 6 (MTSAT-1R)(03 UTC, 28 June, 2005)
FIRST OPERATIONAL IMAGES OF HIMAWARIHISTORY OF METEOROLOGICAL SATELLITE CENTER
ABBREVIATIONS
ORGANIZATION
Year Date Outline1950 15-Jul The Meteorological Communication Center was moved to Kiyose.1968 20-Aug Reception of the Automatic Picture Transmission (APT) data from the polar orbiting satellite ESSA-6
(U.S.) was started.16-Apr Meteorological Satellite Planning Division was established in JMA’s headquarters.
1974 1-Mar Reception of the VHRR data from the polar-orbiting satellite ITOS-D (NOAA-2, U.S.) was started. Data from NOAA satellites have been received since then.
1976 1-Mar The building of the Meteorological Satellite Center (MSC) was constructed.8-Mar The building of Command and Data Acquisition Station (CDAS) was constructed.
22-Mar Computer system for both satellite control and data processing was put into operation.1-May The Preparatory Office for Meteorological Satellite Center was established.
1977 1-Apr MSC was established as an auxiliary organ of the JMA.14-Jul The first Geostationary Meteorological Satellite (GMS) was launched from Cape Canaveral in Florida,
U.S. at 19:39 (JST). 18-Jul GMS was nicknamed “Himawari”.8-Sep The first earth imagery of GMS was captured.4-Nov GMS was transferred from the National Space Development Agency of Japan (NASDA) to JMA.
1978 6-Apr GMS started full operations capturing full disk images three-hourly and disseminating facsimile pictures.
1981 1-Apr Retrieval of atmospheric vertical profile data from the polar orbiting meteorological satellite TIROS-N (U.S.) was started.
11-Aug GMS-2 (Himawari 2) was launched from the Tanegashima Space Center of the NASDA in Kagoshima Prefecture, Japan at 05:03 (JST).
21-Dec Full operations of GMS-2 were started.1983 1-Jul Provision of Himawari data to the International Satellite Cloud Climatology Project (ISCCP) was
started.1984 1-Jul Provision of typhoon analysis reports (SAREP) was started.
3-Aug GMS-3 (Himawari 3) was launched from the Tanegashima Space Center at 05:30 (JST).27-Sep Full operations of GMS-3 were started.
1987 1-Mar Operation of new computer system was started. Concurrently, hourly northern hemisphere half disk observations in addition to the three-hourly full disk observations and generation of new products such as Satellite Cloud Information Charts (SCICs) were started.
1988 1-Jan Provision of Himawari data to the Global Precipitation Climate Project (GPCP) was started.1-Apr Dissemination of stretched VISSR (S-VISSR) data from Himawari was started.
1989 5-Jan Operation of hourly full disk observations was started.6-Sep GMS-4 (Himawari 4) was launched from the Tanegashima Space Center at 04:11 (JST).
14-Dec Full operations of GMS-4 was started.1994 1-Mar Provision of SCICs was augmented to hourly from three-hourly.
1-Apr Operation of the Simultaneous Satellite Communication System for Emergency Information was started.
1995 18-Mar GMS-5 (Himawari 5) was launched from the Tanegashima Space Center at 17:01 (JST).14-Jun Operation of new computer system was started. SCIC was renamed Satellite Cloud Analysis Chart
(SCAC).15-Jun Data reception from two NOAA satellites was started.21-Jun Full operations of GMS-5 were started.30-Jun The second MSC building was constructed.
1996 1-Apr Operation of the Seismic Intensity data Conversion System was started.1999 15-Nov The launch of MTSAT from the Tanegashima Space on a H-II launch vehicle at 16:29 (JST) was failed,
due to the problem of the vehicle.2002 2-Dec Landline dissemination for the back-up of satellite dissemination was started.2003 22-May Back-up operation by GOES-9 was started.2005 26-Feb MTSAT-1R (Himawari 6) was launched from the Tanegashima Space Center of the JAXA (successor
organization to the NASDA) at 18:25 (JST).1-Mar Operation of new computer system was started.
29-Mar Provision of SCACs over the southern hemisphere was started.28-Jun Full operation of MTSAT-1R started.
2006 18-Feb MTSAT-2 was launched from the Tanegashima Space Center at 15:27 (JST).4-Sep Operation of MTSAT-2 (Himawari 7) as back-up of MTSAT-1R was started.
2007 25-May Reception of Metop-A (Europe) was started.2008 12-Mar Dissemination of HiRID and WEFAX was discontinued.2010 1-Jul Operation of earth imaging by MTSAT-2 was started, and MTSAT-1R was put into the back-up
satellite of MTSAT-2.20-Aug New tower with an antenna to receive polar-orbiting satellite data was installed.
2011 7-Jun Operation of MTSAT-1R rapid scan observation was started.26-Dec The third MSC building was constructed.
CDAS Command and Data Acquisition StationDCP Data Collection PlatformDCS Data Collection SystemDPC Data Processing CenterEOC Earth Observation Center (JAXA)
ESSA Environmental Science Services Administration SatelliteEUMETSAT European Organization for the Exploitation of Meteorological SatellitesGMS Geostationary Meteorological SatelliteGOES Geostationary Operational Environmental Satellite (NOAA)GPCP Global Precipitation Climatology Project
GTS Global Telecommunication SystemHiRID High Resolution Imager DataHRIT High Rate Information TransmissionIR-image Infrared-imageISCCP International Satellite Cloud Climatology Project
JAXA Japan Aerospace Exploration AgencyLRIT Low Rate Information TransmissionMETEOSAT Geostationary Meteorological Satellite (EUMETSAT)Metop Meteorological Operational Polar Satellite (EUMETSAT)MTSAT Multi-functional Transport Satellite
NOAA National Oceanic and Atmospheric Administration (U.S.)SAREP Report on tropical cyclone analysis using satellite imageryVIS-image Visible-imageVISSR Visible and Infrared Spin Scan RadiometerWEFAX Weather Facsimile
WMO World Meteorological OrganizationWV-image Water Vapor-imageWWW World Weather Watch
System EngineeringDivision
Data Processing Department
Data Processing Division
Analysis Division
Satellite ControlDivision
Facilities Division
Communication Department
First CommunicationDivision
Second CommunicationDivision
Command and DataAcquisition Station
Administration Division
Administration Department
Finance andAccounting Division
Meteorological Satellite Center
Japan Meteorological Agency
(in Hatoyama-machi, Saitama)
26

Himawari 2 (GMS-2)(06 UTC, 21 December, 1981)
As weather affects agriculture, industry, transportation and everyday activities, it has a significant influence on people’s lives. The Himawari geostationary meteorological satellite carries an imaging sensor that continuously captures images of the earth over the western Pacific region from space day and night. These images provide information on clouds, the atmosphere and land/sea surfaces, and are used for weather analysis, weather forecasting and climate/environment monitoring. Himawaricontributes in particular to the prevention and mitigation of disasters by providing the images to be used for advance warning of potentially devastating phenomena such as typhoons, thunderstorms, strong winds, torrential rains and heavy snow.
SPACE-BASED GLOBAL OBSERVING SYSTEM 1HIMAWARI AND ITS FUNCTIONS 3GEOSTATIONARY METEOROLOGICAL SATELLITE SYSTEM 5RADIO TELECOMMUNICATIONS WITH HIMAWARI 7COMPUTER SYSTEM TO PROCESS SATELLITE DATA 9DISSEMINATION OF IMAGERY DATA 11MONITORING METEOROLOGICAL PHENOMENA FROM SPACE 13DETERMINATION OF METEOROLOGICAL PARAMETERS 17DATA COLLECTION SYSTEM 21INTERNATIONAL ACTIVITIES 22HISTORY OF HIMAWARI 23HISTORY OF METEOROLOGICAL SATELLITE CENTER 25ORGANIZATION, ABBREVIATIONS 26
CONTENTS
Himawari (GMS)(00 UTC, 6 April, 1978)
Himawari 3 (GMS-3)(06 UTC, 27 September, 1984)
Himawari 7 (MTSAT-2)(03 UTC, 1 July, 2010)
Himawari 4 (GMS-4)(00 UTC, 14 December, 1989)
Himawari 5 (GMS-5)(00 UTC, 21 June, 1995)
Himawari 6 (MTSAT-1R)(03 UTC, 28 June, 2005)
FIRST OPERATIONAL IMAGES OF HIMAWARI

Region Satellite Operator Location
East Pacific GOES-15(GOES WEST)
NOAA
135°W
North, Central and South America
GOES-13(GOES EAST) 75°W
GOES-12 60°W
Europe & AfricaMeteosat-9
EUMETSAT0°
Meteosat-8 9.5°E
Indian Ocean& Asia
Meteosat-7 57.5°EKalpana-1 INDIA 74°E
Electro-L N1 Roshydromet-Roscosmos 76°EFY-2D CMA 86.5°E
INSAT-3A INDIA 93.5°EFY-2E CMA 105°E
West Pacific
COMS-1 KMA 128.2°EHimawari 6
(MTSAT-1R) JMA140°E
Himawari 7(MTSAT-2) 145°E
SPACE-BASED GLOBAL OBSERVING SYSTEM– World Weather Watch –
Reference: WMO Web page (March, 2012)
Geostationary Meteorological Satellites
Satellite Operator
NOAA NOAA Polar-orbiting satellites follow circular sun-synchronous orbits over the northern and southern polar regions at altitudes of about 850 km with an orbital period of about 100 minutes.
FY-1, FY-3 CMA
Metop EUMETSAT
Polar-orbiting Meteorological Satellites
To support consistent earth observation on a global scale, the World Meteorological Organization (WMO) runs the World Weather Watch (WWW) programme in collaboration with WMO Member States. The space-based Global Observing System (GOS), consisting of geostationary meteorological satellites and polar-orbiting meteorological satellites, plays an important role in the programme. The Himawari geostationary meteorological satellite is an indispensable part of the GOS, and contributes significantly to meteorological services both in Japan and around the world.
Reference: WMO Web page (March, 2012)
1

Region Satellite Operator Location
East Pacific GOES-15(GOES WEST)
NOAA
135°W
North, Central and South America
GOES-13(GOES EAST) 75°W
GOES-12 60°W
Europe & AfricaMeteosat-9
EUMETSAT0°
Meteosat-8 9.5°E
Indian Ocean& Asia
Meteosat-7 57.5°EKalpana-1 INDIA 74°E
Electro-L N1 Roshydromet-Roscosmos 76°EFY-2D CMA 86.5°E
INSAT-3A INDIA 93.5°EFY-2E CMA 105°E
West Pacific
COMS-1 KMA 128.2°EHimawari 6
(MTSAT-1R) JMA140°E
Himawari 7(MTSAT-2) 145°E
SPACE-BASED GLOBAL OBSERVING SYSTEM– World Weather Watch –
Reference: WMO Web page (March, 2012)
Geostationary Meteorological Satellites
Satellite Operator
NOAA NOAA Polar-orbiting satellites follow circular sun-synchronous orbits over the northern and southern polar regions at altitudes of about 850 km with an orbital period of about 100 minutes.
FY-1, FY-3 CMA
Metop EUMETSAT
Polar-orbiting Meteorological Satellites
To support consistent earth observation on a global scale, the World Meteorological Organization (WMO) runs the World Weather Watch (WWW) programme in collaboration with WMO Member States. The space-based Global Observing System (GOS), consisting of geostationary meteorological satellites and polar-orbiting meteorological satellites, plays an important role in the programme. The Himawari geostationary meteorological satellite is an indispensable part of the GOS, and contributes significantly to meteorological services both in Japan and around the world.
Reference: WMO Web page (March, 2012)
2
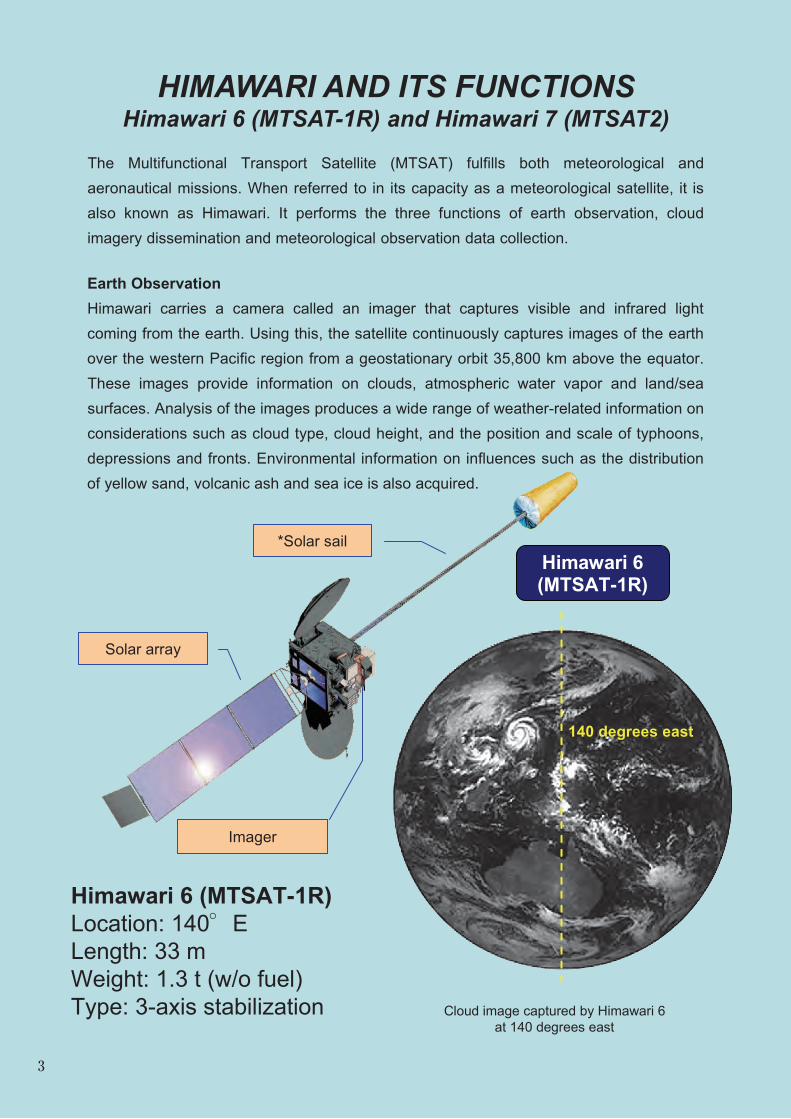
Cloud image captured by Himawari 6at 140 degrees east
Cloud image captured by Himawari 7at 145 degrees east
Himawari 7(MTSAT-2)
*Solar sail
Solar array
Imager
*Solar sail
Solar array
Imager
Himawari 7 (MTSAT-2)Location: 145°ELength: 27 mWeight: 1.7 t (w/o fuel)Type: 3-axis stabilization* Solar sailThe solar sail counteracts the torque produced by the force of sunlight acting on the solar array.
140 degrees east 145 degrees east
Himawari 6 (MTSAT-1R)Location: 140°ELength: 33 mWeight: 1.3 t (w/o fuel)Type: 3-axis stabilization
Himawari Earth Observation ScanningScanning a mirror line by line from north to south, the imager on board Himawari monitors the intensity of visible and infrared light coming from the earth. It takes about 30 minutes to obtain a full-disk earth image.
Himawari 6(MTSAT-1R)
HIMAWARI AND ITS FUNCTIONSHimawari 6 (MTSAT-1R) and Himawari 7 (MTSAT2)
The Multifunctional Transport Satellite (MTSAT) fulfills both meteorological andaeronautical missions. When referred to in its capacity as a meteorological satellite, it isalso known as Himawari. It performs the three functions of earth observation, cloudimagery dissemination and meteorological observation data collection.
Earth ObservationHimawari carries a camera called an imager that captures visible and infrared lightcoming from the earth. Using this, the satellite continuously captures images of the earthover the western Pacific region from a geostationary orbit 35,800 km above the equator.These images provide information on clouds, atmospheric water vapor and land/seasurfaces. Analysis of the images produces a wide range of weather-related information onconsiderations such as cloud type, cloud height, and the position and scale of typhoons,depressions and fronts. Environmental information on influences such as the distributionof yellow sand, volcanic ash and sea ice is also acquired.
Imagery Data DisseminationHimawari disseminates its imagery data to utilizationstations over the western Pacific region.
Meteorological Observation Data CollectionHimawari collects meteorological data, tide gauge dataand seismic intensity gauge data gathered at datacollection platforms (DCPs) distributed across thewestern Pacific region.
3

Cloud image captured by Himawari 6at 140 degrees east
Cloud image captured by Himawari 7at 145 degrees east
Himawari 7(MTSAT-2)
*Solar sail
Solar array
Imager
*Solar sail
Solar array
Imager
Himawari 7 (MTSAT-2)Location: 145°ELength: 27 mWeight: 1.7 t (w/o fuel)Type: 3-axis stabilization* Solar sailThe solar sail counteracts the torque produced by the force of sunlight acting on the solar array.
140 degrees east 145 degrees east
Himawari 6 (MTSAT-1R)Location: 140°ELength: 33 mWeight: 1.3 t (w/o fuel)Type: 3-axis stabilization
Himawari Earth Observation ScanningScanning a mirror line by line from north to south, the imager on board Himawari monitors the intensity of visible and infrared light coming from the earth. It takes about 30 minutes to obtain a full-disk earth image.
Himawari 6(MTSAT-1R)
HIMAWARI AND ITS FUNCTIONSHimawari 6 (MTSAT-1R) and Himawari 7 (MTSAT2)
The Multifunctional Transport Satellite (MTSAT) fulfills both meteorological andaeronautical missions. When referred to in its capacity as a meteorological satellite, it isalso known as Himawari. It performs the three functions of earth observation, cloudimagery dissemination and meteorological observation data collection.
Earth ObservationHimawari carries a camera called an imager that captures visible and infrared lightcoming from the earth. Using this, the satellite continuously captures images of the earthover the western Pacific region from a geostationary orbit 35,800 km above the equator.These images provide information on clouds, atmospheric water vapor and land/seasurfaces. Analysis of the images produces a wide range of weather-related information onconsiderations such as cloud type, cloud height, and the position and scale of typhoons,depressions and fronts. Environmental information on influences such as the distributionof yellow sand, volcanic ash and sea ice is also acquired.
Imagery Data DisseminationHimawari disseminates its imagery data to utilizationstations over the western Pacific region.
Meteorological Observation Data CollectionHimawari collects meteorological data, tide gauge dataand seismic intensity gauge data gathered at datacollection platforms (DCPs) distributed across thewestern Pacific region.
4

Earth Observation and Imagery Data Dissemination
Seismic Intensity Gauge(Local Meteorological
Observatory, etc.)
Medium-scale Data Utilization Station
Ship
Isolated island
Meteorological Satellite Center(Kiyose, Tokyo)
Sea surfaceSea ice
Meteorological Observation Data Collection
Water vaporin atmosphere
Japan Meteorological Agency(Chiyoda-ku, Tokyo)
Cloud
Imagery data
Command and Data Acquisition Station
(Hatoyama, Saitama)
Volcanic Ash
Meteorological observation data
Observation
Observation
Imagery data dissemination by HRIT
Observation
ObservationRaw imagery data
Satellite telemetry
Meteorological Satellite Center(Kiyose, Tokyo) Japan Meteorological Agency
(Chiyoda-ku, Tokyo)
Command and Data Acquisition Station
(Hatoyama, Saitama)
Satellite control command
Imagery data dissemination by LRIT
Small-scale Data Utilization Station
GEOSTATIONARY METEOROLOGICAL SATELLITE SYSTEM
Tide Gauge(Tsunami Watch)
5

Earth Observation and Imagery Data Dissemination
Seismic Intensity Gauge(Local Meteorological
Observatory, etc.)
Medium-scale Data Utilization Station
Ship
Isolated island
Meteorological Satellite Center(Kiyose, Tokyo)
Sea surfaceSea ice
Meteorological Observation Data Collection
Water vaporin atmosphere
Japan Meteorological Agency(Chiyoda-ku, Tokyo)
Cloud
Imagery data
Command and Data Acquisition Station
(Hatoyama, Saitama)
Volcanic Ash
Meteorological observation data
Observation
Observation
Imagery data dissemination by HRIT
Observation
ObservationRaw imagery data
Satellite telemetry
Meteorological Satellite Center(Kiyose, Tokyo) Japan Meteorological Agency
(Chiyoda-ku, Tokyo)
Command and Data Acquisition Station
(Hatoyama, Saitama)
Satellite control command
Imagery data dissemination by LRIT
Small-scale Data Utilization Station
GEOSTATIONARY METEOROLOGICAL SATELLITE SYSTEM
Tide Gauge(Tsunami Watch)
6
Ground Control Console Satellite Control Console
Imager Data Acquisition Control System
Full view of Command and Data Acquisition Station (CDAS)
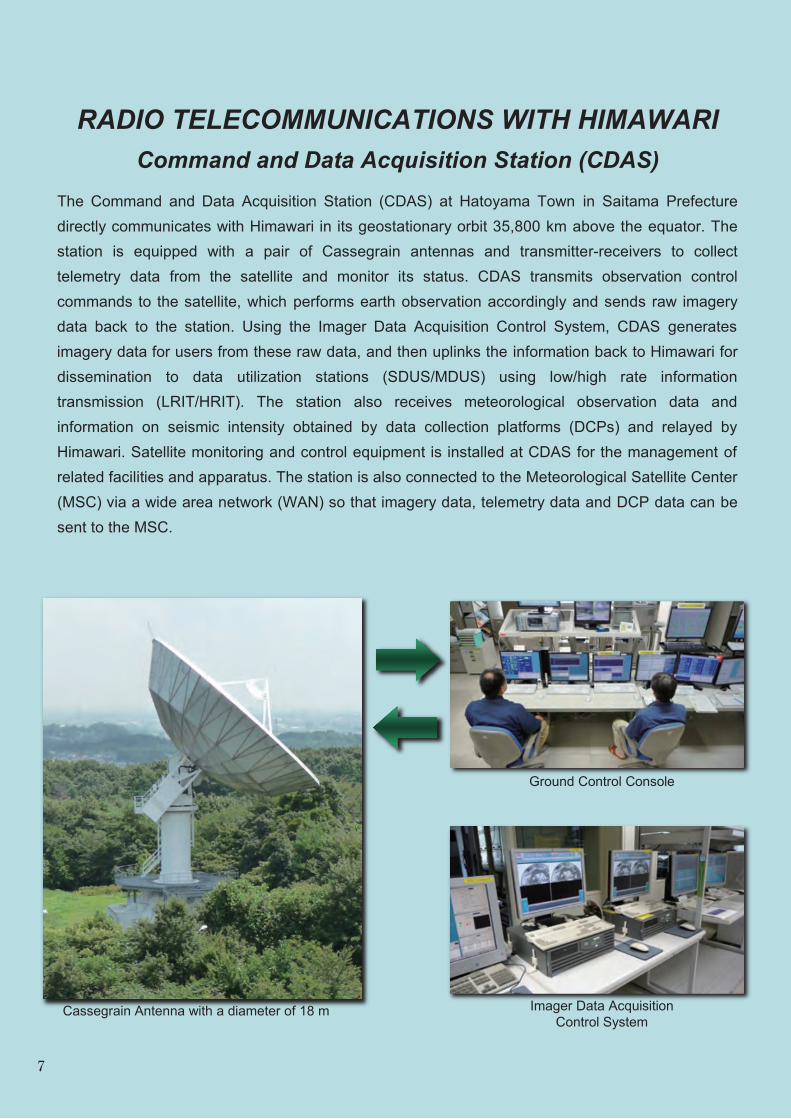
Cassegrain Antenna with a diameter of 18 m
RADIO TELECOMMUNICATIONS WITH HIMAWARICommand and Data Acquisition Station (CDAS)
The Command and Data Acquisition Station (CDAS) at Hatoyama Town in Saitama Prefecture directly communicates with Himawari in its geostationary orbit 35,800 km above the equator. The station is equipped with a pair of Cassegrain antennas and transmitter-receivers to collect telemetry data from the satellite and monitor its status. CDAS transmits observation controlcommands to the satellite, which performs earth observation accordingly and sends raw imagery data back to the station. Using the Imager Data Acquisition Control System, CDAS generates imagery data for users from these raw data, and then uplinks the information back to Himawari for dissemination to data utilization stations (SDUS/MDUS) using low/high rate informationtransmission (LRIT/HRIT). The station also receives meteorological observation data and information on seismic intensity obtained by data collection platforms (DCPs) and relayed by Himawari. Satellite monitoring and control equipment is installed at CDAS for the management of related facilities and apparatus. The station is also connected to the Meteorological Satellite Center (MSC) via a wide area network (WAN) so that imagery data, telemetry data and DCP data can be sent to the MSC.
Operation Information Generation Equipment(MSC)
Acquisition System of the Seismic Intensity Data from DCPs
7

Ground Control Console Satellite Control Console
Imager Data Acquisition Control System
Full view of Command and Data Acquisition Station (CDAS)
Cassegrain Antenna with a diameter of 18 m
RADIO TELECOMMUNICATIONS WITH HIMAWARICommand and Data Acquisition Station (CDAS)
The Command and Data Acquisition Station (CDAS) at Hatoyama Town in Saitama Prefecture directly communicates with Himawari in its geostationary orbit 35,800 km above the equator. The station is equipped with a pair of Cassegrain antennas and transmitter-receivers to collect telemetry data from the satellite and monitor its status. CDAS transmits observation controlcommands to the satellite, which performs earth observation accordingly and sends raw imagery data back to the station. Using the Imager Data Acquisition Control System, CDAS generates imagery data for users from these raw data, and then uplinks the information back to Himawari for dissemination to data utilization stations (SDUS/MDUS) using low/high rate informationtransmission (LRIT/HRIT). The station also receives meteorological observation data and information on seismic intensity obtained by data collection platforms (DCPs) and relayed by Himawari. Satellite monitoring and control equipment is installed at CDAS for the management of related facilities and apparatus. The station is also connected to the Meteorological Satellite Center (MSC) via a wide area network (WAN) so that imagery data, telemetry data and DCP data can be sent to the MSC.
Operation Information Generation Equipment(MSC)
Acquisition System of the Seismic Intensity Data from DCPs
8

COMPUTER SYSTEM TO PROCESS SATELLITE DATAMeteorological Satellite Center (MSC)
Polar-orbiting Satellite Data Receiving System
Satellite Data Processing System
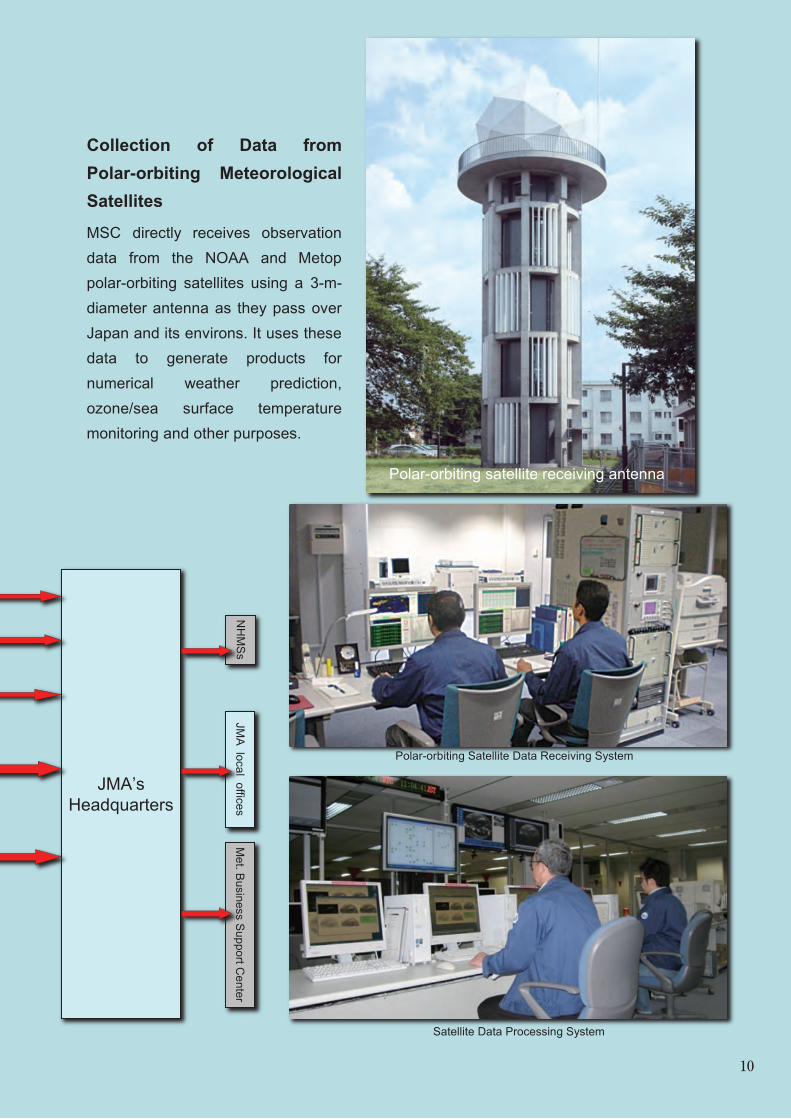
Collection of Data fromPolar-orbiting Meteorological Satellites
MSC directly receives observation data from the NOAA and Metop polar-orbiting satellites using a 3-m-diameter antenna as they pass over Japan and its environs. It uses these data to generate products for numerical weather prediction, ozone/sea surface temperature monitoring and other purposes.
Polar-orbiting satellite receiving antenna
Satellite Data Processing
A computer system at the Meteorological Satellite Center (MSC) in Tokyo’s Kiyose City receives Himawari information from CDAS and processes it to generate various products, including cloud images, cloud analysis charts, wind vectors, volcanic ash monitoring images, yellow sand analysis, sea ice monitoring images and sea surface temperature data. This output is provided to JMA’s headquarters and local offices, National Meteorological and Hydrological Services (NMHSs) around the world, aeronautical operators and the Japan Meteorological Business Support Center, which supplies imagery data and products to commercial users. The computer system also has functions to support the editing of DCP data collected by Himawari and the exchange of earth observation satellite data with the Japan Aerospace Exploration Agency (JAXA).
JMA’sHeadquarters
JMA’sHeadquarters
CDASCDAS
JAXA(EOC)
JAXA(EOC)
Imagery dataDCP data
LRIT imagery
JMA
local officesJM
A local offices
NH
MS
sN
HM
Ss
Met. B
usiness Support C
enterM
et. Business S
upport Center
MTSAT
HRPT data
Earth observing satellite data
Meteorological data
HRIT imagery
サーバ群
Satellite Data Processing System
Meteorological Satellite Center
DCP Data Editing System
Physical products- Cloud amount lattice point- Atmospheric Motion Vectors- Sea surface temperatures- Sea ice movement- Yellow sand, etc.
HRIT imagery
DCP data Edited DCP data
Rapid scan imagery data
Polar-orbiting Satellite Data
Receiving System
Polar-orbiting Satellite Data
Receiving System
Earth Observation Satellite Data Utilization
System
Earth Observation Satellite Data Utilization
System
NOAA satellite
MetOp satelliteAHRPT data
Wide Area Cloud Information System
Satellite CloudInformation Chartsfor aviation users
Imagery products
9
COMPUTER SYSTEM TO PROCESS SATELLITE DATAMeteorological Satellite Center (MSC)
Polar-orbiting Satellite Data Receiving System
Satellite Data Processing System
Collection of Data fromPolar-orbiting Meteorological Satellites
MSC directly receives observation data from the NOAA and Metop polar-orbiting satellites using a 3-m-diameter antenna as they pass over Japan and its environs. It uses these data to generate products for numerical weather prediction, ozone/sea surface temperature monitoring and other purposes.
Polar-orbiting satellite receiving antenna
Satellite Data Processing
A computer system at the Meteorological Satellite Center (MSC) in Tokyo’s Kiyose City receives Himawari information from CDAS and processes it to generate various products, including cloud images, cloud analysis charts, wind vectors, volcanic ash monitoring images, yellow sand analysis, sea ice monitoring images and sea surface temperature data. This output is provided to JMA’s headquarters and local offices, National Meteorological and Hydrological Services (NMHSs) around the world, aeronautical operators and the Japan Meteorological Business Support Center, which supplies imagery data and products to commercial users. The computer system also has functions to support the editing of DCP data collected by Himawari and the exchange of earth observation satellite data with the Japan Aerospace Exploration Agency (JAXA).
JMA’sHeadquarters
JMA’sHeadquarters
CDASCDAS
JAXA(EOC)
JAXA(EOC)
Imagery dataDCP data
LRIT imagery
JMA
local officesJM
A local offices
NH
MS
sN
HM
Ss
Met. B
usiness Support C
enterM
et. Business S
upport Center
MTSAT
HRPT data
Earth observing satellite data
Meteorological data
HRIT imagery
サーバ群
Satellite Data Processing System
Meteorological Satellite Center
DCP Data Editing System
Physical products- Cloud amount lattice point- Atmospheric Motion Vectors- Sea surface temperatures- Sea ice movement- Yellow sand, etc.
HRIT imagery
DCP data Edited DCP data
Rapid scan imagery data
Polar-orbiting Satellite Data
Receiving System
Polar-orbiting Satellite Data
Receiving System
Earth Observation Satellite Data Utilization
System
Earth Observation Satellite Data Utilization
System
NOAA satellite
MetOp satelliteAHRPT data
Wide Area Cloud Information System
Satellite CloudInformation Chartsfor aviation users
Imagery products
10

Dissemination manner Area Channel Dissemination frequency
HRIT
Full disk
Northern Hemisphere
Southern Hemisphere
All channels
LRIT
Full disk
Visible Hourly (24 times/day)
Infrared Hourly (24 times/day)
Infrared (water vapor) 6 Hourly (4 times/day)
East Asiapolar-stereographic
Infrared Every 30 minutes (44 times/day)
Infrared (water vapor) Every 30 minutes (44 times/day)
Visible Every 30 minutes (daytime only)
3.8 μm Every 30 minutes (nighttime only)
Northeast of Japanpolar-stereographic Visible Every 30 minutes (daytime only)
Southwest of Japanpolar-stereographic Visible Every 30 minutes (daytime only)
Two types of Himawari imagery data generated at CDAS are disseminated to users via the satellite.
For medium-scale data utilization stations (MDUS), high spatial resolution imagery data for all channels and observation times are disseminated using high rate information transmission (HRIT).
For small-scale data utilization stations (SDUS), low spatial resolution imagery data are disseminated using low rate information transmission (LRIT). To allow the transfer of imagery data using the narrow bandwidth of LRIT, the data are compacted by reducing the spatial resolution of the images and limiting the number of channels.
In addition to imagery data from Himawari, data on coastlines and latitude/longitude lines are also disseminated using HRIT and LRIT, respectively, to be overlaid onto imagery data.
List of imagery data disseminated
High resolution imagery data disseminated by HRIT
Full disk (visible)
Full disk (water vapor)
Full disk (infrared) East Asia (visible)
East Asia (3.8 μm)
Northeast of Japan (visible)
Southwest of Japan (visible)
DISSEMINATION OF IMAGERY DATANorthern hemisphere (visible)
Southern hemisphere (visible)
Low resolution imagery data disseminated by LRIT56 times/day
Full diskHourly (24 times/day)
Northern HemisphereNear hourly (24 times/day)
Southern Hemisphere6 hourly (8 times/day)
11

Dissemination manner Area Channel Dissemination frequency
HRIT
Full disk
Northern Hemisphere
Southern Hemisphere
All channels
LRIT
Full disk
Visible Hourly (24 times/day)
Infrared Hourly (24 times/day)
Infrared (water vapor) 6 Hourly (4 times/day)
East Asiapolar-stereographic
Infrared Every 30 minutes (44 times/day)
Infrared (water vapor) Every 30 minutes (44 times/day)
Visible Every 30 minutes (daytime only)
3.8 μm Every 30 minutes (nighttime only)
Northeast of Japanpolar-stereographic Visible Every 30 minutes (daytime only)
Southwest of Japanpolar-stereographic Visible Every 30 minutes (daytime only)
Two types of Himawari imagery data generated at CDAS are disseminated to users via the satellite.
For medium-scale data utilization stations (MDUS), high spatial resolution imagery data for all channels and observation times are disseminated using high rate information transmission (HRIT).
For small-scale data utilization stations (SDUS), low spatial resolution imagery data are disseminated using low rate information transmission (LRIT). To allow the transfer of imagery data using the narrow bandwidth of LRIT, the data are compacted by reducing the spatial resolution of the images and limiting the number of channels.
In addition to imagery data from Himawari, data on coastlines and latitude/longitude lines are also disseminated using HRIT and LRIT, respectively, to be overlaid onto imagery data.
List of imagery data disseminated
High resolution imagery data disseminated by HRIT
Full disk (visible)
Full disk (water vapor)
Full disk (infrared) East Asia (visible)
East Asia (3.8 μm)
Northeast of Japan (visible)
Southwest of Japan (visible)
DISSEMINATION OF IMAGERY DATANorthern hemisphere (visible)
Southern hemisphere (visible)
Low resolution imagery data disseminated by LRIT56 times/day
Full diskHourly (24 times/day)
Northern HemisphereNear hourly (24 times/day)
Southern Hemisphere6 hourly (8 times/day)
12

2. Rapid Scan Observation
Himawari can capture images over a small area at short intervals thanks to a function known as rapid scan observation. Using Himawari 6, which currently serves as the back-up satellite for Himawari 7, MSC performs five-minute-interval rapid scan observations in summer to provide timely cumulus cloud information to aviation operators.
The above pictures show sequential visible images captured by Himawari 6 rapid scan observation, and the figure below shows a schematic diagram of a single-cell thunderstorm passing through the stages of development, maturity and dissipation. In the pictures, quickly developing cumulus clouds are observed from the development stage to the mature stage, during which the nominal observation at 30-minute intervals cannot capture the process in detail. Such rapidly developing cumulus clouds yield severe phenomena such as intense rain, thunder, downbursts and tornados, which can be hazardous to airplanes – particularly when they are taking off or landing. Implementing Himawari 6 rapid scan observation in summer allows MSC to provide aviation operators with observation images and cumulus analysis images to support flight safety.
Visible image at 9 JST on 20 September, 2011
Himawari 6 rapid scan images on 11 July, 2011
14:10 14:25 14:40 14:50 15:10
MONITORING METEOROLOGICAL PHENOMENA FROM SPACEUtilization of Cloud Imagery
1. Typhoon Monitoring
Typhoons usually form over tropical ocean areas far south of Japan. As ground-based observation islimited to land areas and does not cover maritime regions, the typhoon observation informationprovided by Himawari is particularly valuable.
The picture below was captured by Himawari 7 at 9 JST on 20 September, 2011, and showsTyphoon T1115 (ROKE) approaching mainland Japan. Analysis using satellite images and otherobservation data showed that the typhoon had a central pressure of 940 hPa and maximum windspeeds of 40 m/s at the time.
Schematic diagram of a single-cell thunderstorm(Chisholm, A. J. and J. H. Renick, 1972)
15
12
9
6
3
km
Development Stage
Maturity stage Dissipation stage
TIME, MIN
20km0
0 10 15 20 25 30
HT 103ft
10
20
30
40
13

2. Rapid Scan Observation
Himawari can capture images over a small area at short intervals thanks to a function known as rapid scan observation. Using Himawari 6, which currently serves as the back-up satellite for Himawari 7, MSC performs five-minute-interval rapid scan observations in summer to provide timely cumulus cloud information to aviation operators.
The above pictures show sequential visible images captured by Himawari 6 rapid scan observation, and the figure below shows a schematic diagram of a single-cell thunderstorm passing through the stages of development, maturity and dissipation. In the pictures, quickly developing cumulus clouds are observed from the development stage to the mature stage, during which the nominal observation at 30-minute intervals cannot capture the process in detail. Such rapidly developing cumulus clouds yield severe phenomena such as intense rain, thunder, downbursts and tornados, which can be hazardous to airplanes – particularly when they are taking off or landing. Implementing Himawari 6 rapid scan observation in summer allows MSC to provide aviation operators with observation images and cumulus analysis images to support flight safety.
Visible image at 9 JST on 20 September, 2011
Himawari 6 rapid scan images on 11 July, 2011
14:10 14:25 14:40 14:50 15:10
MONITORING METEOROLOGICAL PHENOMENA FROM SPACEUtilization of Cloud Imagery
1. Typhoon Monitoring
Typhoons usually form over tropical ocean areas far south of Japan. As ground-based observation islimited to land areas and does not cover maritime regions, the typhoon observation informationprovided by Himawari is particularly valuable.
The picture below was captured by Himawari 7 at 9 JST on 20 September, 2011, and showsTyphoon T1115 (ROKE) approaching mainland Japan. Analysis using satellite images and otherobservation data showed that the typhoon had a central pressure of 940 hPa and maximum windspeeds of 40 m/s at the time.
Schematic diagram of a single-cell thunderstorm(Chisholm, A. J. and J. H. Renick, 1972)
15
12
9
6
3
km
Development Stage
Maturity stage Dissipation stage
TIME, MIN
20km0
0 10 15 20 25 30
HT 103ft
10
20
30
40
14

Weather chart (left) and infrared image (right) at 9 JST on 5 January, 2011
Infrared image at 15 JST on 29 July, 2011
Infrared image at 6 JST on 30 July, 2011
Visible image12 JST, 1 January, 2011
3. Severe Weather Monitoring
Localized torrential rainfall in the warm season and heavy snowfall in winter are typical extremeweather events in Japan. By capturing cloud images from space, Himawari can provide moreinformation on such phenomena than the ground-based rain radar network. Its images contribute tothe analysis and forecasting of these extreme conditions, allowing warnings and advisories to beissued as appropriate.
Localized Torrential RainThe pictures below show Himawari 7 images of clouds depositing torrential rain over middle andnorthern parts of Japan. From 27 to 30 July, 2011, a front remained over the area stretching fromthe Korean Peninsula to the Sea of Japan and on to the middle of Japan. It was strengthened bywarm and wet air flowing from the south, and brought torrential rains to the area.
Heavy SnowfallOn 1 January, 2011, heavy snow fell over the area facing the Sea of Japan, causing widespreaddisturbance to trains and on roads.
4. Depression Monitoring
Cloud images captured by Himawari clearly show depression structures, which vary with the stage ofdevelopment. Water vapor images also show upper-air flow, which is closely related to thedevelopment of depressions. These images contribute to depression analysis and support theappropriate issuance of related weather information.
The infrared Himawari image below shows a significantly developed depression to the east of Japan.This type of quickly developing depression is occasionally observed around the country.
5. Sea Fog and Low Cloud Watch
Himawari 6 and 7 capture infraredimages in the 3.8-μm band, whichshows sea fog and low-level cloudmore clearly than those in the 10.8-μm band at night. These imagescontribute to the safety of maritimenavigation.
Enhanced infrared image at 3 JSTon 6 May, 2011, showing sea fogand low cloud over the sea aroundthe northern Japan.
6. Sea Ice Watch
Sea ice information is important for safety inmaritime travel and fisheries. The distribution andmovement of sea ice can be observed using imagesfrom Himawari and polar-orbiting satellites. Thefigure on the left shows sea ice movement asdetermined from Himawari visible images.
visible image at 13 JST on 22 February,2011, with sea ice movement vectors.
15

Weather chart (left) and infrared image (right) at 9 JST on 5 January, 2011
Infrared image at 15 JST on 29 July, 2011
Infrared image at 6 JST on 30 July, 2011
Visible image12 JST, 1 January, 2011
3. Severe Weather Monitoring
Localized torrential rainfall in the warm season and heavy snowfall in winter are typical extremeweather events in Japan. By capturing cloud images from space, Himawari can provide moreinformation on such phenomena than the ground-based rain radar network. Its images contribute tothe analysis and forecasting of these extreme conditions, allowing warnings and advisories to beissued as appropriate.
Localized Torrential RainThe pictures below show Himawari 7 images of clouds depositing torrential rain over middle andnorthern parts of Japan. From 27 to 30 July, 2011, a front remained over the area stretching fromthe Korean Peninsula to the Sea of Japan and on to the middle of Japan. It was strengthened bywarm and wet air flowing from the south, and brought torrential rains to the area.
Heavy SnowfallOn 1 January, 2011, heavy snow fell over the area facing the Sea of Japan, causing widespreaddisturbance to trains and on roads.
4. Depression Monitoring
Cloud images captured by Himawari clearly show depression structures, which vary with the stage ofdevelopment. Water vapor images also show upper-air flow, which is closely related to thedevelopment of depressions. These images contribute to depression analysis and support theappropriate issuance of related weather information.
The infrared Himawari image below shows a significantly developed depression to the east of Japan.This type of quickly developing depression is occasionally observed around the country.
5. Sea Fog and Low Cloud Watch
Himawari 6 and 7 capture infraredimages in the 3.8-μm band, whichshows sea fog and low-level cloudmore clearly than those in the 10.8-μm band at night. These imagescontribute to the safety of maritimenavigation.
Enhanced infrared image at 3 JSTon 6 May, 2011, showing sea fogand low cloud over the sea aroundthe northern Japan.
6. Sea Ice Watch
Sea ice information is important for safety inmaritime travel and fisheries. The distribution andmovement of sea ice can be observed using imagesfrom Himawari and polar-orbiting satellites. Thefigure on the left shows sea ice movement asdetermined from Himawari visible images.
visible image at 13 JST on 22 February,2011, with sea ice movement vectors.
16
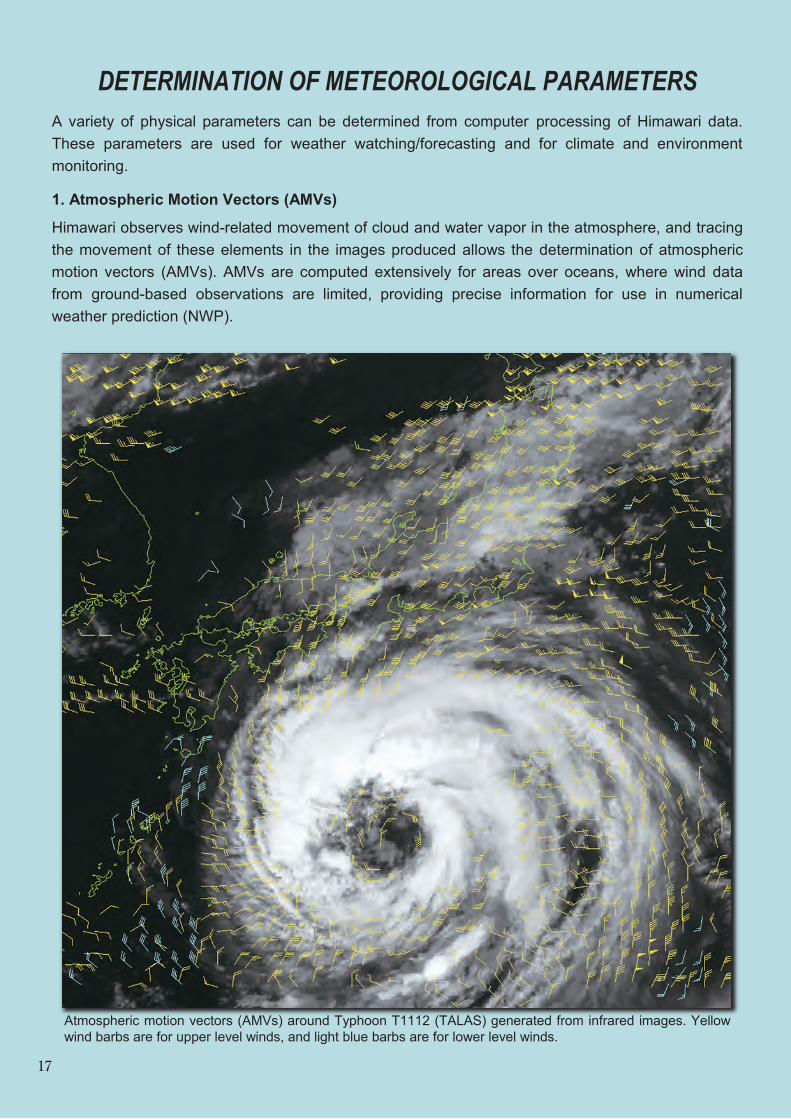
A variety of physical parameters can be determined from computer processing of Himawari data. These parameters are used for weather watching/forecasting and for climate and environment monitoring.
1. Atmospheric Motion Vectors (AMVs)
Himawari observes wind-related movement of cloud and water vapor in the atmosphere, and tracing the movement of these elements in the images produced allows the determination of atmospheric motion vectors (AMVs). AMVs are computed extensively for areas over oceans, where wind data from ground-based observations are limited, providing precise information for use in numerical weather prediction (NWP).
Atmospheric motion vectors (AMVs) around Typhoon T1112 (TALAS) generated from infrared images. Yellow wind barbs are for upper level winds, and light blue barbs are for lower level winds.
DETERMINATION OF METEOROLOGICAL PARAMETERS 2. Satellite Cloud Information Charts (SCICs)
Satellite cloud information charts (SCICs) are created based on computer analysis of Himawari imagery. The chart below shows the results of analysis for variables such as cloud distribution, cloud height, subsidence areas and distinct boundaries. SCICs are provided to aviation operators and JMA’s domestic aviation weather offices for use in safe flight planning.
Infrared image at 11 JST on 12 September, 2011 Satellite Cloud Information Chart
Cloud type Amount of upper level cloud Amount of convective cloud
Total cloud amount Cloud top heightInfrared image
3. Cloud Grid Information (CGI)
Cloud grid information (CGI) is presented in the form of charts showing classified cloud data. It isused as a basis for objective analysis to support forecasters in monitoring weather conditions andcreating forecasts.
17

A variety of physical parameters can be determined from computer processing of Himawari data. These parameters are used for weather watching/forecasting and for climate and environment monitoring.
1. Atmospheric Motion Vectors (AMVs)
Himawari observes wind-related movement of cloud and water vapor in the atmosphere, and tracing the movement of these elements in the images produced allows the determination of atmospheric motion vectors (AMVs). AMVs are computed extensively for areas over oceans, where wind data from ground-based observations are limited, providing precise information for use in numerical weather prediction (NWP).
Atmospheric motion vectors (AMVs) around Typhoon T1112 (TALAS) generated from infrared images. Yellow wind barbs are for upper level winds, and light blue barbs are for lower level winds.
DETERMINATION OF METEOROLOGICAL PARAMETERS 2. Satellite Cloud Information Charts (SCICs)
Satellite cloud information charts (SCICs) are created based on computer analysis of Himawari imagery. The chart below shows the results of analysis for variables such as cloud distribution, cloud height, subsidence areas and distinct boundaries. SCICs are provided to aviation operators and JMA’s domestic aviation weather offices for use in safe flight planning.
Infrared image at 11 JST on 12 September, 2011 Satellite Cloud Information Chart
Cloud type Amount of upper level cloud Amount of convective cloud
Total cloud amount Cloud top heightInfrared image
3. Cloud Grid Information (CGI)
Cloud grid information (CGI) is presented in the form of charts showing classified cloud data. It isused as a basis for objective analysis to support forecasters in monitoring weather conditions andcreating forecasts.
18

Visible image at 15 JST, 1 May, 2011. The gray and opaque areas around the Yellow sea and the Korean Peninsula show yellow sand.
Yellow sand areas analyzed by using two infrared images.
Infrared image (left) and infrared differential image (right) at 12 JST on 27 January, 2011
Aerosol optical depth retrieved from a visible image.
4. Yellow Sand Monitoring
The appearance of yellow sand in the atmosphere is a phenomenon typically seen in spring,when sand dust blown into upper atmosphere in continental Asian deserts is carried to Japan onstrong westerly winds. The sand can soil laundry hanging outside and cloud the windows of carsand houses, and sometimes even causes traffic disturbances on high-volume days. Thedistribution and density of yellow sand are determined from Himawari visible and infraredimages.
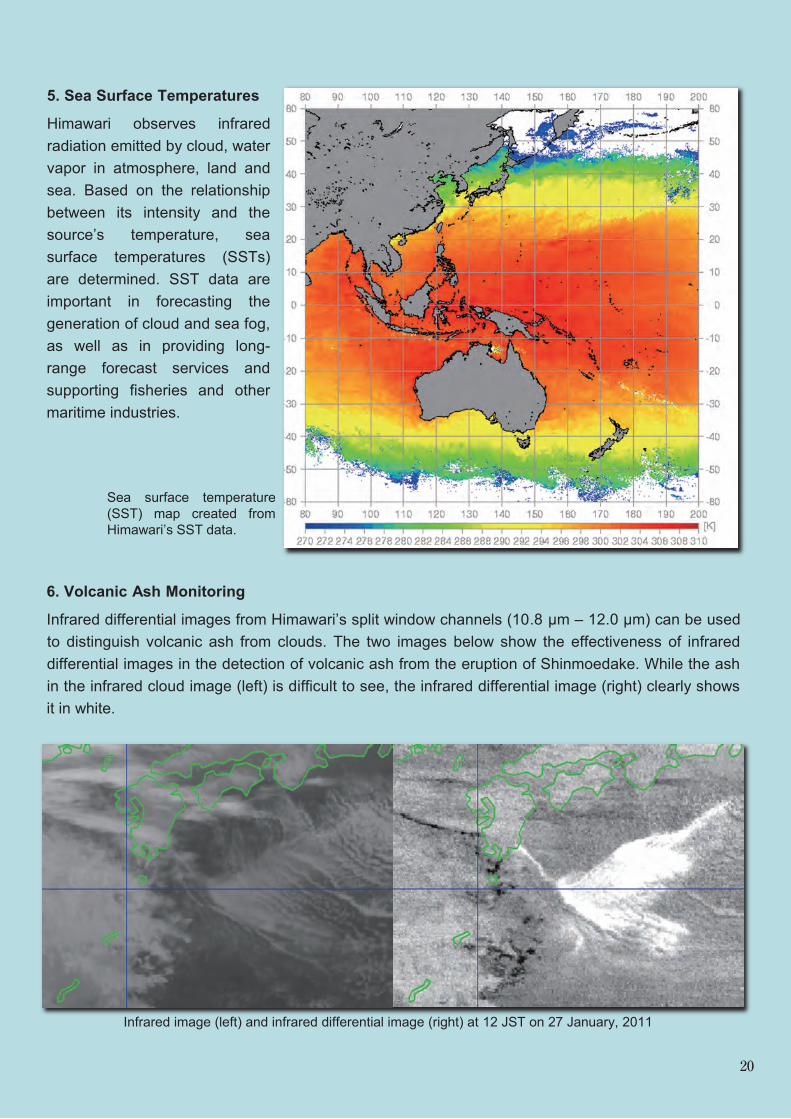
5. Sea Surface Temperatures
Himawari observes infraredradiation emitted by cloud, watervapor in atmosphere, land andsea. Based on the relationshipbetween its intensity and thesource’s temperature, seasurface temperatures (SSTs)are determined. SST data areimportant in forecasting thegeneration of cloud and sea fog,as well as in providing long-range forecast services andsupporting fisheries and othermaritime industries.
6. Volcanic Ash Monitoring
Infrared differential images from Himawari’s split window channels (10.8 μm – 12.0 μm) can be usedto distinguish volcanic ash from clouds. The two images below show the effectiveness of infrareddifferential images in the detection of volcanic ash from the eruption of Shinmoedake. While the ashin the infrared cloud image (left) is difficult to see, the infrared differential image (right) clearly showsit in white.
Sea surface temperature(SST) map created fromHimawari’s SST data.
19
Visible image at 15 JST, 1 May, 2011. The gray and opaque areas around the Yellow sea and the Korean Peninsula show yellow sand.
Yellow sand areas analyzed by using two infrared images.
Infrared image (left) and infrared differential image (right) at 12 JST on 27 January, 2011
Aerosol optical depth retrieved from a visible image.
4. Yellow Sand Monitoring
The appearance of yellow sand in the atmosphere is a phenomenon typically seen in spring,when sand dust blown into upper atmosphere in continental Asian deserts is carried to Japan onstrong westerly winds. The sand can soil laundry hanging outside and cloud the windows of carsand houses, and sometimes even causes traffic disturbances on high-volume days. Thedistribution and density of yellow sand are determined from Himawari visible and infraredimages.
5. Sea Surface Temperatures
Himawari observes infraredradiation emitted by cloud, watervapor in atmosphere, land andsea. Based on the relationshipbetween its intensity and thesource’s temperature, seasurface temperatures (SSTs)are determined. SST data areimportant in forecasting thegeneration of cloud and sea fog,as well as in providing long-range forecast services andsupporting fisheries and othermaritime industries.
6. Volcanic Ash Monitoring
Infrared differential images from Himawari’s split window channels (10.8 μm – 12.0 μm) can be usedto distinguish volcanic ash from clouds. The two images below show the effectiveness of infrareddifferential images in the detection of volcanic ash from the eruption of Shinmoedake. While the ashin the infrared cloud image (left) is difficult to see, the infrared differential image (right) clearly showsit in white.
Sea surface temperature(SST) map created fromHimawari’s SST data.
20

DATA COLLECTION SYSTEMIn addition to its earth observation and imagery data dissemination functions, Himawari also gathers observation data from data collection platforms (DCPs) on the ground via the data collection system (DCS).
DCP facilities include automated remote weather stations, tide/tsunami gauges and observation equipment on ships. Himawari collects data transmitted by DCPs within the range of satellite communication ability and relays them to CDAS, which in turn demodulates the information and sends it to MSC. The Center then processes the data and transmits the results to DCP operators, users and international organizations via the Global Telecommunication System (GTS). As of March 2012, Himawari collected data from about 200 DCPs.
Using the DCS, Himawari collects seismic intensity data from around 430 earthquake observation sites all over Japan as back-up to the landline network. These data are used for JMA’searthquake monitoring activities.
Communication range of MTSAT-DCS
INTERNATIONAL ACTIVITIESAs a component of the space-based Global Observing System (GOS), MSC/JMA provides Himawari cloud observation images of the area over the Asia and western Pacific regions to users outside Japan via satellite and landlines. To support users, MSC sends data onHimawari’s operation schedule via the satellite. Information on related plans and the operational status of the satellite and the DCS is also published on the MSC website (http://mscweb.kishou.go.jp/).
To lend further support, MSC/JMA also participates in international conferences to provide users with the latest information on Himawari and related plans.
Website of Meteorological Satellite Centerhttp://mscweb.kishou.go.jp/
Distribution of DCPs
The 2nd Asia/Oceania Meteorological Satellite Users Conference, Tokyo, 6–9 December, 2011
Ships
Islands Command and Data Acquisition Station
MeteorologicalSatellite Center
Japan Meteorological Agency
Seismic Intensity Gauge(Local Meteorological
Observatory, etc.)
Meteorological observation data
MTSAT
80E60N
40N
20N
20S
40S
60S
EQ
120E 160E 160W
21

DATA COLLECTION SYSTEMIn addition to its earth observation and imagery data dissemination functions, Himawari also gathers observation data from data collection platforms (DCPs) on the ground via the data collection system (DCS).
DCP facilities include automated remote weather stations, tide/tsunami gauges and observation equipment on ships. Himawari collects data transmitted by DCPs within the range of satellite communication ability and relays them to CDAS, which in turn demodulates the information and sends it to MSC. The Center then processes the data and transmits the results to DCP operators, users and international organizations via the Global Telecommunication System (GTS). As of March 2012, Himawari collected data from about 200 DCPs.
Using the DCS, Himawari collects seismic intensity data from around 430 earthquake observation sites all over Japan as back-up to the landline network. These data are used for JMA’searthquake monitoring activities.
Communication range of MTSAT-DCS
INTERNATIONAL ACTIVITIESAs a component of the space-based Global Observing System (GOS), MSC/JMA provides Himawari cloud observation images of the area over the Asia and western Pacific regions to users outside Japan via satellite and landlines. To support users, MSC sends data onHimawari’s operation schedule via the satellite. Information on related plans and the operational status of the satellite and the DCS is also published on the MSC website (http://mscweb.kishou.go.jp/).
To lend further support, MSC/JMA also participates in international conferences to provide users with the latest information on Himawari and related plans.
Website of Meteorological Satellite Centerhttp://mscweb.kishou.go.jp/
Distribution of DCPs
The 2nd Asia/Oceania Meteorological Satellite Users Conference, Tokyo, 6–9 December, 2011
Ships
Islands Command and Data Acquisition Station
MeteorologicalSatellite Center
Japan Meteorological Agency
Seismic Intensity Gauge(Local Meteorological
Observatory, etc.)
Meteorological observation data
MTSAT
80E60N
40N
20N
20S
40S
60S
EQ
120E 160E 160W
22

Japan’s first geostationary meteoro-logical satellite (GMS), known as Himawari, was launched in 1977 from Cape Canaveral in Florida.
GMSGMS--33((HimawariHimawari 3)3)
GMSGMS--55(Himawari 5)(Himawari 5)
MTSATMTSAT--1R1R(Himawari 6)(Himawari 6)
HimawariHimawari--8, 98, 9(planned)
For more than 30 years, the Himawari satellite series has contributed to weather watching, disaster prevention and climate/environment monitoring by providing earth observation images.
GMSGMS(Himawari)(Himawari)
MTSATMTSAT--22(Himawari 7)(Himawari 7)
GMSGMS--44(Himawari 4)(Himawari 4)
* From May 2003 to June 2005, JMA rented the GOES-9 satellite from the National Oceanic and Atmospheric Administration (NOAA) for observation of the western Pacific region to fill the gap between the operational periods of Himawari-5 and Himawari-6.
Satellites Period of imaging operation
Himawari GMS 1977~1981
Himawari 2 GMS-2 1981~1984
Himawari 3 GMS-3 1984~1989
Himawari 4 GMS-4 1989~1995
Himawari 5 GMS-5 1995~2003
Pacific GOES GOES-9* 2003~2005
Himawari 6 MTSAT-1R 2005~2010
Himawari 7 MTSAT-2 2010~
HISTORY OF HIMAWARIHISTORY OF HIMAWARI
GMSGMS--22(Himawari 2)(Himawari 2)
23

Japan’s first geostationary meteoro-logical satellite (GMS), known as Himawari, was launched in 1977 from Cape Canaveral in Florida.
GMSGMS--33((HimawariHimawari 3)3)
GMSGMS--55(Himawari 5)(Himawari 5)
MTSATMTSAT--1R1R(Himawari 6)(Himawari 6)
HimawariHimawari--8, 98, 9(planned)
For more than 30 years, the Himawari satellite series has contributed to weather watching, disaster prevention and climate/environment monitoring by providing earth observation images.
GMSGMS(Himawari)(Himawari)
MTSATMTSAT--22(Himawari 7)(Himawari 7)
GMSGMS--44(Himawari 4)(Himawari 4)
* From May 2003 to June 2005, JMA rented the GOES-9 satellite from the National Oceanic and Atmospheric Administration (NOAA) for observation of the western Pacific region to fill the gap between the operational periods of Himawari-5 and Himawari-6.
Satellites Period of imaging operation
Himawari GMS 1977~1981
Himawari 2 GMS-2 1981~1984
Himawari 3 GMS-3 1984~1989
Himawari 4 GMS-4 1989~1995
Himawari 5 GMS-5 1995~2003
Pacific GOES GOES-9* 2003~2005
Himawari 6 MTSAT-1R 2005~2010
Himawari 7 MTSAT-2 2010~
HISTORY OF HIMAWARIHISTORY OF HIMAWARI
GMSGMS--22(Himawari 2)(Himawari 2)
24

HISTORY OF METEOROLOGICAL SATELLITE CENTER
ABBREVIATIONS
ORGANIZATION
Year Date Outline1950 15-Jul The Meteorological Communication Center was moved to Kiyose.1968 20-Aug Reception of the Automatic Picture Transmission (APT) data from the polar orbiting satellite ESSA-6
(U.S.) was started.16-Apr Meteorological Satellite Planning Division was established in JMA’s headquarters.
1974 1-Mar Reception of the VHRR data from the polar-orbiting satellite ITOS-D (NOAA-2, U.S.) was started. Data from NOAA satellites have been received since then.
1976 1-Mar The building of the Meteorological Satellite Center (MSC) was constructed.8-Mar The building of Command and Data Acquisition Station (CDAS) was constructed.
22-Mar Computer system for both satellite control and data processing was put into operation.1-May The Preparatory Office for Meteorological Satellite Center was established.
1977 1-Apr MSC was established as an auxiliary organ of the JMA.14-Jul The first Geostationary Meteorological Satellite (GMS) was launched from Cape Canaveral in Florida,
U.S. at 19:39 (JST). 18-Jul GMS was nicknamed “Himawari”.8-Sep The first earth imagery of GMS was captured.4-Nov GMS was transferred from the National Space Development Agency of Japan (NASDA) to JMA.
1978 6-Apr GMS started full operations capturing full disk images three-hourly and disseminating facsimile pictures.
1981 1-Apr Retrieval of atmospheric vertical profile data from the polar orbiting meteorological satellite TIROS-N (U.S.) was started.
11-Aug GMS-2 (Himawari 2) was launched from the Tanegashima Space Center of the NASDA in Kagoshima Prefecture, Japan at 05:03 (JST).
21-Dec Full operations of GMS-2 were started.1983 1-Jul Provision of Himawari data to the International Satellite Cloud Climatology Project (ISCCP) was
started.1984 1-Jul Provision of typhoon analysis reports (SAREP) was started.
3-Aug GMS-3 (Himawari 3) was launched from the Tanegashima Space Center at 05:30 (JST).27-Sep Full operations of GMS-3 were started.
1987 1-Mar Operation of new computer system was started. Concurrently, hourly northern hemisphere half disk observations in addition to the three-hourly full disk observations and generation of new products such as Satellite Cloud Information Charts (SCICs) were started.
1988 1-Jan Provision of Himawari data to the Global Precipitation Climate Project (GPCP) was started.1-Apr Dissemination of stretched VISSR (S-VISSR) data from Himawari was started.
1989 5-Jan Operation of hourly full disk observations was started.6-Sep GMS-4 (Himawari 4) was launched from the Tanegashima Space Center at 04:11 (JST).
14-Dec Full operations of GMS-4 was started.1994 1-Mar Provision of SCICs was augmented to hourly from three-hourly.
1-Apr Operation of the Simultaneous Satellite Communication System for Emergency Information was started.
1995 18-Mar GMS-5 (Himawari 5) was launched from the Tanegashima Space Center at 17:01 (JST).14-Jun Operation of new computer system was started. SCIC was renamed Satellite Cloud Analysis Chart
(SCAC).15-Jun Data reception from two NOAA satellites was started.21-Jun Full operations of GMS-5 were started.30-Jun The second MSC building was constructed.
1996 1-Apr Operation of the Seismic Intensity data Conversion System was started.1999 15-Nov The launch of MTSAT from the Tanegashima Space on a H-II launch vehicle at 16:29 (JST) was failed,
due to the problem of the vehicle.2002 2-Dec Landline dissemination for the back-up of satellite dissemination was started.2003 22-May Back-up operation by GOES-9 was started.2005 26-Feb MTSAT-1R (Himawari 6) was launched from the Tanegashima Space Center of the JAXA (successor
organization to the NASDA) at 18:25 (JST).1-Mar Operation of new computer system was started.
29-Mar Provision of SCACs over the southern hemisphere was started.28-Jun Full operation of MTSAT-1R started.
2006 18-Feb MTSAT-2 was launched from the Tanegashima Space Center at 15:27 (JST).4-Sep Operation of MTSAT-2 (Himawari 7) as back-up of MTSAT-1R was started.
2007 25-May Reception of Metop-A (Europe) was started.2008 12-Mar Dissemination of HiRID and WEFAX was discontinued.2010 1-Jul Operation of earth imaging by MTSAT-2 was started, and MTSAT-1R was put into the back-up
satellite of MTSAT-2.20-Aug New tower with an antenna to receive polar-orbiting satellite data was installed.
2011 7-Jun Operation of MTSAT-1R rapid scan observation was started.26-Dec The third MSC building was constructed.
CDAS Command and Data Acquisition StationDCP Data Collection PlatformDCS Data Collection SystemDPC Data Processing CenterEOC Earth Observation Center (JAXA)
ESSA Environmental Science Services Administration SatelliteEUMETSAT European Organization for the Exploitation of Meteorological SatellitesGMS Geostationary Meteorological SatelliteGOES Geostationary Operational Environmental Satellite (NOAA)GPCP Global Precipitation Climatology Project
GTS Global Telecommunication SystemHiRID High Resolution Imager DataHRIT High Rate Information TransmissionIR-image Infrared-imageISCCP International Satellite Cloud Climatology Project
JAXA Japan Aerospace Exploration AgencyLRIT Low Rate Information TransmissionMETEOSAT Geostationary Meteorological Satellite (EUMETSAT)Metop Meteorological Operational Polar Satellite (EUMETSAT)MTSAT Multi-functional Transport Satellite
NOAA National Oceanic and Atmospheric Administration (U.S.)SAREP Report on tropical cyclone analysis using satellite imageryVIS-image Visible-imageVISSR Visible and Infrared Spin Scan RadiometerWEFAX Weather Facsimile
WMO World Meteorological OrganizationWV-image Water Vapor-imageWWW World Weather Watch
System EngineeringDivision
Data Processing Department
Data Processing Division
Analysis Division
Satellite ControlDivision
Facilities Division
Communication Department
First CommunicationDivision
Second CommunicationDivision
Command and DataAcquisition Station
Administration Division
Administration Department
Finance andAccounting Division
Meteorological Satellite Center
Japan Meteorological Agency
(in Hatoyama-machi, Saitama)
25

Himawari 2 (GMS-2)(06 UTC, 21 December, 1981)
As weather affects agriculture, industry, transportation and everyday activities, it has a significant influence on people’s lives. The Himawari geostationary meteorological satellite carries an imaging sensor that continuously captures images of the earth over the western Pacific region from space day and night. These images provide information on clouds, the atmosphere and land/sea surfaces, and are used for weather analysis, weather forecasting and climate/environment monitoring. Himawaricontributes in particular to the prevention and mitigation of disasters by providing the images to be used for advance warning of potentially devastating phenomena such as typhoons, thunderstorms, strong winds, torrential rains and heavy snow.
SPACE-BASED GLOBAL OBSERVING SYSTEM 1HIMAWARI AND ITS FUNCTIONS 3GEOSTATIONARY METEOROLOGICAL SATELLITE SYSTEM 5RADIO TELECOMMUNICATIONS WITH HIMAWARI 7COMPUTER SYSTEM TO PROCESS SATELLITE DATA 9DISSEMINATION OF IMAGERY DATA 11MONITORING METEOROLOGICAL PHENOMENA FROM SPACE 13DETERMINATION OF METEOROLOGICAL PARAMETERS 17DATA COLLECTION SYSTEM 21INTERNATIONAL ACTIVITIES 22HISTORY OF HIMAWARI 23HISTORY OF METEOROLOGICAL SATELLITE CENTER 25ORGANIZATION, ABBREVIATIONS 26
CONTENTS
Himawari (GMS)(00 UTC, 6 April, 1978)
Himawari 3 (GMS-3)(06 UTC, 27 September, 1984)
Himawari 7 (MTSAT-2)(03 UTC, 1 July, 2010)
Himawari 4 (GMS-4)(00 UTC, 14 December, 1989)
Himawari 5 (GMS-5)(00 UTC, 21 June, 1995)
Himawari 6 (MTSAT-1R)(03 UTC, 28 June, 2005)
FIRST OPERATIONAL IMAGES OF HIMAWARIHISTORY OF METEOROLOGICAL SATELLITE CENTER
ABBREVIATIONS
ORGANIZATION
Year Date Outline1950 15-Jul The Meteorological Communication Center was moved to Kiyose.1968 20-Aug Reception of the Automatic Picture Transmission (APT) data from the polar orbiting satellite ESSA-6
(U.S.) was started.16-Apr Meteorological Satellite Planning Division was established in JMA’s headquarters.
1974 1-Mar Reception of the VHRR data from the polar-orbiting satellite ITOS-D (NOAA-2, U.S.) was started. Data from NOAA satellites have been received since then.
1976 1-Mar The building of the Meteorological Satellite Center (MSC) was constructed.8-Mar The building of Command and Data Acquisition Station (CDAS) was constructed.
22-Mar Computer system for both satellite control and data processing was put into operation.1-May The Preparatory Office for Meteorological Satellite Center was established.
1977 1-Apr MSC was established as an auxiliary organ of the JMA.14-Jul The first Geostationary Meteorological Satellite (GMS) was launched from Cape Canaveral in Florida,
U.S. at 19:39 (JST). 18-Jul GMS was nicknamed “Himawari”.8-Sep The first earth imagery of GMS was captured.4-Nov GMS was transferred from the National Space Development Agency of Japan (NASDA) to JMA.
1978 6-Apr GMS started full operations capturing full disk images three-hourly and disseminating facsimile pictures.
1981 1-Apr Retrieval of atmospheric vertical profile data from the polar orbiting meteorological satellite TIROS-N (U.S.) was started.
11-Aug GMS-2 (Himawari 2) was launched from the Tanegashima Space Center of the NASDA in Kagoshima Prefecture, Japan at 05:03 (JST).
21-Dec Full operations of GMS-2 were started.1983 1-Jul Provision of Himawari data to the International Satellite Cloud Climatology Project (ISCCP) was
started.1984 1-Jul Provision of typhoon analysis reports (SAREP) was started.
3-Aug GMS-3 (Himawari 3) was launched from the Tanegashima Space Center at 05:30 (JST).27-Sep Full operations of GMS-3 were started.
1987 1-Mar Operation of new computer system was started. Concurrently, hourly northern hemisphere half disk observations in addition to the three-hourly full disk observations and generation of new products such as Satellite Cloud Information Charts (SCICs) were started.
1988 1-Jan Provision of Himawari data to the Global Precipitation Climate Project (GPCP) was started.1-Apr Dissemination of stretched VISSR (S-VISSR) data from Himawari was started.
1989 5-Jan Operation of hourly full disk observations was started.6-Sep GMS-4 (Himawari 4) was launched from the Tanegashima Space Center at 04:11 (JST).
14-Dec Full operations of GMS-4 was started.1994 1-Mar Provision of SCICs was augmented to hourly from three-hourly.
1-Apr Operation of the Simultaneous Satellite Communication System for Emergency Information was started.
1995 18-Mar GMS-5 (Himawari 5) was launched from the Tanegashima Space Center at 17:01 (JST).14-Jun Operation of new computer system was started. SCIC was renamed Satellite Cloud Analysis Chart
(SCAC).15-Jun Data reception from two NOAA satellites was started.21-Jun Full operations of GMS-5 were started.30-Jun The second MSC building was constructed.
1996 1-Apr Operation of the Seismic Intensity data Conversion System was started.1999 15-Nov The launch of MTSAT from the Tanegashima Space on a H-II launch vehicle at 16:29 (JST) was failed,
due to the problem of the vehicle.2002 2-Dec Landline dissemination for the back-up of satellite dissemination was started.2003 22-May Back-up operation by GOES-9 was started.2005 26-Feb MTSAT-1R (Himawari 6) was launched from the Tanegashima Space Center of the JAXA (successor
organization to the NASDA) at 18:25 (JST).1-Mar Operation of new computer system was started.
29-Mar Provision of SCACs over the southern hemisphere was started.28-Jun Full operation of MTSAT-1R started.
2006 18-Feb MTSAT-2 was launched from the Tanegashima Space Center at 15:27 (JST).4-Sep Operation of MTSAT-2 (Himawari 7) as back-up of MTSAT-1R was started.
2007 25-May Reception of Metop-A (Europe) was started.2008 12-Mar Dissemination of HiRID and WEFAX was discontinued.2010 1-Jul Operation of earth imaging by MTSAT-2 was started, and MTSAT-1R was put into the back-up
satellite of MTSAT-2.20-Aug New tower with an antenna to receive polar-orbiting satellite data was installed.
2011 7-Jun Operation of MTSAT-1R rapid scan observation was started.26-Dec The third MSC building was constructed.
CDAS Command and Data Acquisition StationDCP Data Collection PlatformDCS Data Collection SystemDPC Data Processing CenterEOC Earth Observation Center (JAXA)
ESSA Environmental Science Services Administration SatelliteEUMETSAT European Organization for the Exploitation of Meteorological SatellitesGMS Geostationary Meteorological SatelliteGOES Geostationary Operational Environmental Satellite (NOAA)GPCP Global Precipitation Climatology Project
GTS Global Telecommunication SystemHiRID High Resolution Imager DataHRIT High Rate Information TransmissionIR-image Infrared-imageISCCP International Satellite Cloud Climatology Project
JAXA Japan Aerospace Exploration AgencyLRIT Low Rate Information TransmissionMETEOSAT Geostationary Meteorological Satellite (EUMETSAT)Metop Meteorological Operational Polar Satellite (EUMETSAT)MTSAT Multi-functional Transport Satellite
NOAA National Oceanic and Atmospheric Administration (U.S.)SAREP Report on tropical cyclone analysis using satellite imageryVIS-image Visible-imageVISSR Visible and Infrared Spin Scan RadiometerWEFAX Weather Facsimile
WMO World Meteorological OrganizationWV-image Water Vapor-imageWWW World Weather Watch
System EngineeringDivision
Data Processing Department
Data Processing Division
Analysis Division
Satellite ControlDivision
Facilities Division
Communication Department
First CommunicationDivision
Second CommunicationDivision
Command and DataAcquisition Station
Administration Division
Administration Department
Finance andAccounting Division
Meteorological Satellite Center
Japan Meteorological Agency
(in Hatoyama-machi, Saitama)
26