satellite imagery and an abs methodology for predicting...
TRANSCRIPT
Satellite Imagery and an ABS Methodology for Predicting Crop Yields Dr Siu-Ming Tam Chief Methodologist Global WG on Big Data Beijing, China October, 2014
-
1
Outline
Caveats
I. Expert?
II. Methodology
Two parts of the talk
I. Satellite Imagery basics
II. An ABS application
2

Part I
Some views on Big Data
Satellite imagery basics
Challenges
Partners
3

Types of satellites
A satellite is an object that moves around a larger object
• Earth around the sun
Human made satellites
• Revolves around the earth to collect info and communicates back to earth
• About 3,000 operating in earth orbit
Source: Sam Batzil, WisconsinView.org
4

Types of satellites
Weather and atmosphere monitoring (e.g. GOES_R)
Earth observation and mapping (e.g. Landsat7)
Astronomical and Planetary Exploration
Communication
Navigation (GPS)
Military
Sensors are instruments that record solar, radar or laser radiation signals from reflection of earth objects.
Source: Sam Batzil, WisconsinView.org
5

Satellite imagery data basics
6
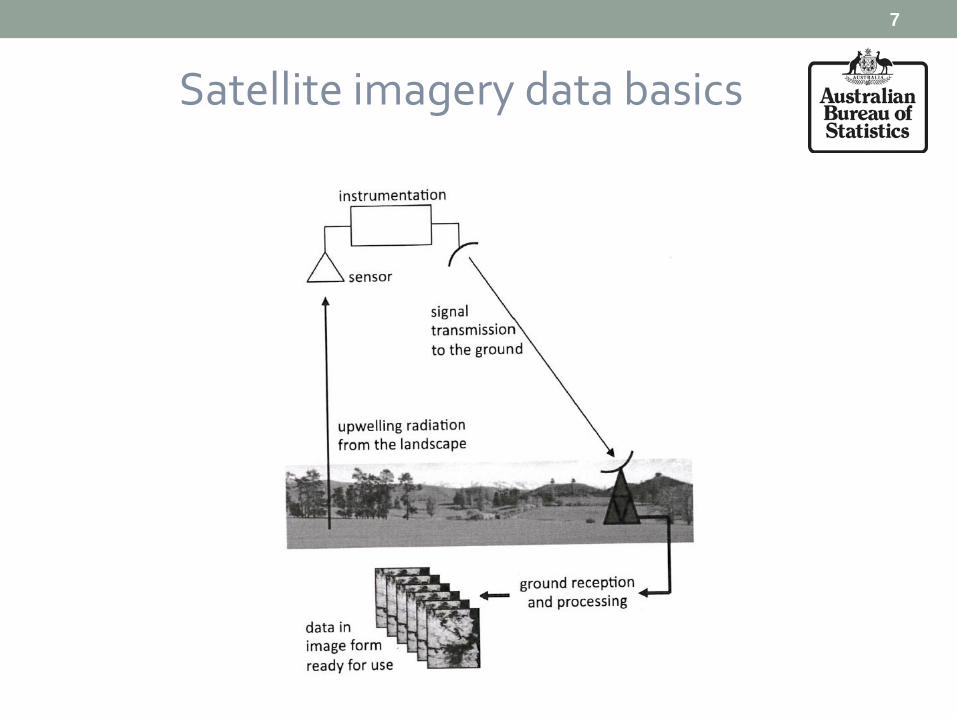
Satellite imagery data basics
7

The Landsat Data Cube | Locate 2014
Satellite Images: Not just ‘photos’

The Landsat Data Cube | Locate 2014
Not just ‘photos’

Satellite imagery data 101
10

Band designations for LandSat 7 & LandSat 8
Multispectral data rather than hyperspectral data
We are currently using LandSat 7 data
11

Landsat 7 launched in April, 1999 to refresh satellite photos of the world
Imagery available once every 16 days per pixel (25m * 25m) covering the globe
Each pixel has 7 reflectance (or radiance)
Images may be downloaded free of charge from US Geological Survey (http://earthexplorer.usgs.gov/)
In May, 2003 Scan Line Corrector failure led to 22% of the data missing
Landsat 7 was joined by Landsat 8 in 2013.
Large manual process to match farm location with pixels for ground truth data (to create a training dataset)
Experimental analyses by ABS only downloaded a small dataset into our Big Data Laboratory so no issue about storage
12
Landsat 7 data

Landsat data are organised as separate “collections”; so huge manual process to create a “time series” of pixels. Also data were not corrected for movement of the continent.
• We intend to “interrogate” the Australian Data Cube for future analysis
Methodology
• ABS has recently developing a methodology for predicting crop yields using ground truth data – to be discussed in Part II
• The algorithms have yet to be tested with large amount of ground truth data
• Still talking to various possible providers of ground truth data
13

A better source for satellite imagery data for Australia is becoming available – The Australian Data Cube
14

“Cubing” Landsat images
Datacube Project – May, 2013
Dice… & … Stack
ti
me
Landsat images
Tile squares

The Australian Data Cube concept
The Landsat Data Cube | Locate 2014
Created by Bureau of Metrology, CSIRO, National Computing Infrastructure and Geoscience, Australia using Landsat Satellites
• about 4.5 PB
• Library of Congress Books is 10 TB; 1 PB = 1000 TB
Data continued to be prospectively and standardised into a common framework
• So analysts can concentrate on analysis, rather than data assembly
Analysts can ‘drill down’ all the data about a particular location, at a pixel level, and access all historical yet comparable Landsat data
GA intends to load European and Japanese satellite data from 2015
• Satellite imagery available every 10 minutes!
• I TB of data per day
Data cube
17

Data loaded in the National Computing Infrastructure which houses the high performance computers
• ABS does not need to store this data
• ABS can use the virtual computing environment to “play” with the data
Thanks to Dr S Minchin of GA for providing the Data Cube slides
18

What problems satellite imagery data are going to solve?
Business case for it
• Efficiency?
• More frequently or timely data?
• Data at a small area level?
• Prediction/forecasting? Is this our core business?
• Replacing/complementing official data?
• Cost benefit?
Challenges
19

Methodology for analysing the data
• Handling missing data e.g. Landsat 7 sensor problems
• Handling missing data from cloud covers
• Scientific modelling vs statistical modelling
• Algorithms
Sourcing the data
. Satellite imagery
. Ground truth data – if statistical modelling is to be adopted
Maintaining trust of official statistics
• Quality assessments
20

Direction setting groups
• HLG – Modernisation of Statistics
Partners in methodology
• Research organisations
• Academics
Providers of data
• Satellite imagery providers
• Ground truthers
User of new official statistics
Management and staff
Partners
21

Other NSOs
– National Bureau of Statistics, China – National Agricultural Statistics Service (US) – Statistics Netherlands – Statistics Canada – INEGI, Mexico – Dane, Colombia
– Others?
22

In Australia
Research, collection and archiving effort carried out by:
– Geoscience Australia – BoM – ABARES – ACEMS – CSIRO – Curtin University – ADFA & UNSW
– TERN – Sense-T – Landgate – Satellite
Remote Sensing Services
– WASTAC
23


ABS Big Data Strategy
ABS Flagships
What problem we are trying to solve?
What methodology to use for analysis?
25
Part II – ABS Example

What is our research problem? Rather than exclusively through a
traditional survey collection,
is it possible to use
satellite imagery data
to estimate the
area of land used to grow different crops
and crop yields
in Australia?
26

Potential to reduce costs by
• Reducing the sample size for Agricultural surveys
Provision of more frequent data
Provision of small area data
Business case has yet to be established
• Current priority is to test the efficacy of the methodology
27
Why?

Estimating crop yields from
Satellite imagery The data
Landsat 7 imagery from US Geological Survey
- reflectance data from 7 freq bands for pixels of 25x25 m2
28

Pixel classification and yields
7 reflectance measurements 𝒚 = (𝑦1, … ,𝑦7 )
𝑓𝒚
=𝑐
29

Two broad types of errors in sampled data sets
• Sampling error • Dependent on size
• Non sampling error • Coverage bias - Big Data population is not the population • Self selection bias – squeaky wheels • Representation bias – multiple representation • Measurement error • Increasing the sample size does NOT reduce non-sampling errors
Traps • Big Data is a solution is search of a problem • Putting the cart before the horse • Correlation = causality
Big Data = Big Traps?
30

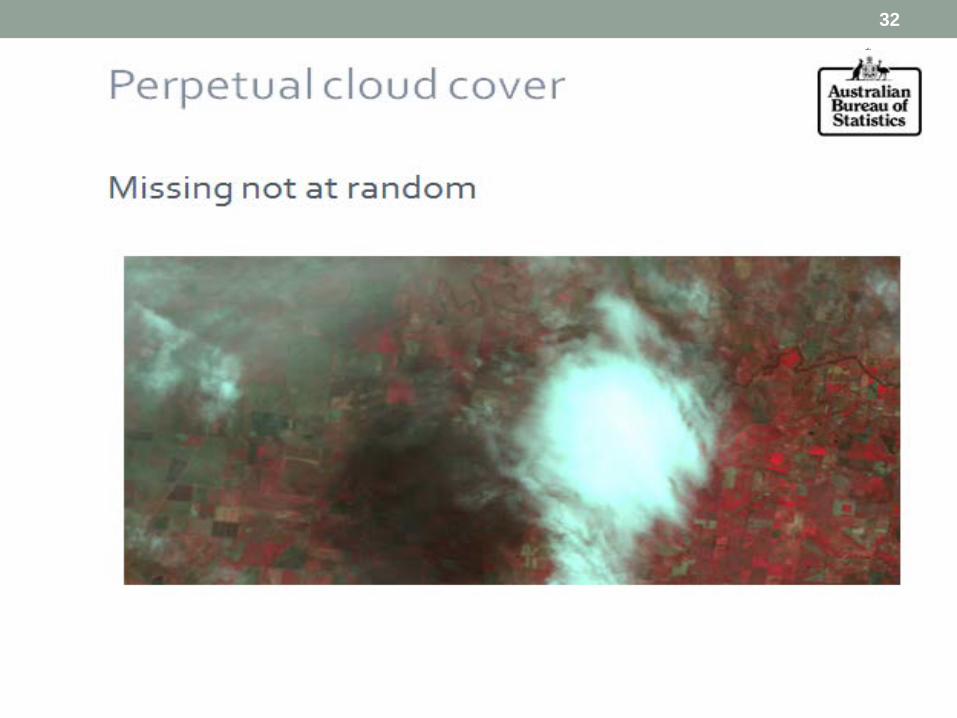
Clouds
31
32

Transformation Model - f 𝐌𝐔|𝐘𝐔;𝛗
Process model - f 𝐘𝐔;𝛉
Parameter model - f 𝛗 and f 𝛉
Data - 𝐌𝐬𝐬,𝐘𝐁𝐬 ; Processes - ℐ,ℛ, I, R; time dimension as well
Survey (or Design) Data and Big (or Organic) Data
33

Predictive (correct) inference for 𝐌𝐔is:
The conditional probability density function (CPDF) of 𝐌𝐔 given 𝐌𝐬𝐬,𝐘𝐁𝐬, ℐ,ℛ, I, R.
Generally there is no closed form for this function.
However, under certain conditions – see next slide – the CPDF is the same as
• the CDPF of 𝐌𝐔 𝐠𝐠𝐠𝐠𝐠 𝐌𝐬𝐬,𝐘𝐁𝐬, I, R, i.e. the missingness due to sampling can be ignored; and
• The CDPF of 𝐌𝐔 𝐠𝐠𝐠𝐠𝐠 𝐌𝐬𝐬,𝐘𝐁𝐬i.e. the missingness due to Big Data membership can be ignored
Bayesian Inference Framework
34

Predictive (correct) inference for 𝐌𝐔is:
𝑓(𝐌𝐔|𝐌𝐬𝐬,𝐘𝐁𝐬, ℐ,ℛ, I, R) ∝𝑓(𝐌𝐔,𝐌𝐬𝐬,𝐘𝐁𝐬,𝐘𝐂 , ℐ,ℛ, I, R,𝛉,𝛗)d𝛉d𝛗d𝐘𝐂
(generally no closed form ) where 𝐘𝐁𝐬 ⋃ 𝐘𝐂 = 𝐘𝐔, or
f(𝐌𝐔| 𝐌𝐬𝐬,𝐘𝐁𝐬, I, R)
provided that
f(ℐ,ℛ|𝐌𝐔,𝐌𝐬𝐬,𝐘𝐁𝐬, I, R) = f(ℐ,ℛ|𝐌𝐬𝐬,𝐘𝐁𝐬, I, R) (controlled by sampler),
or
f(𝐌𝐔| 𝐌𝐬𝐬,𝐘𝐁𝐬)
provided that
f(R, I|𝐌𝐔,𝐘𝐁𝐬,𝐘𝐂 ,𝛉,𝛗) = f(R, I|𝐌𝐔,𝐘𝐁𝐬) (controlled by BD participants).
Bayesian Inference Framework

In English
• The missing process for the survey sample can be ignored if missingness does not depend on the probability of growing a targeted crop • Easy to fulfil as the sampling process is determined by the official
statistician
• The missing process for Big Data (BD) can be ignored if missingness does not depend on the observations from BD • Hard to control as participation in some BD platforms is voluntary and by
self selection.
• Modelling may be required in other situations • Modelling is hard work • Computation is hard, as there is generally no closed form solution
36
Missingness

for every pixel:
I. Yield (Y) = Crop type (m) * quantity (q) (or In Y = In m + In q)
II. Assume m follows a logistic regression model, but allowing the regression coefficients to change over time
1. To allow for different electromagnetic spectra emitted from maturing crops
2. Independent variables are reflectance
III. Assume In q follows a logistic normal regression model, also allowing the regression coefficients to change over time
1. Independent variables are land surface temperature and moisture
Predicting crop yields – Methodology in English – assuming Missing At Random
37

Pixel classification
7 reflectance measurements 𝒚 = (𝑦1, … ,𝑦7 )
𝑓𝒚
=𝑐
38

mti = (1 + 𝒆−𝐘𝐭𝐠′ 𝜷𝐭 )−1
𝜷𝐭 = 𝜷𝐭−𝟏 +𝜺𝐭 , 𝜷𝐭 ⫫ 𝐘𝐭,
𝜺𝐭 ~ independent N(0, Ω𝐭), 𝜺𝐭 ⫫ 𝐃(𝐭),
Step A - At time t, select a random sample of pixels as a “training data set”
Step B - For each pixel, use the Landsat data to obtain the 7 reflectance
Step C - For the same pixel, seek “ground truths”, i.e. undertake field work to find out whether the pixel is growing the targeted crop or not (Yes = 1, and No = 0)
Step D - Stack these data up to form 𝐘𝐭𝐬, and 𝐌𝐭𝐬
Step E - Use Newton-Raphson algorithm to calculate 𝜷𝐭|𝐭 from
𝜷𝐭|𝐭= 𝜷𝐭−𝟏|𝐭−𝟏 + ∑𝐭|𝐭−𝟏−1 𝐘𝐭𝐬′ 𝐌𝐭𝐬-𝐘𝐭𝐬′ σ(𝐘𝐭′𝜷𝐭|𝐭)– see Theorem 1
How to predict crop areas
39
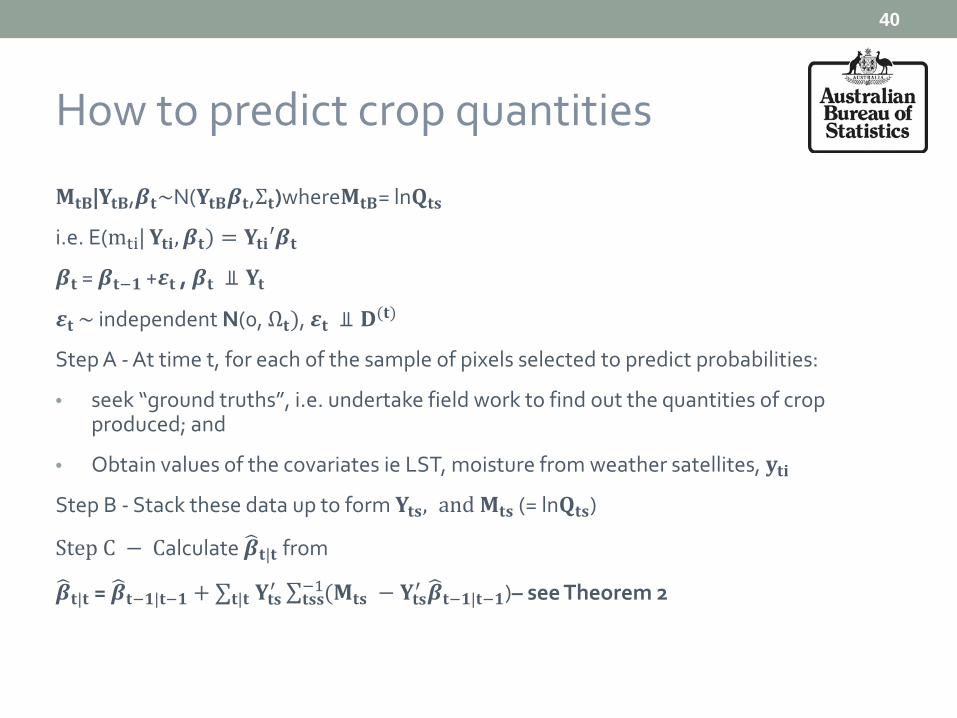
𝐌𝐭𝐁|𝐘𝐭𝐁,𝜷𝐭~N(𝐘𝐭𝐁𝜷𝐭,Σ𝐭)where𝐌𝐭𝐁= ln𝐐𝐭𝐬
i.e. E(mti| 𝐘𝐭𝐠,𝜷𝐭) = 𝐘𝐭𝐠′𝜷𝐭
𝜷𝐭 = 𝜷𝐭−𝟏 +𝜺𝐭 , 𝜷𝐭 ⫫ 𝐘𝐭
𝜺𝐭 ~ independent N(0, Ω𝐭), 𝜺𝐭 ⫫ 𝐃(𝐭)
Step A - At time t, for each of the sample of pixels selected to predict probabilities:
• seek “ground truths”, i.e. undertake field work to find out the quantities of crop produced; and
• Obtain values of the covariates ie LST, moisture from weather satellites, 𝐲𝐭𝐠
Step B - Stack these data up to form 𝐘𝐭𝐬, and 𝐌𝐭𝐬 (= ln𝐐𝐭𝐬)
Step C − Calculate 𝜷𝐭|𝐭 from
𝜷𝐭|𝐭 = 𝜷𝐭−𝟏|𝐭−𝟏 + ∑𝐭|𝐭 𝐘𝐭𝐬′ ∑ (𝐌𝐭𝐬−1𝐭𝐬𝐬 − 𝐘𝐭𝐬′ 𝜷𝐭−𝟏|𝐭−𝟏)– see Theorem 2
How to predict crop quantities
40

Business case for Big Data
Methodology to provide valid statistical inference for Big Data
• Combining survey with Big Data
• Business case from reduction in survey sample sizes
Model for predicting crop yields (applies to all counts and continuous data)
• Algorithms developed
• Cross validation of algorithms required ground truth data
• Model ignored missing data – not a major problem for satellite imagery data, but will be for e.g. social media data
Take home messages
41

Tam, S.M. and Clark, Frederic (2014) Big Data, Official Statisticis and Some Initiatives of the Australian Bureau of Statistics. Paper submitted for publication
Johnson, David M. (2014) An assessment of pre- and within-season remotely sensed variables for forecasting corn and soybean yields in the United States. Remote Sensing of Environment 141, 116-128
42
Key References


44

How will Big Data benefit your institute?
Could it benefit developing countries as well?
Will Big Data help in getting timelier and more indicators for the Post-2015 development agenda?
45
Panel Discussion Questions

Big Data = Big Hype?
Gartner Hype Curve Big Data on the Hype Curve

Key Enabler: Enhanced ABS capability to use
big data
• Develop the skills of our staff • Establish the infrastructure
needed to exploit big data • Develop appropriate methods
and techniques
Our Objective:
Effective application of big data to reduce costs, improve timeliness, quality, and
expand the range of our statistics. • Identify statistical needs that should be the focus of early
efforts to apply big data • Identify “high potential” data sources • Seek funding and support for the application of big data • Undertake pilot applications to better understand the
barriers, enablers and value proposition
Key Enabler:
Active partnership and collaboration with those who
can help us apply big data
• Government Agencies • Academics and Researchers • Private custodians of big data • Working Groups and Centres of
Excellence
• Satellite • Telecom • Financial Sector • Retail Prices • Utilities
• Authority for data acquisition • Authorised Integrator of sensitive
data • Ability to integrate with Census and
Survey data • Trust in the ABS and our reputation
for Integrity, Impartiality and Quality
ABS Capability
ABS Big Data Strategy
• Big Data Research
Partnerships • ARC Partner Investigator • APS Big Data Working
Group & Analytics COE • UNECE Big Data Working
Group
Sources
Research Partners
July 2014
• Population
movements • Environment • Prices
Needs
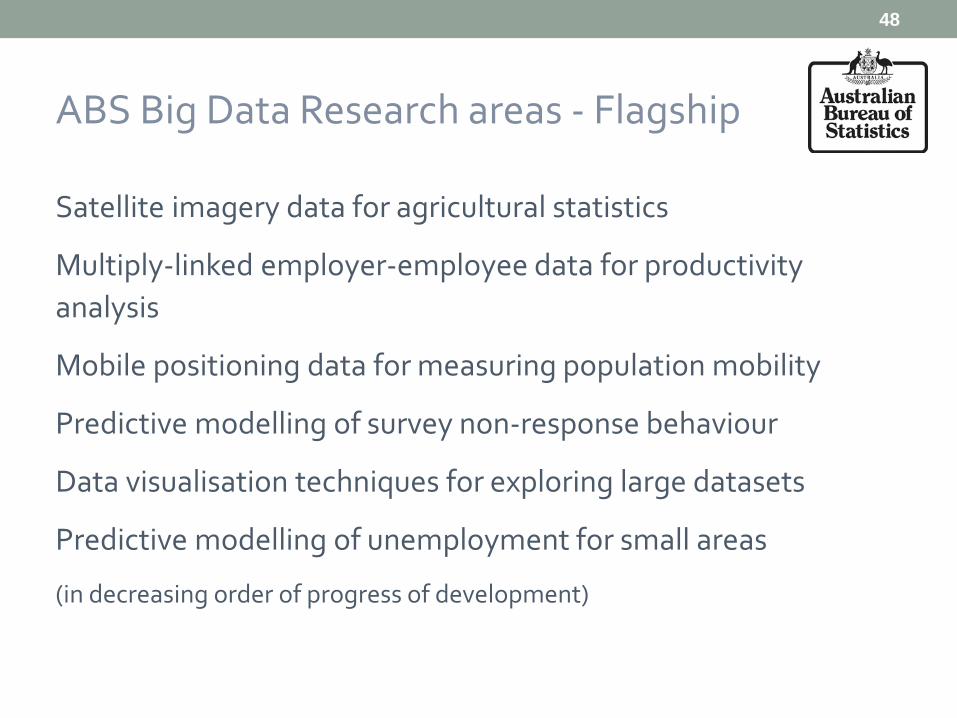
ABS Big Data Research areas - Flagship
Satellite imagery data for agricultural statistics
Multiply-linked employer-employee data for productivity analysis
Mobile positioning data for measuring population mobility
Predictive modelling of survey non-response behaviour
Data visualisation techniques for exploring large datasets
Predictive modelling of unemployment for small areas
(in decreasing order of progress of development)
48

Big Data and Big Opportunities
Possible benefits
• Replace direct data collection
• Complementary direct data collection
• Substitute data items
• New data items
• Supplementary information to improve quality
Statistical activities
Sample frames or registers
Small domain estimation
Small population group estimation
Enabling data imputation, editing and confrontation
Enabling data linking and fusion
Producing new statistical products
Improving statistical operations
49
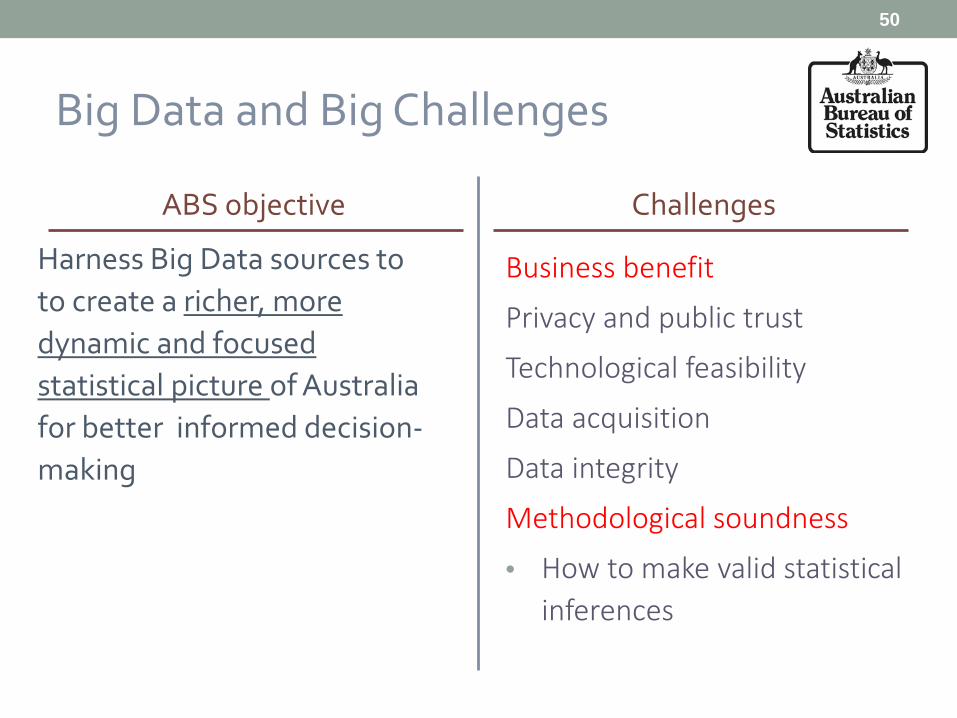
Big Data and Big Challenges
ABS objective
Harness Big Data sources to to create a richer, more dynamic and focused statistical picture of Australia for better informed decision-making
Challenges
Business benefit
Privacy and public trust
Technological feasibility
Data acquisition
Data integrity
Methodological soundness
• How to make valid statistical inferences
50

Two broad types of errors in sampled data sets
• Sampling error • Dependent on size
• Non sampling error • Coverage bias - Big Data population is not the population • Self selection bias – squeaky wheels • Representation bias – multiple representation • Measurement error • Increasing the sample size does NOT reduce non-sampling errors
Traps • Big Data is a solution is search of a problem • Putting the cart before the horse • Correlation = causality
Big Data = Big Traps?
51

Big Data = Big Sources, but
not entirely foreign to official statisticians
Eg Administrative records, Scanner Data
Administrative Records
PIT Records
Medical Records
Bank Records
Commercial Transactions
Credit Card Transactions
Scanner Transactions
Online Purchases
Sensor Data
Satellite Imagery
Ground Sensor Data
Location Data
Behaviour Metrics
Search Engine Queries
Web Pages Views and Navigation
Media Subscriptions
Online Opinion
Social Media Comments
Twitter Feeds
52

Still an open question as we have yet to develop the business case for certain types of Big Data… But promising for
• Satellite Imagery Data
• Mobile phone data
• Harness own operational data
Could it benefit developing countries as well?
• Yes • Provided that sources are also available to DCs;
• Methodology is available to them as well
53
How will Big Data benefit ABS?

Will Big Data help in getting timelier and more indicators for the Post-2015 development agenda?
54