sasol south africa annual financial statements 2019 · sasol south africa annual financial...
TRANSCRIPT

Sasol South Africa Annual Financial Statements 2019 1

2 Sasol South Africa Annual Financial Statements 2019
Sasol South Africa Limited
Registration number 1968/013914/06
Annual Financial Statements for the year ended 30 June 2019
Contents
Page
Report of the Audit Committee 3
Certificate of the Company Secretary 5
Directors’ report 6
Independent auditors’ report 7
Income statements 9
Statements of comprehensive income 9
Statements of financial position 10
Statements of changes in equity 11
Statements of cash flows 13
Notes to the financial statements 14
Preparers of the Annual Financial StatementsThe Annual Financial Statements of Sasol South Africa Limited have been audited in compliance with section 30 of the South African Companies Act. Ms Amelia van den Berg CA(SA), Vice President: Statutory Reporting and Mr Christo Nel CA(SA), Senior Manager Finance: Sasol South Africa Limited, are responsible for this set of financial statements and have supervised the preparation thereof in conjunction with Ms Tintswalo Mohlakoana CA(SA), Senior Accountant: Sasol South Africa Limited.

Sasol South Africa Annual Financial Statements 2019 3
Report of the Audit Committee
The Committee has the honour of presenting its financial year 2019 Audit Committee report.
This report has been prepared for Sasol South Africa Limited, a subsidiary within the Sasol group, and is based on the requirements of the South African Companies Act, 71 of 2008 as amended (the Companies Act), the King IV Report on Corporate Governance for South Africa 2016 (King IV), applicable regulatory requirements and the terms of reference of the Audit Committee (the Committee).
Composition and meetings
The following members of the Committee were duly elected by shareholders at the annual general meeting of Sasol Limited held in 2018, to hold office until the next annual general meeting scheduled to take place on 22 November 2019:
Mr C Beggs (Chairman)Ms NNA MatyumzaMr MJN NjekeMr S WestwellMs G M B Kennealy
All the members of the Audit Committee are independent non-executive directors. They are financially literate and most have extensive audit committee experience.
The Committee met five times during the financial year.
Statutory duties and functions
The Committee is constituted as a statutory committee of Sasol Limited in line with the Companies Act and accountable in this regard to both the Board and Sasol’s shareholders. The Committee also acts as the audit committee for certain South African companies within the Sasol group. Oversight of the following specific matters has been delegated to the Committee:
quality and integrity of the company’s integrated reporting, including its financial statements and public announcements in respect of the financial results;
qualification and independence of the external auditors and the scope and effectiveness of the external audit function; effectiveness of the group’s internal controls and internal audit function; and compliance with legal and regulatory requirements to the extent that might have an impact on financial statements.
The Committee fulfilled all its statutory duties as required by section 94(7) of the Companies Act.
Adequate processes and structures have been implemented to assist the Audit Committee in providing oversight and ensuring the integrity of financial reporting, internal control and other governance matters relating to subsidiaries. The Combined Assurance and Disclosure Committee, a sub-committee of the Group Executive Committee, provides management oversight, assurance and alignment on group-wide, high risk activities and is responsible for ensuring that the information publicly disclosed complies with requirements of the Johannesburg Stock Exchange, New York Stock Exchange and the United States Securities Exchange Commission rules. Material matters of concern are also reported to the Audit Committee.
In satisfying its duties, the Committee in particular:
Considered legal and regulatory compliance requirements to the extent that they might have an impact on financial statements and reviewed the internal control environment.
The Committee is of the opinion that there were no material breakdowns in internal control during the 2019 financial year.
Relied on management, the external auditor, internal audit as well as the group’s independent ethics reporting telephone line to highlight any concerns, complaints or allegations relating to internal financial controls, the content of the financial statements and potential violations of the law or questionable accounting or auditing practices. Separate meetings are also held with management, the external auditor and internal audit every quarter.
The Committee is satisfied with the reporting process and confirms that no significant concerns or complaints were raised during the financial year under review.
Nominated for appointment PricewaterhouseCoopers Inc (PwC) as auditor of Sasol Limited and the group for the financial year ended 30 June 2019 in line with the requirements of the Act and any other legislation relating to the appointment of auditors.
The Committee is satisfied that PwC and the designated auditor are qualified and independent of the Company and the Sasol group.

4 Sasol South Africa Annual Financial Statements 2019
Reviewed and approved the external audit plan, the budgeted and final fee for the reporting period and the terms of engagement of the external auditors. Appropriate controls are in place to manage the provision of non-audit services by the external auditor and the Committee also determined, subject to the provisions of the Act, the nature and extent of any non-audit services which PwC may provide and pre-approved all audit and permissible non-audit services that PwC provides.
The quality of the external audit process was reviewed and the Committee concluded it to be satisfactory. It was confirmed that no unresolved issues of concern exist between the group and the external auditors.
Reviewed the assurance services charter and approved the integrated three year rolling internal audit plan. The Committee also evaluated the independence, effectiveness and performance of the internal audit function and compliance with its charter and found them to be satisfactory.
Reviewed the group’s policies on risk assessment and management as they pertain to financial reporting and found them to be sound. The Committee also considered fraud and information technology risks and controls.
The Committee also considered the plans and outputs of the external and internal auditors and concluded that they were adequate to address all significant financial risks facing the business.
The Committee is also satisfied with the appropriateness of the expertise and experience of the Chief Financial Officer of Sasol Limited and the expertise, resources, succession plans and experience of Sasol’s finance functions.
Conclusion
The Committee is satisfied that it has complied with all its statutory and other responsibilities. Having had regard to all material risks and factors that may impact on the integrity of the Company’s annual financial statements, the Committee recommends the annual financial statements of Sasol South Africa Limited for the year ended 30 June 2019 for approval to the Board.
On behalf of the Audit Committee
Colin Beggs (Chairman)
28 October 2019


Sasol South Africa Annual Financial Statements 2019 7
Independent auditors’ report
Independent auditors’ report to the shareholders of Sasol South Africa Limited
Our opinion
In our opinion, the consolidated and separate financial statements present fairly, in all material respects, the consolidated and separate financial position of Sasol South Africa Limited (the Company) and its subsidiaries (together the Group) as at 30 June 2019, and its consolidated and separate financial performance and its consolidated and separate cash flows for the year then ended in accordance with International Financial Reporting Standards and the requirements of the Companies Act of South Africa.
What we have audited
Sasol South Africa Limited’s consolidated and separate financial statements set out on pages 9 to 67 comprise: the consolidated and separate statements of financial position as at 30 June 2019; the consolidated and separate income statements for the year then ended; the consolidated and separate statements of comprehensive income for the year then ended; the consolidated and separate statements of changes in equity for the year then ended; the consolidated and separate statements of cash flows for the year then ended; and the notes to the financial statements, which include a summary of significant accounting policies.
Basis for opinion
We conducted our audit in accordance with International Standards on Auditing (ISAs). Our responsibilities under those standards are further described in the Auditor’s responsibilities for the audit of the consolidated and separate financial statements section of our report. We believe that the audit evidence we have obtained is sufficient and appropriate to provide a basis for our opinion.
Independence
We are independent of the Group in accordance with the sections 290 and 291 of the Independent Regulatory Board for Auditors’ Code of Professional Conduct for Registered Auditors (Revised January 2018), parts 1 and 3 of the Independent Regulatory Board for Auditors’ Code of Professional Conduct for Registered Auditors (Revised November 2018) (together the IRBA Codes) and other independence requirements applicable to performing audits of financial statements in South Africa. We have fulfilled our other ethical responsibilities, as applicable, in accordance with the IRBA Codes and in accordance with other ethical requirements applicable to performing audits in South Africa. The IRBA Codes are consistent with the corresponding sections of the International Ethics Standards Board for Accountants’ Code of Ethics for Professional Accountants and the International Ethics Standards Board for Accountants’ International Code of Ethics for Professional Accountants (including International Independence Standards) respectively.
Other Information
The directors are responsible for the other information. The other information comprises the information included in the document titled “Sasol South Africa Limited Annual Financial Statements 30 June 2019”, which includes the Report of the Audit Committee, the Director’s Report and the Certificate of the Company Secretary as required by the Companies Act of South Africa. The other information does not include the consolidated or the separate financial statements and our auditor’s report thereon.
Our opinion on the consolidated and separate financial statements does not cover the other information and we do not express an audit opinion or any form of assurance conclusion thereon.
In connection with our audit of the consolidated and separate financial statements, our responsibility is to read the other information identified above and, in doing so, consider whether the other information is materially inconsistent with the consolidated and separate financial statements or our knowledge obtained in the audit, or otherwise appears to be materially misstated.
If, based on the work we have performed, we conclude that there is a material misstatement of this other information, we are required to report that fact. We have nothing to report in this regard.
Responsibilities of the directors for the consolidated and seperate financial statements
The directors are responsible for the preparation and fair presentation of the consolidated and separate financial statements in accordance with International Financial Reporting Standards and the requirements of the Companies Act of South Africa, and for such internal control as the directors determine is necessary to enable the preparation of consolidated and separate financial statements that are free from material misstatement, whether due to fraud or error.
In preparing the consolidated and separate financial statements, the directors are responsible for assessing the Group and the Company’s ability to continue as a going concern, disclosing, as applicable, matters related to going concern and using the going concern basis of accounting unless the directors either intend to liquidate the Group and/or the Company or to cease operations, or have no realistic alternative but to do so.
Auditor’s responsibilities for the audit of the consolidated and seperate financial statements
Our objectives are to obtain reasonable assurance about whether the consolidated and separate financial statements as a whole are free from material misstatement, whether due to fraud or error, and to issue an auditor’s report that includes our opinion. Reasonable assurance is a high level of assurance, but is not a guarantee that an audit conducted in accordance with ISAs will always detect a material misstatement when it exists. Misstatements can arise from fraud or error and are considered material if, individually or in the aggregate, they could reasonably be expected to influence the economic decisions of users taken on the basis of these consolidated and separate financial statements.

8 Sasol South Africa Annual Financial Statements 2019
As part of an audit in accordance with ISAs, we exercise professional judgement and maintain professional scepticism throughout the audit. We also:
Identify and assess the risks of material misstatement of the consolidated and separate financial statements, whether due to fraud or error, design and perform audit procedures responsive to those risks, and obtain audit evidence that is sufficient and appropriate to provide a basis for our opinion. The risk of not detecting a material misstatement resulting from fraud is higher than for one resulting from error, as fraud may involve collusion, forgery, intentional omissions, misrepresentations, or the override of internal control.
Obtain an understanding of internal control relevant to the audit in order to design audit procedures that are appropriate in the circumstances, but not for the purpose of expressing an opinion on the effectiveness of the Group’s and the Company’s internal control.
Evaluate the appropriateness of accounting policies used and the reasonableness of accounting estimates and related disclosures made by the directors.
Conclude on the appropriateness of the directors’ use of the going concern basis of accounting and, based on the audit evidence obtained, whether a material uncertainty exists related to events or conditions that may cast significant doubt on the Group’s and the Company’s ability to continue as a going concern. If we conclude that a material uncertainty exists, we are required to draw attention in our auditor’s report to the related disclosures in the consolidated and separate financial statements or, if such disclosures are inadequate, to modify our opinion. Our conclusions are based on the audit evidence obtained up to the date of our auditor’s report. However, future events or conditions may cause the Group and / or Company to cease to continue as a going concern.
Evaluate the overall presentation, structure and content of the consolidated and separate financial statements, including the disclosures, and whether the consolidated and separate financial statements represent the underlying transactions and events in a manner that achieves fair presentation.
Obtain sufficient appropriate audit evidence regarding the financial information of the entities or business activities within the group to express an opinion on the consolidated financial statements. We are responsible for the direction, supervision and performance of the group audit. We remain solely responsible for our audit opinion.
We communicate with the directors regarding, among other matters, the planned scope and timing of the audit and significant audit findings, including any significant deficiencies in internal control that we identify during our audit.
PricewaterhouseCoopers Inc.
Director: E.P.V BerghRegistered Auditor Johannesburg
Date: 10 March 2020

Sasol South Africa Annual Financial Statements 2019 9
Income statementsfor the year ended 30 June
Group Company2019 2018 2019 2018
Note Rm Rm Rm RmTurnover 2 95 222 88 123 91 985 85 326Materials, energy and consumables used 3 (36 029) (32 826) (40 835) (38 307)Selling and distribution costs (2 764) (2 675) (2 758) (2 665)Maintenance expenditure (5 584) (5 088) (5 443) (4 959)Employee-related expenditure 4 (15 045) (14 772) (14 664) (14 412)Exploration expenditure and feasibility costs (206) (426) (206) (426)Depreciation and amortisation (11 531) (11 343) (8 700) (8 725)Other expenses and income (6 315) (4 143) (5 740) (3 659)
Translation (losses)/gains 5 (125) 221 (104) 185Other operating expenses and income 6 (6 190) (4 364) (5 636) (3 844)
Equity accounted profits, net of tax 19 44 78 8 8Operating profit before remeasurement items 17 792 16 928 13 647 12 181Remeasurement items 8 (5 907) (9 953) (8 286) (15 895)Earnings/(loss) before interest and tax (EBIT) 11 885 6 975 5 361 (3 714)Finance income 7 786 919 3 542 4 823Finance costs 7 (2 764) (3 184) (2 371) (2 707)Earnings/(loss) before tax 9 907 4 710 6 532 (1 598)Taxation 10 (1 552) (1 343) 354 1 953
Earnings for the year 8 355 3 367 6 886 355Attributable toOwners of Sasol South Africa Limited 7 596 2 663 6 886 355Non-controlling interests in subsidiaries 759 704 - -
8 355 3 367 6 886 355
Statements of comprehensive incomefor the year ended 30 June
Group Company2019 2018 2019 2018
Rm Rm Rm RmEarnings for the year 8 355 3 367 6 886 355Other comprehensive income, net of taxItems that can be subsequently reclassified to the income statement (1) – (1) – Effect of cash flow hedges (2) – (2) – Tax on items that can be subsequently reclassified to the income statement 1 – 1 –Items that cannot be subsequently reclassified to the income statement 226 97 224 96 Remeasurement on post-retirement benefit obligation 314 135 311 133 Tax on items that cannot be subsequently reclassified to the income statement (88) (38) (87) (37)
Total comprehensive income for the year 8 580 3 464 7 109 451
Attributable toOwners of Sasol South Africa Limited 7 821 2 760 7 109 451
Non-controlling interests in subsidiaries 759 704 - -
8 580 3 464 7 109 451The notes on pages 14 to 67 are an integral part of the Annual Financial Statements.

10 Sasol South Africa Annual Financial Statements 2019
Statements of financial positionat 30 June
Group Company2019 2018 2019 2018
Note Rm Rm Rm Rm
AssetsProperty, plant and equipment 15 76 490 77 633 56 670 60 957Assets under construction 16 16 783 13 417 16 489 13 089Goodwill and other intangible assets 17 34 022 37 302 1 108 1 195Equity accounted investments 19 283 282 10 11Investment in subsidiaries and joint ventures 20 - - 48 187 48 187Post-retirement benefit assets 31 409 436 409 436Long-term receivables and prepaid expenses 18 706 811 385 768Non-current assets 128 693 129 881 123 258 124 643
Assets in disposal groups held for sale 9 1 229 - 1 229 -Inventories 21 10 462 10 442 10 416 10 432Tax receivable 11 101 2 805 101 2 789Trade and other receivables 22 15 829 15 420 15 189 14 971Short-term financial assets 1 1 1 1Cash and cash equivalents 25 10 290 6 726 6 566 2 867Current assets 37 912 35 394 33 502 31 060Total assets 166 605 165 275 156 760 155 703
Equity and liabilitiesShareholders' equity 47 021 41 434 53 418 49 262Non-controlling interests 1 709 1 941 - -Total equity 48 730 43 375 53 418 49 262
Long-term debt 14 69 392 71 480 67 597 68 577Long-term provisions 29 6 821 5 848 6 355 5 446Post-retirement benefit obligations 31 3 320 3 442 3 306 3 425Long-term deferred income 205 220 205 220Deferred tax liabilities 12 19 929 20 462 8 584 9 292Non-current liabilities 99 667 101 452 86 047 86 960
Liabilities in disposal groups held for sale 9 388 - 388 -Short-term debt 14 4 218 4 088 3 101 3 122Dividend payable 28 - 3 179 - 3 179Short-term provisions 30 966 1 261 962 1 222Tax payable 11 169 222 - -Trade and other payables 23 12 409 11 679 12 786 11 941Short-term deferred income 58 19 58 17Current liabilities 18 208 20 448 17 295 19 481Total equity and liabilities 166 605 165 275 156 760 155 703
The notes on pages 14 to 67 are an integral part of the Annual Financial Statements.

Sasol South Africa Annual Financial Statements 2019 11
Statement of changes in equityfor the year ended 30 June
Group
Share capital
Share-based
payment reserve
Other Reserves
Re-measure-
menton post-
retirementbenefits
Retainedearnings
Share-holders'
equity
Non-controlling
interestsTotal
equityNote 13 Note 33
Rm Rm Rm Rm Rm Rm Rm RmBalance at 30 June 2017 55 849 2 173 9 (13) (14 437) 43 581 1 895 45 476Shares issued* 4 733 - - - - 4 733 - 4 733Shares issued on implementation of Sasol Khanyisa transaction** 8 252 – – – – 8 252 – 8 252Long-term incentives vested and settled – (367) – – 367 – – –Movement in share-based payment reserve – 614 – – – 614 – 614 share-based payment expense – 549 – – – 549 – 549
deferred tax – 65 – – – 65 – 65Expiry of Sasol share incentive scheme – (1 617) – – 1 617 – – –Total comprehensive income for the year – – – 97 2 663 2 760 704 3 464profit – – – – 2 663 2 663 704 3 367 other comprehensive income for the year – – – 97 – 97 – 97Dividends paid – – – – (18 506) (18 506) (658) (19 164)Balance at 30 June 2018 68 834 803 9 84 (28 296) 41 434 1 941 43 375
Movement in Incentives schemes – (361) – – (579) (940) – (940) long-term incentives vested and settled – (361) – – 361 – – – share incentives schemes distributions*** – – – – (940) (940) – (940)Movement in share-based payment reserve – 991 – – – 991 – 991 share-based payment expense – 1 053 – – – 1 053 – 1 053
deferred tax – (62) – – – (62) – (62)Total comprehensive income for the year – – (1) 226 7 596 7 821 759 8 580 profit – – – – 7 596 7 596 759 8 355 other comprehensive income for the year – – (1) 226 – 225 – 225Retained earnings of newly controlled entity**** – – – – 719 719 – 719
Dividends paid – – – – (3 004) (3 004) (991) (3 995)
Dividends declared – – – – (3 300) (3 300) (991) (4 291)Notional portion of dividends declared – – – – 296 296 – 296Balance at 30 June 2019 68 834 1 433 8 310 (23 564) 47 021 1 709 48 730* Subscription by Sasol Limited of 1 no par value share in the share capital of Sasol South Africa Limited. ** Subscription by Sasol Khanyisa Fundco (RF) Limited and the Khanyisa ESOP of 26,5 million no par value shares each in the share capital of Sasol South Africa Limited.
***Distributions in accordance with Khanyisa Tier 1 scheme of R408 miilion (refer note 33.2) and long-term incentive scheme of R532 million (refer note 33.3).****Sasol South Africa Limited obtained effective control over the governance activities of Siyakha Enterprise and Supplier Development Trust (Siyakha). Sasol South Africa Limited consolidated Siyakha in accordance with IFRS 10. Refer note 20.
The notes on pages 14 to 67 are an integral part of the Annual Financial Statements.

12 Sasol South Africa Annual Financial Statements 2019
Statement of changes in equityfor the year ended 30 June
Company
Share capital
Share-based
payment reserve
Other Reserves
Re-measure-
menton post-
retirementbenefits
Retainedearnings
Totalequity
Note 13 Note 33
Rm Rm Rm Rm Rm RmBalance at 30 June 2017 55 849 2 173 8 (13) (4 292) 53 725Shares issued* 4 733 – – – – 4 733Shares issued on implementation of Sasol Khanyisa transaction** 8 252 – – – – 8 252Long-term incentives vested and settled – (367) – – 367 –Movement in share-based payment reserve – 598 – – – 598 share-based payment expense – 535 – – – 535 deferred tax – 63 – – – 63Expiry of Sasol share incentive scheme – (1 617) – – 1 617 –Total comprehensive income for the year – – – 96 355 451 profit – – – – 355 355 other comprehensive income for the year – – – 96 – 96Dividends paid – – – – (18 497) (18 497)Balance at 30 June 2018 68 834 787 8 83 (20 450) 49 262Movement in Incentives schemes – (348) – – (558) (906) long-term incentives vested and settled – (348) – – 348 – share incentives schemes distributions*** – – – – (906) (906)Movement in share-based payment reserve – 957 – – – 957 share-based payment expense – 1 018 – – – 1 018 deferred tax – (61) – – – (61)Total comprehensive income for the year – – (1) 224 6 886 7 109 profit – – – – 6 886 6 886 other comprehensive income for the year – – (1) 224 – 223Dividends paid – – – – (3 004) (3 004)Dividends declared – – – – (3 300) (3 300)Notional portion of dividends declared – – – – 296 296Balance at 30 June 2019 68 834 1 396 7 307 (17 126) 53 418* Subscription by Sasol Limited of 1 no par value share in the share capital of Sasol South Africa Limited.
** Subscription by Sasol Khanyisa Fundco (RF) Limited and the Khanyisa ESOP of 26,5 million no par value shares each in the share capital of Sasol South Africa Limited. ***Distributions in accordance with Khanyisa Tier 1 scheme of R386 miilion (refer note 33.2) and long-term incentive scheme of R520 million (refer note 33.3).
The notes on pages 14 to 67 are an integral part of the Annual Financial Statements.

Sasol South Africa Annual Financial Statements 2019 13
Statements of cash flowsfor the year ended 30 June
Group Company2019 2018 2019 2018
Note Rm Rm Rm RmCash receipts from customers 94 560 85 760 91 368 83 099Cash paid to suppliers and employees (67 128) (57 777) (70 725) (62 859)Cash generated by operating activities 26 27 432 27 983 20 643 20 240Dividends received from equity accounted investments 19 29 53 29 53Finance income received 7 702 789 3 439 4 656Finance costs paid 7 (3 142) (3 270) (2 802) (2 855)Tax refund/(paid) 11 510 (2 192) 2 278 (554)Cash available from operating activities 25 531 23 363 23 587 21 540Dividends paid 28 (3 536) (15 327) (3 524) (15 318)Dividends paid to non-controlling shareholders in subsidiaries (991) (658) – –Cash retained from operating activities 21 004 7 378 20 063 6 222
Additions to non-current assets (15 951) (12 846) (15 604) (12 589) additions to property, plant and equipment 15 (179) (136) (174) (137) additions to assets under construction 16 (15 977) (13 066) (15 635) (12 808) additions to other intangible assets – (2) – (2) increase in capital project related payables 205 358 205 358Non-current assets sold 63 47 58 42Decrease/(Increase) in long-term receivables and prepaid expenses 405 (778) 382 (735)Cash used in investing activities (15 483) (13 577) (15 164) (13 282)
Share capital issued – 12 985 – 12 985Proceeds from long-term debt 14 1 891 1 681 1 891 1 581Repayment of long-term debt 14 (4 100) (8 585) (3 126) (7 796)Cash (used in)/generated by financing activities (2 209) 6 081 (1 235) 6 770
Increase/(Decrease) in cash and cash equivalents 3 312 (118) 3 664 (290)Cash and cash equivalents at the beginning of year 6 726 6 844 2 867 3 157Reclassification to disposal groups held for sale 35 – 35 –Cash and cash equivalents of Siyakha* 20 217 – – –Cash and cash equivalents at the end of the year 25 10 290 6 726 6 566 2 867* Sasol South Africa Limited consolidated Siyakha in accordance with IFRS 10.
The notes on pages 14 to 67 are an integral part of the Annual Financial Statements.

14 Sasol South Africa Annual Financial Statements 2019
Notes to the financial statements
1 Statement of compliance The annual financial statements are prepared in compliance with International Financial Reporting Standards (IFRS) and Interpretations of those standards, as issued by the International Accounting Standards Board, the SAICA Financial Reporting Guides as issued by the Accounting Practices Committee and Financial Reporting Pronouncements as issued by Financial Reporting Standards Council and the South African Companies Act, 2008. The annual financial statements were approved for issue by the Board of Directors on 10 March 2020.
Basis of preparation of financial results
The annual financial statements are prepared using the historic cost convention except that, certain items, including derivative instruments, liabilities for cash-settled share-based payment schemes, financial assets at fair value through profit or loss and available-for-sale financial assets, are stated at fair value. The annual financial results are presented in rand, which is Sasol South Africa Limited’s functional and presentation currency, rounded to the nearest million.
The annual financial statements are prepared on the going concern basis.
The comparative figures are reclassified or restated as necessary to afford a proper and more meaningful comparison of results as set out in the affected notes to the financial statements.
Certain additional disclosure has been provided in respect of the current year. To the extent practicable, comparative information has also been provided.
Accounting policies
The accounting policies applied in the preparation of these group and company financial statements are in terms of IFRS and are consistent with those applied in the annual financial statements for the year ended 30 June 2018, except for the adoption of IFRS 9 'Financial Instruments', IFRS 15 'Revenue from Contracts with Customers' and an amendment to IAS 23 ‘Borrowing Costs’ with effect from 1 July 2018. Both IFRS 9 and IFRS 15 were adopted using the modified transition approach, where the comparative financial information is not restated as permitted by the standard. The amendment to IAS 23 is applied prospectively. These accounting policies are consistently applied throughout the group and company.
Accounting standards, interpretations and amendments to published accounting standards
IFRS 9 'Financial Instruments'
IFRS 9 provides a single classification and measurement approach for financial assets that reflects the business model in which they are managed and their cash flow characteristics. The financial assets are classified as measured at amortised cost, fair value through profit or loss, or fair value through other comprehensive income.
For financial liabilities the existing classification and measurement requirements of IAS 39 will remain the same.
Impairments of financial assets classified as measured at amortised cost are recognised on an expected loss basis which incorporates forward-looking information when assessing credit risk, with the expected losses recognised in profit or loss. The effect of the change was inconsequential on Sasol South Africa Limited’s accounting as the expected loss basis is not significantly different from the stringent debtor management policies currently applied by Sasol South Africa Limited, and therefore no transition adjustment is presented. Refer to note 39 for the expected credit loss disclosure.
The adoption of IFRS 9 did not have a significant impact on the group and company’s accounting policies relating to financial assets and financial liabilities.
The IFRS 9 hedge accounting requirements are not effective for the group and company until the International Accounting Standards Board’s macro hedging project is finalised.
IFRS 15 ‘Revenue from contracts with customers'
Under IFRS 15, revenue from contracts with customers is recognised when a performance obligation is satisfied by transferring a promised good or service to a customer. A good or service is transferred when the customer obtains control of that good or service. The transfer of control of Sasol South Africa Limited’s energy and chemical products usually coincides with title passing to the customer and the customer taking physical possession, with the group and company’s performance obligations primarily satisfied at a point in time. Amounts of revenue recognised relating to performance obligations over time are not significant. The accounting for revenue under IFRS 15 therefore represents an inconsequential change from the group and company’s previous practice for recognising revenue from sales with customers, and therefore no transition adjustment is presented.
An analysis of revenue from contracts with customers by product is presented on note 2. Amounts presented for comparative periods include revenues determined in accordance with the group and company's previous accounting policies, but the differences are inconsequential.
IAS 23 ‘Borrowing Costs’
The amendment to IAS 23 clarifies that if any specific borrowing remains outstanding after the related asset is ready for its intended use or sale, that borrowing becomes part of the funds that an entity borrows generally when calculating the capitalisation rate on general borrowings. Previously, if any specific borrowing remained outstanding after the related asset was ready for its intended use or sale, Sasol South Africa Limited recognised the finance costs related to this borrowing in profit and loss.

Sasol South Africa Annual Financial Statements 2019 15
The adoption of the amendment has been applied prospectively from 1 July 2018 and had a material impact on the group and company’s earnings for the period as Sasol South Africa Limited has a large number of projects to which borrowing costs are capitalised. The impact of applying the amendment for the year ended 30 June 2019 is:
Group
Results before
amendment
Adjustment on IAS 23
amendment
Resultsafter
amendmentsfor the year ended 30 June Rm Rm Rm
Non-current assetsProperty, plant, equipment and assets under construction 93 137 136 93 273
Income statementFinance costs 2 900 (136) 2 764
Company
Results before
amendment
Adjustment on IAS 23
amendment
Resultsafter
amendmentsfor the year ended 30 June Rm Rm
Non-current assetsProperty, plant, equipment and assets under construction 73 023 136 73 159Income statement
Finance costs 2 507 (136) 2 371
Accounting standards, interpretations and amendments not yet effective
IFRS 16 ‘Leases' (Effective for the group and company from 1 July 2019)
IFRS 16 introduces a single lease accounting model and requires a lessee to recognise assets and liabilities for all leases with a term of more than 12 months, unless the underlying asset is of low value. A lessee is required to recognise a right of use asset representing its right to use the underlying leased asset and a lease liability representing its obligation to make lease payments. The finance charge to unwind the lease liability and depreciation of the leased asset are recognised in the income statement based on the implied interest rate and contract terms respectively.
Previously, the group planned to adopt the standard from 1 July 2019 on a full retrospective basis and was in the process completing this adoption method. However, with the new standard indirectly impacting the accounting of a number of business areas, including the valuation of inventory and the value-in-use of cash generating units, the group decided from a cost/benefit perspective that it would be preferable to apply the modified retrospective approach as applied by almost all of our peers. This approach allow the cumulative effect of initially applying the standard to be recognised at the date of initial application, with no restatement of comparative financial information required.
The identification and classification of leases and the analysis of the effect on the group and company’s financial statements have largely been completed. A new software program has been introduced to manage and measure leases going forward and the results from the solution, used to determine the impact disclosed below, is currently being assessed. Accounting policies and processes have been updated and the impact on key performance indicators and financial metrics have been quantified.
The adoption of the standard will have a material effect on the group and company’s financial statements, significantly increasing the group and company’s recognised assets and liabilities. Upon adoption, the most significant impact will be the present value of the operating lease commitments as per note 35, which are not currently recognised on the statement of financial position and provides an indication of the magnitude of assets and liabilities that will be recognised on the statement of financial position on adoption. We expect an increase in the depreciation expense and also in cash flows from operating activities as the lease payments will be reflected as financing outflows in our cash flow statement.
The discount rates applied in determining the lease liabilities recognised are based on the incremental borrowing rates as appropriate for each lease considering factors such as the lessee country of operation, lease term, nature of asset and commencement date. The rate implicit in the lease was previously applied to certain leases that will be changed to the incremental borrowing rate when adopting to the new standard, increasing the liability recognised on these leases. Currently across the group and company, the incremental borrowing rates applicable to the significant portion of the undiscounted lease cash flows range from 8,2% - 11,5%.
Based on the group and company’s current assessment, the impact on 2020 is expected to be as follows:
Between R2 billion and R2,7 billion for the group and between R2 billion and R2,1 billion for the company of additional lease liabilities would be recognised in the statement of financial position and a corresponding right-of-use asset of between R2 billion and R2,1 billion for the group and between R1.8 billion and R1.9 billion for the company at 1 July 2019. Net income before interest and tax would increase between zero and R0,4 billion for the group and between zero and R0,4
billion for the company and interest expense increase by between R0,1 billion and R0,3 billion for the group and between R0,1 billion and R0,3 billion for the company, the net results having an immaterial impact on earnings. Depreciation would increase by between R0,4 billion and R0,5 billion for the group and between R0,4 billion and R,5 billion for the company.
16 Sasol South Africa Annual Financial Statements 2019
Group Company2019 2018* 2019 2018*
for the year ended 30 June Rm Rm Rm Rm
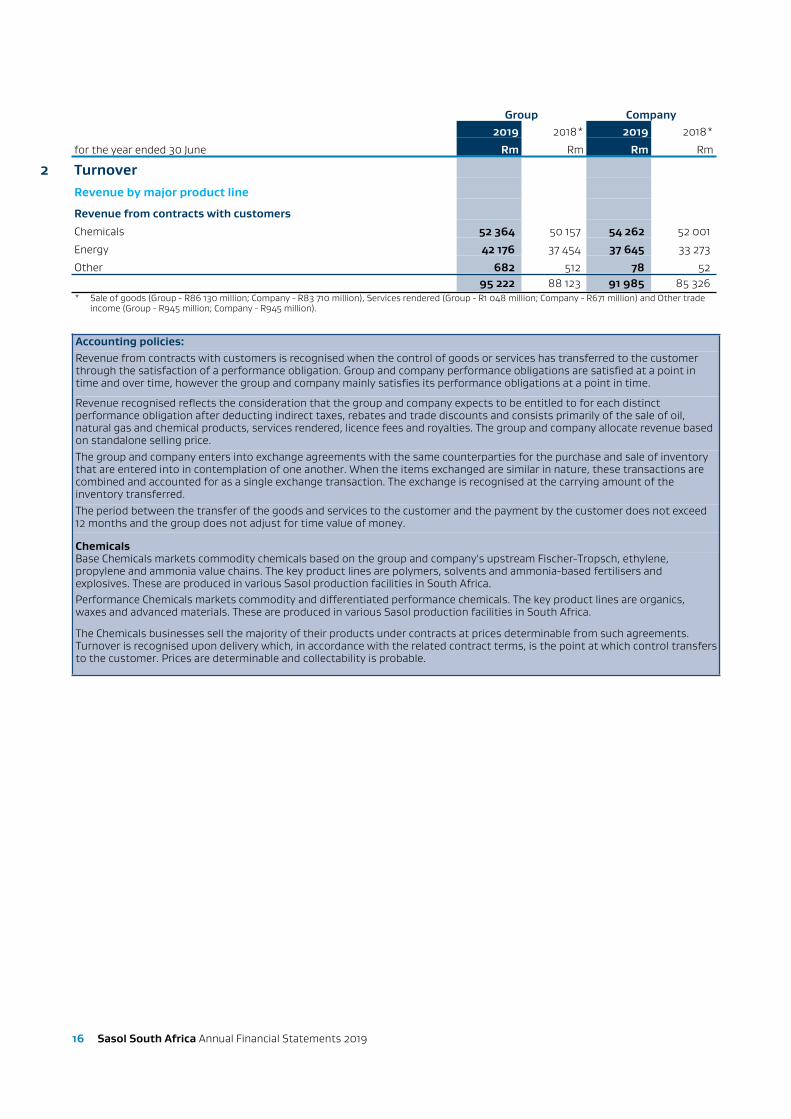
2 TurnoverRevenue by major product line
Revenue from contracts with customers
Chemicals 52 364 50 157 54 262 52 001
Energy 42 176 37 454 37 645 33 273
Other 682 512 78 5295 222 88 123 91 985 85 326
* Sale of goods (Group - R86 130 million; Company - R83 710 million), Services rendered (Group - R1 048 million; Company - R671 million) and Other trade income (Group - R945 million; Company - R945 million).
Accounting policies:Revenue from contracts with customers is recognised when the control of goods or services has transferred to the customer through the satisfaction of a performance obligation. Group and company performance obligations are satisfied at a point in time and over time, however the group and company mainly satisfies its performance obligations at a point in time.
Revenue recognised reflects the consideration that the group and company expects to be entitled to for each distinct performance obligation after deducting indirect taxes, rebates and trade discounts and consists primarily of the sale of oil, natural gas and chemical products, services rendered, licence fees and royalties. The group and company allocate revenue based on standalone selling price.The group and company enters into exchange agreements with the same counterparties for the purchase and sale of inventory that are entered into in contemplation of one another. When the items exchanged are similar in nature, these transactions are combined and accounted for as a single exchange transaction. The exchange is recognised at the carrying amount of the inventory transferred.The period between the transfer of the goods and services to the customer and the payment by the customer does not exceed 12 months and the group does not adjust for time value of money.
ChemicalsBase Chemicals markets commodity chemicals based on the group and company's upstream Fischer-Tropsch, ethylene, propylene and ammonia value chains. The key product lines are polymers, solvents and ammonia-based fertilisers and explosives. These are produced in various Sasol production facilities in South Africa.Performance Chemicals markets commodity and differentiated performance chemicals. The key product lines are organics, waxes and advanced materials. These are produced in various Sasol production facilities in South Africa.
The Chemicals businesses sell the majority of their products under contracts at prices determinable from such agreements. Turnover is recognised upon delivery which, in accordance with the related contract terms, is the point at which control transfers to the customer. Prices are determinable and collectability is probable.

Sasol South Africa Annual Financial Statements 2019 17
The point of delivery is determined in accordance with the contractual agreements entered into with customers which are as follows:
Delivery terms Control passes to the customer:Ex-tank sales At the point in time when products are loaded into the customer’s vehicle or unloaded from
the seller’s storage tanks.Ex-works At the point in time when products are loaded into the customer’s vehicle or unloaded at the
seller’s premises.Products - CPT: At the point in time when the product is delivered to a specified location or main carrier.Products - CIF, CIP and CFR: At the point in time when the products are loaded into the transport vehicle.
Carriage Paid To (CPT); Cost Insurance Freight (CIF); Carriage and Insurance Paid (CIP); and Cost Freight Railage (CFR)
Carriage, freight and insurance: Over the period of transporting the products to the customer’s nominated place – where the seller is responsible for carriage, freight and insurance costs, which are included in the contract.
Free on Board At the point in time when products are loaded into the transport vehicle; the customer is responsible for shipping and handling costs.
Delivered at Place At the point in time when products are delivered to and signed for by the customer.
Consignment Sales As and when products are consumed by the customer.
EnergySecunda Synfuels Operations sells synthetic fuels components to Sasol Oil (Pty) Ltd under the Component Supply Agreement (CSA) at prices determined by the CSA. Turnover is recognised when in accordance with the related contract terms, control have passed to the customer, which is when the products have passed over the appropriate weigh bridge or flow meter.
Gas is sold under long-term contracts at a price determinable from the supply agreements in accordance with the pricing methodology used by the National Energy Regulator of South Africa (NERSA). Turnover is recognised at the point in time when the gas has reached the inlet coupling of the customer, which is the point at which control passes to the customer. Gas analysis and tests of the specifications and content are performed prior to delivery.
IFRS 15 applicable in 2019:
Revenue from contracts with customers is recognised when the control of goods or services has transferred to the customer through the satisfaction of a performance obligation. The group and company’s performance obligations are satisfied at a point in time and over time, however the group and company mainly satisfies its performance obligations at a point in time.Revenue recognised reflects the consideration that the group and company expects to be entitled to for each distinct performance obligation after deducting indirect taxes, rebates and trade discounts and consists primarily of the sale of goods, services rendered and other trade income. The group and company allocate revenue based on stand-alone selling price. The group and company enters into exchange agreements with the same counterparties for the purchase and sale of inventory that are entered into in contemplation of one another. When the items exchanged are similar in nature, these transactions are combined and accounted for as a single exchange transaction. The exchange is recognised at the carrying amount of the inventory transferred. The period between the transfer of the goods and services to the customer and the payment by the customer does not exceed 12 months and the group and company do not adjust for time value of money.The period between the transfer of the goods and services to the customer and the payment by the customer does not exceed 12 months and the group and company do not adjust for time value of money.
IAS 18 applicable in prior periods:Revenue is recognised at the fair value of the consideration received or receivable net of indirect taxes, rebates and trade discounts and consists primarily of the sale of products, services rendered, and other trade income.■ evidence of an arrangement exists;■ delivery has occurred or services have been rendered and the significant risks and rewards of ownership have been
transferred to the purchaser;■ transaction costs can be reliably measured;■ the selling price is fixed or determinable; and■ collectability is reasonably assured.The timing of revenue recognition is as follows. Revenue from:■ the sale of products is recognised when the group and company have substantially transferred all the risks and rewards of
ownership and no longer retains continuing managerial involvement associated with ownership or effective control;
■ services rendered is based on the stage of completion of the transaction, based on the proportion that costs incurred to date bear to the total cost of the project; and
■ licence fees and royalties are recognised on an accrual basis.The group and company enters into exchange agreements with the same counterparties for the purchase and sale of inventory that are entered into in contemplation of one another. When the items exchanged are similar in nature, these transactions are combined and accounted for as a single exchange transaction. The exchange is recognised at the carrying amount of the inventory transferred.

18 Sasol South Africa Annual Financial Statements 2019
Group Company2019 2018 2019 2018
for the year ended 30 June Rm Rm Rm Rm
3 Materials, energy and consumables usedCost of raw materials 30 073 27 088 34 884 32 572Cost of energy and other consumables used in production process 5 956 5 738 5 951 5 735
36 029 32 826 40 835 38 307
Costs relating to items that are consumed in the manufacturing process, including changes in inventories and distribution costs up until the point of sale.
Group Company2019 2018 2019 2018
for the year ended 30 June Note Rm Rm Rm Rm
4 Employee-related expenditureAnalysis of employee costsLabour 15 308 14 708 14 943 14 357 salaries, wages and other employee related expenditure 14 885 14 257 14 520 13 907 post-employment benefits 423 451 423 450Share-based payment expenses 759 1 003 729 980 equity-settled 33 1 053 549 1 018 535 cash-settled 32 (294) 454 (289) 445
Total employee-related expenditure 16 067 15 711 15 672 15 337Costs capitalised to projects (1 022) (939) (1 008) (925)
Per income statement 15 045 14 772 14 664 14 412
The total number of permanent and non-permanent employees, in approved positions, excluding joint ventures' and associates' employees, is analysed below:
Group Company2019 2018 2019 2018
for the year ended 30 June Number Number Number NumberPermanent employees 17 173 17 339 16 862 17 026
Non-permanent employees 235 178 235 17817 408 17 517 17 097 17 204
Accounting policies:
Remuneration of employees is charged to the income statement, except where it is capitalised to projects in line with the accounting policy for assets under construction. Short-term employee benefitsShort-term employee benefits includes salaries, wages and costs of temporary employees, paid vacation leave, sick leave and incentive bonuses. Long-term employee benefits
Long-term employee benefits are those benefits that are expected to be wholly settled more than 12 months after the end of the annual reporting period, in which the services have been rendered and are discounted to their present value.Post-retirement benefitsFurther information on these benefits is provided in note 31, and include defined benefit contribution plans, as well as defined benefit plans.

Sasol South Africa Annual Financial Statements 2019 19
Group Company2019 2018 2019 2018
for the year ended 30 June Rm Rm Rm Rm
5 Translation (losses)/gainsArising fromTrade and other receivables 95 298 88 282Trade and other payables 19 (103) 26 (73)Foreign currency loans (212) (1) (212) (1)Other (27) 27 (6) (23)
(125) 221 (104) 185
Differences arising on the translation of monetary assets and liabilities into functional currency.
Group Company2019 2018 2019 2018
for the year ended 30 June Rm Rm Rm Rm
6 Other operating expenses and incomeRentals 912 864 889 842Insurance 600 536 576 512Computer costs 1 807 1 626 1 803 1 622Hired labour 516 561 513 547Audit remuneration 38 38 36 36Derivative (gains)/losses (including foreign exchange contracts) (83) – (83) –Professional fees 683 927 669 916Changes in rehabilitation provisions 607 (917) 607 (917)Other expenses 4 865 4 212 4 676 3 981Other operating income (3 755) (3 483) (4 050) (3 695)
6 190 4 364 5 636 3 844
20 Sasol South Africa Annual Financial Statements 2019
Group Company2019 2018 2019 2018
for the year ended 30 June Note Rm Rm Rm Rm
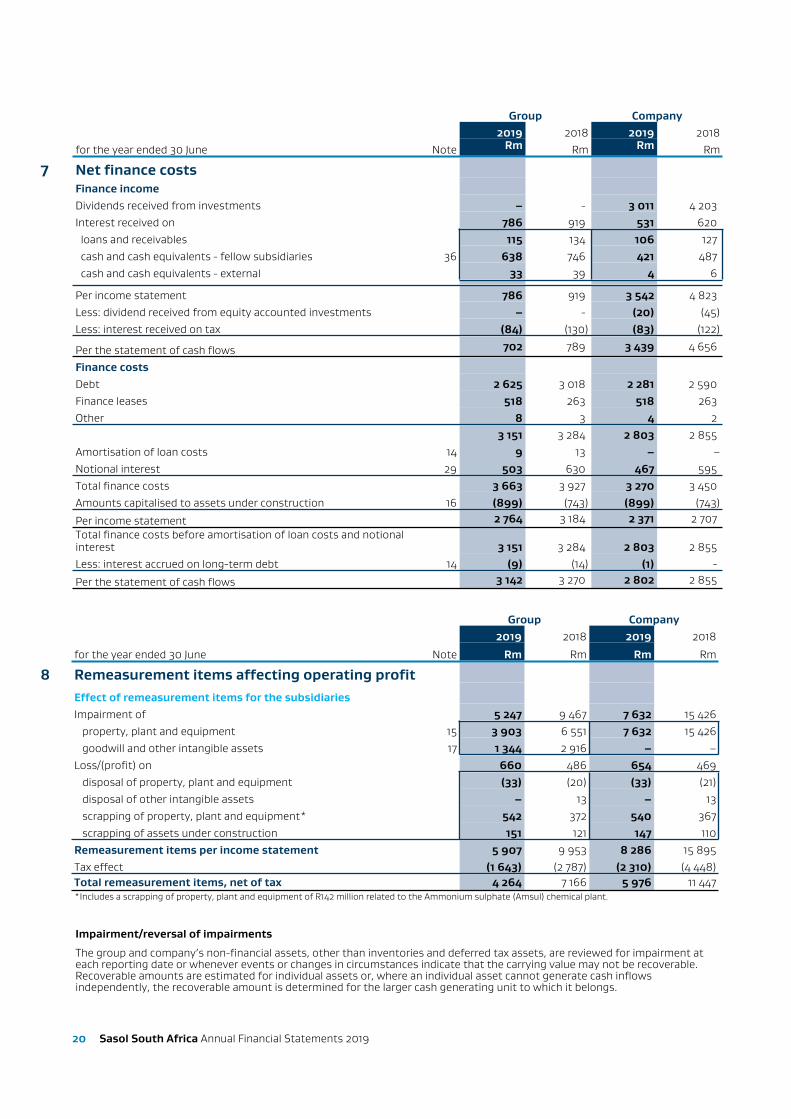
7 Net finance costsFinance incomeDividends received from investments – - 3 011 4 203Interest received on 786 919 531 620 loans and receivables 115 134 106 127 cash and cash equivalents - fellow subsidiaries 36 638 746 421 487 cash and cash equivalents - external 33 39 4 6
Per income statement 786 919 3 542 4 823Less: dividend received from equity accounted investments – - (20) (45)Less: interest received on tax (84) (130) (83) (122)
Per the statement of cash flows 702 789 3 439 4 656
Finance costsDebt 2 625 3 018 2 281 2 590Finance leases 518 263 518 263Other 8 3 4 2
3 151 3 284 2 803 2 855Amortisation of loan costs 14 9 13 – –Notional interest 29 503 630 467 595Total finance costs 3 663 3 927 3 270 3 450Amounts capitalised to assets under construction 16 (899) (743) (899) (743)
Per income statement 2 764 3 184 2 371 2 707Total finance costs before amortisation of loan costs and notional interest 3 151 3 284 2 803 2 855Less: interest accrued on long-term debt 14 (9) (14) (1) -
Per the statement of cash flows 3 142 3 270 2 802 2 855
Group Company2019 2018 2019 2018
for the year ended 30 June Note Rm Rm Rm Rm
8 Remeasurement items affecting operating profitEffect of remeasurement items for the subsidiariesImpairment of 5 247 9 467 7 632 15 426 property, plant and equipment 15 3 903 6 551 7 632 15 426 goodwill and other intangible assets 17 1 344 2 916 – –Loss/(profit) on 660 486 654 469 disposal of property, plant and equipment (33) (20) (33) (21) disposal of other intangible assets – 13 – 13 scrapping of property, plant and equipment* 542 372 540 367 scrapping of assets under construction 151 121 147 110Remeasurement items per income statement 5 907 9 953 8 286 15 895Tax effect (1 643) (2 787) (2 310) (4 448)Total remeasurement items, net of tax 4 264 7 166 5 976 11 447*Includes a scrapping of property, plant and equipment of R142 million related to the Ammonium sulphate (Amsul) chemical plant.
Impairment/reversal of impairments
The group and company’s non-financial assets, other than inventories and deferred tax assets, are reviewed for impairment at each reporting date or whenever events or changes in circumstances indicate that the carrying value may not be recoverable. Recoverable amounts are estimated for individual assets or, where an individual asset cannot generate cash inflows independently, the recoverable amount is determined for the larger cash generating unit to which it belongs.

Sasol South Africa Annual Financial Statements 2019 21
Impairment calculations
The recoverable amount of the assets reviewed for impairment is determined based on the higher of the fair value less costs to sell or value-in-use calculations. Key assumptions relating to this include the discount rate and cash flows. Future cash flows are estimated based on financial budgets covering a five year period and extrapolated over the useful life of the assets to reflect the long-term plans for the group and company using the estimated growth rate for the specific business or project. Where reliable cash flow projections are available for a period longer than five years, those budgeted cash flows are used in the impairment calculation. The estimated future cash flows and discount rate are post-tax, based on the assessment of current risks applicable to the specific entity and country in which it operates. Discounting post-tax cash flows at a post-tax discount rate yields the same results as discount pre-tax cash flows at a pre-tax discount rate, assuming there are no significant temporary tax differences.
The Phenolics, Ammonia and Specialty Gases business was internally transferred within the Chemicals Strategic Business Unit (SBU) from Performance Chemicals to Base Chemicals on 1 July 2018. Management of the Ammonia and Specialty Gases is housed in the Energy SBU.
Main assumptions used for impairment calculationsGroup Company
2019 2018 2019 2018Growth rate – long-term Producer Price Index % 5,50 5,50 5,50 5,50Weighted average cost of capital* % 13,12 12,71 13,12 12,71Discount rate – risk adjusted % 13,12 12,71 13,12 12,71Long-term average ammonia price** Rand/ton 4 258,54 5 807,46 4 258,54 5 807,46Long-term average wax price** Rand/ton 23 705,80 21 961,20 23 705,80 21 961,20Long-term average exchange rate** Rand/US$ 14,29 13,57 14,29 13,57* Calculated using spot market factors on 30 June.
** Assumptions are provided on a long-term average basis. The 2019 and 2018 exchange rate, wax and ammonia price assumptions are calculated based on a five year period.
Areas of judgement:Management determines the expected performance of the assets based on past performance and its expectations of market development. The weighted average growth rates used are consistent with the increase in the long-term Producer Price Index. Estimations are based on a number of key assumptions such as volume, price and product mix which will create a basis for future growth and gross margin. These assumptions are set in relation to historic figures and external reports. If necessary, these cash flows are then adjusted to take into account any changes in assumptions or operating conditions that have been identified subsequent to the preparation of the budgets.The weighted average cost of capital (WACC) rate is derived from a pricing model based on credit risk and the cost of the debt. The variables used in the model are established on the basis of management judgement and current market conditions. Management judgement is also applied in estimating the future cash flows and defining of the cash generating units. These values are sensitive to the cash flows projected for the periods for which detailed forecasts are not available and to the assumptions regarding the long-term sustainability of the cash flows thereafter.
Determining as to whether, and by how much, cost incurred on a project is abnormal and needs to be scrapped involves judgement. The factors considered by management include the scale and complexity of the project, the technology being applied and guidance from experts.
Significant impairments of assets in the group in 2019
Base Chemicals cash generating units (CGUs)
The Base Chemicals CGUs were impaired by R6 095 million at 30 June 2019 mainly due to a R1 586 million further impairment of the Methanol CGU and a further impairment of R4 509 million of the Ammonia CGU. At 30 June 2019 the recoverable amounts of the Methanol CGU and Ammonia CGU were R547 million and R3 142 million respectively.
The Ammonia CGU impairment is largely driven by lower international Ammonia sales price assumptions in the short- to medium-term and increased gas feedstock prices in the longer term impacting on the Base Chemicals margins. The recoverable amount of the Ammonia CGU is largely impacted by global Ammonia prices and a 5% change in the global Ammonia price could change the recoverable amount by approximately R1 858 million. A US$1/GJ increase in gas feedstock prices in the long-term will decrease the recoverable amount by approximately R319 million. The performance of the Ammonia CGU is also highly sensitive to Rand/US dollar exchange rate and weighted average cost of capital (WACC) rate movements. A 5% change in the exchange rate assumption could impact the recoverable amount by approximately R2 500 million. A 1% change in the WACC rate could change the recoverable amount by approximately R293 million.
The Methanol CGU impairment is largely driven by increased gas feedstock prices in the longer term impacting on the Base Chemicals margins. A US$1/GJ increase in gas feedstock prices in the long-term will decrease the recoverable amount by approximately R82 million. The performance of the Methanol CGU is also highly sensitive to Rand/US dollar exchange rate and weighted average cost of capital (WACC) rate movements. A 5% change in the exchange rate assumption could impact the recoverable amount by approximately R292 million. A 1% change in the WACC rate could change the recoverable amount by approximately R63 million.
The macroeconomic factors are outside of the control of management. The Base Chemicals CGUs are highly sensitive to variability in product prices driven by changes in the global market conditions. We continue to monitor these assets for further impairments or signs of recovery indicating a reversal of impairment.
22 Sasol South Africa Annual Financial Statements 2019
Significant reversal of impairment of assets in the group in 2019
Base Chemicals cash generating units (CGUs)
In 2018, the Chlor Vinyls value chain was impaired by R3 918 million due to the continued and sustained strengthening of the exchange rate outlook and the resulting impact on Base Chemicals margins. A structural change in the integrated ethylene value chain led to the useful life extension from 2034 to 2050 of the Chlor Vinyls value chain in Sasolburg resulting in a partial reversal of impairment of R848 million. The recoverable amount of the Chlor Vinyls value chain is R2 840 million as at 30 June 2019.
The performance of the Chlor Vinyls value chain is highly sensitive to Rand/US dollar exchange rate and weighted average cost of capital (WACC) rate movements. A 5% change in the exchange rate assumption could impact the recoverable amount by approximately R2 610 million. A 1% change in the WACC rate could change the recoverable amount by approximately R368 million.
The macroeconomic factors are outside of the control of management. The Base Chemicals CGUs are highly sensitive to variability in product prices driven by changes in the global market conditions. We continue to monitor these assets for further impairments or signs of recovery indicating a reversal of impairment.
Significant impairments of assets in the group in 2018
Base Chemicals cash generating units (CGUs)
The Base Chemicals CGUs were impaired by R8 641 million at 30 June 2018 mainly due to a R4 723 million impairment of the Polythene CGU and a R3 918 million impairment of the Chlor Vinyls value chain. At 30 June 2018 the recoverable amounts of the Polythene CGU and Chlor Vinyls value chain were R6 258 million and R258 million respectively.
These impairments were largely driven by the strengthening of the Rand against the US dollar and the resulting impact on the Base Chemicals margins. The performance of the Polythene CGU and Chlor Vinyls value chain is highly sensitive to Rand/US dollar exchange rate and WACC rate movements. A 5% change in the exchange rate assumption could change the recoverable amount by approximately R2 372 million for the Polythene CGU and R1 969 million for the Chlor Vinyls value chain. A 1% change in the WACC rate could change the recoverable amount by approximately R454 million for the Polythene CGU and R30 million for the Chlor Vinyls value chain.
Performance Chemicals CGUs
The Ammonia CGU was further impaired by R805 million at 30 June 2018. At 30 June 2018 the recoverable amount of the Ammonia CGU was R4 631 million.
The recoverable amount of the Ammonia CGU is largely impacted by global Ammonia prices and the Rand/US dollar exchange rate. A 5% change in the global Ammonia price could change the recoverable amount by approximately R1 219 million and a 5% change in the Rand/US dollar exchange rate assumption could change the recoverable amount by R604 million. A 1% change in WACC rate could change the recoverable amount by approximately R469 million.
Significant impairments of assets in the company in 2019
Base Chemicals cash generating units (CGUs)
The Base Chemicals CGUs were impaired by R4 079 million at 30 June 2019 mainly due to a R864 million further impairment of the Chlor Vinyls CGU, a R273 million impairment of the Methanol CGU, a R1 772 million impairment of the Acrylates and Butanol CGU and a R1 170 million further impairment of the Ammonia CGU. At 30 June 2019 the recoverable amounts for the Chlor Vinyls CGU was negative R3 996 million, negative R2 924 million for the Methanol CGU and negative R7 411 million for the Ammonia CGU. The recoverable amount for the Acrylates and Butanol CGU was R2 304 million.
The Chlor Vinyls CGU impairment was largely driven by an increase in gas feedstock prices in the longer term and a lower sales price outlook resulting in a negative impact on Base Chemicals profit margins. A US$1/GJ increase in gas feedstock price in the long-term will decrease the recoverable amount by R58 million. The performance of the Chlor Vinyls CGU is also highly sensitive to the Rand/US dollar exchange rate and weighted average cost of capital (WACC) rate movements. A 5% change in the exchange rate assumption could impact the recoverable amount by approximately R3 612 million. A 1% change in the WACC rate could change the recoverable amount by approximately R139 million.
The Acrylates and Butanol CGU impairment was largely driven by lower margins resulting from a lower sales price outlook. The performance of the Acrylates and Butanol CGU is highly sensitive to Rand/US dollar exchange rate and WACC rate movements. A 5% change in the exchange rate assumption could impact the recoverable amount by approximately R1 942 million. A 1% change in the WACC rate could change the recoverable amount by approximately R339 million.
The Ammonia CGU impairment is largely driven by lower international Ammonia sales price assumptions in the short- to medium-term and increased gas feedstock prices in the longer term impacting on the Base Chemicals margins. The recoverable amount of the Ammonia CGU is largely impacted by global Ammonia prices and a 5% change in the global Ammonia price could change the recoverable amount by approximately R2 017 million. A US$1/GJ increase in gas feedstock prices in the long-term will decrease the recoverable amount by approximately R319 million. The performance of the Ammonia CGU is also highly sensitive to Rand/US dollar exchange rate and weighted average cost of capital (WACC) rate movements. A 5% change in the exchange rate assumption could impact the recoverable amount by approximately R2 885 million. A 1% change in the WACC rate could change the recoverable amount by approximately R211 million.
The Methanol CGU impairment is largely driven by increased gas feedstock prices in the longer term impacting on the Base Chemicals margins. A US$1/GJ increase in gas feedstock prices in the long-term will decrease the recoverable amount by approximately R82 million. The performance of the Methanol CGU is also highly sensitive to Rand/US dollar exchange rate and weighted average cost of capital (WACC) rate movements. A 5% change in the exchange rate assumption could impact the recoverable amount by approximately R409 million. A 1% change in the WACC rate could change the recoverable amount by approximately R126 million.
The macroeconomic factors are outside of the control of management. The Base Chemicals CGUs are also highly sensitive to variability in product prices driven by changes in the global market conditions. We continue to monitor these assets for further impairments or signs of recovery indicating a reversal of impairment.

Sasol South Africa Annual Financial Statements 2019 23
Performance Chemicals CGUs
The Wax CGU was further impaired by R3 553 million at 30 June 2019. At 30 June 2019 the recoverable amount of the Wax CGU was negative R328 million.
The impairment was largely driven by increased gas feedstock prices in the longer term impacting on the Performance Chemicals margins. A US$1/GJ increase in gas feedstock prices in the long-term will decrease the recoverable amount by approximately R181 million. The performance of the Wax CGU is highly sensitive to prevailing market prices of wax, Rand/US dollar and Rand/EUR exchange rate and weighted average cost of capital (WACC) rate movements. A 5% change in the wax sales prices would result in a R2 473 million change in the recoverable amount, whereas a 5% change in the exchange rate assumption could impact the recoverable amount by approximately R1 806 million. A 1% change in the WACC rate could change the recoverable amount by approximately R301 million.
The macroeconomic factors are outside of the control of management. The Performance Chemicals CGUs are also highly sensitive to variability in product prices driven by changes in the global market conditions. We continue to monitor these assets for further impairments or signs of recovery indicating a reversal of impairment.
Significant impairments of assets in the company in 2018
Base Chemicals cash generating units (CGUs)
The Base Chemicals CGUs were impaired by R9 511 million at 30 June 2018 mainly due to a R6 937 million impairment of the Polythene CGU and a R2 574 million impairment of the Chlor Vinyls CGU. At 30 June 2018 the recoverable amounts of the Polythene CGU and Chlor Vinyls CGU were R2 212 million and negative R4 803 million respectively.
These impairments were largely driven by the strengthening of the Rand against the US dollar and the resulting impact on the Base Chemicals margins. The performance of the Polythene CGU and Chlor Vinyls CGU is highly sensitive to Rand/US dollar exchange rate and WACC rate movements. A 5% change in the exchange rate assumption could change the recoverable amount by approximately R2 372 million for the Polythene CGU and R1 969 million for the Chlor Vinyls CGU. A 1% change in the WACC rate could change the recoverable amount by approximately R229 million for the Polythene CGU and R245 million for the Chlor Vinyls CGU.
Performance Chemicals CGUs
The Performance Chemicals CGUs were impaired by R5 895 million at 30 June 2018 due to the R3 229 million and R2 666 million impairments of the Wax CGU and the Ammonia CGU respectively. At 30 June 2018 the recoverable amounts of the Wax CGU and Ammonia CGU were R4 183 million and negative R3 219 million respectively.
The performance of the Wax CGU is highly sensitive to the prevailing market prices of Wax, the Rand/US dollar and Rand/EUR exchange rate movements. The impairment was largely driven by lower margins resulting from lower sales prices and volumes as well as the strengthening of the Rand against the US dollar and EUR, when compared to financial year 2017. A 5% change in the wax sales prices would result in a R1 946 million change in the recoverable amount, whereas a 5% change in the Rand/US dollar and Rand/EUR would result in a change of R1 320 million in the recoverable amount. A 1% change in WACC rate would change the recoverable amount by approximately R417 million.
The recoverable amount of the Ammonia CGU is largely impacted by global Ammonia prices and the Rand/US dollar exchange rate. A 5% change in the global Ammonia price could change the recoverable amount by approximately R1 219 million and a 5% change in the Rand/US$ exchange rate assumption could change the recoverable amount by R604 million. A 1% change in WACC rate could change the recoverable amount by approximately R52 million.

24 Sasol South Africa Annual Financial Statements 2019
Accounting policies:Remeasurement items are items of income and expense recognised in the income statement that are less closely aligned to the operating or trading activities of the reporting entity and includes the impairment of non-current assets, profit or loss on disposal of non-current assets and scrapping of assets. The group and the company’s non-financial assets, other than inventories and deferred tax assets, are reviewed at each reporting date or whenever events or changes in circumstances indicate that the carrying amount may not be recoverable, to determine whether there is any indication of impairment. An impairment test is performed on all goodwill, intangible assets not yet in use and intangible assets with indefinite useful lives at each reporting date.
The recoverable amount of an asset is defined as the amount that reflects the greater of the fair value less costs of disposal and value-in-use that can be attributed to an asset as a result of its ongoing use by the entity. Value-in-use is estimated using a discounted cash flow model. The future cash flows are adjusted for risks specific to the asset. The recoverable amount may be adjusted to take into account recent market transactions for a similar asset.
Some assets are an integral part of the value chain but are not capable of generating independent cash flows because there is no active market for the product streams produced from these assets, or the market does not have the ability to absorb the product streams produced from these assets or it is not practically possible to access the market due to infrastructure constraints that would be costly to construct. Product streams produced by these assets form an input into another process and accordingly do not have an active market. These assets are classified as corporate assets in terms of IAS 36 when their output supports the production of multiple product streams that are ultimately sold into an active market.
The group and company’s corporate assets are allocated to the relevant cash generating unit based on a cost or volume contribution metric. Costs incurred by the corporate asset are allocated to the appropriate cash generating unit at cost. If there is an indication that a corporate asset may be impaired, then the recoverable amount is determined for the cash generating unit to which the corporate asset belongs.The gas value chain starts with the feedstock obtained in Mozambique and continues along the conversion processes in Secunda and Sasolburg, ultimately resulting in fuels and chemicals-based product lines. The group and company's of assets which support the different product lines, including corporate asset allocations, are considered to be separate cash generating units.
Certain products are sometimes produced incidentally from the main conversion processes and can be sold into active markets. When this is the case, the assets that are directly attributable to the production of these products, are classified as separate cash generating units. The cost of conversion of these products is compared against the revenue when assessing the asset for impairment.
For the purposes of goodwill impairment testing, cash-generating units to which goodwill has been allocated are aggregated so that the level at which impairment is tested reflects the lowest level at which goodwill is monitored internally. Impairment losses recognised in respect of a cash-generating unit are first allocated to reduce the carrying amount of the goodwill allocated to the unit and then to reduce the carrying amounts of the other assets in the unit on a pro rata basis relative to their carrying amounts. A previously recognised impairment loss on goodwill cannot be reversed.
Group Company2019 2018 2019 2018
for the year ended 30 June Rm Rm Rm Rm
9 Disposal groups held for saleAssets in disposal groups held for saleChemicals - Explosives business 1 229 – 1 229 –
Liabilities in disposal groups held for saleChemicals - Explosives business (388) – (388) –
The Explosives business was identified for partial divestment and collaboration with a world-class Explosives partner. The downstream portion of the Explosives business was classified as a disposal group held for sale at 30 June 2019, following approval to commence negotiations with a preferred partner, with the aim of creating a joint venture managed and operated by the partner. The partial divestment and partnering is expected to be completed within the next 12 months.

Sasol South Africa Annual Financial Statements 2019 25
Accounting policies:A non-current asset or disposal group (a business grouping of assets and their related liabilities) is designated as held for sale when its carrying amount will be recovered principally through a sale transaction rather than through continuing use.
The classification as held for sale of a non-current asset or disposal group occurs when it is available for immediate sale in its present condition and the sale is highly probable. A sale is considered highly probable if management is committed to a plan to sell the non-current asset or disposal group, an active divestiture programme has been initiated, the non-current asset or disposal group is marketed at a price reasonable to its fair value and the disposal will be completed within one year from classification.
Where a disposal group held for sale will result in the loss of control or joint control of a subsidiary or joint operation, respectively, all the assets and liabilities of that subsidiary or joint operation are classified as held for sale, regardless of whether a non-controlling interest in the former subsidiary or an ongoing interest in the joint operation is to be retained after the sale.
Where a disposal group held for sale will result in the loss of joint control of a joint venture or significant influence of an associate, the full investment is classified as held for sale. Equity accounting ceases from the date the joint venture or associate is classified as held for sale.Before classification of a non-current asset or disposal group as held for sale, it is reviewed for impairment. The impairment loss charged to the income statement is the excess of the carrying amount of the non-current asset over its expected fair value less costs to sell.
No depreciation or amortisation is provided on non-current assets from the date they are classified as held for sale.
Group Company2019 2018 2019 2018
for the year ended 30 June Rm Rm Rm Rm
10 TaxationSouth African normal tax 1 655 2 089 488 631 current year 1 579 2 251 371 802 prior years 76 (162) 117 (171)Foreign tax – current year 567 396 2 1 current year 482 456 2 1 prior years 85 (60) – –
Income tax 2 222 2 485 490 632Deferred tax – South Africa (670) (1 142) (844) (2 585) current year (678) (1 259) (851) (2 692) prior years 8 117 7 107
1 552 1 343 (354) (1 953)

26 Sasol South Africa Annual Financial Statements 2019
Group Company2019 2018 2019 2018
for the year ended 30 June % % % %
Reconciliation of effective tax rateThe table below shows the difference between the South African enacted tax rate (28%) compared to the effective tax rate in the income statement. Total income tax expense differs from the amount computed by applying the South African normal tax rate to profit before tax. The reasons for these differences are:South African normal tax rate 28,0 28,0 28,0 28,0Increase/(decrease) in rate of tax due to
disallowed expenditure1 0,8 11,8 1,1 (15,0)disallowed share-based payment expenses 1,7 0,5 2,6 (1,3)different tax rates 0,7 1,9 – –exempt income2 (0,2) (0,8) (13,2) 72,4energy efficiency allowances3 (15,9) (9,8) (24,1) 27,9prior year adjustments 1,7 (2,2) 1,9 3,9other adjustments (1,2) (0,9) (1,7) 2,5
Effective tax rate 15,6 28,5 (5,4) 118,41 Includes non-deductible expenses incurred not deemed to be in the production of taxable income.2 Exempt income mainly comprises dividends received (company).3 Energy efficiency allowances increased by R4,2 billion compared to prior year.
Group Company2019 2018 2019 2018
for the year ended 30 June Note Rm Rm Rm Rm
11 Tax paidNet amounts receivable at beginning of year (2 583) (2 684) (2 789) (2 745)Net interest on tax (81) (130) (80) (122)Income tax per income statement 10 2 222 2 485 490 632Foreign exchange differences recognised in income statement – (62) – –
(442) (391) (2 379) (2 235)Net tax (payable)/receivable per statement of financial position (68) 2 583 101 2 789
tax payable (169) (222) – –tax receivable 101 2 805 101 2 789
Per the statement of cash flows (510) 2 192 (2 278) 554
ComprisingNormal tax
South Africa (1 181) 1 871 (2 280) 553Foreign 671 321 2 1
(510) 2 192 (2 278) 554
Group Company2019 2018 2019 2018
for the year ended 30 June Rm Rm Rm Rm
12 Deferred taxReconciliationBalance at beginning of year 20 462 21 612 9 292 11 884Current year charge (521) (1 169) (697) (2 611) per the income statement (670) (1 142) (844) (2 585) per the statement of changes in equity 62 (65) 61 (63) per the statement of comprehensive income 87 38 86 37Transfer to disposal groups held for sale (9) – (9) –Transfer to other businesses (3) 19 (2) 19Balance at end of year 19 929 20 462 8 584 9 292
Deferred tax liabilities are determined based on the tax status and rate of the underlying entities.

Sasol South Africa Annual Financial Statements 2019 27
Group Company2019 2018 2019 2018
for the year ended 30 June Rm Rm Rm Rm
Deferred tax is attributable to temporary differences on the following:Net deferred tax liabilities:Property, plant and equipment 17 027 16 490 12 746 13 014Intangible assets 7 139 8 031 – –Current assets (524) (202) (449) (128)Short- and long-term provisions (3 306) (3 176) (3 157) (3 032)Current liabilities (205) (224) (194) (215)Calculated tax losses (63) (107) – –Other (139) (350) (362) (347)
19 929 20 462 8 584 9 292
Accounting policies:The income tax charge is determined based on net income before tax for the year and includes deferred tax.The current tax charge is the tax payable on the taxable income for the financial year applying enacted or substantively enacted tax rates and includes any adjustments to tax payable in respect of prior years. Deferred tax is provided for using the liability method, on all temporary differences between the carrying amount of assets and liabilities for accounting purposes and the amounts used for tax purposes and on any tax losses. No deferred tax is provided on temporary differences relating to:■ the initial recognition of goodwill; ■ the initial recognition (other than in a business combination) of an asset or liability to the extent that neither accounting nor
taxable profit is affected on acquisition; and ■ investments in subsidiaries, associates and interests in joint arrangements to the extent that the temporary difference will
probably not reverse in the foreseeable future and the control of the reversal of the temporary difference lies with the parent, investor, joint venturer or joint operator.
The provision for deferred tax is calculated using enacted or substantively enacted tax rates at the reporting date that are expected to apply when the asset is realised or liability settled.Deferred tax assets and liabilities are offset when the related income taxes are levied by the same taxation authority, there is a legally enforceable right to offset and there is an intention to settle the balances on a net basis.
Group and Company2019 2018
for the year ended 30 June Rm Rm
13 Share capitalIssued share capital (as per statement of changes in equity) 68 834 68 834
Group and CompanyNumber of shares
2019 2018AuthorisedOrdinary shares of no par value 400 000 000 400 000 000
Issued - no par value sharesShares issued at beginning of year 288 371 336 167
Shares issued during the year* – 288 371 169Shares issued at end of year 288 371 336 288 371 336*Shares issued in prior year related to the implementation of the Sasol Khanyisa transaction. 26,5 million were issued to the Khanyisa ESOP, another 26,5 million were issued to Sasol Khanyisa Fundco (RF) Limited and 235,4 million were issued to Sasol Limited.
Share Capital
The capital of the group is managed by its ultimate holding company, Sasol Limited, by means of an approved group funding policy, which determines each group entity’s required rate of return.
Accounting policies:Issued share capital is stated in the statement of changes in equity at the amount of the proceeds received less directly attributable issue costs.

28 Sasol South Africa Annual Financial Statements 2019
Group Company2019 2018 2019 2018
for the year ended 30 June Note Rm Rm Rm Rm
14 Long-term debtFellow subsidiaries 36 65 973 67 435 65 644 67 023External 7 637 8 133 5 054 4 676Total long-term debt 73 610 75 568 70 698 71 699Short-term portion (4 218) (4 088) (3 101) (3 122)
69 392 71 480 67 597 68 577Analysis of long-term debtAt amortised costSecured debt 2 590 3 473 – –Finance leases* 35 4 267 4 474 4 267 4 474Unsecured debt 66 761 67 638 66 431 67 225Unamortised loan costs (8) (17) – –
73 610 75 568 70 698 71 699ReconciliationBalance at beginning of year 75 568 78 587 71 699 74 056Loans raised 1 912 5 517 1 912 5 417 proceeds from loans 1 891 1 681 1 891 1 581 finance leases acquired 21 3 836 21 3 836Loans repaid (4 100) (8 585) (3 126) (7 796)Interest accrued 7 9 14 1 –Amortisation of loan costs 7 9 13 – –Translation effect of foreign currency loans 212 22 212 22Balance at end of year 73 610 75 568 70 698 71 699Interest-bearing statusInterest-bearing debt 72 836 75 064 69 924 71 195Non-interest-bearing debt 774 504 774 504
73 610 75 568 70 698 71 699Maturity profileWithin one year 4 218 4 088 3 101 3 122One to five years 13 710 13 729 11 916 10 826More than five years 55 682 57 751 55 681 57 751
73 610 75 568 70 698 71 699
*Mainly relate to finance leases for the Air Separation Unit in Secunda, Sasolburg Oxygen plant and the BASF Catalyst plant in the Netherlands.
Fair value of long-term debt The fair value of long-term debt is based on the current rates available for debt with the same maturity profile and with similar cash flows. Market related rates ranging from 2,3% to 13,0% was used to discount estimated cash flows based on the underlying currency of the debt.
Group Company2019 2018 2019 2018
Rm Rm Rm Rm
Total long-term debt (before unamortised loan costs)* 73 671 80 051 70 693 76 068* The difference in the fair value of long-term debt compared to the carrying value is mainly due to the 0% loan from Sasol Limited.

Sasol South Africa Annual Financial Statements 2019 29
Group
Interest rate at 2019 2018
Terms of repayment Security Business Currency 30 June 2019 Rm RmSecured debtRepayable in bi-annual instalments ending June 2022
Secured by property,plant and equipment with a carrying value of R4 941 million (2018 - R5 415 million)
Energy (Rompco)
Rand Jibar + 1,75% 2 590 3 473
Finance leasesRepayable in equal monthly instalments ending June 2050
Underlying assets Energy Various Fixed 2,3% to 12,14%
3 590 3 707
Repayable in equal monthly instalments ending November 2030
Underlying assets Chemicals Various Fixed 3,7%to 13%
674 760
Other finance leases Underlying assets Various Various Various 3 74 267 4 474
Unsecured debtRepayable in annual instalments ending June 2026 Energy,
ChemicalsRand Jibar + 2,5% 19 096 20 257
Other Other Rand – 788 504Repayable on 30 days written notice from Sasol Limited1
Sasol South Africa Limited
Rand Fixed 0% 46 877 46 877
Total unsecured debt 66 761 67 638
Total long-term debt 73 618 75 585
Unamortised loan costs (amortised over period of debt using the effective interest rate method)
(8) (17)
73 610 75 568
Short-term portion of long-term debt (4 218) (4 088)
69 392 71 480
CompanyInterest rate at 2019 2018
Terms of repayment Security Business Currency 30 June 2019 Rm RmFinance leasesRepayable in equal monthly instalments ending June 2050
Underlying assets Energy Various Fixed 2,3% to 12,14%
3 590 3 707
Repayable in equal monthly instalments ending November 2030
Underlying assets Chemicals Various Fixed 3,7%to 13%
674 760
Other finance leases Underlying assets Various Various Various 3 74 267 4 474
Unsecured debtRepayable in annual instalments ending June 2026 Energy,
ChemicalsRand Jibar + 2,5% 18 767 19 844
Other Other Rand – 787 504Repayable on 30 days written notice from Sasol Limited1
Sasol South Africa Limited
Rand Fixed 0% 46 877 46 877
Total unsecured debt 66 431 67 225
Total long-term debt 70 698 71 699Short-term portion of long-term debt (3 101) (3 122)
67 597 68 5771 Sasol South Africa Limited (SSA) purchased 100% of the shares in Sasol Gas (Pty) Ltd from Sasol Limited on 30 June 2017 for R51,2 billion (fair value). The
purchase was funded by a loan from Sasol Limited at 0% interest. The loan is payable on 30 day’s written notice from Sasol Limited to SSA. Sasol Limited made an election not to exercise its right to demand payment from SSA under the loan note for the 12 month period from 1 July 2019 to 30 June 2020.

30 Sasol South Africa Annual Financial Statements 2019
Accounting policies:Debt, which constitutes a financial liability, includes short-term and long-term debt. Debt is initially recognised at fair value, net of transaction costs incurred and is subsequently stated at amortised cost. Debt is classified as short-term unless the borrowing entity has an unconditional right to defer settlement of the liability for at least 12 months after the reporting date.Debt is derecognised when the obligation in the contract is discharged, cancelled or has expired. Premiums or discounts arising from the difference between the fair value of debt raised and the amount repayable at maturity date are charged to the income statement as finance expenses based on the effective interest method.A debt modification gain or loss is recognised immediately when a debt measured at amortised cost has been modified.
Group
Land
Buildingand
improvements
Plant,equipment
and vehicles Total
for the year ended 30 June Rm Rm Rm Rm
15 Property, plant and equipmentCarrying amount at 30 June 2018 401 3 981 73 251 77 633Additions to sustain existing operations – 4 196 200Net reclassification to other assets (7) 4 (25) (28)Projects capitalised – 245 12 687 12 932Reclassification to disposal groups held for sale (8) (44) (358) (410)Rehabilitation provisions capitalised – – 30 30
Disposals and scrapping (22) (37) (510) (569)Current year depreciation charge – (251) (9 144) (9 395)Impairment of property, plant and equipment – – (3 903) (3 903)Carrying amount at 30 June 2019 364 3 902 72 224 76 490
Group
Land
Buildingand
improvements
Plant,equipment
and vehicles Total
for the year ended 30 June Rm Rm Rm RmCarrying amount at 30 June 2017 353 3 999 71 049 75 401Additions to sustain existing operations – – 3 972 3 972Prior year lease adjustment – – (221) (221)
Net reclassification from other assets – – (8) (8)Reduction in rehabilitation provisions capitalised – – (49) (49)Projects capitalised 27 237 14 325 14 589Reclassification from disposal groups held for sale 24 – – 24Disposals and scrapping (3) (1) (374) (378)Current year depreciation charge – (254) (8 892) (9 146)
Impairment of property, plant and equipment – – (6 551) (6 551)Carrying amount at 30 June 2018 401 3 981 73 251 77 633
2019Cost 364 6 474 167 455 174 293
Accumulated depreciation and impairment – (2 572) (95 231) (97 803)364 3 902 72 224 76 490
2018Cost 401 6 416 160 426 167 243
Accumulated depreciation and impairment – (2 435) (87 175) (89 610)401 3 981 73 251 77 633

Sasol South Africa Annual Financial Statements 2019 31
Company
Land
Buildingand
improvements
Plant,equipment
and vehicles Total
for the year ended 30 June Rm Rm Rm Rm
Carrying amount at 30 June 2018 387 3 922 56 648 60 957Additions to sustain existing operations – 4 191 195Net reclassification to other assets (7) 4 (22) (25)Projects capitalised – 245 12 319 12 564Reclassification to disposal groups held for sale (8) (44) (358) (410)Disposals and scrapping (22) (37) (503) (562)Current year depreciation charge – (247) (8 170) (8 417)Impairment of property, plant and equipment – – (7 632) (7 632)Carrying amount at 30 June 2019 350 3 847 52 473 56 670
Company
Land
Buildingand
improvements
Plant,equipment
and vehicles Total
for the year ended 30 June Rm Rm Rm RmCarrying amount at 30 June 2017 340 3 937 62 702 66 979Additions to sustain existing operations – – 3 973 3 973Prior year lease adjustment – – (221) (221)
Net reclassification from other assets – – (8) (8)Projects capitalised 26 233 14 187 14 446Reclassification from disposal groups held for sale 24 – – 24Disposals and scrapping (3) (1) (362) (366)Current year depreciation charge – (247) (8 197) (8 444)
Impairment of property, plant and equipment – – (15 426) (15 426)Carrying amount at 30 June 2018 387 3 922 56 648 60 957
2019Cost 350 6 388 151 879 158 617
Accumulated depreciation and impairment – (2 541) (99 406) (101 947)350 3 847 52 473 56 670
2018Cost 387 6 330 145 236 151 953
Accumulated depreciation and impairment – (2 408) (88 588) (90 996)387 3 922 56 648 60 957
Group Company2019 2018 2019 2018
for the year ended 30 June Rm Rm Rm RmAdditions to property, plant and equipment (cash flow)Current year additions* 230 3 972 195 3 973Adjustments for non-cash items movement in environmental provisions capitalised (30) – – – other non-cash movements** (21) (3 836) (21) (3 836)Per the statement of cash flows 179 136 174 137* Includes plant, equipment and vehicles acquired by finance leases.** Additions to the prior year include the Air Separation Unit in Secunda of R3,4 billion.

32 Sasol South Africa Annual Financial Statements 2019
Group Company2019 2018 2019 2018
for the year ended 30 June Rm Rm Rm RmLeased assetsCarrying value of capitalised leased assets (included in property, plant and equipment) 4 085 4 173 4 085 4 173 cost 4 934 4 866 4 934 4 866 accumulated depreciation (849) (693) (849) (693)
Capital commitments (excluding equity accounted investments)Capital commitments, excluding capitalised interest, include all projects for which specific board approval has been obtained. Projects still under investigation for which specific board approvals have not yet been obtained are excluded from the following:Authorised and contracted for 19 356 17 400 19 016 16 900Authorised but not yet contracted for 14 813 13 730 14 506 13 516
Less expenditure to the end of year (13 641) (10 778) (13 348) (10 456)20 528 20 352 20 174 19 960
to sustain existing operations 20 006 19 656 19 685 19 295to expand operations 522 696 489 665
Estimated expenditureWithin one year 13 921 15 730 13 608 15 431
One to five years 6 607 4 622 6 566 4 52920 528 20 352 20 174 19 960
FundingCapital expenditure will be financed from funds generated out of normal business operations, existing borrowing facilities, specific project financing and additional capital contributions from Sasol Limited.
Accounting policies:Property, plant and equipment is stated at cost less accumulated depreciation and accumulated impairment losses. Land is not depreciated.When plant and equipment comprises major components with different useful lives, these components are accounted for as separate items.
Property, plant and equipment is depreciated to its estimated residual value on a straight- line basis over its expected useful life.
Areas of judgement:
The depreciation methods, estimated remaining useful lives and residual values are reviewed at least annually. The estimation of the useful lives of property, plant and equipment is based on historic performance as well as expectations about future use and therefore requires a significant degree of judgement to be applied by management.The following depreciation rates apply in the group:Buildings and improvements 1 – 17%, units of production over life of related reserve base
Plant 2 – 50 %Equipment 3 – 91 %
Vehicles 5 – 33 %

Sasol South Africa Annual Financial Statements 2019 33
GroupProperty plant
and equipmentunder
construction
Other intangibleassets underdevelopment Total
for the year ended 30 June Rm Rm Rm
16 Assets under constructionBalance as at 30 June 2018 13 236 181 13 417Additions 15 782 195 15 977 to sustain existing operations 15 455 195 15 650 to expand operations 327 – 327Net reclassification from other assets (77) (4) (81)Finance costs capitalised 899 – 899Reclassification to disposal groups held for sale (154) – (154)Projects capitalised (12 932) (192) (13 124)Disposals and scrapping (151) – (151)Balance at 30 June 2019 16 603 180 16 783
Property plantand equipment
under construction
Other intangibleassets underdevelopment Total
for the year ended 30 June Rm Rm RmBalance as at 30 June 2017 14 328 123 14 451Additions 12 875 190 13 065 to sustain existing operations 12 596 190 12 786 to expand operations 279 – 279Net reclassification from other assets – 8 8Finance costs capitalised 743 – 743Projects capitalised (14 589) (140) (14 729)Disposals and scrapping (121) – (121)Balance at 30 June 2018 13 236 181 13 417

34 Sasol South Africa Annual Financial Statements 2019
Company
Property plantand equipment
underconstruction
Other intangibleassets underdevelopment Total
for the year ended 30 June Rm Rm Rm
Balance as at 30 June 2018 12 916 173 13 089Additions 15 441 194 15 635 to sustain existing operations 15 136 194 15 330 to expand operations 305 – 305Net reclassification from other assets (83) 5 (78)Finance costs capitalised 899 – 899Reclassification to disposal groups held for sale (154) – (154)Projects capitalised (12 564) (191) (12 755)Disposals and scrapping (147) – (147)Balance at 30 June 2019 16 308 181 16 489
Property plantand equipment
underconstruction
Other intangibleassets underdevelopment Total
for the year ended 30 June Rm Rm RmBalance as at 30 June 2017 14 107 119 14 226Additions 12 622 185 12 807 to sustain existing operations 12 371 185 12 556 to expand operations 251 – 251Net reclassification from other assets – 8 8Finance costs capitalised 743 – 743Projects capitalised (14 446) (139) (14 585)Disposals and scrapping (110) – (110)Balance at 30 June 2018 12 916 173 13 089
Group Company2019 2018 2019 2018
for the year ended 30 June Rm Rm Rm Rm
Additions to assets under construction (cash flow)Current year additions 15 977 13 065 15 635 12 807Adjustments for non-cash item: cash flow hedge accounting – 1 – 1Per the statement of cash flows 15 977 13 066 15 635 12 808
The group and company hedges its exposure in South Africa to foreign currency risk in respect of its significant capital projects by means of forward exchange contracts. Cash flow hedge accounting is applied to these hedging transactions and accordingly, the effective portion of any gain or loss realised on these contracts is adjusted against the underlying item of assets under construction.
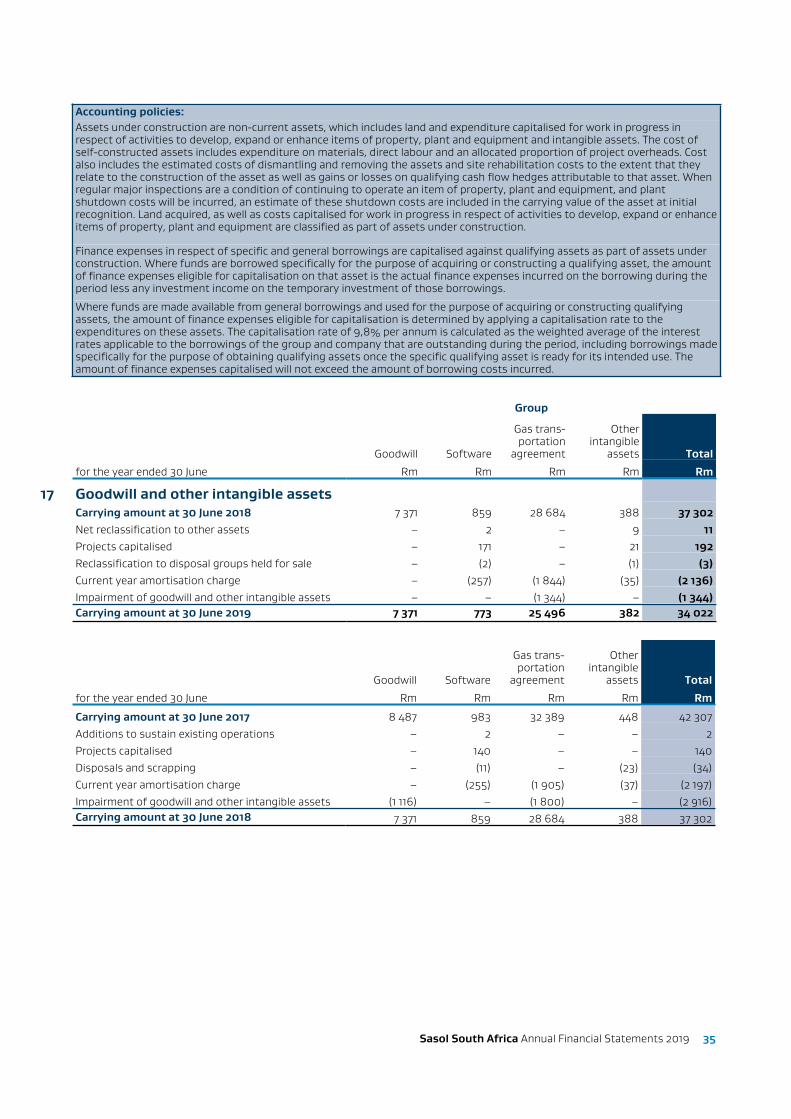
Sasol South Africa Annual Financial Statements 2019 35
Accounting policies:Assets under construction are non-current assets, which includes land and expenditure capitalised for work in progress in respect of activities to develop, expand or enhance items of property, plant and equipment and intangible assets. The cost of self-constructed assets includes expenditure on materials, direct labour and an allocated proportion of project overheads. Cost also includes the estimated costs of dismantling and removing the assets and site rehabilitation costs to the extent that they relate to the construction of the asset as well as gains or losses on qualifying cash flow hedges attributable to that asset. When regular major inspections are a condition of continuing to operate an item of property, plant and equipment, and plant shutdown costs will be incurred, an estimate of these shutdown costs are included in the carrying value of the asset at initial recognition. Land acquired, as well as costs capitalised for work in progress in respect of activities to develop, expand or enhance items of property, plant and equipment are classified as part of assets under construction.
Finance expenses in respect of specific and general borrowings are capitalised against qualifying assets as part of assets under construction. Where funds are borrowed specifically for the purpose of acquiring or constructing a qualifying asset, the amount of finance expenses eligible for capitalisation on that asset is the actual finance expenses incurred on the borrowing during the period less any investment income on the temporary investment of those borrowings.
Where funds are made available from general borrowings and used for the purpose of acquiring or constructing qualifying assets, the amount of finance expenses eligible for capitalisation is determined by applying a capitalisation rate to the expenditures on these assets. The capitalisation rate of 9,8% per annum is calculated as the weighted average of the interest rates applicable to the borrowings of the group and company that are outstanding during the period, including borrowings made specifically for the purpose of obtaining qualifying assets once the specific qualifying asset is ready for its intended use. The amount of finance expenses capitalised will not exceed the amount of borrowing costs incurred.
Group
Goodwill Software
Gas trans-portation
agreement
Other intangible
assets Total
for the year ended 30 June Rm Rm Rm Rm Rm
17 Goodwill and other intangible assetsCarrying amount at 30 June 2018 7 371 859 28 684 388 37 302Net reclassification to other assets – 2 – 9 11Projects capitalised – 171 – 21 192Reclassification to disposal groups held for sale – (2) – (1) (3)Current year amortisation charge – (257) (1 844) (35) (2 136)Impairment of goodwill and other intangible assets – – (1 344) – (1 344)Carrying amount at 30 June 2019 7 371 773 25 496 382 34 022
Goodwill Software
Gas trans-portation
agreement
Other intangible
assets Total
for the year ended 30 June Rm Rm Rm Rm Rm
Carrying amount at 30 June 2017 8 487 983 32 389 448 42 307Additions to sustain existing operations – 2 – – 2Projects capitalised – 140 – – 140Disposals and scrapping – (11) – (23) (34)Current year amortisation charge – (255) (1 905) (37) (2 197)Impairment of goodwill and other intangible assets (1 116) – (1 800) – (2 916)Carrying amount at 30 June 2018 7 371 859 28 684 388 37 302

36 Sasol South Africa Annual Financial Statements 2019
Company
Software
Other intangible
assets Total
for the year ended 30 June Rm Rm Rm
Carrying amount at 30 June 2018 856 339 1 195Additions to sustain existing operations – – –Net reclassification to other assets – 8 8Projects capitalised 171 20 191Reclassification from disposal groups held for sale (2) (1) (3)Disposals and scrapping – – –Current year amortisation charge (252) (31) (283)Carrying amount at 30 June 2019 773 335 1 108
Software
Other intangible
assets Total
for the year ended 30 June Rm Rm Rm
Carrying amount at 30 June 2017 975 395 1 370Additions to sustain existing operations 2 – 2Projects capitalised 139 – 139Disposals and scrapping (11) (23) (34)Current year amortisation charge (249) (33) (282)Carrying amount at 30 June 2018 856 339 1 195
Accounting policies:Intangible assets are stated at cost less accumulated amortisation and impairment losses. These intangible assets are recognised if it is probable that future economic benefits will flow to the entity from the intangible assets and the costs of the intangible assets can be reliably measured. Intangible assets with finite useful lives are amortised on a straight-line basis over their estimated useful lives. The amortisation methods and estimated remaining useful lives are reviewed at least annually. The estimation of the useful lives of other intangible assets is based on historic performance as well as expectations about future use and therefore requires a significant degree of judgement to be applied by management. The following amortisation rates, based on the estimated useful lives of the respective assets were applied:Software 10% – 50%Patents and trademarks 5% – 20% Gas transportation agreement 6%Other intangible assets 3% - 33% Goodwill is recognised when the consideration transferred, the fair value of any previously held interests and the recognised amount of non-controlling interests exceeds the fair value of the net identifiable assets of the entity acquired. Acquisitions of non-controlling interests are accounted for as transactions with owners in their capacity as owners and therefore no goodwill is recognised as a result of these transactions. The adjustments to non-controlling interest are based on a proportionate amount of the net assets of the subsidiary. Goodwill is tested at each reporting date for impairment.
Group Company2019 2018 2019 2018
for the year ended 30 June Note Rm Rm Rm Rm
18 Long-term receivables and prepaid expensesTotal long-term receivables* 339 21 22 21Short-term portion (2) (2) (2) (2)Impairment of long-term receivables (17) – – –
320 19 20 19Long-term prepaid expenses 11 9 11 9Related party long-term prepaid expenses – subsidiaries, fellow subsidiaries and joint ventures** 36 375 783 354 740
706 811 385 768* Included in the Group, for 2019, is an amount of R317 million relating to Siyakha.** Includes prepaid expenses for the Tier 1 - Khanyisa Employee Share Ownership Plan. Refer to note 33.2.

Sasol South Africa Annual Financial Statements 2019 37
Impairment of long-term loans and receivables
Long-term loans and receivables that are considered for impairment under the expected credit loss model. Refer to note 39 for detail on the impairments recognised.
Group Company2019 2018 2019 2018
for the year ended 30 June Rm Rm Rm Rm
19 Equity accounted investmentsAmounts recognised in the statement of cash flows:Dividends received from equity accounted investments 29 53 29 53At 30 June, the group and company’s interest in equity accounted investments and the total carrying values were:
GroupInterest 2019 2018
NameCountry of incorporation Nature of activities % Rm Rm
Joint ventures and associates
Sasol Dyno Nobel (Pty) Ltd (joint venture) South AfricaManufacturing and distribution of explosives 50 273 271
Clariant Sasol Catalysts (Pty) Ltd (associate) South Africa Manufacturing and distribution of catalyst
20 10 11
Carrying value of investments 283 282
CompanyInterest 2019 2018
NameCountry of incorporation Nature of activities % Rm Rm
AssociatesClariant Sasol Catalysts (Pty) Ltd South Africa Manufacturing and
distribution of catalyst20 10 11
Summarised financial information for the group and company's share of equity accounted investments*
Group Company2019 2018 2019 2018
for the year ended 30 June Rm Rm Rm RmOperating profit 58 109 11 14Earnings before tax 58 109 11 12Taxation (14) (31) (3) (4)Earnings and total comprehensive income for the year 44 78 8 8* The financial information provided represents the group and company's share of the results of the equity accounted investment.
Group Company2019 2018 2019 2018
Capital commitments relating to equity accounted investments Rm Rm Rm RmCapital commitments, excluding capitalised interest, include all projects for which specific board approval has been obtained. Projects still under investigation for which specific board approvals have not yet been obtained are excluded from the following:Authorised and contracted for 19 16 – –Authorised but not yet contracted for 8 1 – –Less expenditure to the end of year (18) (12) – –
9 5 – –
Impairment testing of equity accounted investments
Based on impairment indicators at each reporting date, impairment tests in respect of investments in joint ventures and associates are performed. The recoverable amount of the investment is compared to the carrying amount to calculate the impairment.
There are no significant restrictions on the ability of the joint venture and associate to transfer funds to Sasol South Africa Limited in the form of cash dividends or repayment of loans or advances.

38 Sasol South Africa Annual Financial Statements 2019
Accounting policies:A joint venture is a joint arrangement in which the parties have joint control with rights to the net assets of the arrangement. An associate is an entity, other than a subsidiary, joint venture or joint operation, in which the group has significant influence, but no control or joint control, over financial and operating policies. The financial results of associates and joint ventures are included in the group’s results according to the equity method from acquisition date until the disposal date. Under the equity method, investments in joint ventures and associates are recognised initially at cost. Subsequent to the acquisition date, the group’s share of profits or losses of joint ventures and associates is charged to the income statement as equity accounted earnings and its share of movements in equity reserves is recognised as other comprehensive income or equity as appropriate. The financial results of associates and joint ventures are included in the company’s results according to the cost method from acquisition date until the disposal date. Under the cost method, investments in joint ventures and associates are recognised initially at cost. Subsequent to the acquisition date, the company’s share of profits or losses of joint ventures and associates is charged to the income statement to the extent that dividends are declared as dividends received.
Group Company2019 2018 2019 2018
for the year ended 30 June Rm Rm Rm Rm
20 Investment in subsidiaries and joint venturesReflected as non-current assetsInvestments at cost – – 48 187 48 187Interest in operating subsidiaries and joint ventures
The following table presents each of the company’s subsidiaries (including direct and indirect holdings) and joint ventures, the nature of activities, the percentage of equity owned and the country of incorporation at 30 June.
There are no significant restrictions on the ability of the company’s subsidiaries and joint ventures to transfer funds to Sasol South Africa Limited in the form of cash dividends or repayment of loans or advances.
Company% of equity owned Investment at cost
2019 2018 2019 2018
NameCountry of incorporation Nature of activities % % Rm Rm
Operating subsidiaries and joint venturesDirectSasol Dyno Nobel (Pty) Ltd (joint venture)
South Africa Manufacturing and distribution of explosives
50 50 114 114
Sasol Acrylates (South Africa) (Pty) Ltd
South Africa Production of acrylic acid and acrylates 50 50 819 819
Sasol Acrylates (Pty) Ltd
South Africa Marketing of acrylic acid and acrylates 100 100 372 372
The Republic of Mozambique Pipeline Investment Company (Pty) Ltd (Rompco)*
South Africa Owning and operating of the natural gas transmission pipeline between Temane in Mozambique and Secunda in South Africa for the transportation of natural gas produced in Mozambique to markets in Mozambique and South Africa
50 50 5 5
Sasol Gas (Pty) Ltd South Africa Marketing, distribution and transportation of pipeline gas and the maintenance of pipelines used to transport gas
100 100 46 877 46 877
48 187 48 187* Through contractual arrangements Sasol South Africa Limited exercises control over the relevant activities of Rompco.
Interest in newly controlled entity
Sasol South Africa Limited obtained effective control over the governance activities of Siyakha Enterprise and Supplier Development Trust (Siyakha). Sasol South Africa Limited consolidated Siyakha in accordance with IFRS 10.

Sasol South Africa Annual Financial Statements 2019 39
Group2019 2018
for the year ended 30 June Rm RmAssets and liabilities of newly controlled entityLong-term receivables* 300 –Trade and other receivables* 205 –Cash and cash equivalents 217 –Trade and other payables (3) –Retained earnings of newly controlled entity 719 –* Net of impairment recognised.
Group Company
2019 2018 2019 2018
for the year ended 30 June Rm Rm Rm Rm
21 InventoriesCarrying valueRaw materials 273 293 218 257Process material 1 454 1 639 1 452 1 630Maintenance materials 3 759 3 415 3 583 3 267Work in process 693 750 693 750Manufactured products 4 236 4 283 4 424 4 467Consignment inventory 47 62 46 61
10 462 10 442 10 416 10 432The impact of lower chemical product prices has resulted in a net realisable value write-down of R68 million in 2019 (2018 – R134 million) for the group and company. No inventories are encumbered. Inventory of R721 million (2018 - R520 million) is held at net realisable value for the group and company.
Accounting policies:Inventories are stated at the lower of cost and net realisable value. Cost includes expenditure incurred in acquiring, manufacturing and transporting the inventory to its present location. Manufacturing costs include an allocated portion of production overheads which are directly attributable to the cost of manufacturing such inventory. The allocation is determined based on the greater of normal production capacity and actual production. The costs attributable to any inefficiencies in the production process are charged to the income statement as incurred.
By-products are incidental to the manufacturing processes, are usually produced as a consequence of the main product stream, and are immaterial to the company. Revenue from sale of by-products is offset against the cost of the main products.Cost is determined as follows:Raw materials First-in-first-out valuation method (FIFO)Process, maintenance and other materials Weighted average purchase priceWork in progress Manufacturing costs incurred
Manufactured products including consignment inventory Manufacturing costs according to FIFO
Group Company2019 2018 2019 2018
for the year ended 30 June Note Rm Rm Rm Rm
22 Trade and other receivablesTrade receivables 4 843 5 260 4 023 4 494Related party receivables – subsidiaries, fellow subsidiaries and joint ventures 36 9 531 9 375 9 782 9 674Other receivables 443 210 332 207Impairment of trade and other receivables (128) (48) (81) (20)Trade and other receivables 14 689 14 797 14 056 14 355Prepaid expenses and other 879 444 876 443Value added tax 261 179 257 173
15 829 15 420 15 189 14 971

40 Sasol South Africa Annual Financial Statements 2019
Credit risk exposure in respect of trade receivables is under IAS39 analysed as follows:
Group Company
Carrying value Impairment
Carryingvalue Impairment
2018 2018 2018 2018
for the year ended 30 June Rm Rm Rm Rm
Age analysis of trade receivablesNot past due date 4 490 2 3 883 2Past due 0 – 30 days* 618 4 589 4Past due 31 – 150 days 96 10 16 10Past due 151 days – one year 40 19 5 3More than one year** 16 13 1 1
5 260 48 4 494 20* Past due debtors up to 30 days constitute mainly export customers which are settled at month-end, however funds only reflected in South Africa after
month-end.** More than one year relates to long outstanding balances for specific customers who have exceeded their contractual repayment terms.
Impairment of trade receivables
Trade receivables are considered for impairment under the expected credit loss model. . Trade receivables are impaired when there is no reasonable prospect that the customer will pay. Refer to note 39 for detail on the impairments recognised.
The following customer represents more than 10% of the group and company’s trade and other receivables:
Sasol Oil (Pty) Ltd – R3 862 million (2018 – R4 089 million)
Fair value of trade receivables
The carrying value approximates fair value because of the short period to maturity of these instruments.
Collateral
The group and company hold no collateral over the trade receivables which can be sold or pledged to a third party.
Accounting policies:
IFRS 9 applicable in 2019:Trade and other receivables are recognised initially at transaction price and subsequently stated at amortised cost using the effective interest rate method, less impairment losses. A simplified expected credit loss model is applied for recognition and measurement of impairments in trade receivables, where expected lifetime credit losses are recognised from initial recognition, with changes in loss allowances recognised in profit and loss. The group and company did not use provisional matrix. Trade and other receivables are written off where there is no reasonable expectation of recovering amounts due. The trade receivables do not contain a significant financing component.
IAS 39 applicable in 2018:Trade and other receivables are recognised initially at fair value and subsequently stated at amortised cost using the effective interest rate method, less impairment losses.

Sasol South Africa Annual Financial Statements 2019 41
Group Company2019 2018 2019 2018
for the year ended 30 June Note Rm Rm Rm Rm
23 Trade and other payablesTrade payables external 4 375 4 357 4 131 4 115Capital project related payables 897 691 897 691Related party payables - subsidiaries, fellow subsidiaries and joint ventures 36 2 720 2 274 3 484 2 922Accrued expenses 1 708 1 462 1 637 1 385Related party payables - third parties 189 33 189 33Trade payables 9 889 8 817 10 338 9 146Other payables* 2 471 2 839 2 425 2 795Value added tax 49 23 23 –
12 409 11 679 12 786 11 941* Other payables includes employee-related payables.
The following vendor represents more than 10% of the group and company's trade payables:
Sasol Mining (Pty) Ltd – R2 186 million (2018 - R1 767 million)
Fair value of trade and other payables
The carrying value approximates fair value because of the short period to settlement of these obligations.
Accounting policies:Trade and other payables are initially recognised at fair value and subsequently stated at amortised cost. Capital project related payables are excluded from working capital, as the nature and risks of these payables are not considered to be aligned to operational trade payables.
Group Company2019 2018 2019 2018
Rm Rm Rm Rm
24 Increase in working capitalIncrease in inventories (222) (87) (184) (384)Increase in trade and other receivables (1 192) (1 619) (1 138) (1 517)(Decrease)/increase in trade and other payables (2 331) 1 228 (2 206) 945Movement in financial assets and liabilities (1) 1 (1) 1Increase in working capital (3 746) (477) (3 529) (955)
Group Company2019 2018 2019 2018
for the year ended 30 June Note Rm Rm Rm Rm
25 Cash and cash equivalentsCash and cash equivalents 10 290 6 726 6 566 2 867 fellow subsidiaries 36 8 037 4 560 5 117 1 336 external 2 253 2 166 1 449 1 531
Per the statement of cash flows 10 290 6 726 6 566 2 867

42 Sasol South Africa Annual Financial Statements 2019
Included in cash:
Company
Cash held in trust that is restricted for use and held in escrow. Includes funds of R334 million (2018 – R315 million) for the rehabilitation of sites.
Group
Cash held in trust that is restricted for use and held in escrow. Includes funds of R334 million (2018 – R315 million) for the rehabilitation of sites. Other cash held in trust restricted for use includes R217 million (2018 – Rnil) relating to Siyakha.
Other cash restricted for use of R473 million (2018 – R418 million) includes deposits for decommissioning of pipelines and cash relating to the Sasol Gas pipeline in Mozambique which is unable to be repatriated to South Africa due to foreign exchange control regulations.
Fair value of cash and cash equivalents
The carrying value of cash and cash equivalents approximates fair value due to the short-term maturity of these instruments.
Accounting policies:Cash and cash equivalents comprises cash on hand and cash restricted for use. Cash and cash equivalents are stated at carrying amount which is deemed to be fair value. Cash restricted for use comprises cash and cash equivalents which are not available for general use by the group and company, including amounts held in escrow, trust or other separate bank accounts.
Group Company2019 2018 2019 2018
for the year ended 30 June Note Rm Rm Rm Rm
26 Cash generated by operating activitiesCash flow from operations 27 31 178 28 460 24 172 21 195Increase in working capital 24 (3 746) (477) (3 529) (955)
27 432 27 983 20 643 20 240
Group Company2019 2018 2019 2018
for the year ended 30 June Note Rm Rm Rm Rm
27 Cash flow from operationsEarnings before interest and tax (EBIT) 11 885 6 975 5 361 (3 714)Adjusted for share of profits of equity accounted investments 19 (44) (78) (8) (8) equity-settled share-based payment expense 33 1 053 549 1 018 535 depreciation and amortisation 11 531 11 343 8 700 8 725 effect of remeasurement items 8 5 907 9 953 8 286 15 895 Expected credit losses 96 11 61 (4) movement in long-term provisions income statement charge 29 307 (462) 312 (471) utilisation 29 (311) (370) (303) (366) movement in short-term provisions 199 (37) 222 (35) movement in post-retirement benefits 221 273 221 270 movement in long-term deferred income 25 (12) 26 (10) movement in short-term deferred income – – – 1 write-down of inventories to net realisable value 21 68 134 68 134 other non-cash movements 241 181 208 243
31 178 28 460 24 172 21 195

Sasol South Africa Annual Financial Statements 2019 43
Group Company2019 2018 2019 2018
for the year ended 30 June Note Rm Rm Rm Rm
28 Dividends paidFinal dividend – 11 431 – 11 431Interim dividend* 3 004 6 603 3 004 6 603Share incentive schemes distributions 940 472 906 463Per the statement of changes in equity 3 944 18 506 3 910 18 497Less: non-cash Sasol Khanyisa Tier 1 distribution 33.2 (408) – (386) –Less: dividend payable – (3 179) – (3 179)Per the statement of cash flows 3 536 15 327 3 524 15 318* Interim dividend declared of R3 300 million excluding the R296 million notional portion, refer note 33.2.
Group
Environ-mental
Share-based
payments* Other Totalfor the year ended 30 June Rm Rm Rm Rm
29 Long-term provisions2019Balance at beginning of year 6 075 769 75 6 919Rehabilitation provision capitalised 30 – – 30Reclassification to disposal groups held for sale (51) – – (51)Per the income statement 607 (294) (6) 307 additional provisions and changes to existing provisions 98 (294) – (196) reversal of unutilised amounts (4) – (6) (10) effect of change in discount rate 513 – – 513Notional interest 503 – – 503Utilised during year (cash flow) (20) (289) (2) (311)Balance at end of year 7 144 186 67 7 397
Environ-mental
Share-based
payments* Other Totalfor the year ended 30 June Rm Rm Rm RmLong-term provisions2018
Balance at beginning of year 6 449 640 81 7 170Reduction in capitalised rehabilitation provision (49) – – (49)Per the income statement (916) 454 – (462) additional provisions and changes to existing provisions (3) 454 – 451 reversal of unutilised amounts (173) – – (173) effect of change in discount rate (740) – – (740)Notional interest 630 – – 630Utilised during year (cash flow) (39) (325) (6) (370)Balance at end of year 6 075 769 75 6 919* Refer note 32 for accounting policies and areas of judgement used in calculating the share-based payment provision (cash-settled).
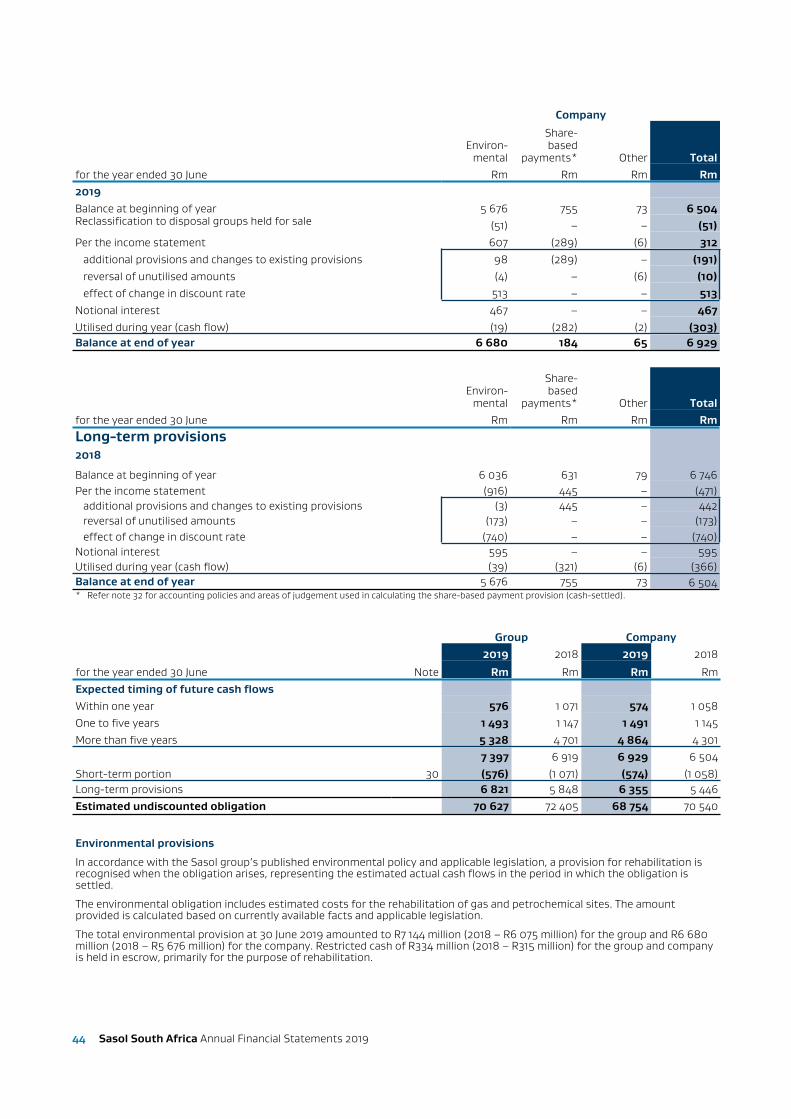
44 Sasol South Africa Annual Financial Statements 2019
Company
Environ-mental
Share-based
payments* Other Totalfor the year ended 30 June Rm Rm Rm Rm2019Balance at beginning of year 5 676 755 73 6 504Reclassification to disposal groups held for sale (51) – – (51)Per the income statement 607 (289) (6) 312 additional provisions and changes to existing provisions 98 (289) – (191) reversal of unutilised amounts (4) – (6) (10) effect of change in discount rate 513 – – 513Notional interest 467 – – 467Utilised during year (cash flow) (19) (282) (2) (303)Balance at end of year 6 680 184 65 6 929
Environ-mental
Share-based
payments* Other Totalfor the year ended 30 June Rm Rm Rm RmLong-term provisions2018
Balance at beginning of year 6 036 631 79 6 746Per the income statement (916) 445 – (471) additional provisions and changes to existing provisions (3) 445 – 442 reversal of unutilised amounts (173) – – (173) effect of change in discount rate (740) – – (740)Notional interest 595 – – 595Utilised during year (cash flow) (39) (321) (6) (366)Balance at end of year 5 676 755 73 6 504* Refer note 32 for accounting policies and areas of judgement used in calculating the share-based payment provision (cash-settled).
Group Company2019 2018 2019 2018
for the year ended 30 June Note Rm Rm Rm RmExpected timing of future cash flowsWithin one year 576 1 071 574 1 058One to five years 1 493 1 147 1 491 1 145More than five years 5 328 4 701 4 864 4 301
7 397 6 919 6 929 6 504Short-term portion 30 (576) (1 071) (574) (1 058)Long-term provisions 6 821 5 848 6 355 5 446Estimated undiscounted obligation 70 627 72 405 68 754 70 540
Environmental provisions
In accordance with the Sasol group’s published environmental policy and applicable legislation, a provision for rehabilitation is recognised when the obligation arises, representing the estimated actual cash flows in the period in which the obligation is settled.
The environmental obligation includes estimated costs for the rehabilitation of gas and petrochemical sites. The amount provided is calculated based on currently available facts and applicable legislation.
The total environmental provision at 30 June 2019 amounted to R7 144 million (2018 – R6 075 million) for the group and R6 680 million (2018 – R5 676 million) for the company. Restricted cash of R334 million (2018 – R315 million) for the group and company is held in escrow, primarily for the purpose of rehabilitation.

Sasol South Africa Annual Financial Statements 2019 45
The following risk-free rates were used to discount the estimated cash flows based on the underlying currency and time duration of the obligation.
Group Company 2019 2018 2019 2018
for the year ended 30 June % % % %
South Africa 6,8 to 8,7 7,3 to 9,2 6,8 to 8,7 7,3 to 9,2
2019 2018 2019 2018for the year ended 30 June Rm Rm Rm Rm
A 1% point change in the discount rate would have the following effect on the long-term provisions recognisedIncrease in the discount rate (1 305) (1 098) (1 243) (1 042) amount capitalised to property, plant and equipment (62) (56) – –
income recognised in income statement (1 243) (1 042) (1 243) (1 042)
Decrease in the discount rate 1 777 1 509 1 703 1 442 amount capitalised to property, plant and equipment 74 67 – – expense recognised in income statement 1 703 1 442 1 703 1 442
Accounting policies: Long-term provisions are determined by discounting the expected future cash flows using a pre-tax discount rate to their present value. The increase in discounted long-term provisions as a result of the passage of time is recognised as a finance expense in the income statement.Estimated long-term environmental provisions, comprising pollution control and rehabilitation, are based on the group’s environmental policy taking into account current technological, environmental and regulatory requirements. The provision for rehabilitation is recognised as and when the environmental liability arises. To the extent that the obligations relate to the construction of an asset, they are capitalised as part of the cost of those assets. The effect of subsequent changes to assumptions in estimating an obligation for which the provision was recognised as part of the cost of the asset is adjusted against the asset. Any subsequent changes to an obligation which did not relate to the initial construction of a related asset are charged to the income statement. The estimated present value of future decommissioning costs, taking into account current environmental and regulatory requirements, is capitalised as part of property, plant and equipment, to the extent that they relate to the construction of the asset, and the related provisions are raised. These estimates are reviewed at least annually.
Deferred tax is recognised on the temporary differences in relation to both the asset to which the obligation relates to and rehabilitation provision.Termination benefits are recognised as a liability at the earlier of the date of recognition of restructuring costs or when the group is demonstrably committed, without realistic possibility of withdrawal, to a formal detailed plan to either terminate employment before normal retirement date, or to provide termination benefits as a result of an offer made to encourage voluntary redundancy. In the case of an offer to encourage voluntary redundancy, the termination benefits are measured based on the number of employees expected to accept the offer. Benefits that are expected to be wholly settled more than 12 months after the end of the reporting period are discounted to their present value.
Areas of judgement:The determination of long-term provisions, in particular environmental provisions, remains a key area where management’s judgement is required. Estimating the future cost of these obligations is complex and requires management to make estimates and judgements because most of the obligations will only be fulfilled in the future and contracts and laws are often not clear regarding what is required. The resulting provisions could also be influenced by changing technologies and political, environmental, safety, business and statutory considerations.
It is envisaged that, based on the current information available, any additional liability in excess of the amounts provided will not have a material adverse effect on the group and company’s financial position, liquidity or cash flow.
Group Company2019 2018 2019 2018
for the year ended 30 June Note Rm Rm Rm Rm
30 Short-term provisionsOther provisions 228 30 227 5Short-term portion of long-term provisions 29 576 1 071 574 1 058 post-retirement benefit obligations 31 162 160 161 159
966 1 261 962 1 222
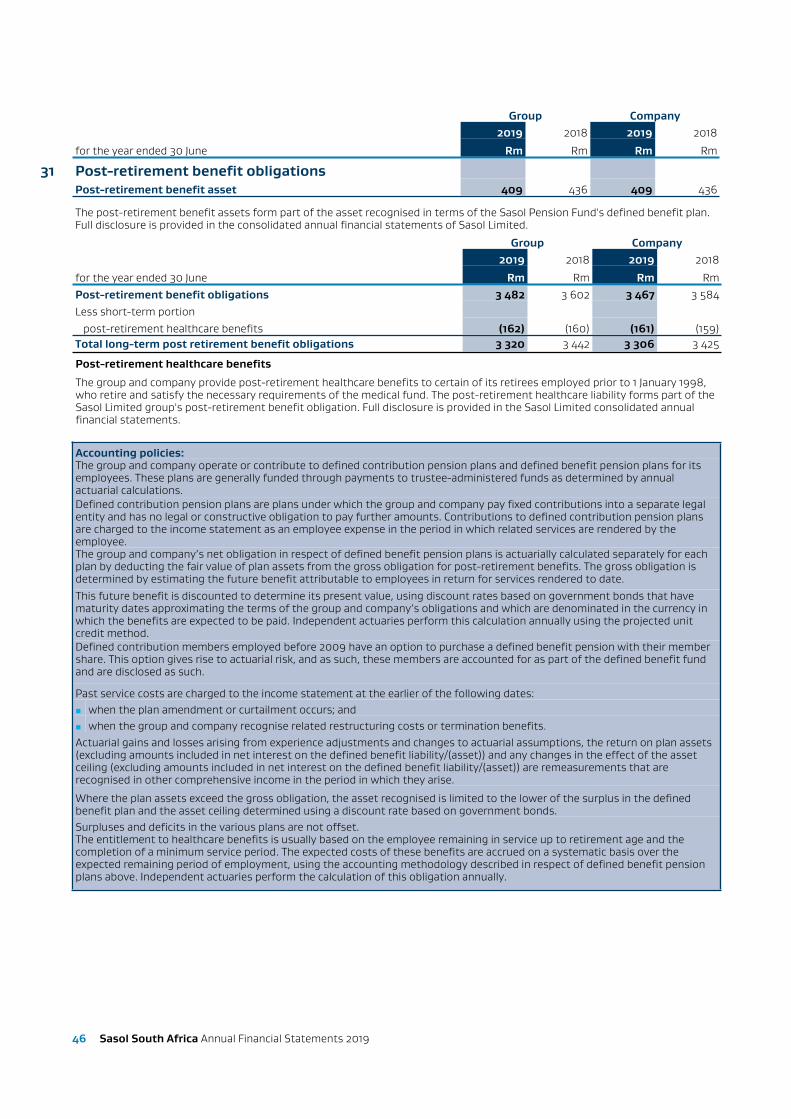
46 Sasol South Africa Annual Financial Statements 2019
Group Company2019 2018 2019 2018
for the year ended 30 June Rm Rm Rm Rm
31 Post-retirement benefit obligationsPost-retirement benefit asset 409 436 409 436
The post-retirement benefit assets form part of the asset recognised in terms of the Sasol Pension Fund's defined benefit plan. Full disclosure is provided in the consolidated annual financial statements of Sasol Limited.
Group Company2019 2018 2019 2018
for the year ended 30 June Rm Rm Rm RmPost-retirement benefit obligations 3 482 3 602 3 467 3 584Less short-term portion post-retirement healthcare benefits (162) (160) (161) (159)Total long-term post retirement benefit obligations 3 320 3 442 3 306 3 425
Post-retirement healthcare benefits
The group and company provide post-retirement healthcare benefits to certain of its retirees employed prior to 1 January 1998, who retire and satisfy the necessary requirements of the medical fund. The post-retirement healthcare liability forms part of the Sasol Limited group's post-retirement benefit obligation. Full disclosure is provided in the Sasol Limited consolidated annual financial statements.
Accounting policies:The group and company operate or contribute to defined contribution pension plans and defined benefit pension plans for its employees. These plans are generally funded through payments to trustee-administered funds as determined by annual actuarial calculations.Defined contribution pension plans are plans under which the group and company pay fixed contributions into a separate legal entity and has no legal or constructive obligation to pay further amounts. Contributions to defined contribution pension plans are charged to the income statement as an employee expense in the period in which related services are rendered by the employee.The group and company’s net obligation in respect of defined benefit pension plans is actuarially calculated separately for each plan by deducting the fair value of plan assets from the gross obligation for post-retirement benefits. The gross obligation is determined by estimating the future benefit attributable to employees in return for services rendered to date.This future benefit is discounted to determine its present value, using discount rates based on government bonds that have maturity dates approximating the terms of the group and company’s obligations and which are denominated in the currency in which the benefits are expected to be paid. Independent actuaries perform this calculation annually using the projected unit credit method.Defined contribution members employed before 2009 have an option to purchase a defined benefit pension with their member share. This option gives rise to actuarial risk, and as such, these members are accounted for as part of the defined benefit fund and are disclosed as such.
Past service costs are charged to the income statement at the earlier of the following dates:■ when the plan amendment or curtailment occurs; and■ when the group and company recognise related restructuring costs or termination benefits.Actuarial gains and losses arising from experience adjustments and changes to actuarial assumptions, the return on plan assets (excluding amounts included in net interest on the defined benefit liability/(asset)) and any changes in the effect of the asset ceiling (excluding amounts included in net interest on the defined benefit liability/(asset)) are remeasurements that are recognised in other comprehensive income in the period in which they arise.
Where the plan assets exceed the gross obligation, the asset recognised is limited to the lower of the surplus in the defined benefit plan and the asset ceiling determined using a discount rate based on government bonds.Surpluses and deficits in the various plans are not offset.The entitlement to healthcare benefits is usually based on the employee remaining in service up to retirement age and the completion of a minimum service period. The expected costs of these benefits are accrued on a systematic basis over the expected remaining period of employment, using the accounting methodology described in respect of defined benefit pension plans above. Independent actuaries perform the calculation of this obligation annually.

Sasol South Africa Annual Financial Statements 2019 47
Healthcare benefits Pension benefits
Last actuarial valuation – South Africa 31 March 2019 31 March 2019Full/interim valuation Full FullValuation method adopted Projected unit credit Projected unit credit
The plans have been assessed by the actuaries and have been found to be in sound financial positions.
Principal actuarial assumptions
Weighted average assumptions used in performing actuarial valuations determined in consultation with independent actuaries.
South Africa2019 2018
at valuation date % %Healthcare cost inflation initial 7,5 7,5 ultimate 7,5 7,5Discount rate – post-retirement medical benefits 10,5 9,9Discount rate – pension benefits 10,0 9,9Pension increase assumption 4,7 4,5Average salary increases 5,5* 5,5*
Weighted average duration of the obligation – post-retirement medical obligation 15 years 15 yearsWeighted average duration of the obligation – pension obligation 13 years 13 yearsAssumptions regarding future mortality are based on published statistics and mortality tables.* Salary increases are linked to inflation.
Group Company2019 2018 2019 2018
for the year ended 30 June Rm Rm Rm Rm
32 Cash-settled share-based payment provisionDuring the year, the following share-based payment expenses were recognised in the income statement relating to cash-settled arrangements (refer to note 33 for the equity settled share-based payment disclosure):Share-based payment (income)/expense – movement in long-term provisionsSasol Share Appreciation Rights Scheme (294) 454 (289) 445
Sasol's share price decreased by 30% over the financial year to a closing price on 30 June 2019 of R350,21. This has resulted in a R294 million income being recognised in the current year for the group and R289 million income for the company.
The Sasol Share Appreciation Rights Scheme (closed since 2013)
Group Company2019 2018 2019 2018
Total rights/units granted Number Number Number NumberShare Appreciation Rights 3 346 646 4 969 521 3 299 320 4 876 843
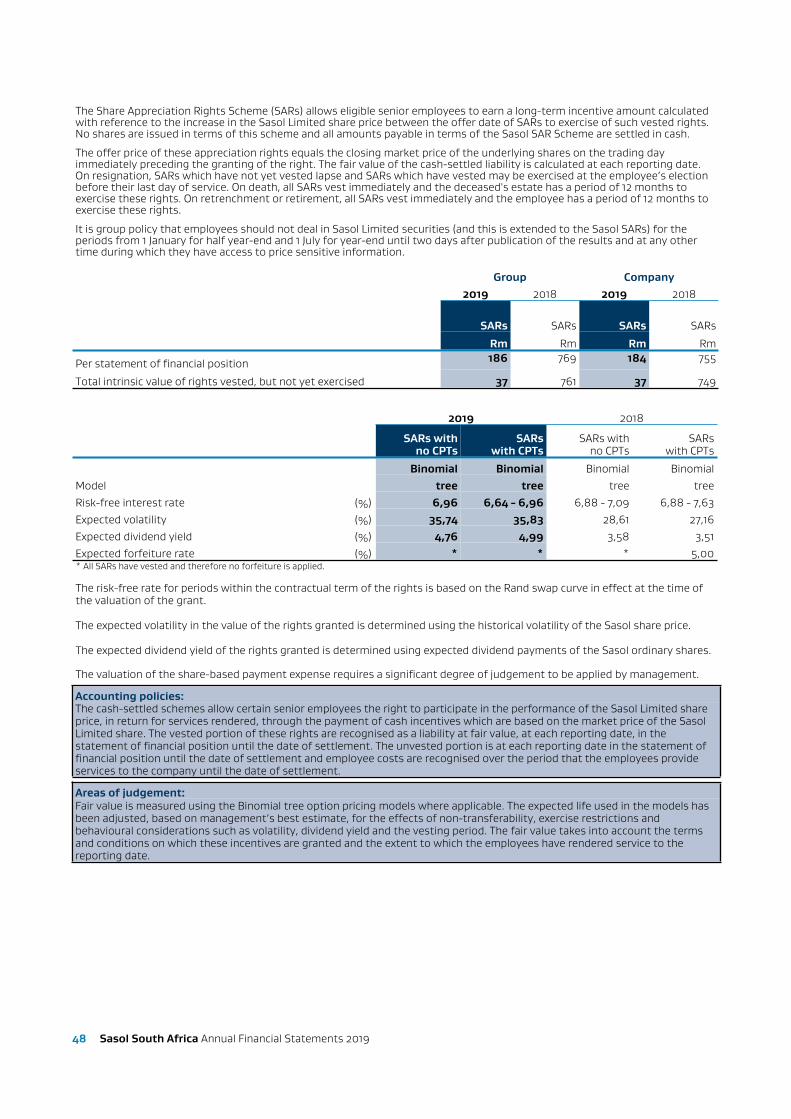
48 Sasol South Africa Annual Financial Statements 2019
The Share Appreciation Rights Scheme (SARs) allows eligible senior employees to earn a long-term incentive amount calculated with reference to the increase in the Sasol Limited share price between the offer date of SARs to exercise of such vested rights. No shares are issued in terms of this scheme and all amounts payable in terms of the Sasol SAR Scheme are settled in cash.
The offer price of these appreciation rights equals the closing market price of the underlying shares on the trading day immediately preceding the granting of the right. The fair value of the cash-settled liability is calculated at each reporting date. On resignation, SARs which have not yet vested lapse and SARs which have vested may be exercised at the employee’s election before their last day of service. On death, all SARs vest immediately and the deceased's estate has a period of 12 months to exercise these rights. On retrenchment or retirement, all SARs vest immediately and the employee has a period of 12 months to exercise these rights.
It is group policy that employees should not deal in Sasol Limited securities (and this is extended to the Sasol SARs) for the periods from 1 January for half year-end and 1 July for year-end until two days after publication of the results and at any other time during which they have access to price sensitive information.
Group Company2019 2018 2019 2018
SARs SARs SARs SARs
Rm Rm Rm Rm
Per statement of financial position 186 769 184 755
Total intrinsic value of rights vested, but not yet exercised 37 761 37 749
2019 2018
SARs with no CPTs
SARs with CPTs
SARs withno CPTs
SARswith CPTs
Binomial Binomial Binomial BinomialModel tree tree tree treeRisk-free interest rate (%) 6,96 6,64 - 6,96 6,88 - 7,09 6,88 - 7,63Expected volatility (%) 35,74 35,83 28,61 27,16Expected dividend yield (%) 4,76 4,99 3,58 3,51Expected forfeiture rate (%) * * * 5,00* All SARs have vested and therefore no forfeiture is applied.
The risk-free rate for periods within the contractual term of the rights is based on the Rand swap curve in effect at the time of the valuation of the grant.
The expected volatility in the value of the rights granted is determined using the historical volatility of the Sasol share price.
The expected dividend yield of the rights granted is determined using expected dividend payments of the Sasol ordinary shares.
The valuation of the share-based payment expense requires a significant degree of judgement to be applied by management.
Accounting policies:The cash-settled schemes allow certain senior employees the right to participate in the performance of the Sasol Limited share price, in return for services rendered, through the payment of cash incentives which are based on the market price of the Sasol Limited share. The vested portion of these rights are recognised as a liability at fair value, at each reporting date, in the statement of financial position until the date of settlement. The unvested portion is at each reporting date in the statement of financial position until the date of settlement and employee costs are recognised over the period that the employees provide services to the company until the date of settlement.
Areas of judgement:Fair value is measured using the Binomial tree option pricing models where applicable. The expected life used in the models has been adjusted, based on management’s best estimate, for the effects of non-transferability, exercise restrictions and behavioural considerations such as volatility, dividend yield and the vesting period. The fair value takes into account the terms and conditions on which these incentives are granted and the extent to which the employees have rendered service to the reporting date.

Sasol South Africa Annual Financial Statements 2019 49
Group Company2019 2018 2019 2018
for the year ended 30 June Note Rm Rm Rm Rm
33 Share-based payment reserveDuring the year, the following share-based payment expense was recognised in the income statement relating to the equity-settled share-based payment scheme:Equity-settled – recognised directly in equitySasol Inzalo share transaction 33.1 – 21 – 22 Sasol Khanyisa share transaction1 33.2 625 58 598 54
Tier 1 - Khanyisa Employee Share Ownership Plan 422 36 400 33Tier 2 - Khanyisa ESOP 203 22 198 21
Long-term incentives2 33.3 428 470 420 4591 053 549 1 018 535
1 In November 2017, Sasol Khanyisa a new Broad-Based Black Economic Empowerment (B-BBEE) scheme was approved by Sasol Limited shareholders at a General Meeting.
2 On 25 November 2016, the cash settled LTI scheme was converted to an equity-settled scheme.
Equity-settled share incentive schemes 33.1 The Sasol Inzalo share transaction
In May 2008, shareholders approved the Sasol Inzalo share transaction, a broad-based black economic empowerment (B-BBEE) transaction, which resulted in the transfer of beneficial ownership of 10% (63,1 million shares) of Sasol Limited's issued share capital before the implementation of this transaction to its employees and a wide spread of B-BBEE participants. This award was financed using both external funding that was guaranteed by Sasol, and internal funding provided directly by Sasol to enable participants to purchase the shares in Sasol Limited.
The Sasol Inzalo Employee share transaction ended on 4 June 2018. Sasol exercised its right to repurchase the 25 231 686 Sasol Limited (SOL) shares held by the Sasol Inzalo Employee and Management Trusts at a nominal value of R0,01 per share in consideration for the notional vendor financing that was owed to Sasol by these participants. Consequently the relevant vested participants in the Inzalo Employee Schemes received no distribution of SOL Shares.
33.2 The Sasol Khanyisa share transaction
In November 2017, Sasol shareholders approved the implementation of a new black-economic empowerment scheme, Sasol Khanyisa. Sasol Khanyisa has been designed to comply with the revised B–BBEE legislation in South Africa and seeks to ensure on-going and sustainable B-BBEE ownership credentials for Sasol Limited.
Sasol Khanyisa contains a number of elements structured at both a Sasol Limited and a Sasol South Africa (SSA) level.
The participants of Sasol Khanyisa are limited to those individuals, groups and employees that participated in the Sasol Inzalo transaction as well as certain elements of the transaction will also be awarded to eligible Black persons who are currently employed by Sasol and were not participants of Sasol Inzalo. At the end of 10 years, or earlier if the underlying funding has been settled, the participants will exchange their SSA shareholding on a fair value-for-value basis for SOLBE1 shares to the extent of any value created during the transaction term.
SOLBE1 shares can only be traded between Black Persons on the Empowerment Segment of the JSE. This transaction will therefore ensure evergreen B-BBEE ownership credentials for Sasol Limited.
Sasol Khanyisa comprises of the following elements:
Tier 1 - Khanyisa Employee Share Ownership Plan – Eligible Inzalo participants
Inzalo Employee Scheme participants, who were still actively employed by Sasol were granted rights in SOL shares or SOLBE1 shares, at no cost to them, to the value of R100 000, all of which will vest after a three year service period. Black employees were able to choose to receive the award in SOL or SOLBE1 shares, whilst employees who are not black people received an award in SOL shares, as SOLBE1 shares may only be held by qualifying black people. Employees will receive dividends on these shares throughout the 3 year vesting period. This award will be recognised on a straight line basis over the three year vesting period. The employer companies made a cash contribution to the Khanyisa ESOP to enable this ownership plan. The cash contribution unwinds over the 3 year vesting period in accordance with IFRS 2.
An expense of (Group – R422 million; Company - R400 million) was recognised at 30 June 2019.
Sasol Khanyisa – SSA (Tier 2 and Khanyisa Public)
Inzalo Groups, Inzalo Public and electing SOLBE1 shareholders; as well as qualifying Black employees, were invited to participate in the SSA element of the Khanyisa transaction. The B-BBEE participation in SSA comprises two groups of participants, being the external public participants (made up of Inzalo Groups, Inzalo Public and electing SOLBE1 shareholders) who participate via Khanyisa Public, and qualifying black employees who participate via the Khanyisa Employee Share Ownership plan (Khanyisa ESOP).
Both Khanyisa Public and the Khanyisa ESOP have a beneficial interest, funded wholly by Sasol (vendor funding), in approximately 9% each in SSA. As dividends are declared by SSA, 97,5% of these will be utilised to repay the vendor funding, as well as the related financing cost, calculated at 75% of prime rate. 2,5% of dividends will be distributed directly to participants as a trickle dividend. At the end of the 10 year transaction term, or earlier, if the vendor funding is repaid, the net value in SSA shares exchanged for SOLBE1 shares will be distributed to participants. Any vendor funding not yet settled by the end of the transaction will be settled using the SSA shares, and will reduce any distribution made to participants. Since any ultimate value created for participants will be granted in the form of SOLBE1 shares, the accounting for this transaction is similar to an option over Sasol shares granted for no consideration.
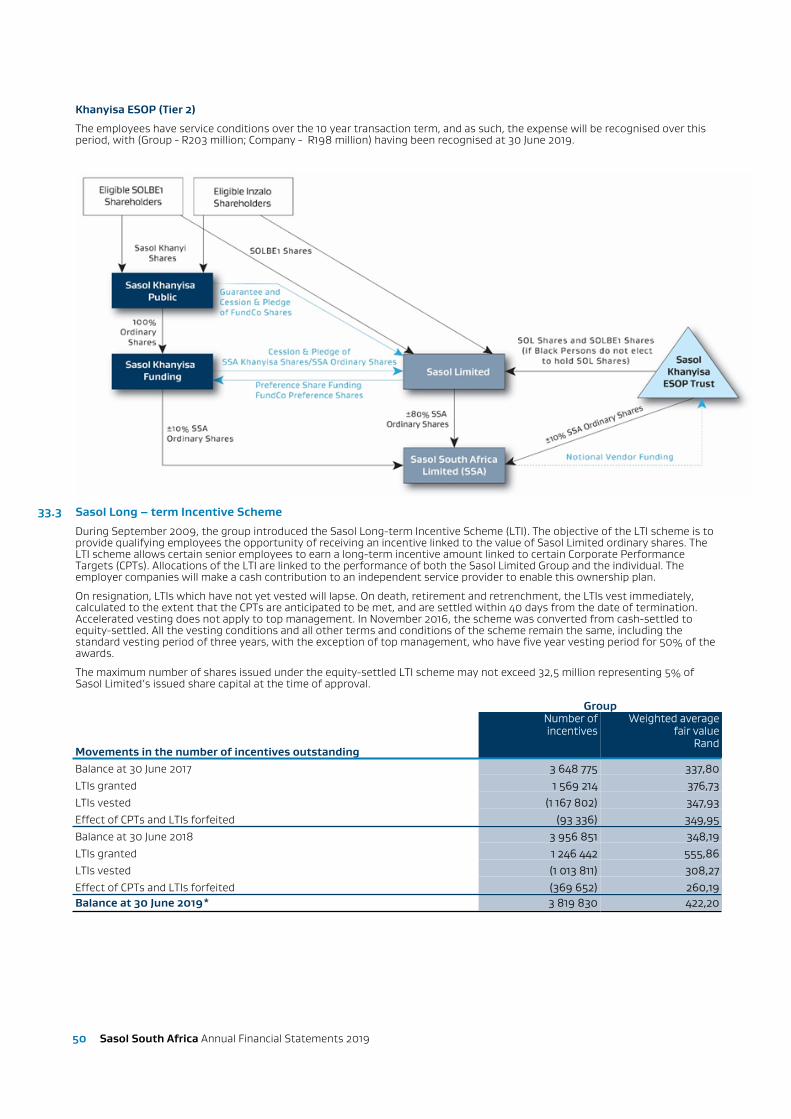
50 Sasol South Africa Annual Financial Statements 2019
Khanyisa ESOP (Tier 2)
The employees have service conditions over the 10 year transaction term, and as such, the expense will be recognised over this period, with (Group - R203 million; Company - R198 million) having been recognised at 30 June 2019.
33.3 Sasol Long – term Incentive Scheme
During September 2009, the group introduced the Sasol Long-term Incentive Scheme (LTI). The objective of the LTI scheme is to provide qualifying employees the opportunity of receiving an incentive linked to the value of Sasol Limited ordinary shares. The LTI scheme allows certain senior employees to earn a long-term incentive amount linked to certain Corporate Performance Targets (CPTs). Allocations of the LTI are linked to the performance of both the Sasol Limited Group and the individual. The employer companies will make a cash contribution to an independent service provider to enable this ownership plan.
On resignation, LTIs which have not yet vested will lapse. On death, retirement and retrenchment, the LTIs vest immediately, calculated to the extent that the CPTs are anticipated to be met, and are settled within 40 days from the date of termination. Accelerated vesting does not apply to top management. In November 2016, the scheme was converted from cash-settled to equity-settled. All the vesting conditions and all other terms and conditions of the scheme remain the same, including the standard vesting period of three years, with the exception of top management, who have five year vesting period for 50% of the awards.
The maximum number of shares issued under the equity-settled LTI scheme may not exceed 32,5 million representing 5% of Sasol Limited’s issued share capital at the time of approval.
Group
Movements in the number of incentives outstanding
Number ofincentives
Weighted averagefair value
Rand
Balance at 30 June 2017 3 648 775 337,80LTIs granted 1 569 214 376,73LTIs vested (1 167 802) 347,93Effect of CPTs and LTIs forfeited (93 336) 349,95Balance at 30 June 2018 3 956 851 348,19LTIs granted 1 246 442 555,86LTIs vested (1 013 811) 308,27Effect of CPTs and LTIs forfeited (369 652) 260,19Balance at 30 June 2019* 3 819 830 422,20
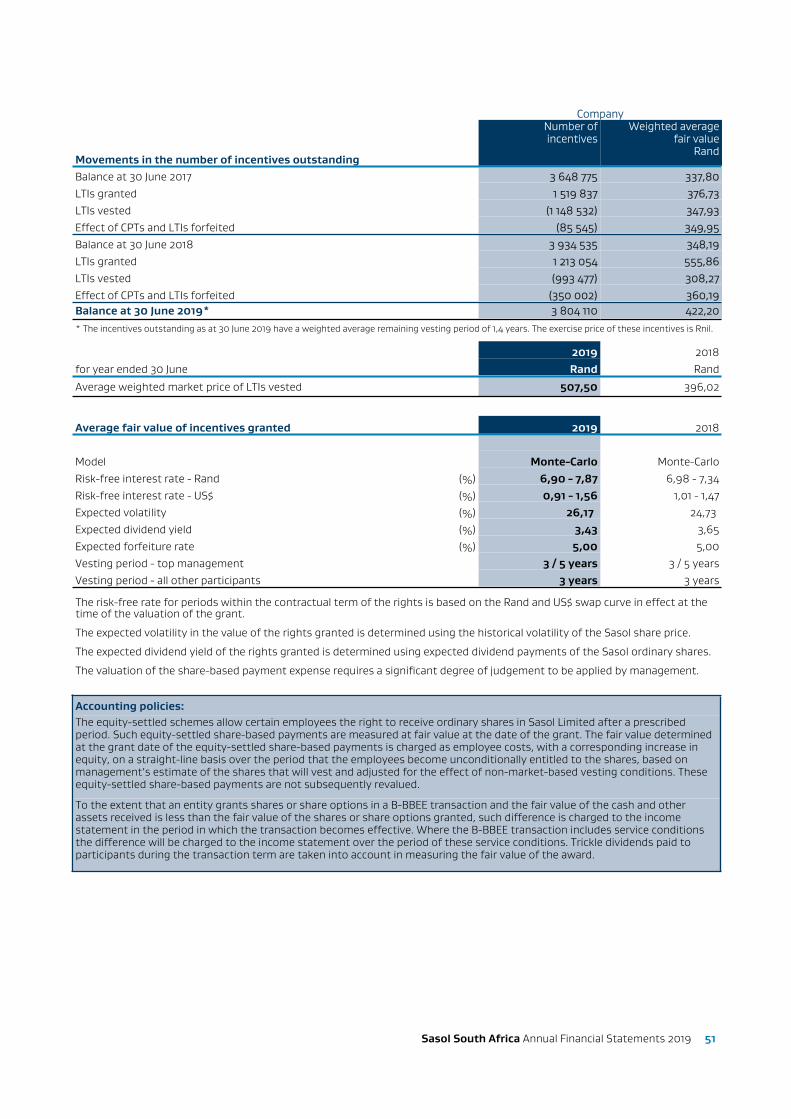
Sasol South Africa Annual Financial Statements 2019 51
Company
Movements in the number of incentives outstanding
Number ofincentives
Weighted averagefair value
Rand
Balance at 30 June 2017 3 648 775 337,80LTIs granted 1 519 837 376,73LTIs vested (1 148 532) 347,93Effect of CPTs and LTIs forfeited (85 545) 349,95Balance at 30 June 2018 3 934 535 348,19LTIs granted 1 213 054 555,86LTIs vested (993 477) 308,27Effect of CPTs and LTIs forfeited (350 002) 360,19Balance at 30 June 2019* 3 804 110 422,20
* The incentives outstanding as at 30 June 2019 have a weighted average remaining vesting period of 1,4 years. The exercise price of these incentives is Rnil.
2019 2018for year ended 30 June Rand Rand
Average weighted market price of LTIs vested 507,50 396,02
Average fair value of incentives granted 2019 2018
Model Monte-Carlo Monte-CarloRisk-free interest rate - Rand (%) 6,90 - 7,87 6,98 - 7,34Risk-free interest rate - US$ (%) 0,91 - 1,56 1,01 - 1,47Expected volatility (%) 26,17 24,73Expected dividend yield (%) 3,43 3,65Expected forfeiture rate (%) 5,00 5,00Vesting period - top management 3 / 5 years 3 / 5 yearsVesting period - all other participants 3 years 3 years
The risk-free rate for periods within the contractual term of the rights is based on the Rand and US$ swap curve in effect at the time of the valuation of the grant.
The expected volatility in the value of the rights granted is determined using the historical volatility of the Sasol share price.
The expected dividend yield of the rights granted is determined using expected dividend payments of the Sasol ordinary shares.
The valuation of the share-based payment expense requires a significant degree of judgement to be applied by management.
Accounting policies:The equity-settled schemes allow certain employees the right to receive ordinary shares in Sasol Limited after a prescribed period. Such equity-settled share-based payments are measured at fair value at the date of the grant. The fair value determined at the grant date of the equity-settled share-based payments is charged as employee costs, with a corresponding increase in equity, on a straight-line basis over the period that the employees become unconditionally entitled to the shares, based on management’s estimate of the shares that will vest and adjusted for the effect of non-market-based vesting conditions. These equity-settled share-based payments are not subsequently revalued.
To the extent that an entity grants shares or share options in a B-BBEE transaction and the fair value of the cash and other assets received is less than the fair value of the shares or share options granted, such difference is charged to the income statement in the period in which the transaction becomes effective. Where the B-BBEE transaction includes service conditions the difference will be charged to the income statement over the period of these service conditions. Trickle dividends paid to participants during the transaction term are taken into account in measuring the fair value of the award.

52 Sasol South Africa Annual Financial Statements 2019
34 Contingent liabilities34.1 Litigation
Construction disputes – Fischer Tropsch Wax Expansion Project in Sasolburg (FTWEP)
After the conclusion of construction of FTWEP at the Sasol One site in Sasolburg, a number of contractual claims have been instituted by some contractors who were involved in the construction and project management relating to this project. Certain of these claims have already been resolved, either through settlement between the parties or through the contractual dispute resolution process. The Fluor SA (Pty) Ltd matter is still ongoing.
Fluor SA (Pty) Ltd – FTWEP
Fluor SA (Pty) Ltd (Flour) claimed a total amount of R485,7 million plus interest. This dispute turns on the nature and quantification of Fluor’s alleged entitlement to a change to the prices and completion dates for delayed access. In June 2015, Fluor referred the claim to adjudication. In September 2015, the adjudicator rejected Fluor’s entire claim. Thereafter, Fluor notified Sasol of its dissatisfaction with the outcome of the adjudication and Fluor’s intention to refer the matter to arbitration. The arbitration process commenced with Fluor filing its statement of claim during December 2016. Sasol filed two objections against the statement of claim which had the potential to dispose of the arbitration proceedings. The arbitrator, however, did not decide in favour of Sasol on the objection applications and dismissed the application with costs. The objections will still be raised as a special jurisdictional plea and will be filed with Sasol’s statement of defence during the arbitration process.
Fluor subsequently amended its claim, inter alia, by reducing the amount claimed from R485,7 million to R448,0 million excluding interest. On 12 March 2019 Fluor filed and served a further amendment to its statement of claim and an amended expert report in terms of which a further reduction in the quantum is being claimed. Fluor now claims an amount of R383,8 million (alternatively the amount of R406,6 million based on an alternative assessment of its claim). The amendment by Fluor resulted in the arbitration being postponed as Sasol’s experts will be required to deal with the revised expert report and we will be required to file an amendment to our statement of defence. The hearing of the matter is now only anticipated to commence in March 2020. Sasol believes that Fluor’s original claim, included the amended claims are not justified. Accordingly, no provision was recognised at 30 June 2019.
Wetback Contracts (Pty) Ltd – FTWEP
The dispute regarding Wetback Contracts (Pty) Ltd was concluded during the year.
Legal review of Sasol Gas National Energy Regulator of South Africa (NERSA) maximum price decision and NERSA gastransmission tariff application (March 2013)
In October 2013, following the March 2013 decisions by NERSA (pursuant to the applications by Sasol Gas), seven of the customers of Sasol Gas (“customers”) brought a legal review application requesting the setting aside of the maximum price methodology used by NERSA in evaluating the maximum price application by Sasol Gas as well as maximum price decision and gas transmission tariff decision. The basis of the challenge to the NERSA price decision is the allegation that the methodology used by NERSA to determine its approval of the maximum gas prices was unreasonable and irrational.
In October 2016 the High Court dismissed the review application The Applicants were subsequently granted consent to appeal this decision to the Supreme Court of Appeal ("SCA"). On 10 May 2018 the SCA upheld the appeal by the Applicants. NERSA and Sasol Gas each launched an application to the Constitutional Court (“CC”) to appeal the SCA decision.
Leave to appeal was granted and the matter was heard on 26 February 2019. On 15 July 2019 the CC handed down its decision. The Court upheld the appeal on the ruling by the SCA relating to the transmission tariffs and accordingly the NERSA transmission tariff decision was confirmed.
However, the court dismissed the remainder of the appeal. The Court found that NERSA, in applying the basket of alternatives approach to determine the Maximum Gas Price for Sasol Gas, was irrational as it did not take into account a required material fact for making a rational decision. NERSA’s decision to approve maximum gas prices and a trading margin for Sasol Gas for the period 26 March 2014 to 30 June 2017 was therefore reviewed and set aside. In terms of the court order NERSA will have to consider the overturned decisions anew and decide on the approval of a new maximum gas price for Sasol. In accordance with the rules of the regulator, NERSA will, in considering a new maximum gas price application by Sasol, follow a public participation process that will afford Sasol as well as the affected stakeholders and customers the opportunity to provide input into the decision to be made by NERSA.
If the new maximum gas price approved by NERSA for the period of the overturned decision is lower than the actual price charged to customers, then a retrospective liability may arise for Sasol Gas as a result.
It is not possible to determine at this time what the outcome of such a price decision by NERSA will be. Therefore, the likelihood of a future obligation cannot be determined currently and neither can an amount for such a possible obligation be reliably estimated. Therefore, no provision has been raised at 30 June 2019.
Other litigation matters
From time to time, Sasol South Africa Limited (SSA) is involved in other litigation and similar proceedings in the normal course of business. A detailed assessment is performed on each matter and a provision is recognised where appropriate. Although the outcome of these proceedings and claims cannot be predicted with certainty, the company does not believe that the outcome of any of these cases would have a material effect on the group and company’s financial results.
34.2 Competition matters
SSA continuously evaluates its compliance programmes and controls in general, including its competition law compliance programmes and controls. As a consequence of these compliance programmes and controls, including monitoring and review activities, SSA has adopted appropriate remedial and/or mitigating steps, where necessary or advisable, lodged leniency applications and made disclosures on material findings as and when appropriate. These ongoing compliance activities have already revealed, and may still reveal, competition law contraventions or potential contraventions in respect of which we have taken, or will take, appropriate remedial and/or mitigating steps including lodging leniency applications.

Sasol South Africa Annual Financial Statements 2019 53
34.3 Environmental orders
SSA’s environmental obligation accrued as at 30 June 2019 was R7 144 million compared to R6 075 million at 30 June 2018. Included in this balance are costs such as for the remediation of soil and groundwater contamination. Due to uncertainties regarding future remediation costs, the amount accrued cannot be reasonably determined.
Although SSA has provided for known environmental obligations that are probable and reasonably estimable, the amount of additional future costs relating to remediation and rehabilitation may be material to results of operations in the period in which they are recognised. It is not expected that these environmental obligations will have a material effect on the financial position of the group and company.
35 Lease and other commitmentsOperating leases – Minimum future lease paymentsThe group and company lease buildings under long-term non-cancellable operating lease agreements and also rent offices and other equipment under operating leases that are cancellable at various short-term notice periods by either party.
Group Company2019 2018 2019 2018
for the year ended 30 June Rm Rm Rm RmProperty, plant and equipmentWithin one year 818 866 801 850One to five years 3 027 3 510 2 942 3 432More than five years 12 249 13 560 12 081 13 369Total minimum future lease payments 16 094 17 936 15 824 17 651
Included in operating leases is the following:■ The lease for the Sasol Corporate office building. The lease term is 20 years with an option to extend for a further five years.
This is a significant lease for the group and company.■ The rental of a pipeline for the transportation of gas products. The rental payments are based on the quantity of gas
transported. The lease may be extended by either party to the lease for a further three year period prior to the expiry of the current lease term of 16 years.
These leasing arrangements do not impose any significant restrictions on the group or its subsidiaries.
Contingent rentals
The group and company have no contingent rentals in respect of operating leases that are linked to market related data such as inflation.
Finance leases – Minimum future lease payments
The group and company lease equipment under long-term non-cancellable finance lease agreements. These lease agreements contain terms of renewal and escalation clauses but exclude purchase options.

54 Sasol South Africa Annual Financial Statements 2019
Group Company2019 2018 2019 2018
for the year ended 30 June Rm Rm Rm RmProperty, plant and equipmentWithin one year 619 688 619 688One to five years 2 290 2 458 2 290 2 458More than five years 10 596 10 780 10 596 10 780Less amounts representing finance charges (9 238) (9 452) (9 238) (9 452)Total minimum future lease payments 4 267 4 474 4 267 4 474
Contingent rentals
The group and company have contingent rentals in respect of finance leases.
Other Commitments
Group Company2019 2018 2019 2018
for the year ended 30 June Rm Rm Rm Rm
Water reticulation for Secunda Synfuels OperationsWithin one year 173 171 173 171One to five years 713 847 713 847More than five years 1 416 1 798 1 416 1 798
2 302 2 816 2 302 2 816The water reticulation commitments of Secunda Synfuels Operations relate to a long-term water supply agreement. The rental payments are determined based on the quantity of water consumed over the 20 year period of the agreement.
36 Related party transactionsParties are considered to be related if one party directly or indirectly has the ability to control or jointly control the other party or exercise significant influence over the other party or is a member of the key management of the reporting entity (Sasol South Africa Limited).
During the year the group and company, in the ordinary course of business, entered into various purchase and sale transactions with its holding company, fellow subsidiaries, subsidiaries, joint ventures and associates. The effect of these transactions is included in the financial performance and results of the group and company. Terms and conditions are determined on an arm's length basis.
Material related party transactions
The following table shows the material transactions that are included in the financial statements.
Group Company2019 2018 2019 2018
for the year ended 30 June Rm Rm Rm RmSales and services rendered to related partiesfellow subsidiaries
Sasol Chemicals North America LLC 5 331 5 463 5 331 5 463Sasol Chemicals Pacific Limited 4 671 4 485 4 671 4 485Sasol Chemie Co GmbH 3 146 3 192 3 146 3 192Sasol Oil (Pty) Ltd 36 920 32 668 36 916 32 664Wesco China Limited 1 159 730 1 159 730Sasol Wax GmbH 1 122 1 354 1 122 1 354Sasol Middle East FZCO 2 037 2 018 2 037 2 018Sasol Germany GmbH 1 434 1 159 1 434 1 159Other (less than R1 billion) 3 010 2 388 2 691 2 068
subsidiariesSasol Gas (Pty) Ltd – – 834 681Sasol Acrylates (South Africa) (Pty) Ltd – – 1 898 1 845
58 830 53 457 61 239 55 659Purchases from related partiesfellow subsidiaries
Sasol Mining (Pty) Ltd 17 652 16 349 17 652 16 349Sasol Petroleum Temane Limitada 3 235 2 467 – –Other (less than R1 billion) 673 725 673 725
subsidiariesSasol Gas (Pty) Ltd – – 7 049 6 961Sasol Acrylates (South Africa) (Pty) Ltd – – 2 582 2 451
joint ventureSasol Dyno Nobel (Pty) Ltd 807 726 807 726
22 367 20 267 28 763 27 212

Sasol South Africa Annual Financial Statements 2019 55
Group Company2019 2018 2019 2018
for the year ended 30 June Rm Rm Rm RmOther income statement items from related partiesAdministration fees paidfellow subsidiaries
Sasol Technology (Pty) Ltd 38 28 38 28Finance costsfellow subsidiaries
Sasol Financing Limited 2 252 2 582 2 214 2 541Sasol Financing International Limited 6 5 – –Sasol Limited 20 51 20 51Sasol Oil (Pty) Ltd 47 49 47 49
2 325 2 687 2 281 2 641Finance incomefellow subsidiaries
Sasol Financing Limited 638 746 421 487subsidiaries
Sasol Gas (Pty) Ltd – – 2 000 3 500ROMPCO (Pty) Ltd – – 991 658Sasol Dyno Nobel (Pty) Ltd – – 20 45Clariant Sasol Catalysts (Pty) Ltd* 9 8 9 8
647 754 3 441 4 698
*Not included as part of finance income but included in investment in associates.
Group Company2019 2018 2019 2018
for the year ended 30 June Rm Rm Rm RmAmounts reflected as non-current assetsInvestment in subsidiaries
Sasol Dyno Nobel (Pty) Ltd – – 114 114Sasol Acrylates (South Africa) (Pty) Ltd – – 819 819Sasol Acrylates (Pty) Ltd – – 372 372ROMPCO (Pty) Ltd – – 5 5Sasol Gas (Pty) Ltd – – 46 877 46 877
– – 48 187 48 187Long-term prepaid expensesfellow subsidiaries
Sasol Limited 375 783 354 740Amounts reflected as current assetsReceivablesfellow subsidiaries
Sasol Chemicals North America LLC 1 044 1 408 1 044 1 408Sasol Oil (Pty) Ltd 3 862 4 089 3 861 4 084Sasol Chemie Co GmbH 631 540 631 540Sasol Limited 499 377 405 400Other (less than R1 billion) 3 487 2 953 3 436 2 898
subsidiariesSasol Gas (Pty) Ltd – – 113 102Sasol Acrylates (South Africa) (Pty) Ltd – – 282 232ROMPCO (Pty) Ltd – – 2 2
joint ventureSasol Dyno Nobel (Pty) Ltd 8 8 8 8
9 531 9 375 9 782 9 674Cashfellow subsidiaries
Sasol Financing Limited 7 968 4 552 5 048 1 328Sasol Financing International Limited 69 8 69 8
8 037 4 560 5 117 1 336
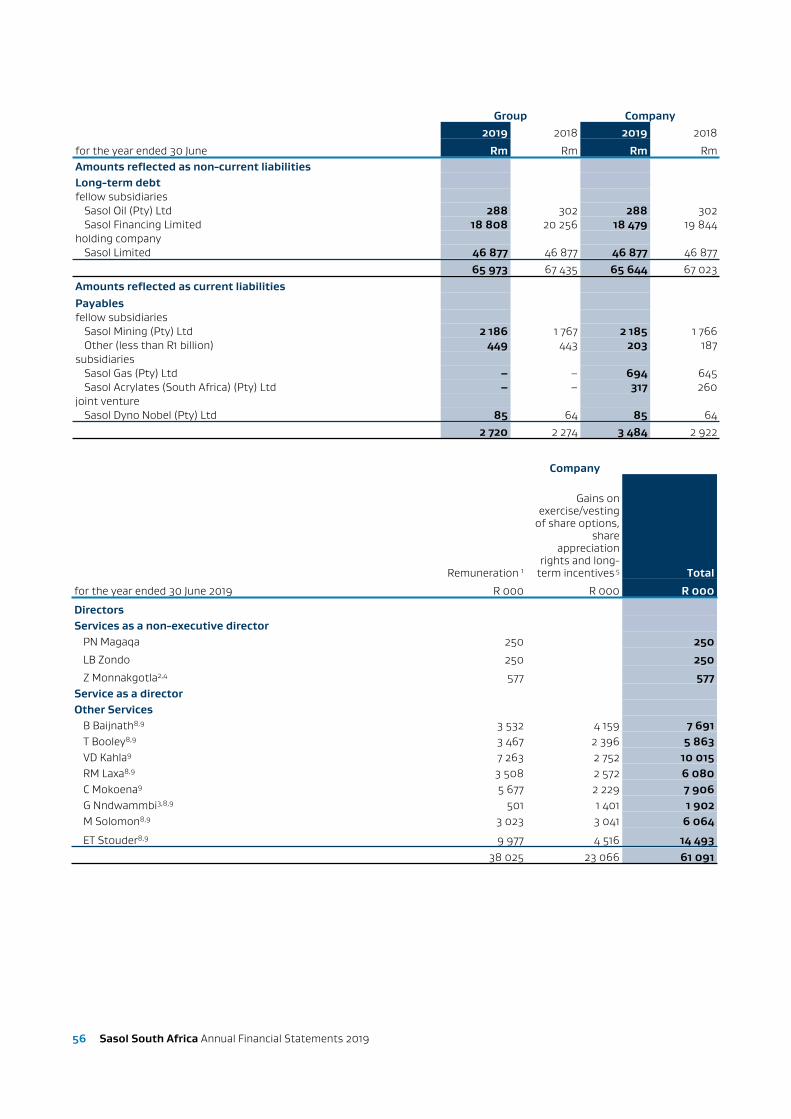
56 Sasol South Africa Annual Financial Statements 2019
Group Company2019 2018 2019 2018
for the year ended 30 June Rm Rm Rm RmAmounts reflected as non-current liabilitiesLong-term debtfellow subsidiaries
Sasol Oil (Pty) Ltd 288 302 288 302Sasol Financing Limited 18 808 20 256 18 479 19 844
holding companySasol Limited 46 877 46 877 46 877 46 877
65 973 67 435 65 644 67 023Amounts reflected as current liabilitiesPayablesfellow subsidiaries
Sasol Mining (Pty) Ltd 2 186 1 767 2 185 1 766Other (less than R1 billion) 449 443 203 187
subsidiariesSasol Gas (Pty) Ltd – – 694 645Sasol Acrylates (South Africa) (Pty) Ltd – – 317 260
joint ventureSasol Dyno Nobel (Pty) Ltd 85 64 85 64
2 720 2 274 3 484 2 922
Company
Remuneration 1
Gains on exercise/vesting
of share options, share
appreciation rights and long-
term incentives 5 Total
for the year ended 30 June 2019 R 000 R 000 R 000
DirectorsServices as a non-executive director
PN Magaqa 250 250
LB Zondo 250 250
Z Monnakgotla2,4 577 577Service as a directorOther Services
B Baijnath8,9 3 532 4 159 7 691T Booley8,9 3 467 2 396 5 863VD Kahla9 7 263 2 752 10 015RM Laxa8,9 3 508 2 572 6 080C Mokoena9 5 677 2 229 7 906G Nndwammbi3,8,9 501 1 401 1 902M Solomon8,9 3 023 3 041 6 064
ET Stouder8,9 9 977 4 516 14 49338 025 23 066 61 091

Sasol South Africa Annual Financial Statements 2019 57
Company
Balance of long-term incentives
at end of year
Intrinsic value of long-term
incentives at end of year 6,7
for the year ended 30 June 2019 NumberR 000
and US$ 000DirectorsServices as a non-executive director
N Magaqa – –L Zondo – –Z Monnakgotla – –
Service as a directorOther Services
B Baijnath 22 398 R 7 844T Booley 19 942 R 6 984VD Kahla 53 389 R 18 693RM Laxa 16 238 R 5 687C Mokoena 34 190 R 11 976G Nndwammbi 15 597 R 5 462M Solomon 13 898 R 4 867
175 652 R 61 513
ET Stouder 21 911 $544
Prescribed officers for Sasol South Africa Limited are directors of the Company1Remuneration includes salary plus short term incentives (STI) approved based on the Group results for the 2019 financial year and payable in the 2020 financial year. No STI payment was approved for 2019.2Includes remuneration in relation to another directorship held within the Sasol Group.3Appointed with effect from 3 May 2019. Reflects remuneration and benefits for the period from date of appointment.4Appointed with effect from 8 August 2018. Reflects remuneration and benefits for the period from date of appointment.5Long-term incentives (LTIs) for the 2019 financial year represent the number of units x corporate performance target achieved (2019) x closing share price on 17 October 2019.6Intrinsic values at end of year have been determined using the closing share price of R350,21 ($24,85) on 30 June 2019.7Change in instrinsic value for the year results from a change in the share price.8Long-term incentive gains includes a special LTI award. The Special LTI will vest on the third anniversary of the award date, subject to the person being in service of Sasol on the vesting date.9The director is the permanent employee within the Sasol Group, full remuneration is disclosed.
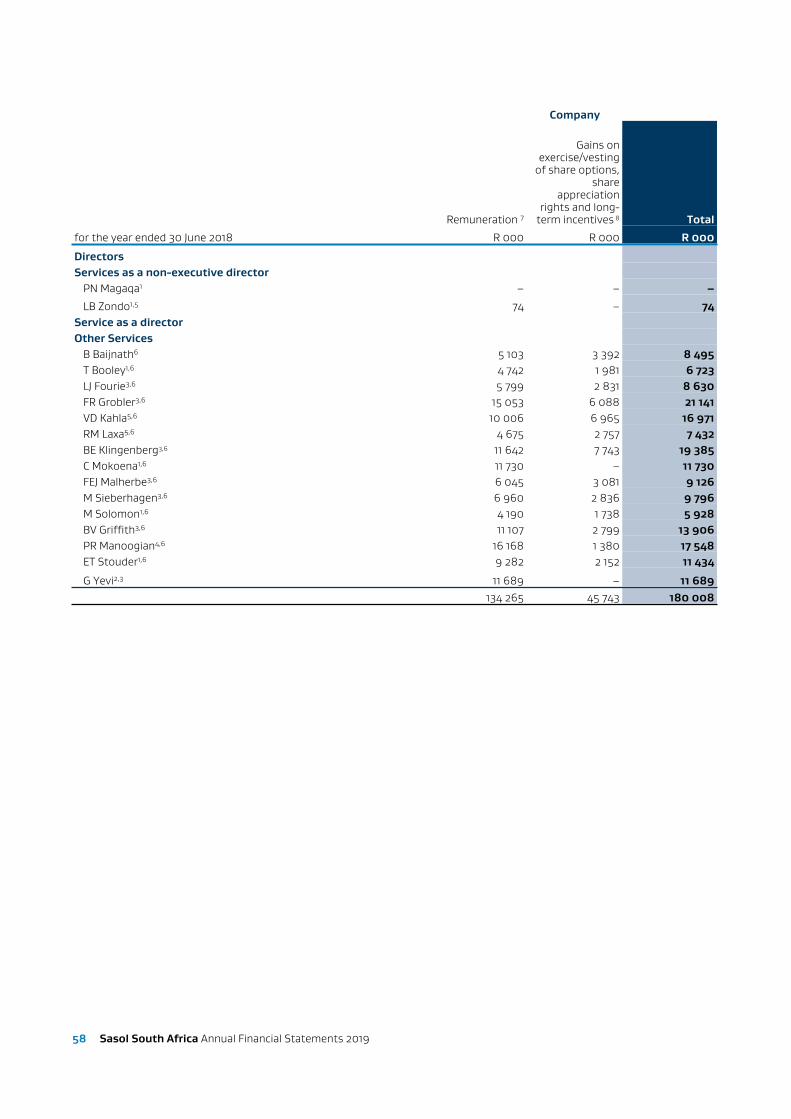
58 Sasol South Africa Annual Financial Statements 2019
Company
Remuneration 7
Gains on exercise/vesting
of share options, share
appreciation rights and long-
term incentives 8 Total
for the year ended 30 June 2018 R 000 R 000 R 000
DirectorsServices as a non-executive director
PN Magaqa1 – – –
LB Zondo1,5 74 – 74Service as a directorOther Services
B Baijnath6 5 103 3 392 8 495T Booley1,6 4 742 1 981 6 723LJ Fourie3,6 5 799 2 831 8 630FR Grobler3,6 15 053 6 088 21 141VD Kahla5,6 10 006 6 965 16 971RM Laxa5,6 4 675 2 757 7 432BE Klingenberg3,6 11 642 7 743 19 385C Mokoena1,6 11 730 – 11 730FEJ Malherbe3,6 6 045 3 081 9 126M Sieberhagen3,6 6 960 2 836 9 796M Solomon1,6 4 190 1 738 5 928BV Griffith3,6 11 107 2 799 13 906PR Manoogian4,6 16 168 1 380 17 548ET Stouder1,6 9 282 2 152 11 434
G Yevi2,3 11 689 – 11 689134 265 45 743 180 008

Sasol South Africa Annual Financial Statements 2019 59
Company
Balance of long-term incentives
at end of year
Intrinsic value of long-term
incentives at end of year 9,10
for the year ended 30 June 2018 NumberR 000
and US$ 000DirectorsServices as a non-executive director
N Magaqa – –L Zondo – –
Service as a directorOther Services
B Baijnath 23 782 R 11 959T Booley 19 547 R 9 829LJ Fourie 17 544 R 8 822FR Grobler 47 609 R 23 941VD Kahla 51 548 R 25 921RM Laxa 16 444 R 8 269BE Klingenberg 61 445 R 30 898C Mokoena 22 936 R 11 534FEJ Malherbe 21 020 R 10 570M Sieberhagen 19 870 R 9 992M Solomon 12 887 R 6 480
314 632 R 158 215
BV Griffith 22 078 $807PR Manoogian 21 935 $802ET Stouder 21 744 $795G Yevi 8 500 $311
74 257 $2 715
Key management remuneration
Key management comprises of Executive and Non-executive Directors as well as other members of the Group Executive Committee (GEC).
Amounts due to and from related parties are included in the respective notes to the financial statements for those statement of financial position items.
37 Subsequent eventOn 14 February 2020, we received approval from the Competition Commission of South Africa to form a new joint venture, which will be managed and operated by our world-class explosives partner and the majority shareholder, Enaex S.A. The downstream portion of our explosives business, classified as a disposal group held for sale since 30 June 2019, will be disposed to the joint venture as a going concern. The process is expected to close by the end of June 2020.

60 Sasol South Africa Annual Financial Statements 2019
38 Going concernThe directors’ have made an assessment of the company’s ability to continue as a going concern and there is no reason to believe the business will not be a going concern in the year ahead.
39 Financial risk management and financial instruments The group and company classify all its financial instruments at amortised cost except for short-term financial assets and liabilities which are classified at fair value through profit and loss.
39.1 Financial risk management
The group and company are exposed in varying degrees to a number of financial instrument related risks. The directors have the overall responsibility for the establishment and oversight of the group and company's risk management framework. The directors are responsible for providing the board with the assurance that significant business risks are systematically identified, assessed and reduced to acceptable levels. A comprehensive risk management process has been developed to continuously monitor and control these risks. The directors and divisional committees of Sasol South Africa Limited meet regularly to review and, if appropriate, approve the implementation of optimal strategies for the effective management of financial risks. The committee reports on a regular basis to the Group Executive Committee (GEC) on its activities.
The Sasol group has a central treasury function that manages the financial risks relating to the group's operations.
Capital allocation
The group and company's objectives when managing capital (which includes share capital, borrowings, working capital and cash and cash equivalents) are to maintain a flexible capital structure that reduces the cost of capital to an acceptable level of risk and to safeguard the group and company's ability to continue as a going concern while taking advantage of strategic opportunities in order to grow shareholder value sustainably.
The group and company manage the capital structure and make adjustments to it in light of changes in economic conditions and the risk characteristics of the underlying assets. In order to maintain the capital structure, the group and company may adjust the amount of dividends paid to shareholders, return capital to shareholders, issue new debt, issue new debt to replace existing debt with different characteristics and/or sell assets to reduce debt.
The group and company monitor capital utilising a number of measures, including the gearing ratio. The gearing ratio is calculated as net borrowings (total borrowings less cash) divided by total equity. Gearing takes into account the group's substantial capital investment and susceptibility to external market factors such as crude oil prices, exchange rates and commodity chemical prices. The gearing level for 2019 is 132% (2018 – 160%) for the group and 121% (2018 – 140%) for the company, mainly due to the loan raised of R46,9 billion with Sasol Limited to fund the acquisition of Sasol Gas (Pty) Ltd at fair value. Excluding the loan to finance the acquisition of Sasol Gas (Pty) Ltd the gearing for 2019 is 36% (2018 – 52%) for the group and 33% (2018 – 45%) for the company.
Financing risk
Financing risk refers to the risk that financing of the group and company’s net debt requirements and refinancing of existing borrowings could become more difficult or more costly in the future. This risk can be decreased by managing the group and company within the targeted gearing ratio, maintaining an appropriate spread of maturity dates and managing short-term borrowings within acceptable levels.
The group and company’s target for long-term borrowings include an average time to maturity of at least two years, and an even spread of maturities.
Risk profile
Risk management and measurement relating to each of these risks is discussed under the headings below (sub-categorised into credit risk, liquidity risk, and market risk) which entails an analysis of the types of risk exposure, the way in which such exposure is managed and quantification of the level of exposure in the statement of financial position.
Credit risk
Credit risk, or the risk of financial loss due to counterparties not meeting their contractual obligations. Credit risk is deemed to be low when based on the forward available information it is highly probably that the customer will service its debt in accordance to the agreement throughout the period.
How we manage the risk
The risk is managed by the application of credit approvals, limits and monitoring procedures. Where appropriate, the group and company obtain security in the form of guarantees to mitigate risk. Counterparty credit limits are in place and are reviewed and approved by the respective subsidiary credit management committees. The central treasury function provides credit risk management for the group-wide exposure in respect of a diversified group of banks and other financial institutions. These are evaluated regularly for financial robustness especially in the current global economic environment. Management has evaluated treasury counterparty risk and does not expect any treasury counterparties to fail in meeting their obligations. The group maximum exposure is the outstanding carrying amount of the financial asset.
For all financial assets measured at amortised cost, the group and company calculates the expected credit loss based on contractual payment terms of the asset. The contractual payment terms for receivables vary from 30 days to 120 days. The exposure to credit risk is influenced by the individual characteristics, the industry and geographical area of the counterparty with whom we have transacted. Financial assets at amortised cost are carefully monitored and reviewed on a regular basis for expected credit loss and impairment based on our credit risk policy.

Sasol South Africa Annual Financial Statements 2019 61
Expected credit loss is calculated as a function of probability of default, loss given default and exposure at default. The group and company allocate probability of default based on the external and internal information. The major portion of the financial assets at amortised cost consist of externally rated customers and the group and company uses the average of Moody’s, Fitch and S&P Corporate and Sovereign probability of defaults, depending on whether the customer or holder of the financial asset is corporate or government related. For customers or debtors that are not rated by the rating agency, the group and company allocate internal credit ratings and default rates taking into account forward looking information, based on the, debtors profile and financial status. Loss given default is based on the Basel model. The Basel model assumes 35% loss given default for secured financial assets and 45% for unsecured financial assets. Credit enhancement is only taken into account if it is integral to the asset. Trade receivables expected credit loss is calculated over lifetime. Other financial assets expected credit loss is measured over 12 months when the credit risk is low and over lifetime where the credit risk has increased. Credit risk is deemed to have increases when the payment is 30 days overdue and the customer have defaulted, indicating that their inability to honour the debt.
Sasol Oil (Pty) Ltd represents more than 10% of the group and company’s total turnover and more than 10% of the group and company’s total trade and other receivables for the years ended 30 June 2019 and 2018. Approximately 71% (2018 – 68%) of the group and company’s total turnover is generated from sales within South Africa, while about 29% (2018 – 32%) relates to foreign sales. The concentration of credit risk within geographic regions is largely aligned with the geographic regions in which the turnover was earned.
Detail on expected credit losses recognised:
Group2019 2018
Life time 12 months DeductionsExpected
credit loss Impairment
Rm Rm Rm Rm RmLong-term receivables 17 – – 17 –Trade and other receivables 128 – – 128 48
145 – – 145 48
Company2019 2018
Life time 12 months DeductionsExpected
credit loss Impairment
Rm Rm Rm Rm RmTrade and other receivables 81 – – 81 20
Amounts of R48 million for the group and R20 million for the company were recognised under IAS 39 as at 30 June 2018. Overview of the credit risk profile of financial assets measured at amortised cost is as follows:
Group Company
2019 2019
% %AAA to A- 76 73BBB to B- 21 24CCC+ and - below 3 3
Liquidity risk
Liquidity risk is the risk that the group and company will be unable to meet its obligations as they become due.
How we manage the risk
The group and company manage liquidity risk by effectively managing its working capital, capital expenditure and cash flows, making use of a central treasury function within Sasol Group to manage pooled business unit cash investments and borrowing requirements. Currently the group and company are maintaining a positive cash position, conserving the group's cash resources through continued focus on working capital improvement and capital reprioritisation. The group and company meet its financing requirements through a mixture of cash generated from its operations and, short and long-term borrowings. Adequate banking facilities and reserve borrowing capacities are maintained.
Our exposure to and assessment of the risk
The maturity profile of the undiscounted contractual cash flows of financial instruments at 30 June was as follows:

62 Sasol South Africa Annual Financial Statements 2019
Group
Contractual cash flows*
Within one year
One to five years
More than five years
Note Rm Rm Rm Rm2019Financial assetsNon-derivative instrumentsLong-term receivables 339 2 337 –Trade and other receivables 22 14 689 14 689 – –Cash and cash equivalents 25 10 290 10 290 – –
25 318 24 981 337 –Derivative instrumentsForward exchange contracts – – – –
25 318 24 981 337 –
Financial liabilitiesNon-derivative instrumentsLong-term debt (89 331) (6 766) (20 224) (62 341)Trade and other payables** 23 (9 889) (9 889) – –
(99 220) (16 655) (20 224) (62 341)Derivative instrumentsForeign exchange contracts – – – –
(99 220) (16 655) (20 224) (62 341)* Contractual cash flows include interest payments.** Trade and other payables exclude employee related payables and VAT.
GroupContractual Within One to More thancash flows* one year five years five years
Note Rm Rm Rm Rm
2018Financial assetsNon-derivative instrumentsLong-term receivables 21 2 19 –Trade and other receivables 22 14 797 14 797 – –Cash and cash equivalents 25 6 726 6 726 – –
21 544 21 525 19 –Derivative instrumentsForward exchange contracts 421 421 – –
21 965 21 946 19 –
Financial liabilitiesNon-derivative instrumentsLong-term debt (93 357) (6 861) (21 172) (65 324)Trade and other payables** 23 (8 817) (8 817) – –
(102 174) (15 678) (21 172) (65 324)
Derivative instrumentsForward exchange contracts (420) (420) – –
(102 594) (16 098) (21 172) (65 324)* Contractual cash flows include interest payments.** Trade and other payables exclude employee related payables and VAT.

Sasol South Africa Annual Financial Statements 2019 63
CompanyContractual Within One to More thancash flows* one year five years five years
Note Rm Rm Rm Rm
2019Financial assetsNon-derivative instrumentsLong-term receivables 22 2 20 –Trade and other receivables 22 14 056 14 056 – –Cash and cash equivalents 25 6 566 6 566 – –
20 644 20 624 20 –Derivative instrumentsForward exchange contracts – – – –
20 644 20 624 20 –
Financial liabilitiesNon-derivative instrumentsLong-term debt (86 055) (5 444) (18 270) (62 341)Trade and other payables** 23 (10 338) (10 338) – –
(96 393) (15 782) (18 270) (62 341)Derivative instrumentsForward exchange contracts – – – –
(96 393) (15 782) (18 270) (62 341)* Contractual cash flows include interest payments.** Trade and other payables exclude employee related payables and VAT.
CompanyContractual Within One to More thancash flows* one year five years five years
Note Rm Rm Rm Rm
2018Financial assetsNon-derivative instrumentsLong-term receivables 21 2 19 –Trade and other receivables 22 14 355 14 355 – –Cash and cash equivalents 25 2 867 2 867 – –
17 243 17 224 19 –Derivative instrumentsForward exchange contracts 421 421 – –
17 664 17 645 19 –
Financial liabilitiesNon-derivative instrumentsLong-term debt (88 700) (5 563) (17 813) (65 324)Trade and other payables** 23 (9 146) (9 146) – –
(97 846) (14 709) (17 813) (65 324)
Derivative instrumentsForward exchange contracts (420) (420) – –
(98 266) (15 129) (17 813) (65 324)* Contractual cash flows include interest payments.** Trade and other payables exclude employee related payables and VAT.

64 Sasol South Africa Annual Financial Statements 2019
Market risk
Market risk is the risk arising from possible market price movements and their impact on the future cash flows of the business. The market price movements that the group is exposed to:
Foreign currency risk
Foreign currency risk is a risk that earnings and cash flows will be affected due to changes in exchange rates.
How we manage the risk
The Sasol Limited group’s Hedging and Digital committee sets broad guidelines in terms of tenor and hedge cover ratios specifically to assess future currency exposure and large forward cover amounts for long periods into the future, which have the potential to materially affect our financial position. These guidelines and our hedging policy are reviewed from time to time. This hedging strategy enables us to better predict cash flows and thus manage our working capital and debt more effectively. Foreign currency risks are managed through the Sasol Limited group’s hedging policy and financing policies and the selective use of forward exchange contracts.
Our exposure to and assessment of the risk
The group and company's transactions are predominantly entered into in the respective functional currency of the individual operations. However, the group and company’s operations utilise various foreign currencies on sales, purchases and borrowings, and consequently are exposed to exchange rate fluctuations that have an impact on cash flows and financing activities. Our chemical products are mostly commodity products whose prices are largely based on global commodity and benchmark prices quoted in US dollars and consequently are exposed to exchange rate fluctuations that have an impact on cash flows and financing activities. These operations are exposed to foreign currency risk in connection with contracted payments in currencies not in their individual functional currency.
Foreign exchange contractsForeign exchange contracts (FECs) are utilised by the group and company to hedge the risk of currency depreciation on committed and highly probable forecast transactions. Transactions hedged with FECs include capital and goods purchases (imports) and sales (exports).
The following significant exchange rates were applied during the year:
Average rate Closing rate2019 2018 2019 2018
Rm Rm Rm RmRand/Euro 16,19 15,34 16,01 16,04Rand/US dollar 14,20 12,85 14,08 13,73
The table below shows the significant currency exposure where entities within the group and company have monetary assets or liabilities that have exposure to the US dollar or the Euro. The amounts have been presented in rand by converting the foreign currency amount at the closing rate at the reporting date.
Group2019 2018
Euro US dollar Euro US dollar
Rm Rm Rm RmTrade and other receivables 1 768 3 848 1 610 3 904Cash and cash equivalents – 87 – 15Net exposure on assets 1 768 3 935 1 610 3 919
Long-term debt (122) (1 851) (153) (1 651)Trade and other payables (164) (878) (122) (820)Net exposure on liabilities (286) (2 729) (275) (2 471)Total net exposure 1 482 1 206 1 335 1 448
Not
es to
the
finan
cial
sta
tem
ents

Sasol South Africa Annual Financial Statements 2019 65
Company2019 2018
Euro US dollar Euro US dollar
Rm Rm Rm RmTrade and other receivables 1 768 3 564 1 610 3 573Cash and cash equivalents – 69 – 8Net exposure on assets 1 768 3 633 1 610 3 581
Long-term debt (122) (1 851) (153) (1 651)Trade and other payables (161) (529) (110) (459)Net exposure on liabilities (283) (2 380) (263) (2 110)Total net exposure 1 485 1 253 1 347 1 471
Sensitivity analysis
The following sensitivity analysis is provided to show the foreign currency exposure of the group and company at the end of the reporting period. This analysis is prepared based on the statement of financial position balances that exist at year-end, for which there is currency risk, before consideration of currency derivatives, which exist at that point in time. The effect on equity is calculated as the effect on profit and loss.
A 10% weakening in the group and company's significant exposure to the foreign currency at 30 June would have increased either the equity or the profit by the amounts below, before the effect of tax. This analysis assumes that all other variables, in particular, interest rates, remain constant, and has been performed on the same basis for 2018.
Group Company
2019 2018 2019 2018
Income Income Income Income Equity Statement Equity statement Equity Statement Equity statement
Rm Rm Rm Rm Rm Rm Rm RmEuro 148 148 134 134 149 149 135 135US dollar 121 121 145 145 125 125 147 147
A 10% movement in the opposite direction in the group and company's exposure to foreign currency would have an equal and opposite effect to the amounts disclosed above.
Interest rate risk
Interest rate risk is the risk that the value of short-term investments and financial activities will change as a result of fluctuations in the interest rates.
Fluctuations in interest rates impact on the value of short-term investments and financing activities, giving rise to interest rate risk. The group and company have significant exposure to interest rate risk due to the volatility in South African interest rates.
How we manage the risk
The group and company’s policy is to borrow funds at floating rates of interest as this is considered to give somewhat of a natural hedge against commodity price movements, given the correlation with economic growth (and industrial activity) which in turn shows a correlation with commodity price fluctuation.
The debt of the group and company are structured on a combination of floating rates. The benefits of fixing or capping interest rates on the group and company’s various financing activities are considered on a case-by-case and project-by-project basis, taking the specific and overall risk profile into consideration. For further details of long-term debt refer to note 14.
In respect of financial assets, the group and company’s policy is to invest cash at floating rates of interest and cash reserves are to be maintained in short-term investments (less than one year) in order to maintain liquidity, while achieving a satisfactory return for shareholders.
Not
es to
the
finan
cial
sta
tem
ents

66 Sasol South Africa Annual Financial Statements 2019
Our exposure to and assessment of the risk
At the reporting date, the interest rate profile of the group and company’s interest-bearing financial instruments was:
Group CompanyCarrying value Carrying value
2019 2018 2019 2018
Rm Rm Rm RmVariable rate instrumentsFinancial assets 10 291 6 728 6 567 2 869Financial liabilities (21 678) (23 713) (18 767) (19 844)
(11 387) (16 985) (12 200) (16 975)
Fixed rate instrumentsFinancial liabilities (51 144) (51 351) (51 144) (51 351)Interest profile (variable: fixed rate as a percentage of total financial assets) 100:0 100:0 100:0 100:0Interest profile (variable: fixed rate as a percentage of total financial liabilities) 30:70 32:68 27:73 28:72
Cash flow sensitivity for variable rate instruments
Financial instruments affected by interest rate risk include borrowings, deposits, derivative financial instruments, trade receivables and trade payables. A change of 1% in the prevailing interest rate in that region at the reporting date would have increased/(decreased) earnings by the amounts shown below before the effect of tax. The sensitivity analysis has been prepared on the basis that all other variables, in particular foreign currency rates, remain constant and has been performed on the same basis for 2018.
Group Company
Income statement - 1%
increase
Income statement - 1%
decrease
Income statement - 1%
increase
Income statement - 1%
decrease
Rm Rm Rm Rm
30 June 2019 (114) 114 (122) 122
30 June 2018 (170) 170 (170) 170
39.2 Fair value
Various valuation techniques and assumptions are utilised for the purpose of calculating fair value.
The group and company do not hold any financial instruments traded in an active market. Fair value is determined using valuation techniques as outlined below. Where possible, inputs are based on quoted prices and other market determined variables.
Fair value hierarchy
The following table is provided representing the assets and liabilities measured at fair value at reporting date, or for which fair value is disclosed at reporting date.
The calculation of fair value requires various inputs into the valuation methodologies used.
The source of the inputs used affects the reliability and accuracy of the valuations. Significant inputs have been classified into the hierarchical levels in line with IFRS 13, as shown below.
There have been no transfers between levels in the current year. Transfers between levels are considered to have occurred at the date of the event or change in circumstances.
Level 1 Quoted prices in active markets for identical assets or liabilities.Level 2 Inputs other than quoted prices that are observable for the asset or liability (directly or indirectly).Level 3 Inputs for the asset or liability that are unobservable.

Sasol South Africa Annual Financial Statements 2019 67
Group CompanyFair value Fair value Fair value
30 June 30 June hierarchy
Financial instrument 2019 2019 Valuation method Significant inputs of inputsFinancial assetsLong-term receivables 339 22 Discounted cash flow Market related interest rates. Level 3Trade and other receivables 14 689 14 056 Discounted cash flow Market related interest rates. Level 3*
Cash and cash equivalents 10 290 6 566 ** ** Level 1**
Financial liabilitiesUnlisted long-term debt 73 671 70 693 Discounted cash flow Market related interest rates Level 3
Trade and other payables 9 889 10 338 Discounted cash flow Market related interest rates Level 3*
* The fair value of these instruments approximates their carrying value, due to their short-term nature.** The carrying value of cash and cash equivalents is considered to reflect its fair value.

68 Sasol South Africa Annual Financial Statements 2019