sasol ar 2005 fin download even
TRANSCRIPT
1
visionTo be a respected global enterprise, harnessing our talents in applying unique, innovative and competitive
technologies to excel in selected markets in the energy and chemicals sectors in Southern Africa and worldwide.
valuesSasol's global business principles and conduct are founded on, and inspired by, six shared values: customer focus,
winning with people, safety, excellence in all we do, continuous improvement and integrity.
Through the collective skills of our people around
the globe we are working hard to improve safety,
customer service, productivity and technology, while
also containing costs, reducing our environmental
footprint and seeking to be a better corporate citizen
because the pursuit of continuous improvement is
integral to our values.
2
the year in review
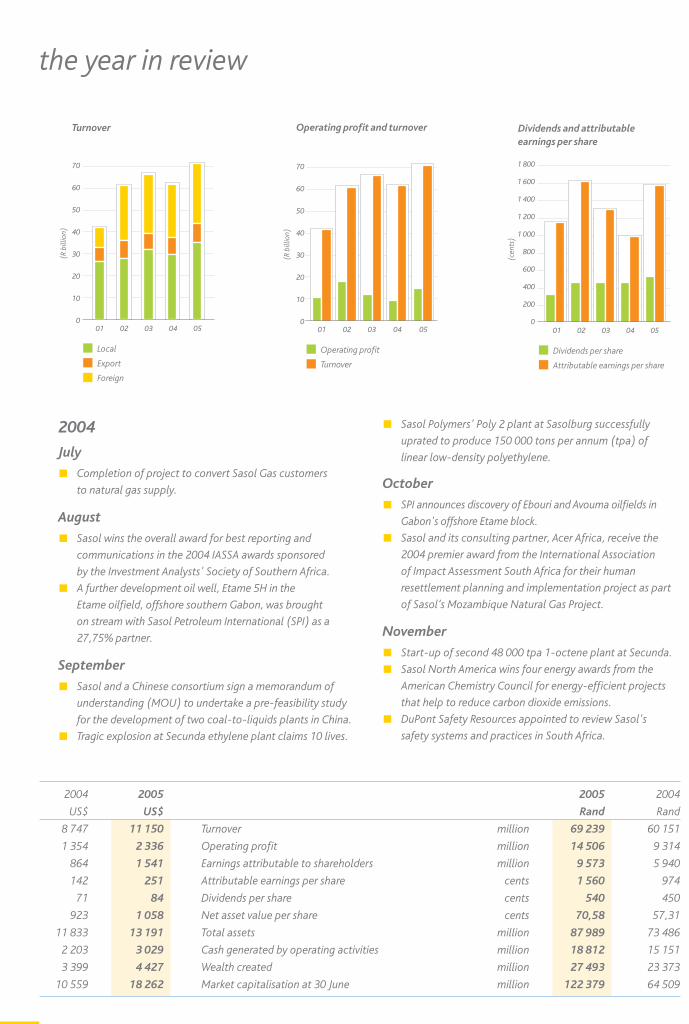
Turnover
01 02 03 04 05
70
60
50
40
30
20
10
0
Local
Export
Foreign
(R b
illio
n)
Operating profit and turnover
01
70
60
50
40
30
20
10
0
Operating profit
Turnover
(R b
illio
n)
02 03 04 05
Dividends and attributableearnings per share
01 02 03 04 05
Dividends per share
Attributable earnings per share
(cen
ts)
0
200
400
600
800
1 000
1 200
1 400
1 600
1 800
2004
July
Completion of project to convert Sasol Gas customers
to natural gas supply.
August
Sasol wins the overall award for best reporting and
communications in the 2004 IASSA awards sponsored
by the Investment Analysts' Society of Southern Africa.
A further development oil well, Etame 5H in the
Etame oilfield, offshore southern Gabon, was brought
on stream with Sasol Petroleum International (SPI) as a
27,75% partner.
September
Sasol and a Chinese consortium sign a memorandum of
understanding (MOU) to undertake a pre-feasibility study
for the development of two coal-to-liquids plants in China.
Tragic explosion at Secunda ethylene plant claims 10 lives.
Sasol Polymers' Poly 2 plant at Sasolburg successfully
uprated to produce 150 000 tons per annum (tpa) of
linear low-density polyethylene.
October
SPI announces discovery of Ebouri and Avouma oilfields in
Gabon's offshore Etame block.
Sasol and its consulting partner, Acer Africa, receive the
2004 premier award from the International Association
of Impact Assessment South Africa for their human
resettlement planning and implementation project as part
of Sasol’s Mozambique Natural Gas Project.
November
Start-up of second 48 000 tpa 1-octene plant at Secunda.
Sasol North America wins four energy awards from the
American Chemistry Council for energy-efficient projects
that help to reduce carbon dioxide emissions.
DuPont Safety Resources appointed to review Sasol's
safety systems and practices in South Africa.
2004 2005 2005 2004
US$ US$ Rand Rand
8 747 11 150 Turnover million 69 239 60 151
1 354 2 336 Operating profit million 14 506 9 314
864 1 541 Earnings attributable to shareholders million 9 573 5 940
142 251 Attributable earnings per share cents 1 560 974
71 84 Dividends per share cents 540 450
923 1 058 Net asset value per share cents 70,58 57,31
11 833 13 191 Total assets million 87 989 73 486
2 203 3 029 Cash generated by operating activities million 18 812 15 151
3 399 4 427 Wealth created million 27 493 23 373
10 559 18 262 Market capitalisation at 30 June million 122 379 64 509
4
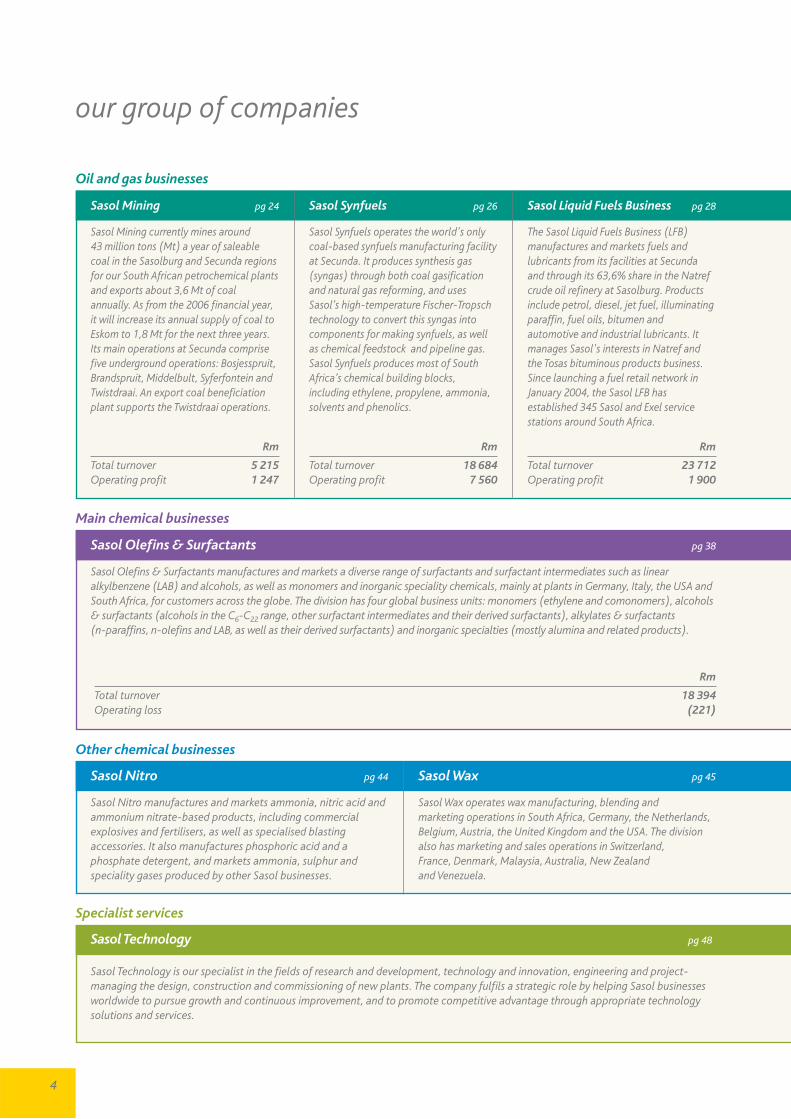
Sasol Mining pg 24
Sasol Mining currently mines around 43 million tons (Mt) a year of saleablecoal in the Sasolburg and Secunda regionsfor our South African petrochemical plantsand exports about 3,6 Mt of coalannually. As from the 2006 financial year,it will increase its annual supply of coal toEskom to 1,8 Mt for the next three years.Its main operations at Secunda comprisefive underground operations: Bosjesspruit,Brandspruit, Middelbult, Syferfontein andTwistdraai. An export coal beneficiationplant supports the Twistdraai operations.
Rm
Total turnover 5 215Operating profit 1 247
Sasol Synfuels pg 26
Sasol Synfuels operates the world's onlycoal-based synfuels manufacturing facility at Secunda. It produces synthesis gas(syngas) through both coal gasification and natural gas reforming, and usesSasol’s high-temperature Fischer-Tropschtechnology to convert this syngas intocomponents for making synfuels, as well as chemical feedstock and pipeline gas.Sasol Synfuels produces most of SouthAfrica’s chemical building blocks,including ethylene, propylene, ammonia,solvents and phenolics.
Rm
Total turnover 18 684Operating profit 7 560
Rm
Total turnover 23 712Operating profit 1 900
Sasol Liquid Fuels Business pg 28
The Sasol Liquid Fuels Business (LFB)manufactures and markets fuels andlubricants from its facilities at Secundaand through its 63,6% share in the Natrefcrude oil refinery at Sasolburg. Productsinclude petrol, diesel, jet fuel, illuminatingparaffin, fuel oils, bitumen andautomotive and industrial lubricants. Itmanages Sasol's interests in Natref andthe Tosas bituminous products business.Since launching a fuel retail network inJanuary 2004, the Sasol LFB hasestablished 345 Sasol and Exel servicestations around South Africa.
Sasol Olefins & Surfactants pg 38
Sasol Olefins & Surfactants manufactures and markets a diverse range of surfactants and surfactant intermediates such as linearalkylbenzene (LAB) and alcohols, as well as monomers and inorganic speciality chemicals, mainly at plants in Germany, Italy, the USA andSouth Africa, for customers across the globe. The division has four global business units: monomers (ethylene and comonomers), alcohols& surfactants (alcohols in the C6-C22 range, other surfactant intermediates and their derived surfactants), alkylates & surfactants (n-paraffins, n-olefins and LAB, as well as their derived surfactants) and inorganic specialties (mostly alumina and related products).
Oil and gas businesses
Main chemical businesses
Other chemical businesses
Specialist services
Sasol Nitro pg 44
Sasol Nitro manufactures and markets ammonia, nitric acid andammonium nitrate-based products, including commercialexplosives and fertilisers, as well as specialised blastingaccessories. It also manufactures phosphoric acid and aphosphate detergent, and markets ammonia, sulphur andspeciality gases produced by other Sasol businesses.
Sasol Wax pg 45
Sasol Wax operates wax manufacturing, blending and marketing operations in South Africa, Germany, the Netherlands,Belgium, Austria, the United Kingdom and the USA. The division also has marketing and sales operations in Switzerland,France, Denmark, Malaysia, Australia, New Zealand and Venezuela.
Sasol Technology pg 48
Sasol Technology is our specialist in the fields of research and development, technology and innovation, engineering and project-managing the design, construction and commissioning of new plants. The company fulfils a strategic role by helping Sasol businessesworldwide to pursue growth and continuous improvement, and to promote competitive advantage through appropriate technologysolutions and services.
our group of companies
Rm
Total turnover 18 394Operating loss (221)

5
Rm
Total turnover 2 404Operating profit 932
Rm
Total turnover 841Operating profit 281
Rm
Total turnover 7 282Operating profit 1 484
Sasol Gas pg 32
Sasol Gas distributes and marketsnatural gas from Mozambique's Temanefield and methane-rich gas produced atSecunda. The company delivers pipelinegas through a 2 265 km pipelinenetwork to more than 530 industrial and commercial customers in Gauteng,Mpumalanga, Free State and KwaZulu-Natal.
Sasol Synfuels International pg 36
Sasol Synfuels International (SSI),together with the joint venture withChevron of the USA, Sasol Chevron,develops and implements internationalventures based on the integrated, three-step Sasol Slurry Phase Distillate™ (SasolSPD™) process for gas-to-liquids (GTL)fuel conversion. SSI also exploresopportunities based on coal and otherhydrocarbon sources that could entail theuse of Sasol Fischer-Tropsch technology.SSI, in partnership with Qatar Petroleum,will bring its first GTL plant intoproduction in our 2006 financial year
Sasol Petroleum International pg 34
Sasol Petroleum International (SPI)develops and manages our internationalupstream interests in oil and gasexploration and production from officesin London and Johannesburg. Theseinterests are concentrated inMozambique, South Africa, Gabon,Equatorial Guinea and Nigeria. SPI hasbeen producing gas from Mozambique'sonshore Temane field since February2004, with production being 77,1 milliongigajoules for the 2005 financial year. It isalso producing oil in Gabon through its27,75% share in the offshore Etame field.
Sasol Polymers pg 40
Sasol Polymers operates plants at Sasolburg and Secunda andproduces ethylene, propylene, low-density polyethylene(LDPE), linear low-density polyethylene, polypropylene, vinylchloride monomer, polyvinyl chloride, chlor-alkali chemicalsand mining reagents. It has shareholdings in two Malaysiancompanies: Optimal Olefins for producing ethylene andpropylene; and Petlin (Malaysia) for producing LDPE.
Rm
Total turnover 8 404Operating profit 1 243
Sasol Solvents pg 42
Sasol Solvents is a supplier of a diverse range of solvents andassociated products with manufacturing plants in South Africa andGermany. It has 11 business units: blends and hydrocarbons; C3/C4
alcohols; esters and acids; ethanol; fine chemicals; glycol ethers;ketones; methanol; mining chemicals; acrylic acid and acrylates (a joint venture with Mitsubishi Chemical Corporation); andmaleic anhydride (a joint venture with Huntsman Corporation).
Sasol Infrachem pg 46
Sasol Infrachem has been producing syngas derived from naturalgas as feedstock for Sasol's Sasolburg chemical businesses since July 2004. The company produces and distributes reformednatural gas on behalf of Sasol Gas. Sasol Infrachem provides on-site utilities, infrastructure support and support services toother businesses.
Merisol pg 47
Merisol is a joint venture with Merichem Company of the USA.It is a leading global manufacturer of cresols, xylenols,alkylphenols and other phenolics. It has manufacturing facilities in South Africa and the USA and maintains two joint ventures:one at Sasolburg; and the other at Oita, Japan.
Sasol Financing pg 50
Sasol Financing is responsible for centrally managing group cash and liquidity, credit rating processes, in-house banking, domestic andinternational financing arrangements, and foreign exchange, interest rate and treasury risk management, as well as general financing andtreasury matters. Sasol Financing also acts as a business partner to Sasol subsidiaries and joint ventures for project- and company-specificspecialised financing and financial risk mitigation strategies and arrangements. Assistance is provided in developing and implementinghedging strategies for risks associated with commodity prices, foreign exchange and interest rates.
Note: Please refer to pages 129 and 131 of the annual financial statements for a list of the significant subsidiaries and incorporated joint ventures of Sasol Limited.
Sasol Limited
The Sasol head office at Johannesburg, South Africa, coordinates group activities and provides certain specialisedservices to group companies. The names and principal activities of the main businesses and divisions of the Sasol groupof companies are featured here.
6
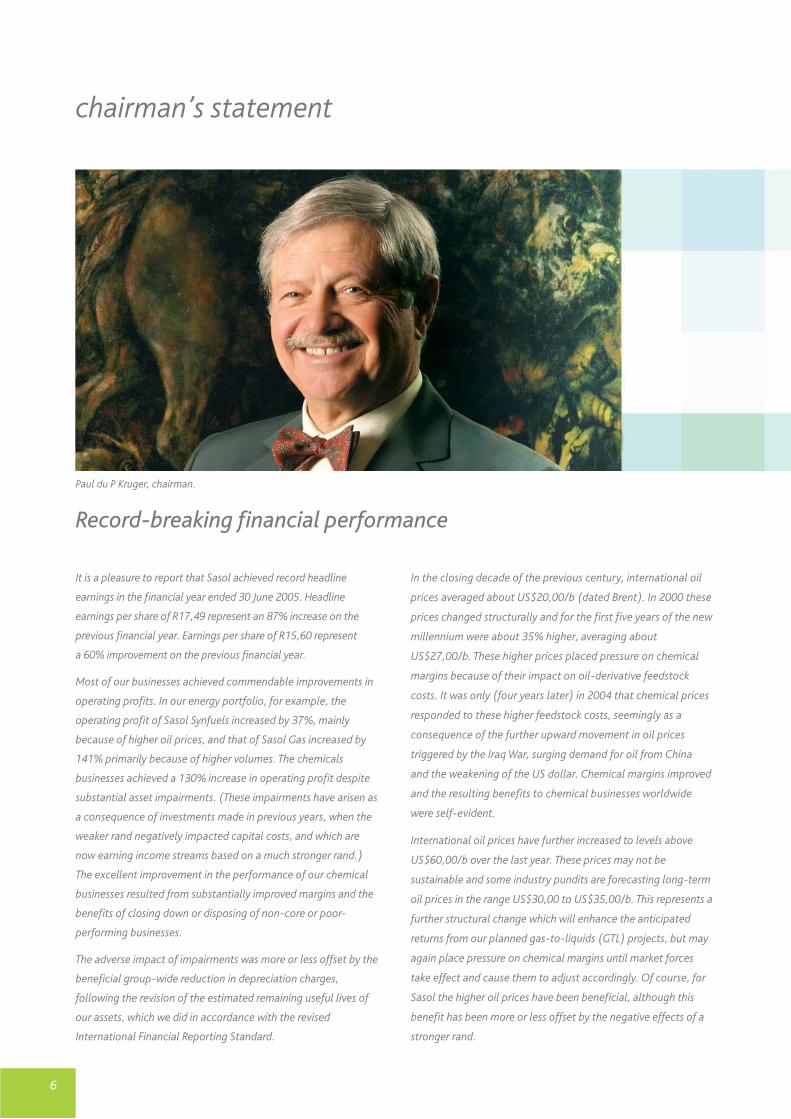
chairman’s statement
It is a pleasure to report that Sasol achieved record headline
earnings in the financial year ended 30 June 2005. Headline
earnings per share of R17,49 represent an 87% increase on the
previous financial year. Earnings per share of R15,60 represent
a 60% improvement on the previous financial year.
Most of our businesses achieved commendable improvements in
operating profits. In our energy portfolio, for example, the
operating profit of Sasol Synfuels increased by 37%, mainly
because of higher oil prices, and that of Sasol Gas increased by
141% primarily because of higher volumes. The chemicals
businesses achieved a 130% increase in operating profit despite
substantial asset impairments. (These impairments have arisen as
a consequence of investments made in previous years, when the
weaker rand negatively impacted capital costs, and which are
now earning income streams based on a much stronger rand.)
The excellent improvement in the performance of our chemical
businesses resulted from substantially improved margins and the
benefits of closing down or disposing of non-core or poor-
performing businesses.
The adverse impact of impairments was more or less offset by the
beneficial group-wide reduction in depreciation charges,
following the revision of the estimated remaining useful lives of
our assets, which we did in accordance with the revised
International Financial Reporting Standard.
In the closing decade of the previous century, international oil
prices averaged about US$20,00/b (dated Brent). In 2000 these
prices changed structurally and for the first five years of the new
millennium were about 35% higher, averaging about
US$27,00/b. These higher prices placed pressure on chemical
margins because of their impact on oil-derivative feedstock
costs. It was only (four years later) in 2004 that chemical prices
responded to these higher feedstock costs, seemingly as a
consequence of the further upward movement in oil prices
triggered by the Iraq War, surging demand for oil from China
and the weakening of the US dollar. Chemical margins improved
and the resulting benefits to chemical businesses worldwide
were self-evident.
International oil prices have further increased to levels above
US$60,00/b over the last year. These prices may not be
sustainable and some industry pundits are forecasting long-term
oil prices in the range US$30,00 to US$35,00/b. This represents a
further structural change which will enhance the anticipated
returns from our planned gas-to-liquids (GTL) projects, but may
again place pressure on chemical margins until market forces
take effect and cause them to adjust accordingly. Of course, for
Sasol the higher oil prices have been beneficial, although this
benefit has been more or less offset by the negative effects of a
stronger rand.
Paul du P Kruger, chairman.
Record-breaking financial performance

7
Gearing (net debt to shareholders' equity) was reduced from
41% to 38% despite the year's significant capital expenditure of
R13,2 billion and remains within our targeted range of 30% to
50%. Major capital projects advanced included the Oryx GTL
venture in Qatar, the Ayra Sasol Polymers venture in Iran and the
fuel-enhancement project in South Africa (Project Turbo), which
also enables polymer expansions.
A final dividend of R3,10 has been declared, which brings the
total dividend for the year to R5,40 which is 20% higher than
the previous year. The resulting dividend cover of 2,9 is suitably
within our preferred range of 2,5 to 3,5 times cover.
The leadership changeAfter a highly successful 34-year career at Sasol, Pieter Cox
retired as chief executive on 30 June 2005. During his eight-year
tenure at the helm, Sasol became a truly globalised group. He led
many exciting and beneficial initiatives, including: a substantial
expansion of our chemical operations; the commencement of
our GTL projects in Qatar and Nigeria, which will spearhead
the growth of Sasol in future years; the Mozambique Natural
Gas Project, which brought gas into the industrial heartland of
South Africa; and the listing of Sasol on the New York Stock
Exchange (NYSE).
Pieter's contributions were recognised in many ways, including
being elected the Sunday Times Businessman of the Year in 2002 and
receiving an honorary doctorate from the University of St Andrews in
Scotland. Pieter will succeed me as chairman of Sasol Limited on
1 January 2006. I thank him for his immense contribution to the
group and wish him much success in his new role.
On 1 July 2005, Pat Davies succeeded Pieter as chief executive.
Pat has been with Sasol for 30 years and has held various
positions in engineering design, project management,
operations management and corporate affairs. He has been
responsible for the group's oil and gas businesses and Sasol
Technology, and has served on the boards of most major
companies in the group. He is well equipped to lead the
group as it embarks on a further growth path that will be
dominated by the global deployment of our GTL technology,
a responsibility which has also fallen to Pat.
With effect from the same date, Trevor Munday was appointed
deputy chief executive. Trevor joined Sasol when Polifin Limited,
which he led successfully for five years, was acquired in 1999.
In 2001, he was appointed chief financial officer with
responsibility also for corporate affairs and, in 2003, he
assumed responsibility for our global chemical businesses.
In my view, Pat and Trevor have complementary skills
and experience and will form a highly effective team.
I am confident they will successfully lead Sasol in “reaching
new frontiers” in the years ahead.
“A final dividend of R3,10 has been declared, which brings the total dividend
for the year to R5,40 which is 20% higher than the previous year”

8
The transformation imperativeSasol has been criticised for its apparent tardiness in responding
to the transformation imperative and, more recently, particularly
with respect to the appointment of Pieter Cox to succeed me as
chairman, and those of Pat Davies and Trevor Munday. These
appointments were made by the Sasol Limited board following
a comprehensive selection process. The South African non-
executive members of the board at end June were 50%
represented by people from the so-called designated groups and
75% of these directors were black people. We intend to increase
this representation further in due course.
We are on public record acknowledging that we aspire to have more
black leaders in the senior executive positions of the group. Already,
we are pleased to have appointed Ms Nolitha Fakude, president of
the Black Management Forum (BMF), as an executive director
responsible for our worldwide human resources and strategy
functions. We welcome Nolitha to Sasol and are actively seeking
suitable black candidates for other key positions.
Sasol is a large, complex and growing global business with
governance and other obligations resulting from its listings on the
JSE Limited (JSE) and the NYSE. Recruiting senior financial
people, for example, in these circumstances is challenging when
only a fraction of the estimated 540 black (African) chartered
accountants in South Africa have more than three years of post-
qualifying experience, and when many of the remaining potential
candidates have moved on to other careers outside the finance
and accounting disciplines.
Nevertheless, we are persisting in our endeavours to recruit and
develop suitable black leaders and are confident that within the
foreseeable future the demographic profile of our senior
leadership structures will have become more representative of
South Africa. We understand our obligations in this regard – to us
they are morally, socially and business-driven and not just
prompted by statutes.
In the middle management ranks of Sasol, we are fortunate that
the substantial investment we have made over many years in our
bursary scheme is providing us with a steady source of high-
calibre candidates. In the past five years, 170 Sasol bursary-
holding black engineers have graduated from South African
universities and joined the group. Presently, we have nearly
500 bursary-holders of whom about 400 are undergraduate
students and, of these, some 60% are black students. Several
other initiatives, including our in-house advanced leadership
development programme (ALDP), which has been running for
several years and at any time has 20 to 25 black candidates
participating, will position us to meet the transformation
imperative from an employment equity perspective.
We are keenly awaiting the decision of the Competition Tribunal on
the proposed Uhambo Oil joint venture between our liquid fuels
business and Engen. The merged business is expected to be a
national champion in the South African fuel industry. It will provide
an exciting equity empowerment opportunity, across an entire
value-chain in this industry, ie from refinery to the fuel pump. We
expect it to be sustainable and credible. The model developed by
Sasol, together with our empowerment partners, will achieve
broad-based ownership from gender and geographic perspectives.
It is also financially facilitated by Sasol in an imaginative manner,
to the benefit of our prospective new partners, without prejudicing
the rights of our existing shareholders.
chairman’s statement

9
The competition law adjudication process will have taken a year if
the deliberations of our competition authorities are completed by
end-November 2005. They are working diligently within the
requirements of set statutes and we appreciate the importance of
them properly reviewing this proposed transaction and of giving
third-parties the opportunity to scrutinise and challenge it. This
length of time is, however, both frustrating for the potential
partners and demotivating for those people employed in the
entities planned for merger.
In turn, the resulting uncertainty adversely affects the efficiency
and focus of those involved, causing a potentially anti-
competitive situation in itself, especially if it is exploited by
competitors in the marketplace, or if their legal counsels are
allowed to frustrate and further protract the process. We
earnestly hope that the joint venture is cleared soon by the
Competition Tribunal.
We have also initiated equity empowerment transactions in Sasol
Mining and certain other parts of Sasol. We are, however, carefully
considering how we can advance the equity empowerment
imperative across our various other businesses. Of course, the
regulatory requirements in this respect are only now in the process
of being clarified through the progressive development and
gazetting of the South African Government's black economic
empowerment (BEE)-related codes of good practice. We look
forward to responding constructively to these codes.
From a competitive South Africa Incorporated position, this process
will have to be carefully managed by all businesses throughout the
country. The transformation imperative is clear and we must
progress within an overriding commitment to protecting or
enhancing the competitiveness of our businesses in South Africa,
in the interest of our economy and all our people.
It is an exciting, albeit a daunting task and encouragement
by the Government of businesses' endeavours through closer
engagement will be welcome. I am concerned about the divisive
tone of communiqués that are usually accorded much media
prominence. I would encourage a far more collaborative
association and dialogue being fostered between the Government
and the business community. Certainly, we at Sasol are aware of
our obligations in this regard and desire a constructive and
mutually beneficial relationship with the Government. After all,
we are important key joint-stakeholders in the success and
development of our country.
Our governance obligationsIt is a compliment to the governance standards set by the JSE
that at Sasol the step up to the stringent governance
requirements of the Securities and Exchanges Commission (SEC),
as a consequence of our listing on the NYSE, was not onerous.
During the year, we were privileged to have received governance
and disclosure awards, including the prestigious Ernst & Young
Award for excellence in corporate reporting and the JSE Award
for sustainability reporting.
As a major corporation, we continue to place prime emphasis on
sound governance throughout our worldwide operations and
have increased our disclosure to levels that have been
applauded by the investment, banking and other communities.
We shall continue to place priority on this critical aspect of
running our businesses.
“The transformation imperative is clear and we must progress within an
overall commitment to protecting or enhancing the competitiveness of our
businesses … in the interest of our economy and all our people”

10
In addition, I am pleased to report the extent to which we have
now embedded risk management practices throughout our
operations, and that risk assessments for all our businesses, major
functions and projects are regularly undertaken and presented to
the responsible governance committees for review.
The safety issueAfter several years of continuous improvement in safety
performance across all our businesses, we were shocked in 2004
by the spate of serious accidents we had at our plants and mines
that tragically resulted in fatalities and serious injuries to some of
our employees and contractors. It is conventional wisdom in the
petrochemical industry worldwide that a deteriorating safety
performance, measured according to internationally accepted
metrics, is a pointer to management problems and the likelihood
of a pending serious incident.
Our experiences in 2004 confounded this paradigm and showed us
that vigilance and management focus on safety matters must also
be increased, even in an environment of improvement. For example,
the tragic explosion at our Secunda ethylene plant on
1 September 2004 happened in an area which had for years been
successfully achieving improvements in safety performance,
confirming that complacency must be guarded against.
On behalf of the board and all the people of Sasol, I again
express my deep regret about these incidents. It is our dearest
wish that all people working at Sasol sites should be safe. The
intervention that took place following these incidents was
profound and I am confident that a stronger safety culture will
develop quickly as a result.
We have benefited from much intra-company introspection and
learning as a consequence of these safety incidents and the
interventions that followed to put our situation right. We accept
that every incident can be avoided and have committed ourselves
unreservedly to world-class safety performance. We appreciate
the collaborative spirit of our leading trade unions and have
welcomed the contribution they also are making to strengthen
Sasol's safety culture. The signing of our safety charter bears
testimony to the growing cooperation with our trade unions in
this key aspect of our operations.
Profit outlookDuring the year ahead, we shall be commissioning various large
projects and notably Project Turbo, our polymers project in Iran
and our first international GTL project in Qatar. The incremental
earnings benefits of these projects will start to flow in the
financial year beginning 1 July 2006.
For the year ahead, we are anticipating satisfactory headline
earnings growth, although uncertainty in oil and exchange rates
again makes forecasting difficult. Furthermore, this forward view
is dependent upon no major disruptions occuring in currency or
energy markets.
From a rand currency perspective, we are fortunate that the
South African fiscal environment and economy are stable
and we again express our admiration and appreciation to the
South African Government in this regard. The recent upgrading of
South Africa's international credit rating reflects the strength of
our economy and is testimony to its sound management.

11
The integrity of our balance sheet is high and our cash flow
planning is efficient and so we again expect to operate during the
year comfortably within our targeted gearing range of 30% to 50%.
The end of my tenure as chairman –acknowledgementsThis is my final statement as chairman of Sasol before stepping
down on 31 December 2005, after which I shall assume
responsibility as a non-executive director and hand over the
chairman's role to Pieter Cox. It has been a privilege to serve
Sasol as chairman for the past nine years. I have been fortunate
to have had sound counsel and support from my non-executive
directors whom I thank most sincerely. They have made my task
both manageable and gratifying. During my tenure, Pieter Cox
was chief executive until end-June 2005 and I also thank him for
the constructive relationship we had and the significant
contribution he made to Sasol.
During the year, one of our international non-executive directors,
Steven Pfeiffer, and a previous executive director, Jan Fourie,
retired. I thank them for their valuable contributions. I also
welcome Ms Imogen Mkhize, who joined the board as an
independent non-executive director on 1 January.
I thank the members of the group executive committee and all
the people of Sasol for the ongoing success of the group. It is
their individual and collective efforts that create our success and
I compliment them.
During the past year, we have again benefited from the support
of our various business partners, including our customers,
suppliers, contractors and bankers. I thank them all. I also thank
the South African and other governments and regulatory bodies
for the valuable engagements we have had with them.
In closing, I express my appreciation also to the public of South
Africa for their support of Sasol. Over the last year the group has
been under intense and often critical scrutiny.
The organisation is undergoing significant change and its
transformation will accelerate under the new executive
leadership. It is a successful and patriotic corporation that is
rapidly expanding globally and which proudly has its primary
domicile in South Africa. I look forward to it prospering under the
guidance of its new leadership.
Paul du P Kruger
Chairman

12
turning natural gas into low-emissions diesel
Why are GTL plants being developed?
Sasol is developing GTL plants because they:
• produce high-quality, high-performance, premium-grade, low-emissions energy
products in line with consumer demands and the requirements of future markets
and market regulators;
• enable gas-rich countries to monetise remote or underutilised gas reserves;
• are coinciding with a fast-emerging trend of dieselisation in many markets; and
• can help gas-rich countries to diversify their energy base.
Where might GTL plants be developed?
GTL plants can be developed in or near any gas-rich country, especially where the reserves are remote or underutilised – or in countries
where large amounts of associated gas are flared during oil production. Sasol and its GTL partners are developing GTL plants in Qatar
and Nigeria, and are exploring opportunities in Australia, Iran and other regions.
The world's energy paradigm will change in
2006 with the emergence of the international
era of commercial GTL production, which
enables gas-rich countries to convert remote or
underutilised natural gas into GTL diesel, GTL
naphtha and other higher-value products.
Australia Iran Nigeria Qatar
What is GTL technology?
GTL technology is the combination of three chemical
processing technologies to convert natural gas or a
similar gaseous hydrocarbon into liquid fuels and related
petrochemicals. The heart of GTL technology is the
conversion of synthesis gas into a waxy syncrude (a form
of synthetic crude oil) through Fischer-Tropsch synthesis.
In the case of the Sasol Slurry Phase Distillate™ (Sasol
SPD™) process, Sasol uses its proprietary Slurry Phase
Fischer-Tropsch technology to convert natural gas into
GTL diesel, GTL naphtha and some liquefied petroleum gas.

13
What have SSI and Sasol Chevronachieved to date?
The 34 000 barrels-per-day (b/d) Oryx
GTL joint venture at Ras Laffan in Qatar
between SSI and Qatar Petroleum (QP) will
be starting up in 2006. SSI is also working
with the National Petrochemical Company
of Iran for the possible development of a
GTL plant at Bandar Assaluyeh.
Sasol Chevron and QP plan to increase the
Oryx GTL plant capacity to 100 000 b/d,
and are at an early stage of discussion
regarding an integrated GTL plant at Ras
Laffan, with further capacity of about
130 000 b/d. Sasol Chevron is discussing
the potential development of a GTL plant
in Australia and is providing technical and
managerial support to the 34 000 b/d EGTL
plant at Escravos, Nigeria. This plant is
owned by the National Nigerian Petroleum
Corporation and Chevron Nigeria Limited
and is planned to start full commercial
production in 2009.
What is the potential for GTLtechnology?
Sasol Chevron and other GTL players have
the potential to produce 10% of the
world’s diesel requirements through GTL
plants by 2020. Sasol Chevron wants to
develop at least three foundation GTL
plants, through joint ventures, over the
next decade.
How does Sasol convert gas into GTL diesel in three steps?• by reforming natural gas in an autothermal reformer with oxygen and steam over a
catalyst to produce synthesis gas (syngas), a mixture comprising mostly carbon
monoxide and hydrogen;
• by converting syngas through Fischer-Tropsch synthesis into long-chain waxy
hydrocarbons in the low-temperature Sasol Slurry Phase reactor; and
• by selectively cracking the waxy hydrocarbons through Chevron Isocracking™
technology to produce the mildly isomerised middle-distillate products of GTL diesel,
kerosene and GTL naphtha.
What are the advantages of GTL products?
GTL diesel
GTL diesel is of a significantly higher quality than diesel derived from crude oil.It can be used in all modern diesel engine applications and is characterised by ahigh cetane number (>70), low sulphur (<5ppm), low aromatics (<1%), andgood cold flow characteristics (CFPP<-10C). The benefits of GTL diesel shouldposition it as a clean, premium product or blend-stock.
GTL diesel is compatible with existing fuel distribution infrastructures and withboth current and envisaged future exhaust gas after-treatment technologies.
GTL naphtha
The naphtha produced in the Fischer-Tropsch process is highly paraffinic with a very low sulphur, naphthenic and aromatics content. It is ideal as a feedstock for steam cracking to produce ethylene. Ethylene is one of the basic building blocks of the petrochemical industry and the precursor of widely used plasticpolyethylene and other derivatives.
What is Sasol's role in developing GTL plants?
To spearhead its international Fischer-Tropsch synfuel production ambitions, Sasol formed Sasol
Synfuels International (SSI) in 1997 and then a joint venture with Chevron of the USA, Sasol
Chevron, in 2000. SSI aims to be the company of choice in developing partnerships to enable the
successful commercial application of proven Sasol Fischer-Tropsch technology globally. The
primary expression of this vision is Sasol Chevron, which is dedicated to commercialising GTL
technology in projects that offer the highest rate of return for the investors.
14
chief executive’s report
Results and market trends
Returning to solid growth
In the wake of two tough financial years, in which the
appreciation of the rand led to reduced earnings, Sasol lifted its
overall performance on the strength of higher prices and margins
for oil, gas and chemicals. Ongoing efforts to reduce costs and
improve productivity, quality and customer service also
contributed to better performance.
On the downside, the continuing strength of the rand against the
US dollar impacted performance. The adverse impact of
impairments was more-or-less offset by reduced depreciation
charges following a review of the remaining useful lives of our
assets as required by accounting standards. Unscheduled
shutdowns at Sasolburg and Secunda lowered fuel and chemical
production and, in some cases, adversely impacted on supplies to
our customers. These incidents are regretted and the affected
Sasol businesses have since done everything possible to restore
required service levels.
Looking back at Sasol's performance of the last three years,
several factors have enabled the group to withstand dramatic
changes in prices, exchange rates and demand:
• our continuing focus on unlocking further value from our
integrated value chain;
• a commitment to develop our natural gas business;
• our investments to expand and improve our chemicals
portfolio; and
Robust strategy and improved conditions fuel growth
• our drive to reduce costs, improve productivity, develop new
markets and strengthen customer relations.
Achieving record earnings
Turnover increased by 15% from R60 151 million to R69 239 million,
and operating profit rose by 56% from R9 314 million to
R14 506 million. Earnings attributable to shareholders increased
by 61% from R5 940 million to R9 573 million. Wealth creation
rose by 18% from R23 373 million to R27 493 million.
Having increased by 12% in the previous year, the average price of
dated Brent crude oil rose by 48% from US$31,30 a barrel (b) to
US$46,17/b. Besides the strength of the world economy during the
year, the main geopolitical factors influencing the oil price were a
combination of a weaker US dollar, lower petroleum inventories,
strong Asian demand, uncertainty over Iraqi supplies, robust US
gasoline demand and concerns about political conflict in the
Middle East. International refining margins were notably higher.
Business optimisation
Reaffirming our safety commitment
During the year, we reported 17 work-related fatalities, 10 of
which resulted from an explosion at our Secunda ethylene plant
in September 2004. Once again, we extend our sincere
condolences to the families, friends and colleagues of those who
died as a result of these tragic workplace accidents. These
statistics are unacceptable and we have intensified our efforts to
achieve our goal of zero fatalities.
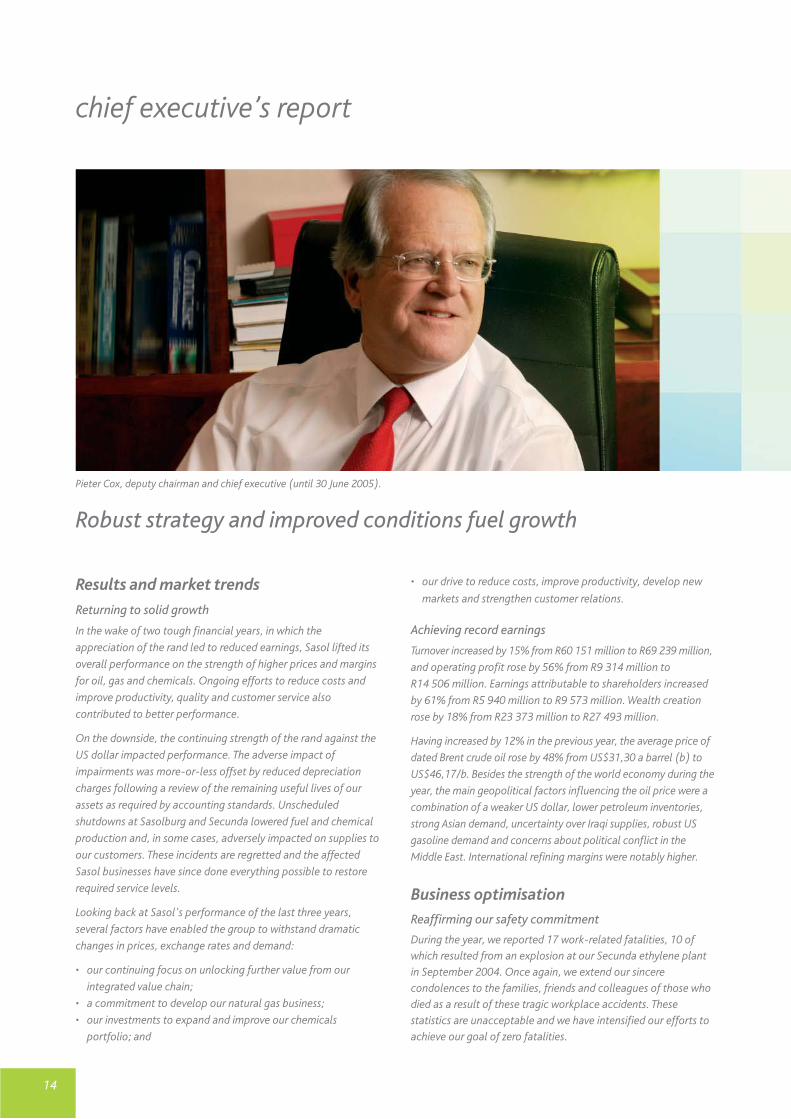
Pieter Cox, deputy chairman and chief executive (until 30 June 2005).

15
To bolster our safety culture and performance, we appointed
DuPont Safety Resources in November 2004 to independently
review our South African safety systems and practices. DuPont
was asked to recommend opportunities for improving our safety
programmes, including process safety, as well as employee and
contractor training and management. DuPont conducted its
safety review in the first quarter of 2005. In the interests of
transparency, DuPont's findings and recommendations have been
posted on our website.
Committing to a renewed safety drive
We are acting on the DuPont recommendations. This
commitment has been integrated into the Sasol safety
improvement plan, a change-management programme covering
safe behaviour, contractor safety, process safety and other key
safety matters. Through such sustained efforts, we aim to achieve
world-class safety standards throughout our South African
operations.
Sasol and three trade unions representing a high percentage of
our South African workforce – the Chemical, Energy, Paper,
Printing, Wood and Allied Workers' Union, the South African
Chemical Workers' Union and Solidarity – also signed the Sasol
safety charter in May 2005. This charter demonstrates our
common goal of making safety the first priority of everyone at
Sasol. In addition, we revised our values to better emphasise
safety as one of Sasol's six shared values.
As a result of these initiatives, Sasol's leaders and employees have
been demonstrating a stronger commitment to good safety
performance. We are optimistic, therefore, that we shall achieve
the results we all wish for Sasol.
Promoting black economic empowerment
Besides investing in social upliftment and development
programmes in communities around our operations, Sasol's
transformation initiatives centre on our growing black economic
empowerment (BEE) programme.
The intention is to introduce the required BEE ownership to our
liquid fuels business (LFB) and coal-mining business within the
next year. The final structure and timing of the Sasol LFB
transaction – which should result in the formation of Uhambo
Oil, a joint venture with Petronas – depends on final approval
from South Africa's Competition Tribunal.
Engen is a major South African oil company controlled by
Petroliam Nasional Berhad (Petronas) of Malaysia. The BEE
partners in the planned Uhambo joint venture are Worldwide
African Investment Holdings and Tshwarisano LFB Investment.
Their investment in Uhambo will be the single largest BEE
investment across the fuel industry value chain and will be broad-
based with significant gender and geographic representation. The
Competition Tribunal is scheduled to review the Uhambo
transaction in October 2005.
Sasol Mining is advancing plans with Eyesizwe Coal, which was
selected in May 2004 as our lead BEE partner for our South
African coal-mining activities. Sasol Mining and Eyesizwe plan to
announce details of their BEE deal in the year ahead.
Other BEE deals are being explored and it is likely that smaller
ones will be pursued through our renewed ChemCity initiative,
which focuses on creating new downstream businesses. This
initiative is at the forefront of our drive to develop small, medium
and micro enterprises in the South African chemical industry.
“The Sasol safety charter, signed in May 2005, demonstrates our common
goal of making safety the first priority of everyone at Sasol”
16
races and people with disabilities. We intend to increase this to
50% over the next few years.
Sustaining continuous improvement
The pursuit of continuous improvement remains a cornerstone ofSasol's culture. All businesses are retaining a disciplined approachtowards cost containment. Last year, we reported a largelysustainable reduction of almost R900 million in our annual costbase. This was maintained during the year under review.
Outside unscheduled shutdowns, several fuel and chemicalbusinesses increased their plant throughputs and per-capitaproductivity. Continuous improvement also covers ongoingprogrammes to:
• reduce our environmental footprint;• expand our knowledge base and promote the sharing of
best practices;• pioneer better technologies; and• increase our production and sale of higher-margin products.
Safeguarding a successful strategy
The group's strategic framework dating back to the late 1990sremains resilient and appropriate. Sasol's ability to withstandchanging currency and market cycles against the backdrop of globalmarkets that have become more competitive is further testimonythat we have the required vision, values, leadership and investmentsto stay focused on achieving growth and improvement.
Our growth drivers remain unchanged:
• commercialising and expanding our Fischer-Tropsch gas-to-liquids (GTL) and coal-to-liquids (CTL) technology;
• growing our chemical portfolio in selected areas; and• exploiting upstream hydrocarbon opportunities.
chief executive’s report
We are, however, also reconsidering our entire empowerment
strategy. Once the BEE Codes of Good Practice have been
classified and gazetted, businesses in South Africa will have a
clearer understanding of the South African Government's
empowerment expectations.
Through specific empowerment programmes under way in our
South African businesses, Sasol is well set to meet its
transformation challenges over the next decade. Notably, we
approach the broader issue of socioeconomic transformation
prudently, based on two prerequisites:
• we create partnerships with BEE players with whom we can
establish synergy based on shared values and commitments; and
• we seek sustainable BEE equity deals with the potential to
economically benefit a broad base of historically
disadvantaged South Africans.
Furthermore, our annual procurement spend with BEE suppliers in
South Africa rose by 65% from R1 495 million to R2 473 million.
We intend to increase this amount in the year ahead.
Seeking top-level black executives
We continue to advance employment equity in our South African
operations in line with the Employment Equity Act of 1998.
A major initiative is under way to develop black South Africans at
senior executive positions, an area in which we have been lacking.
Shortly after year end, we announced the appointment of Nolitha
Fakude as an executive director responsible for our global human
resource and strategy functions.
At year end, 39% of our South African managerial, professional
and supervisory posts were held by people from designated
groups: blacks (Africans, Coloureds and Indians), women of all

17
Business highlights
Mining, oil and gas
Adapting to a new paradigm
Sasol Mining has entered a new era following the conversion of
our Sasolburg chemical plant to natural gas feedstock, as well as
the introduction of natural gas to our Secunda plant as a
supplementary feedstock. As a result of these strategic
developments and a new coal supply agreement with Anglo Coal,
group coal production is being downscaled by more than 10%,
using 2004 as the baseline. For the foreseeable future, our
Secunda operations most likely will use natural gas, rather than
coal, to increase production.
Consequently, Sasol Mining faces new pressures in containing cost
per ton, having improved productivity, quality and financial
performance in the previous six financial years. This well-
performing business, however, is adapting to its new paradigm
having launched its Project 2010 initiative in 2003. Among other
objectives, Project 2010 is aimed at sustaining Sasol Mining's drive
to remain stable, innovative and profitable. We are confident this
business will remain an important contributor to earnings.
Retaining status despite lower production
Despite unscheduled shutdowns and the associated loss of
production, Sasol Synfuels remains a solid performer. Besides
contributing substantially to profit on the strength of higher
crude oil prices and greater efficiency, this business has been
working to increase operational stability and flexibility and
reduce costs.
In partnership with the Sasol Liquid Fuels Business (LFB) and Sasol
Technology, Sasol Synfuels is advancing Project Turbo to ensure
Sasol's compliance with South Africa's new liquid fuel
specifications after December 2005. Project Turbo will also
provide additional monomer feedstock to support Sasol
Polymers' growth plans.
Expanding our fuel retail network
The Sasol LFB posted a pleasing contribution to earnings. This
business maintained its retail service station rollout launched in
January 2004. By financial year end, it had established
345 Sasol- and Exel-branded service stations, 73 of which were
opened during the year. The business had another 25 retail sites
under development.
Whatever the outcome of the Competition Tribunal decision on
the planned Uhambo joint venture, we are confident Sasol LFB
has the foundations to build a successful liquid fuels business in
South Africa and sub-Saharan Africa.
Harnessing gas for new growth
Natural gas promises to play an important role in driving future
growth. We have completed our first full financial year as a
natural gas producer in Mozambique. Sasol Petroleum
International (SPI) maintained steady gas production in
Mozambique's Temane field and is set to become a reliable
and profitable gas producer.
While Sasol's proven gas reserves, according to the definitions
of the US Securities and Exchange Commission, have
remained unchanged, we can report significant increases in
our access to combined proven and probable reserves in
Mozambique. SPI entered into a new agreement with the
Government of Mozambique to commence exploration
of a large offshore block east of the Temane and Pande
fields in the year ahead.
The introduction of natural gas to customers in South Africa's
industrial heartland has benefited Sasol Gas. This business
increased its sales volumes by 71% largely on the strength of
introducing natural gas to established and new external
customers, as well as our Sasolburg and Secunda plants.
Compared with developed countries, South Africa is a small
consumer of natural gas as a percentage of its total energy
requirements. This presents Sasol Gas with opportunities to increase
sales of environmentally preferred natural gas.
This potential could be boosted if South African power producers
and consumers exploit the benefits of using gas for cost-competitive
and environmentally preferred co-generation, a technology for the
concurrent generation of steam and electricity in industry.
“Through specific empowerment programmes under way in our South African
businesses, Sasol is well set to meet its transformation challenges …”
18
Chemicals
Growing our polymers portfolio
Besides our world-scale South African and Asian polymer expansion
projects, we have eased the pace of our large-capacity chemical
expansion programme. While we shall continue to evaluate
chemical opportunities that meet our investment criteria, the group
is moving into an exciting era of expansion in GTL ventures, which
should also provide chemical expansion opportunities.
Sasol Polymers remains a strong performer and posted a record
earnings contribution on the strength of higher international
polymer prices, as well as cost reduction and improved
efficiencies. Once the two new Project Turbo-related polymer
plants are completed in the year ahead, this capacity – along
with the new capacity following two other plant expansions – will
increase our global polymer capacity by about 80% to about
1,5 million tons. This augurs well for Sasol Polymers' plans to
significantly increase future profit streams.
Through Sasol Polymers Germany, we are developing the Arya
Sasol joint-venture polymer facilities at Bandar Assaluyeh, Iran, in
partnership with that country's National Petrochemical
Company. As a 50% partner in Arya Sasol, these new investments
will provide us with an additional 500 000 tons per annum (tpa)
of ethylene and 300 000 tpa of polyethylene. Most of this
polyethylene will be targeted for sales to customers in China,
South-East Asia and Africa.
Planning to sell surfactants operations
On 1 August 2005, we announced our intention to dispose of much
of the assets we acquired in 2001 from RWE-DEA, subject to fair
value being secured. While we shall retain the German-based assets
of Sasol Solvents, as well as our South African comonomer
activities, we plan to sell the international surfactants and inorganic
speciality businesses of Sasol Olefins & Surfactants.
It has been a pleasure and a privilege for us to develop
relationships with the excellent people in these businesses over
the last four years. We are grateful for the contributions they have
made to strengthening this business and to ensuring that it is
poised for success and growth.
chief executive’s report
Gearing for the GTL era
An exciting development in our oil and gas portfolio is our
ambition to be a key player in the world's emerging GTL industry.
Through Sasol Synfuels International (SSI) and our joint venture
with Chevron, Sasol Chevron, we are pioneering the international
GTL industry at Ras Laffan, Qatar, with the construction of the
first-phase (34 000 b/d) Oryx GTL plant in partnership with
Qatar Petroleum (QP).
SSI and QP expect the Oryx GTL plant to start producing
GTL diesel and GTL naphtha for the international market
during 2006. Sasol Chevron and QP plan to increase the installed
GTL capacity at Ras Laffan in the future by about 195 000 b/d
by expanding the Oryx GTL plant and building an integrated
GTL plant.
In April 2005, Chevron Nigeria Limited (CNL) and the National
Nigerian Petroleum Corporation (NNPC) awarded the
US$1,7 billion engineering, procurement and construction
contract to the multinational Team JKS consortium for a GTL
plant at Escravos, Nigeria. While this plant will be owned and
operated by NNPC and CNL, Sasol will provide technology and
operating expertise, as well as 50% of the risk-based project
finance required by CNL for this venture. Plant start-up currently
is targeted for 2009. This GTL plant will use the Sasol Slurry Phase
Distillate™ (Sasol SPD™) process to produce GTL diesel, GTL
naphtha and some liquefied petroleum gas.
Based on the Sasol SPD™ process, there is potential for Sasol and
its partners to install a global GTL capacity of about 450 000 b/d
by 2014. To this end, we are holding discussions with Australia,
Iran and other gas-rich countries.
Pursuing CTL studies for China
The growth of emerging economies, along with continuing
concerns about high crude oil prices and security of energy
supplies, has revived interest in CTL conversion technology,
particularly Sasol's coal-based Fischer-Tropsch technology.
Sasol and a Chinese consortium are undertaking a pre-feasibility
study for the potential development of two CTL plants in China
early in the next decade.

19
The surfactants business, however, is not integrated to the extent
Sasol requires and, from a portfolio management perspective,
the proceeds arising from their sale will be better utilised to
reduce our gearing, or to advance our GTL ambitions, which
leverage Sasol's proprietary technology and are core to our
future growth objectives.
Sasol Solvents released sparkling results for the year, while both
Sasol Nitro and Sasol Wax have posted solid results.
Technology
Maintaining focused innovation
We continue to invest substantially in programmes to advance those
core petrochemical processes that form the bastion of our
competitive advantage. We are advancing the next generation of our
GTL technology and are seeking opportunities to leverage chemicals
expansion in the process. Our project management resources are
being bolstered in anticipation of future projects, particularly those
related to offshore GTL and potential CTL ventures.
Sustainable development
Sustainability framework
Building our commitment
Sasol remains in the top quartile of the international Dow-Jones
Sustainability Index for our industrial category. It also is pleasing
that our efforts to improve our sustainability reporting and
increase transparency on our economic, social and environmental
challenges were again acknowledged when, in June 2005, we
jointly won the best sustainability report award of the Association
of Chartered Certified Accountants.
In 2004, we were one of the first companies to be listed on the
socially responsible investment index (JSE SRI) of the JSE Limited
(JSE). This year, we were ranked in the five top performers of the
22 high-impact companies listed on the JSE. In addition, we
continue to advance a worldwide Responsible Care programme
for our fuel and chemical interests, and uphold our commitment
to the tenets of the Global Compact as a signatory to this United
Nations initiative.
Economic development
Unlocking wealth in Africa and the Middle East
Sasol is a major contributor to economic development in
South Africa and, increasingly, also in other African countries
and the Middle East.
In South Africa, our operations sustain about 170 000 jobs,
directly and indirectly, which accounts for about 2% of the formal
employment sector. We contribute about R40 billion (4%) to
national gross domestic product (GDP) and save the country
more than R30 billion in foreign exchange. Sasol also remains the
country's single largest industrial investor, with our R24 billion
invested over the last four years equating to almost 90% of South
Africa's total foreign direct investment over the same period.
Economists estimate that our US$1,2 billion investment to
develop the Temane and Pande gas fields and to pipe natural gas
to South Africa has enabled Mozambique to increase its GDP by
about 20%.
This contribution to Mozambique's economic development is
vital at a time when African leaders are engaged in new initiatives
to reduce poverty and promote further socioeconomic
development. During the year, in addition to providing a portion
of the royalty obligation by way of gas in kind, Sasol also paid
R19 million (US$3 million) to the Government of Mozambique in
the form of taxes and royalties. Our operations in Mozambique,
directly, have created about 280 permanent jobs.
Elsewhere in Africa, the licensing of our proprietary Sasol SPD™
process to CNL and NNPC for the Escravos GTL plant will begin to
contribute to the Nigerian economy after the plant's start-up in
2009. Our joint-venture investments in the Oryx GTL and Arya
Sasol Polymer projects will contribute to economic development
in the Middle East Gulf region.
Human capital
Nurturing talent for growth
Our substantial investment in employee training and development
entails striving to be an employer of choice that offers safe,
stimulating and rewarding workplaces and career opportunities.
“An exciting development in our oil and gas
portfolio is our ambition to be a key player
in the world’s emerging GTL industry”

20
We invested R172 million in employee training and development,
most of which was spent in South Africa, Germany, Italy and
the USA. We also are transferring and developing skills in
neighbouring Mozambique. We intend to replicate this
commitment whenever we invest in other economies, such
as Qatar and Nigeria. Our successful bursary programme
continues to gain momentum and, in line with South Africa's
social transformation, we are allocating more than 62% of
our undergraduate bursaries to students from historically
disadvantaged groups.
Waging war on Aids
The Sasol HIV/Aids Response Programme (SHARP) has been
introduced to all our businesses in South Africa, as well
as neighbouring Mozambique. SHARP is an integrated
approach focused on sustaining positive measures to reduce
the rate of HIV/Aids infection throughout our company, and
on extending the quality of life of infected employees by
providing managed healthcare solutions. In addition, SHARP is
benefiting communities surrounding our Southern African
operations, particularly in the Sasolburg, Secunda and
central Mozambique regions.
Social investment
Furthering social upliftment
Sasol is one of South Africa's largest corporate investors
in social upliftment and development. Most of this investment
is channelled into education and training, capacity building
and job creation, health and welfare, environmental education
and conservation, and arts and culture.
In South Africa, alone, we invested almost R47 million during
the year in social investment, which was complemented
by a further investment of R2,5 million in Mozambique.
We also contribute to community programmes in Europe,
the USA and Asia through our international operations.
In addition, Sasol contributed funds to the relief programmes
that followed the South-East Asian tsunami disaster of
December 2004.
chief executive’s report
21
Foreign shareholdingAttracting new foreign investors
Foreign investors continue to invest in Sasol. By year end,
foreign shareholding had risen to 33% of total ordinary
shares issued.
Since listing on the New York Stock Exchange (NYSE) in
April 2003, the price of a Sasol American depositary receipt
(ADR) continues to appreciate. On the day of our NYSE listing,
a Sasol ADR closed at US$10,73. In July and August 2005, a Sasol
ADR was trading in the region of US$34,00, a threefold increase.
ProspectsSustaining growth through new capacity
Forecasting exchange rates, oil and petrochemical prices
and energy costs remains difficult. We are, however,
expecting satisfactory growth in headline earnings in the
year ahead.
Our plans to increase production capacity in the year ahead as
the Oryx GTL, Arya Sasol Polymer and Project Turbo plants begin
to build up production and sales are well known. The income
streams from these investments will benefit the financial year
beginning on 1 July 2006.
AcknowledgementsLooking back with appreciation
This is my final chief executive's report and I wish to express
a special appreciation this year. Not only do I thank our
employees worldwide for their continued hard work and
contribution to Sasol's good results, but I also thank them for
contributing to many group successes during my stimulating
and enjoyable tenure as chief executive.
I also thank our many valued customers, suppliers and
business associates worldwide for their continuing goodwill
and support. We look forward to working with you in the
year ahead.
Welcoming Sasol’s new leaders
On 1 July 2005, I handed the reins to the group's new chief
executive, Pat Davies, to lead Sasol in an exciting new phase of
growth and innovation. To strengthen our leadership, the board
of directors also appointed Trevor Munday to the newly created
post of deputy chief executive. Both Pat and Trevor bring much
experience and insight to our executive team. I thank them for
their significant contributions, support and the constructive
relationship we enjoyed over many years.
Sasol is in capable hands. I believe our talented leaders and
employees around the world will continue to safeguard our
values, work for growth and improvement, and uphold the
principles of good corporate citizenship.
Acknowledgements
I thank Paul Kruger for his support as chairman over the past nine
years. I have appreciated the guidance and sound advice from
him and our non-executive board members during my tenure as
chief executive. I thank them all.
Pieter CoxChief executive (until 30 June 2005)
“Sasol’s contribution to Mozambique’s economic development is vital at a
time when African leaders are engaged in new initiatives to reduce poverty …”

Fischer-Tropsch process
Natural gas
Syngas
Coal, crude oil and natural gas sold to open market
Coal
Syngas productionExploration and production
Fisc
her-Tropsch process
Coal, crude oil and natural gas
Explorationand production
Natural gas Gas reforming
Coal Gasification
Syngas production
22
Exploiting the benefits of Fischer-Tropsch technology
Exploration and production
Sasol obtains its raw materials (coal, gas and crude oil) through its
coal-mining activities and oil and gas exploration and production
activities, which are supplemented by purchases from the open
market. Some raw materials are sold directly to external markets.
Syngas production
Using steam and oxygen at high temperatures, coal is gasified and
natural gas reformed to produce synthesis gas (syngas, a mixture
of carbon monoxide and hydrogen).
Fischer-Tropsch conversion
Using a catalyst, the Fischer-
Tropsch (FT) reaction converts
syngas into a range of
hydrocarbons – co-products, fuel
and chemical components.
Low- and high-temperature
operating modes provide different
product splits.
sasol’s integrated business model
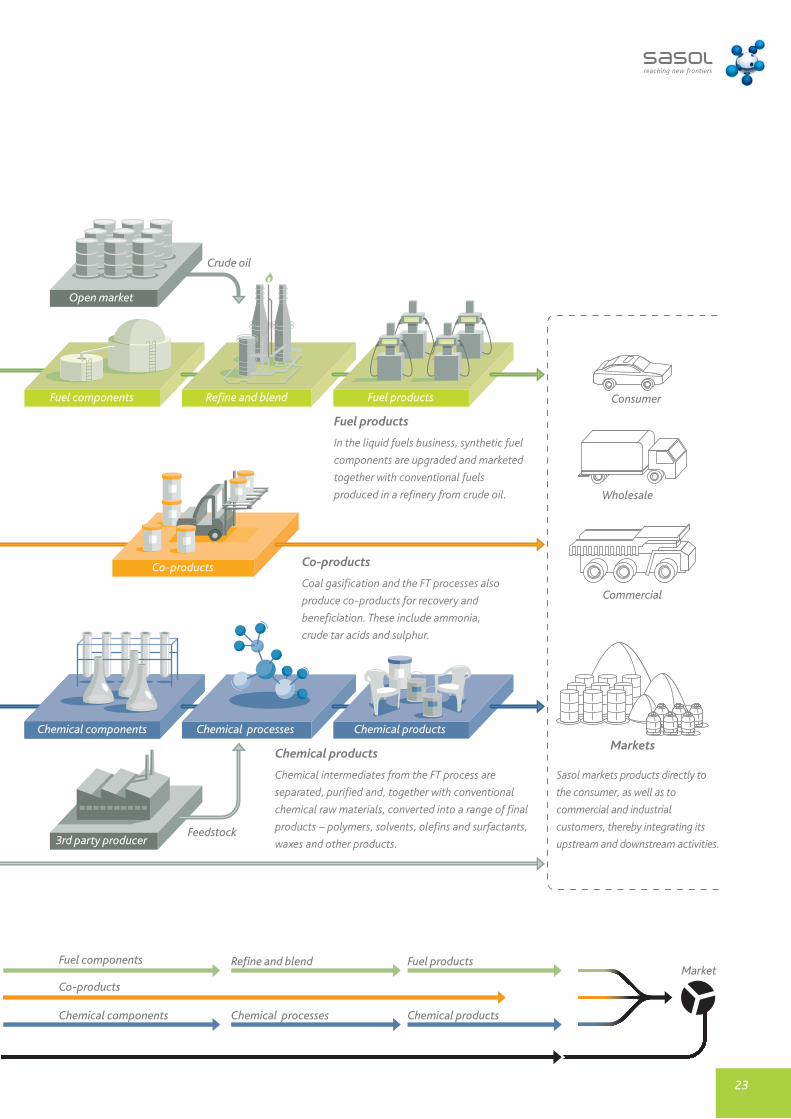
Crude oil
Feedstock
Co-products
Chemical components
Refine and blend
Chemical products
Fuel productsFuel components
Chemical processes
Consumer
Wholesale
Commercial
Open market
3rd party producer
Markets
Market
Chemical components
Refine and blend
Chemical products
Fuel productsFuel components
Co-products
Chemical processes
23
Fuel products
In the liquid fuels business, synthetic fuel
components are upgraded and marketed
together with conventional fuels
produced in a refinery from crude oil.
Co-products
Coal gasification and the FT processes also
produce co-products for recovery and
beneficiation. These include ammonia,
crude tar acids and sulphur.
Chemical products
Chemical intermediates from the FT process are
separated, purified and, together with conventional
chemical raw materials, converted into a range of final
products – polymers, solvents, olefins and surfactants,
waxes and other products.
Sasol markets products directly to
the consumer, as well as to
commercial and industrial
customers, thereby integrating its
upstream and downstream activities.
24
operational review oil and gas businesses
• Healthy profit contribution of R1 247 million despite lower sales.
• Mining has entered a new paradigm following the introduction of natural gas and reduced group coal demand.
• Exports continue to perform well and benefited from higher global prices.
• Work is progressing towards our empowerment deal with Eyesizwe Coal.
• New Sasolburg mine is set to go into production in November 2005.
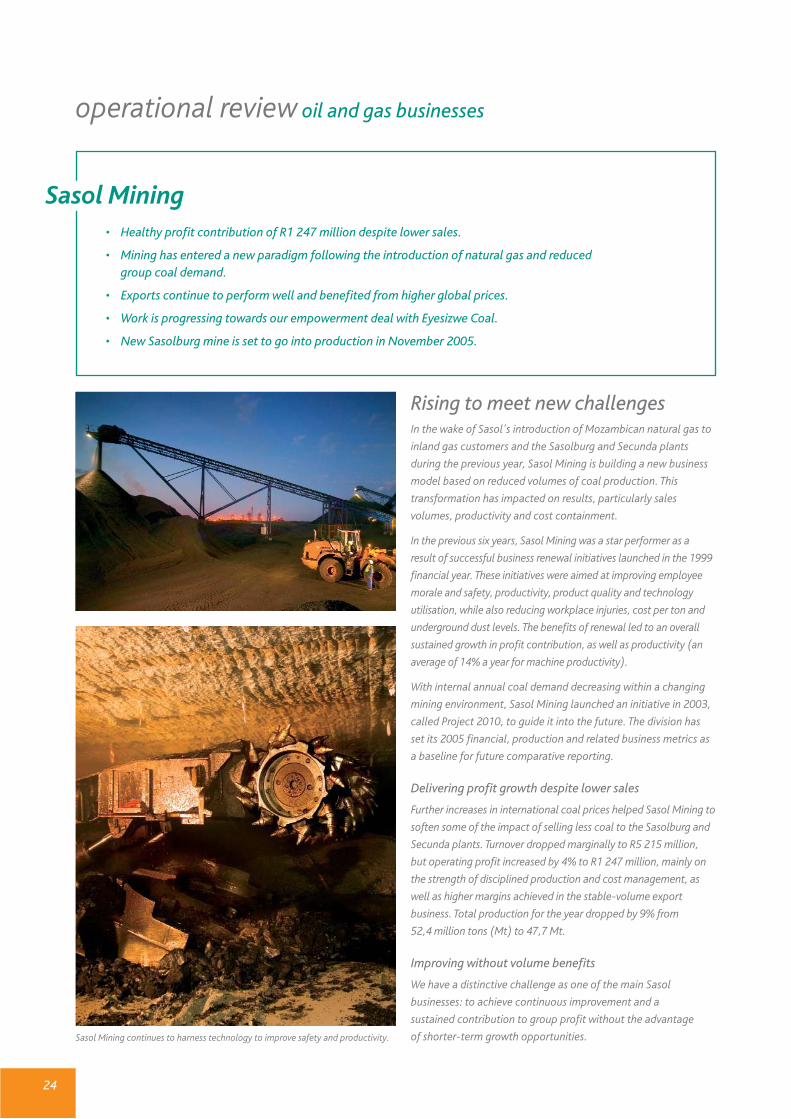
Sasol Mining continues to harness technology to improve safety and productivity.
Sasol Mining
Rising to meet new challengesIn the wake of Sasol's introduction of Mozambican natural gas to
inland gas customers and the Sasolburg and Secunda plants
during the previous year, Sasol Mining is building a new business
model based on reduced volumes of coal production. This
transformation has impacted on results, particularly sales
volumes, productivity and cost containment.
In the previous six years, Sasol Mining was a star performer as a
result of successful business renewal initiatives launched in the 1999
financial year. These initiatives were aimed at improving employee
morale and safety, productivity, product quality and technology
utilisation, while also reducing workplace injuries, cost per ton and
underground dust levels. The benefits of renewal led to an overall
sustained growth in profit contribution, as well as productivity (an
average of 14% a year for machine productivity).
With internal annual coal demand decreasing within a changing
mining environment, Sasol Mining launched an initiative in 2003,
called Project 2010, to guide it into the future. The division has
set its 2005 financial, production and related business metrics as
a baseline for future comparative reporting.
Delivering profit growth despite lower sales
Further increases in international coal prices helped Sasol Mining to
soften some of the impact of selling less coal to the Sasolburg and
Secunda plants. Turnover dropped marginally to R5 215 million,
but operating profit increased by 4% to R1 247 million, mainly on
the strength of disciplined production and cost management, as
well as higher margins achieved in the stable-volume export
business. Total production for the year dropped by 9% from
52,4 million tons (Mt) to 47,7 Mt.
Improving without volume benefits
We have a distinctive challenge as one of the main Sasol
businesses: to achieve continuous improvement and a
sustained contribution to group profit without the advantage
of shorter-term growth opportunities.

25
Following the introduction of natural gas during 2004, coal-
mining at Sasolburg has been downscaled from an annual rate
of about 6 Mt to around 2 Mt. In addition, with Sasol Synfuels
using natural gas as a supplementary feedstock, the Secunda
operations can be expected to use natural gas, rather than coal,
to expand future production.
We produced 52,4 Mt of coal at Sasolburg and Secunda in the
previous year and, by the end of the 2006 financial year, annual
production will have dropped to around 45 Mt. Our shorter-term
financial growth, therefore, will stem mainly from productivity
improvements and cost reductions.
Moving Project 2010 forward
For these and related optimisation reasons, we implemented
our Project 2010 business enhancement strategy and
revised operating framework two years ago. This initiative is
founded on:
• improving safety, health and environmental performance;
• supporting South Africa's socioeconomic transformation to
ensure Mining Charter compliance;
• winning with people;
• pursuing continuous improvement;
• strengthening product and market optimisation and logistics;
and
• optimising reserve utilisation.
Consolidating our Secunda operations
To support Project 2010, we have been consolidating our
Secunda operations. The lower Secunda production volumes have
presented an additional challenge at a time when we have been
working successfully to reduce unit cost. Since commencing
business renewal and optimisation in the 1999 financial year, unit
cost has reduced by 7% in real terms.
Sasol Mining operational highlights
2005 2004 % change
Total sales Mt 46,5 51,1 (9)
Total production Mt 47,7 52,4 (9)
Sales per employee t 6 535 6 687 (2)
Sasol Mining financial highlights
2005 2004 % change
Turnover Rm 5 215 5 244 (1)
Operating profit Rm 1 247 1 194 4
Capital items Rm 23 17
Operating margin % 24 23
Contribution to:
group operating profit % 9 13
attributable earnings Rm 801 837 (4)
Cash flow from operations Rm 1 689 1 714 (1)
Our Syferfontein strip-mining operations reached the end
of their economic life, and our underground complex adjacent
to the Secunda factories was consolidated further. In addition,
the Kriel South Project – aimed at optimising effectiveness at
Secunda – remains on schedule and budget, and the first coal
from Anglo Coal was delivered on 1 July 2005. As a result of
this project, entailing a swap of reserves for supplies between
the two mining companies, Anglo Coal will supply Sasol Mining
with 3,7 Mt of coal during the 2006 financial year and thereafter
at a rate of 5 Mt a year, and we shall further reduce our Secunda
production volumes.
We have defined our customer profiles and markets
more clearly. At Secunda, we are focused on three main
customers: Sasol Synfuels; exports through Richards Bay
Coal Terminal to power generators and Eskom, South Africa’s
state-owned power company. The established underground
operations of Bosjesspruit, Brandspruit, Middelbult and
Syferfontein serve Sasol Synfuels. The Twistdraai operations
have been consolidated to serve the export business, while
also producing middlings for Sasol Synfuels. The plan is to
ensure that Twistdraai no longer supplies run-of-mine coal
to Sasol Synfuels.
The Sigma-Wonderwater strip-mining operation near
Sasolburg is being closed and rehabilitated. In its place,
we are developing the Sigma-Mooikraal mine to supply the
2 Mt of utility coal required for the Sasolburg power and
steam plants. Situated near Sasolburg, Sigma-Mooikraal is
scheduled to commence supply in November 2005.
In the year ahead, we shall continue to work with Eyesizwe Coal,
our lead empowerment partner, towards introducing BEE
ownership to our mining operations. We intend to conclude the
terms of an empowerment deal in the year ahead.

26
operational review oil and gas businesses
Sasol Synfuels• Renewed commitment to improve safety performance.
• Strong contribution of R5 310 million to earnings despite lower production.
• Cost-optimisation drive unleashes new benefits.
• Complex Project Turbo enters final construction phase.
• Ongoing investments to reduce environmental footprint.
Pleasing results despite lower production
Prevailing high oil prices and other macroeconomic influences
were favourable for Sasol Synfuels, along with our focus on
safety, optimising cost and improving production planning.
These benefits, however, were offset partially by lower
production following a few non-scheduled shutdowns, the most
severe of which occurred in January 2005 after unusually high
rainfall, the highest recorded in Sasol Synfuels' history. Flooding
on the eastern site kept plants offline for up to 14 days because
several electrical motors were damaged.
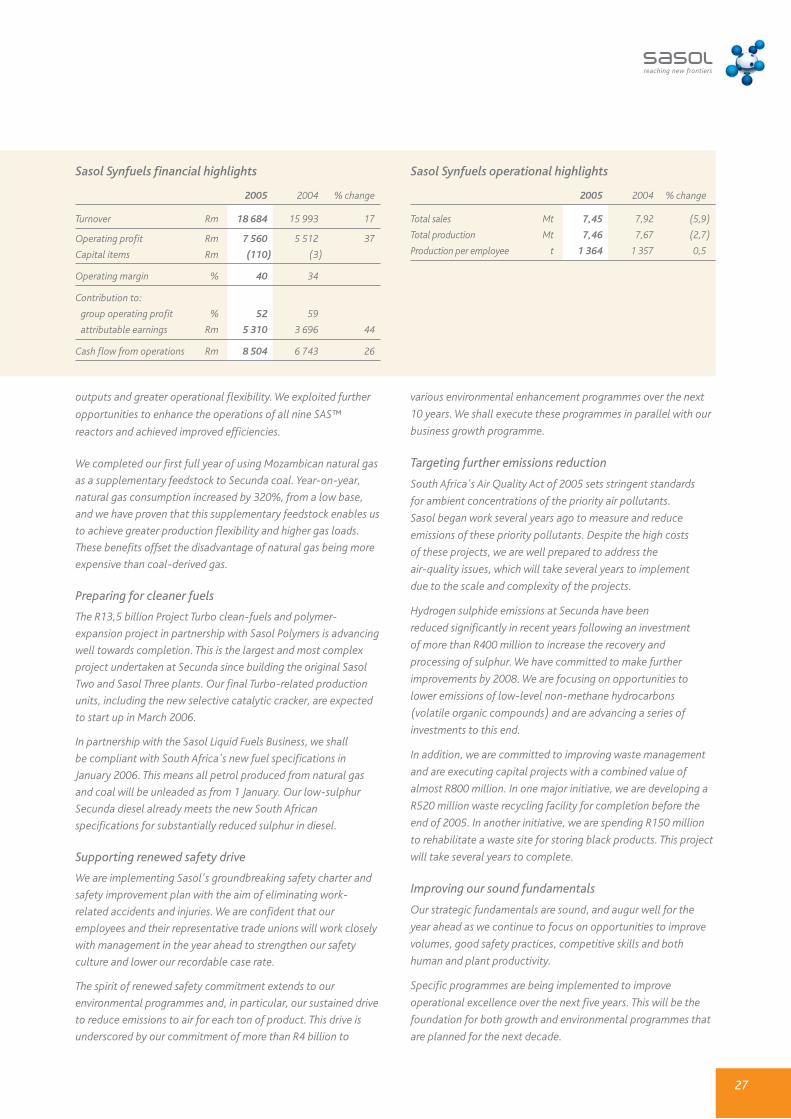
Despite the 2,7% drop in production from a record 7,67 Mt to
7,46 Mt, Sasol Synfuels remained the leading contributor to
group earnings.
Sustaining our growth
Turnover increased by 17% from R15 993 million to R18 684 million,
and operating profit rose by 37% from R5 512 million to
R7 560 million.
Our rand/ton cost, however, increased by 9,4% mainly because
unscheduled shutdowns reduced volumes. We continue to work
hard to reduce unit cost through our five-year operational
excellence strategy.
Our continuing focus on reducing our staff complement
through natural attrition enabled us to increase productivity by
almost 0,5% from 1 357 t to 1 364 t per capita despite lower
total production.
Further improvements to Fischer-Tropsch technology
We continue to exploit new opportunities to streamline
production and enhance economy of scale. In the previous
financial year, we identified an opportunity with Sasol Technology
to operate some of the Sasol Advanced Synthol™ (SAS™)
reactors in a more efficient configuration, and this yielded higherSasol Synfuels is close to completing Project Turbo at Secunda in South Africa.
27
outputs and greater operational flexibility. We exploited further
opportunities to enhance the operations of all nine SAS™
reactors and achieved improved efficiencies.
We completed our first full year of using Mozambican natural gas
as a supplementary feedstock to Secunda coal. Year-on-year,
natural gas consumption increased by 320%, from a low base,
and we have proven that this supplementary feedstock enables us
to achieve greater production flexibility and higher gas loads.
These benefits offset the disadvantage of natural gas being more
expensive than coal-derived gas.
Preparing for cleaner fuels
The R13,5 billion Project Turbo clean-fuels and polymer-
expansion project in partnership with Sasol Polymers is advancing
well towards completion. This is the largest and most complex
project undertaken at Secunda since building the original Sasol
Two and Sasol Three plants. Our final Turbo-related production
units, including the new selective catalytic cracker, are expected
to start up in March 2006.
In partnership with the Sasol Liquid Fuels Business, we shall
be compliant with South Africa's new fuel specifications in
January 2006. This means all petrol produced from natural gas
and coal will be unleaded as from 1 January. Our low-sulphur
Secunda diesel already meets the new South African
specifications for substantially reduced sulphur in diesel.
Supporting renewed safety drive
We are implementing Sasol's groundbreaking safety charter and
safety improvement plan with the aim of eliminating work-
related accidents and injuries. We are confident that our
employees and their representative trade unions will work closely
with management in the year ahead to strengthen our safety
culture and lower our recordable case rate.
The spirit of renewed safety commitment extends to our
environmental programmes and, in particular, our sustained drive
to reduce emissions to air for each ton of product. This drive is
underscored by our commitment of more than R4 billion to
Sasol Synfuels operational highlights
2005 2004 % change
Total sales Mt 7,45 7,92 (5,9)
Total production Mt 7,46 7,67 (2,7)
Production per employee t 1 364 1 357 0,5
Sasol Synfuels financial highlights
2005 2004 % change
Turnover Rm 18 684 15 993 17
Operating profit Rm 7 560 5 512 37
Capital items Rm (110) (3)
Operating margin % 40 34
Contribution to:
group operating profit % 52 59
attributable earnings Rm 5 310 3 696 44
Cash flow from operations Rm 8 504 6 743 26
various environmental enhancement programmes over the next
10 years. We shall execute these programmes in parallel with our
business growth programme.
Targeting further emissions reduction
South Africa's Air Quality Act of 2005 sets stringent standards
for ambient concentrations of the priority air pollutants.
Sasol began work several years ago to measure and reduce
emissions of these priority pollutants. Despite the high costs
of these projects, we are well prepared to address the
air-quality issues, which will take several years to implement
due to the scale and complexity of the projects.
Hydrogen sulphide emissions at Secunda have been
reduced significantly in recent years following an investment
of more than R400 million to increase the recovery and
processing of sulphur. We have committed to make further
improvements by 2008. We are focusing on opportunities to
lower emissions of low-level non-methane hydrocarbons
(volatile organic compounds) and are advancing a series of
investments to this end.
In addition, we are committed to improving waste management
and are executing capital projects with a combined value of
almost R800 million. In one major initiative, we are developing a
R520 million waste recycling facility for completion before the
end of 2005. In another initiative, we are spending R150 million
to rehabilitate a waste site for storing black products. This project
will take several years to complete.
Improving our sound fundamentals
Our strategic fundamentals are sound, and augur well for the
year ahead as we continue to focus on opportunities to improve
volumes, good safety practices, competitive skills and both
human and plant productivity.
Specific programmes are being implemented to improve
operational excellence over the next five years. This will be the
foundation for both growth and environmental programmes that
are planned for the next decade.

28
operational review oil and gas businesses
Maintaining growth and innovation
The Sasol Liquid Fuels Business (LFB) performed well and posted
a strong profit on the strength of higher refining margins. The
financial impact of lower-than-planned production was offset by
the sustained efforts to contain costs, improve efficiency and
build brand awareness.
Other operational highlights include:
• the establishment of mutually beneficial individual supply
agreements with each of the other major oil companies
operating in South Africa; and
• our drive to expand market share in the South African liquid
fuel wholesale and retail markets through marketing and
promotional initiatives, including Sasol's expanded corporate
sport sponsorship programme.
The combination of higher prices and sales enabled Sasol
LFB to increase turnover by 26% from R18 851 million to
R23 712 million, while operating profit rose 33% from
R1 429 million to R1 900 million largely on the strength of
better refining margins. The South African liquid fuels market
grew by about 3% during the year.
We also are marketing and selling on behalf of Sasol Petroleum
International the condensate recovered by the Temane natural
gas central processing facility in Mozambique.
Expanding retail network and market share
Consumers have been responding favourably to our retail
network expansion programme. During the year, 73 new
Sasol- and Exel-branded retail service stations were opened
and another 25 were under development at year end. To date,
Sasol LFB has established 345 Sasol- and Exel-branded retail
service stations around South Africa. These facilities contributed
appreciably to our increased market share, which rose to 7%
for the combined South African petrol and diesel market.
• Operating profit up 33% on strength of higher refining margins, cost discipline and retail expansion, with 146 Sasol convenience centres and 199 Exel service stations operating at year end.
• R600 million Natref clean-fuels project is nearing completion.
• Planned Uhambo Oil joint venture with Engen awaits Competition Tribunal approval.
• Improved range of turbo™ fuels launched.
• Supply agreements signed with other oil companies operating in South Africa.
Sasol Liquid Fuels Business
Sasol’s convenience centre rollout established critical mass during the year.

29
Significantly, 35% of the Sasol- and Exel-branded service stations
are operated by historically disadvantaged South Africans. It is
our intention to franchise at least 50% of all future service
stations to historically disadvantaged people in line with a wider
national programme to economically empower a far greater
percentage of South Africans.
Creating a world-class retail experience
The distinctive Sasol delight!™ convenience stores with bakeries
at our Sasol convenience centres (SCCs) have been exceptionally
well received by consumers around South Africa. Based on market
research findings, our Sasol delight!™ facilities are meeting and
exceeding their retail performance criteria.
We commenced our SCC rollout programme in January 2004
determined to create a new retail service station experience in
South Africa and to emulate world-best practices. We believe we
have met our initial SCC design and performance targets.
The SCC franchisees, in general, have been performing well and
their combined turnover has been higher than expected. Our
retail rollout strategy is not driven by growth purely for growth's
sake, which can be disruptive to our industry. Since launching our
SCC rollout programme, we have focused successfully on areas
where there is a real market need for these facilities within the
ambit of responsible development and competition.
In April 2005, we held the ceremonial opening at Sasolburg of our
first integrated truck service centre, which we regard as a first of
its kind in South Africa. This centre offers refuelling, internal and
external tanker washing and ablution facilities, along with a
restaurant, convenience store and secure parking to benefit
transport companies operating in the region.
Besides our well-established programme of sponsoring motor
sport in South Africa, including the annual Sasol Rally in the
province of Mpumalanga, Sasol is sponsoring national rugby
Sasol Liquid Fuels Business financial highlights
2005 2004 % change
Turnover Rm 23 712 18 851 26
Operating profit Rm 1 900 1 429 33
Capital items Rm (63) –
Operating margin % 8 8
Contribution to:
group operating profit % 13 15
attributable earnings Rm 1 201 943 27
Cash flow from operations Rm 2 405 1 932 24
(including the Springboks), the national under-23 soccer team,
Amaglug-glug™, and the South African Olympics team. The 2005
Sasol Rally had 71 participating teams and drew more than
30 000 live spectators.
We also sponsor the Exel cycling team, which has a strong focus
on developing top-class cyclists from historically disadvantaged
groups. The motor sport sponsorship specifically focuses on
developing people from disadvantaged groups as well.
Sustaining product innovation
The launch of improved formulations of Sasol turbodiesel™
and Sasol turbo™ unleaded petrol contributed to our pleasing
growth in the retail market. Consumers have responded
enthusiastically to these new products, particularly Sasol
turbodiesel™, which is considered to be the cleanest diesel
currently being sold at South African forecourts. This diesel
already exceeds the new South African fuel specifications to be
introduced in January 2006.
For several years, we have been supplying a semi-synthetic jet
fuel to international airlines operating to and from Johannesburg
International Airport. We are working with international airlines
and aviation officials, as well as jet-engine manufacturers, to
obtain approval to supply a fully synthetic jet fuel, which would
be manufactured at Secunda from a combination of coal and
natural gas feedstock.
Waiting for approval of joint venture
The planned Uhambo Oil Limited (Uhambo) joint venture
between the liquid fuel interests of Sasol and Engen,
predominantly owned by Petroliam Nasional Berhad (Petronas)
of Malaysia, was recommended for conditional approval in May
2005 by South Africa's Competition Commission. It has been
referred to the Competition Tribunal for final review and
approval. The tribunal hearing is set for October 2005.
Sasol Liquid Fuels Business operational highlights
2005 2004 % change
Crude oil processed * M m3 3,18 3,1 2
White product yield
(% of raw material) 89,5 90,7 (1)
Total liquid fuel sales M m3 9,60 9,32 3
Fuel and bitumen exports M m3 0,9 0,7 29
* Based on the 63,6% share held by Sasol in the Natref crude oil refinery.
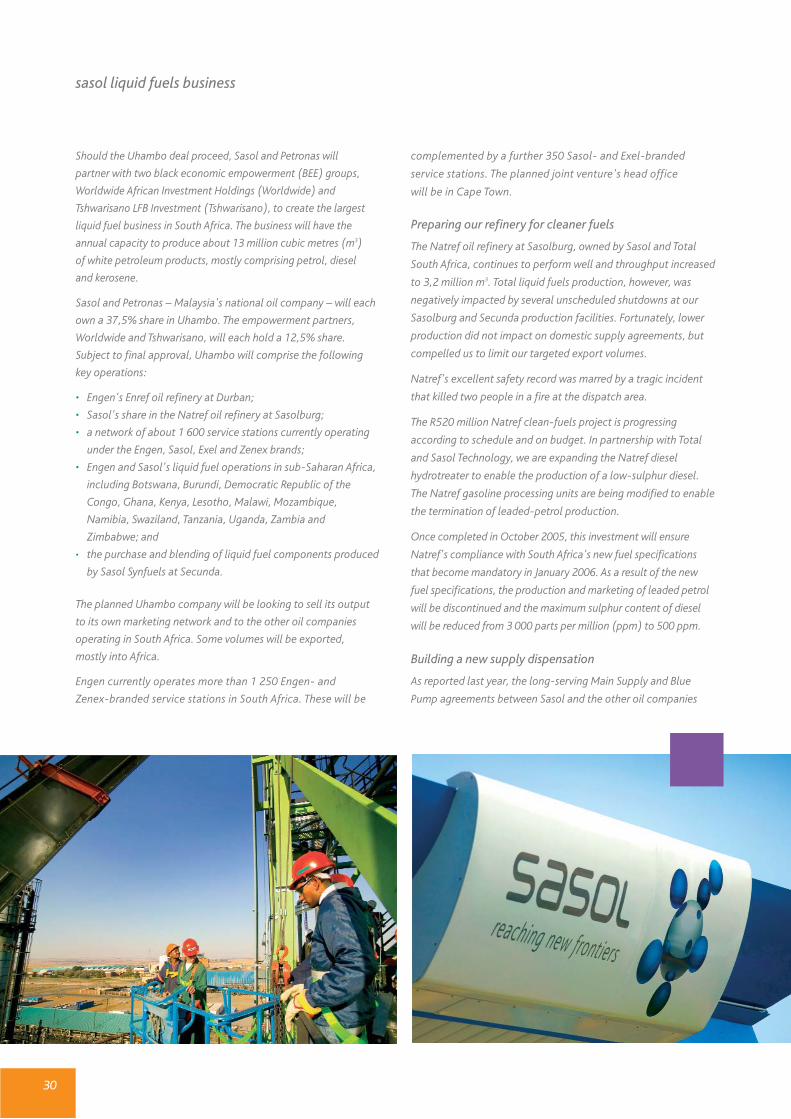
30
Should the Uhambo deal proceed, Sasol and Petronas will
partner with two black economic empowerment (BEE) groups,
Worldwide African Investment Holdings (Worldwide) and
Tshwarisano LFB Investment (Tshwarisano), to create the largest
liquid fuel business in South Africa. The business will have the
annual capacity to produce about 13 million cubic metres (m3)
of white petroleum products, mostly comprising petrol, diesel
and kerosene.
Sasol and Petronas – Malaysia's national oil company – will each
own a 37,5% share in Uhambo. The empowerment partners,
Worldwide and Tshwarisano, will each hold a 12,5% share.
Subject to final approval, Uhambo will comprise the following
key operations:
• Engen's Enref oil refinery at Durban;
• Sasol's share in the Natref oil refinery at Sasolburg;
• a network of about 1 600 service stations currently operating
under the Engen, Sasol, Exel and Zenex brands;
• Engen and Sasol's liquid fuel operations in sub-Saharan Africa,
including Botswana, Burundi, Democratic Republic of the
Congo, Ghana, Kenya, Lesotho, Malawi, Mozambique,
Namibia, Swaziland, Tanzania, Uganda, Zambia and
Zimbabwe; and
• the purchase and blending of liquid fuel components produced
by Sasol Synfuels at Secunda.
The planned Uhambo company will be looking to sell its output
to its own marketing network and to the other oil companies
operating in South Africa. Some volumes will be exported,
mostly into Africa.
Engen currently operates more than 1 250 Engen- and
Zenex-branded service stations in South Africa. These will be
complemented by a further 350 Sasol- and Exel-branded
service stations. The planned joint venture's head office
will be in Cape Town.
Preparing our refinery for cleaner fuels
The Natref oil refinery at Sasolburg, owned by Sasol and Total
South Africa, continues to perform well and throughput increased
to 3,2 million m3. Total liquid fuels production, however, was
negatively impacted by several unscheduled shutdowns at our
Sasolburg and Secunda production facilities. Fortunately, lower
production did not impact on domestic supply agreements, but
compelled us to limit our targeted export volumes.
Natref's excellent safety record was marred by a tragic incident
that killed two people in a fire at the dispatch area.
The R520 million Natref clean-fuels project is progressing
according to schedule and on budget. In partnership with Total
and Sasol Technology, we are expanding the Natref diesel
hydrotreater to enable the production of a low-sulphur diesel.
The Natref gasoline processing units are being modified to enable
the termination of leaded-petrol production.
Once completed in October 2005, this investment will ensure
Natref's compliance with South Africa's new fuel specifications
that become mandatory in January 2006. As a result of the new
fuel specifications, the production and marketing of leaded petrol
will be discontinued and the maximum sulphur content of diesel
will be reduced from 3 000 parts per million (ppm) to 500 ppm.
Building a new supply dispensation
As reported last year, the long-serving Main Supply and Blue
Pump agreements between Sasol and the other oil companies
sasol liquid fuels business
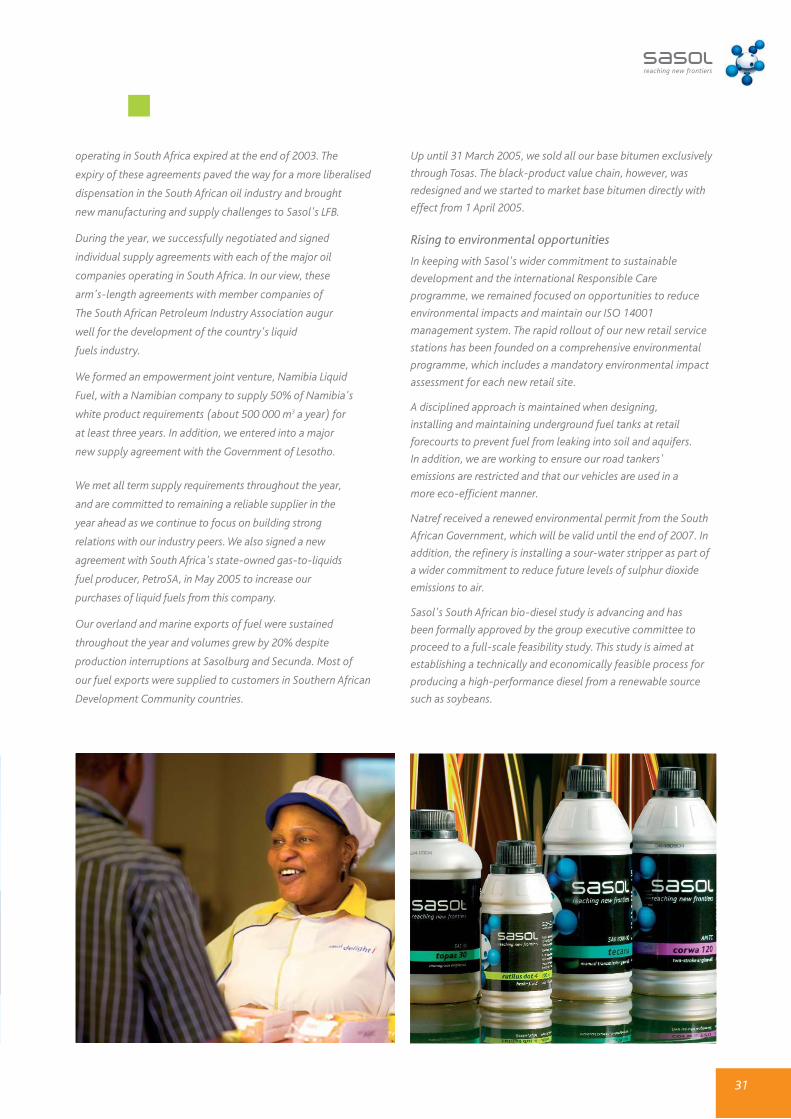
31
operating in South Africa expired at the end of 2003. The
expiry of these agreements paved the way for a more liberalised
dispensation in the South African oil industry and brought
new manufacturing and supply challenges to Sasol's LFB.
During the year, we successfully negotiated and signed
individual supply agreements with each of the major oil
companies operating in South Africa. In our view, these
arm's-length agreements with member companies of
The South African Petroleum Industry Association augur
well for the development of the country's liquid
fuels industry.
We formed an empowerment joint venture, Namibia Liquid
Fuel, with a Namibian company to supply 50% of Namibia's
white product requirements (about 500 000 m3 a year) for
at least three years. In addition, we entered into a major
new supply agreement with the Government of Lesotho.
We met all term supply requirements throughout the year,
and are committed to remaining a reliable supplier in the
year ahead as we continue to focus on building strong
relations with our industry peers. We also signed a new
agreement with South Africa's state-owned gas-to-liquids
fuel producer, PetroSA, in May 2005 to increase our
purchases of liquid fuels from this company.
Our overland and marine exports of fuel were sustained
throughout the year and volumes grew by 20% despite
production interruptions at Sasolburg and Secunda. Most of
our fuel exports were supplied to customers in Southern African
Development Community countries.
Up until 31 March 2005, we sold all our base bitumen exclusively
through Tosas. The black-product value chain, however, was
redesigned and we started to market base bitumen directly with
effect from 1 April 2005.
Rising to environmental opportunities
In keeping with Sasol's wider commitment to sustainable
development and the international Responsible Care
programme, we remained focused on opportunities to reduce
environmental impacts and maintain our ISO 14001
management system. The rapid rollout of our new retail service
stations has been founded on a comprehensive environmental
programme, which includes a mandatory environmental impact
assessment for each new retail site.
A disciplined approach is maintained when designing,
installing and maintaining underground fuel tanks at retail
forecourts to prevent fuel from leaking into soil and aquifers.
In addition, we are working to ensure our road tankers'
emissions are restricted and that our vehicles are used in a
more eco-efficient manner.
Natref received a renewed environmental permit from the South
African Government, which will be valid until the end of 2007. In
addition, the refinery is installing a sour-water stripper as part of
a wider commitment to reduce future levels of sulphur dioxide
emissions to air.
Sasol's South African bio-diesel study is advancing and has
been formally approved by the group executive committee to
proceed to a full-scale feasibility study. This study is aimed at
establishing a technically and economically feasible process for
producing a high-performance diesel from a renewable source
such as soybeans.
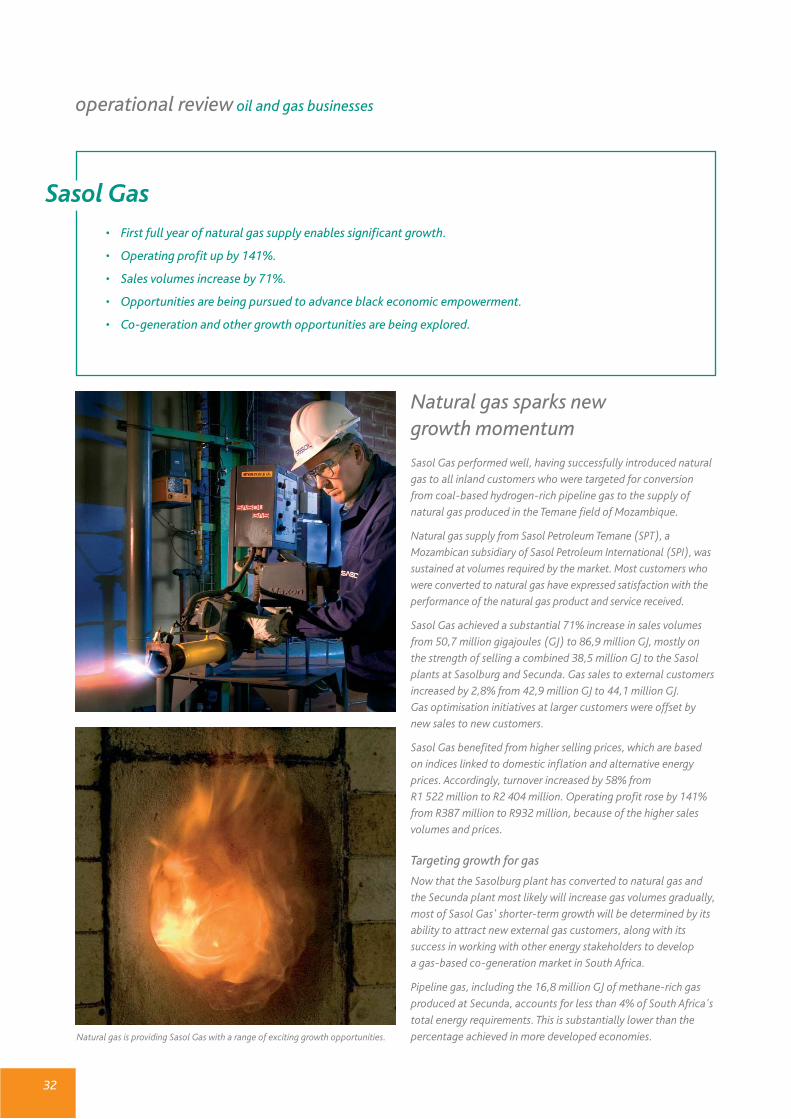
32
operational review oil and gas businesses
Natural gas sparks new growth momentum
Sasol Gas performed well, having successfully introduced natural
gas to all inland customers who were targeted for conversion
from coal-based hydrogen-rich pipeline gas to the supply of
natural gas produced in the Temane field of Mozambique.
Natural gas supply from Sasol Petroleum Temane (SPT), a
Mozambican subsidiary of Sasol Petroleum International (SPI), was
sustained at volumes required by the market. Most customers who
were converted to natural gas have expressed satisfaction with the
performance of the natural gas product and service received.
Sasol Gas achieved a substantial 71% increase in sales volumes
from 50,7 million gigajoules (GJ) to 86,9 million GJ, mostly on
the strength of selling a combined 38,5 million GJ to the Sasol
plants at Sasolburg and Secunda. Gas sales to external customers
increased by 2,8% from 42,9 million GJ to 44,1 million GJ.
Gas optimisation initiatives at larger customers were offset by
new sales to new customers.
Sasol Gas benefited from higher selling prices, which are based
on indices linked to domestic inflation and alternative energy
prices. Accordingly, turnover increased by 58% from
R1 522 million to R2 404 million. Operating profit rose by 141%
from R387 million to R932 million, because of the higher sales
volumes and prices.
Targeting growth for gas
Now that the Sasolburg plant has converted to natural gas and
the Secunda plant most likely will increase gas volumes gradually,
most of Sasol Gas' shorter-term growth will be determined by its
ability to attract new external gas customers, along with its
success in working with other energy stakeholders to develop
a gas-based co-generation market in South Africa.
Pipeline gas, including the 16,8 million GJ of methane-rich gas
produced at Secunda, accounts for less than 4% of South Africa's
total energy requirements. This is substantially lower than the
percentage achieved in more developed economies.
Sasol Gas • First full year of natural gas supply enables significant growth.
• Operating profit up by 141%.
• Sales volumes increase by 71%.
• Opportunities are being pursued to advance black economic empowerment.
• Co-generation and other growth opportunities are being explored.
Natural gas is providing Sasol Gas with a range of exciting growth opportunities.

33
Maintaining sound supply record
Reliability of supply to our customers was sound but deteriorated
relative to the previous year. In one case, unauthorised third-
party excavation work led to a severe pipeline gas leak and fire
at an industrial site in Centurion in August 2004. Fortunately,
no one was injured, and the damaged pipeline section and some
associated equipment were repaired and supplies to affected
customers restored within 38 hours.
We launched a comprehensive pipeline integrity management
initiative to ensure that regional and local authorities, including
emergency services, local communities and other stakeholders
along our pipeline routes, are better informed on the location of
underground gas pipelines and the importance of maintaining
pipeline integrity for safety, environmental and supply reasons.
Post-commissioning problems were experienced with the two
newly installed autothermal reformers at Sasolburg. These
problems caused syngas supply interruptions to Sasol Nitro, Sasol
Solvents and Sasol Wax. Innovative cooperation and gas mixture
configuration by Sasol Infrachem, which operates and maintains
the reformers on behalf of Sasol Gas, enabled Egoli Gas in
Johannesburg to continue without interruption.
On the safety front, our recordable case rate (RCR)* of two is a
major disappointment, despite most of the cases being relatively
minor injuries. In support of a wider Sasol initiative in South
Africa, we are implementing a comprehensive safety
improvement plan.
Seeking empowerment opportunities
Our drive to promote BEE in the South African gas sector is
gaining momentum. The 49:51 Sasol Gas joint venture with the
Durban-based BEE company of Coal Energy & Power Resources,
Spring Lights Gas, continues to perform well. This company
increased its sales volumes from 2,7 million GJ to 3 million GJ.
Another BEE potential opportunity exists for the cross-border
transmission pipeline linking the Temane central processing
facility to the Sasol Gas network at Secunda. This 865-km
pipeline is owned and operated by Republic of Mozambique
Pipeline Investments Company (Rompco), formerly a wholly
owned Sasol subsidiary company. The South African Government
– through iGas, a member of the state-owned Central Energy
Fund group of companies – acquired a 25% stake in Rompco in
July 2005.
iGas intends to use its 25% share to enable BEE participation in
the pipeline at a later date. The Mozambican Government has
expressed its intent to take up its option for a share of up to 25%
in Rompco, but no final commitment has yet been made.
The feasibility study with another BEE company, Umkhumbi We
Afrika of Mpumalanga, for the installation of a gas supply
network in the Nelspruit region, has been completed. The
findings indicate that the project, as originally envisaged, is not
feasible and a smaller-scale project is being considered.
Gaining recognition for gas project
The group's natural gas project and its project teams received
four awards during the year:
• the 2005 project management excellence award from Project
Management South Africa;
• the 2004 Project Finance deal of the year in the African oil and
gas category;
• the 2004 premium award from the International Association
for Impact Assessment; and
• a 2004 South Africa Technology Top 100 award.
Sasol Gas financial highlights
2005 2004 % change
Turnover Rm 2 404 1 522 58
Operating profit Rm 932 387 141
Capital items Rm – –
Operating margin % 39 25
Contribution to:
group operating profit % 6 4
attributable earnings Rm 517 487 6
Cash flow from operations Rm 1 197 476 151
Sasol Gas operational highlights
2005 2004 % change
Total gas sales M GJ 86,9 50,7 71
Sales per employee GJ 499 494 331 176 51
Cash fixed cost per GJ R 2,33 3,62 (36)
Number of unscheduled
supply interruptions 15 9 67
Number of reported gas leaks 4 2 100
* An RCR is the number of fatalities, lost workdays and medical treatments beyond first-aid cases for every 200 000 employee hours worked.
Note: A gigajoule (GJ) is a standard measure used for the heating value of any fuel gas supplied to customers. A joule is an international unit of energy defined as the energy produced from onewatt flowing for one second. Giga – denotes a measure of a billion (109). For gas, one gigajoule is equal to 0,96 thousand cubic feet under standard temperature and pressure conditions.

34
operational review oil and gas businesses
Upstream producer establishescritical mass
Sasol Petroleum International (SPI) has established critical mass
having enjoyed its first full financial year as a reliable producer of
natural gas in Mozambique. Having produced and sold – jointly
with its 30% partner, Empresa Nacional de Hidrocarbonetos de
Moçambique (ENH) – 77,1 million gigajoules (GJ) of natural gas
to Sasol Gas and a further 1,8 million barrels (b) of crude oil for
its own account through its 27,75% stake in Gabon's offshore
Etame field, SPI has become a positive contributor to group
profit. SPI's share of the gas production was 54 million GJ.
SPI increased turnover from R312 million to R841 million,
maintained a strong cash flow and recorded an operating profit
of R281 million. The group's investments since 1995 to fund SPI's
fledgling oil and gas exploration and production (E&P) interests
are starting to yield desired returns. SPI is set to be a sustainable
contributor to group profits as a result of its expected
continuation as a reliable and consistent supplier of natural gas
from Mozambique's onshore Temane and Pande fields. The Pande
field will not be used for production until the high pressure in the
Temane field drops and is comparable with the lower pressure of
the Pande field.
Maintaining stable Mozambican production
SPI – through its Mozambican subsidiary company of Sasol Petroleum
Temane (SPT) – maintained steady operations of the Temane central
processing facility (CPF), where we collect, clean and compress
natural gas before feeding it into the main transmission line linking
the gas fields to the Sasol Gas network at Secunda.
We also continue to explore for additional gas reserves in and
around the Temane and Pande gas fields as part of an exploration
licence that enables exploration across an onshore area of almost
17 000 km2. While gas proven reserves, according to the
definitions of the US Securities and Exchange Commission, have
remained unchanged, we can report significant increases in our
access to combined proven and probable reserves.
Sasol Petroleum International • Stable gas production sustained in Mozambique's Temane field.
• New gas exploration programme to commence off the coast of Mozambique.
• Sales volumes from Gabon’s offshore Etame oilfield increased by more than 20%.
• South African seismic data is being reappraised with BHP Billiton.
• Upstream integration opportunities being sought with Sasol Chevron and Sasol Synfuels International.
Sasol Petroleum International completed its first full financial year as acommercial gas producer in Mozambique’s Temane field.
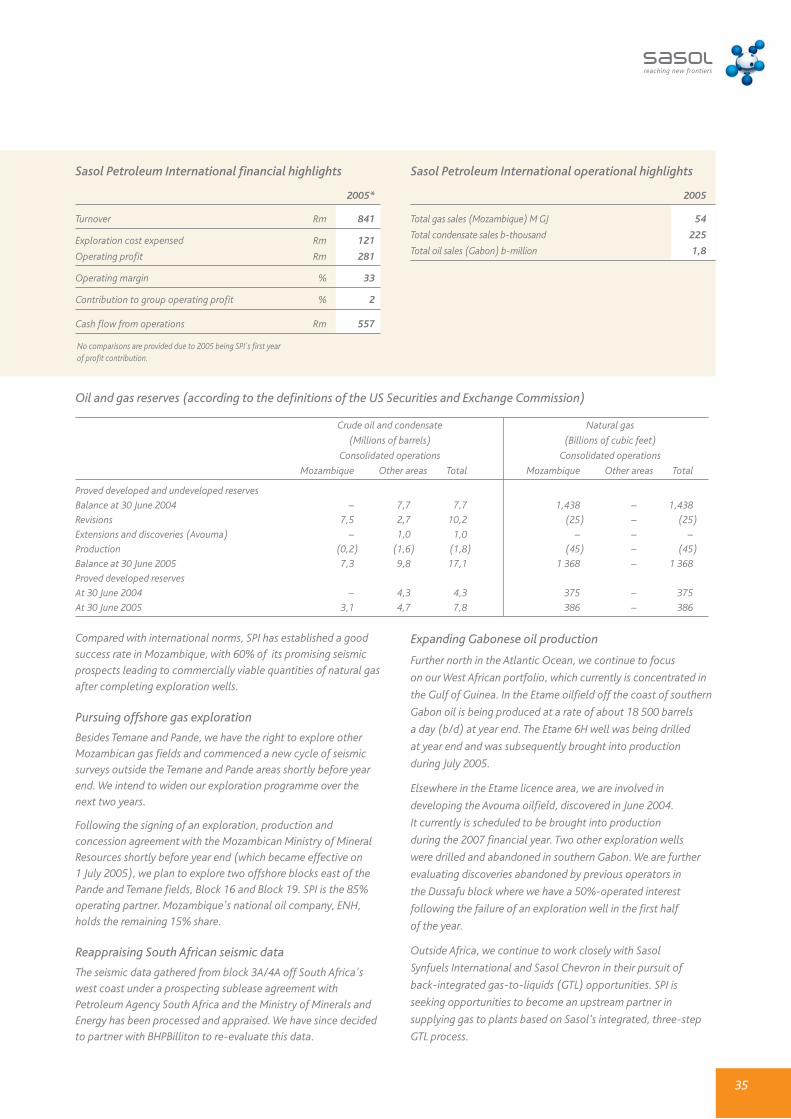
35
Compared with international norms, SPI has established a good
success rate in Mozambique, with 60% of its promising seismic
prospects leading to commercially viable quantities of natural gas
after completing exploration wells.
Pursuing offshore gas exploration
Besides Temane and Pande, we have the right to explore otherMozambican gas fields and commenced a new cycle of seismicsurveys outside the Temane and Pande areas shortly before yearend. We intend to widen our exploration programme over thenext two years.
Following the signing of an exploration, production andconcession agreement with the Mozambican Ministry of MineralResources shortly before year end (which became effective on 1 July 2005), we plan to explore two offshore blocks east of thePande and Temane fields, Block 16 and Block 19. SPI is the 85%operating partner. Mozambique's national oil company, ENH,holds the remaining 15% share.
Reappraising South African seismic data
The seismic data gathered from block 3A/4A off South Africa'swest coast under a prospecting sublease agreement withPetroleum Agency South Africa and the Ministry of Minerals andEnergy has been processed and appraised. We have since decidedto partner with BHPBilliton to re-evaluate this data.
Sasol Petroleum International operational highlights
2005
Total gas sales (Mozambique) M GJ 54
Total condensate sales b-thousand 225
Total oil sales (Gabon) b-million 1,8
No comparisons are provided due to 2005 being SPI's first yearof profit contribution.
Oil and gas reserves (according to the definitions of the US Securities and Exchange Commission)
Crude oil and condensate Natural gas
(Millions of barrels) (Billions of cubic feet)
Consolidated operations Consolidated operations
Mozambique Other areas Total Mozambique Other areas Total
Proved developed and undeveloped reserves
Balance at 30 June 2004 – 7,7 7,7 1,438 – 1,438
Revisions 7,5 2,7 10,2 (25) – (25)
Extensions and discoveries (Avouma) – 1,0 1,0 – – –
Production (0,2) (1,6) (1,8) (45) – (45)
Balance at 30 June 2005 7,3 9,8 17,1 1 368 – 1 368
Proved developed reserves
At 30 June 2004 – 4,3 4,3 375 – 375
At 30 June 2005 3,1 4,7 7,8 386 – 386
Expanding Gabonese oil production
Further north in the Atlantic Ocean, we continue to focus
on our West African portfolio, which currently is concentrated in
the Gulf of Guinea. In the Etame oilfield off the coast of southern
Gabon oil is being produced at a rate of about 18 500 barrels
a day (b/d) at year end. The Etame 6H well was being drilled
at year end and was subsequently brought into production
during July 2005.
Elsewhere in the Etame licence area, we are involved in
developing the Avouma oilfield, discovered in June 2004.
It currently is scheduled to be brought into production
during the 2007 financial year. Two other exploration wells
were drilled and abandoned in southern Gabon. We are further
evaluating discoveries abandoned by previous operators in
the Dussafu block where we have a 50%-operated interest
following the failure of an exploration well in the first half
of the year.
Outside Africa, we continue to work closely with Sasol
Synfuels International and Sasol Chevron in their pursuit of
back-integrated gas-to-liquids (GTL) opportunities. SPI is
seeking opportunities to become an upstream partner in
supplying gas to plants based on Sasol’s integrated, three-step
GTL process.
Sasol Petroleum International financial highlights
2005*
Turnover Rm 841
Exploration cost expensed Rm 121
Operating profit Rm 281
Operating margin % 33
Contribution to group operating profit % 2
Cash flow from operations Rm 557

36
operational review oil and gas businesses
Preparing for start of GTL production
Sasol Synfuels International (SSI) is well on track towards
becoming a key player in the world's emerging GTL industry and
will be the first to enter the market with commercial-scale GTL
products. The US$950 million Oryx plant – the first GTL plant
outside South Africa to feature Sasol's unique Fischer-Tropsch
(FT) synthesis gas (syngas) conversion technology – has entered
its final construction phase at Ras Laffan, Qatar. Systems
commissioning is well advanced and the plant is on schedule to
begin full commercial production in 2006.
SSI continues to work closely with Sasol Chevron, Sasol's joint
venture with Chevron of the USA, in seeking additional GTL
investment opportunities, one of which is under way at Escravos
in Nigeria. The Escravos facility is scheduled to begin full
commercial production in 2009. It will be the next GTL venture to
come on stream after Oryx.
In another significant development, SSI is working with a Chinese
consortium to advance pre-feasibility studies for the potential
development of two CTL plants in inland China.
Approaching Oryx GTL start-up
The Oryx GTL plant will be owned and operated by Oryx GTL
(QSC), a 49:51 joint venture between SSI and Qatar Petroleum
(QP), the Qatari state-owned petroleum company. The 34 000
b/d plant will incorporate the integrated, three-step Sasol Slurry
Phase Distillate™ (Sasol SPD™) process. It will convert lean
natural gas from Qatar's extensive North Field reserves into
syngas for the downstream conversion and upgrading to GTL
diesel, GTL naphtha and some liquefied petroleum gas (LPG).
The Sasol SPD™ process uses Sasol's unique low-temperature FT
(LTFT) Slurry Phase reactor technology. Two of these LTFT
reactors were fabricated in Japan and arrived at Ras Laffan from
Yokohama in April 2005. Technip is executing the US$675 million
lump-sum, turnkey engineering, procurement and construction
(EPC) contract for the GTL plant.
Sasol Synfuels International • Oryx gas-to-liquids (GTL) plant in Qatar is nearing completion.
• Construction of Nigerian GTL plant will commence in the year ahead.
• Pre-feasibility study under way for two potential coal-to-liquids (CTL) plants in China.
• Sasol Chevron and Qatar Petroleum continue to develop GTL expansion opportunities in Qatar.
• GTL opportunities in other gas-rich regions are under consideration.
• CTL opportunities in other coal-rich regions are being explored.
The Oryx GTL plant in Qatar will be brought into production in the year ahead.
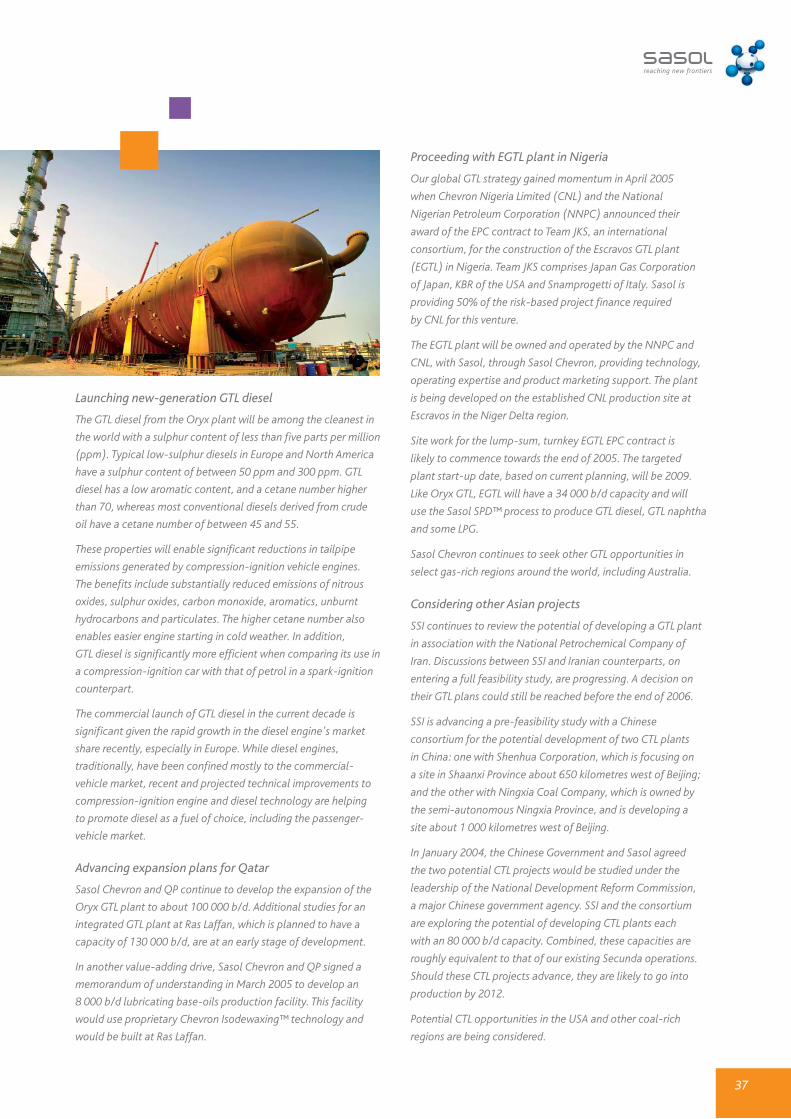
37
Launching new-generation GTL diesel
The GTL diesel from the Oryx plant will be among the cleanest in
the world with a sulphur content of less than five parts per million
(ppm). Typical low-sulphur diesels in Europe and North America
have a sulphur content of between 50 ppm and 300 ppm. GTL
diesel has a low aromatic content, and a cetane number higher
than 70, whereas most conventional diesels derived from crude
oil have a cetane number of between 45 and 55.
These properties will enable significant reductions in tailpipe
emissions generated by compression-ignition vehicle engines.
The benefits include substantially reduced emissions of nitrous
oxides, sulphur oxides, carbon monoxide, aromatics, unburnt
hydrocarbons and particulates. The higher cetane number also
enables easier engine starting in cold weather. In addition,
GTL diesel is significantly more efficient when comparing its use in
a compression-ignition car with that of petrol in a spark-ignition
counterpart.
The commercial launch of GTL diesel in the current decade is
significant given the rapid growth in the diesel engine's market
share recently, especially in Europe. While diesel engines,
traditionally, have been confined mostly to the commercial-
vehicle market, recent and projected technical improvements to
compression-ignition engine and diesel technology are helping
to promote diesel as a fuel of choice, including the passenger-
vehicle market.
Advancing expansion plans for Qatar
Sasol Chevron and QP continue to develop the expansion of the
Oryx GTL plant to about 100 000 b/d. Additional studies for an
integrated GTL plant at Ras Laffan, which is planned to have a
capacity of 130 000 b/d, are at an early stage of development.
In another value-adding drive, Sasol Chevron and QP signed a
memorandum of understanding in March 2005 to develop an
8 000 b/d lubricating base-oils production facility. This facility
would use proprietary Chevron Isodewaxing™ technology and
would be built at Ras Laffan.
Proceeding with EGTL plant in Nigeria
Our global GTL strategy gained momentum in April 2005
when Chevron Nigeria Limited (CNL) and the National
Nigerian Petroleum Corporation (NNPC) announced their
award of the EPC contract to Team JKS, an international
consortium, for the construction of the Escravos GTL plant
(EGTL) in Nigeria. Team JKS comprises Japan Gas Corporation
of Japan, KBR of the USA and Snamprogetti of Italy. Sasol is
providing 50% of the risk-based project finance required
by CNL for this venture.
The EGTL plant will be owned and operated by the NNPC and
CNL, with Sasol, through Sasol Chevron, providing technology,
operating expertise and product marketing support. The plant
is being developed on the established CNL production site at
Escravos in the Niger Delta region.
Site work for the lump-sum, turnkey EGTL EPC contract is
likely to commence towards the end of 2005. The targeted
plant start-up date, based on current planning, will be 2009.
Like Oryx GTL, EGTL will have a 34 000 b/d capacity and will
use the Sasol SPD™ process to produce GTL diesel, GTL naphtha
and some LPG.
Sasol Chevron continues to seek other GTL opportunities in
select gas-rich regions around the world, including Australia.
Considering other Asian projects
SSI continues to review the potential of developing a GTL plant
in association with the National Petrochemical Company of
Iran. Discussions between SSI and Iranian counterparts, on
entering a full feasibility study, are progressing. A decision on
their GTL plans could still be reached before the end of 2006.
SSI is advancing a pre-feasibility study with a Chinese
consortium for the potential development of two CTL plants
in China: one with Shenhua Corporation, which is focusing on
a site in Shaanxi Province about 650 kilometres west of Beijing;
and the other with Ningxia Coal Company, which is owned by
the semi-autonomous Ningxia Province, and is developing a
site about 1 000 kilometres west of Beijing.
In January 2004, the Chinese Government and Sasol agreed
the two potential CTL projects would be studied under the
leadership of the National Development Reform Commission,
a major Chinese government agency. SSI and the consortium
are exploring the potential of developing CTL plants each
with an 80 000 b/d capacity. Combined, these capacities are
roughly equivalent to that of our existing Secunda operations.
Should these CTL projects advance, they are likely to go into
production by 2012.
Potential CTL opportunities in the USA and other coal-rich
regions are being considered.

38
operational review main chemical businesses
Sasol Olefins & Surfactants • Margins stabilised in spite of substantially higher feedstock costs.
• Surfactant and surfactant intermediate markets remain strong.
• Problems hamper supply of product from Secunda Safol plant.
• Further substantial reduction in fixed costs achieved.
• World-class performance in lowering injuries.
Margin stabilisation key to improved performance
Sasol Olefins & Surfactants (O&S) achieved turnover of R18 394 million (€2 331 million; US$2 962 million), which was6% higher in rand terms and 10% higher in euro terms than theprevious year (R17 382 million;€2 122 million; US$2 528 million).Increased turnover was due to higher sales prices, but this benefitwas fully absorbed in the higher feedstock and energy costs.
Profit was constrained to lower levels because of further increases in feedstock prices and higher energy costs.Product prices increased strongly during the year and furtherprogress was made in reducing costs and improving efficiency.EBITDA* (before capital items) amounted to R1 500 million (€190 million; US$242 million) and operating loss to R221 million (€28 million; US$36 million) including capital itemsamounting to R783 million ( €99 million; US$126 million).
Stronger international oil and energy prices increased feedstockcosts. When compared with the previous year, this resulted inincreased ethylene costs in Germany, significantly higher naturalgas and ethane costs in the USA, substantially higher keroseneand benzene costs in the USA and Italy, and slightly higher rand-based feedstock costs in South Africa.
Countering higher feedstock costs
Contrary to the previous year, we were able to significantlyincrease product pricing to counter the impact of increasedfeedstock costs. Furthermore, we sustained our drive to counterthe impacts of difficult trading conditions through efforts such asrestructuring, to reduce costs and improve operational efficiency.
Towards year end, strategic and growth projects again receivedattention in addition to our ongoing rationalisation efforts.Announcements were made on:
• an ethylene pipeline and related expansion projects atBrunsbüttel, Germany;
• the intention to build, pending final board approval, anoleochemical-based alcohol plant in China together with apotential joint-venture partner, Wilmar; and
Sasol Olefins & Surfactants continues to focus on new opportunities to reducecosts and streamline operations.
* earnings before interest, taxation, depreciation and amortisation.
39
• an investigation into business opportunities in Russia togetherwith a Russian company, Nizhnekamskneftekhim.
Easing ongoing pressures with cost reduction
Although the variable costs of the alkylates and surfactantsbusiness unit were substantially higher than the previous year,it was possible to increase product prices to keep margins fairly constant. Apart from kerosene feedstock costs thatincreased by about 50%, benzene feedstock costs almost doubled year-on-year. The benzene prices were not only drivenby higher oil prices and refinery margins, as were the keroseneprices, but also by a shortage of benzene in the market.
Apart from the increases in product prices, especially linearalkylbenzene (LAB) prices, the business unit performancebenefited from reduced fixed cost, improved efficiency andlonger-term customer relationships. Towards year end, the LABplant at Porto Torres, Italy, was restarted to meet customerdemand and replace volumes lost during maintenanceturnarounds on other LAB plants. In the year ahead, oil prices will continue to be the main driver, but, under constant feedstock conditions, the expectation is that this business unitwill perform appreciably better.
Delivering another strong performance
The supply/demand equation in the international alcoholsindustry remained well balanced, which enabled the alcoholsand surfactants business unit to increase product pricing formany of its products. These strong market conditions alsoattracted some new competitors and announcements have beenmade on several new oleochemical-based alcohol plants inSouth-East Asia. This will lead to a substantial increase in alcoholcapacity from 2006 onwards with the accompanying expectedpressure on alcohol margins.
Supply problems, of which the biggest was the cloudburst atSecunda in January 2005, severely restricted our ability to meetcustomer demand. Following the cloudburst we were forced todeclare force majeure on supplies of Safol. This situation impactedsignificantly on this business unit, but is not expected to persist inthe year ahead and should enable us to better our performance ofthe 2004 financial year.
Sasol Olefins & Surfactants operational highlights
2005 2004 % change
Total sales Mt 2,29 2,31 (1,0)
Total production Mt 2,26 2,29 (1,2)
Production per employee t 619 563 9,9
Sasol Olefins & Surfactants financial highlights
2005 2004 % change
Turnover Rm 18 394 17 382 6
Operating loss Rm (221) (67) (230)
Capital items Rm (783) (21)
Contribution to:
group operating profit % (2) (1)
attributable earnings Rm (317) (102)
Cash flow from operations Rm 1 520 1 465 4
Achieving strong monomers performance
Contrary to expectations, the ethylene part of the monomers
business unit had another good year when ethylene margins in
the USA were much stronger than forecast. These strong margins
compensated for the replacement of expiring contract volumes
with lower-margin business and increased energy cost.
The comonomer part of the monomers business, with plants
at Secunda, had a better financial performance. This was due
primarily to the rand's stabilisation later in the year and
much-improved supply/demand conditions in the 1-hexene
market. The successful commissioning of the second
1-octene train at the end of November also contributed
to this improvement.
Improvement at inorganic specialities
The inorganic specialities business unit maintained its upward
trend in performance by continuing to develop and introduce
new products. The business benefits from the continuing move
towards higher-value-added products. The performance further
gained from the successful introduction of precipitated aluminas
to the market from the new facility at Crotone, Italy.
Working to lower costs and lift efficiency
Our plants outside South Africa ran well and at high utilisation
rates. Initiatives to improve operational performance, such
as the restructuring project in Sasol Italy, the shared services
project in Sasol Germany and the profit improvement drive in
Sasol North America delivered further value. Coupled with the
ongoing efforts and projects to improve feedstock and energy
efficiency, reduce the overall cost of ownership and align
employees with business objectives through performance
management, this improved the competitiveness of our
production and delivery of products.
Following the nominal fixed cost reduction of 3% in the
previous year, Sasol O & S’ fixed cost was reduced by a further
nominal 2%. This fixed-cost-saving programme will be concluded
in the year ahead. The result of this programme will be a real
reduction in fixed costs, greater than 20%.

40
operational review main chemical businesses
Sterling performance in aftermath of a tragedy
The explosion at the Secunda ethylene plant on 1 September
2004 and the tragic loss of life was a major upset during the year.
Sasol Polymers recovered from the tragedy to achieve a record
trading profit on the strength of good sales prices and margins,
and continuing efforts to enhance efficiency and control costs.
Monomers, polymers and chemicals, in general, enjoyed strong
international and domestic prices and higher margins, which
eased much of the impact of a stronger rand and higher feedstock
costs. A basket made up of the average of these prices was about
18% higher in rand terms than the previous year.
Production volumes dropped by 11% mostly because of the
90-day loss of ethylene production and the subsequent impact
on polyethylene and polyvinyl chloride (PVC) production at
Sasolburg. A flood at Secunda in January 2005 also temporarily
restrained production. Combined annual sales volumes declined
by 9% from a record 1,27 million tons (Mt) to 1,15 Mt.
Turnover increased by 9% from R6 662 million to R7 282 million,
and operating profit rose by 44% from R1 030 million to
R1 484 million. Because of the unscheduled shutdowns,
per-capita productivity dropped by 3% from 721 t to 701 t.
Sasol Polymers achieved a 99% success rate in delivering orders
on time and in full. We attained 96% quality compliance for all
products combined. Our fixed cash cost per ton has dropped by
42% in real terms over the last 11 years.
Restoring monomer production
The ethylene plant was restored to normal production levels by
December 2004. The monomers business sold 682 000 t of
ethylene and propylene, which was 8% lower than the previous
year. The financial impact of the plant explosion was mitigated
by an insurance claim.
Sasol Polymers• Excellent overall performance achieved despite tragic explosion at Secunda.
• Operating profit up 44% on the strength of higher prices and efficiencies, as well as cost containment.
• Two new world-scale South African polymer plants under construction.
• Asian interests continue to generate good earnings.
• Total installed polymer production capacity set to almost double.
Bold investments will enable Sasol Polymers to increase its South African polymercapacity in the year ahead.
41
As part of Sasol's Project Turbo work scope, the monomers
business will substantially increase its production of ethylene and
propylene in the year ahead. Our Sasolburg and Secunda
ethylene crackers are being debottlenecked to increase ethylene
production. Once brought into beneficial operation in 2006, our
new and debottlenecked plants will increase our installed South
African polymer production capacity by about 80%.
Achieving satisfactory polymer sales
The polypropylene business, in general, performed well, but
reported a 7% reduction in sales volumes. Of its sales volumes of
226 200 t, 49% (110 000 t) was sold to customers in export
markets, mostly in Asia-Pacific and Africa.
The polythene business recorded lower sales because of the
Secunda incident. Combined sales of low-density polyethylene
(LDPE) and linear low-density polyethylene (LLDPE) fell by
15% to 195 500 t.
The vinyls business performed well considering the reduced
availability of ethylene, which is used to make vinyl chloride
monomer (VCM). The VCM and PVC plants were successfully
uprated to 205 000 tpa and 200 000 tpa, respectively. This
business had to limit VCM production because of the prolonged
interruption of ethylene supply. As a result, PVC sales were 13%
lower at 169 600 t.
Harnessing desired returns in Asia
The two ventures with Petronas at Kertih, on the east coast of
mainland Malaysia, continue to perform satisfactorily and
contribute to profit. These interests are a 12% share in the Optimal
Olefins ethane cracker, which produces ethylene and some
propylene, and a 40% share in the 250 000 tpa Petlin LDPE plant.
Through a 40% interest in Hong Kong-based Wesco China,
Sasol Polymers remains a significant distributor of polymers in
the emerging Chinese market. Wesco China distributed almost
142 000 t of polymers, of which 30 000 t was produced by
Sasol Polymers.
Sasol Polymers operational highlights
2005 2004 % change
Total sales Mt 1,15 1,27 (9)
Total production Mt 1,73 1,93 (10)
Production per employee t 701 721 (3)
Sasol Polymers financial highlights
2005 2004 % change
Turnover Rm 7 282 6 662 9
Operating profit Rm 1 484 1 030 44
Capital items Rm (12) 59
Operating margin % 20 15
Contribution to:
group operating profit % 10 11
attributable earnings Rm 1 548 881 76
Cash flow from operations Rm 1 778 1 436 24
Advancing South African expansion
As part of Project Turbo, we are constructing a 300 000 tpa
polypropylene plant (PP 2) to complement the 225 000 tpa
polypropylene plant at Secunda. PP 2 will produce
homopolymers, random copolymers and impact
copolymers for customers in Southern African and
offshore export markets.
At the Sasolburg Midland site, a 220 000 tpa LDPE plant
(Poly 3) is under construction. Once this plant is brought into
operation, we plan to downscale the Sasolburg Poly 1 LDPE plant
from 100 000 tpa to 20 000 tpa. The Sasolburg Poly 2 plant
was uprated to increase LLDPE production from 105 000 tpa
to 150 000 tpa.
SPG moves ahead in Iran
Sasol Polymers Germany GmbH, a subsidiary of Sasol Polymers
International Investments, is investing US$516 million in
new monomer and polymer production facilities at Bandar
Assaluyeh, Iran. These world-scale facilities are being
developed through Arya Sasol Polymer Company, a
50:50 joint venture with the National Petrochemical
Company of Iran.
The Arya Sasol facilities will comprise an ethane cracker for
producing 1 Mt of ethylene annually. Some ethylene will be
exported, but most of it will be converted in two 300 000 tpa
polyethylene plants: one for producing LDPE and one for
high-density polyethylene. The cracker construction schedule
has been revised and mechanical completion is targeted for
the first quarter of 2006. The polyethylene plants will be
completed soon afterwards.
Once the Arya Sasol facilities are operational – and
combined with the two Project Turbo plants under
development and the share in the Petlin plant in Malaysia –
Sasol will have an installed annual global polymer production
capacity of about 1,5 Mt.
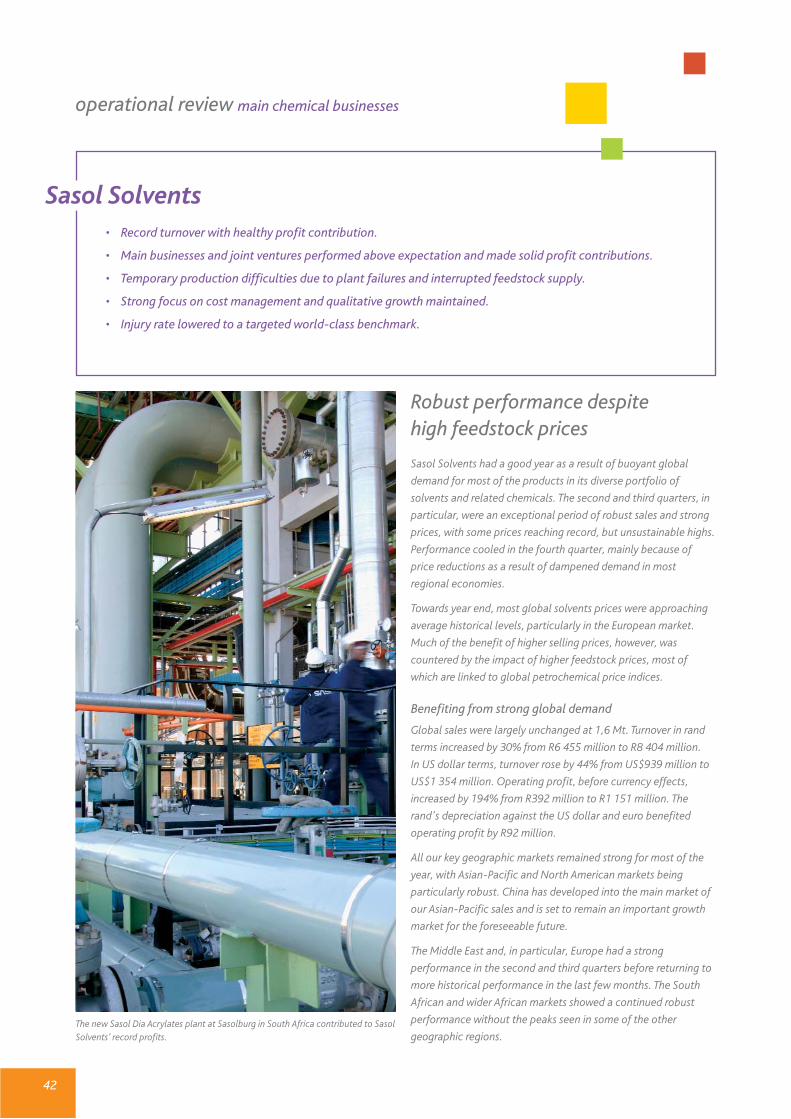
42
operational review main chemical businesses
Robust performance despite high feedstock prices
Sasol Solvents had a good year as a result of buoyant global
demand for most of the products in its diverse portfolio of
solvents and related chemicals. The second and third quarters, in
particular, were an exceptional period of robust sales and strong
prices, with some prices reaching record, but unsustainable highs.
Performance cooled in the fourth quarter, mainly because of
price reductions as a result of dampened demand in most
regional economies.
Towards year end, most global solvents prices were approaching
average historical levels, particularly in the European market.
Much of the benefit of higher selling prices, however, was
countered by the impact of higher feedstock prices, most of
which are linked to global petrochemical price indices.
Benefiting from strong global demand
Global sales were largely unchanged at 1,6 Mt. Turnover in rand
terms increased by 30% from R6 455 million to R8 404 million.
In US dollar terms, turnover rose by 44% from US$939 million to
US$1 354 million. Operating profit, before currency effects,
increased by 194% from R392 million to R1 151 million. The
rand's depreciation against the US dollar and euro benefited
operating profit by R92 million.
All our key geographic markets remained strong for most of the
year, with Asian-Pacific and North American markets being
particularly robust. China has developed into the main market of
our Asian-Pacific sales and is set to remain an important growth
market for the foreseeable future.
The Middle East and, in particular, Europe had a strong
performance in the second and third quarters before returning to
more historical performance in the last few months. The South
African and wider African markets showed a continued robust
performance without the peaks seen in some of the other
geographic regions.
Sasol Solvents • Record turnover with healthy profit contribution.
• Main businesses and joint ventures performed above expectation and made solid profit contributions.
• Temporary production difficulties due to plant failures and interrupted feedstock supply.
• Strong focus on cost management and qualitative growth maintained.
• Injury rate lowered to a targeted world-class benchmark.
The new Sasol Dia Acrylates plant at Sasolburg in South Africa contributed to SasolSolvents’ record profits.
43
Increasing volumes almost threefold in five years
The combination of increased production, new products and
focused marketing worldwide has enabled us in recent years to
increase sales and geographic spread. Five years ago, we sold
close to 510 000 t of products to customers in almost
90 countries. Today, we are selling a broader portfolio of
solvents, more than 1,5 Mt a year, to customers in more than
110 countries across all continents.
During the first half, our South African-based sales potential was
constrained by a few production problems in our own plants, as
well as other Sasol plants providing feedstock to Sasol Solvents.
This temporarily limited sales of certain products in most overseas
regions. All South African assets have since been restored to full
capacity and are operating smoothly. In some instances, we have
achieved new South African production records.
Our German operations at Herne, Marl and Moers performed well
without major interruptions and met expected production output.
Approved low-capital debottlenecking projects are under way to
increase the capacity of our methyl ethyl ketone (MEK) plant at
Moers and our iso-propanol plants at Herne and Moers. In South
Africa, two projects are being developed:
• the construction of a second methyl iso-butyl ketone (MIBK)
train; and
• an incremental debottlenecking of our n-propanol production.
Exceeding group safety targets
We are pleased with the achieved year-end recordable case rate
of 0,3 for our operations. In both Germany and South Africa,
we are significantly below the group’s set target of 0,5 for
June 2006. Our continuing safety efforts, especially in South
Africa, have led to a significant reduction of recordable-case injuries.
Rising above expectation in most cases
The C3/C4 alcohols business performed well due to the higher-
than-anticipated product prices achieved during the middle of
Sasol Solvents operational highlights
2005 2004 % change
Total sales Mt 1,58 1,48 7,0
Total production Mt 1,59 1,42 12,5
Production per employee t 1 177 1 062 10,8
Sasol Solvents financial highlights
2005 2004 increase
Turnover Rm 8 404 6 455 1 949
Operating profit Rm 1 243 117 1 126
Capital items Rm (382) (18)
Operating margin % 15 2
Contribution to:
group operating profit % 9 1
attributable earnings Rm 1 106 169 937
Cash flow from operations Rm 1 883 454 1 429
the year. In particular, iso-propanol performed well in Europe and
contributed significantly to the business unit's results. The glycol
ethers business also had a strong performance for similar reasons.
The ketones business unit also performed well and enjoyed good
market conditions and excellent demand for its major products of
acetone, MEK and MIBK. The ethanol business globally did not
perform as planned, mainly because of the disappointing
performance of the German operation due to exceptionally high
feedstock costs. The esters and acids business reported better
results with improved production and sales volumes and higher
selling prices.
Enjoying robust demand for acrylates
The Sasol Dia Acrylates joint venture with Mitsubishi Chemical
Corporation of Japan at Sasolburg also performed well, and is
benefiting from strong global demand for acrylic acid and
acrylates. The new Sasolburg complex enjoyed its first full
financial year of operation. This joint venture posted a healthy
contribution to profit.
Although new capacities went on stream in China in the second
quarter of 2005, global acrylates demand seems to remain robust.
Sasol Solvents and Mitsubishi Chemical Corporation are exploring
the merits of expanding the Sasol Dia Acrylates plant. The first step
will be an incremental debottlenecking of the existing facilities, and
the next step will entail the construction of a second train to
produce additional volumes of acrylic acid and its derivatives.
Exceeding targets for maleic anhydride
The Sasol-Huntsman joint venture with Huntsman Corporation at
Moers experienced a strong year for the production and sale of
maleic anhydride. Demand for unsaturated polyester resins, the
largest market for maleic anhydride, remained healthy.
The recent approvals of low capital expenditure for a
pastillisation unit and debottlenecking of the existing
facilities in Europe will enable this business to increase its
focus on European markets.
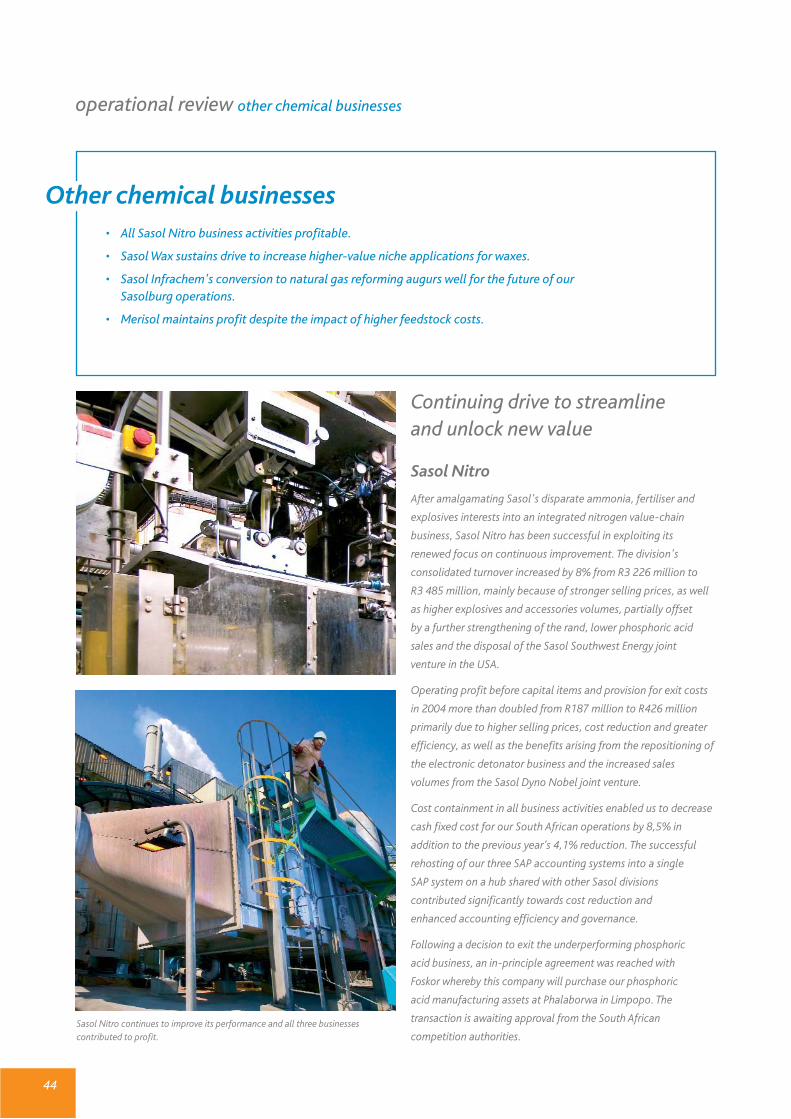
44
operational review other chemical businesses
Continuing drive to streamline and unlock new value
Sasol Nitro
After amalgamating Sasol's disparate ammonia, fertiliser and
explosives interests into an integrated nitrogen value-chain
business, Sasol Nitro has been successful in exploiting its
renewed focus on continuous improvement. The division's
consolidated turnover increased by 8% from R3 226 million to
R3 485 million, mainly because of stronger selling prices, as well
as higher explosives and accessories volumes, partially offset
by a further strengthening of the rand, lower phosphoric acid
sales and the disposal of the Sasol Southwest Energy joint
venture in the USA.
Operating profit before capital items and provision for exit costs
in 2004 more than doubled from R187 million to R426 million
primarily due to higher selling prices, cost reduction and greater
efficiency, as well as the benefits arising from the repositioning of
the electronic detonator business and the increased sales
volumes from the Sasol Dyno Nobel joint venture.
Cost containment in all business activities enabled us to decrease
cash fixed cost for our South African operations by 8,5% in
addition to the previous year’s 4,1% reduction. The successful
rehosting of our three SAP accounting systems into a single
SAP system on a hub shared with other Sasol divisions
contributed significantly towards cost reduction and
enhanced accounting efficiency and governance.
Following a decision to exit the underperforming phosphoric
acid business, an in-principle agreement was reached with
Foskor whereby this company will purchase our phosphoric
acid manufacturing assets at Phalaborwa in Limpopo. The
transaction is awaiting approval from the South African
competition authorities.
Other chemical businesses • All Sasol Nitro business activities profitable.
• Sasol Wax sustains drive to increase higher-value niche applications for waxes.
• Sasol Infrachem's conversion to natural gas reforming augurs well for the future of our Sasolburg operations.
• Merisol maintains profit despite the impact of higher feedstock costs.
Sasol Nitro continues to improve its performance and all three businessescontributed to profit.
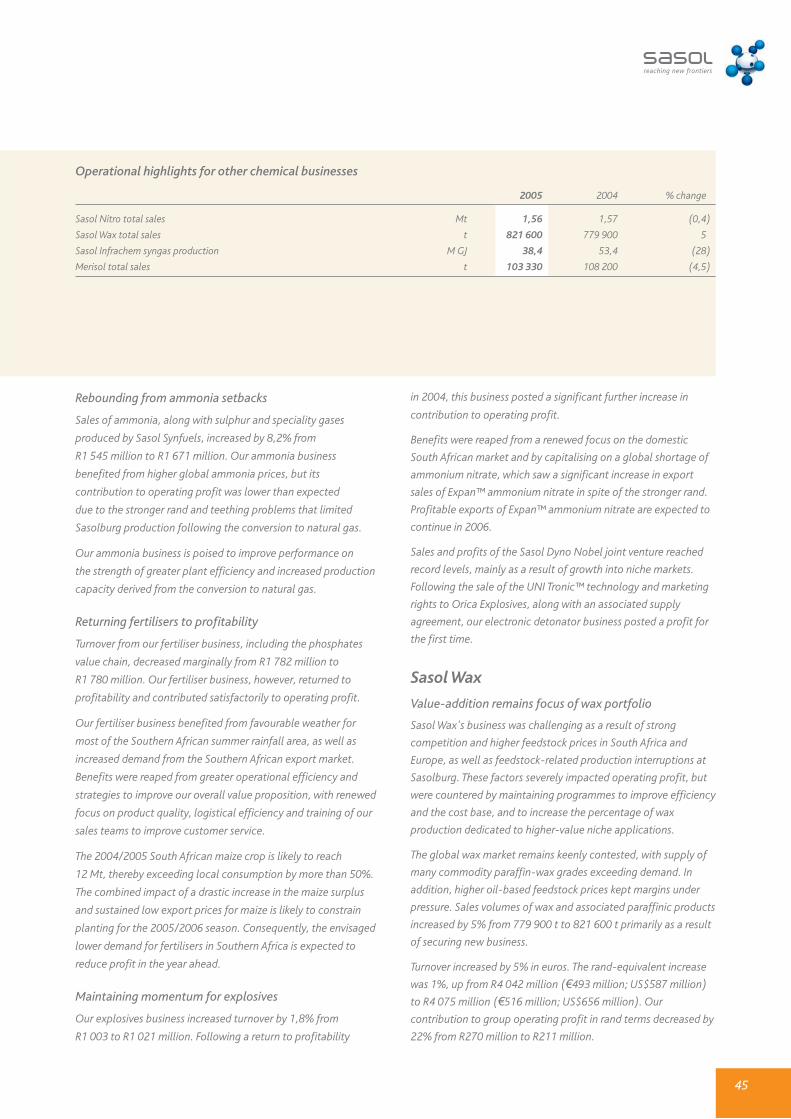
45
Rebounding from ammonia setbacks
Sales of ammonia, along with sulphur and speciality gases
produced by Sasol Synfuels, increased by 8,2% from
R1 545 million to R1 671 million. Our ammonia business
benefited from higher global ammonia prices, but its
contribution to operating profit was lower than expected
due to the stronger rand and teething problems that limited
Sasolburg production following the conversion to natural gas.
Our ammonia business is poised to improve performance on
the strength of greater plant efficiency and increased production
capacity derived from the conversion to natural gas.
Returning fertilisers to profitability
Turnover from our fertiliser business, including the phosphates
value chain, decreased marginally from R1 782 million to
R1 780 million. Our fertiliser business, however, returned to
profitability and contributed satisfactorily to operating profit.
Our fertiliser business benefited from favourable weather for
most of the Southern African summer rainfall area, as well as
increased demand from the Southern African export market.
Benefits were reaped from greater operational efficiency and
strategies to improve our overall value proposition, with renewed
focus on product quality, logistical efficiency and training of our
sales teams to improve customer service.
The 2004/2005 South African maize crop is likely to reach
12 Mt, thereby exceeding local consumption by more than 50%.
The combined impact of a drastic increase in the maize surplus
and sustained low export prices for maize is likely to constrain
planting for the 2005/2006 season. Consequently, the envisaged
lower demand for fertilisers in Southern Africa is expected to
reduce profit in the year ahead.
Maintaining momentum for explosives
Our explosives business increased turnover by 1,8% from
R1 003 to R1 021 million. Following a return to profitability
in 2004, this business posted a significant further increase in
contribution to operating profit.
Benefits were reaped from a renewed focus on the domestic
South African market and by capitalising on a global shortage of
ammonium nitrate, which saw a significant increase in export
sales of Expan™ ammonium nitrate in spite of the stronger rand.
Profitable exports of Expan™ ammonium nitrate are expected to
continue in 2006.
Sales and profits of the Sasol Dyno Nobel joint venture reached
record levels, mainly as a result of growth into niche markets.
Following the sale of the UNI Tronic™ technology and marketing
rights to Orica Explosives, along with an associated supply
agreement, our electronic detonator business posted a profit for
the first time.
Sasol Wax
Value-addition remains focus of wax portfolio
Sasol Wax's business was challenging as a result of strong
competition and higher feedstock prices in South Africa and
Europe, as well as feedstock-related production interruptions at
Sasolburg. These factors severely impacted operating profit, but
were countered by maintaining programmes to improve efficiency
and the cost base, and to increase the percentage of wax
production dedicated to higher-value niche applications.
The global wax market remains keenly contested, with supply of
many commodity paraffin-wax grades exceeding demand. In
addition, higher oil-based feedstock prices kept margins under
pressure. Sales volumes of wax and associated paraffinic products
increased by 5% from 779 900 t to 821 600 t primarily as a result
of securing new business.
Turnover increased by 5% in euros. The rand-equivalent increase
was 1%, up from R4 042 million (€493 million; US$587 million)
to R4 075 million (€516 million; US$656 million). Our
contribution to group operating profit in rand terms decreased by
22% from R270 million to R211 million.
Operational highlights for other chemical businesses
2005 2004 % change
Sasol Nitro total sales Mt 1,56 1,57 (0,4)
Sasol Wax total sales t 821 600 779 900 5
Sasol Infrachem syngas production M GJ 38,4 53,4 (28)
Merisol total sales t 103 330 108 200 (4,5)

46
Increasing demand for FT waxes
Global demand for Fischer-Tropsch (FT) waxes produced at
Sasolburg has been increasing and favourable margins are being
realised. The targeted sales volume of these speciality products
was not achieved due to the production setbacks after the
Sasolburg chemical plant converted to natural gas. We lost about
8% of our scheduled annual Sasolburg FT wax production. We
have since been restoring customer confidence, having placed
South African and international customers on limited supply.
Our German wax operations at Hamburg operated at full
capacity throughout the year and enjoyed excellent stability. The
toll-production of wax emulsions at Oslo, Norway, was ceased
and integrated with the Hamburg operations to streamline
production and reduce cost. Paramelt in the Netherlands
acquired Honeywell's wax-blending business at Eupen, Belgium,
and at Suzhou, China.
Continuing drive to increase value
Increasingly, successes are being achieved by developing new wax
applications, which are resulting in greater sales of higher-margin
speciality products. These value-adding opportunities apply to
waxes made from both oil-based feedstock outside South Africa
and gas-based feedstock in South Africa. One such opportunity is
the use of the proprietary Sasobit™ wax additive for bitumens,
which brings major advantages for road builders and related
bitumen coating applications.
New opportunities are emerging in China, through Sasol
Polymers and its Chinese joint-venture distributor, Wesco, to sell
speciality grades of polyethylene and polypropylene with FT-wax
additives. These modified grades help polymer converters to
improve both extruder energy-efficiency and the quality of their
final extruded plastic goods.
The planned wax joint venture with Total SA (France) was
abandoned for competitive reasons. In addition, the European
Union Competition Commission recently initiated an investigation
into the European paraffin wax industry, as did the competition
authorities in the USA. Sasol Wax declared at the outset that it
would cooperate with the competition authorities.
Sasol Infrachem
Rebounding from conversion setbacks
The conversion from coal gasification to natural gas reforming
at Sasolburg towards the end of the previous financial year was
completed by Sasol Infrachem when the two new autothermal
reformers were brought into commercial production. Reformer
production during the year, however, alternated between
prolonged periods of stable operations in line with
planned production and intermittent downtime to resolve
post-commissioning technical shortcomings that limited
full reformer capability.
As a result of these interruptions, turnover dropped by almost
14% from R2 329 million to R2 013 million. Gas production fell
by 28% from 53,4 million coal-based gigajoules (GJ) to
25,9 million natural gas-based GJ and 12,5 million coal-based
GJ, a total of 38,4 million GJ.
In July 2004, the coal gasification facilities were temporarily
recommissioned to support gas supply to our customers while
the complex reformer control systems were refined and feed lines
were upgraded. The coal gasification facilities were finally
decommissioned in February 2005.
In May 2005, cracks were detected in the heater piping on the
gas pre-heaters. As a safety precaution, we decommissioned
the reformers, which led to a four-week cessation of synthesis
gas (syngas) production. The reformers were recommissioned in
June 2005 and have since been operating at planned
design parameters.
We intend to increase natural gas-based gas production in the
year ahead to about 35,4 million GJ in line with projected
demand from the other Sasol businesses that require syngas.
Reducing emissions to air
The envisaged environmental benefits of converting from coal to
natural gas are being realised and audited results of the Sasolburg
plant's substantial reduction in emissions to air (including
hydrogen sulphide, carbon dioxide, nitrous oxides and volatile
other chemical businesses
The Sasol Wax plant at Hamburg in northern Germany. Sasol Infrachem employees working on a Sasolburg autothermal reformer.
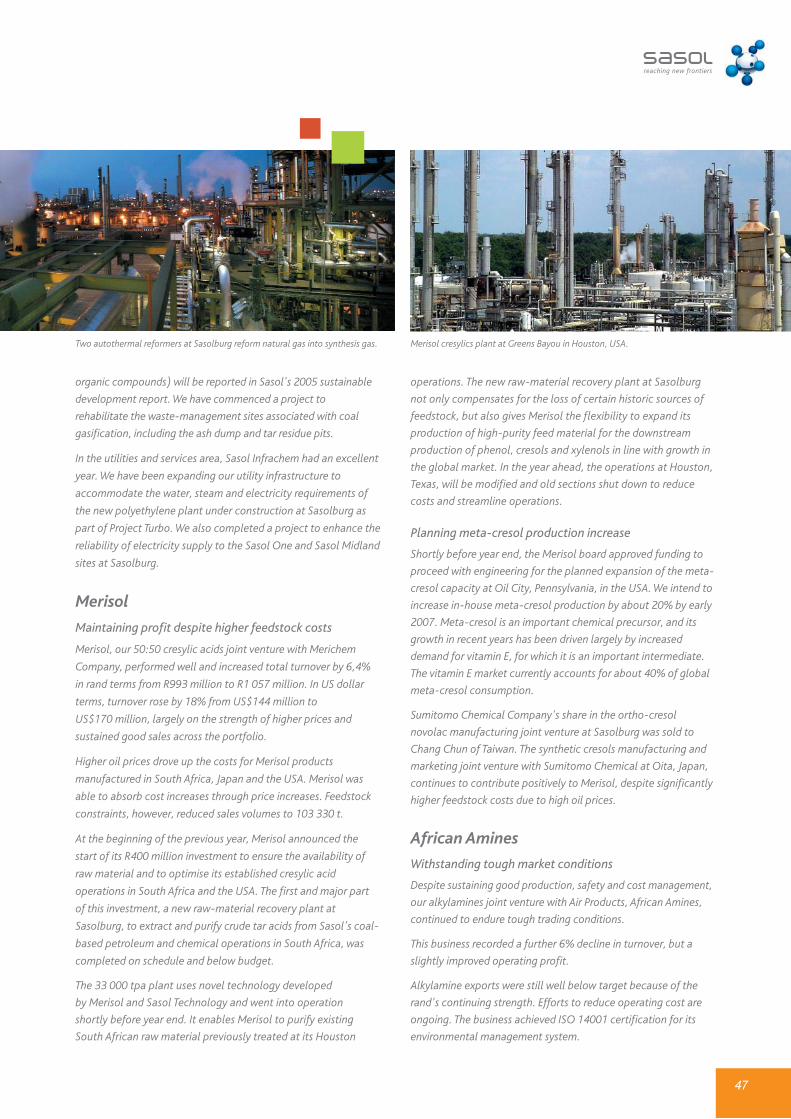
47
organic compounds) will be reported in Sasol's 2005 sustainable
development report. We have commenced a project to
rehabilitate the waste-management sites associated with coal
gasification, including the ash dump and tar residue pits.
In the utilities and services area, Sasol Infrachem had an excellent
year. We have been expanding our utility infrastructure to
accommodate the water, steam and electricity requirements of
the new polyethylene plant under construction at Sasolburg as
part of Project Turbo. We also completed a project to enhance the
reliability of electricity supply to the Sasol One and Sasol Midland
sites at Sasolburg.
Merisol
Maintaining profit despite higher feedstock costs
Merisol, our 50:50 cresylic acids joint venture with Merichem
Company, performed well and increased total turnover by 6,4%
in rand terms from R993 million to R1 057 million. In US dollar
terms, turnover rose by 18% from US$144 million to
US$170 million, largely on the strength of higher prices and
sustained good sales across the portfolio.
Higher oil prices drove up the costs for Merisol products
manufactured in South Africa, Japan and the USA. Merisol was
able to absorb cost increases through price increases. Feedstock
constraints, however, reduced sales volumes to 103 330 t.
At the beginning of the previous year, Merisol announced the
start of its R400 million investment to ensure the availability of
raw material and to optimise its established cresylic acid
operations in South Africa and the USA. The first and major part
of this investment, a new raw-material recovery plant at
Sasolburg, to extract and purify crude tar acids from Sasol's coal-
based petroleum and chemical operations in South Africa, was
completed on schedule and below budget.
The 33 000 tpa plant uses novel technology developed
by Merisol and Sasol Technology and went into operation
shortly before year end. It enables Merisol to purify existing
South African raw material previously treated at its Houston
operations. The new raw-material recovery plant at Sasolburg
not only compensates for the loss of certain historic sources of
feedstock, but also gives Merisol the flexibility to expand its
production of high-purity feed material for the downstream
production of phenol, cresols and xylenols in line with growth in
the global market. In the year ahead, the operations at Houston,
Texas, will be modified and old sections shut down to reduce
costs and streamline operations.
Planning meta-cresol production increase
Shortly before year end, the Merisol board approved funding to
proceed with engineering for the planned expansion of the meta-
cresol capacity at Oil City, Pennsylvania, in the USA. We intend to
increase in-house meta-cresol production by about 20% by early
2007. Meta-cresol is an important chemical precursor, and its
growth in recent years has been driven largely by increased
demand for vitamin E, for which it is an important intermediate.
The vitamin E market currently accounts for about 40% of global
meta-cresol consumption.
Sumitomo Chemical Company's share in the ortho-cresol
novolac manufacturing joint venture at Sasolburg was sold to
Chang Chun of Taiwan. The synthetic cresols manufacturing and
marketing joint venture with Sumitomo Chemical at Oita, Japan,
continues to contribute positively to Merisol, despite significantly
higher feedstock costs due to high oil prices.
African Amines
Withstanding tough market conditions
Despite sustaining good production, safety and cost management,
our alkylamines joint venture with Air Products, African Amines,
continued to endure tough trading conditions.
This business recorded a further 6% decline in turnover, but a
slightly improved operating profit.
Alkylamine exports were still well below target because of the
rand's continuing strength. Efforts to reduce operating cost are
ongoing. The business achieved ISO 14001 certification for its
environmental management system.
Two autothermal reformers at Sasolburg reform natural gas into synthesis gas. Merisol cresylics plant at Greens Bayou in Houston, USA.
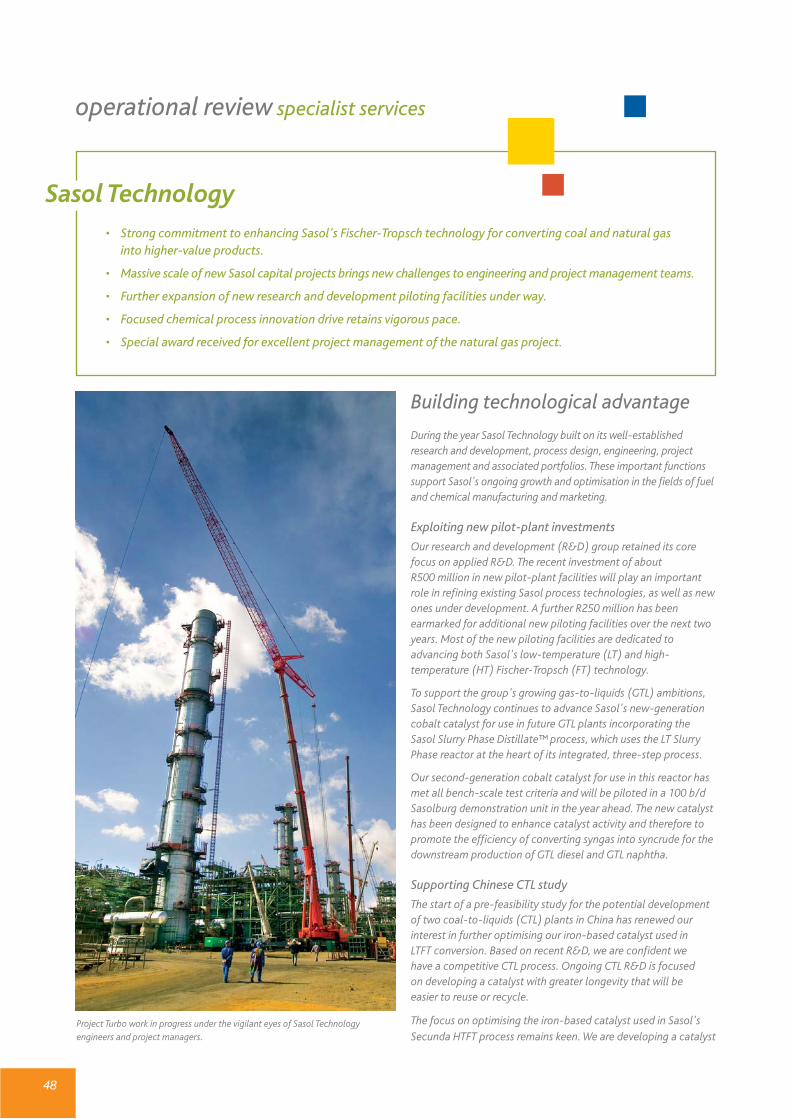
48
operational review specialist services
Building technological advantage
During the year Sasol Technology built on its well-establishedresearch and development, process design, engineering, projectmanagement and associated portfolios. These important functionssupport Sasol's ongoing growth and optimisation in the fields of fueland chemical manufacturing and marketing.
Exploiting new pilot-plant investments
Our research and development (R&D) group retained its corefocus on applied R&D. The recent investment of about R500 million in new pilot-plant facilities will play an importantrole in refining existing Sasol process technologies, as well as newones under development. A further R250 million has beenearmarked for additional new piloting facilities over the next twoyears. Most of the new piloting facilities are dedicated toadvancing both Sasol's low-temperature (LT) and high-temperature (HT) Fischer-Tropsch (FT) technology.
To support the group's growing gas-to-liquids (GTL) ambitions,Sasol Technology continues to advance Sasol's new-generationcobalt catalyst for use in future GTL plants incorporating theSasol Slurry Phase Distillate™ process, which uses the LT SlurryPhase reactor at the heart of its integrated, three-step process.
Our second-generation cobalt catalyst for use in this reactor hasmet all bench-scale test criteria and will be piloted in a 100 b/dSasolburg demonstration unit in the year ahead. The new catalysthas been designed to enhance catalyst activity and therefore topromote the efficiency of converting syngas into syncrude for thedownstream production of GTL diesel and GTL naphtha.
Supporting Chinese CTL study
The start of a pre-feasibility study for the potential developmentof two coal-to-liquids (CTL) plants in China has renewed ourinterest in further optimising our iron-based catalyst used in LTFT conversion. Based on recent R&D, we are confident we have a competitive CTL process. Ongoing CTL R&D is focused on developing a catalyst with greater longevity that will be easier to reuse or recycle.
The focus on optimising the iron-based catalyst used in Sasol'sSecunda HTFT process remains keen. We are developing a catalyst
Sasol Technology • Strong commitment to enhancing Sasol's Fischer-Tropsch technology for converting coal and natural gas
into higher-value products.
• Massive scale of new Sasol capital projects brings new challenges to engineering and project management teams.
• Further expansion of new research and development piloting facilities under way.
• Focused chemical process innovation drive retains vigorous pace.
• Special award received for excellent project management of the natural gas project.
Project Turbo work in progress under the vigilant eyes of Sasol Technologyengineers and project managers.
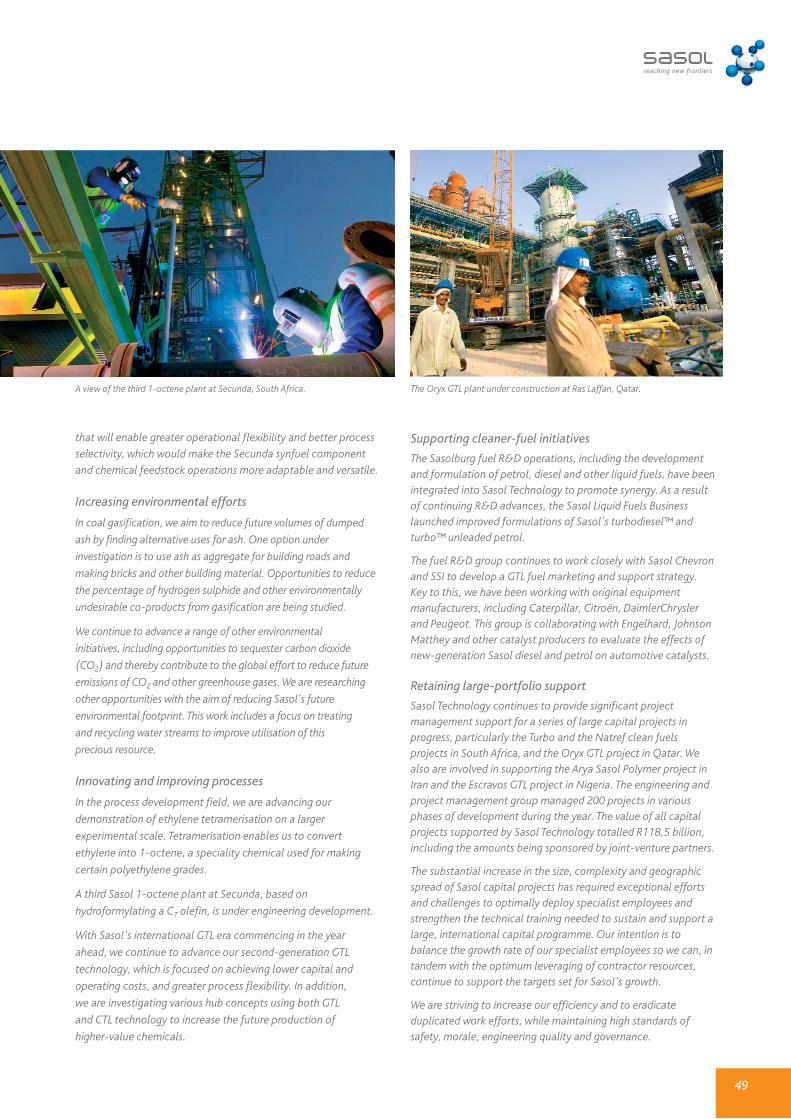
49
that will enable greater operational flexibility and better process
selectivity, which would make the Secunda synfuel component
and chemical feedstock operations more adaptable and versatile.
Increasing environmental efforts
In coal gasification, we aim to reduce future volumes of dumped
ash by finding alternative uses for ash. One option under
investigation is to use ash as aggregate for building roads and
making bricks and other building material. Opportunities to reduce
the percentage of hydrogen sulphide and other environmentally
undesirable co-products from gasification are being studied.
We continue to advance a range of other environmental
initiatives, including opportunities to sequester carbon dioxide
(CO2) and thereby contribute to the global effort to reduce future
emissions of CO2 and other greenhouse gases. We are researching
other opportunities with the aim of reducing Sasol's future
environmental footprint. This work includes a focus on treating
and recycling water streams to improve utilisation of this
precious resource.
Innovating and improving processes
In the process development field, we are advancing our
demonstration of ethylene tetramerisation on a larger
experimental scale. Tetramerisation enables us to convert
ethylene into 1-octene, a speciality chemical used for making
certain polyethylene grades.
A third Sasol 1-octene plant at Secunda, based on
hydroformylating a C7 olefin, is under engineering development.
With Sasol's international GTL era commencing in the year
ahead, we continue to advance our second-generation GTL
technology, which is focused on achieving lower capital and
operating costs, and greater process flexibility. In addition,
we are investigating various hub concepts using both GTL
and CTL technology to increase the future production of
higher-value chemicals.
Supporting cleaner-fuel initiatives
The Sasolburg fuel R&D operations, including the developmentand formulation of petrol, diesel and other liquid fuels, have beenintegrated into Sasol Technology to promote synergy. As a resultof continuing R&D advances, the Sasol Liquid Fuels Businesslaunched improved formulations of Sasol's turbodiesel™ andturbo™ unleaded petrol.
The fuel R&D group continues to work closely with Sasol Chevronand SSI to develop a GTL fuel marketing and support strategy.Key to this, we have been working with original equipmentmanufacturers, including Caterpillar, Citroën, DaimlerChryslerand Peugeot. This group is collaborating with Engelhard, JohnsonMatthey and other catalyst producers to evaluate the effects ofnew-generation Sasol diesel and petrol on automotive catalysts.
Retaining large-portfolio support
Sasol Technology continues to provide significant projectmanagement support for a series of large capital projects inprogress, particularly the Turbo and the Natref clean fuelsprojects in South Africa, and the Oryx GTL project in Qatar. Wealso are involved in supporting the Arya Sasol Polymer project inIran and the Escravos GTL project in Nigeria. The engineering andproject management group managed 200 projects in variousphases of development during the year. The value of all capitalprojects supported by Sasol Technology totalled R118,5 billion,including the amounts being sponsored by joint-venture partners.
The substantial increase in the size, complexity and geographicspread of Sasol capital projects has required exceptional effortsand challenges to optimally deploy specialist employees andstrengthen the technical training needed to sustain and support alarge, international capital programme. Our intention is tobalance the growth rate of our specialist employees so we can, intandem with the optimum leveraging of contractor resources,continue to support the targets set for Sasol's growth.
We are striving to increase our efficiency and to eradicateduplicated work efforts, while maintaining high standards ofsafety, morale, engineering quality and governance.
A view of the third 1-octene plant at Secunda, South Africa. The Oryx GTL plant under construction at Ras Laffan, Qatar.

50
operational review specialist services
Structuring complex deals andcreating value
Sasol Financing – comprising Sasol Financing (Pty) Limited at
Johannesburg and Sasol Financing International plc on the Isle
of Man – continues to fulfil an important strategic role in
optimising the group's treasury, hedging and specialised
financing requirements to support our strategic growth
drivers, particularly our major new investments to expand
our gas-to-liquids (GTL) and international chemical ventures.
Saving costs through centralisation
The in-house bank continues to achieve significant savings on cash
pooling, cost-effective financing, foreign-exchange management
and other treasury-related activities. Sasol Financing proactively
manages Sasol's liquidity risk by establishing appropriate
financing structures and credit lines, both committed and
uncommitted, and ensures a sound mix of funding, both
offshore and domestic, as well as long- and short-term.
Central financing sources include offshore and domestic
corporate bond issues, offshore revolving credit facilities,
long- and short-term bank loans and issuing commercial
paper. We also ensure, at a group level, that a sound balance is
maintained between floating and fixed interest rates. This is done
by evaluating different funding requirements (treasury funding,
subsidiary debt and project debt) in terms of risk tolerance and
repayment profiles and entering into appropriate fixed-interest-
rate funding (such as corporate bond issues) and/or derivative
instruments (interest rate swaps or options).
In one of the major activities undertaken in this respect,
we helped Oryx GTL (QSC) to conclude a three-year
interest-rate swap for US$200 million (about 50% of
outstanding debt) at a fixed rate of 3,78%.
Sasol Financing • Revolving credit facility of €400 million refinanced at substantially improved terms and conditions.
• Debut €300 million Eurobond successfully issued in European capital markets.
• First South African credit ratings awarded to Sasol by Moody's Investors' Services at Aa3.za long-term andPrime-1.za short term.
• Early repayment of Sasol Chemie external financing facilities, resulting in release of assets held as security and saving on interest expense.
• Assisted in implementing a fixed interest rate hedge of US$200 million for three years for Oryx GTL.
The Oryx GTL plant is one of the group's major new investments beingexecuted with expert support from Sasol Financing.

51
In addition, in our role as the custodian of group financial-
market risk management, we ensure appropriate governing
policies are in place for managing and hedging commodity price
and currency risk, and we also supply risk management advice
and hedging implementation support to Sasol subsidiaries and
joint ventures.
Sasol Financing also advised on the updating of Sasol's hedging
policies for commodity-price risk and currency risk, and assisted
Sasol Synfuels in executing a strategic hedge on about 30% of its
2005/06 synthetic fuel revenues. The hedging was executed by
utilising zero cost collars, in terms of which Sasol will obtain a
minimum of US$45,00/barrel (b) of oil, and a maximum of
US$82,61/b, for 45 000 b/day of oil for the 2006 financial year.
In March 2005, Sasol received the 2004 African oil and gas deal
of the year from Project Finance magazine for financing the
Mozambique-to-South Africa natural gas pipeline project.
Achieving higher credit rating and standing
Working with Standard & Poor's and Moody's Investors' Services
(Moody's), we are responsible for overseeing Sasol's corporate
credit rating. In May 2005, the international rating agency,
Moody's, awarded Sasol the highest possible short-term South
African rating of Prime-1.za, and a long-term South African credit
rating of Aa3.za. These ratings confirm Sasol's long-standing
position of strength in the South African debt and capital markets
and benefited the group's cost of funding.
In June 2005, in anticipation of our debut Eurobond issue,
Moody's assigned global long-term Baa1 and short-term Prime-2
ratings to Sasol. The outlook for Sasol was put at “stable”. The
Baa1 rating is commensurate with Standard & Poor's long-term
foreign-currency rating, which was upgraded to BBB+ in August
2005. These ratings underscore the group's commitment to
maintaining a prudent financial strategy, conservative gearing
and a strong balance sheet.
The Moody's and Standard & Poor's ratings are comprehensive
and continue to provide investors and lenders globally with a
relevant and improving benchmark of Sasol's credit quality.
Mandating a new revolving credit facility
In May 2005, we announced that the group had concluded a
€400 million syndicated multicurrency revolving credit facility.
Calyon and Dresdner Kleinwort Wasserstein acted as mandated
lead arrangers and bookrunners, and the latter bank also acts
as documentation agent. Dresdner Bank Luxembourg is the
facility agent.
This facility has a tenor of three years, as well as two one-year
extensions, and carries a margin of 0,325% a year. This facility –
established at much better terms, conditions and margins than
the existing Sasol US$375 million syndicated revolving credit
facility concluded in October 2003 – is being used to refinance
the existing facility and for general corporate financing needs.
Issuing of successful debut Eurobond
In June 2005, Sasol raised €300 million from its debut Eurobond
issue at a fixed-interest coupon of 3,375%. The bond was well
received by a geographically diverse investor base and will mature
in June 2010.
The bond assists greatly in diversifying and extending the average
tenor of Sasol's debt portfolio and lowers our exposure to
floating-interest-rate risk. ABN Amro and Dresdner Kleinwort
Wasserstein were the joint lead managers in the transaction,
which was oversubscribed sixfold.
Innovating financing solutions
We also add financing value to Sasol's businesses and joint
ventures. We continued to assist the Arya Sasol Polymer Company
joint venture in Iran with its financing in a complex environment.
We assisted the process to early repay Sasol Chemie's external
asset-based financing facilities of about US$650 million, which
was incurred at the time of acquiring Condea from RWE-DEA in
2001. This resulted in the release of more than €1,4 billion assets
held as security and has saved on interest expense.
In addition, we are assisting the financing arrangements for Sasol's
black economic empowerment partners set to acquire a 12,5%
interest in the planned Uhambo Oil joint venture with Petronas.
Major Sasol capital projects under way in South Africa, the Middle East and Europe are being financed optimally with the help of Sasol Financing.
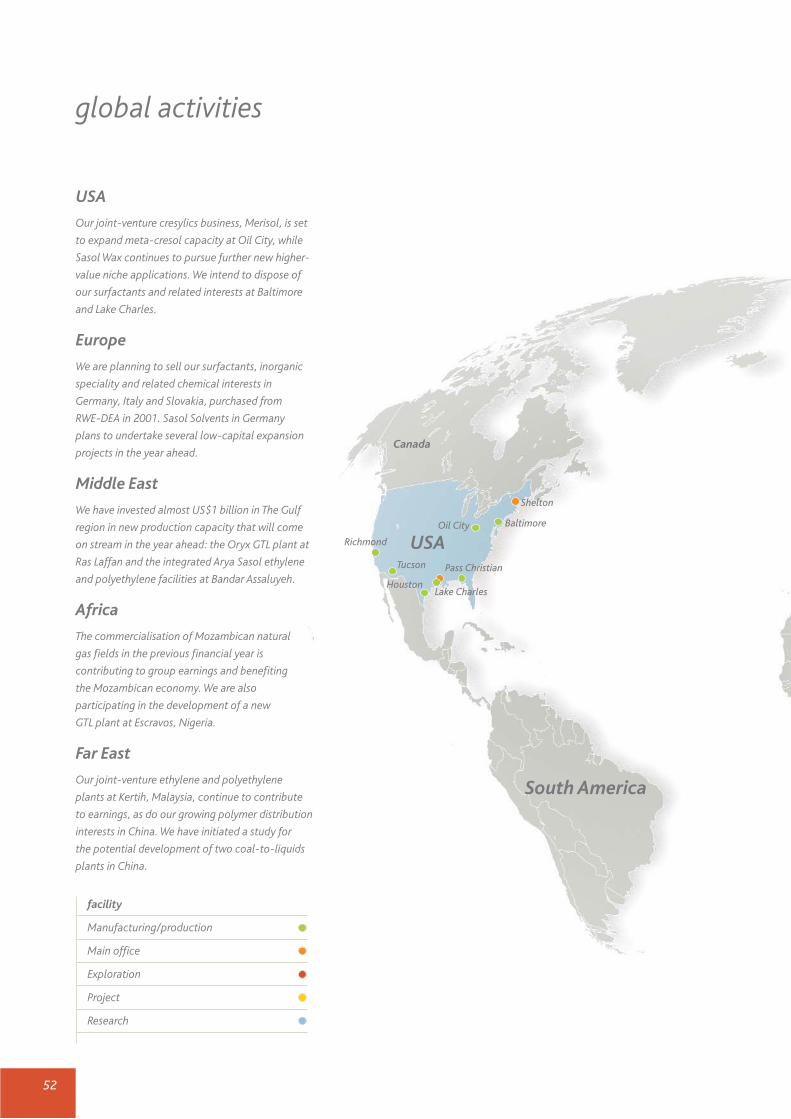
52
global activities
Baltimore
Pass Christian
Lake CharlesHouston
Richmond
Tucson
Canada
USA
South America
Shelton
Oil City
facility
Manufacturing/production
Main office
Exploration
Project
Research
USA
Our joint-venture cresylics business, Merisol, is set
to expand meta-cresol capacity at Oil City, while
Sasol Wax continues to pursue further new higher-
value niche applications. We intend to dispose of
our surfactants and related interests at Baltimore
and Lake Charles.
Europe
We are planning to sell our surfactants, inorganic
speciality and related chemical interests in
Germany, Italy and Slovakia, purchased from
RWE-DEA in 2001. Sasol Solvents in Germany
plans to undertake several low-capital expansion
projects in the year ahead.
Middle East
We have invested almost US$1 billion in The Gulf
region in new production capacity that will come
on stream in the year ahead: the Oryx GTL plant at
Ras Laffan and the integrated Arya Sasol ethylene
and polyethylene facilities at Bandar Assaluyeh.
Africa
The commercialisation of Mozambican natural
gas fields in the previous financial year is
contributing to group earnings and benefiting
the Mozambican economy. We are also
participating in the development of a new
GTL plant at Escravos, Nigeria.
Far East
Our joint-venture ethylene and polyethylene
plants at Kertih, Malaysia, continue to contribute
to earnings, as do our growing polymer distribution
interests in China. We have initiated a study for
the potential development of two coal-to-liquids
plants in China.
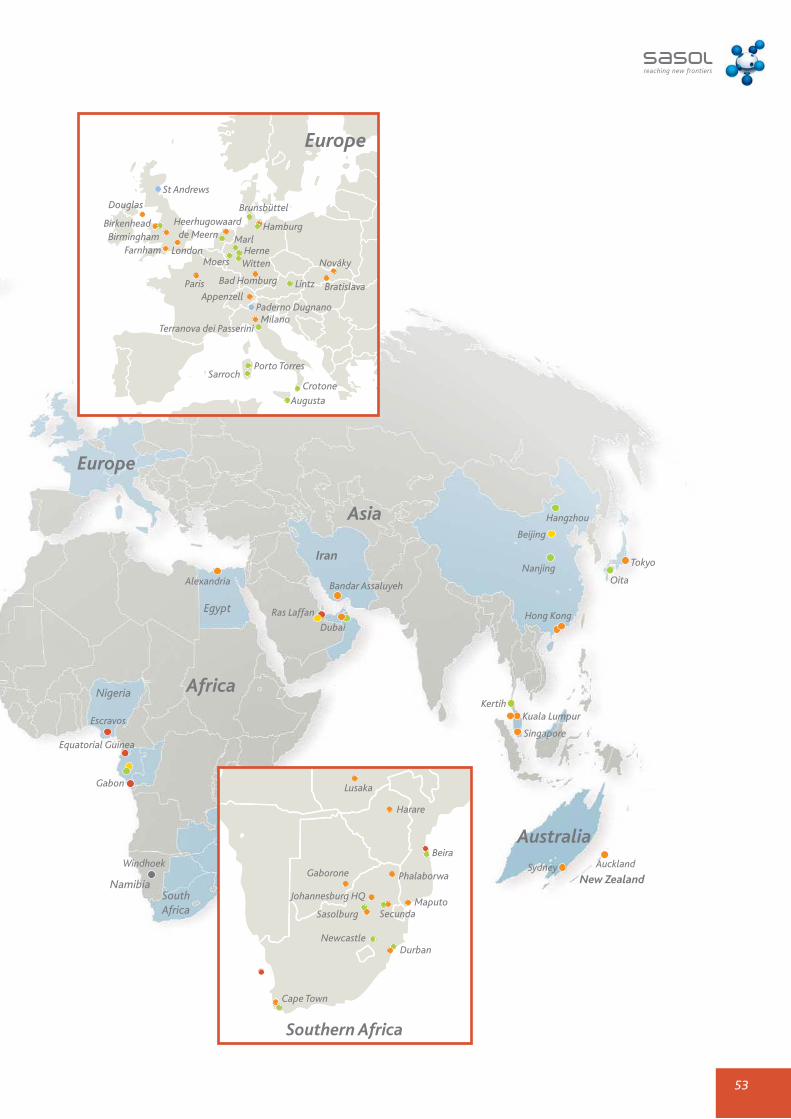
53
Nigeria
Egypt
SouthAfrica
Namibia
Escravos
Equatorial Guinea
Gabon
Africa
Europe
Iran
Asia
Bandar Assaluyeh
Dubai
Ras Laffan
Alexandria
Windhoek
Hangzhou
Beijing
NanjingOita
Tokyo
Hong Kong
KertihKuala Lumpur
Singapore
Sydney Auckland
Australia
New Zealand
Southern Africa
Lusaka
Beira
Cape Town
DurbanNewcastle
Secunda
Phalaborwa
Johannesburg HQ
Gaborone
SasolburgMaputo
Harare
Europe
Douglas
St Andrews
Birkenhead HamburgMarl
HeerhugowaardBrunsbüttel
de Meern
Terranova dei Passerini
Lintz Bratislava
Nováky
Crotone
MilanoPaderno Dugnano
Appenzell
Bad Homburg
HerneWitten
Porto TorresSarroch
London
Paris
FarnhamMoers
Birmingham
Augusta

54
sustainable development review
Principal achievements
• New group-wide targets set to improve sustainability performance.
• Signing of safety charter with South African trade unions.
• New investments bring economic benefits to Africa and the Middle East.
• Successful rollout in South Africa of the Sasol HIV/Aids Response Programme.
• Continuing reductions in reported emissions of atmospheric pollutants.
• Strong social investment programme maintained.
Principal disappointments
• Seventeen work-related fatalities.
• Unacceptable number of safety incidents in South Africa.
• Slow progress in achieving employment equity objectives at the most senior
management levels of our South African activities.
Creating critical mass for better corporate citizenship
Our sustainable development commitment includes building open and constructive relations with different communities and other stakeholder groups.
55
Sustainable development commitment
Introduction
Evolving towards international best practice
Since publicly committing to sustainable development in 2000,
Sasol has been evolving the management framework needed to
provide our businesses with the policies, governance structures,
targets and reporting systems to manage the risks and
opportunities associated with improving our economic, social
and environmental performance.
Our commitment to sustainable development is intrinsic to our
vision and values, and is integral to our status as a public
company listed on the JSE Limited (JSE) in Johannesburg and the
New York Stock Exchange (NYSE). We believe effective
sustainability practices yield a valuable competitive advantage.
They enhance the reputation of our business; contribute to our
goal of being a company of choice; and result in improved
longer-term business performance.
Acting on our commitment
Our sustainable development commitment is expressed through
international programmes aimed at:
• maintaining sound governance and risk management practices;
• complying with the laws of the countries in which we operate;
• building open and constructive stakeholder relations;
• improving employee skills through training and development;
• promoting sound occupational health and safety practices and
minimising workplace accidents;
• recruiting and rewarding employees on merit with regard for
human rights and fair labour practices;
• improving process safety and reducing risks associated with
operating mining machinery and petrochemical plants;
• educating employees on the risks of contracting Aids and life-
threatening diseases, and, where necessary, providing them
with managed healthcare, including free antiretroviral
treatment in the case of HIV-positive employees;
• promoting black economic empowerment (BEE) in South
Africa to benefit people from historically disadvantaged
groups;
• adding economic value to the coal, crude oil, natural gas and
chemical feedstocks we beneficiate;
• decreasing our environmental footprint by striving to reduce
emissions, waste and the consumption of water and energy per
unit of production;
• developing and manufacturing products with regard for the
needs of customers, consumers and the environment; and
• sustaining social investments, particularly in under-resourced
South African and Mozambican communities.
We have evolved a corporate sustainable development management
framework to manage these programmes and ensure we pursue
continuous improvement in line with global best practice.
Management framework
Managing a global structure
Sasol's sustainable development management framework covers
our international construction, exploration, production and
marketing operations throughout the 30 countries in which we
operate in Africa, Asia, Europe, the Americas and Australasia (see
map on page 52).
Our global group commitment to corporate citizenship or
sustainable development is managed at corporate level and
implemented at business level, with ultimate responsibility
residing with the board of directors. The board has specialised
committees to help it to fulfil its fiduciary duties. One of these is
the risk, safety, health and environment committee (see
corporate governance overview on page 74).
The group executive committee (GEC), chaired by our chief
executive, maintains primary responsibility for the effective daily
management of group-wide sustainability. The GEC receives
valuable strategic and operational-specific inputs from all
businesses, as well as from specialised committees and two group
forums that meet quarterly. These are the:
• group risk management forum, which oversees the risk profile
of our global operations; and
• group safety, health and environment (SH&E) and sustainable
development (SD) forum, which reviews performance, and
considers and approves recommendations on sustainable
development and SH&E guidelines and policy.
The Sasol safety, health and environmental centre (SH&E
centre), based at our Johannesburg head office, oversees group-
wide sustainability and SH&E management. The centre is
responsible for global SH&E and sustainable development
direction, policy, review and governance. It also provides
specialist advice and support services to our businesses.
In a new development, our new chief executive, Pat Davies,
became the group's first chief SH&E officer on 1 July 2005.
He intends to play a significant leadership role in promoting
our safety charter and safety improvement plan, among other
sustainability challenges.
Refining risk management
We have developed a systemic approach towards managing
sustainability risks throughout Sasol. During the year, we further
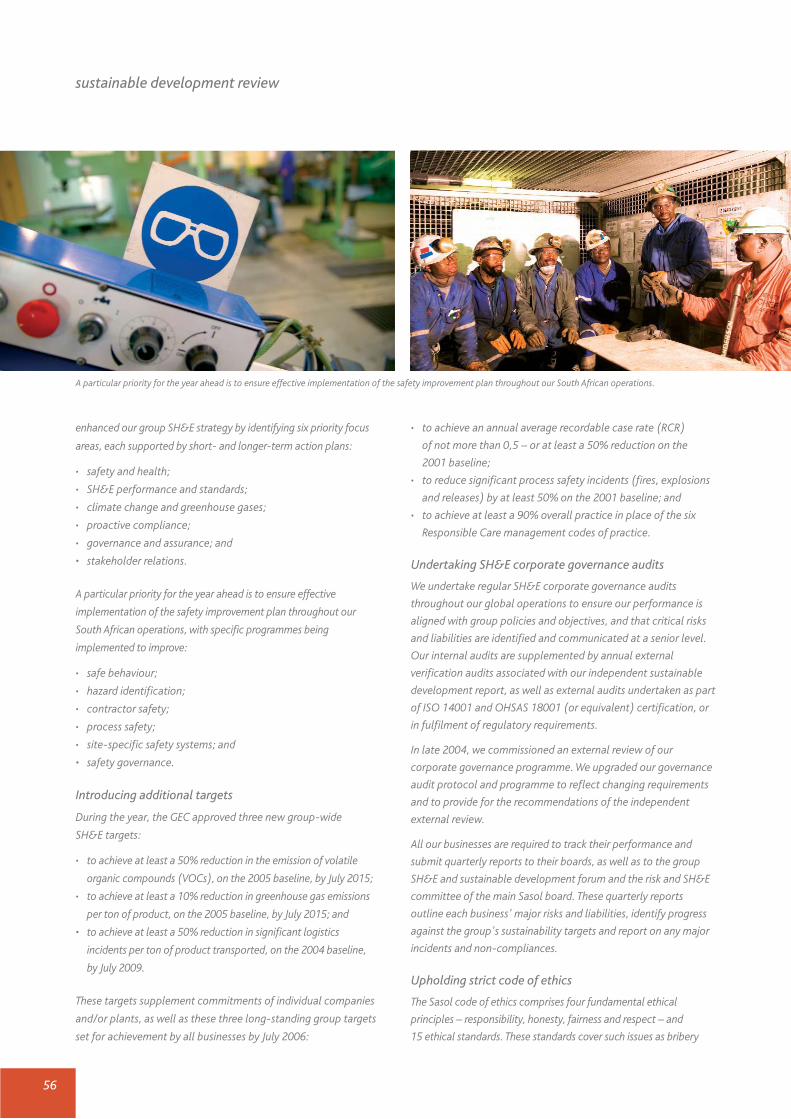
56
enhanced our group SH&E strategy by identifying six priority focus
areas, each supported by short- and longer-term action plans:
• safety and health;
• SH&E performance and standards;
• climate change and greenhouse gases;
• proactive compliance;
• governance and assurance; and
• stakeholder relations.
A particular priority for the year ahead is to ensure effective
implementation of the safety improvement plan throughout our
South African operations, with specific programmes being
implemented to improve:
• safe behaviour;
• hazard identification;
• contractor safety;
• process safety;
• site-specific safety systems; and
• safety governance.
Introducing additional targets
During the year, the GEC approved three new group-wide
SH&E targets:
• to achieve at least a 50% reduction in the emission of volatile
organic compounds (VOCs), on the 2005 baseline, by July 2015;
• to achieve at least a 10% reduction in greenhouse gas emissions
per ton of product, on the 2005 baseline, by July 2015; and
• to achieve at least a 50% reduction in significant logistics
incidents per ton of product transported, on the 2004 baseline,
by July 2009.
These targets supplement commitments of individual companies
and/or plants, as well as these three long-standing group targets
set for achievement by all businesses by July 2006:
• to achieve an annual average recordable case rate (RCR)
of not more than 0,5 – or at least a 50% reduction on the
2001 baseline;
• to reduce significant process safety incidents (fires, explosions
and releases) by at least 50% on the 2001 baseline; and
• to achieve at least a 90% overall practice in place of the six
Responsible Care management codes of practice.
Undertaking SH&E corporate governance audits
We undertake regular SH&E corporate governance audits
throughout our global operations to ensure our performance is
aligned with group policies and objectives, and that critical risks
and liabilities are identified and communicated at a senior level.
Our internal audits are supplemented by annual external
verification audits associated with our independent sustainable
development report, as well as external audits undertaken as part
of ISO 14001 and OHSAS 18001 (or equivalent) certification, or
in fulfilment of regulatory requirements.
In late 2004, we commissioned an external review of our
corporate governance programme. We upgraded our governance
audit protocol and programme to reflect changing requirements
and to provide for the recommendations of the independent
external review.
All our businesses are required to track their performance and
submit quarterly reports to their boards, as well as to the group
SH&E and sustainable development forum and the risk and SH&E
committee of the main Sasol board. These quarterly reports
outline each business' major risks and liabilities, identify progress
against the group's sustainability targets and report on any major
incidents and non-compliances.
Upholding strict code of ethics
The Sasol code of ethics comprises four fundamental ethical
principles – responsibility, honesty, fairness and respect – and
15 ethical standards. These standards cover such issues as bribery
sustainable development review
A particular priority for the year ahead is to ensure effective implementation of the safety improvement plan throughout our South African operations.
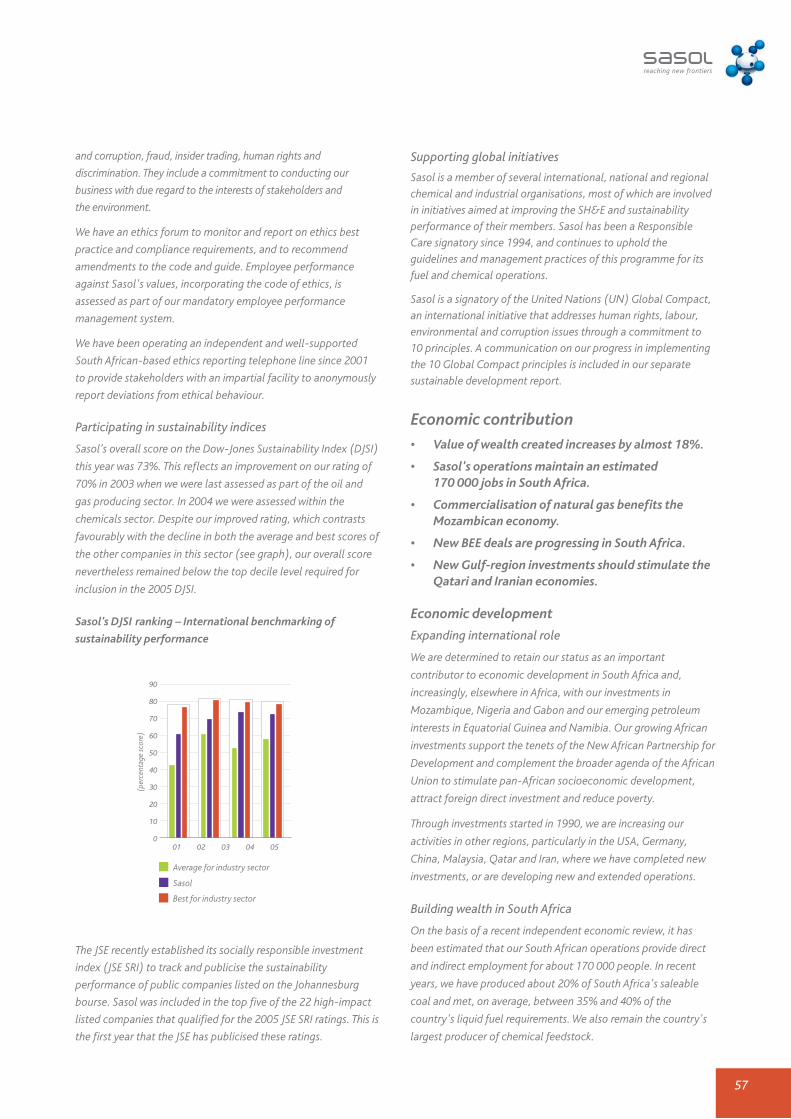
57
and corruption, fraud, insider trading, human rights and
discrimination. They include a commitment to conducting our
business with due regard to the interests of stakeholders and
the environment.
We have an ethics forum to monitor and report on ethics best
practice and compliance requirements, and to recommend
amendments to the code and guide. Employee performance
against Sasol's values, incorporating the code of ethics, is
assessed as part of our mandatory employee performance
management system.
We have been operating an independent and well-supported
South African-based ethics reporting telephone line since 2001
to provide stakeholders with an impartial facility to anonymously
report deviations from ethical behaviour.
Participating in sustainability indices
Sasol’s overall score on the Dow-Jones Sustainability Index (DJSI)
this year was 73%. This reflects an improvement on our rating of
70% in 2003 when we were last assessed as part of the oil and
gas producing sector. In 2004 we were assessed within the
chemicals sector. Despite our improved rating, which contrasts
favourably with the decline in both the average and best scores of
the other companies in this sector (see graph), our overall score
nevertheless remained below the top decile level required for
inclusion in the 2005 DJSI.
Sasol’s DJSI ranking – International benchmarking of
sustainability performance
The JSE recently established its socially responsible investment
index (JSE SRI) to track and publicise the sustainability
performance of public companies listed on the Johannesburg
bourse. Sasol was included in the top five of the 22 high-impact
listed companies that qualified for the 2005 JSE SRI ratings. This is
the first year that the JSE has publicised these ratings.
Supporting global initiatives
Sasol is a member of several international, national and regional
chemical and industrial organisations, most of which are involved
in initiatives aimed at improving the SH&E and sustainability
performance of their members. Sasol has been a Responsible
Care signatory since 1994, and continues to uphold the
guidelines and management practices of this programme for its
fuel and chemical operations.
Sasol is a signatory of the United Nations (UN) Global Compact,
an international initiative that addresses human rights, labour,
environmental and corruption issues through a commitment to
10 principles. A communication on our progress in implementing
the 10 Global Compact principles is included in our separate
sustainable development report.
Economic contribution
• Value of wealth created increases by almost 18%.
• Sasol's operations maintain an estimated 170 000 jobs in South Africa.
• Commercialisation of natural gas benefits theMozambican economy.
• New BEE deals are progressing in South Africa.
• New Gulf-region investments should stimulate theQatari and Iranian economies.
Economic development
Expanding international role
We are determined to retain our status as an important
contributor to economic development in South Africa and,
increasingly, elsewhere in Africa, with our investments in
Mozambique, Nigeria and Gabon and our emerging petroleum
interests in Equatorial Guinea and Namibia. Our growing African
investments support the tenets of the New African Partnership for
Development and complement the broader agenda of the African
Union to stimulate pan-African socioeconomic development,
attract foreign direct investment and reduce poverty.
Through investments started in 1990, we are increasing our
activities in other regions, particularly in the USA, Germany,
China, Malaysia, Qatar and Iran, where we have completed new
investments, or are developing new and extended operations.
Building wealth in South Africa
On the basis of a recent independent economic review, it has
been estimated that our South African operations provide direct
and indirect employment for about 170 000 people. In recent
years, we have produced about 20% of South Africa's saleable
coal and met, on average, between 35% and 40% of the
country's liquid fuel requirements. We also remain the country's
largest producer of chemical feedstock.
01 02 03 04 05
90
80
70
60
50
40
30
20
10
0
(per
cent
age
scor
e)
Average for industry sector
Sasol
Best for industry sector
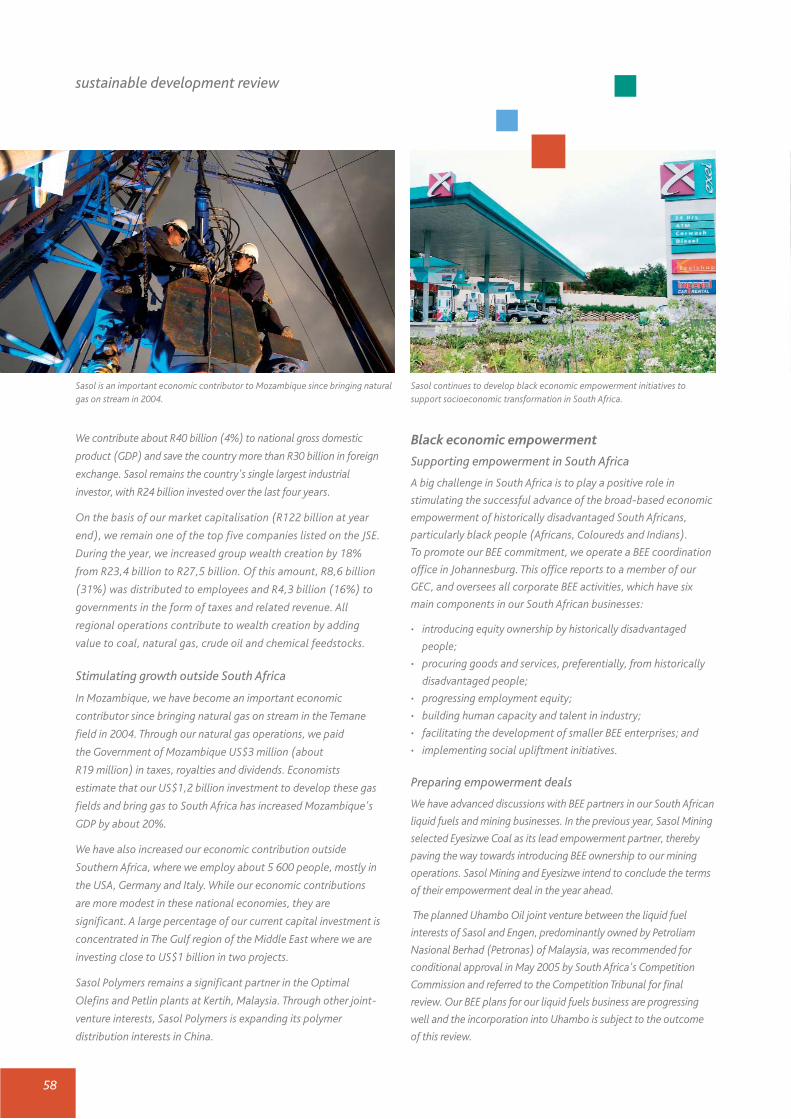
58
We contribute about R40 billion (4%) to national gross domestic
product (GDP) and save the country more than R30 billion in foreign
exchange. Sasol remains the country's single largest industrial
investor, with R24 billion invested over the last four years.
On the basis of our market capitalisation (R122 billion at year
end), we remain one of the top five companies listed on the JSE.
During the year, we increased group wealth creation by 18%
from R23,4 billion to R27,5 billion. Of this amount, R8,6 billion
(31%) was distributed to employees and R4,3 billion (16%) to
governments in the form of taxes and related revenue. All
regional operations contribute to wealth creation by adding
value to coal, natural gas, crude oil and chemical feedstocks.
Stimulating growth outside South Africa
In Mozambique, we have become an important economic
contributor since bringing natural gas on stream in the Temane
field in 2004. Through our natural gas operations, we paid
the Government of Mozambique US$3 million (about
R19 million) in taxes, royalties and dividends. Economists
estimate that our US$1,2 billion investment to develop these gas
fields and bring gas to South Africa has increased Mozambique's
GDP by about 20%.
We have also increased our economic contribution outside
Southern Africa, where we employ about 5 600 people, mostly in
the USA, Germany and Italy. While our economic contributions
are more modest in these national economies, they are
significant. A large percentage of our current capital investment is
concentrated in The Gulf region of the Middle East where we are
investing close to US$1 billion in two projects.
Sasol Polymers remains a significant partner in the Optimal
Olefins and Petlin plants at Kertih, Malaysia. Through other joint-
venture interests, Sasol Polymers is expanding its polymer
distribution interests in China.
Black economic empowerment
Supporting empowerment in South Africa
A big challenge in South Africa is to play a positive role in
stimulating the successful advance of the broad-based economic
empowerment of historically disadvantaged South Africans,
particularly black people (Africans, Coloureds and Indians).
To promote our BEE commitment, we operate a BEE coordination
office in Johannesburg. This office reports to a member of our
GEC, and oversees all corporate BEE activities, which have six
main components in our South African businesses:
• introducing equity ownership by historically disadvantaged
people;
• procuring goods and services, preferentially, from historically
disadvantaged people;
• progressing employment equity;
• building human capacity and talent in industry;
• facilitating the development of smaller BEE enterprises; and
• implementing social upliftment initiatives.
Preparing empowerment deals
We have advanced discussions with BEE partners in our South African
liquid fuels and mining businesses. In the previous year, Sasol Mining
selected Eyesizwe Coal as its lead empowerment partner, thereby
paving the way towards introducing BEE ownership to our mining
operations. Sasol Mining and Eyesizwe intend to conclude the terms
of their empowerment deal in the year ahead.
The planned Uhambo Oil joint venture between the liquid fuel
interests of Sasol and Engen, predominantly owned by Petroliam
Nasional Berhad (Petronas) of Malaysia, was recommended for
conditional approval in May 2005 by South Africa's Competition
Commission and referred to the Competition Tribunal for final
review. Our BEE plans for our liquid fuels business are progressing
well and the incorporation into Uhambo is subject to the outcome
of this review.
sustainable development review
Sasol is an important economic contributor to Mozambique since bringing naturalgas on stream in 2004.
Sasol continues to develop black economic empowerment initiatives tosupport socioeconomic transformation in South Africa.

59
Should the Uhambo deal proceed, Petronas and Sasol will partner
with their two BEE groups, Worldwide African Investment Holdings
and Tshwarisano LFB Investment, respectively, to create South
Africa's largest liquid fuel business. BEE partners would own 25% of
Uhambo. If the Uhambo deal does not proceed, then Tshwarisano
will take a 25% equity position in Sasol’s Liquid Fuels Business.
Sasol Gas and its empowerment partner, Coal Energy & Power
Resources, continue to operate their successful 49:51 joint venture
at Durban, Spring Lights Gas. Sasol Gas is seeking other
empowerment joint ventures, subject to opportunities to create
new regional gas markets and find BEE partners. In addition, DPI
Plastics, a joint venture between Sasol Polymers and Group Five,
maintains seven BEE joint ventures to market and sell plastic piping.
Promoting employee diversity
We continue to increase the percentage of employees drawn from
historically disadvantaged groups in line with South Africa's
Employment Equity Act. People from designated groups – Africans,
Coloureds and Indians, women and people with disabilities –
comprise almost 65% of our South African workforce.
At year end, people from designated groups held 39,2% of our
South African managerial, professional and supervisory posts. This
compares with a target of 40% that we set for ourselves some years
ago. We intend to increase this figure to 50% in the medium term.
We award more than 62% of our undergraduate bursaries to
students from historically disadvantaged groups. More than 50% of
future appointments of trainee artisans will be allocated to people
from designated groups.
Shortly after year end, we announced the appointment of
Ms Nolitha Fakude as an executive director as part of a drive to
appoint more black people to the higher levels of group
management, including the GEC. We intend to make additional
senior black appointments in the year ahead.
Expanding BEE procurement
Our independently reviewed procurement spend with BEE
suppliers increased by 65% to R2 473 million. We intend to
increase this amount in the year ahead.
Social performance
• Safety charter and improvement plan launched in
response to an unacceptable increase in safety
incidents and 17 work-related fatalities.
• Sasol North America and Sasol Germany attained
world-class safety performances.
• More than R170 million invested in developing
employee skills.
• More than 80% of South African employees have
undergone voluntary HIV testing.
• Social investment continues to emphasise the need
for advancing socioeconomic development in
Southern Africa by building human capacity.
Occupational health and safety
Targeting zero fatalities
It is with deep regret that seven employees and 10 contractors
were fatally injured in workplace incidents. This includes the
10 people who died in an explosion at our Secunda ethylene
plant in September 2004. Any work-related fatality in the group
is unacceptable, and this figure is of particular concern. This
compares with five workplace fatalities in the previous year and
10 in our 2003 financial year. Our goal remains zero fatalities.
We have since intensified our safety management programmes to
attain our goal of zero fatalities. In November 2004, Sasol appointed
DuPont Safety Resources to perform a comprehensive safety review
of our South African operations. In the interests of transparency, the
findings of this review have been posted on our website.
Ongoing employee skills and safety training and personal development are integral to Sasol's pursuit of good corporate citizenship.

60
We are acting on the DuPont Safety Resources recommendations,
which are based on improving the safety culture of our South African
operations. This commitment is encapsulated in the Sasol safety
improvement plan, which covers key elements of safe behaviour,
contractor safety, process safety and many other specific issues. In
addition, all businesses have implemented their own site-specific
safety plans, the progress of which is monitored by their boards.
We have embarked on a comprehensive change-management
programme to ensure the sustainability of these efforts
throughout our South African operations. Key to this
commitment, Sasol and three trade unions recently unveiled a
safety charter, details of which are available on our website. This
charter – believed to be a world first – was developed in close
consultation with these unions and demonstrates our common
goal of making safety the first priority of everyone at Sasol.
As a focal point for these efforts, Sasol has revised its shared
values to emphasise safety as one of the group's six core values.
Improving our recordable case rate
We have significantly refocused our efforts to drive down the
group injury rate, which we track as the RCR. An RCR is the
number of fatalities, lost workdays and medical treatments
beyond first-aid cases for every 200 000 employee hours worked.
We have set an interim target of halving our worldwide RCR to
0,5 by June 2006 (a maximum of one case for every 400 000
employee hours). An RCR of 0,5 is considered to be in line with
global best practice.
An unacceptable increase in injuries was experienced in the first
half of the year, particularly at Sasol Mining and Sasol Polymers.
The group RCR increased to 1,17 compared with 1,03 and 1,34 in
financial 2004 and 2003, respectively. We have taken significant
steps to address this poor safety performance.
There have been some early encouraging signs of improved
performance. Sasol Mining, for the first time, achieved five
million employee hours without a lost workday case and, by mid-
2005, had reported working eight million employee hours
without a lost workday case. In April 2004, the Sasol North
America operations at Lake Charles, Louisiana, achieved one
continuous year of operations without a recordable injury.
Progressing process safety management
Ensuring the effective management of the risk of fires, explosions
and releases of hazardous substances is critical to our business.
We achieved further progress in implementing the recently
approved process safety management system throughout our
operations, with the aim of minimising the risks of accidents and
releases of hazardous substances.
Despite these efforts, there were 25 significant fires, explosions
and releases throughout the group. We register an incident as
“significant” when it meets one of three criteria: it involves a
fatality or lost workday case; it results in damage of more than
US$25 000; or it causes a release of the relevant substance’s
US OSHA threshold quantity. It is nevertheless pleasing that this
represents a 37,5% reduction on the level of our 2001 financial
year, and constitutes significant progress towards the SH&E
target of a 50% improvement on 2001 levels by July 2006.
Human resource management
Maintaining a skilled and stable workforce
At year end, Sasol had about 30 000 employees. Employee
turnover was within normal ranges of between 4% and 6%.
Since our inception, we have focused on developing, maintaining
and optimising our skills base that is necessary to ensure the
ongoing productivity, safety and reliability of our global
operations. Our commitment to creating a culture of continuous
learning is evident in the structured, group-wide approach to
people development, including our 5 600 employees outside
South Africa.
sustainable development review
More than 80% of our South African employees volunteered to undergo confidentialHIV testing as part of the successful Sasol HIV/Aids Response Programme.
The implementation of a process safety management system was further advanced.
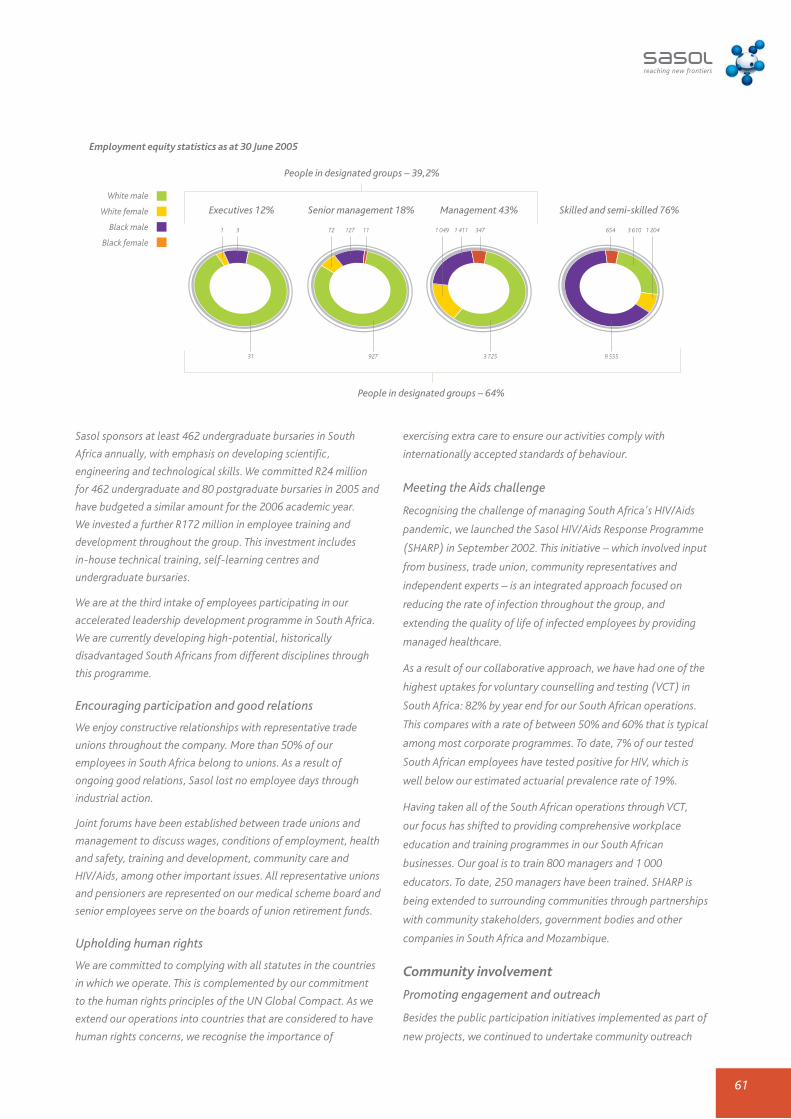
Employment equity statistics as at 30 June 2005
Executives 12% Senior management 18% Management 43% Skilled and semi-skilled 76%
People in designated groups – 39,2%
People in designated groups – 64%
White male
White female
Black male
Black female
31
1 3
3 725
1 049 1 411 347 3 610 1 204
9 555
654
927
72 127 11
61
Sasol sponsors at least 462 undergraduate bursaries in South
Africa annually, with emphasis on developing scientific,
engineering and technological skills. We committed R24 million
for 462 undergraduate and 80 postgraduate bursaries in 2005 and
have budgeted a similar amount for the 2006 academic year.
We invested a further R172 million in employee training and
development throughout the group. This investment includes
in-house technical training, self-learning centres and
undergraduate bursaries.
We are at the third intake of employees participating in our
accelerated leadership development programme in South Africa.
We are currently developing high-potential, historically
disadvantaged South Africans from different disciplines through
this programme.
Encouraging participation and good relations
We enjoy constructive relationships with representative trade
unions throughout the company. More than 50% of our
employees in South Africa belong to unions. As a result of
ongoing good relations, Sasol lost no employee days through
industrial action.
Joint forums have been established between trade unions and
management to discuss wages, conditions of employment, health
and safety, training and development, community care and
HIV/Aids, among other important issues. All representative unions
and pensioners are represented on our medical scheme board and
senior employees serve on the boards of union retirement funds.
Upholding human rights
We are committed to complying with all statutes in the countries
in which we operate. This is complemented by our commitment
to the human rights principles of the UN Global Compact. As we
extend our operations into countries that are considered to have
human rights concerns, we recognise the importance of
exercising extra care to ensure our activities comply with
internationally accepted standards of behaviour.
Meeting the Aids challenge
Recognising the challenge of managing South Africa's HIV/Aids
pandemic, we launched the Sasol HIV/Aids Response Programme
(SHARP) in September 2002. This initiative – which involved input
from business, trade union, community representatives and
independent experts – is an integrated approach focused on
reducing the rate of infection throughout the group, and
extending the quality of life of infected employees by providing
managed healthcare.
As a result of our collaborative approach, we have had one of the
highest uptakes for voluntary counselling and testing (VCT) in
South Africa: 82% by year end for our South African operations.
This compares with a rate of between 50% and 60% that is typical
among most corporate programmes. To date, 7% of our tested
South African employees have tested positive for HIV, which is
well below our estimated actuarial prevalence rate of 19%.
Having taken all of the South African operations through VCT,
our focus has shifted to providing comprehensive workplace
education and training programmes in our South African
businesses. Our goal is to train 800 managers and 1 000
educators. To date, 250 managers have been trained. SHARP is
being extended to surrounding communities through partnerships
with community stakeholders, government bodies and other
companies in South Africa and Mozambique.
Community involvement
Promoting engagement and outreach
Besides the public participation initiatives implemented as part of
new projects, we continued to undertake community outreach

62
initiatives at most of our existing operations. These initiatives
included holding public meetings, hosting explanatory tours
of our operations and implementing structured systems for
responding effectively to community complaints. This
constructive approach towards community outreach has
provided our management teams with a deeper understanding
of community concerns and interests.
In developing our 2005 sustainable development report,
we commissioned independent consultants to engage a sample
of Sasol's stakeholders by e-mail, telephone, interviews and
focus groups. A summary and analysis of the outcomes of this
engagement process are included in our sustainable
development report.
Sustaining strong social investments
Sasol has committed more than R600 million to social upliftment
and human development over the last decade. We continue to
support the communities in which we operate, especially in
South Africa, our corporate home, and in Mozambique, where
we recently completed construction of our US$1,2 billion
Mozambique Natural Gas Project (MNGP).
We channel our social investments into five main areas:
• education;
• job creation and capacity building;
• health and welfare;
• arts, culture and sport development; and
• the natural environment.
During the year, we committed almost R47 million to
socioeconomic development projects, mostly in the Sasolburg and
Secunda communities and along the Mozambique-to-Secunda
pipeline route. This investment excludes the R24 million committed
to bursaries and the funds dedicated to sport sponsorship.
As part of the MNGP, Sasol is maintaining a social development
plan in Mozambique. To date, we have invested more than
US$7 million in community development projects in
Mozambique, with US$0,86 million invested during the year.
We also have committed an additional US$1 million for social
upliftment projects to benefit communities alongside the gas
transmission pipeline in South Africa.
While most of our social investments are undertaken in Southern
Africa, important community-based initiatives are undertaken by
our US and European operations. During the year, these
operations and their employees contributed almost R6 million to
community projects. Employees in the USA donated thousands of
volunteer hours to help with community projects. A more detailed
review of our social investment activities is available from our
corporate social investment department.
Environmental performance
• Group targets agreed for reducing emissions of
greenhouse gases and volatile organic compounds.
• Visible progress in reducing atmospheric emissions.
• Significant new capital investments approved for
further emission reductions.
• Many businesses are reducing energy and water
consumption per ton of production.
• Progress in implementing product stewardship
throughout global operations.
Reducing impacts
Due to the nature of Sasol's activities as a global petrochemical
company, we recognise we have the potential to impact the
natural environment. The group is therefore committed to
sustainable development review
Sasol is undertaking several major investments to improve its waste-management facilitiesand environmental performance.
Sasol continues to support socioeconomic development through anextensive corporate social investment programme.
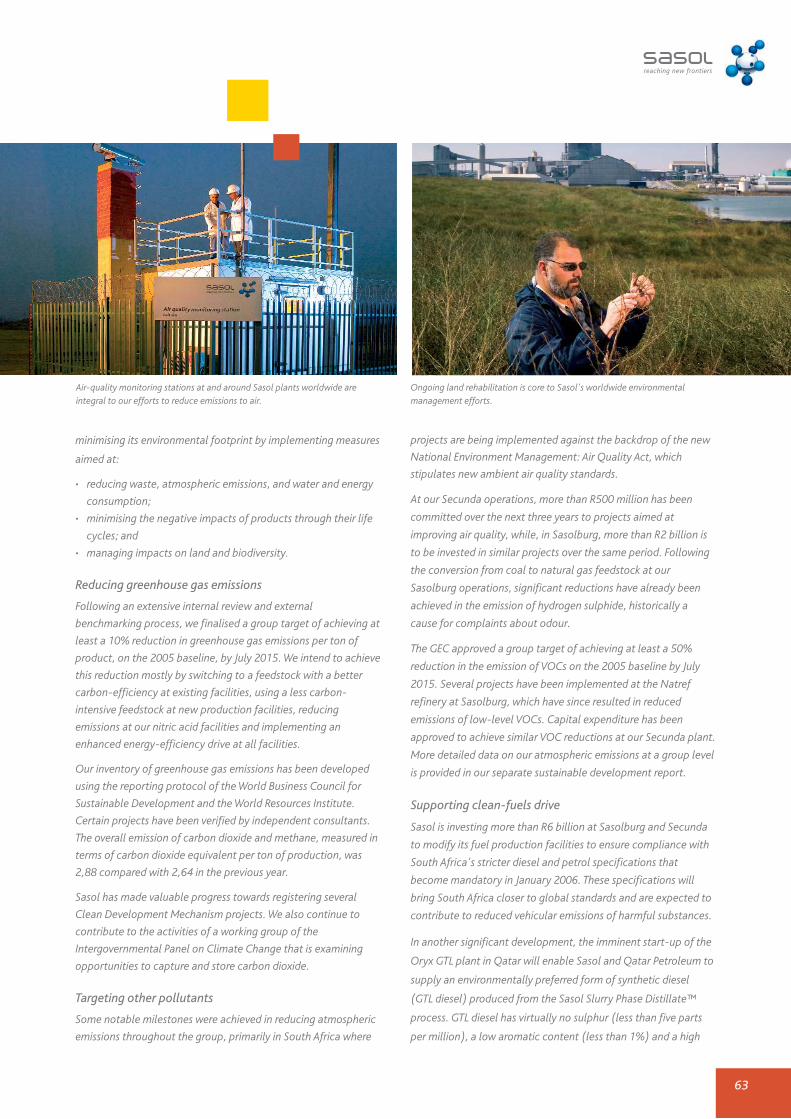
63
minimising its environmental footprint by implementing measures
aimed at:
• reducing waste, atmospheric emissions, and water and energy
consumption;
• minimising the negative impacts of products through their life
cycles; and
• managing impacts on land and biodiversity.
Reducing greenhouse gas emissions
Following an extensive internal review and external
benchmarking process, we finalised a group target of achieving at
least a 10% reduction in greenhouse gas emissions per ton of
product, on the 2005 baseline, by July 2015. We intend to achieve
this reduction mostly by switching to a feedstock with a better
carbon-efficiency at existing facilities, using a less carbon-
intensive feedstock at new production facilities, reducing
emissions at our nitric acid facilities and implementing an
enhanced energy-efficiency drive at all facilities.
Our inventory of greenhouse gas emissions has been developed
using the reporting protocol of the World Business Council for
Sustainable Development and the World Resources Institute.
Certain projects have been verified by independent consultants.
The overall emission of carbon dioxide and methane, measured in
terms of carbon dioxide equivalent per ton of production, was
2,88 compared with 2,64 in the previous year.
Sasol has made valuable progress towards registering several
Clean Development Mechanism projects. We also continue to
contribute to the activities of a working group of the
Intergovernmental Panel on Climate Change that is examining
opportunities to capture and store carbon dioxide.
Targeting other pollutants
Some notable milestones were achieved in reducing atmospheric
emissions throughout the group, primarily in South Africa where
projects are being implemented against the backdrop of the new
National Environment Management: Air Quality Act, which
stipulates new ambient air quality standards.
At our Secunda operations, more than R500 million has been
committed over the next three years to projects aimed at
improving air quality, while, in Sasolburg, more than R2 billion is
to be invested in similar projects over the same period. Following
the conversion from coal to natural gas feedstock at our
Sasolburg operations, significant reductions have already been
achieved in the emission of hydrogen sulphide, historically a
cause for complaints about odour.
The GEC approved a group target of achieving at least a 50%
reduction in the emission of VOCs on the 2005 baseline by July
2015. Several projects have been implemented at the Natref
refinery at Sasolburg, which have since resulted in reduced
emissions of low-level VOCs. Capital expenditure has been
approved to achieve similar VOC reductions at our Secunda plant.
More detailed data on our atmospheric emissions at a group level
is provided in our separate sustainable development report.
Supporting clean-fuels drive
Sasol is investing more than R6 billion at Sasolburg and Secunda
to modify its fuel production facilities to ensure compliance with
South Africa's stricter diesel and petrol specifications that
become mandatory in January 2006. These specifications will
bring South Africa closer to global standards and are expected to
contribute to reduced vehicular emissions of harmful substances.
In another significant development, the imminent start-up of the
Oryx GTL plant in Qatar will enable Sasol and Qatar Petroleum to
supply an environmentally preferred form of synthetic diesel
(GTL diesel) produced from the Sasol Slurry Phase Distillate™
process. GTL diesel has virtually no sulphur (less than five parts
per million), a low aromatic content (less than 1%) and a high
Air-quality monitoring stations at and around Sasol plants worldwide areintegral to our efforts to reduce emissions to air.
Ongoing land rehabilitation is core to Sasol's worldwide environmentalmanagement efforts.

64
cetane number (70 versus the 45-55 of conventional diesels).
These properties enable greatly reduced tailpipe emissions of
nitrous oxides, sulphur oxides, carbon monoxide, aromatics,
unburnt hydrocarbons and particulates from compression-
ignition engines.
Working to minimise waste
Potential risks associated with waste remain a priority. Historical
legacies are addressed in accordance with relevant legal
requirements. Cleaner production principles are being
implemented to minimise future risks.
An important initiative has been the commissioning of a waste-
recycling facility at Secunda, which will have significant
implications for on- and off-site waste treatment and disposal
activities. We are working on developing group targets for waste
reduction and global guidelines are being developed for
minimum waste-management requirements.
Partnering for better energy efficiency
In South Africa, we signed the Energy Efficiency Accord with
other companies and the Department of Minerals and Energy.
Though this accord, we are committed to taking actions to
reduce energy consumption per unit produced by 15% by 2015.
The base year is 2000.
Remediating and rehabilitating land
As a result of our historical chemicals and fuels processes, we
have several areas where soil or groundwater may have been
polluted in the past. Good progress has been made in
remediating contaminated land throughout the group.
In some areas, remediation projects were successfully completed.
In other areas, detailed surface and groundwater characterisation
projects have been implemented.
Managing impacts in global activities
Sasol is undertaking new investments in countries such as
Mozambique, Nigeria, Gabon, Equatorial Guinea and Qatar,
where we are involved – or are about to become involved – in
exploration, extraction, processing and transportation activities
relating to natural gas, petroleum and chemicals.
Our operations in these jurisdictions are subject to regulations for
exploration and mining rights and the protection of safety, health
and the environment. In addition, securing external funding for
projects of this nature generally requires that we meet World
Bank social and environmental requirements following the
adoption by many banks of the Equator Principles. With this in
mind, we typically require that such activities comply, as a
minimum, with World Bank environmental and social standards.
Product stewardship
Furthering product stewardship
Recognising the risk management and marketing benefits
associated with environmentally preferred products, particularly
sustainable development review
Members of the emergency response team at the Lake Charles ChemicalComplex in Louisiana conduct regular equipment inspections.
The Oryx GTL plant in Qatar will supply environmentally preferred synthetic diesel.
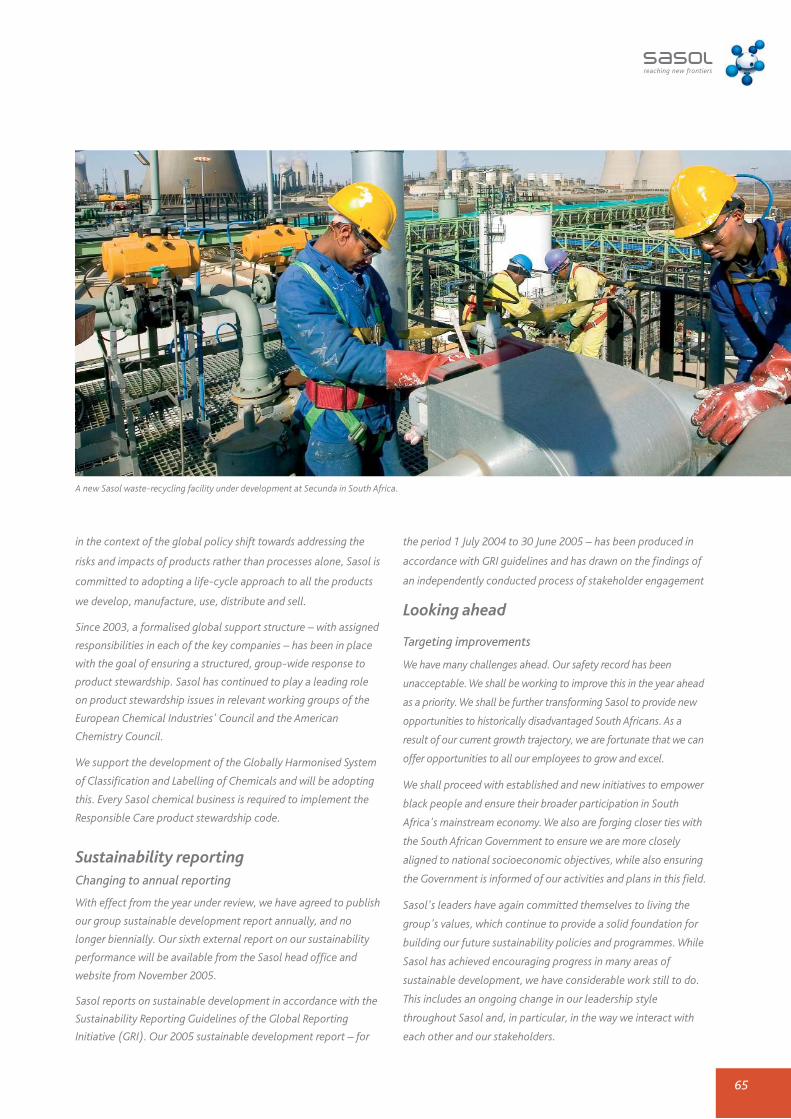
65
in the context of the global policy shift towards addressing the
risks and impacts of products rather than processes alone, Sasol is
committed to adopting a life-cycle approach to all the products
we develop, manufacture, use, distribute and sell.
Since 2003, a formalised global support structure – with assigned
responsibilities in each of the key companies – has been in place
with the goal of ensuring a structured, group-wide response to
product stewardship. Sasol has continued to play a leading role
on product stewardship issues in relevant working groups of the
European Chemical Industries' Council and the American
Chemistry Council.
We support the development of the Globally Harmonised System
of Classification and Labelling of Chemicals and will be adopting
this. Every Sasol chemical business is required to implement the
Responsible Care product stewardship code.
Sustainability reportingChanging to annual reporting
With effect from the year under review, we have agreed to publish
our group sustainable development report annually, and no
longer biennially. Our sixth external report on our sustainability
performance will be available from the Sasol head office and
website from November 2005.
Sasol reports on sustainable development in accordance with the
Sustainability Reporting Guidelines of the Global Reporting
Initiative (GRI). Our 2005 sustainable development report – for
A new Sasol waste-recycling facility under development at Secunda in South Africa.
the period 1 July 2004 to 30 June 2005 – has been produced in
accordance with GRI guidelines and has drawn on the findings of
an independently conducted process of stakeholder engagement
Looking ahead
Targeting improvements
We have many challenges ahead. Our safety record has been
unacceptable. We shall be working to improve this in the year ahead
as a priority. We shall be further transforming Sasol to provide new
opportunities to historically disadvantaged South Africans. As a
result of our current growth trajectory, we are fortunate that we can
offer opportunities to all our employees to grow and excel.
We shall proceed with established and new initiatives to empower
black people and ensure their broader participation in South
Africa's mainstream economy. We also are forging closer ties with
the South African Government to ensure we are more closely
aligned to national socioeconomic objectives, while also ensuring
the Government is informed of our activities and plans in this field.
Sasol's leaders have again committed themselves to living the
group's values, which continue to provide a solid foundation for
building our future sustainability policies and programmes. While
Sasol has achieved encouraging progress in many areas of
sustainable development, we have considerable work still to do.
This includes an ongoing change in our leadership style
throughout Sasol and, in particular, in the way we interact with
each other and our stakeholders.
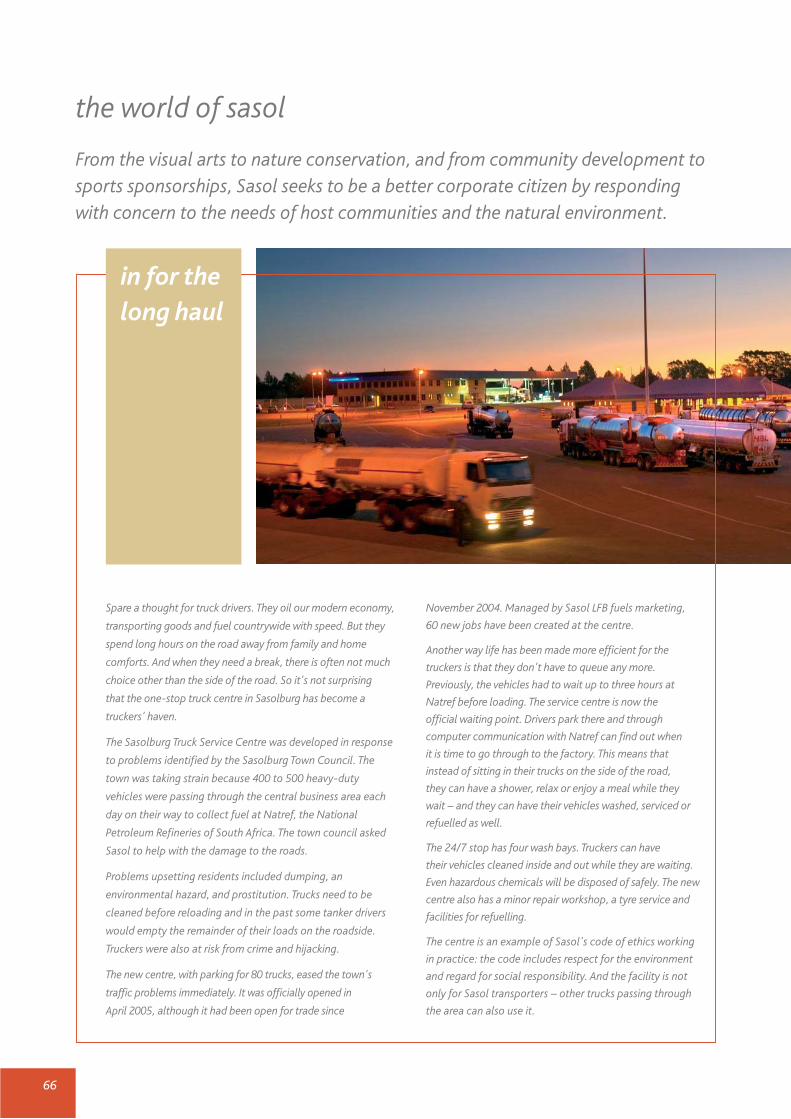
66
the world of sasol
From the visual arts to nature conservation, and from community development tosports sponsorships, Sasol seeks to be a better corporate citizen by respondingwith concern to the needs of host communities and the natural environment.
Spare a thought for truck drivers. They oil our modern economy,
transporting goods and fuel countrywide with speed. But they
spend long hours on the road away from family and home
comforts. And when they need a break, there is often not much
choice other than the side of the road. So it's not surprising
that the one-stop truck centre in Sasolburg has become a
truckers' haven.
The Sasolburg Truck Service Centre was developed in response
to problems identified by the Sasolburg Town Council. The
town was taking strain because 400 to 500 heavy-duty
vehicles were passing through the central business area each
day on their way to collect fuel at Natref, the National
Petroleum Refineries of South Africa. The town council asked
Sasol to help with the damage to the roads.
Problems upsetting residents included dumping, an
environmental hazard, and prostitution. Trucks need to be
cleaned before reloading and in the past some tanker drivers
would empty the remainder of their loads on the roadside.
Truckers were also at risk from crime and hijacking.
The new centre, with parking for 80 trucks, eased the town's
traffic problems immediately. It was officially opened in
April 2005, although it had been open for trade since
November 2004. Managed by Sasol LFB fuels marketing,
60 new jobs have been created at the centre.
Another way life has been made more efficient for the
truckers is that they don't have to queue any more.
Previously, the vehicles had to wait up to three hours at
Natref before loading. The service centre is now the
official waiting point. Drivers park there and through
computer communication with Natref can find out when
it is time to go through to the factory. This means that
instead of sitting in their trucks on the side of the road,
they can have a shower, relax or enjoy a meal while they
wait – and they can have their vehicles washed, serviced or
refuelled as well.
The 24/7 stop has four wash bays. Truckers can have
their vehicles cleaned inside and out while they are waiting.
Even hazardous chemicals will be disposed of safely. The new
centre also has a minor repair workshop, a tyre service and
facilities for refuelling.
The centre is an example of Sasol's code of ethics working
in practice: the code includes respect for the environment
and regard for social responsibility. And the facility is not
only for Sasol transporters – other trucks passing through
the area can also use it.
in for thelong haul

67
contemporary artists. The collecting policy focuses on works
by young South African artists, both those emerging and
those more established. The annual Sasol New Signatures
competition exposes budding artists.
We have produced three volumes of art publications. The
first coincided with an exhibition of the collection at the
Johannesburg Art Gallery. The second marked the opening
of the Sasol Art Museum at the University of Stellenbosch.
The third was produced in honour of the late Joe Stegmann.
The Sasol Art Museum opened in October 1991 and its
outreach programmes include regular workshops for
learners from schools on the Cape Flats, Cape Town.
Once a year, in November, we open the doors of our
Rosebank, Johannesburg offices to the public to view new
acquisitions or take a guided tour.
When the staff at Petlin, the largest low-density polyethylene
plant in Asia, asked if they could alter their lunar landscape of
metal and concrete and develop a park within the plant, the
management gave them a green thumbs-up.
The staff then set out to create not one, but three gardens,
each representing one of the national identities of Petlin's
shareholders, Petronas, Malaysia's national petroleum
corporation (40%), Sasol Polymers of South Africa (40%) and
SABIC Polyethylenes, which holds the 20% share previously
held by DSM of the Netherlands.
The Malaysian garden has gazebos and bunga raya shrub, the
national flower, lining its perimeter. The South African garden
has a miniature replica of an African elephant and a lion
next to a water fountain. The Dutch garden has a windmill
and pine trees. The gardens are a talking point for visitors to the
plant. This employee-made oasis is used by the staff during
their tea breaks.
plants in a plant
This year’s publication of art @ work celebrates Sasol's support
for the visual arts in South Africa over the past 21 years. The
book features some of the almost 120 artists whose works
make up our collection.
Sasol may be an oil, gas and chemical company, but the Sasol staff
work in an artistic environment. The works are on display in
corridors, conference rooms and reception areas around the world,
a living testament to South Africa's wealth of creative visual talent.
More than that, staff are invited to participate through monthly in-
house More About Art sessions. One month a year is also dedicated
to arts and culture when employees, friends and family are included
in lunchtime activities such as videos and pottery workshops.
The collection was started in 1982 by a former chief executive,
Joe Stegmann, whose passion for the arts has evolved into an
impressive corporate collection of 2 000 pieces, mainly by
fuelling south africa’s creative juices
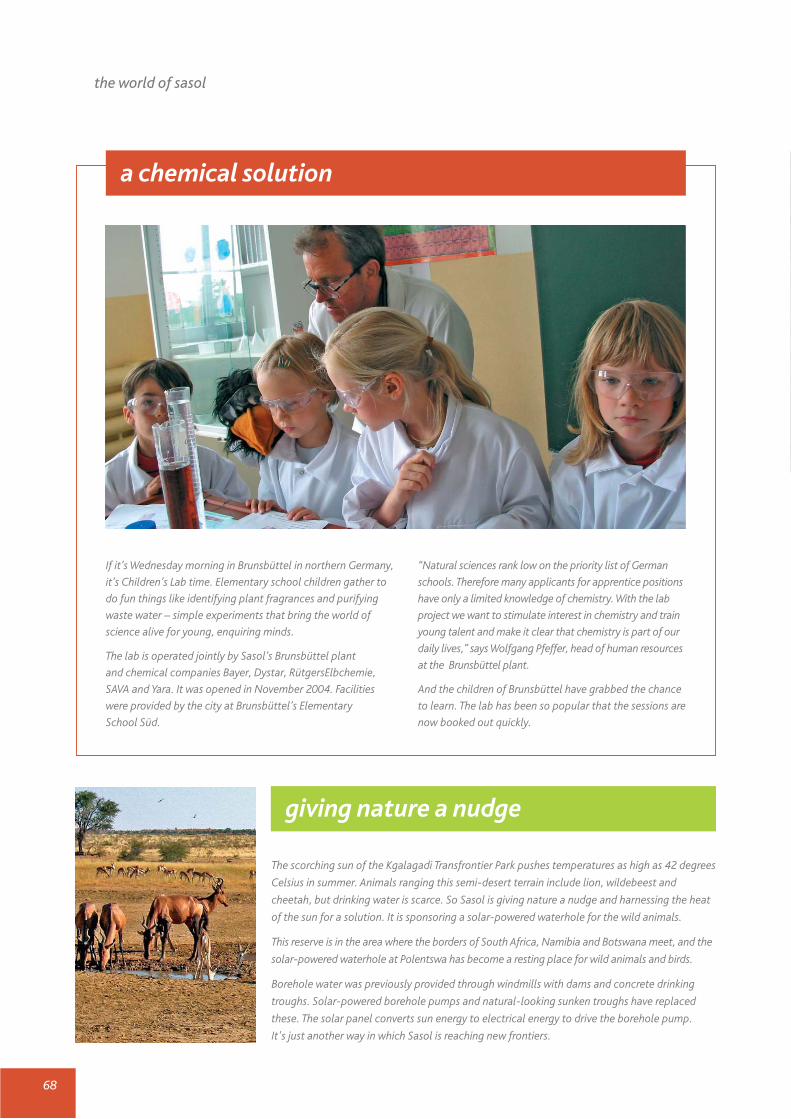
68
the world of sasol
If it’s Wednesday morning in Brunsbüttel in northern Germany,
it’s Children’s Lab time. Elementary school children gather to
do fun things like identifying plant fragrances and purifying
waste water – simple experiments that bring the world of
science alive for young, enquiring minds.
The lab is operated jointly by Sasol’s Brunsbüttel plant
and chemical companies Bayer, Dystar, RütgersElbchemie,
SAVA and Yara. It was opened in November 2004. Facilities
were provided by the city at Brunsbüttel’s Elementary
School Süd.
a chemical solution
“Natural sciences rank low on the priority list of German
schools. Therefore many applicants for apprentice positions
have only a limited knowledge of chemistry. With the lab
project we want to stimulate interest in chemistry and train
young talent and make it clear that chemistry is part of our
daily lives,” says Wolfgang Pfeffer, head of human resources
at the Brunsbüttel plant.
And the children of Brunsbüttel have grabbed the chance
to learn. The lab has been so popular that the sessions are
now booked out quickly.
The scorching sun of the Kgalagadi Transfrontier Park pushes temperatures as high as 42 degrees
Celsius in summer. Animals ranging this semi-desert terrain include lion, wildebeest and
cheetah, but drinking water is scarce. So Sasol is giving nature a nudge and harnessing the heat
of the sun for a solution. It is sponsoring a solar-powered waterhole for the wild animals.
This reserve is in the area where the borders of South Africa, Namibia and Botswana meet, and the
solar-powered waterhole at Polentswa has become a resting place for wild animals and birds.
Borehole water was previously provided through windmills with dams and concrete drinking
troughs. Solar-powered borehole pumps and natural-looking sunken troughs have replaced
these. The solar panel converts sun energy to electrical energy to drive the borehole pump.
It's just another way in which Sasol is reaching new frontiers.
giving nature a nudge
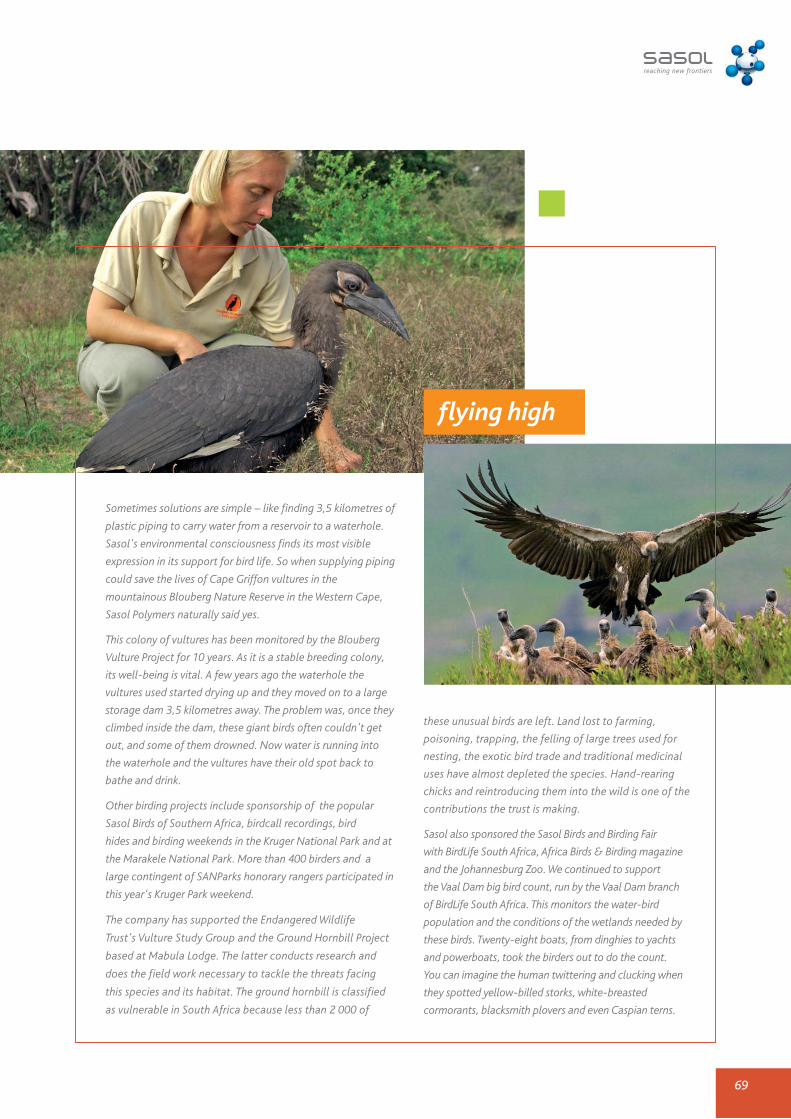
69
these unusual birds are left. Land lost to farming,
poisoning, trapping, the felling of large trees used for
nesting, the exotic bird trade and traditional medicinal
uses have almost depleted the species. Hand-rearing
chicks and reintroducing them into the wild is one of the
contributions the trust is making.
Sasol also sponsored the Sasol Birds and Birding Fair
with BirdLife South Africa, Africa Birds & Birding magazine
and the Johannesburg Zoo. We continued to support
the Vaal Dam big bird count, run by the Vaal Dam branch
of BirdLife South Africa. This monitors the water-bird
population and the conditions of the wetlands needed by
these birds. Twenty-eight boats, from dinghies to yachts
and powerboats, took the birders out to do the count.
You can imagine the human twittering and clucking when
they spotted yellow-billed storks, white-breasted
cormorants, blacksmith plovers and even Caspian terns.
Sometimes solutions are simple – like finding 3,5 kilometres of
plastic piping to carry water from a reservoir to a waterhole.
Sasol's environmental consciousness finds its most visible
expression in its support for bird life. So when supplying piping
could save the lives of Cape Griffon vultures in the
mountainous Blouberg Nature Reserve in the Western Cape,
Sasol Polymers naturally said yes.
This colony of vultures has been monitored by the Blouberg
Vulture Project for 10 years. As it is a stable breeding colony,
its well-being is vital. A few years ago the waterhole the
vultures used started drying up and they moved on to a large
storage dam 3,5 kilometres away. The problem was, once they
climbed inside the dam, these giant birds often couldn't get
out, and some of them drowned. Now water is running into
the waterhole and the vultures have their old spot back to
bathe and drink.
Other birding projects include sponsorship of the popular
Sasol Birds of Southern Africa, birdcall recordings, bird
hides and birding weekends in the Kruger National Park and at
the Marakele National Park. More than 400 birders and a
large contingent of SANParks honorary rangers participated in
this year's Kruger Park weekend.
The company has supported the Endangered Wildlife
Trust's Vulture Study Group and the Ground Hornbill Project
based at Mabula Lodge. The latter conducts research and
does the field work necessary to tackle the threats facing
this species and its habitat. The ground hornbill is classified
as vulnerable in South Africa because less than 2 000 of
flying high

70
the world of sasol
Energy changes lives. So Sasol was pleased to partner the
Department of Minerals and Energy in South Africa to
develop Integrated Energy Centres (IeCs). These centres will
make energy products more accessible and affordable to
poor people in rural areas of South Africa.
Take the people living in Maluti, a remote rural area near
Matatiele on the border of KwaZulu-Natal and Eastern Cape.
In the past they had to make an 80 kilometre taxi journey to
Kokstad to buy paraffin and candles. Now they can shop at the
Caba-Mdeni IeC, an information hub and energy shop selling
paraffin, liquid petroleum gas, candles, petrol and diesel. Sasol
delivers directly to the centre, excluding the middleman, which
makes the products more affordable.
The IeC idea was introduced in 2001 after President Thabo
Mbeki's plea to business to assist in the delivery of services
free state learners get wired
and resources to rural people. Industry players like Sasol
were asked to help with community-based energy projects
as part of the South African Government's Integrated
Sustainable Rural Development Plan.
Caba-Mdeni, which opened in December 2004, is the first
of 10 IeCs around the country. It is a cooperative owned by
59 members of the sprawling community. Thirty-five of the
registered members are women. It has also created 10 jobs
in a community where formal employment is scarce.
Sasol will eventually move on from being directly involved
in running the IeC. “We shall be involved with an IeC for a
maximum of 18 months, after which it will function like a
proper, independent business with us as the supplier,” says
Johan Thyse, manager: new energy solutions at Sasol's
manufacturing and supply group.
powerto thepeople
Teachers and learners in the northern Free State are joining
the information highway at the Boitjhorisong Resource Centre,
which has more than 100 computers and connections to the
Internet. This Sasol-sponsored community education project is
contributing to turning the northern Free State area into a
centre of excellence. The district achieved the best matric pass
rate for 2002, 2003 and 2004.
The centre embraces a philosophy of life-long learning. It
reaches 74 schools, 158 farm schools, 63 500 learners and 2 000
teachers with literacy, numeracy and computer courses,
workshops on different subjects and support services for schools.
Improving the standard of maths and science is crucial to
provide the skills the country needs. So Boitjhorisong is helping
to bridge the digital divide. It uses computers for training and
also gives learners the chance to pass computer science as a
seventh subject. Teachers can use the science and mathematics
lending library and learners are allowed Internet access at
the centre.
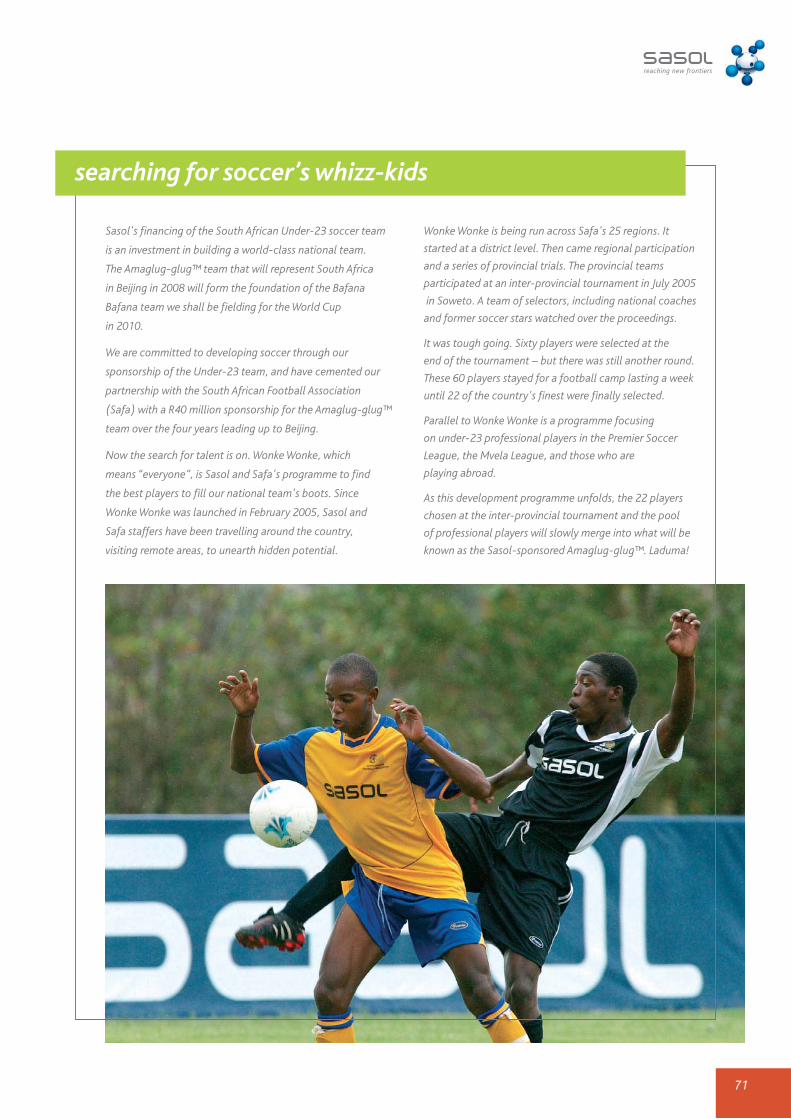
71
Wonke Wonke is being run across Safa's 25 regions. It
started at a district level. Then came regional participation
and a series of provincial trials. The provincial teams
participated at an inter-provincial tournament in July 2005
in Soweto. A team of selectors, including national coaches
and former soccer stars watched over the proceedings.
It was tough going. Sixty players were selected at the
end of the tournament – but there was still another round.
These 60 players stayed for a football camp lasting a week
until 22 of the country's finest were finally selected.
Parallel to Wonke Wonke is a programme focusing
on under-23 professional players in the Premier Soccer
League, the Mvela League, and those who are
playing abroad.
As this development programme unfolds, the 22 players
chosen at the inter-provincial tournament and the pool
of professional players will slowly merge into what will be
known as the Sasol-sponsored Amaglug-glug™. Laduma!
searching for soccer’s whizz-kids
Sasol's financing of the South African Under-23 soccer team
is an investment in building a world-class national team.
The Amaglug-glug™ team that will represent South Africa
in Beijing in 2008 will form the foundation of the Bafana
Bafana team we shall be fielding for the World Cup
in 2010.
We are committed to developing soccer through our
sponsorship of the Under-23 team, and have cemented our
partnership with the South African Football Association
(Safa) with a R40 million sponsorship for the Amaglug-glug™
team over the four years leading up to Beijing.
Now the search for talent is on. Wonke Wonke, which
means “everyone”, is Sasol and Safa's programme to find
the best players to fill our national team's boots. Since
Wonke Wonke was launched in February 2005, Sasol and
Safa staffers have been travelling around the country,
visiting remote areas, to unearth hidden potential.
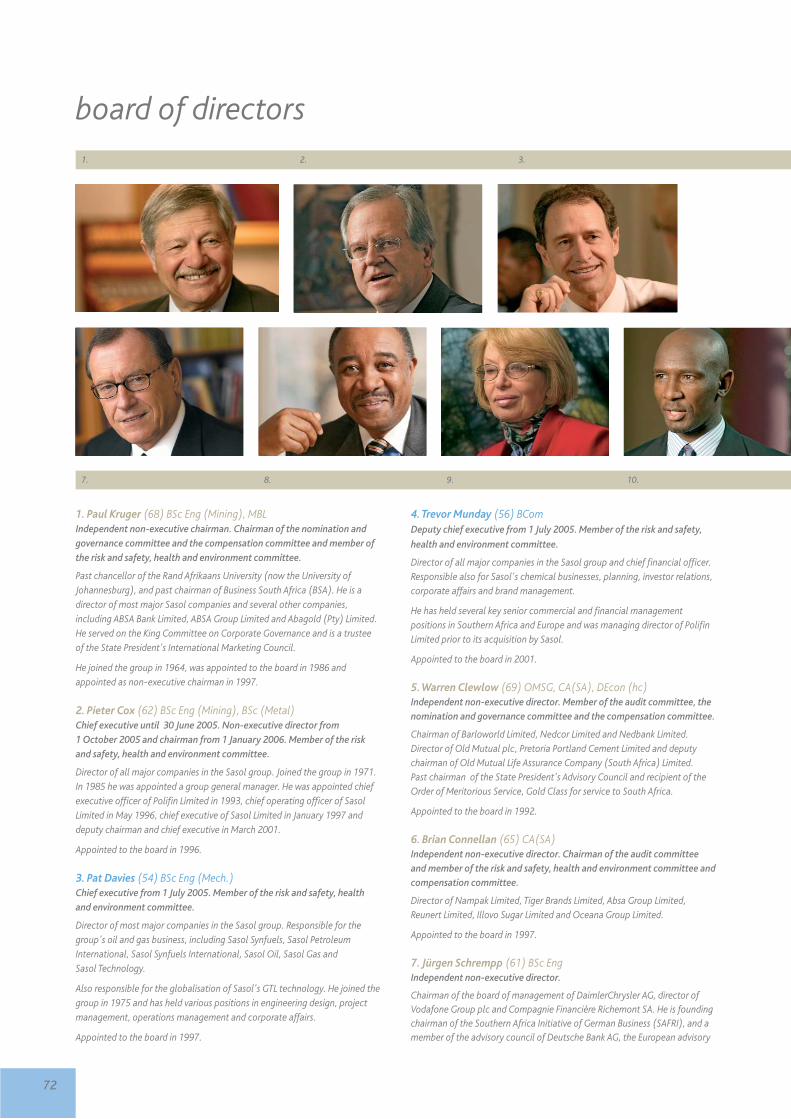
72
1. 2. 3.
board of directors
1. Paul Kruger (68) BSc Eng (Mining), MBLIndependent non-executive chairman. Chairman of the nomination and
governance committee and the compensation committee and member of
the risk and safety, health and environment committee.
Past chancellor of the Rand Afrikaans University (now the University of
Johannesburg), and past chairman of Business South Africa (BSA). He is a
director of most major Sasol companies and several other companies,
including ABSA Bank Limited, ABSA Group Limited and Abagold (Pty) Limited.
He served on the King Committee on Corporate Governance and is a trustee
of the State President's International Marketing Council.
He joined the group in 1964, was appointed to the board in 1986 and
appointed as non-executive chairman in 1997.
2. Pieter Cox (62) BSc Eng (Mining), BSc (Metal) Chief executive until 30 June 2005. Non-executive director from
1 October 2005 and chairman from 1 January 2006. Member of the risk
and safety, health and environment committee.
Director of all major companies in the Sasol group. Joined the group in 1971.
In 1985 he was appointed a group general manager. He was appointed chief
executive officer of Polifin Limited in 1993, chief operating officer of Sasol
Limited in May 1996, chief executive of Sasol Limited in January 1997 and
deputy chairman and chief executive in March 2001.
Appointed to the board in 1996.
3. Pat Davies (54) BSc Eng (Mech.) Chief executive from 1 July 2005. Member of the risk and safety, health
and environment committee.
Director of most major companies in the Sasol group. Responsible for the
group's oil and gas business, including Sasol Synfuels, Sasol Petroleum
International, Sasol Synfuels International, Sasol Oil, Sasol Gas and
Sasol Technology.
Also responsible for the globalisation of Sasol's GTL technology. He joined the
group in 1975 and has held various positions in engineering design, project
management, operations management and corporate affairs.
Appointed to the board in 1997.
4. Trevor Munday (56) BCom Deputy chief executive from 1 July 2005. Member of the risk and safety,
health and environment committee.
Director of all major companies in the Sasol group and chief financial officer.Responsible also for Sasol's chemical businesses, planning, investor relations,corporate affairs and brand management.
He has held several key senior commercial and financial managementpositions in Southern Africa and Europe and was managing director of PolifinLimited prior to its acquisition by Sasol.
Appointed to the board in 2001.
5. Warren Clewlow (69) OMSG, CA(SA), DEcon (hc) Independent non-executive director. Member of the audit committee, thenomination and governance committee and the compensation committee.
Chairman of Barloworld Limited, Nedcor Limited and Nedbank Limited.Director of Old Mutual plc, Pretoria Portland Cement Limited and deputychairman of Old Mutual Life Assurance Company (South Africa) Limited.Past chairman of the State President's Advisory Council and recipient of theOrder of Meritorious Service, Gold Class for service to South Africa.
Appointed to the board in 1992.
6. Brian Connellan (65) CA(SA)Independent non-executive director. Chairman of the audit committeeand member of the risk and safety, health and environment committee andcompensation committee.
Director of Nampak Limited, Tiger Brands Limited, Absa Group Limited,Reunert Limited, Illovo Sugar Limited and Oceana Group Limited.
Appointed to the board in 1997.
7. Jürgen Schrempp (61) BSc Eng Independent non-executive director.
Chairman of the board of management of DaimlerChrysler AG, director ofVodafone Group plc and Compagnie Financière Richemont SA. He is foundingchairman of the Southern Africa Initiative of German Business (SAFRI), and amember of the advisory council of Deutsche Bank AG, the European advisory
7. 8. 9. 10.

73
4. 5. 6.
board of Harvard Business School, the German Council of INSEAD and theSouth African President's International Investment Council. He is HonoraryConsul-General in Germany of the Republic of South Africa and he holds aprofessorship of the federal state of Baden-Württemberg, Germany, andhonorary doctorates of the University of Graz, Austria and the University ofStellenbosch, South Africa.
Appointed to the board in 1997.
8. Sam Montsi (60) BA Econ, MA Dev EconIndependent non-executive director. Chairman of the risk and safety,
health and environment committee and member of the nomination and
governance committee and compensation committee.
Chairman of Montsi Investments (Pty) Limited and director of Independent
News & Media SA (Pty) Limited and Business Arts South Africa and all
companies in which Montsi Investments has invested.
Appointed to the board in 1997.
9. Elisabeth Bradley (66) BSc, MScIndependent non-executive director. Member of the nomination and
governance committee and the compensation committee.
Chairman of Toyota South Africa (Pty) Limited, Wesco Investments Limited,
Metair Investments Limited, Rosebank Hotel and the Winkler Hotel. Director
of the Standard Bank Group Limited, the Tongaat-Hulett Group Limited and
Anglogold Ashanti Limited. She is deputy chairman of the SA Institute of
International Affairs and chairman of the Centre for Development
and Enterprise.
Appointed to the board in 1998.
10. Mandla Gantsho (43) CA(SA), MScNon-executive director.
Chief executive officer and managing director of the Development Bank of
Southern Africa (DBSA). Previously chief financial officer of the DBSA.
Between 1999 and 2000 was seconded as advisor to a vice-president of the
International Finance Corporation in Washington, DC.
Appointed to the board in 2003.
11. Conrad Strauss (69) BA, MSc, PhDIndependent non-executive director. Member of the audit committee and
nomination and governance committee.
Former chairman of Standard Bank Investment Corporation Limited. He still
serves as a director of the Standard Bank of South Africa Limited, Afrox
Limited and Hans Merensky Holdings (Pty) Limited. He was chairman of the
Presidential Commission of Enquiry into Rural Finance, the South Africa
Foundation and the South African Institute of International Affairs.
Appointed to the board in 2000.
12. Anshu Jain (42) BA (Hons), MBAIndependent non-executive director.
Managing director and head of global markets at Deutsche Bank AG and
member of the group executive committee. Previously a managing director
with Merrill Lynch in New York.
Appointed to the board in 2003.
13. Imogen Mkhize (42) BSc, MBAIndependent non-executive director. Member of the risk and safety, health
and environment committee.
Chief executive officer of the 18th World Petroleum Congress. Previously,
executive chairman of the Zitek Group and managing director of Lucent
Technologies South Africa. She is a director of Murray & Roberts Holdings,
Datacentrix, the CSIR, the Financial Markets Advisory Board and
Rhodes University.
Appointed to the board on 1 January 2005.
11. 12. 13.

74
corporate governance
Upholding international best practice
Introduction
Sound corporate governance structures and processes have been in
operation at Sasol since its inception. They are constantly reviewed
and adapted to accommodate internal corporate developments
and to reflect national and international best practice.
The company maintains a primary listing of its ordinary shares on
the JSE Limited (JSE) and a listing of American Depositary Shares
on the New York Stock Exchange (NYSE). The company is
accordingly subject to the ongoing disclosure, corporate
governance and other requirements imposed by the JSE,
US Securities and Exchange Commission (SEC) and the NYSE.
The company complies with the JSE listing requirements and
US governance requirements of the SEC, the NYSE and legislation
such as the Sarbanes-Oxley Act of 2002 (SOX) applicable to
foreign companies listed on the NYSE. In addition, Sasol has
compared its corporate governance practices to those required to
be applied by domestic US companies listed on the NYSE and has
confirmed to the NYSE that it complies in all significant respects
with such NYSE corporate governance standards.
Sasol endorses the principles of the South African Code of
Corporate Practices and Conduct as recommended in the second
King Report (King II).
The nomination and governance committee and the board of
directors (board) continue to review and benchmark the group’s
governance structures and processes. The board considers
corporate governance as a priority that requires more attention
than merely establishing the steps to be taken to demonstrate
compliance with legal, regulatory or listing requirements.
Issues of governance will continue to receive the board and
its committees' consideration and attention during the year
ahead. Sound governance remains one of the top priorities of
executive management.
The board of directors and non-executivedirectors
The company's articles of association provide that the company’s
board consists of a maximum of 15 directors of whom a maximum
of five may be executive directors. During the year, three directors
were executive directors (Messrs PV Cox, LPA Davies and
TS Munday) and 11 of the directors were non-executive directors.
Mr JH Fourie retired as a non-executive director with effect from
1 January 2005 and Mr SB Pfeiffer resigned as a non-executive
director with effect from 31 October 2004. Ms IN Mkhize was
appointed as a non-executive director with effect from
1 January 2005.
All the non-executive directors, except Messrs MSV Gantsho,
JH Fourie and SB Pfeiffer, were considered by the board to be
independent directors in accordance with King II and the rules of
the NYSE. The board was precluded from categorising Steven
Pfeiffer as an independent director in view of the occasional
US legal services provided by him and his firm. These services
constituted less than 1% of the firm’s turnover. The board is
of the view that all non-executive directors bring independent
judgement to bear on material decisions of the company.
During the year, the offices of chairman and deputy
chairman/chief executive were separate and filled by a non-
executive independent director (Mr P du P Kruger) and an
executive director (Mr PV Cox), respectively. On 4 March 2005,
the company announced the appointment of Mr LPA Davies as
chief executive and Mr TS Munday as deputy chief executive with
effect from 1 July 2005. It was also announced that Mr PV Cox
would succeed Mr P du P Kruger as chairman of the board on
1 January 2006.
In terms of the company's articles of association, the directors
appoint the chief executive. Such an appointment may not exceed
five years at a time.
Details of directors of the board appear on pages 72 and 73 of the
annual review.
Board powers and procedures
The board has adopted a board charter. It provides a concise
overview of:
• the demarcation of the roles, functions, responsibilities and
powers of the board, the shareholders, individual directors,
officers and executives of the company;
• the terms of reference of the board committees;
• matters reserved for final decision-making or pre-approval by
the board; and
• the policies and practices of the board for such matters as
corporate governance, trading by directors in the securities of
the company, declarations of conflicts of interest, board
meeting documentation and procedures and the nomination,
appointment, induction, training and evaluation of directors
and members of board committees.
Within the powers conferred upon the board by the articles, the
board has determined its main function and responsibility as
adding significant value to the company by:
a) retaining full and effective control over the company;
b) determining the strategies and strategic objectives of the
company and group companies;
c) determining and setting the tone of the company's values,
including principles of ethical business practice;
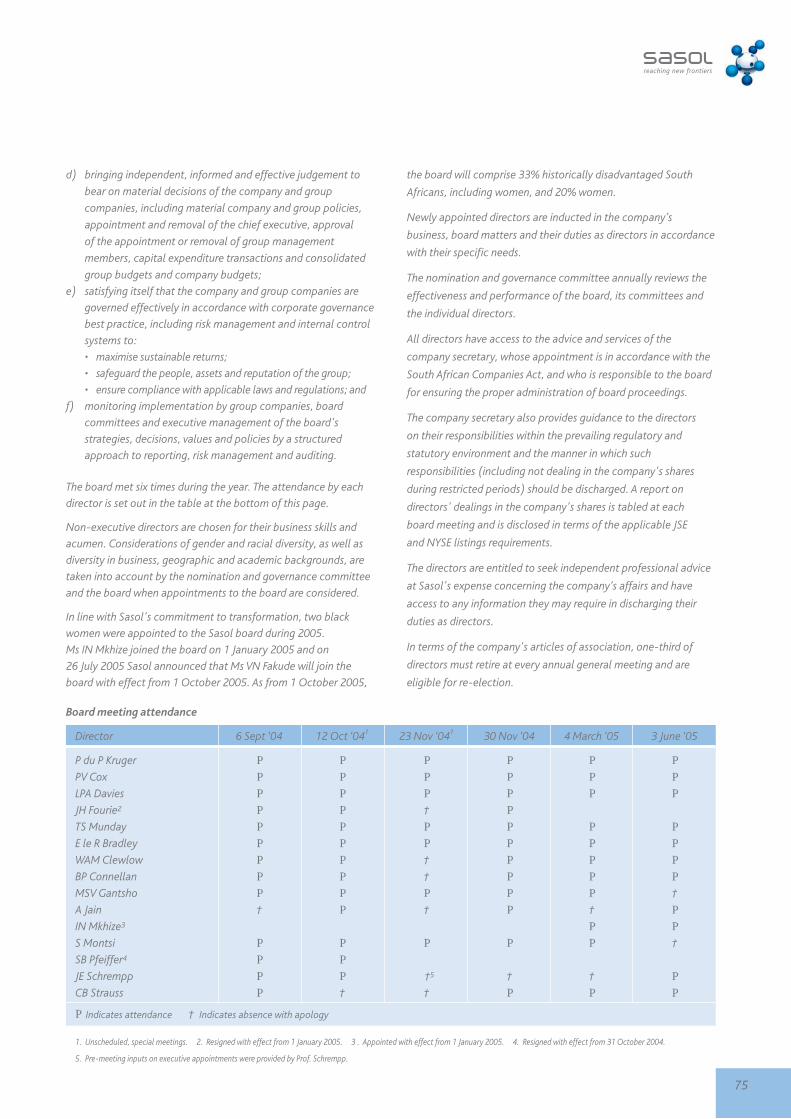
75
d) bringing independent, informed and effective judgement to
bear on material decisions of the company and group
companies, including material company and group policies,
appointment and removal of the chief executive, approval
of the appointment or removal of group management
members, capital expenditure transactions and consolidated
group budgets and company budgets;
e) satisfying itself that the company and group companies are
governed effectively in accordance with corporate governance
best practice, including risk management and internal control
systems to:
• maximise sustainable returns;
• safeguard the people, assets and reputation of the group;
• ensure compliance with applicable laws and regulations; and
f) monitoring implementation by group companies, board
committees and executive management of the board's
strategies, decisions, values and policies by a structured
approach to reporting, risk management and auditing.
The board met six times during the year. The attendance by each
director is set out in the table at the bottom of this page.
Non-executive directors are chosen for their business skills and
acumen. Considerations of gender and racial diversity, as well as
diversity in business, geographic and academic backgrounds, are
taken into account by the nomination and governance committee
and the board when appointments to the board are considered.
In line with Sasol's commitment to transformation, two black
women were appointed to the Sasol board during 2005.
Ms IN Mkhize joined the board on 1 January 2005 and on
26 July 2005 Sasol announced that Ms VN Fakude will join the
board with effect from 1 October 2005. As from 1 October 2005,
the board will comprise 33% historically disadvantaged South
Africans, including women, and 20% women.
Newly appointed directors are inducted in the company’s
business, board matters and their duties as directors in accordance
with their specific needs.
The nomination and governance committee annually reviews the
effectiveness and performance of the board, its committees and
the individual directors.
All directors have access to the advice and services of the
company secretary, whose appointment is in accordance with the
South African Companies Act, and who is responsible to the board
for ensuring the proper administration of board proceedings.
The company secretary also provides guidance to the directors
on their responsibilities within the prevailing regulatory and
statutory environment and the manner in which such
responsibilities (including not dealing in the company's shares
during restricted periods) should be discharged. A report on
directors' dealings in the company's shares is tabled at each
board meeting and is disclosed in terms of the applicable JSE
and NYSE listings requirements.
The directors are entitled to seek independent professional advice
at Sasol's expense concerning the company’s affairs and have
access to any information they may require in discharging their
duties as directors.
In terms of the company's articles of association, one-third of
directors must retire at every annual general meeting and are
eligible for re-election.
Board meeting attendance
Director 6 Sept ‘04 12 Oct ‘041 23 Nov ‘041 30 Nov ‘04 4 March ‘05 3 June ‘05
P du P Kruger P P P P P PPV Cox P P P P P PLPA Davies P P P P P PJH Fourie2 P P † PTS Munday P P P P P PE le R Bradley P P P P P PWAM Clewlow P P † P P PBP Connellan P P † P P PMSV Gantsho P P P P P †
A Jain † P † P † PIN Mkhize3 P PS Montsi P P P P P †
SB Pfeiffer4 P PJE Schrempp P P †5 † † PCB Strauss P † † P P P
P Indicates attendance † Indicates absence with apology
1. Unscheduled, special meetings. 2. Resigned with effect from 1 January 2005. 3 . Appointed with effect from 1 January 2005. 4. Resigned with effect from 31 October 2004.
5. Pre-meeting inputs on executive appointments were provided by Prof. Schrempp.

76
Corporate governance
Board committees
Several committees have been established to assist the board in
discharging its responsibilities. The committees have an important
role in enhancing high standards of governance and achieving
increased effectiveness within the group.
During the year, the terms of reference of the audit committee,
the compensation committee, the nomination and governance
committee and the risk and safety, health and environment
committee were reviewed and updated to conform to the NYSE
corporate governance rules. The terms of reference of the board
committees form part of the board charter and can be viewed on
the company’s website (www.sasol.com).
The company's subsidiaries, as well as their operating divisions,
have established board and committee structures to ensure the
maintenance of high standards and best practice for corporate
governance and internal control throughout. The business of
group subsidiaries and divisions is decentralised.
The company requires decision-making involvement for a defined
list of material matters of the businesses of its subsidiaries. This list
includes matters such as the appointment of directors, strategy
charters, large capital expenditures and mergers, acquisitions and
disposals. The boards of the main subsidiaries and divisions of the
company are constituted so that a majority of directors of each
main subsidiary or divisional board are non-executive directors of
the subsidiary or division.
The chairman of Sasol Limited and members of the group
executive committee serve on boards of all the main Sasol
businesses. The attendance of the chairman at main subsidiary
board meetings provides an essential link between the Sasol
businesses and the non-executive directors of Sasol Limited.
The compensation committee
Members: Messrs P du P Kruger (chairman), WAM Clewlow,
BP Connellan, S Montsi and Ms E le R Bradley.
All the members of the committee are independent non-executive
directors. The functions of the compensation committee are to:
• assist the board in exercising its function of ensuring that
affordable, fair and effective compensation practices are
implemented in the Sasol group;
• determine the compensation of group management members;
• make recommendations to the board on directors' fees and the
compensation and service conditions of executive directors,
including the chief executive; and
• provide a channel of communication between the board and
management on compensation matters.
The compensation committee is mandated to:
• review and approve general proposals for salary and
wage adjustments;
• review and approve proposals for the general adjustment
of standard conditions of service, including matters relating
to leave, housing, motor vehicles, bonuses, incentives,
pension funds, provident funds, medical aid, deferred
compensation and share schemes;
• review the group’s compensation policies and practices and
proposals to change these and to make recommendations in
this regard to the board;
• determine and approve any criteria for measuring the
performance of executive directors in discharging their
functions and responsibilities;
• review (at least annually) and approve the terms and
conditions of executive directors' employment contracts,
taking into account information from comparable companies;
• determine and approve any grants to executive directors and
other senior employees made pursuant to the company's
executive share scheme;
• review and approve any disclosures in the annual report or
elsewhere on compensation policies or directors'
compensation; and
• at least annually assess the performance of the committee
and committee members.
The compensation committee has determined the remuneration
philosophy of the company, which is to offer remuneration that
will attract, retain, motivate and reward employees with the skills
required for the company to achieve its business goals and to base
remuneration on personal and company performance in
accordance with competitive market practices.
Directors' emoluments and other relevant remuneration
information are disclosed in the directors' remuneration section
from page 28 to 33 of the annual financial statements.
The committee meets at least twice a year and is empowered to
obtain such external or other independent professional advice as it
considers necessary to carry out its duties.
The attendance at meetings was as follows:
Member 3 Sept ‘04 4 March ‘05 3 June ‘05
WAM Clewlow P P PE le R Bradley P P PP du P Kruger P P PBP Connellan* † † PS Montsi* † † †
* Appointed with effect from 4 March 2005.
The audit committee
Members: Messrs BP Connellan (chairman), WAM Clewlow and
Dr CB Strauss.
The audit committee is an important element of the board's
system of monitoring and control. All members are independent
non-executive directors and Mr WAM Clewlow has been
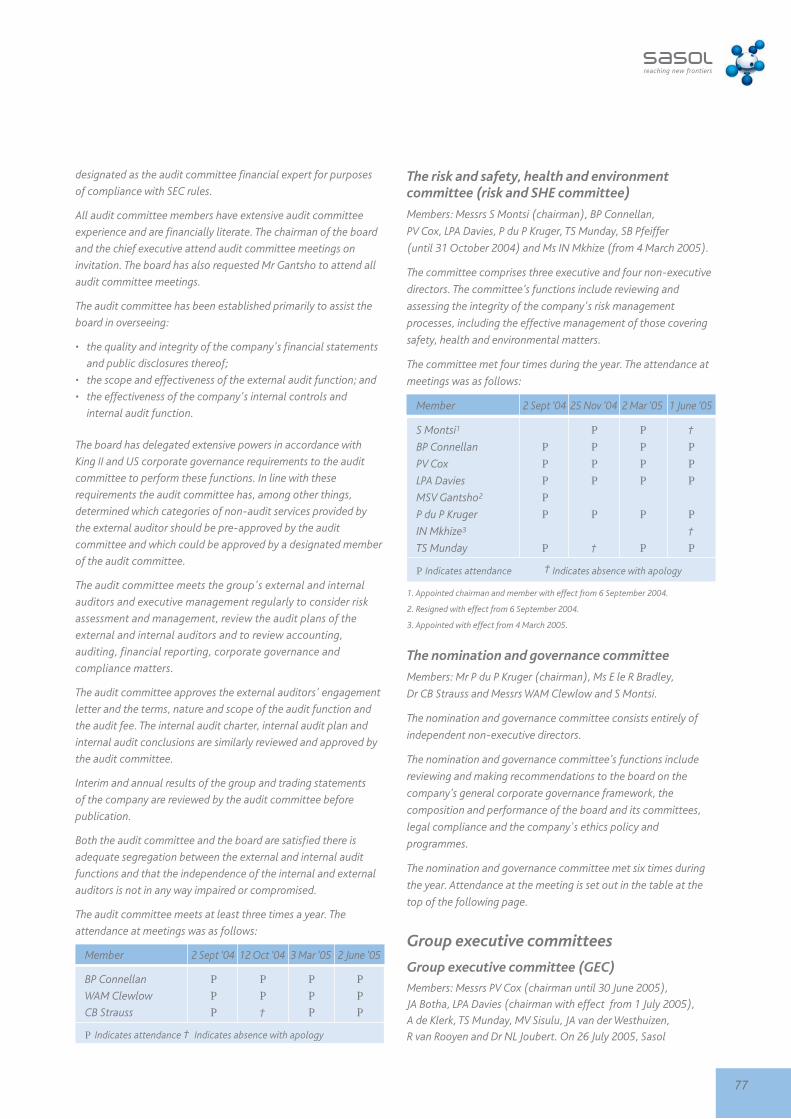
77
designated as the audit committee financial expert for purposes
of compliance with SEC rules.
All audit committee members have extensive audit committee
experience and are financially literate. The chairman of the board
and the chief executive attend audit committee meetings on
invitation. The board has also requested Mr Gantsho to attend all
audit committee meetings.
The audit committee has been established primarily to assist the
board in overseeing:
• the quality and integrity of the company's financial statements
and public disclosures thereof;
• the scope and effectiveness of the external audit function; and
• the effectiveness of the company's internal controls and
internal audit function.
The board has delegated extensive powers in accordance with
King II and US corporate governance requirements to the audit
committee to perform these functions. In line with these
requirements the audit committee has, among other things,
determined which categories of non-audit services provided by
the external auditor should be pre-approved by the audit
committee and which could be approved by a designated member
of the audit committee.
The audit committee meets the group's external and internal
auditors and executive management regularly to consider risk
assessment and management, review the audit plans of the
external and internal auditors and to review accounting,
auditing, financial reporting, corporate governance and
compliance matters.
The audit committee approves the external auditors' engagement
letter and the terms, nature and scope of the audit function and
the audit fee. The internal audit charter, internal audit plan and
internal audit conclusions are similarly reviewed and approved by
the audit committee.
Interim and annual results of the group and trading statements
of the company are reviewed by the audit committee before
publication.
Both the audit committee and the board are satisfied there is
adequate segregation between the external and internal audit
functions and that the independence of the internal and external
auditors is not in any way impaired or compromised.
The audit committee meets at least three times a year. The
attendance at meetings was as follows:
Member 2 Sept ‘04 12 Oct ‘04 3 Mar ‘05 2 June ‘05
BP Connellan P P P PWAM Clewlow P P P PCB Strauss P † P P
P Indicates attendance † Indicates absence with apology
The risk and safety, health and environmentcommittee (risk and SHE committee)
Members: Messrs S Montsi (chairman), BP Connellan,
PV Cox, LPA Davies, P du P Kruger, TS Munday, SB Pfeiffer
(until 31 October 2004) and Ms IN Mkhize (from 4 March 2005).
The committee comprises three executive and four non-executive
directors. The committee’s functions include reviewing and
assessing the integrity of the company's risk management
processes, including the effective management of those covering
safety, health and environmental matters.
The committee met four times during the year. The attendance at
meetings was as follows:
Member 2 Sept ‘04 25 Nov ‘04 2 Mar ‘05 1 June ‘05
S Montsi1 P P †
BP Connellan P P P P
PV Cox P P P P
LPA Davies P P P P
MSV Gantsho2 P
P du P Kruger P P P P
IN Mkhize3 †
TS Munday P † P P
P Indicates attendance † Indicates absence with apology
1. Appointed chairman and member with effect from 6 September 2004.
2. Resigned with effect from 6 September 2004.
3. Appointed with effect from 4 March 2005.
The nomination and governance committee
Members: Mr P du P Kruger (chairman), Ms E le R Bradley,
Dr CB Strauss and Messrs WAM Clewlow and S Montsi.
The nomination and governance committee consists entirely of
independent non-executive directors.
The nomination and governance committee’s functions include
reviewing and making recommendations to the board on the
company’s general corporate governance framework, the
composition and performance of the board and its committees,
legal compliance and the company's ethics policy and
programmes.
The nomination and governance committee met six times during
the year. Attendance at the meeting is set out in the table at the
top of the following page.
Group executive committees
Group executive committee (GEC)
Members: Messrs PV Cox (chairman until 30 June 2005),
JA Botha, LPA Davies (chairman with effect from 1 July 2005),
A de Klerk, TS Munday, MV Sisulu, JA van der Westhuizen,
R van Rooyen and Dr NL Joubert. On 26 July 2005, Sasol
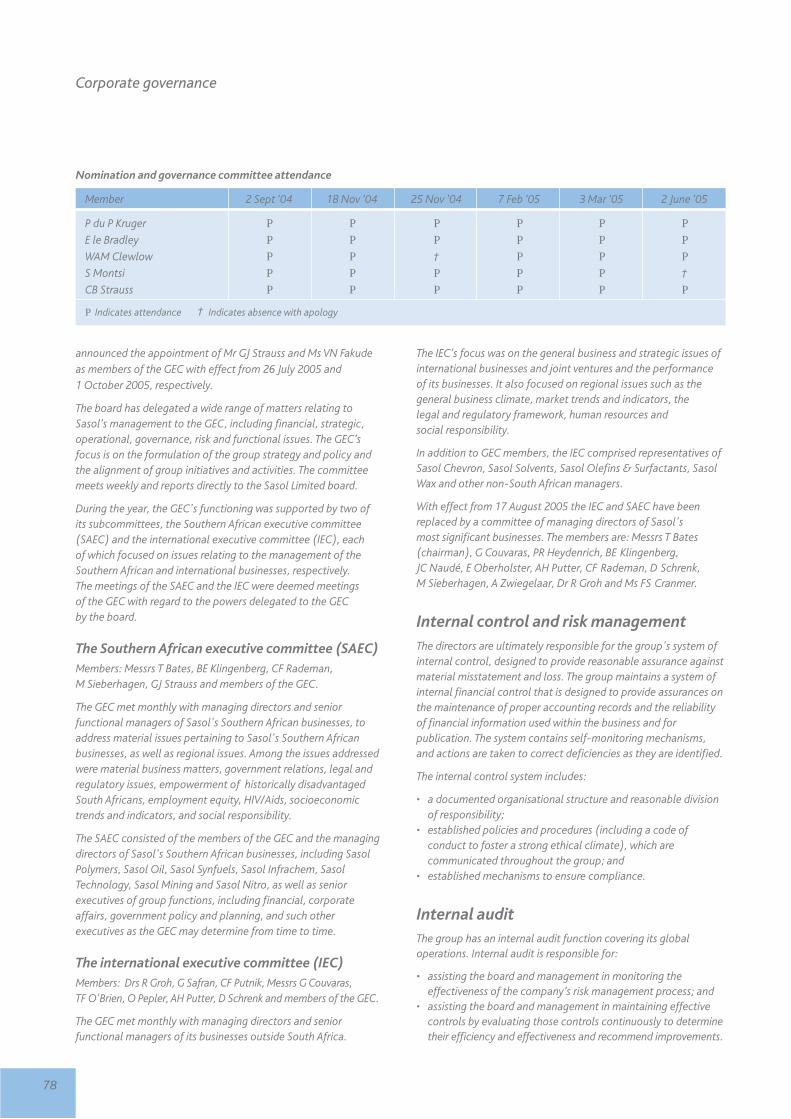
78
announced the appointment of Mr GJ Strauss and Ms VN Fakudeas members of the GEC with effect from 26 July 2005 and 1 October 2005, respectively.
The board has delegated a wide range of matters relating toSasol’s management to the GEC, including financial, strategic,operational, governance, risk and functional issues. The GEC’sfocus is on the formulation of the group strategy and policy andthe alignment of group initiatives and activities. The committeemeets weekly and reports directly to the Sasol Limited board.
During the year, the GEC's functioning was supported by two ofits subcommittees, the Southern African executive committee(SAEC) and the international executive committee (IEC), each of which focused on issues relating to the management of theSouthern African and international businesses, respectively.The meetings of the SAEC and the IEC were deemed meetings of the GEC with regard to the powers delegated to the GEC by the board.
The Southern African executive committee (SAEC)Members: Messrs T Bates, BE Klingenberg, CF Rademan,M Sieberhagen, GJ Strauss and members of the GEC.
The GEC met monthly with managing directors and seniorfunctional managers of Sasol's Southern African businesses, toaddress material issues pertaining to Sasol's Southern Africanbusinesses, as well as regional issues. Among the issues addressedwere material business matters, government relations, legal andregulatory issues, empowerment of historically disadvantagedSouth Africans, employment equity, HIV/Aids, socioeconomictrends and indicators, and social responsibility.
The SAEC consisted of the members of the GEC and the managingdirectors of Sasol's Southern African businesses, including SasolPolymers, Sasol Oil, Sasol Synfuels, Sasol Infrachem, SasolTechnology, Sasol Mining and Sasol Nitro, as well as seniorexecutives of group functions, including financial, corporateaffairs, government policy and planning, and such otherexecutives as the GEC may determine from time to time.
The international executive committee (IEC)Members: Drs R Groh, G Safran, CF Putnik, Messrs G Couvaras,TF O'Brien, O Pepler, AH Putter, D Schrenk and members of the GEC.
The GEC met monthly with managing directors and seniorfunctional managers of its businesses outside South Africa.
The IEC’s focus was on the general business and strategic issues ofinternational businesses and joint ventures and the performanceof its businesses. It also focused on regional issues such as thegeneral business climate, market trends and indicators, the legal and regulatory framework, human resources and social responsibility.
In addition to GEC members, the IEC comprised representatives ofSasol Chevron, Sasol Solvents, Sasol Olefins & Surfactants, SasolWax and other non-South African managers.
With effect from 17 August 2005 the IEC and SAEC have beenreplaced by a committee of managing directors of Sasol's most significant businesses. The members are: Messrs T Bates(chairman), G Couvaras, PR Heydenrich, BE Klingenberg,JC Naudé, E Oberholster, AH Putter, CF Rademan, D Schrenk,M Sieberhagen, A Zwiegelaar, Dr R Groh and Ms FS Cranmer.
Internal control and risk managementThe directors are ultimately responsible for the group's system ofinternal control, designed to provide reasonable assurance againstmaterial misstatement and loss. The group maintains a system ofinternal financial control that is designed to provide assurances onthe maintenance of proper accounting records and the reliabilityof financial information used within the business and forpublication. The system contains self-monitoring mechanisms,and actions are taken to correct deficiencies as they are identified.
The internal control system includes:
• a documented organisational structure and reasonable divisionof responsibility;
• established policies and procedures (including a code ofconduct to foster a strong ethical climate), which arecommunicated throughout the group; and
• established mechanisms to ensure compliance.
Internal auditThe group has an internal audit function covering its globaloperations. Internal audit is responsible for:
• assisting the board and management in monitoring theeffectiveness of the company’s risk management process; and
• assisting the board and management in maintaining effectivecontrols by evaluating those controls continuously to determinetheir efficiency and effectiveness and recommend improvements.
Corporate governance
Nomination and governance committee attendance
Member 2 Sept ‘04 18 Nov ‘04 25 Nov ‘04 7 Feb ‘05 3 Mar ‘05 2 June ‘05
P du P Kruger P P P P P PE le Bradley P P P P P PWAM Clewlow P P † P P PS Montsi P P P P P †
CB Strauss P P P P P P
P Indicates attendance † Indicates absence with apology

79
The controls subject to evaluation encompass:
• the information management environment;
• the reliability and integrity of financial and operating information;
• the safeguarding of assets; and
• the effective and efficient use of the company's resources.
Audit plans are based on an assessment of risk areas, as well as on
issues highlighted by the audit committee and management. Audit
plans are updated as appropriate to ensure they are responsive to
changes in the business. A comprehensive findings report is
presented to the risk and SHE committee and the audit committee
at each of their scheduled meetings.
Follow-up audits are conducted in areas where significant internal
control weaknesses are found.
Corporate governance best practice requires that the internal
audit function reports directly to the audit committee. Such direct
reporting is ensured by the audit committee's mandate to:
• evaluate the effectiveness of internal audit;
• review and approve the internal audit charter, internal audit
plans and internal audit conclusions about internal control;
• review significant internal audit findings and the adequacy of
corrective action taken;
• assess the performance of the internal audit function and the
adequacy of available internal audit resources;
• review significant differences of opinion between management
and the internal audit function; and
• consider the appointment, dismissal or reassignment of the
head of internal audit.
The charter of the internal audit department provides that the
head of internal audit has direct access to the chief executive and
the chairman of the audit committee.
The head of internal audit reports administratively to the group
general manager responsible for the company secretarial, legal,
risk management and insurance departments.
Risk management
The board is responsible for governing risk management
processes in the Sasol group in accordance with corporate
governance best practice.
The establishment of a more formalised enterprise-wide risk
management process was initiated during the 2002 financial year
with the following principal objectives:
• providing the board with assurance that significant business risks
are systematically identified, assessed and reduced to acceptable
levels in order to achieve an optimal risk-reward profile; and
• making risk identification and risk management an integral part
of the daily activities of everyone in the organisation.
Substantial progress has been made to date in achieving the
above objectives. There are still certain components of the
process which need to be further developed and embedded and
programmes are in place to address these.
Sasol’s enterprise-wide risk management process is guided by the
following key principles:
• a clear assignment of responsibilities and accountabilities;
• the use of a single enterprise-wide risk management framework
and process;
• independent review of the effectiveness of the process; and
• the context of risk management activities is the achievement of
business plans and strategic objectives.
The company's insurance services department, with the assistance
of external consultants, undertakes regular risk control audits
of all the company's plants and operations using recognised
international procedures and standards. The group participates in
an international insurance programme that provides, at competitive
cost, insurance cover for losses above acceptable deductibles.
Most significant risks
The most significant risks currently faced by the group are:
• volatility in currency exchange rates;
• volatility in crude oil, natural gas and petroleum product prices;
• cyclicality in petrochemical product prices;
• not succeeding with the expedient exploitation of
technological advances;
• our gas-to-liquids projects not proving sufficiently
viable as planned;
• the sustainability of beneficial supply agreements entered into
after termination on 1 January 2004 of the agreements in terms of
which petroleum products are sold to South African oil companies;
• sociopolitical and other risks relating to the countries in
which we operate;
• regulatory changes impacting on our mining and
petroleum businesses;
• an inability to attract and retain desired levels of sufficiently
skilled employees;
• patent and related intellectual property competition;
• changes in consumer and safety, health and environmental laws
and regulations;
• increasing competition by products originating from countries with
low production costs;
• industry-related accidents causing property damages, personal
injuries and/or environmental contamination;*
• an inability to interpret correctly and ensure ongoing compliance
with legal and regulatory requirements;
• not responding timeously to emerging regulations/requirements
relating to the empowerment of historically disadvantaged South
Africans; and
• risks associated with the simultaneous construction and
commissioning of new plants and businesses.
* See also page 59 and 60 for more information on operational initiatives to improve safety.
80
Corporate governance
The responsibility for monitoring the management by line
management of each of these risks is assigned to a senior group
executive member.
Disaster recovery plans are continually reviewed for critical
information management systems that could have a material
impact on the group's continuing operations. Certain of these plans
are subject to regular testing and, in other cases, are subjected to
ongoing tests to ensure their robustness and reliability.
Sustainability reporting
The company reports on all aspects of its social, transformation,
ethical and safety, health and environmental policies and
practices to the board and to its stakeholders. A comprehensive
sustainability report dealing with these issues was published
by the company in November 2004 and is available on the
company's website.
See pages 54 to 65 for more information on Sasol’s
sustainability reporting.
Worker participation and employment equity
The group has established participative structures on issues that
affect employees directly and materially and is committed to
promoting equal opportunities and fair employment practices
regardless of employees’ ethnic origin or gender. Several
programmes have been implemented to ensure practical
application of the group's commitment to worker participation
and employment equity, while maintaining the company's high
standards and statutory compliance.
Code of ethics
The company’s code of ethics consists of four fundamental ethical
principles – responsibility, honesty, fairness and respect – and
15 ethical standards. These cover such issues as bribery and
corruption, fraud, insider trading, human rights and discrimination
and include a commitment to conducting our business with due
regard to the interests of all our stakeholders and the environment.
The code embodies the highest standards of compliance with laws
and regulations. An ethics forum has been established to monitor
and report on ethics, best practice and compliance requirements, and
to recommend amendments to the code and the guide as required.
Employee performance against Sasol's values, which incorporates
the code of ethics, is assessed as part of Sasol's performance
appraisal system.
Any amendment or waiver of the code as it relates to the chief
executive or chief financial officer will be posted on the website
within five business days following such amendment or waiver.
No such amendments or waivers are anticipated.
The principles contained in the code have been communicated
throughout the group and are available on the company's website.
An ethics hotline, operated by an independent service provider,
has been operating since 2001. The hotline provides an
independent facility for stakeholders of the company to
anonymously report fraud and other crimes, safety malpractices,
deviations from the procurement policy, financial reporting
irregularities and other irregularities.
Insider trading
The company's directors, executives and senior employees are
prohibited from dealing in Sasol shares during certain prescribed
restricted periods. The company secretary regularly disseminates
written notices to inform them of the insider trading legislation
and advise them of closed periods.
Disclosure
Sasol has a disclosure committee which oversees compliance with
the disclosure requirements contained in the JSE, SEC and NYSE
rules. Disclosure controls and procedures have been implemented
to ensure that accurate and timely disclosure of information that
may have a material effect on the value of Sasol securities or
influence investment decisions is made to shareholders, the
financial community and the investing public.
During the year, a project to ensure compliance with the
requirements for controls over financial reporting of SOX 404
during the next financial year has been successfully completed.
See page 11 of the annual financial statements for more details.
Investor relations and shareholdercommunication
The company's chief executive, the chief financial officer and
investor relations management conduct regular presentations on
the group's performance and strategy to analysts, institutional
investors and the media in South Africa, North America and
Europe. The company's investor relations management maintains
regular contact with the investment community and analysts.
To ensure the company communicates with its smaller
shareholders and those stakeholders without access to the
electronic media, the company publishes and reports on details of
its corporate actions and performance (including its interim and
final results) in the main South African daily newspapers.
The company's communications department also maintains
regular contact with the media by disseminating relevant
information. The company maintains a website through which
access is available to the company's latest financial, operational
and historical information, including its annual report.
81
summarised financial information
82 Highlights
83 Balance sheet
84 Income statement
85 Changes in equity statement
85 Value added statement
86 Cash flow statement
88 Salient features
90 Business segment information
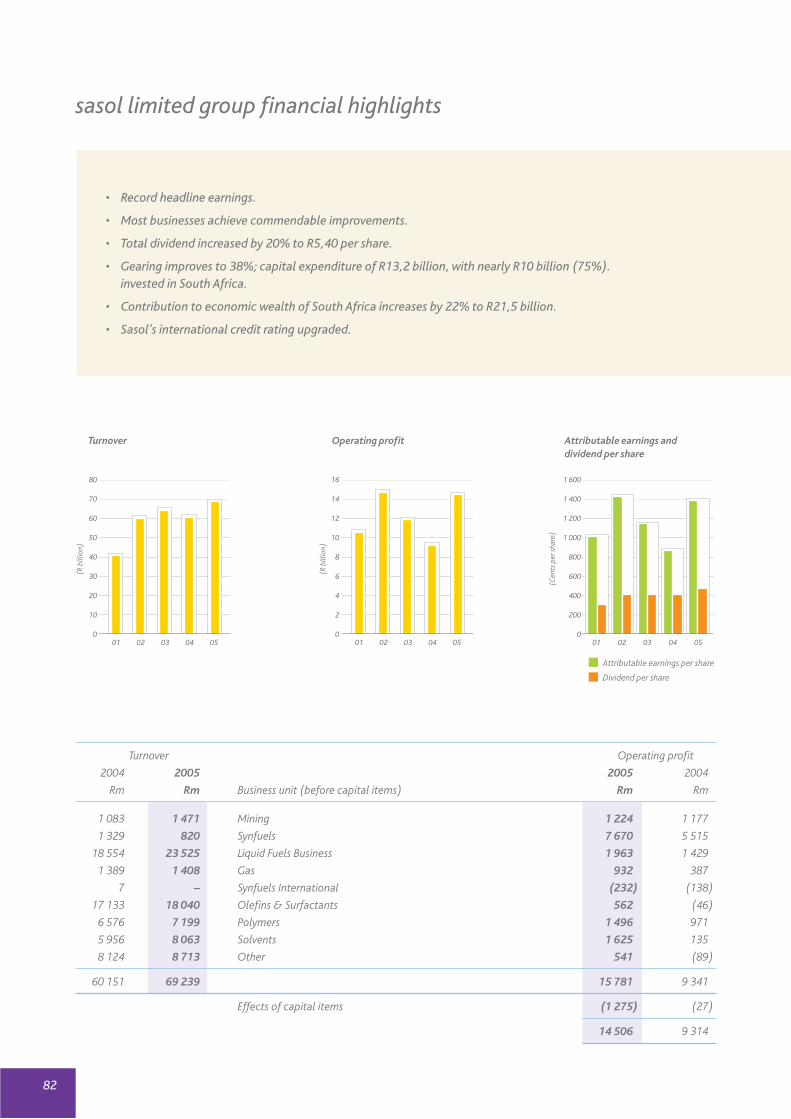
82
sasol limited group financial highlights
• Record headline earnings.
• Most businesses achieve commendable improvements.
• Total dividend increased by 20% to R5,40 per share.
• Gearing improves to 38%; capital expenditure of R13,2 billion, with nearly R10 billion (75%).invested in South Africa.
• Contribution to economic wealth of South Africa increases by 22% to R21,5 billion.
• Sasol’s international credit rating upgraded.
Turnover
01 02 03 04 05
80
70
60
50
40
30
20
10
0
(R b
illio
n)
Operating profit
01 02 03 04 05
16
14
12
10
8
6
4
2
0
(R b
illio
n)
Attributable earnings anddividend per share
01 02 03 04 05
1 600
1 400
1 200
1 000
800
600
400
200
0
(Cen
ts p
er s
hare
)
Attributable earnings per share
Dividend per share
Turnover Operating profit
2004 2005 2005 2004
Rm Rm Business unit (before capital items) Rm Rm
1 083 1 471 Mining 1 224 1 177
1 329 820 Synfuels 7 670 5 515
18 554 23 525 Liquid Fuels Business 1 963 1 429
1 389 1 408 Gas 932 387
7 – Synfuels International (232) (138)
17 133 18 040 Olefins & Surfactants 562 (46)
6 576 7 199 Polymers 1 496 971
5 956 8 063 Solvents 1 625 135
8 124 8 713 Other 541 (89)
60 151 69 239 15 781 9 341
Effects of capital items (1 275) (27)
14 506 9 314

Mining
Synfuels
Liquid Fuels Business
Gas
Synfuels International
Olefins & Surfactants
Polymers
Solvents
Other
2005 2004
Turnover
South Africa
Rest of Africa
Europe
Middle East, India and Far East
North America
South America
South-East Asia
2005 2004
Operating profit
83
Gearing
01 02 03 04 05
45
40
35
30
25
20
15
10
5
0
(%)
Turnover Operating profit
2004 2005 2005 2004
Rm Rm Geographic analysis Rm Rm
28 954 35 395 South Africa 12 236 8 505
3 062 2 553 Rest of Africa 536 204
15 632 17 145 Europe 1 486 591
3 509 3 840 Middle East, India and Far East 389 277
7 060 8 149 North America (221) (303)
723 760 South America (5) 4
1 211 1 397 South-East Asia 85 36
60 151 69 239 14 506 9 314

84
balance sheet
2005 2004
at 30 June Rm Rm
AssetsProperty, plant, equipment 56 550 46 858
Goodwill (net of negative goodwill in 2004) 509 92
Intangible assets 1 900 2 236
Post-retirement benefit assets 300 239
Deferred tax assets 409 306
Other long-term assets 2 212 1 877
Non-current assets 61 880 51 608
Investments held-for-sale 41 –
Inventories 9 995 8 292
Trade and other receivables 12 384 10 971
Short-term financial assets 178 25
Restricted cash 1 002 527
Cash 2 509 2 063
Current assets 26 109 21 878
Total assets 87 989 73 486
Equity and liabilitiesShareholders' equity 43 530 35 027
Minority interest 256 373
Long-term debt 12 951 9 110
Long-term provisions 2 954 2 362
Post-retirement benefit obligations 2 970 2 724
Long-term deferred income 763 237
Deferred tax liability 6 286 5 768
Non-current liabilities 25 924 20 201
Short-term debt 3 300 3 265
Short-term financial liabilities 792 1 205
Other current liabilities 11 572 9 302
Bank overdraft (including overnight borrowings) 2 615 4 113
Current liabilities 18 279 17 885
Total equity and liabilities 87 989 73 486
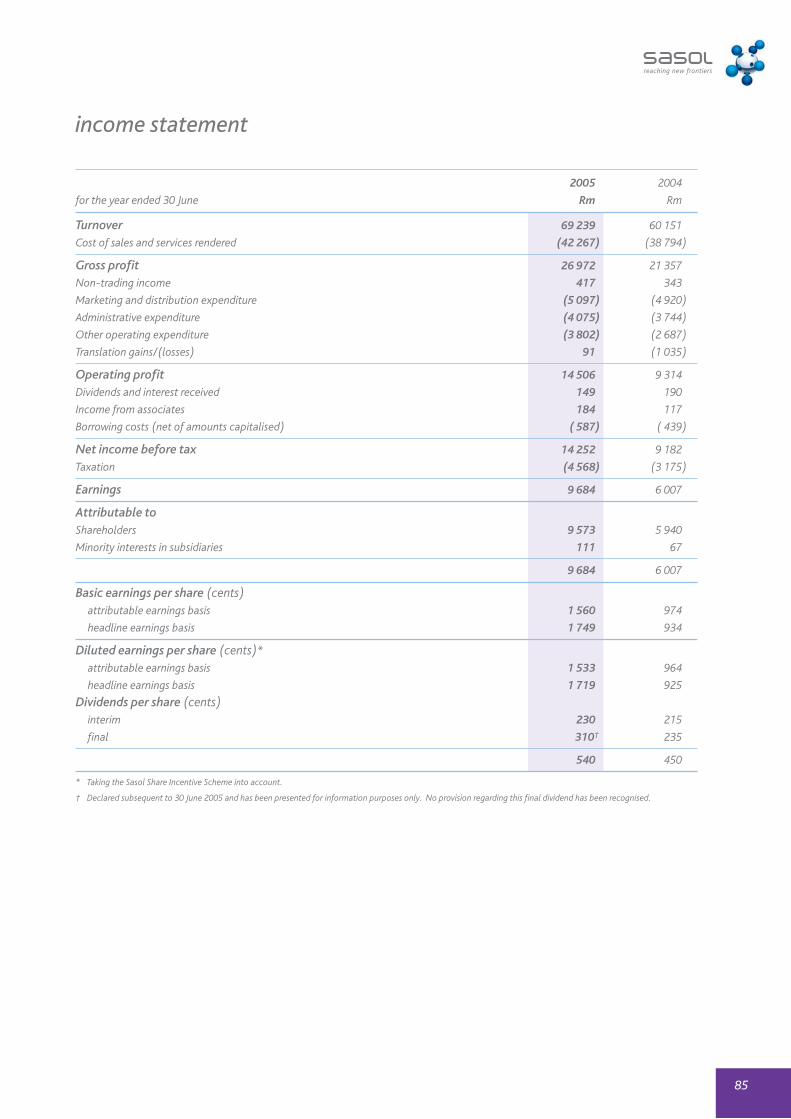
85
income statement
2005 2004
for the year ended 30 June Rm Rm
Turnover 69 239 60 151
Cost of sales and services rendered (42 267) (38 794)
Gross profit 26 972 21 357
Non-trading income 417 343
Marketing and distribution expenditure (5 097) (4 920)
Administrative expenditure (4 075) (3 744)
Other operating expenditure (3 802) (2 687)
Translation gains/(losses) 91 (1 035)
Operating profit 14 506 9 314
Dividends and interest received 149 190
Income from associates 184 117
Borrowing costs (net of amounts capitalised) ( 587) ( 439)
Net income before tax 14 252 9 182
Taxation (4 568) (3 175)
Earnings 9 684 6 007
Attributable toShareholders 9 573 5 940
Minority interests in subsidiaries 111 67
9 684 6 007
Basic earnings per share (cents)attributable earnings basis 1 560 974
headline earnings basis 1 749 934
Diluted earnings per share (cents)*
attributable earnings basis 1 533 964
headline earnings basis 1 719 925
Dividends per share (cents)interim 230 215
final 310† 235
540 450
* Taking the Sasol Share Incentive Scheme into account.
† Declared subsequent to 30 June 2005 and has been presented for information purposes only. No provision regarding this final dividend has been recognised.

86
changes in equity statement
2005 2004
for the year ended 30 June Rm Rm
Opening balance 35 027 33 518
Negative goodwill written off 610 –
Shares issued 311 109
Shares repurchased – ( 33)
Attributable earnings 9 573 5 940
Dividends paid (2 856) (2 745)
Increase/(decrease) in foreign currency translation reserve 313 (1 217)
Increase/(decrease) in cash flow hedge accounting reserve 552 ( 545)
Closing balance 43 530 35 027
ComprisingShare capital 3 203 2 892
Share repurchase programme (3 647) (3 647)
Accumulated earnings 45 643 38 236
Foreign currency translation reserve (1 336) (1 569)
Investment fair value reserve 2 2
Cash flow hedge accounting reserve ( 335) ( 887)
Shareholders' equity 43 530 35 027
value added statement
2005 2004
for the year ended 30 June Rm Rm
Turnover 69 239 60 151
Purchased materials and services (42 079) (37 085)
Value added 27 160 23 066
Investment income 333 307
Wealth created 27 493 23 37
South Africa 21 474 17 664
Rest of World 6 019 5 709
Wealth created 27 493 23 373
Employees 8 645 8 731
Providers of equity capital 2 967 2 812
Providers of loan capital 587 439
Government 4 326 3 421
Reinvested in the group 10 968 7 970
Wealth distribution 27 493 23 373
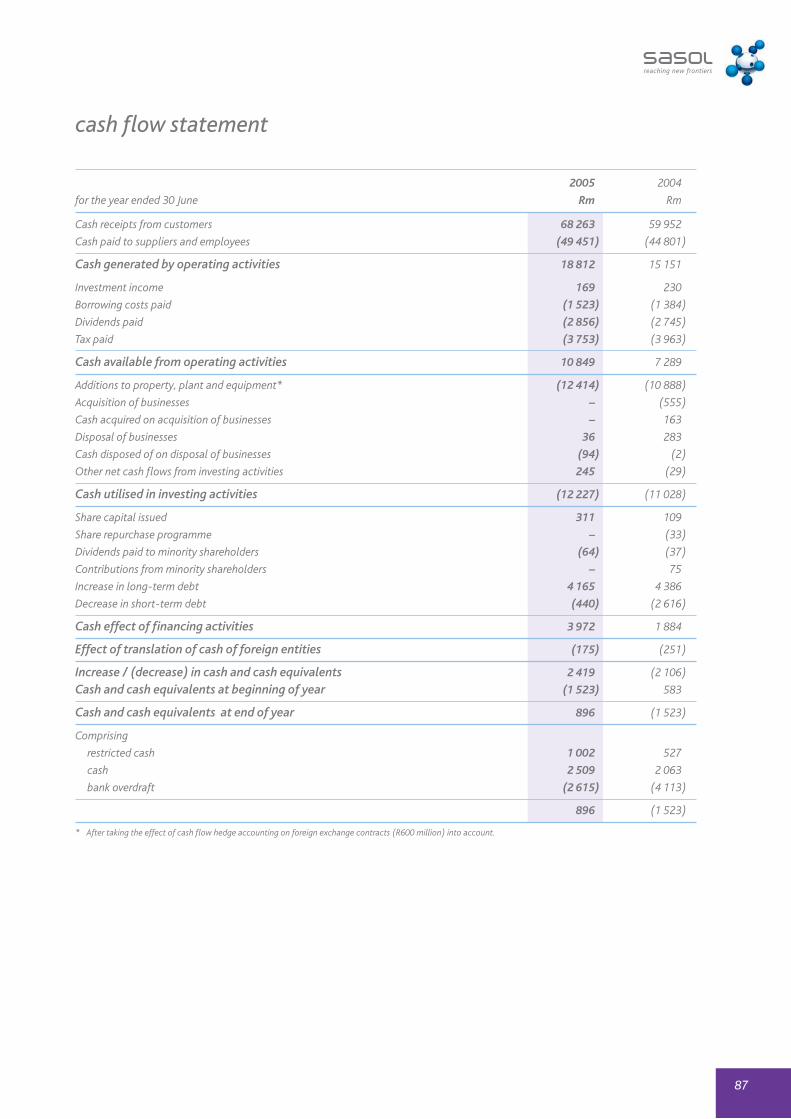
87
cash flow statement
2005 2004
for the year ended 30 June Rm Rm
Cash receipts from customers 68 263 59 952
Cash paid to suppliers and employees (49 451) (44 801)
Cash generated by operating activities 18 812 15 151
Investment income 169 230
Borrowing costs paid (1 523) (1 384)
Dividends paid (2 856) (2 745)
Tax paid (3 753) (3 963)
Cash available from operating activities 10 849 7 289
Additions to property, plant and equipment* (12 414) (10 888)
Acquisition of businesses – (555)
Cash acquired on acquisition of businesses – 163
Disposal of businesses 36 283
Cash disposed of on disposal of businesses (94) (2)
Other net cash flows from investing activities 245 (29)
Cash utilised in investing activities (12 227) (11 028)
Share capital issued 311 109
Share repurchase programme – (33)
Dividends paid to minority shareholders (64) (37)
Contributions from minority shareholders – 75
Increase in long-term debt 4 165 4 386
Decrease in short-term debt (440) (2 616)
Cash effect of financing activities 3 972 1 884
Effect of translation of cash of foreign entities (175) (251)
Increase / (decrease) in cash and cash equivalents 2 419 (2 106)
Cash and cash equivalents at beginning of year (1 523) 583
Cash and cash equivalents at end of year 896 (1 523)
Comprising
restricted cash 1 002 527
cash 2 509 2 063
bank overdraft (2 615) (4 113)
896 (1 523)
* After taking the effect of cash flow hedge accounting on foreign exchange contracts (R600 million) into account.

88
salient features
2005 2004
for the year ended 30 June Rm Rm
Selected ratiosReturn on equity % 24,4 17,3
Return on total assets % 18,4 13,4
Operating margin % 21,0 15,5
Borrowing cost cover times 9,7 7,0
Dividend cover times 2,9 2,2
Share statisticsTotal shares in issue million 676,9 671,3
Treasury shares (share repurchase programme) million 60,1 60,1
Weighted average number of shares million 613,8 610,0
Diluted weighted average number of shares million 624,4 616,2
Share price (closing) Rand 180,80 96,10
Market capitalisation Rm 122 379 64,509
Net asset value per share rand 70,58 57,31
Other financial informationTotal debt (including bank overdraft)
interest-bearing Rm 18 865 16,448
non-interest-bearing Rm 1 40
Borrowing costs capitalised Rm 1116 1105
Capital commitments 19 169 24,780
authorised and contracted Rm 26 679 18,216
authorised, not yet contracted Rm 7 740 14,397
less expenditure to date Rm (15 250) (7,833)
Guarantees and contingent liabilities
total amount Rm 33 122 25,835
liability included on balance sheet Rm 11 230 9,759
Significant items in operating profit
employee costs Rm 8 645 8,731
depreciation of property, plant and equipment Rm 3 591 4,723
operating lease charges Rm 462 350
Directors' remuneration Rm 26 22
Share options granted to directors – cumulative '000 1 205 1,451
Effective tax rate % 32,1 34,6
Employees number 30,004 30,910
Average crude oil price – dated Brent US$/barrel 46,17 31,30
Average rand/US$ exchange rate 1US$ = rand 6,21 6,88
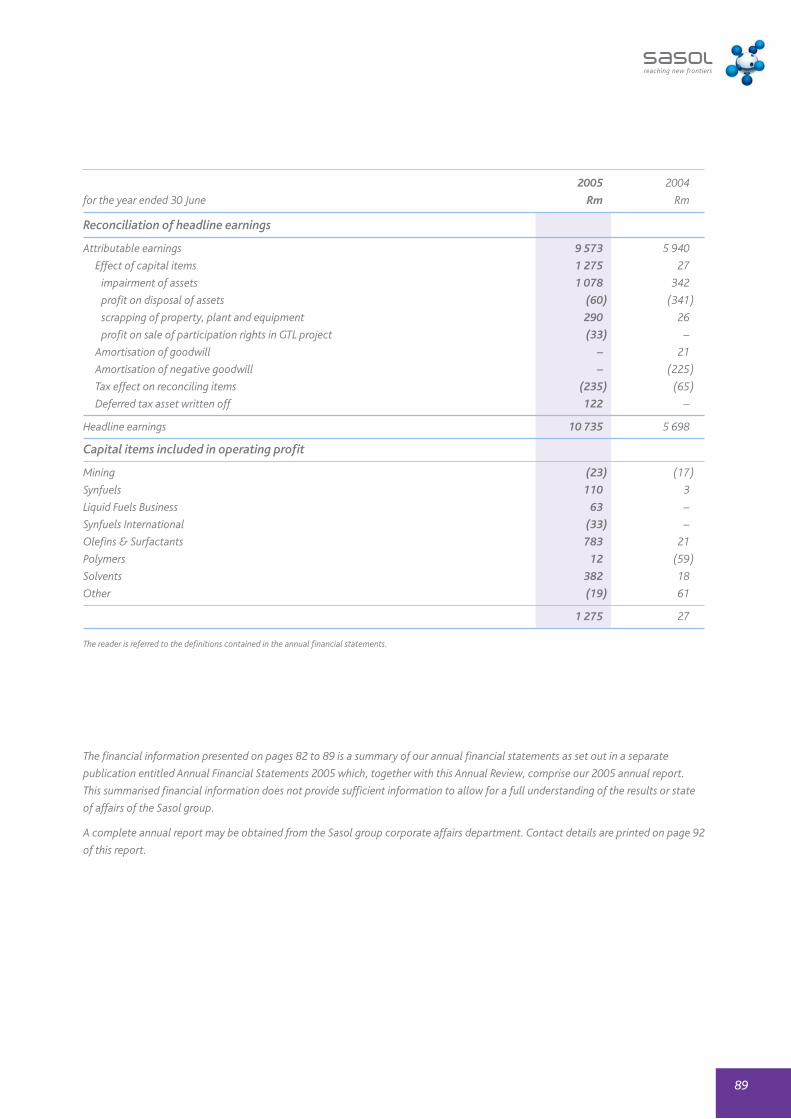
89
2005 2004
for the year ended 30 June Rm Rm
Reconciliation of headline earnings
Attributable earnings 9 573 5 940
Effect of capital items 1 275 27
impairment of assets 1 078 342
profit on disposal of assets (60) (341)
scrapping of property, plant and equipment 290 26
profit on sale of participation rights in GTL project (33) –
Amortisation of goodwill – 21
Amortisation of negative goodwill – (225)
Tax effect on reconciling items (235) (65)
Deferred tax asset written off 122 –
Headline earnings 10 735 5 698
Capital items included in operating profit
Mining (23) (17)
Synfuels 110 3
Liquid Fuels Business 63 –
Synfuels International (33) –
Olefins & Surfactants 783 21
Polymers 12 (59)
Solvents 382 18
Other (19) 61
1 275 27
The reader is referred to the definitions contained in the annual financial statements.
The financial information presented on pages 82 to 89 is a summary of our annual financial statements as set out in a separate
publication entitled Annual Financial Statements 2005 which, together with this Annual Review, comprise our 2005 annual report.
This summarised financial information does not provide sufficient information to allow for a full understanding of the results or state
of affairs of the Sasol group.
A complete annual report may be obtained from the Sasol group corporate affairs department. Contact details are printed on page 92
of this report.
90
ammonium nitrate: A colourless, crystalline compound derivedfrom nitric acid and ammonia and used mostly for fertilisers andcommercial explosives.
autothermal reformer: A type of catalytic partial-oxidation reactorin which the endothermic heat needed for the reforming reactions isprovided by combustion reactions of oxygen in the feed.
barrel (b): A standard international petroleum industryvolumetric measure equal to 42 US gallons, 35 imperial (UK)gallons or 159,1 litres.
bio-diesel: A form of diesel derived in part from renewable bioticsources such as soybeans and rapeseeds.
black products: In the context of Sasol's South Africanoperations, those secondary products from coal gasification – tarsand pitches – that often contain coal. They are difficult andexpensive to process, have little commercial value and may needto be stored at production sites.
catalyst: Usually a metal or metal-containing material used toaccelerate a reaction between two or more chemical elements orcompounds. A catalyst is not generally changed in the process,although its efficacy may reduce with time.
central processing facility: A petrochemical processing plantwith support infrastructure used at or near natural gas fields toconduct several processing steps on natural gas from multiplewells before the gas is fed into a transmission pipeline.
cetane number: This refers to the results of a standardised testconducted to measure the combustion properties of a diesel fuel.This is the equivalent of the octane testing conducted for petrol.Cetane is a colourless, liquid, straight-chain paraffin.
comonomer: A chemical, such as 1-butene, 1-hexene or 1-octene, that is blended with a monomer such as ethylene toimprove or modify certain properties such as impact strength,flexibility or clarity of a polymer such as polyethylene.
compression-ignition: The form of ignition used in a diesel-fuelled version of an internal-combustion engine. The diesel isignited spontaneously as it is injected into the cylinder because ofthe heat emanating from the compression of the air charge. This isin contrast to spark ignition used in petrol engines.
continuous-miner: A large, remote-controlled vehicle used in anunderground colliery to cut and remove coal from a coalface withthe aid of a spiked, rotating cutting drum.
cracker: Petrochemical jargon referring to a chemical reactionvessel used for decomposing (cracking) petrochemicalcompounds such as naphtha, liquefied petroleum gas or waxes.
dieselisation: A description of the trend presently occurring inEurope (and elsewhere) where vehicles are increasingly beingfuelled by diesel, primarily due to high fuel efficiencies, taxincentives and modern, effective diesel engines.
ethylene: A colourless, flammable hydrocarbon gas of the alkeneseries derived through Sasol's process and used principally in SouthAfrica as feedstock for producing polyethylene and polyvinyl chloride.
Fischer-Tropsch process: A chemical process pioneered inGermany by Franz Fischer and Hans Tropsch in the 1920s andsubsequently evolved by Sasol. It is used to produce synthesis gas,which is reacted under temperature in the presence of a catalystto produce a diverse spectrum of hydrocarbons for downstreamprocessing into liquid transportation fuels and chemicals.
gas-to-liquids (GTL): A petrochemical term referring to a processtechnology, plant or venture that entails the conversion of ahydrocarbon feedstock gas (usually natural gas or methane) intoa liquid transportation fuel and related hydrocarbons such asdiesel, kerosene and naphtha.
gasification: The process of converting coal in a gasifier into gasesand co-products under high temperature and pressure in thepresence of steam and oxygen. The purified gases and co-products are then converted into desired products.
greenhouse gases: Gases – usually formed anthropogenically – that contribute to the Earth's intensified greenhouse effect orglobal warming. Greenhouse gases include carbon dioxide, nitrousoxides, ozone, methane and chlorofluorocarbons.
hexene (1-hexene): An alpha olefin emanating from the SasolSynthol process. An alpha olefin is a straight-chain hydrocarbonmolecule containing a single, terminal double-bond betweenatoms. Hexene is used mostly as a comonomer for producingcertain plastics.
hydroformylation: A type of carbonylation (ie, involving carbonmonoxide) reaction that uses carbon monoxide and hydrogen withthe aid of a catalyst to convert an olefin into an aldehyde orprimary alcohol, depending on the selected reaction conditionssuch as pressure, temperature and catalyst type.
ketones: Hydrocarbon compounds containing a carbonyl group (-CO-) in the molecule attached to two hydrocarbon radicals.Ketones include acetone, methyl ethyl ketone (MEK) and methylisobutyl ketone (MIBK). They are used mostly as solvents orchemical feedstock.
linear alkylbenzene (LAB): An organic compound with an alkylgroup bound to a benzene ring that is produced in a process involvingbenzene and long-chain paraffins. LAB is used as an intermediate forproducing surfactants used in the detergent industry.
liquefied petroleum gas (LPG): Gaseous hydrocarbons orpetroleum gases such as propane, butane and pentane pressurisedin liquefied form and used for heating applications such ascamping stoves and lighters.
methane: The simplest alkane, methane is a gas that occursnaturally in petroleum wells, natural gas fields and as marsh gas.Coal gas also contains a large proportion of methane.
methanol: A toxic, colourless alcohol produced from varioussources, including the destructive distillation of wood, the catalyticoxidisation of methane and the synthesis of carbon monoxide andhydrogen in the presence of a catalyst. In it is an importantintermediate chemical and is often used as a versatile solvent.
glossary of terms
91
monomer: A chemical such as ethylene or propylene capable ofbeing converted into a long-chain polymer or a synthetic resin bycombining with itself or other similar molecules or compounds.
naphtha: A generic term for a flammable, light distillate orhydrocarbon feedstock, or a mixture of light hydrocarbons, usedfor gas or petrochemical manufacture.
natural gas: A mixture of hydrocarbon gases in the Earth's crustcontaining methane, as well as ethane, propane, butane, nitrogen,carbon dioxide and sulphur compounds such as hydrogen sulphide.
nitric acid: A colourless, corrosive, fuming and unstable liquid,which Sasol derives by oxidising some of its ammonia production.It is important intermediate for producing ammonium nitrate andits derivatives.
octene (1-octene): An alpha olefin emanating from the Sasol Synthol process, 1-octene is a straight-chain C8
hydrocarbon molecule that contains a single, terminal double-bond between atoms. It is used mostly as a comonomer forproducing certain plastics.
pentene (1-pentene): An alpha olefin emanating from the SasolSynthol process, 1-pentene is a straight-chain C5 hydrocarbonmolecule that contains a single, terminal double-bond betweenatoms. It is used for producing certain plastics and agrochemicals.
polyethylene: A common plastic that has a macromoleculecomprising long-chain ethylene molecules. Polyethylene is mostlyused to produce packaging materials, pipe and moulded fittingsand to sheath wire and cable.
polymer: A compound whose molecule is formed from a largenumber of repeated units of one or more compounds of lowmolecular-weight (monomers). Synthetic polymers are usedextensively in plastics. Polymers do not have a definite formulabecause they consist of many chains of different lengths.
polypropylene: Another common plastic, this versatile material
with many end-applications is derived from the polymerisation of
propylene. It is used for automotive components, furniture, self-
hinged containers, medical equipment, carpet backings and
woven bags.
polyvinyl chloride (PVC): PVC is a tough, white, solid
thermoplastic than can be softened with plasticisers. Sasol
produces PVC by polymerising vinyl chloride monomer derived from
ethylene and chlorine. It is used for sheathing cables, moulding
footwear and for moulding bottles and other packaging forms.
propanol: A colourless and volatile alcohol existing in twoisomers (iso-propanol and normal-propanol) used mainly as asolvent and to prepare esters such as propyl acetate.
propylene: A colourless, gaseous hydrocarbon (olefin) obtainedfrom petroleum by cracking alkanes, among other petrochemicalprocesses. In the case of Sasol's operations, it is a co-product ofthe Synthol process that is refined before being converteddownstream into polypropylene and butanol.
reforming: A generic term referring to petrochemical processesthat radically change the feed molecules. For example, reformingof naphtha is used to created high-octane petrol componentsfrom the low-value naphtha. The term is also used to refer to theprocess of converting methane or natural gas into synthesis gas.
Responsible Care: An international chemical industry initiative tomaintain responsible and beneficial control of the impacts itimposes on human safety and health and both the social andbiophysical environments, thereby instilling and maintaininggreater confidence in the industry's stakeholders.
Sasol Advanced Synthol ™ (SAS™) reactor: The proprietarySasol reactor at the heart of the SAS™ process, the high-temperature version of Sasol's Fischer-Tropsch process used at Secunda to produce a synthetic form of crude oil and chemical feedstock.
Sasol Slurry Phase Distillate ™ (Sasol SPD™) process: Aproprietary version of Sasol's low-temperature Fischer-Tropschprocess used to convert synthesis gas into waxes and relatedpetrochemical streams for the end production and marketing ofwaxes and/or diesel.
solvent: A liquid that dissolves another substance or substances to form a solution.
spark-ignition engine: The petrol-fuelled version of an internal-combustion engine in which electrical sparks from spark plugs areused to ignite the fuel in the combustion chambers.
surfactant (surface active agent): A soluble chemical compoundsuch as a detergent or soap that is added to a liquid to increase itsspreading or wetting properties by reducing its surface tension.
synthesis: The formation of more complex chemical compoundsor molecules from simpler compounds or molecules, as in theFischer-Tropsch process.
synthesis gas (syngas): A mixture of carbon monoxide and hydrogen used to produce certain petrochemicals indownstream processes.
volatile organic compounds (VOCs): A generic term forhydrocarbon compounds, such as industrial alcohols, ketones and other solvents, that evaporate rapidly and easily at ambienttemperature when exposed to the air and which are, or can be,harmful to human health as a result of overexposure or misuse.
wax: A liquid or solid long-chain paraffinic compound used forhot-melt adhesives, mould-release agents, printing inks,cosmetics, food coating, board coatings, polishes and candles,among other applications.
92
Shareholder information helpline
We have reserved 0800 202 361 as the South African toll-free
number and +27 (0) 11 870 8222 for shareholders calling
from outside South Africa.
The toll-free inbound telephone helpline will enable
shareholders to obtain information regarding the resolutions
and to provide assistance for completing proxy forms.
Depositary Bank
The Bank of New York
Depositary Receipts Division
101 Barclay Street
New York 10286, New York
The Bank of New York maintains a sponsored dividend
reinvestment and direct purchase programme for Sasol’s
Depositary Receipts. As a participant in Global BuyDIRECTSM,
investors benefit from the direct ownership of their Depositary
Receipts, the efficiency of receiving corporate communications
directly from the Depositary Receipts issuer, and the savings
resulting from the reduced brokerage and transaction costs.
Additional information is available at www.globalbuydirect.com
Questions or correspondence about Global BuyDIRECT should
be addressed to:
The Bank of New York
Investor Relations
PO Box 11258
Church Street Station
New York, New York 10286-1258
Toll-free telephone for US Global BuyDIRECT participants:
1-888-BNY-ADRS
Telephone for international callers: 212-815-3700
E-mail: [email protected]
Company registration number
1979/003231/06
Addresses
Business address and registered office
1 Sturdee Avenue, Rosebank 2196
Republic of South Africa
Postal and electronic addresses andtelecommunication numbers
PO Box 5486, Johannesburg 2000
Republic of South Africa
Telephone +27 (0) 11 441-3111
Telefax +27 (0) 11 788-5092
Website: http://www.sasol.com
Share registrars
Computershare Investor Services 2004 (Pty) Limited
70 Marshall Street, Johannesburg 2001
Republic of South Africa
PO Box 61051, Marshalltown 2107
Republic of South Africa
Telephone +27 (0) 11 370-7700
Investor relations
Telephone +27 (0) 11 441-3420
Telefax +27 (0) 11 441-3481
e-mail: [email protected]
Sasol group corporate affairs department
Telephone: +27 (0) 11 441-3249
Telefax: +27 (0) 11 441-3236
contact information
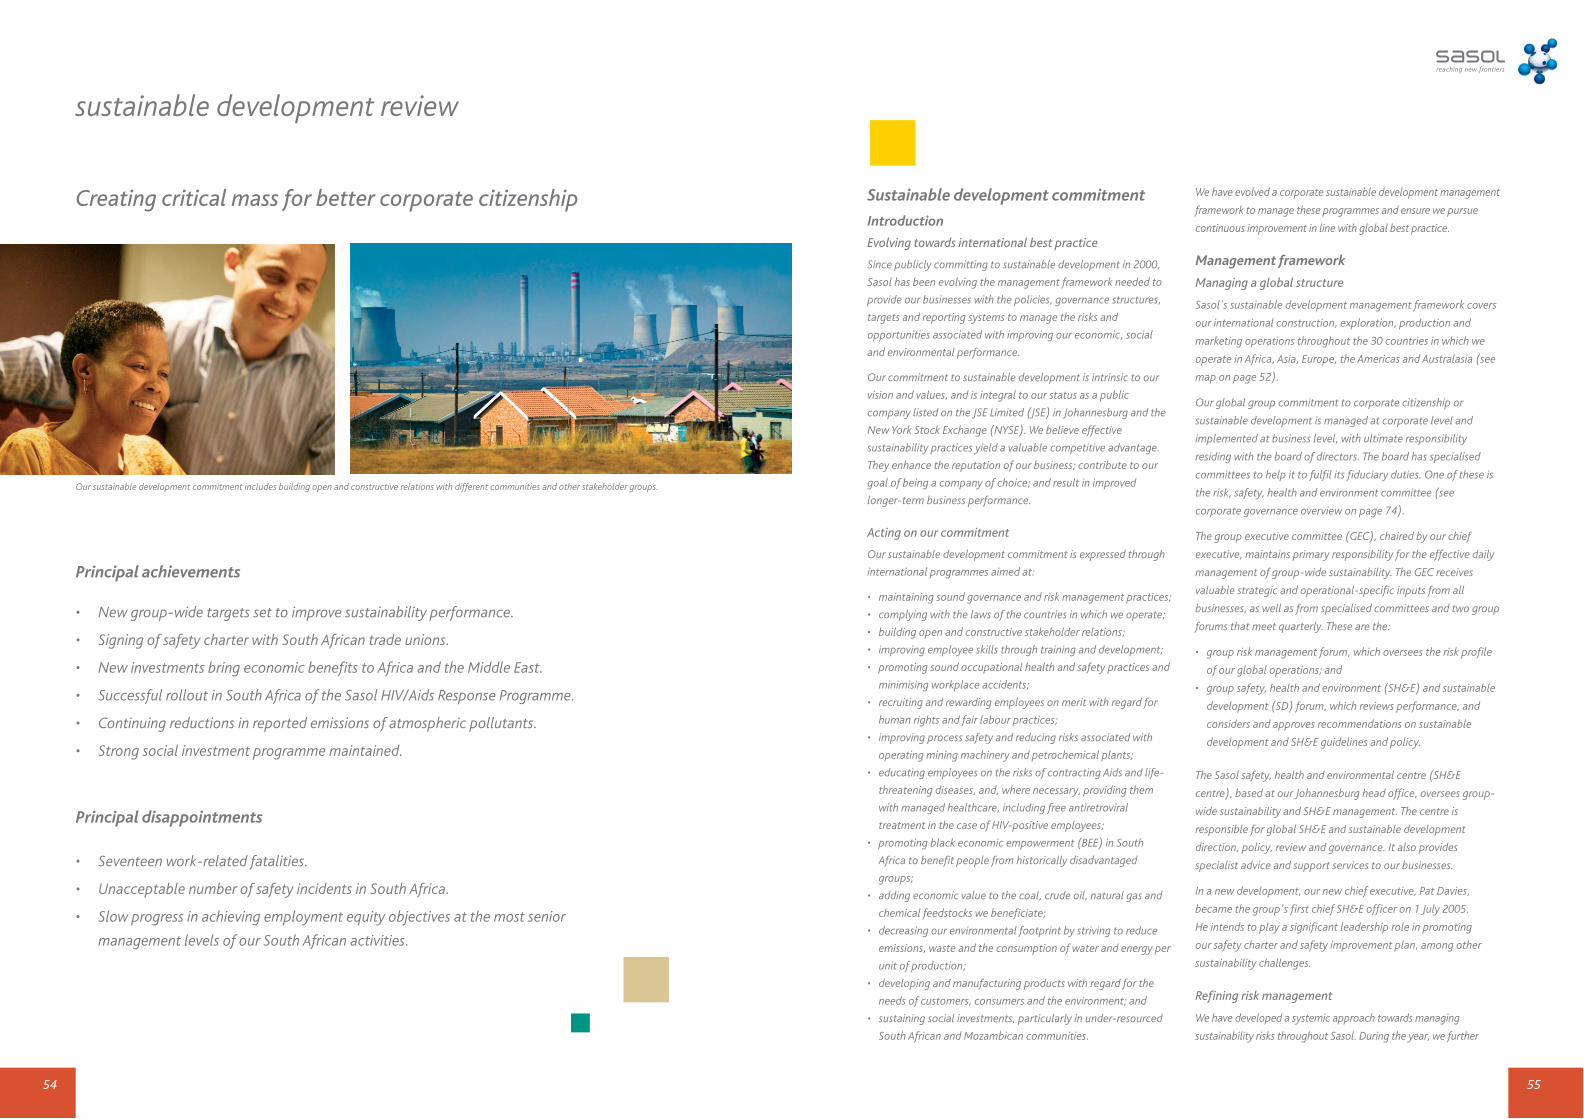
5554
sustainable development review
Sustainable development commitment
Introduction
Evolving towards international best practice
Since publicly committing to sustainable development in 2000,
Sasol has been evolving the management framework needed to
provide our businesses with the policies, governance structures,
targets and reporting systems to manage the risks and
opportunities associated with improving our economic, social
and environmental performance.
Our commitment to sustainable development is intrinsic to our
vision and values, and is integral to our status as a public
company listed on the JSE Limited (JSE) in Johannesburg and the
New York Stock Exchange (NYSE). We believe effective
sustainability practices yield a valuable competitive advantage.
They enhance the reputation of our business; contribute to our
goal of being a company of choice; and result in improved
longer-term business performance.
Acting on our commitment
Our sustainable development commitment is expressed through
international programmes aimed at:
• maintaining sound governance and risk management practices;
• complying with the laws of the countries in which we operate;
• building open and constructive stakeholder relations;
• improving employee skills through training and development;
• promoting sound occupational health and safety practices and
minimising workplace accidents;
• recruiting and rewarding employees on merit with regard for
human rights and fair labour practices;
• improving process safety and reducing risks associated with
operating mining machinery and petrochemical plants;
• educating employees on the risks of contracting Aids and life-
threatening diseases, and, where necessary, providing them
with managed healthcare, including free antiretroviral
treatment in the case of HIV-positive employees;
• promoting black economic empowerment (BEE) in South
Africa to benefit people from historically disadvantaged
groups;
• adding economic value to the coal, crude oil, natural gas and
chemical feedstocks we beneficiate;
• decreasing our environmental footprint by striving to reduce
emissions, waste and the consumption of water and energy per
unit of production;
• developing and manufacturing products with regard for the
needs of customers, consumers and the environment; and
• sustaining social investments, particularly in under-resourced
South African and Mozambican communities.
We have evolved a corporate sustainable development management
framework to manage these programmes and ensure we pursue
continuous improvement in line with global best practice.
Management framework
Managing a global structure
Sasol's sustainable development management framework covers
our international construction, exploration, production and
marketing operations throughout the 30 countries in which we
operate in Africa, Asia, Europe, the Americas and Australasia (see
map on page 52).
Our global group commitment to corporate citizenship or
sustainable development is managed at corporate level and
implemented at business level, with ultimate responsibility
residing with the board of directors. The board has specialised
committees to help it to fulfil its fiduciary duties. One of these is
the risk, safety, health and environment committee (see
corporate governance overview on page 74).
The group executive committee (GEC), chaired by our chief
executive, maintains primary responsibility for the effective daily
management of group-wide sustainability. The GEC receives
valuable strategic and operational-specific inputs from all
businesses, as well as from specialised committees and two group
forums that meet quarterly. These are the:
• group risk management forum, which oversees the risk profile
of our global operations; and
• group safety, health and environment (SH&E) and sustainable
development (SD) forum, which reviews performance, and
considers and approves recommendations on sustainable
development and SH&E guidelines and policy.
The Sasol safety, health and environmental centre (SH&E
centre), based at our Johannesburg head office, oversees group-
wide sustainability and SH&E management. The centre is
responsible for global SH&E and sustainable development
direction, policy, review and governance. It also provides
specialist advice and support services to our businesses.
In a new development, our new chief executive, Pat Davies,
became the group's first chief SH&E officer on 1 July 2005.
He intends to play a significant leadership role in promoting
our safety charter and safety improvement plan, among other
sustainability challenges.
Refining risk management
We have developed a systemic approach towards managing
sustainability risks throughout Sasol. During the year, we further
Principal achievements
• New group-wide targets set to improve sustainability performance.
• Signing of safety charter with South African trade unions.
• New investments bring economic benefits to Africa and the Middle East.
• Successful rollout in South Africa of the Sasol HIV/Aids Response Programme.
• Continuing reductions in reported emissions of atmospheric pollutants.
• Strong social investment programme maintained.
Principal disappointments
• Seventeen work-related fatalities.
• Unacceptable number of safety incidents in South Africa.
• Slow progress in achieving employment equity objectives at the most senior
management levels of our South African activities.
Creating critical mass for better corporate citizenship
Our sustainable development commitment includes building open and constructive relations with different communities and other stakeholder groups.
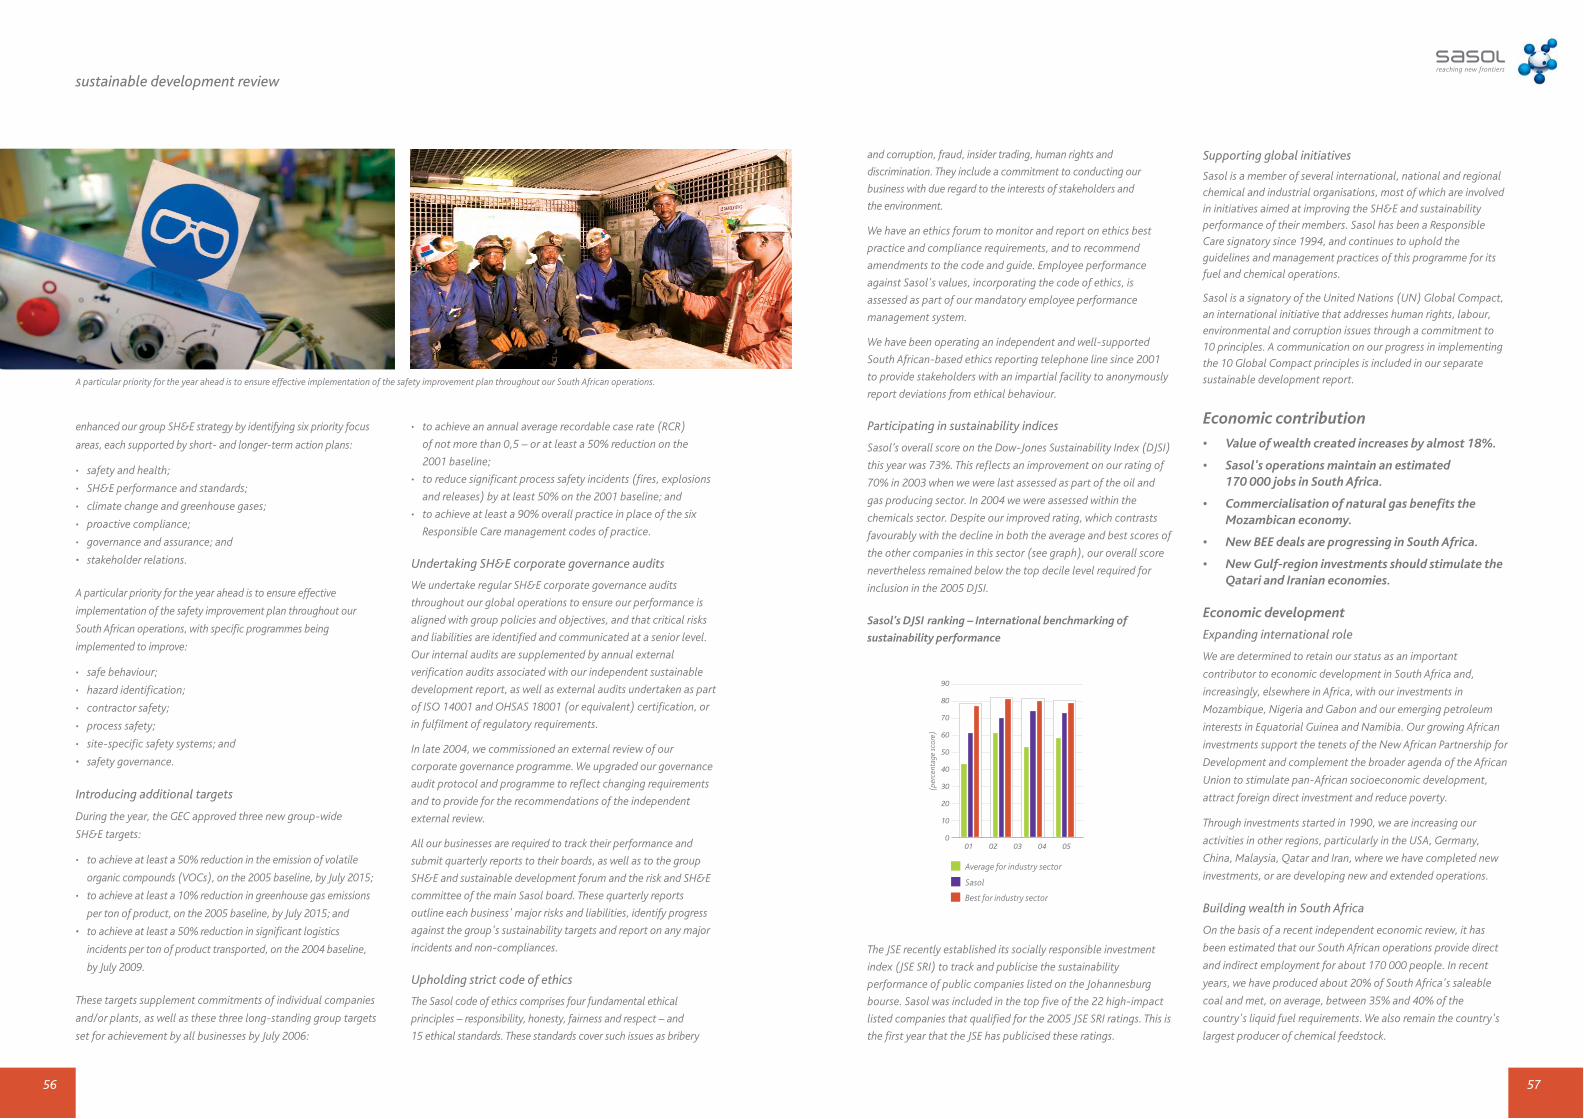
5756
enhanced our group SH&E strategy by identifying six priority focus
areas, each supported by short- and longer-term action plans:
• safety and health;
• SH&E performance and standards;
• climate change and greenhouse gases;
• proactive compliance;
• governance and assurance; and
• stakeholder relations.
A particular priority for the year ahead is to ensure effective
implementation of the safety improvement plan throughout our
South African operations, with specific programmes being
implemented to improve:
• safe behaviour;
• hazard identification;
• contractor safety;
• process safety;
• site-specific safety systems; and
• safety governance.
Introducing additional targets
During the year, the GEC approved three new group-wide
SH&E targets:
• to achieve at least a 50% reduction in the emission of volatile
organic compounds (VOCs), on the 2005 baseline, by July 2015;
• to achieve at least a 10% reduction in greenhouse gas emissions
per ton of product, on the 2005 baseline, by July 2015; and
• to achieve at least a 50% reduction in significant logistics
incidents per ton of product transported, on the 2004 baseline,
by July 2009.
These targets supplement commitments of individual companies
and/or plants, as well as these three long-standing group targets
set for achievement by all businesses by July 2006:
• to achieve an annual average recordable case rate (RCR)
of not more than 0,5 – or at least a 50% reduction on the
2001 baseline;
• to reduce significant process safety incidents (fires, explosions
and releases) by at least 50% on the 2001 baseline; and
• to achieve at least a 90% overall practice in place of the six
Responsible Care management codes of practice.
Undertaking SH&E corporate governance audits
We undertake regular SH&E corporate governance audits
throughout our global operations to ensure our performance is
aligned with group policies and objectives, and that critical risks
and liabilities are identified and communicated at a senior level.
Our internal audits are supplemented by annual external
verification audits associated with our independent sustainable
development report, as well as external audits undertaken as part
of ISO 14001 and OHSAS 18001 (or equivalent) certification, or
in fulfilment of regulatory requirements.
In late 2004, we commissioned an external review of our
corporate governance programme. We upgraded our governance
audit protocol and programme to reflect changing requirements
and to provide for the recommendations of the independent
external review.
All our businesses are required to track their performance and
submit quarterly reports to their boards, as well as to the group
SH&E and sustainable development forum and the risk and SH&E
committee of the main Sasol board. These quarterly reports
outline each business' major risks and liabilities, identify progress
against the group's sustainability targets and report on any major
incidents and non-compliances.
Upholding strict code of ethics
The Sasol code of ethics comprises four fundamental ethical
principles – responsibility, honesty, fairness and respect – and
15 ethical standards. These standards cover such issues as bribery
and corruption, fraud, insider trading, human rights and
discrimination. They include a commitment to conducting our
business with due regard to the interests of stakeholders and
the environment.
We have an ethics forum to monitor and report on ethics best
practice and compliance requirements, and to recommend
amendments to the code and guide. Employee performance
against Sasol's values, incorporating the code of ethics, is
assessed as part of our mandatory employee performance
management system.
We have been operating an independent and well-supported
South African-based ethics reporting telephone line since 2001
to provide stakeholders with an impartial facility to anonymously
report deviations from ethical behaviour.
Participating in sustainability indices
Sasol’s overall score on the Dow-Jones Sustainability Index (DJSI)
this year was 73%. This reflects an improvement on our rating of
70% in 2003 when we were last assessed as part of the oil and
gas producing sector. In 2004 we were assessed within the
chemicals sector. Despite our improved rating, which contrasts
favourably with the decline in both the average and best scores of
the other companies in this sector (see graph), our overall score
nevertheless remained below the top decile level required for
inclusion in the 2005 DJSI.
Sasol’s DJSI ranking – International benchmarking of
sustainability performance
The JSE recently established its socially responsible investment
index (JSE SRI) to track and publicise the sustainability
performance of public companies listed on the Johannesburg
bourse. Sasol was included in the top five of the 22 high-impact
listed companies that qualified for the 2005 JSE SRI ratings. This is
the first year that the JSE has publicised these ratings.
Supporting global initiatives
Sasol is a member of several international, national and regional
chemical and industrial organisations, most of which are involved
in initiatives aimed at improving the SH&E and sustainability
performance of their members. Sasol has been a Responsible
Care signatory since 1994, and continues to uphold the
guidelines and management practices of this programme for its
fuel and chemical operations.
Sasol is a signatory of the United Nations (UN) Global Compact,
an international initiative that addresses human rights, labour,
environmental and corruption issues through a commitment to
10 principles. A communication on our progress in implementing
the 10 Global Compact principles is included in our separate
sustainable development report.
Economic contribution
• Value of wealth created increases by almost 18%.
• Sasol's operations maintain an estimated 170 000 jobs in South Africa.
• Commercialisation of natural gas benefits theMozambican economy.
• New BEE deals are progressing in South Africa.
• New Gulf-region investments should stimulate theQatari and Iranian economies.
Economic development
Expanding international role
We are determined to retain our status as an important
contributor to economic development in South Africa and,
increasingly, elsewhere in Africa, with our investments in
Mozambique, Nigeria and Gabon and our emerging petroleum
interests in Equatorial Guinea and Namibia. Our growing African
investments support the tenets of the New African Partnership for
Development and complement the broader agenda of the African
Union to stimulate pan-African socioeconomic development,
attract foreign direct investment and reduce poverty.
Through investments started in 1990, we are increasing our
activities in other regions, particularly in the USA, Germany,
China, Malaysia, Qatar and Iran, where we have completed new
investments, or are developing new and extended operations.
Building wealth in South Africa
On the basis of a recent independent economic review, it has
been estimated that our South African operations provide direct
and indirect employment for about 170 000 people. In recent
years, we have produced about 20% of South Africa's saleable
coal and met, on average, between 35% and 40% of the
country's liquid fuel requirements. We also remain the country's
largest producer of chemical feedstock.
sustainable development review
01 02 03 04 05
90
80
70
60
50
40
30
20
10
0
(per
cent
age
scor
e)
Average for industry sector
Sasol
Best for industry sector
A particular priority for the year ahead is to ensure effective implementation of the safety improvement plan throughout our South African operations.

5958
We contribute about R40 billion (4%) to national gross domestic
product (GDP) and save the country more than R30 billion in foreign
exchange. Sasol remains the country's single largest industrial
investor, with R24 billion invested over the last four years.
On the basis of our market capitalisation (R122 billion at year
end), we remain one of the top five companies listed on the JSE.
During the year, we increased group wealth creation by 18%
from R23,4 billion to R27,5 billion. Of this amount, R8,6 billion
(31%) was distributed to employees and R4,3 billion (16%) to
governments in the form of taxes and related revenue. All
regional operations contribute to wealth creation by adding
value to coal, natural gas, crude oil and chemical feedstocks.
Stimulating growth outside South Africa
In Mozambique, we have become an important economic
contributor since bringing natural gas on stream in the Temane
field in 2004. Through our natural gas operations, we paid
the Government of Mozambique US$3 million (about
R19 million) in taxes, royalties and dividends. Economists
estimate that our US$1,2 billion investment to develop these gas
fields and bring gas to South Africa has increased Mozambique's
GDP by about 20%.
We have also increased our economic contribution outside
Southern Africa, where we employ about 5 600 people, mostly in
the USA, Germany and Italy. While our economic contributions
are more modest in these national economies, they are
significant. A large percentage of our current capital investment is
concentrated in The Gulf region of the Middle East where we are
investing close to US$1 billion in two projects.
Sasol Polymers remains a significant partner in the Optimal
Olefins and Petlin plants at Kertih, Malaysia. Through other joint-
venture interests, Sasol Polymers is expanding its polymer
distribution interests in China.
Black economic empowerment
Supporting empowerment in South Africa
A big challenge in South Africa is to play a positive role in
stimulating the successful advance of the broad-based economic
empowerment of historically disadvantaged South Africans,
particularly black people (Africans, Coloureds and Indians).
To promote our BEE commitment, we operate a BEE coordination
office in Johannesburg. This office reports to a member of our
GEC, and oversees all corporate BEE activities, which have six
main components in our South African businesses:
• introducing equity ownership by historically disadvantaged
people;
• procuring goods and services, preferentially, from historically
disadvantaged people;
• progressing employment equity;
• building human capacity and talent in industry;
• facilitating the development of smaller BEE enterprises; and
• implementing social upliftment initiatives.
Preparing empowerment deals
We have advanced discussions with BEE partners in our South African
liquid fuels and mining businesses. In the previous year, Sasol Mining
selected Eyesizwe Coal as its lead empowerment partner, thereby
paving the way towards introducing BEE ownership to our mining
operations. Sasol Mining and Eyesizwe intend to conclude the terms
of their empowerment deal in the year ahead.
The planned Uhambo Oil joint venture between the liquid fuel
interests of Sasol and Engen, predominantly owned by Petroliam
Nasional Berhad (Petronas) of Malaysia, was recommended for
conditional approval in May 2005 by South Africa's Competition
Commission and referred to the Competition Tribunal for final
review. Our BEE plans for our liquid fuels business are progressing
well and the incorporation into Uhambo is subject to the outcome
of this review.
Should the Uhambo deal proceed, Petronas and Sasol will partner
with their two BEE groups, Worldwide African Investment Holdings
and Tshwarisano LFB Investment, respectively, to create South
Africa's largest liquid fuel business. BEE partners would own 25% of
Uhambo. If the Uhambo deal does not proceed, then Tshwarisano
will take a 25% equity position in Sasol’s Liquid Fuels Business.
Sasol Gas and its empowerment partner, Coal Energy & Power
Resources, continue to operate their successful 49:51 joint venture
at Durban, Spring Lights Gas. Sasol Gas is seeking other
empowerment joint ventures, subject to opportunities to create
new regional gas markets and find BEE partners. In addition, DPI
Plastics, a joint venture between Sasol Polymers and Group Five,
maintains seven BEE joint ventures to market and sell plastic piping.
Promoting employee diversity
We continue to increase the percentage of employees drawn from
historically disadvantaged groups in line with South Africa's
Employment Equity Act. People from designated groups – Africans,
Coloureds and Indians, women and people with disabilities –
comprise almost 65% of our South African workforce.
At year end, people from designated groups held 39,2% of our
South African managerial, professional and supervisory posts. This
compares with a target of 40% that we set for ourselves some years
ago. We intend to increase this figure to 50% in the medium term.
We award more than 62% of our undergraduate bursaries to
students from historically disadvantaged groups. More than 50% of
future appointments of trainee artisans will be allocated to people
from designated groups.
Shortly after year end, we announced the appointment of
Ms Nolitha Fakude as an executive director as part of a drive to
appoint more black people to the higher levels of group
management, including the GEC. We intend to make additional
senior black appointments in the year ahead.
Expanding BEE procurement
Our independently reviewed procurement spend with BEE
suppliers increased by 65% to R2 473 million. We intend to
increase this amount in the year ahead.
Social performance
• Safety charter and improvement plan launched in
response to an unacceptable increase in safety
incidents and 17 work-related fatalities.
• Sasol North America and Sasol Germany attained
world-class safety performances.
• More than R170 million invested in developing
employee skills.
• More than 80% of South African employees have
undergone voluntary HIV testing.
• Social investment continues to emphasise the need
for advancing socioeconomic development in
Southern Africa by building human capacity.
Occupational health and safety
Targeting zero fatalities
It is with deep regret that seven employees and 10 contractors
were fatally injured in workplace incidents. This includes the
10 people who died in an explosion at our Secunda ethylene
plant in September 2004. Any work-related fatality in the group
is unacceptable, and this figure is of particular concern. This
compares with five workplace fatalities in the previous year and
10 in our 2003 financial year. Our goal remains zero fatalities.
We have since intensified our safety management programmes to
attain our goal of zero fatalities. In November 2004, Sasol appointed
DuPont Safety Resources to perform a comprehensive safety review
of our South African operations. In the interests of transparency, the
findings of this review have been posted on our website.
sustainable development review
Sasol is an important economic contributor to Mozambique since bringing naturalgas on stream in 2004.
Sasol continues to develop black economic empowerment initiatives tosupport socioeconomic transformation in South Africa.
Ongoing employee skills and safety training and personal development are integral to Sasol's pursuit of good corporate citizenship.

Employment equity statistics as at 30 June 2005
Executives 12% Senior management 18% Management 43% Skilled and semi-skilled 76%
People in designated groups – 39,2%
People in designated groups – 64%
White male
White female
Black male
Black female
31
1 3
3 725
1 049 1 411 347 3 610 1 204
9 555
654
927
72 127 11
6160
We are acting on the DuPont Safety Resources recommendations,
which are based on improving the safety culture of our South African
operations. This commitment is encapsulated in the Sasol safety
improvement plan, which covers key elements of safe behaviour,
contractor safety, process safety and many other specific issues. In
addition, all businesses have implemented their own site-specific
safety plans, the progress of which is monitored by their boards.
We have embarked on a comprehensive change-management
programme to ensure the sustainability of these efforts
throughout our South African operations. Key to this
commitment, Sasol and three trade unions recently unveiled a
safety charter, details of which are available on our website. This
charter – believed to be a world first – was developed in close
consultation with these unions and demonstrates our common
goal of making safety the first priority of everyone at Sasol.
As a focal point for these efforts, Sasol has revised its shared
values to emphasise safety as one of the group's six core values.
Improving our recordable case rate
We have significantly refocused our efforts to drive down the
group injury rate, which we track as the RCR. An RCR is the
number of fatalities, lost workdays and medical treatments
beyond first-aid cases for every 200 000 employee hours worked.
We have set an interim target of halving our worldwide RCR to
0,5 by June 2006 (a maximum of one case for every 400 000
employee hours). An RCR of 0,5 is considered to be in line with
global best practice.
An unacceptable increase in injuries was experienced in the first
half of the year, particularly at Sasol Mining and Sasol Polymers.
The group RCR increased to 1,17 compared with 1,03 and 1,34 in
financial 2004 and 2003, respectively. We have taken significant
steps to address this poor safety performance.
There have been some early encouraging signs of improved
performance. Sasol Mining, for the first time, achieved five
million employee hours without a lost workday case and, by mid-
2005, had reported working eight million employee hours
without a lost workday case. In April 2004, the Sasol North
America operations at Lake Charles, Louisiana, achieved one
continuous year of operations without a recordable injury.
Progressing process safety management
Ensuring the effective management of the risk of fires, explosions
and releases of hazardous substances is critical to our business.
We achieved further progress in implementing the recently
approved process safety management system throughout our
operations, with the aim of minimising the risks of accidents and
releases of hazardous substances.
Despite these efforts, there were 25 significant fires, explosions
and releases throughout the group. We register an incident as
“significant” when it meets one of three criteria: it involves a
fatality or lost workday case; it results in damage of more than
US$25 000; or it causes a release of the relevant substance’s
US OSHA threshold quantity. It is nevertheless pleasing that this
represents a 37,5% reduction on the level of our 2001 financial
year, and constitutes significant progress towards the SH&E
target of a 50% improvement on 2001 levels by July 2006.
Human resource management
Maintaining a skilled and stable workforce
At year end, Sasol had about 30 000 employees. Employee
turnover was within normal ranges of between 4% and 6%.
Since our inception, we have focused on developing, maintaining
and optimising our skills base that is necessary to ensure the
ongoing productivity, safety and reliability of our global
operations. Our commitment to creating a culture of continuous
learning is evident in the structured, group-wide approach to
people development, including our 5 600 employees outside
South Africa.
Sasol sponsors at least 462 undergraduate bursaries in South
Africa annually, with emphasis on developing scientific,
engineering and technological skills. We committed R24 million
for 462 undergraduate and 80 postgraduate bursaries in 2005 and
have budgeted a similar amount for the 2006 academic year.
We invested a further R172 million in employee training and
development throughout the group. This investment includes
in-house technical training, self-learning centres and
undergraduate bursaries.
We are at the third intake of employees participating in our
accelerated leadership development programme in South Africa.
We are currently developing high-potential, historically
disadvantaged South Africans from different disciplines through
this programme.
Encouraging participation and good relations
We enjoy constructive relationships with representative trade
unions throughout the company. More than 50% of our
employees in South Africa belong to unions. As a result of
ongoing good relations, Sasol lost no employee days through
industrial action.
Joint forums have been established between trade unions and
management to discuss wages, conditions of employment, health
and safety, training and development, community care and
HIV/Aids, among other important issues. All representative unions
and pensioners are represented on our medical scheme board and
senior employees serve on the boards of union retirement funds.
Upholding human rights
We are committed to complying with all statutes in the countries
in which we operate. This is complemented by our commitment
to the human rights principles of the UN Global Compact. As we
extend our operations into countries that are considered to have
human rights concerns, we recognise the importance of
exercising extra care to ensure our activities comply with
internationally accepted standards of behaviour.
Meeting the Aids challenge
Recognising the challenge of managing South Africa's HIV/Aids
pandemic, we launched the Sasol HIV/Aids Response Programme
(SHARP) in September 2002. This initiative – which involved input
from business, trade union, community representatives and
independent experts – is an integrated approach focused on
reducing the rate of infection throughout the group, and
extending the quality of life of infected employees by providing
managed healthcare.
As a result of our collaborative approach, we have had one of the
highest uptakes for voluntary counselling and testing (VCT) in
South Africa: 82% by year end for our South African operations.
This compares with a rate of between 50% and 60% that is typical
among most corporate programmes. To date, 7% of our tested
South African employees have tested positive for HIV, which is
well below our estimated actuarial prevalence rate of 19%.
Having taken all of the South African operations through VCT,
our focus has shifted to providing comprehensive workplace
education and training programmes in our South African
businesses. Our goal is to train 800 managers and 1 000
educators. To date, 250 managers have been trained. SHARP is
being extended to surrounding communities through partnerships
with community stakeholders, government bodies and other
companies in South Africa and Mozambique.
Community involvement
Promoting engagement and outreach
Besides the public participation initiatives implemented as part of
new projects, we continued to undertake community outreach
sustainable development review
More than 80% of our South African employees volunteered to undergo confidentialHIV testing as part of the successful Sasol HIV/Aids Response Programme.
The implementation of a process safety management system was further advanced.
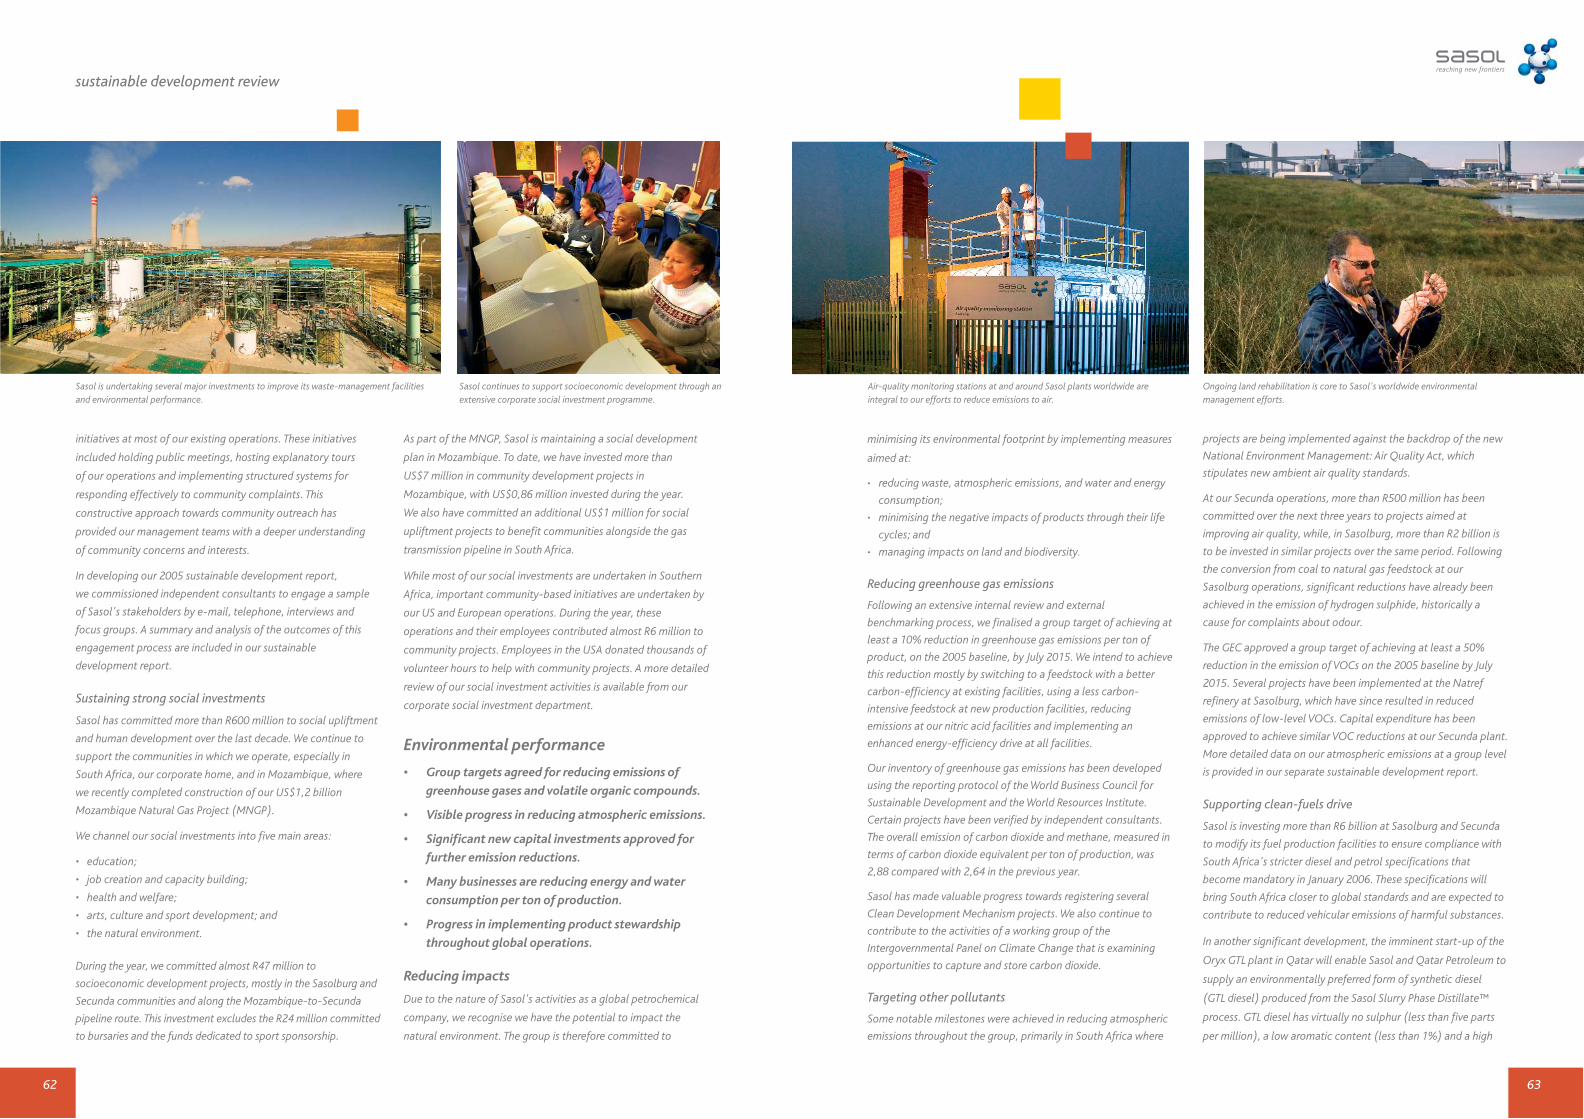
6362
initiatives at most of our existing operations. These initiatives
included holding public meetings, hosting explanatory tours
of our operations and implementing structured systems for
responding effectively to community complaints. This
constructive approach towards community outreach has
provided our management teams with a deeper understanding
of community concerns and interests.
In developing our 2005 sustainable development report,
we commissioned independent consultants to engage a sample
of Sasol's stakeholders by e-mail, telephone, interviews and
focus groups. A summary and analysis of the outcomes of this
engagement process are included in our sustainable
development report.
Sustaining strong social investments
Sasol has committed more than R600 million to social upliftment
and human development over the last decade. We continue to
support the communities in which we operate, especially in
South Africa, our corporate home, and in Mozambique, where
we recently completed construction of our US$1,2 billion
Mozambique Natural Gas Project (MNGP).
We channel our social investments into five main areas:
• education;
• job creation and capacity building;
• health and welfare;
• arts, culture and sport development; and
• the natural environment.
During the year, we committed almost R47 million to
socioeconomic development projects, mostly in the Sasolburg and
Secunda communities and along the Mozambique-to-Secunda
pipeline route. This investment excludes the R24 million committed
to bursaries and the funds dedicated to sport sponsorship.
As part of the MNGP, Sasol is maintaining a social development
plan in Mozambique. To date, we have invested more than
US$7 million in community development projects in
Mozambique, with US$0,86 million invested during the year.
We also have committed an additional US$1 million for social
upliftment projects to benefit communities alongside the gas
transmission pipeline in South Africa.
While most of our social investments are undertaken in Southern
Africa, important community-based initiatives are undertaken by
our US and European operations. During the year, these
operations and their employees contributed almost R6 million to
community projects. Employees in the USA donated thousands of
volunteer hours to help with community projects. A more detailed
review of our social investment activities is available from our
corporate social investment department.
Environmental performance
• Group targets agreed for reducing emissions of
greenhouse gases and volatile organic compounds.
• Visible progress in reducing atmospheric emissions.
• Significant new capital investments approved for
further emission reductions.
• Many businesses are reducing energy and water
consumption per ton of production.
• Progress in implementing product stewardship
throughout global operations.
Reducing impacts
Due to the nature of Sasol's activities as a global petrochemical
company, we recognise we have the potential to impact the
natural environment. The group is therefore committed to
minimising its environmental footprint by implementing measures
aimed at:
• reducing waste, atmospheric emissions, and water and energy
consumption;
• minimising the negative impacts of products through their life
cycles; and
• managing impacts on land and biodiversity.
Reducing greenhouse gas emissions
Following an extensive internal review and external
benchmarking process, we finalised a group target of achieving at
least a 10% reduction in greenhouse gas emissions per ton of
product, on the 2005 baseline, by July 2015. We intend to achieve
this reduction mostly by switching to a feedstock with a better
carbon-efficiency at existing facilities, using a less carbon-
intensive feedstock at new production facilities, reducing
emissions at our nitric acid facilities and implementing an
enhanced energy-efficiency drive at all facilities.
Our inventory of greenhouse gas emissions has been developed
using the reporting protocol of the World Business Council for
Sustainable Development and the World Resources Institute.
Certain projects have been verified by independent consultants.
The overall emission of carbon dioxide and methane, measured in
terms of carbon dioxide equivalent per ton of production, was
2,88 compared with 2,64 in the previous year.
Sasol has made valuable progress towards registering several
Clean Development Mechanism projects. We also continue to
contribute to the activities of a working group of the
Intergovernmental Panel on Climate Change that is examining
opportunities to capture and store carbon dioxide.
Targeting other pollutants
Some notable milestones were achieved in reducing atmospheric
emissions throughout the group, primarily in South Africa where
projects are being implemented against the backdrop of the new
National Environment Management: Air Quality Act, which
stipulates new ambient air quality standards.
At our Secunda operations, more than R500 million has been
committed over the next three years to projects aimed at
improving air quality, while, in Sasolburg, more than R2 billion is
to be invested in similar projects over the same period. Following
the conversion from coal to natural gas feedstock at our
Sasolburg operations, significant reductions have already been
achieved in the emission of hydrogen sulphide, historically a
cause for complaints about odour.
The GEC approved a group target of achieving at least a 50%
reduction in the emission of VOCs on the 2005 baseline by July
2015. Several projects have been implemented at the Natref
refinery at Sasolburg, which have since resulted in reduced
emissions of low-level VOCs. Capital expenditure has been
approved to achieve similar VOC reductions at our Secunda plant.
More detailed data on our atmospheric emissions at a group level
is provided in our separate sustainable development report.
Supporting clean-fuels drive
Sasol is investing more than R6 billion at Sasolburg and Secunda
to modify its fuel production facilities to ensure compliance with
South Africa's stricter diesel and petrol specifications that
become mandatory in January 2006. These specifications will
bring South Africa closer to global standards and are expected to
contribute to reduced vehicular emissions of harmful substances.
In another significant development, the imminent start-up of the
Oryx GTL plant in Qatar will enable Sasol and Qatar Petroleum to
supply an environmentally preferred form of synthetic diesel
(GTL diesel) produced from the Sasol Slurry Phase Distillate™
process. GTL diesel has virtually no sulphur (less than five parts
per million), a low aromatic content (less than 1%) and a high
sustainable development review
Sasol is undertaking several major investments to improve its waste-management facilitiesand environmental performance.
Sasol continues to support socioeconomic development through anextensive corporate social investment programme.
Air-quality monitoring stations at and around Sasol plants worldwide areintegral to our efforts to reduce emissions to air.
Ongoing land rehabilitation is core to Sasol's worldwide environmentalmanagement efforts.
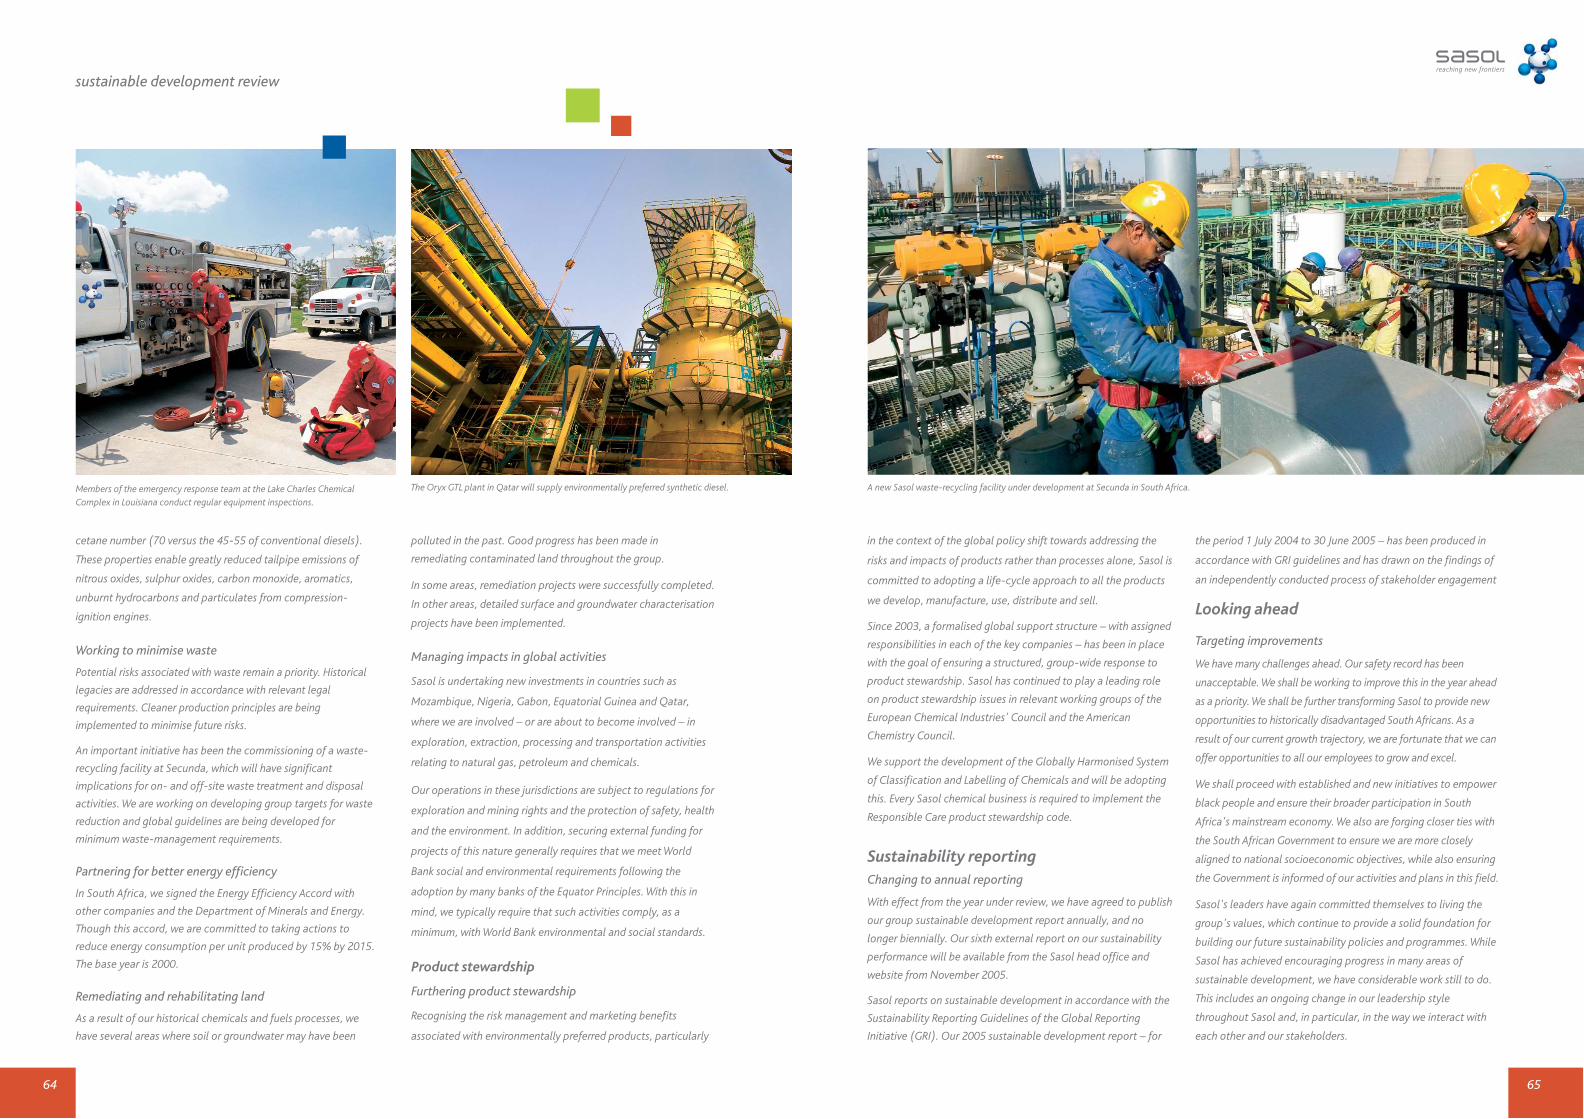
6564
cetane number (70 versus the 45-55 of conventional diesels).
These properties enable greatly reduced tailpipe emissions of
nitrous oxides, sulphur oxides, carbon monoxide, aromatics,
unburnt hydrocarbons and particulates from compression-
ignition engines.
Working to minimise waste
Potential risks associated with waste remain a priority. Historical
legacies are addressed in accordance with relevant legal
requirements. Cleaner production principles are being
implemented to minimise future risks.
An important initiative has been the commissioning of a waste-
recycling facility at Secunda, which will have significant
implications for on- and off-site waste treatment and disposal
activities. We are working on developing group targets for waste
reduction and global guidelines are being developed for
minimum waste-management requirements.
Partnering for better energy efficiency
In South Africa, we signed the Energy Efficiency Accord with
other companies and the Department of Minerals and Energy.
Though this accord, we are committed to taking actions to
reduce energy consumption per unit produced by 15% by 2015.
The base year is 2000.
Remediating and rehabilitating land
As a result of our historical chemicals and fuels processes, we
have several areas where soil or groundwater may have been
polluted in the past. Good progress has been made in
remediating contaminated land throughout the group.
In some areas, remediation projects were successfully completed.
In other areas, detailed surface and groundwater characterisation
projects have been implemented.
Managing impacts in global activities
Sasol is undertaking new investments in countries such as
Mozambique, Nigeria, Gabon, Equatorial Guinea and Qatar,
where we are involved – or are about to become involved – in
exploration, extraction, processing and transportation activities
relating to natural gas, petroleum and chemicals.
Our operations in these jurisdictions are subject to regulations for
exploration and mining rights and the protection of safety, health
and the environment. In addition, securing external funding for
projects of this nature generally requires that we meet World
Bank social and environmental requirements following the
adoption by many banks of the Equator Principles. With this in
mind, we typically require that such activities comply, as a
minimum, with World Bank environmental and social standards.
Product stewardship
Furthering product stewardship
Recognising the risk management and marketing benefits
associated with environmentally preferred products, particularly
in the context of the global policy shift towards addressing the
risks and impacts of products rather than processes alone, Sasol is
committed to adopting a life-cycle approach to all the products
we develop, manufacture, use, distribute and sell.
Since 2003, a formalised global support structure – with assigned
responsibilities in each of the key companies – has been in place
with the goal of ensuring a structured, group-wide response to
product stewardship. Sasol has continued to play a leading role
on product stewardship issues in relevant working groups of the
European Chemical Industries' Council and the American
Chemistry Council.
We support the development of the Globally Harmonised System
of Classification and Labelling of Chemicals and will be adopting
this. Every Sasol chemical business is required to implement the
Responsible Care product stewardship code.
Sustainability reportingChanging to annual reporting
With effect from the year under review, we have agreed to publish
our group sustainable development report annually, and no
longer biennially. Our sixth external report on our sustainability
performance will be available from the Sasol head office and
website from November 2005.
Sasol reports on sustainable development in accordance with the
Sustainability Reporting Guidelines of the Global Reporting
Initiative (GRI). Our 2005 sustainable development report – for
sustainable development review
Members of the emergency response team at the Lake Charles ChemicalComplex in Louisiana conduct regular equipment inspections.
A new Sasol waste-recycling facility under development at Secunda in South Africa.The Oryx GTL plant in Qatar will supply environmentally preferred synthetic diesel.
the period 1 July 2004 to 30 June 2005 – has been produced in
accordance with GRI guidelines and has drawn on the findings of
an independently conducted process of stakeholder engagement
Looking ahead
Targeting improvements
We have many challenges ahead. Our safety record has been
unacceptable. We shall be working to improve this in the year ahead
as a priority. We shall be further transforming Sasol to provide new
opportunities to historically disadvantaged South Africans. As a
result of our current growth trajectory, we are fortunate that we can
offer opportunities to all our employees to grow and excel.
We shall proceed with established and new initiatives to empower
black people and ensure their broader participation in South
Africa's mainstream economy. We also are forging closer ties with
the South African Government to ensure we are more closely
aligned to national socioeconomic objectives, while also ensuring
the Government is informed of our activities and plans in this field.
Sasol's leaders have again committed themselves to living the
group's values, which continue to provide a solid foundation for
building our future sustainability policies and programmes. While
Sasol has achieved encouraging progress in many areas of
sustainable development, we have considerable work still to do.
This includes an ongoing change in our leadership style
throughout Sasol and, in particular, in the way we interact with
each other and our stakeholders.
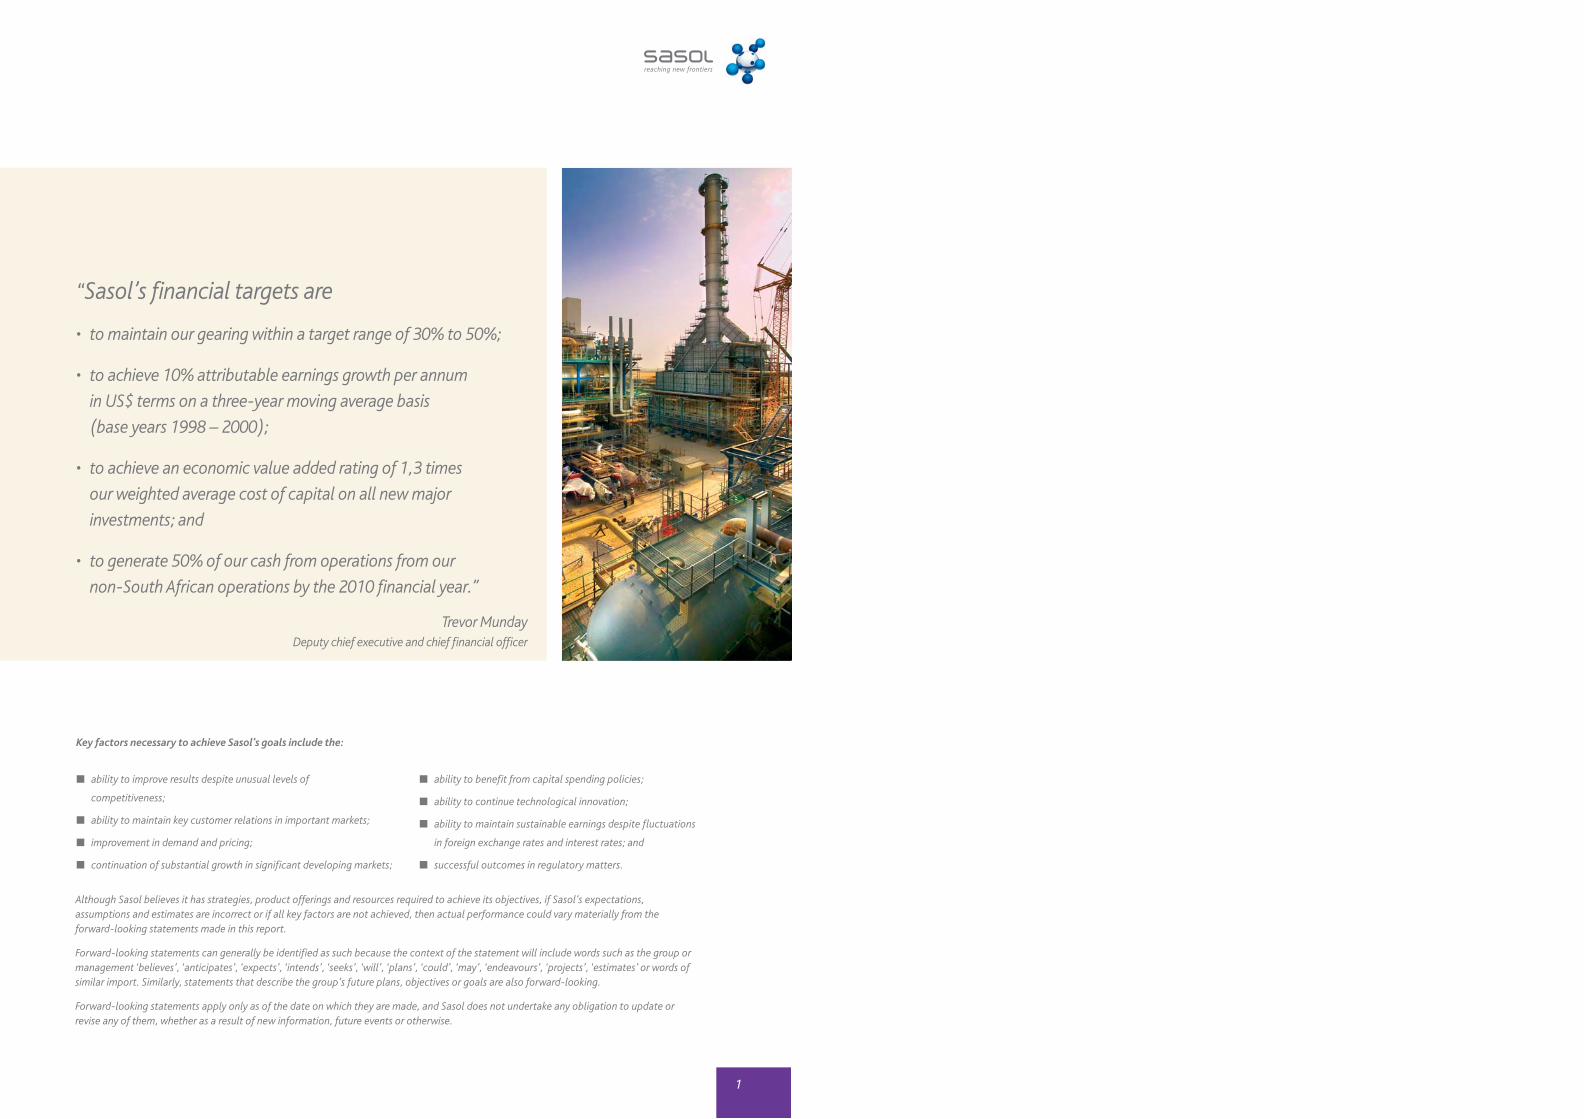
1
“Sasol’s financial targets are
• to maintain our gearing within a target range of 30% to 50%;
• to achieve 10% attributable earnings growth per annum
in US$ terms on a three-year moving average basis
(base years 1998 – 2000);
• to achieve an economic value added rating of 1,3 times
our weighted average cost of capital on all new major
investments; and
• to generate 50% of our cash from operations from our
non-South African operations by the 2010 financial year.”
Trevor Munday Deputy chief executive and chief financial officer
Key factors necessary to achieve Sasol’s goals include the:
Although Sasol believes it has strategies, product offerings and resources required to achieve its objectives, if Sasol’s expectations,assumptions and estimates are incorrect or if all key factors are not achieved, then actual performance could vary materially from theforward-looking statements made in this report.
Forward-looking statements can generally be identified as such because the context of the statement will include words such as the group ormanagement ‘believes’, ‘anticipates’, ‘expects’, ‘intends’, ‘seeks’, ‘will’, ‘plans’, ‘could’, ‘may’, ‘endeavours’, ‘projects’, ‘estimates’ or words ofsimilar import. Similarly, statements that describe the group’s future plans, objectives or goals are also forward-looking.
Forward-looking statements apply only as of the date on which they are made, and Sasol does not undertake any obligation to update orrevise any of them, whether as a result of new information, future events or otherwise.
ability to improve results despite unusual levels of
competitiveness;
ability to maintain key customer relations in important markets;
improvement in demand and pricing;
continuation of substantial growth in significant developing markets;
ability to benefit from capital spending policies;
ability to continue technological innovation;
ability to maintain sustainable earnings despite fluctuations
in foreign exchange rates and interest rates; and
successful outcomes in regulatory matters.

3
sasol limited group
chief financial officer’s review
2
Risk managementWe are exposed to a number of external risks, as described
below, which are not under our control, yet they can have a
significant impact on our results. These risks are monitored on an
ongoing basis and, where feasible and in line with our strategy,
derivative instruments are entered into in order to mitigate them.
No speculative trading in derivatives is permitted.*
ObjectiveOur hedging programme is based on risk management
rationale. The objective of our hedging programme is to achieve
greater certainty in cash flows, particularly considering our
capital expenditure programme, and not to boost profits
through speculative hedging approaches.
Exchange ratesThe majority of our turnover is denominated in US dollars or
significantly influenced by the rand/US dollar exchange rate.
This turnover is derived either from exports from South Africa,
businesses outside of South Africa or South African sales which
comprise mainly petroleum and chemical products that are
mostly based on global commodity and benchmark prices
quoted in US dollars. Furthermore, a significant proportion of
our capital expenditure is also US dollar-linked.
Any change in the annual average rand/US$ exchange rate has a
significant effect on our results. For the 2006 financial year, for
every 10c weakening or strengthening of the rand against the
US$ for the year, our operating profit increases or decreases by
approximately R500 million as applicable. This sensitivity is
utilised primarily for purposes of financial forecasting and
budgeting, reflects the effect of possible changes in the average
annual exchange rate and excludes the effect of any changes to
the closing rand/US dollar exchange rate.
We apply the following principal policies in order to protect
ourselves against the effects (on our South African operations)
of a volatile rand against other major currencies as well as an
anticipated long-term trend of a devaluing rand:
• all major capital expenditure in foreign currency is hedged
immediately on commitment of expenditure or on approval of
the project (also with South African Reserve Bank approval),
by way of forward exchange contracts; and
• all imports in foreign currency in excess of an equivalent of
US$50 000 per transaction are hedged immediately on
commitment by way of forward exchange contracts.
This is an established policy of our group based on anticipated
long-term trends and is designed to hedge our exposure in
South Africa to exchange rate-based volatility in cash flows on
both operating and capital expenditure. This policy enables us
to more accurately forecast our cash outflows for purchases of
both capital items and operating materials thereby improving
our management of both working capital and debt.
Crude oil pricesMarket prices for crude oil fluctuate because they are subject to
international supply, demand and political factors. Worldwide
supply and price levels of crude oil are also influenced by
international oil cartels. Our exposure to the crude oil price
centres primarily around crude oil related raw materials, as well
as on the selling price of the fuel marketed by our Sasol Liquid
Fuels Business which is governed by the basic fuel price (BFP)
formula. A key factor in the BFP is the Mediterranean and
Singapore (petrol) or The Gulf (diesel) spot price.
In order to protect the group against short-term US dollar oil
price volatility and rand to US dollar exchange rate fluctuations
adversely affecting the cost of crude oil purchases, a combination
of forward exchange contracts and crude oil futures are used.
While the use of these hedging instruments provides some
protection against short-term volatility in crude oil prices, it
does not protect against longer-term trends in crude oil prices.
In the financial year under review, we hedged a portion
(approximately 30% of Synfuels’ production) of our exposure to
crude oil price volatility by entering into a derivative instrument
in terms of which 45 000 b/d of crude oil were sold forward at a
weighted average price of US$33,12/b. Whilst the hedge
achieved our objective of achieving a minimum level of cash
flows in order to fund our capital expenditure programme, the
group realised a total opportunity loss for the year on this
hedge of R1 147 million before tax.
We have reviewed our oil price exposure for the 2006 financial
year. Due to continuing volatility in oil markets and considering
the capital expenditure plans for the year, we have decided to
continue with modest hedging to protect cash flows, but
following a different approach.
We have, therefore, for the 2006 financial year, entered into
hedging transactions (zero cost collars) for 45 000 barrels of oil
(dated Brent) per day (equivalent to approximately 30% of
Synfuels’ production). In terms of this hedge the group will be
protected, should monthly average oil prices decrease below
US$45,00/b on the hedged portion of production, and
conversely, will incur opportunity losses on the hedged portion
of production should monthly average oil prices exceed
US$82,61 per barrel.
We believe the revised approach to be more appropriate in the
context of the currently high and rising crude oil prices.
Although, on the hedged portion of production, the approach
protects Sasol should crude oil prices drop below US$45,00/b,
thereby ensuring that sufficient cash flow is generated to fund
the capital expenditure programme, it allows Sasol to take
advantage of any upside on the crude oil price up to
US$82,61/b thus limiting the potential opportunity loss
which could arise.
This review provides further insight into the financial position, performance and arrangements of our group and should be read inconjunction with the annual financial statements presented on pages 25 to 131.
Key performance indicatorsOur key financial performance indicators for the year ended 30 June 2005 were as follows
2005 2005 2004 % US$m1 Rm Rm increase
Turnover 11 150 69 239 60 151 15Operating profit 2 336 14 506 9 314 56Earnings attributable to shareholders 1 541 9 573 5 940 61Cash generated by operating activities 3 029 18 812 15 151 24Total assets 13 191 87 989 73 486 20Total debt 2 829 18 866 16 488 14
Earnings per share cents 251 1 560 974 60
Gearing % 37,6 41,2
Net asset value rand 70,58 57,31 23
1 The principal reporting currency of Sasol is the rand. Amounts expressed in US dollars represent a translation made in accordance with International Financial ReportingStandards (IFRS) as set out in note 28 of the accounting policies and glossary of financial reporting terms on page 43. These figures are presented for convenience purposes only.
Economic variables and financial indicatorsPrincipal economic indicatorsThe economic indicators and variables used in preparing the financial statements were
Income statement Balance sheetNote 2005 2004 2003 2005 2004 2003
Exchange rates 1rand/US$ 6,21 6,88 9,03 6,67 6,21 7,50rand/euro 7,89 8,19 9,41 8,07 7,57 8,63
Financial statementsNote 2005 2004 2003
Crude oil (US$/b)Dated Brent (annual average) 2 46,17 31,30 27,83
Notes:1. Exchange rates are determined as the mid-closing interbank rate of South African banks daily as published by Reuters. The average rate for the year, used for income
statement purposes, is determined as an arithmetic average of the mid-closing interbank rates for each of the South African business days for the financial year under review.2. Brent crude oil prices are determined from the quoted daily average market prices of Blend North Sea crude oil as published by Platts Global Alert. The average price for
the year is calculated as an arithmetic average of the daily published prices.
Monthly average commodity chemical prices are reflected in the following graph
* Further detail is provided in the Form 20-F filed with the Securities and Exchange Commission in the United States of America and available on our website.
Chemical prices
1997 1998 1999 2000 2001 2002 2003 2004 2005
260
240
220
200
180
160
140
120
100
80
60
40
Ammonia Polymers Phenols Solvents
pric
es –
exp
ress
ed a
s a
perc
enta
ge o
f Jul
y 19
97

54
For the 2006 financial year, a US$1/b increase in the average
annual crude oil price results in an approximately R255 million
(US$39 million) increase in operating profit with a similar
negative consequence if the average annual crude oil price
decreases by US$1/b. This sensitivity is utilised primarily for
purposes of financial forecasting and budgeting. Should the
annual average crude oil price move outside the range of
our zero cost collar hedging instrument, the effect on
operating profit will reduce to approximately R105 million
(US$16,5 million) for each US$1 change in the crude oil price.
Full disclosure is provided in the financial instruments disclosure
on page 119.
Cyclicality in petrochemical product pricesThe demand for our chemical and especially polymer products
is normally cyclical. Typically, higher demand during peaks in
industry cycles leads producers to increase production capacity.
Although peaks in these cycles have in the past been
characterised by increased market prices and higher operating
margins, such peaks have prompted further capital investment
which has led to supply exceeding demand and a resultant
reduction in selling prices and operating margins.
Even though there is currently a surplus capacity of some
products in the chemicals market, with the possibility of further
capacity additions in the next few years, it is not currently group
The fixing or capping of interest rates to achieve improved
predictability of borrowing costs is considered and implemented
on a case-by-case and project-by-project basis, taking the
specific and overall risk profile and benefits into consideration.
In most cases, interest rates are fixed by entering into an interest
rate swap to exchange a portion of variable interest exposure
on the underlying debt for fixed interest rate exposure. Details
of these interest rate swaps are provided on page 118 in the
financial instruments notes.
Accounting policiesThe consolidated financial statements are prepared in
compliance with International Financial Reporting Standards
(IFRS) and applicable legislation.
As reflected in the accounting policies on page 37, the group
has adopted the majority of the revised standards issued by the
International Accounting Standards Board (IASB) before the
mandatory date of adoption. This approach has been followed
as these statements provide improvements to financial
reporting resulting in improved disclosure in the annual financial
statements and also has the effect of furthering our stated
intention of harmonising our accounting treatment under IFRS
and US GAAP. The following standards were not adopted during
the current year:
• IAS21 The effect of changes in foreign exchange rates – the
changes to this standard may result in material system and
accounting changes and is therefore being extensively
researched before it is adopted.
• IAS24 Related parties – the changes are primarily to company
(and not group) financial statements and are expected to
result in significant changes to underlying reporting systems
and the requirements are being extensively researched before
being implemented.
• IAS32 and 39 Financial instruments – the IASB recommended
that this statement not be adopted early.
• IFRS2 Share based payments – the equivalent revised
US GAAP standard will only be adopted from the 2006
financial year and therefore the adoption of this standard is
delayed to achieve harmonisation between IFRS and US GAAP.
• IFRS4 Insurance contracts – the standard has no material
impact on Sasol and will be implemented from the 2006
financial year.
• IFRS6 Exploration for and evaluation of mineral resources –
was issued during the current year, has a minimal effect on
Sasol and is only applicable from the 2007 financial year.
These standards will be adopted for the 2006 financial year
which commenced on 1 July 2005.
Progress in achieving harmonisation of IFRS with US GAAPThe adoption of the accounting standards as described in
the accounting policies on page 37 has resulted in further
harmonisation with US GAAP, notably in the areas of business
combinations and intangible assets. The adoption of IFRS2
Share based payments, concurrently with the revised
US GAAP standard, in the 2006 financial year will result in
further harmonisation.
The following remaining significant differences between IFRS
and US GAAP cannot, in terms of current accounting standards
and our policies, be harmonised because in terms of US GAAP:
• the provision for post-retirement benefit obligations is
determined as the expected future benefits payable while in
terms of IFRS it is determined as the expected future
contributions payable;
• all incorporated joint ventures are accounted for using the
equity method whilst under our selected policy for IFRS they
are proportionately consolidated;
• assets are considered to be impaired when the carrying value
is less than the undiscounted value of future cash flows, while
for IFRS the carrying value is compared to the discounted
value of future cash flows; and
• the discount rate of asset retirement obligations is not
reassessed annually whilst for IFRS the discount rate is
adjusted on an annual basis.
Key areas where management’s judgement has been applied
In preparing our financial statements in terms of IFRS,
applicable accounting policies are applied and estimates and
assumptions made that may affect reported financial results.
The nature of these assumptions is inherently long-term and
future experience may result in actual amounts differing from
these estimates.
The following accounting policies have been identified as involving
particularly complex or subjective decisions or assessments:
Depreciation rates
The group depreciates its assets over their estimated useful lives,
which, following the adoption of IAS16 Property, plant and
equipment (revised), are re-assessed on an annual basis. The actual
lives of these assets can vary depending on a variety of factors.
Assets related to oil-and-gas producing activities are
depreciated over the estimated proven reserves to which
those assets relate. Accordingly, changes in proven reserves may
result in a significant change to the depreciation rates applied
to these assets.
The group’s assets are depreciated over their estimated
remaining useful lives. These useful lives are periodically
reassessed to determine whether the original period continues
to be appropriate. Technological innovation, product life
cycles and maintenance programmes all impact the useful lives
of the assets.
During the current year, the effect of changing the remaining
estimated useful lives of our plant and equipment and therefore
the depreciation charge, was an increase in operating profit of
some R1,5 billion. This has significantly reduced the depreciation
to cost of property, plant and equipment ratio from 5,8% in 2004
to 3,8% in 2005. This reduction in depreciation is attributable to
the following businesses:
Reduction in
depreciation charge
Business unit Rm
Mining 29
Synfuels 656
Gas 50
Liquid Fuels Business 39
Polymers 170
Solvents 61
Olefins & Surfactants 517
Nitro 12
Wax 10
Technology 2
Financing 1
Total 1 547
The effect of the initial review of the estimated useful lives of
our assets was significant. It should be noted, however, that for
every subsequent financial year, each business unit is required
to perform a similar review of both the depreciation method
applied and the estimated remaining useful lives of its assets.
This future review is not expected to result in a significant
adjustment to future depreciation charges and therefore the
current year impact is not expected to recur.
Impairment of assets
An impairment assessment is performed on property, plant and
equipment, goodwill and intangible assets at least biannually.
The future cash flows expected to be generated by these assets
are assessed, taking into account forecast market conditions
and the expected remaining lives of these assets. The present
value of these cash flows is compared to the current net asset
value and, if lower, the assets are impaired to the present value.
A number of our chemical plants in South Africa wereconstructed during a period in which the relatively weak randincreased capital costs. These plants are now earning incomestreams based on a much stronger rand than originallyenvisaged at the time of construction. Furthermore, at the timethe investment decisions were made, an average long-termcrude oil price in the region of US$20/b was forecast whilst
sasol limited group
chief financial officer’s review continued
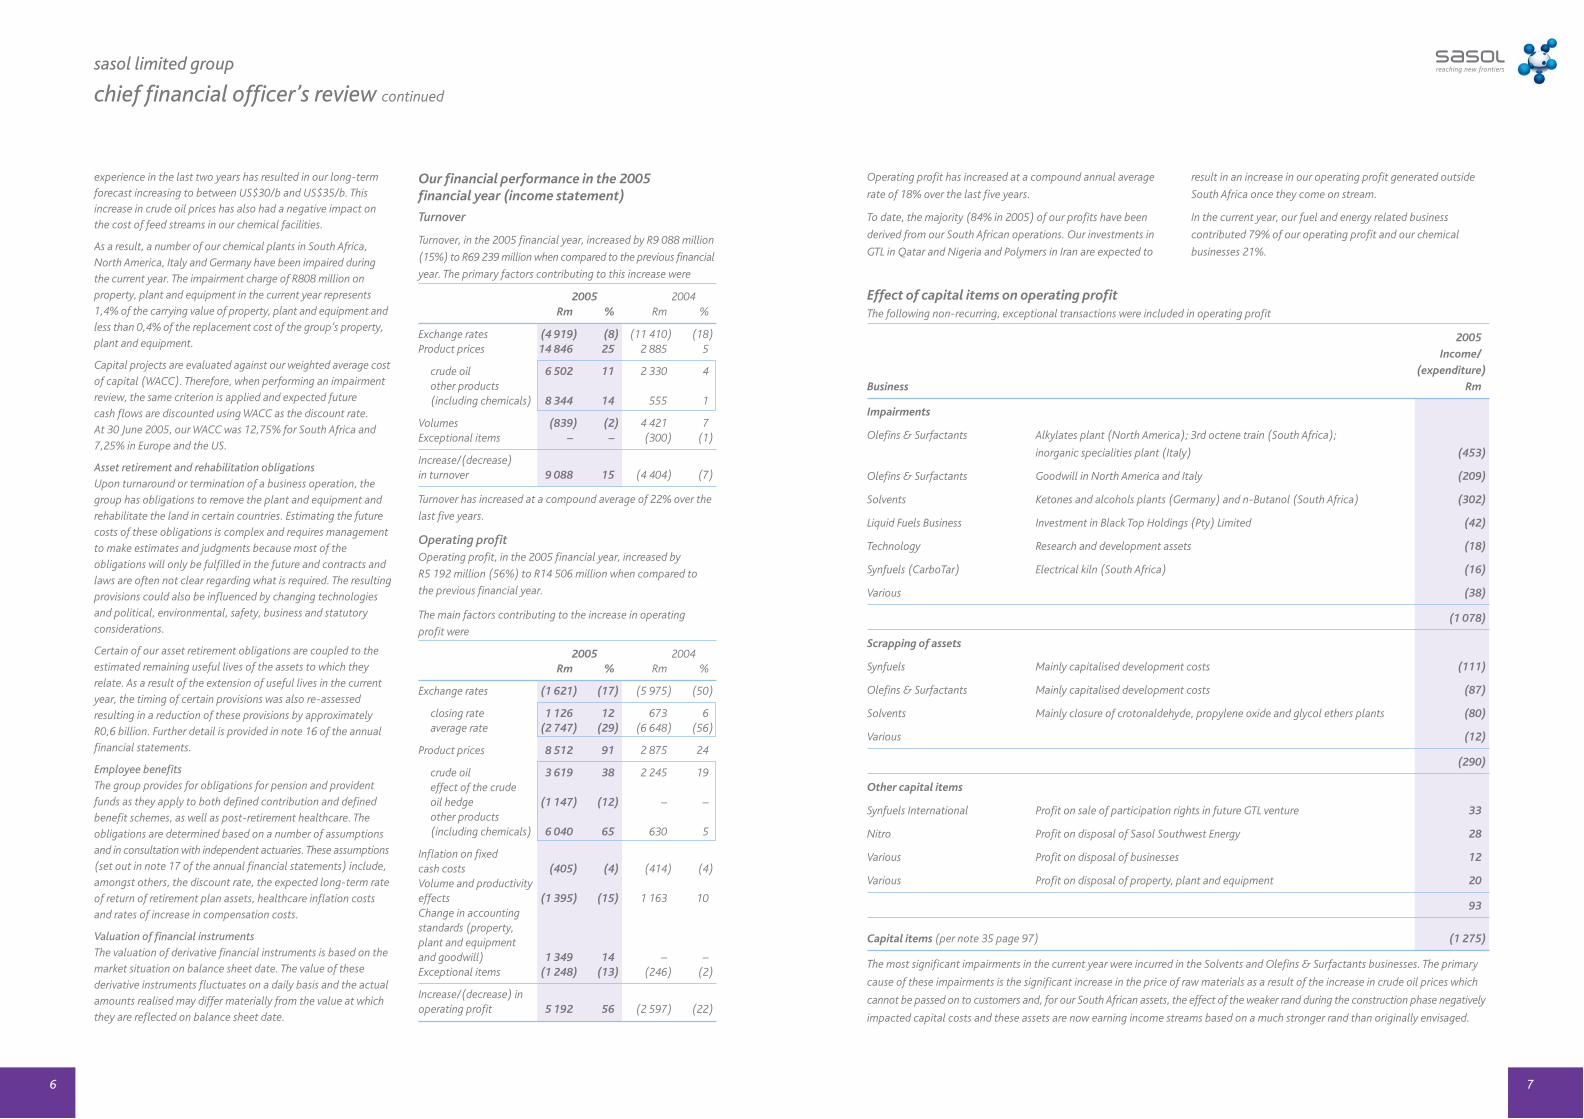
76
experience in the last two years has resulted in our long-termforecast increasing to between US$30/b and US$35/b. Thisincrease in crude oil prices has also had a negative impact onthe cost of feed streams in our chemical facilities.
As a result, a number of our chemical plants in South Africa,North America, Italy and Germany have been impaired duringthe current year. The impairment charge of R808 million onproperty, plant and equipment in the current year represents1,4% of the carrying value of property, plant and equipment andless than 0,4% of the replacement cost of the group’s property,plant and equipment.
Capital projects are evaluated against our weighted average costof capital (WACC). Therefore, when performing an impairmentreview, the same criterion is applied and expected future cash flows are discounted using WACC as the discount rate.At 30 June 2005, our WACC was 12,75% for South Africa and7,25% in Europe and the US.
Asset retirement and rehabilitation obligationsUpon turnaround or termination of a business operation, thegroup has obligations to remove the plant and equipment andrehabilitate the land in certain countries. Estimating the futurecosts of these obligations is complex and requires managementto make estimates and judgments because most of theobligations will only be fulfilled in the future and contracts andlaws are often not clear regarding what is required. The resultingprovisions could also be influenced by changing technologiesand political, environmental, safety, business and statutoryconsiderations.
Certain of our asset retirement obligations are coupled to theestimated remaining useful lives of the assets to which theyrelate. As a result of the extension of useful lives in the currentyear, the timing of certain provisions was also re-assessedresulting in a reduction of these provisions by approximatelyR0,6 billion. Further detail is provided in note 16 of the annualfinancial statements.
Employee benefitsThe group provides for obligations for pension and providentfunds as they apply to both defined contribution and definedbenefit schemes, as well as post-retirement healthcare. Theobligations are determined based on a number of assumptionsand in consultation with independent actuaries. These assumptions(set out in note 17 of the annual financial statements) include,amongst others, the discount rate, the expected long-term rateof return of retirement plan assets, healthcare inflation costsand rates of increase in compensation costs.
Valuation of financial instrumentsThe valuation of derivative financial instruments is based on themarket situation on balance sheet date. The value of thesederivative instruments fluctuates on a daily basis and the actualamounts realised may differ materially from the value at whichthey are reflected on balance sheet date.
Our financial performance in the 2005 financial year (income statement)
Turnover
Turnover, in the 2005 financial year, increased by R9 088 million
(15%) to R69 239 million when compared to the previous financial
year. The primary factors contributing to this increase were
2005 2004Rm % Rm %
Exchange rates (4 919) (8) (11 410) (18)Product prices 14 846 25 2 885 5
crude oil 6 502 11 2 330 4other products (including chemicals) 8 344 14 555 1
Volumes (839) (2) 4 421 7Exceptional items – – (300) (1)
Increase/(decrease) in turnover 9 088 15 (4 404) (7)
Turnover has increased at a compound average of 22% over the
last five years.
Operating profitOperating profit, in the 2005 financial year, increased by
R5 192 million (56%) to R14 506 million when compared to
the previous financial year.
The main factors contributing to the increase in operating
profit were
2005 2004Rm % Rm %
Exchange rates (1 621) (17) (5 975) (50)
closing rate 1 126 12 673 6average rate (2 747) (29) (6 648) (56)
Product prices 8 512 91 2 875 24
crude oil 3 619 38 2 245 19effect of the crude oil hedge (1 147) (12) – –other products (including chemicals) 6 040 65 630 5
Inflation on fixed cash costs (405) (4) (414) (4)Volume and productivity effects (1 395) (15) 1 163 10Change in accounting standards (property,plant and equipment and goodwill) 1 349 14 – –Exceptional items (1 248) (13) (246) (2)
Increase/(decrease) in operating profit 5 192 56 (2 597) (22)
Operating profit has increased at a compound annual average
rate of 18% over the last five years.
To date, the majority (84% in 2005) of our profits have been
derived from our South African operations. Our investments in
GTL in Qatar and Nigeria and Polymers in Iran are expected to
result in an increase in our operating profit generated outside
South Africa once they come on stream.
In the current year, our fuel and energy related business
contributed 79% of our operating profit and our chemical
businesses 21%.
sasol limited group
chief financial officer’s review continued
Effect of capital items on operating profitThe following non-recurring, exceptional transactions were included in operating profit
2005
Income/
(expenditure)
Business Rm
Impairments
Olefins & Surfactants Alkylates plant (North America); 3rd octene train (South Africa);
inorganic specialities plant (Italy) (453)
Olefins & Surfactants Goodwill in North America and Italy (209)
Solvents Ketones and alcohols plants (Germany) and n-Butanol (South Africa) (302)
Liquid Fuels Business Investment in Black Top Holdings (Pty) Limited (42)
Technology Research and development assets (18)
Synfuels (CarboTar) Electrical kiln (South Africa) (16)
Various (38)
(1 078)
Scrapping of assets
Synfuels Mainly capitalised development costs (111)
Olefins & Surfactants Mainly capitalised development costs (87)
Solvents Mainly closure of crotonaldehyde, propylene oxide and glycol ethers plants (80)
Various (12)
(290)
Other capital items
Synfuels International Profit on sale of participation rights in future GTL venture 33
Nitro Profit on disposal of Sasol Southwest Energy 28
Various Profit on disposal of businesses 12
Various Profit on disposal of property, plant and equipment 20
93
Capital items (per note 35 page 97) (1 275)
The most significant impairments in the current year were incurred in the Solvents and Olefins & Surfactants businesses. The primary
cause of these impairments is the significant increase in the price of raw materials as a result of the increase in crude oil prices which
cannot be passed on to customers and, for our South African assets, the effect of the weaker rand during the construction phase negatively
impacted capital costs and these assets are now earning income streams based on a much stronger rand than originally envisaged.
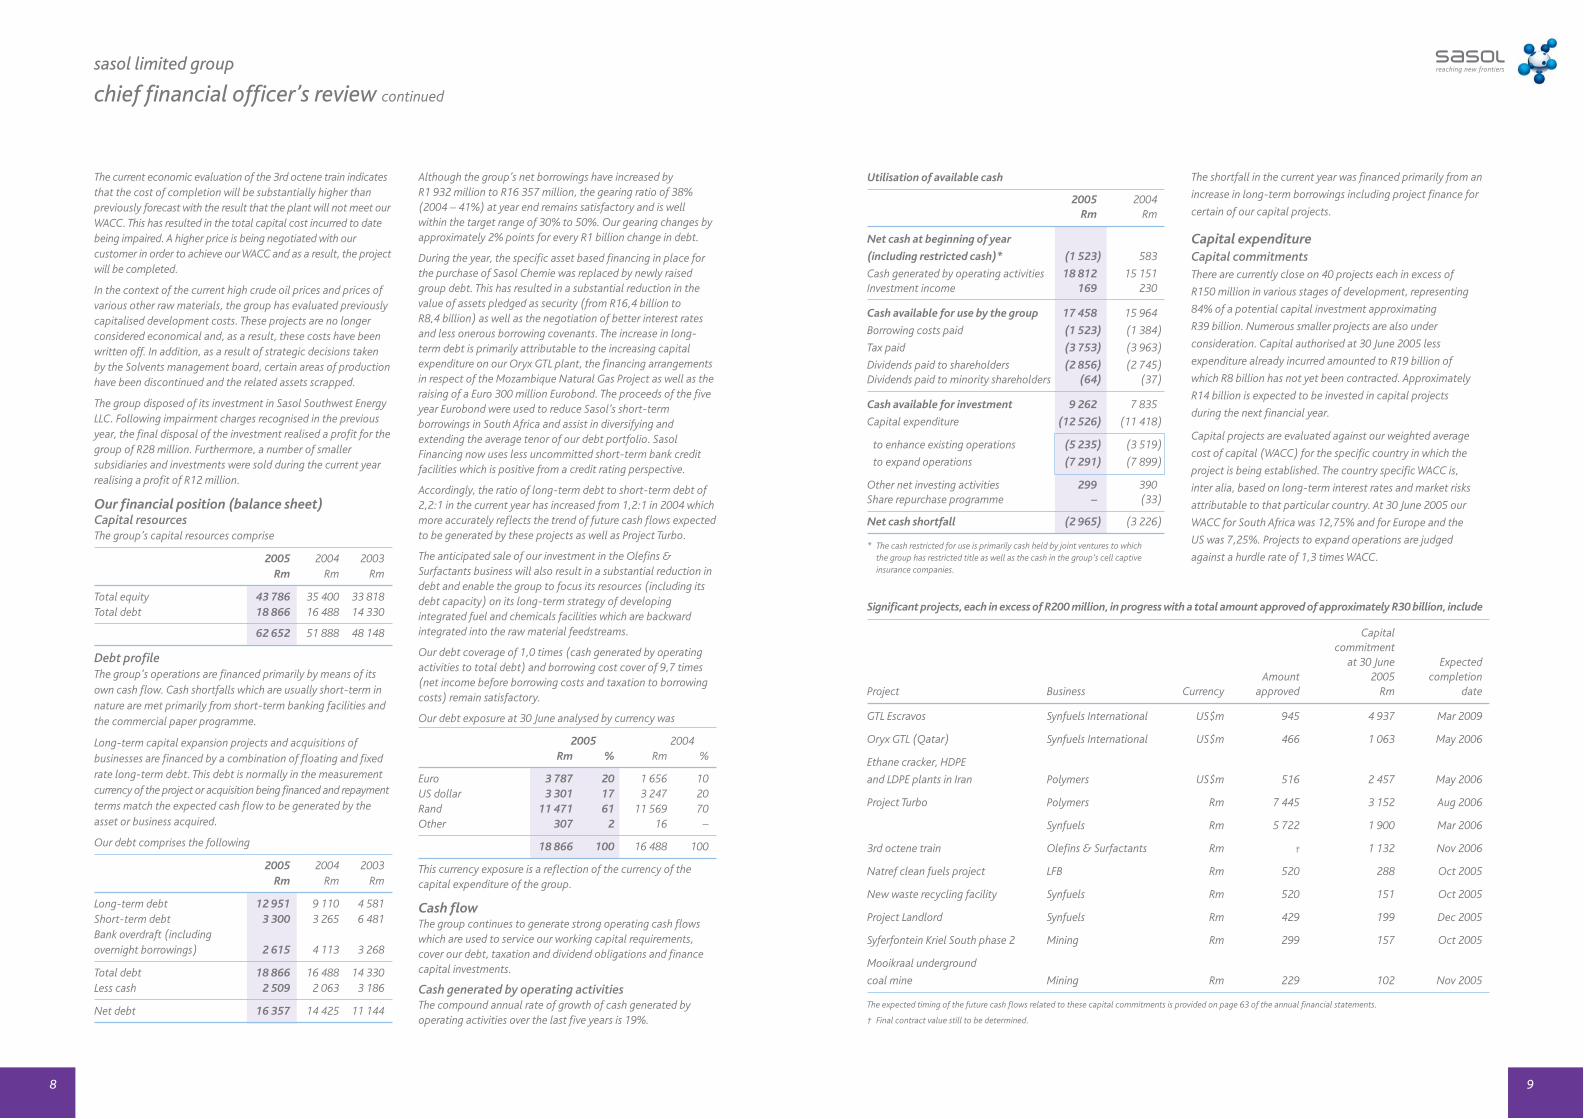
98
The current economic evaluation of the 3rd octene train indicatesthat the cost of completion will be substantially higher thanpreviously forecast with the result that the plant will not meet ourWACC. This has resulted in the total capital cost incurred to datebeing impaired. A higher price is being negotiated with ourcustomer in order to achieve our WACC and as a result, the projectwill be completed.
In the context of the current high crude oil prices and prices ofvarious other raw materials, the group has evaluated previouslycapitalised development costs. These projects are no longerconsidered economical and, as a result, these costs have beenwritten off. In addition, as a result of strategic decisions takenby the Solvents management board, certain areas of productionhave been discontinued and the related assets scrapped.
The group disposed of its investment in Sasol Southwest EnergyLLC. Following impairment charges recognised in the previousyear, the final disposal of the investment realised a profit for thegroup of R28 million. Furthermore, a number of smallersubsidiaries and investments were sold during the current yearrealising a profit of R12 million.
Our financial position (balance sheet)Capital resourcesThe group’s capital resources comprise
2005 2004 2003Rm Rm Rm
Total equity 43 786 35 400 33 818Total debt 18 866 16 488 14 330
62 652 51 888 48 148
Debt profileThe group’s operations are financed primarily by means of itsown cash flow. Cash shortfalls which are usually short-term innature are met primarily from short-term banking facilities andthe commercial paper programme.
Long-term capital expansion projects and acquisitions ofbusinesses are financed by a combination of floating and fixedrate long-term debt. This debt is normally in the measurementcurrency of the project or acquisition being financed and repaymentterms match the expected cash flow to be generated by theasset or business acquired.
Our debt comprises the following
2005 2004 2003Rm Rm Rm
Long-term debt 12 951 9 110 4 581Short-term debt 3 300 3 265 6 481Bank overdraft (includingovernight borrowings) 2 615 4 113 3 268
Total debt 18 866 16 488 14 330Less cash 2 509 2 063 3 186
Net debt 16 357 14 425 11 144
Utilisation of available cash
2005 2004Rm Rm
Net cash at beginning of year
(including restricted cash)* (1 523) 583
Cash generated by operating activities 18 812 15 151Investment income 169 230
Cash available for use by the group 17 458 15 964
Borrowing costs paid (1 523) (1 384)
Tax paid (3 753) (3 963)
Dividends paid to shareholders (2 856) (2 745)Dividends paid to minority shareholders (64) (37)
Cash available for investment 9 262 7 835
Capital expenditure (12 526) (11 418)
to enhance existing operations (5 235) (3 519)
to expand operations (7 291) (7 899)
Other net investing activities 299 390Share repurchase programme – (33)
Net cash shortfall (2 965) (3 226)
* The cash restricted for use is primarily cash held by joint ventures to whichthe group has restricted title as well as the cash in the group’s cell captiveinsurance companies.
The shortfall in the current year was financed primarily from an
increase in long-term borrowings including project finance for
certain of our capital projects.
Capital expenditureCapital commitmentsThere are currently close on 40 projects each in excess of
R150 million in various stages of development, representing
84% of a potential capital investment approximating
R39 billion. Numerous smaller projects are also under
consideration. Capital authorised at 30 June 2005 less
expenditure already incurred amounted to R19 billion of
which R8 billion has not yet been contracted. Approximately
R14 billion is expected to be invested in capital projects
during the next financial year.
Capital projects are evaluated against our weighted average
cost of capital (WACC) for the specific country in which the
project is being established. The country specific WACC is,
inter alia, based on long-term interest rates and market risks
attributable to that particular country. At 30 June 2005 our
WACC for South Africa was 12,75% and for Europe and the
US was 7,25%. Projects to expand operations are judged
against a hurdle rate of 1,3 times WACC.
sasol limited group
chief financial officer’s review continued
Although the group’s net borrowings have increased by R1 932 million to R16 357 million, the gearing ratio of 38%(2004 – 41%) at year end remains satisfactory and is wellwithin the target range of 30% to 50%. Our gearing changes byapproximately 2% points for every R1 billion change in debt.
During the year, the specific asset based financing in place forthe purchase of Sasol Chemie was replaced by newly raisedgroup debt. This has resulted in a substantial reduction in thevalue of assets pledged as security (from R16,4 billion to R8,4 billion) as well as the negotiation of better interest ratesand less onerous borrowing covenants. The increase in long-term debt is primarily attributable to the increasing capitalexpenditure on our Oryx GTL plant, the financing arrangementsin respect of the Mozambique Natural Gas Project as well as theraising of a Euro 300 million Eurobond. The proceeds of the fiveyear Eurobond were used to reduce Sasol’s short-termborrowings in South Africa and assist in diversifying andextending the average tenor of our debt portfolio. SasolFinancing now uses less uncommitted short-term bank creditfacilities which is positive from a credit rating perspective.
Accordingly, the ratio of long-term debt to short-term debt of2,2:1 in the current year has increased from 1,2:1 in 2004 whichmore accurately reflects the trend of future cash flows expectedto be generated by these projects as well as Project Turbo.
The anticipated sale of our investment in the Olefins &Surfactants business will also result in a substantial reduction indebt and enable the group to focus its resources (including itsdebt capacity) on its long-term strategy of developingintegrated fuel and chemicals facilities which are backwardintegrated into the raw material feedstreams.
Our debt coverage of 1,0 times (cash generated by operatingactivities to total debt) and borrowing cost cover of 9,7 times(net income before borrowing costs and taxation to borrowingcosts) remain satisfactory.
Our debt exposure at 30 June analysed by currency was
2005 2004Rm % Rm %
Euro 3 787 20 1 656 10US dollar 3 301 17 3 247 20Rand 11 471 61 11 569 70Other 307 2 16 –
18 866 100 16 488 100
This currency exposure is a reflection of the currency of thecapital expenditure of the group.
Cash flowThe group continues to generate strong operating cash flowswhich are used to service our working capital requirements,cover our debt, taxation and dividend obligations and financecapital investments.
Cash generated by operating activitiesThe compound annual rate of growth of cash generated byoperating activities over the last five years is 19%.
Significant projects, each in excess of R200 million, in progress with a total amount approved of approximately R30 billion, include
Capitalcommitment
at 30 June ExpectedAmount 2005 completion
Project Business Currency approved Rm date
GTL Escravos Synfuels International US$m 945 4 937 Mar 2009
Oryx GTL (Qatar) Synfuels International US$m 466 1 063 May 2006
Ethane cracker, HDPE
and LDPE plants in Iran Polymers US$m 516 2 457 May 2006
Project Turbo Polymers Rm 7 445 3 152 Aug 2006
Synfuels Rm 5 722 1 900 Mar 2006
3rd octene train Olefins & Surfactants Rm † 1 132 Nov 2006
Natref clean fuels project LFB Rm 520 288 Oct 2005
New waste recycling facility Synfuels Rm 520 151 Oct 2005
Project Landlord Synfuels Rm 429 199 Dec 2005
Syferfontein Kriel South phase 2 Mining Rm 299 157 Oct 2005
Mooikraal underground
coal mine Mining Rm 229 102 Nov 2005
The expected timing of the future cash flows related to these capital commitments is provided on page 63 of the annual financial statements.
† Final contract value still to be determined.

11
sasol limited group
chief financial officer’s review continued
10
Additions to non-current assets
Capital expenditure during the year, including the effects of
cash flow hedge accounting (R0,6 billion) amounted to
R13,2 billion of which R13,1 billion was incurred on property,
plant and equipment and R0,1 billion on intangible assets.
The cash effect of capital expenditure during the year
amounted to R12,4 billion on property, plant and equipment
and R0,1 billion on intangible assets.
Of the R12,4 billion capital expenditure (2004 – R10,9 billion),
R5,2 billion (42%) was utilised to address environmental
obligations and enhance existing assets and R7,2 billion (58%)
was spent to expand operations.
Shareholder informationShare repurchase programmeNo further shares were repurchased during the current year. The
group continues to hold 60 111 477 shares (8,9% of the total
shares in issue) in terms of its share repurchase programme.
Should opportunities arise where this capital can meaningfully
be utilised, the group may reissue these shares, although
presently there is no intention to trade with or reissue them.
In anticipation of our gearing easing, we will consider
reactivating our share repurchase programme and purchase
up to 10% of our own shares.
Share incentive schemeSasol operates a share incentive scheme which aims to retain and
reward certain senior employees. Allocations of options to these
employees are linked to both the company’s performance and that
of the individual. Further disclosure of the details of the scheme
are provided in note 38 of the annual financial statements.
In accordance with the group’s accounting policy, the cost of
share options granted to employees is not reflected in the
group’s financial statements. In terms of IFRS2 Share based
payments, Sasol will be required to recognise this expense in the
income statement from the 2006 financial year. Had this policy
been applied in the current year an expense of R137 million
(2004 – R146 million) would have been recognised in the
income statement.
This calculation is determined using the Black Scholes valuation
method taking into account the ruling price of the share on the
JSE Limited at 30 June 2005. Further detail is provided in note 38
of the annual financial statements.
DividendsIt is Sasol’s objective to distribute dividends on an annual basis
covered approximately three times by earnings. The group
aims to maintain a dividend cover of between 2,5 and 3,5 times.
In determining the dividend to be distributed, the group also
considers the potential re-investment opportunities within
the group. The dividend for the year has been increased to
R5,40 representing a dividend cover of 2,9 times which is
within the preferred dividend cover range.
Priorities for the year aheadOur key focus areas in the year ahead will be:
Sarbanes Oxley Act section 404 (SOX 404) implementation
The requirements of SOX 404 are to annually, for Sasol from the
2006 financial year and onwards, assess the adequacy of
internal controls in Sasol’s financial reporting process and to
report in Sasol’s annual (US GAAP) financial report (Form 20-F)
on the effectiveness thereof. The reporting environment and
review thereof by management is required to be evaluated by
our external auditors who will provide an audit opinion on our
assessment of internal control.
Key projects to address environmental matters and enhance existing assets during the year include
Project Business Rm
Project Turbo† Synfuels 2 520
Mining renewal Mining 466
Waste recycling facility Synfuels 263
Reconstruction of the ethylene plant (Unit 24) Polymers 185
Other (individually less than R100 million) Various 1 728
5 162
Key projects to expand operations during the year include
Project Business Rm
Project Turbo† Polymers 3 321
Oryx GTL* and Escravos GTL* Synfuels International (Sasol’s portion) 1 495
Ethane cracker, HDPE and LDPE plants in Iran* Polymers 945
Sasol LFB distribution network* LFB 294
2nd and 3rd octene trains Olefins & Surfactants 288
Mozambique Natural Gas Project* Gas and SPI 239
Clean fuels project* Natref 215
Tar naptha phenolic extraction Merisol (Sasol’s portion) 105
Other (individually less than R100 million) Various 350
7 252
† During the current year, increases in the capital costs as well as an overrun on the project schedule have resulted in the costs of completion of Project Turbo (Synfuels andPolymers) increasing from R12 billion to R13 billion and a resultant decrease in the expected return on this project.
* Financed using project specific finance. All other assets are financed out of available group funds.
Sasol has almost concluded its project to comprehensivelydocument the internal control environment to conform to theSOX 404 requirements. To this end, KPMG, as our external auditorshave been involved in the project as auditors and have evaluatedour process to achieve compliance with the requirements ofSOX 404 for the 2006 financial year. The SOX 404 processprovides benefits to the group in the form of an enhancedsensitivity to internal control as well as formalised, standardisedinternal and reporting control procedures throughout the group.
The focus in the 2006 financial year will be on embedding theseprocesses into our day to day activities and on achieving sign-offon the SOX 404 certification at the end of the 2006 financial year.
Implementation of new and revised accounting standardsThe accounting standards issued by the IASB which have not yetbeen adopted, as mentioned earlier in this report, will beimplemented during the 2006 financial year.
Formation of the liquid fuels business joint ventureThe potential formation of the liquid fuels joint venture,Uhambo Oil Limited, comprising the liquid fuels businesses ofSasol and Petronas, is expected to offer significant challengesfor our business and financial teams. Should the joint venture beapproved by the Competition Tribunal, a significant proportionof our resources will be required to successfully integrate thisbusiness into our reporting structures.
Divestment from Olefins & Surfactants businessThe intended divestment from the Olefins & Surfactants business will provide a number of challenges for the relevant teams to ensure that all aspects are taken into account in this transaction.
Financial targetsIn spite of these challenges we will continue to focus on our coreobjectives as they relate to financial performance. These targetsrepresent challenging but achievable milestones in our drive tocontinue to be a global business.
The current targets, which remain unchanged from the previous year, are:
• to maintain our gearing within a target range of 30% to 50%;
• to achieve 10% attributable earnings growth per annum inUS$ terms on a three year moving average basis (base years 1998 – 2000);
• to achieve an economic value added rating of 1,3 times ourweighted average cost of capital on all new majorinvestments; and
• to generate 50% of our cash from operations from our non-South African operations by the 2010 financial year.
Trevor Munday
Chief financial officer

13
sasol limited group
financial review†
Compound 2005 2004 2003 2002 2001 2000 1999 1998 1997 1996
growth %* Rm Rm Rm Rm Rm Rm Rm Rm Rm Rm
Balance sheet
Property, plant and equipment 24,6 56 550 46 858 42 363 38 453 29 346 18 798 16 048 14 981 13 163 11 547
Non-current assets 5 330 4 750 4 159 3 748 2 355 1 846 908 645 598 446
Current assets 26 109 21 878 23 097 23 529 19 742 9 021 7 300 7 893 7 231 6 631
Total assets 24,3 87 989 73 486 69 619 65 730 51 443 29 665 24 256 23 519 20 992 18 624
Total equity 19,8 43 786 35 400 33 818 31 587 23 244 17 715 15 131 13 025 11 778 10 077
Convertible debentures – – – – – – 1 028 1 028 1 028 1 028
Interest-bearing debt 18 865 16 448 14 277 10 579 8 429 777 1 123 2 145 1 146 1 317
Interest-free liabilities 25 338 21 638 21 524 23 564 19 770 11 173 6 974 7 321 7 040 6 202
Total equity and liabilities 24,3 87 989 73 486 69 619 65 730 51 443 29 665 24 256 23 519 20 992 18 624
Income statement
Turnover 21,9 69 239 60 151 64 555 59 590 40 768 25 762 19 180 16 666 15 810 13 545
Operating profit 18,2 14 506 9 314 11 911 14 783 10 619 6 292 3 701 3 121 3 900 3 213
Income from associates 184 117 60 31 11 6 – – – –
Borrowing (costs)/income (438) (249) (58) (54) 34 (189) 75 165 331 281
Net income before tax 18,5 14 252 9 182 11 913 14 760 10 664 6 109 3 776 3 286 4 231 3 494
Taxation (4 568) (3 175) (4 007) (4 905) (3 512) (1 994) (1 203) (1 225) (1 592) (1 226)
Earnings 18,7 9 684 6 007 7 906 9 855 7 152 4 115 2 573 2 061 2 639 2 268
Attributable to minority interests in subsidiaries (111) (67) (89) (38) (27) (19) (32) (28) (33) (34)
Equalisation reserve transfer – – – – – – – 100 – (100)
Earnings attributable to shareholders 18,5 9 573 5 940 7 817 9 817 7 125 4 096 2 541 2 133 2 606 2 134
Cash flow statement
Cash from operations 19,0 20 993 14 859 15 986 19 241 15 277 8 793 5 063 4 301 4 869 4 097
(Increase)/decrease in working capital (2 181) 292 11 216 (1 195) (1 010) (895) (318) (414) (25)
Cash generated by operating activities 19,3 18 812 15 151 15 997 19 457 14 082 7 783 4 168 3 983 4 455 4 072
Investment income 169 230 178 247 253 204 384 269 445 436
Borrowing costs paid (1 523) (1 384) (1 286) (863) (509) (387) (309) (104) (114) (155)
Tax paid (3 753) (3 963) (5 527) (4 749) (2 972) (1 267) (1 105) (1 211) (998) (1 241)
Cash available from operating activities 16,7 13 705 10 034 9 362 14 092 10 854 6 333 3 138 2 937 3 788 3 112
Dividends and debenture interest paid (2 856) (2 745) (2 835) (2 325) (1 655) (1 114) (980) (978) (901) (236)
Cash retained from operating activities 15,8 10 849 7 289 6 527 11 767 9 199 5 219 2 158 1 959 2 887 2 876
Additions to property, plant and equipment (12 414) (10 888) (10 272) (7 945) (3 657) (1 817) (2 348) (2 927) (2 617) (1 998)
Additions to intangible assets (112) (530) (696) (797) (438) (354) – – – –
Acquisition of businesses – (555) (155) (565) (8 350) (2 827) (346) (148) – –
Other movements 299 945 402 878 (291) 242 8 130 (101) 60
(Increase)/decrease in funding requirements (1 378) (3 739) (4 194) 3 338 (3 537) 463 (528) (986) 169 938
† The financial results of the group have, from the beginning of the 2000 financial year, been prepared in accordance with International Financial Reporting Standards.Figures prior to 2000 have not been restated to comply with International Financial Reporting Standards. During 2003 the group changed its accounting policy to capitalise borrowing costs on qualifying assets. Figures prior to 2001 have not been restated.
* Five year compound growth percentage per annum.
12

2005 2004 2003 2002 2001 2000 1999 1998 1997 1996
Liquidity Measures the group's ability to meet its maturing
obligations and short-term cash requirements
Current ratio Current assets :1 1,4 1,2 1,2 1,4 1,4 1,7 1,7 1,5 1,8 1,8
Current liabilities
Quick ratio Current assets – inventories :1 0,9 0,8 0,7 0,9 0,9 1,0 1,1 1,0 1,2 1,3
Current liabilities
Cash ratio Cash and cash equivalents :1 0,1 (0,1) – 0,1 0,2 0,1 0,2 0,4 0,6 0,7
Current liabilities – bank overdraft
Debt leverage Measures the group’s ability to meet capital and
interest payments over the long term
Total liabilities to shareholders’ equity Non-current liabilities + current liabilities % 101,5 108,7 106,8 109,0 121,9 66,9 49,5 66,7 63,3 66,9
Shareholders’ equity
Total borrowings to shareholders’ equity Long-term debt + short-term debt + bank overdraft (total borrowings) % 43,3 47,1 42,8 34,1 36,8 8,5 5,9 15,3 8,9 11,9
Shareholders’ equity
Net borrowings to shareholders’ equity (gearing) Total borrowings – cash % 37,6 41,2 33,2 25,1 28,1 5,6 0,9 * * *
Shareholders’ equity
Debt coverage Cash generated by operating activities times 1,0 0,9 1,1 1,8 1,7 5,2 4,4 1,9 3,9 3,1
Total borrowings
Borrowing cost cover Net income before borrowing costs and taxation times 9,7 7,0 9,4 17,4 21,4 16,8 13,2 32,6 38,1 23,5
Borrowing costs paid
Profitability Measures the financial performance of the group
Return on shareholders’ equity Earnings attributable to shareholders % 24,4 17,3 24,1 36,1 34,9 24,2 16,8 15,9 21,8 20,2
Average shareholders’ equity
Return on total assets Net income before borrowing costs and taxation % 18,4 13,4 17,9 25,7 26,8 24,1 17,1 15,2 21,9 20,5
Average non-current assets + average current assets
Return on net assets Net income before borrowing costs and taxation % 37,5 27,8 37,1 54,9 53,0 38,1 26,9 25,1 36,1 34,1
Average total assets – average total liabilities
Gross margin Gross profit % 39,0 35,5 39,0 41,6 37,8 31,9 29,0 23,2 31,1 °
Turnover
Operating margin Operating profit % 21,0 15,5 18,5 24,8 26,0 24,4 19,3 18,7 24,7 23,7
Turnover
Efficiency Measures the effectiveness and intensity of the group’s
management of its resources
Net asset turnover ratio Turnover times 1,7 1,7 2,0 2,2 2,0 1,5 1,3 1,2 1,3 1,3
Average total assets – average total liabilities
Depreciation to cost of property, Depreciation % 3,8 5,8 5,9 6,0 4,5 5,9 5,2 4,8 4,5 4,7
plant and equipment Cost of property, plant and equipment(Refer to the chief financial officer’s review)
Net working capital to turnover (Inventories + trade receivables + other receivables and
prepaid expenses) – (accounts payable + other
payables and accrued expenses) % 18,2 17,8 17,4 21,3 27,1 20,8 18,6 15,9 14,5 13,9
Turnover(Refer to the notes to the annual financial statements for additional working capital ratios)
* for 1998, 1997 and 1996 the result is a net cash surplus
° Not available
15
sasol limited group
summary of statistics
14
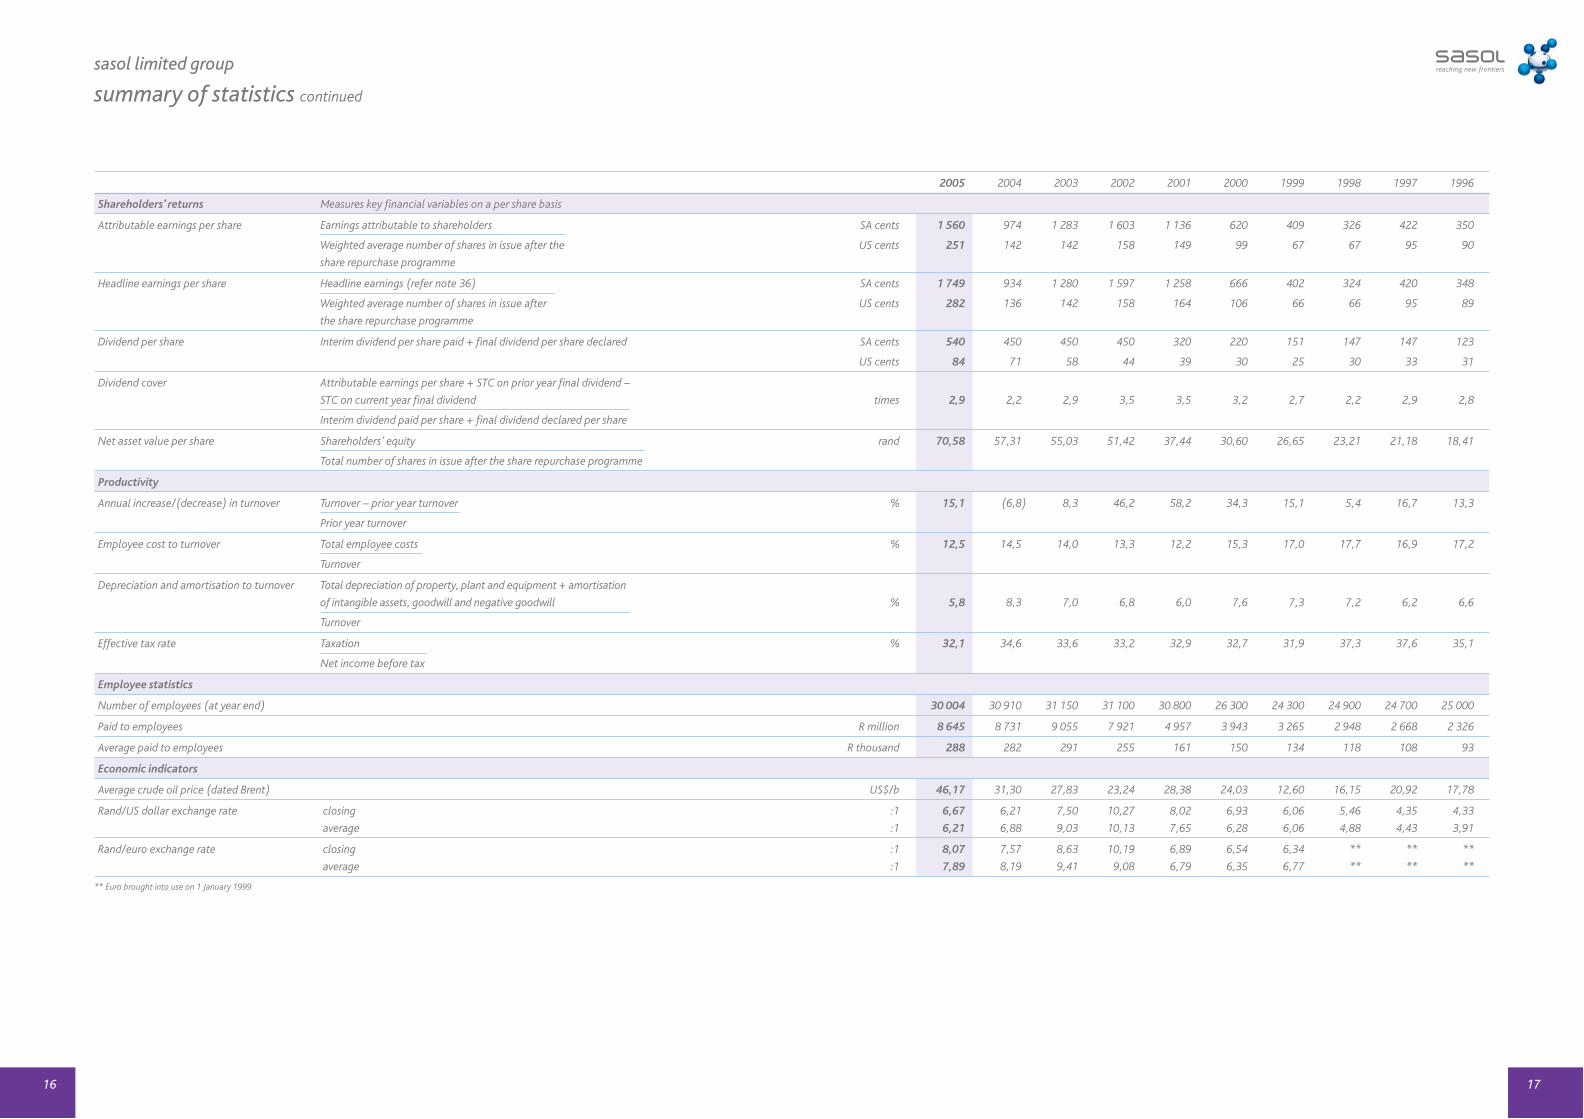
17
sasol limited group
summary of statistics continued
2005 2004 2003 2002 2001 2000 1999 1998 1997 1996
Shareholders’ returns Measures key financial variables on a per share basis
Attributable earnings per share Earnings attributable to shareholders SA cents 1 560 974 1 283 1 603 1 136 620 409 326 422 350
Weighted average number of shares in issue after the US cents 251 142 142 158 149 99 67 67 95 90
share repurchase programme
Headline earnings per share Headline earnings (refer note 36) SA cents 1 749 934 1 280 1 597 1 258 666 402 324 420 348
Weighted average number of shares in issue after US cents 282 136 142 158 164 106 66 66 95 89
the share repurchase programme
Dividend per share Interim dividend per share paid + final dividend per share declared SA cents 540 450 450 450 320 220 151 147 147 123
US cents 84 71 58 44 39 30 25 30 33 31
Dividend cover Attributable earnings per share + STC on prior year final dividend –
STC on current year final dividend times 2,9 2,2 2,9 3,5 3,5 3,2 2,7 2,2 2,9 2,8
Interim dividend paid per share + final dividend declared per share
Net asset value per share Shareholders’ equity rand 70,58 57,31 55,03 51,42 37,44 30,60 26,65 23,21 21,18 18,41
Total number of shares in issue after the share repurchase programme
Productivity
Annual increase/(decrease) in turnover Turnover – prior year turnover % 15,1 (6,8) 8,3 46,2 58,2 34,3 15,1 5,4 16,7 13,3
Prior year turnover
Employee cost to turnover Total employee costs % 12,5 14,5 14,0 13,3 12,2 15,3 17,0 17,7 16,9 17,2
Turnover
Depreciation and amortisation to turnover Total depreciation of property, plant and equipment + amortisation
of intangible assets, goodwill and negative goodwill % 5,8 8,3 7,0 6,8 6,0 7,6 7,3 7,2 6,2 6,6
Turnover
Effective tax rate Taxation % 32,1 34,6 33,6 33,2 32,9 32,7 31,9 37,3 37,6 35,1
Net income before tax
Employee statistics
Number of employees (at year end) 30 004 30 910 31 150 31 100 30 800 26 300 24 300 24 900 24 700 25 000
Paid to employees R million 8 645 8 731 9 055 7 921 4 957 3 943 3 265 2 948 2 668 2 326
Average paid to employees R thousand 288 282 291 255 161 150 134 118 108 93
Economic indicators
Average crude oil price (dated Brent) US$/b 46,17 31,30 27,83 23,24 28,38 24,03 12,60 16,15 20,92 17,78
Rand/US dollar exchange rate closing :1 6,67 6,21 7,50 10,27 8,02 6,93 6,06 5,46 4,35 4,33
average :1 6,21 6,88 9,03 10,13 7,65 6,28 6,06 4,88 4,43 3,91
Rand/euro exchange rate closing :1 8,07 7,57 8,63 10,19 6,89 6,54 6,34 ** ** **
average :1 7,89 8,19 9,41 9,08 6,79 6,35 6,77 ** ** **
** Euro brought into use on 1 January 1999
16
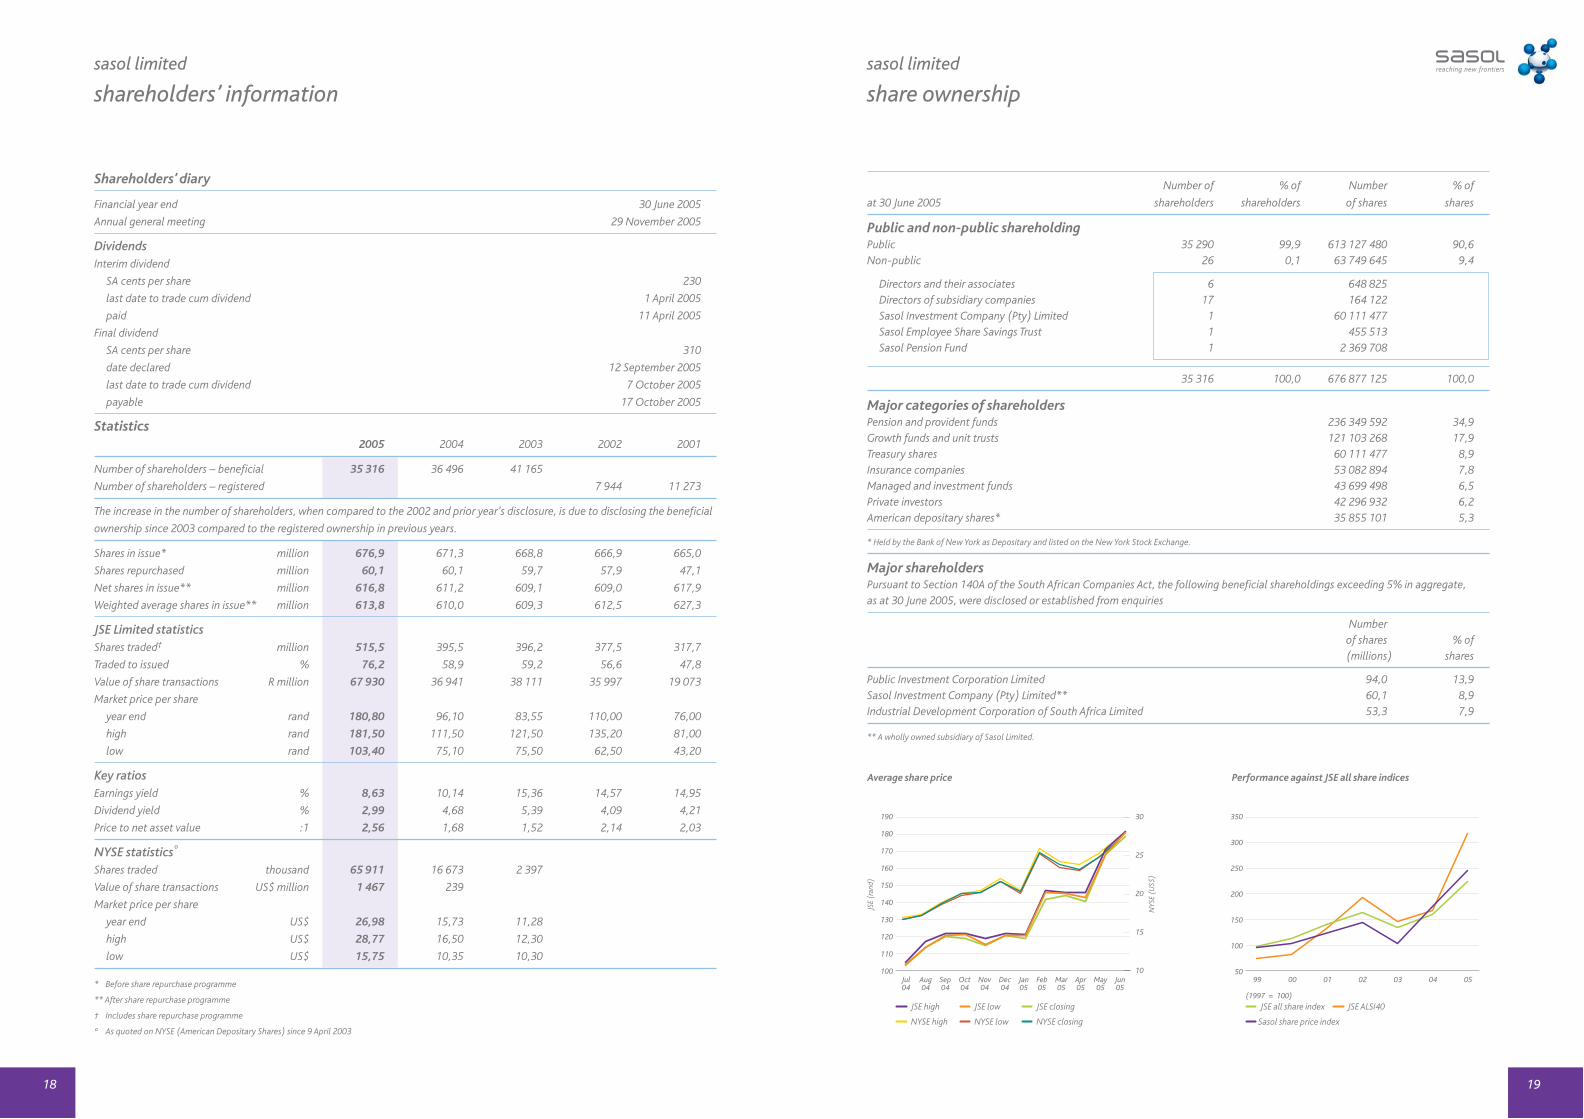
Number of % of Number % of
at 30 June 2005 shareholders shareholders of shares shares
Public and non-public shareholdingPublic 35 290 99,9 613 127 480 90,6Non-public 26 0,1 63 749 645 9,4
Directors and their associates 6 648 825Directors of subsidiary companies 17 164 122Sasol Investment Company (Pty) Limited 1 60 111 477 Sasol Employee Share Savings Trust 1 455 513Sasol Pension Fund 1 2 369 708
35 316 100,0 676 877 125 100,0
Major categories of shareholdersPension and provident funds 236 349 592 34,9 Growth funds and unit trusts 121 103 268 17,9 Treasury shares 60 111 477 8,9 Insurance companies 53 082 894 7,8 Managed and investment funds 43 699 498 6,5 Private investors 42 296 932 6,2 American depositary shares* 35 855 101 5,3
* Held by the Bank of New York as Depositary and listed on the New York Stock Exchange.
Major shareholdersPursuant to Section 140A of the South African Companies Act, the following beneficial shareholdings exceeding 5% in aggregate,as at 30 June 2005, were disclosed or established from enquiries
Number of shares % of (millions) shares
Public Investment Corporation Limited 94,0 13,9 Sasol Investment Company (Pty) Limited** 60,1 8,9 Industrial Development Corporation of South Africa Limited 53,3 7,9
** A wholly owned subsidiary of Sasol Limited.
19
sasol limited
shareholders’ informationsasol limited
share ownership
Shareholders’ diary
Financial year end 30 June 2005
Annual general meeting 29 November 2005
DividendsInterim dividend
SA cents per share 230
last date to trade cum dividend 1 April 2005
paid 11 April 2005
Final dividend
SA cents per share 310
date declared 12 September 2005
last date to trade cum dividend 7 October 2005
payable 17 October 2005
Statistics2005 2004 2003 2002 2001
Number of shareholders – beneficial 35 316 36 496 41 165
Number of shareholders – registered 7 944 11 273
The increase in the number of shareholders, when compared to the 2002 and prior year’s disclosure, is due to disclosing the beneficial
ownership since 2003 compared to the registered ownership in previous years.
Shares in issue* million 676,9 671,3 668,8 666,9 665,0
Shares repurchased million 60,1 60,1 59,7 57,9 47,1
Net shares in issue** million 616,8 611,2 609,1 609,0 617,9
Weighted average shares in issue** million 613,8 610,0 609,3 612,5 627,3
JSE Limited statisticsShares traded† million 515,5 395,5 396,2 377,5 317,7
Traded to issued % 76,2 58,9 59,2 56,6 47,8
Value of share transactions R million 67 930 36 941 38 111 35 997 19 073
Market price per share
year end rand 180,80 96,10 83,55 110,00 76,00
high rand 181,50 111,50 121,50 135,20 81,00
low rand 103,40 75,10 75,50 62,50 43,20
Key ratiosEarnings yield % 8,63 10,14 15,36 14,57 14,95
Dividend yield % 2,99 4,68 5,39 4,09 4,21
Price to net asset value :1 2,56 1,68 1,52 2,14 2,03
NYSE statisticsº
Shares traded thousand 65 911 16 673 2 397
Value of share transactions US$ million 1 467 239
Market price per share
year end US$ 26,98 15,73 11,28
high US$ 28,77 16,50 12,30
low US$ 15,75 10,35 10,30
* Before share repurchase programme
** After share repurchase programme
† Includes share repurchase programme
º As quoted on NYSE (American Depositary Shares) since 9 April 2003
18
Average share price
Jul04
190
180
170
160
150
140
130
120
110
100
JSE high
JSE
(ran
d)
JSE low JSE closing
NYSE high NYSE low NYSE closing
30
25
20
15
10
NYS
E (U
S$)
Aug04
Sep04
Oct04
Nov04
Dec04
Jan05
Feb05
Mar05
Apr05
May05
Jun05
Performance against JSE all share indices
99 00 01 02 03 04 05
350
300
250
200
150
100
50
JSE all share index JSE ALSI40
Sasol share price index
(1997 = 100)

sasol limited group
value added statement
21
sasol limited
share ownership continued
Furthermore the directors have ascertained that some of the shares registered in the names of nominee holders are managed by
various fund managers and that, at 30 June 2005, the following fund managers were responsible for managing investments of 2%
or more of the share capital of Sasol Limited
Number
of shares % of
Fund manager (millions) shares
PIC Equities† 66,2 9,8
Old Mutual Asset Managers 59,6 8,8
Allan Gray Investment Council 57,0 8,4
Capital International Inc. (USA) 30,3 4,5
Stanlib Limited 21,9 3,2
Investec Asset Management 16,7 2,5
Sanlam Investment Managers 13,8 2,0
† The Public Investment Corporation Limited is the beneficial owner of the shares held by PIC Equities and this nominee shareholding is included in the 94,0 million sharesheld by the Public Investment Corporation Limited as mentioned under major shareholders.
20
American depositary shares
Corporate holding
Insurance companies
Investment funds
Pension funds
Private investors
Foreign banks
Other
Beneficial holding disclosures
Beneficial ownership by fund type
South Africa
Europe
North America
Other
Beneficial ownership by geographic region
20053,6%
24,3%
1,0%
6,3%5,3%
16,8%
34,9% 7,8%
20044,3%0,9%
7,1%5,2%
16,9%
24,0%33,9% 7,7%
20050,7%20,9%9,8%
68,6%
20044,7%19,5%7,0%
68,8%
Wealth distribution for 2005
Employees(including employees’ tax)
Providers of equity capital
Providers of debt
Governments – direct taxes
15,7%
39,9%
10,8%
Wealth created per share
01 02 03 04 05
50
40
30
20
10
0
(Ran
d)
31,5%
2,1%
Reinvested in the group
(Year)
Value added is defined as the value created by the activities of a business and its employees and in the case of Sasol is determined as
turnover less the cost of purchased materials and services. The value added statement reports on the calculation of value added and its
application among the stakeholders in the group. This statement shows the total wealth created and how it was distributed, taking into
account the amounts retained and reinvested in the group for the replacement of assets and development of operations.
2005 2004 2003 2002 2001
for the year ended 30 June Rm Rm Rm Rm Rm
Turnover 69 239 60 151 64 555 59 590 40 768
Less purchased materials and services (42 079) (37 085) (39 066) (32 820) (22 844)
Value added 27 160 23 066 25 489 26 770 17 924
Investment income 333 307 227 261 255
Wealth created 27 493 23 373 25 716 27 031 18 179
% % % % %
Employees (including employees’ tax) 31,5 8 645 37,4 8 731 35,2 9 055 29,3 7 921 27,3 4 957
Providers of equity capital 10,8 2 967 12,0 2 812 11,4 2 924 8,7 2 363 9,3 1 682
Providers of debt 2,1 587 1,9 439 0,9 225 1,1 284 1,2 210
Governments – direct taxes 15,7 4 326 14,6 3 421 14,2 3 651 17,3 4 669 21,9 3 988
Reinvested in the group 39,9 10 968 34,1 7 970 38,3 9 861 43,6 11 794 40,4 7 342
Wealth distribution 100,0 27 493 100,0 23 373 100,0 25 716 100,0 27 031 100,0 18 179
Employee statistics
Number of employees at year end 30 004 30 910 31 150 31 100 30 800
Rand Rand Rand Rand Rand
Turnover per employee 2 307 659 1 946 005 2 072 392 1 916 077 1 323 636
Value added per employee 905 213 746 231 818 266 860 772 581 948
Wealth created per employee 916 311 756 163 825 554 869 164 590 227

sasol limited group
monetary exchanges with governments
22 23
sasol limited
approval of the financial statements
The directors are required by the South African Companies Act
1973, to maintain adequate accounting records and are
responsible for the content and integrity of the consolidated
annual financial statements and related financial information
included in this report. It is their responsibility to ensure that the
annual financial statements fairly present the state of affairs of
the group and Sasol Limited (company) as at the end of the
financial year and the results of their operations and cash flows
for the financial year, in conformity with International Financial
Reporting Standards. The group’s external auditors are engaged
to express an independent opinion on the consolidated annual
financial statements.
The consolidated annual financial statements are prepared in
accordance with International Financial Reporting Standards
and incorporate disclosure in line with the accounting policies
of the group. The consolidated annual financial statements are
based upon appropriate accounting policies consistently
applied and supported by reasonable and prudent judgements
and estimates.
The directors acknowledge that they are ultimately responsible
for the system of internal financial control established by the
group and place considerable importance on maintaining a
strong control environment. To enable the directors to meet
these responsibilities, the board sets standards for internal
control aimed at reducing the risk of error or loss in a cost-
effective manner. The standards include the proper delegation
of responsibilities within a clearly defined framework, effective
accounting procedures and adequate segregation of duties to
ensure an acceptable level of risk. These controls are monitored
throughout the group and all employees are required to
maintain the highest ethical standards in ensuring the group’s
business is conducted in a manner that in all reasonable
circumstances is above reproach. The focus of risk management
in the group is on identifying, assessing, managing and
monitoring all known forms of risk across the group. While
operating risk cannot be fully eliminated, the group endeavours
to minimise it by ensuring that appropriate infrastructure,
controls, systems and ethical behaviour are applied and
managed within predetermined procedures and constraints.
The directors are of the opinion, based on the information and
explanations given by management, the internal auditors and
the external auditors, that the system of internal control
provides reasonable assurance that the financial records may be
relied on for the preparation of the consolidated annual
financial statements. However, any system of internal financial
control can provide only reasonable, and not absolute,
assurance against material misstatement or loss.
The directors have reviewed the group’s cash flow forecast for
the year to 30 June 2006 and, in light of this review and the
current financial position, they are satisfied that the group has
or has access to adequate resources to continue in operational
existence for the foreseeable future.
The consolidated annual financial statements, set out on pages
25 to 123, and Sasol Limited’s (company) annual financial
statements, set out on pages 124 to 131, which have been
prepared on the going concern basis, were approved by the
board of directors on 9 September 2005 and were signed on its
behalf by:
Paul Kruger Pieter Cox
9 September 2005
certificate of the company secretary
In my capacity as the company secretary, I hereby confirm, in terms of the South African Companies Act, 1973, that for the year ended
30 June 2005, Sasol Limited has lodged with the Registrar of Companies all such returns as are required of a public company in terms
of this Act, and that all such returns are, to the best of my knowledge and belief, true, correct and up to date.
Nereus Joubert
9 September 2005
2005 2004 2003 2002 2001
for the year ended 30 June Rm Rm Rm Rm Rm
Direct taxes 4 326 3 421 3 651 4 669 3 988
South African normal tax 3 211 2 834 3 080 4 262 3 599
foreign tax 736 257 198 87 178
Secondary Taxation on Companies 379 330 373 320 211
Employees’ tax 1 769 1 643 1 641 1 538 995
Indirect taxes 6 595 4 653 1 254 636 651
customs, excise and fuel duty* 7 424 4 866 1 450 733 786
property tax 65 66 62 64 15
RSC levies 110 97 89 70 66
net VAT received (1 153) (600) (392) (267) (247)
other 149 224 45 36 31
Net monetary exchanges
with governments 12 690 9 717 6 546 6 843 5 634
* During April 2003 fuel duty became payable by the supplier rather than the customer. This amount is recovered from customers.

sasol limited
report of the independent auditors
24 25
sasol limited
directors’ report (Company registration number 1979/003231/06)
The directors have pleasure in presenting their report for the
year ended 30 June 2005.
Nature of business Sasol Limited, the holding company of the group, is incorporated
and domiciled in the Republic of South Africa and was listed on
the JSE Limited on 31 October 1979 and on the New York Stock
Exchange on 9 April 2003.
Sasol is an integrated oil and gas company with substantial
chemical interests. In South Africa, we support these
operations by mining coal and converting it into synthetic
fuels and chemicals through proprietary
Fischer-Tropsch technology.
We also have chemical manufacturing and marketing
operations in Europe, Asia and the Americas. Our larger
chemical portfolios include polymers, solvents, surfactants
and their intermediates, waxes, phenolics and
nitrogenous products.
The group explores for, and produces, crude oil offshore
Gabon, refines crude oil into liquid fuels in South Africa and
retails liquid fuels and lubricants through a growing network of
retail service centres. During the first quarter of 2004, we
started extracting Mozambican natural gas, some of which we
having been using as feedstock for fuel and chemical
production in South Africa since mid 2004.
We are also developing in Qatar and Nigeria two joint-venture
gas-to-liquids plants based on our proprietary Sasol Slurry
Phase Distillate™ process.
The nature of the businesses of the significant operating
subsidiaries and incorporated joint ventures is set out on
pages 129 to 131.
Financial results Earnings attributable to shareholders of R9 573 million for
the year was 61% higher (2004 – 24% lower) than the
R5 940 million of the previous year. Basic attributable earnings
per share, after taking into account the share repurchase
programme, increased by 60% (2004 – decreased by 24%)
from 974 cents to 1 560 cents.
As described in the accounting policies, the group adopted a
number of new accounting standards. Certain of these standards
were adopted before they became mandatory for Sasol.
Sasol Italy SpA has a year end of 31 May and has been included
in the consolidated financial statements up to that date.
The different year end had no material effect on Sasol’s
consolidated financial statements.
Subsidiaries, joint ventures and associates
SubsidiariesOn 9 November 2004, Sasol Oil (Pty) Limited invested in
Namibian Liquid Fuel (Pty) Limited (NLF). The main purpose of
NLF is to supply various petroleum products into the Namibian
market. In terms of the agreement entered into between the
shareholders of NLF, for the 2005 financial year, Sasol
effectively controlled this entity and was entitled to 90% of
the income from this business. NLF has accordingly been
consolidated as a subsidiary for the 2005 financial year.
On 24 December 2004, the group sold its investments in two
South African captive insurance companies for R17 million,
which was equal to their carrying value.
On 1 March 2005, Sasol Wax International AG underwent a
restructuring. The result of the restructuring was the disposal
of its investment in Euro Schumann Sasol Wax GmbH, the
acquisition of 100% of the investment in Sasol Wax Danmark
APS and an acquisition of a direct 31,25% interest in Paramelt
RMC BV. Significant influence in this entity has been retained.
This was a non-cash, share-for-share exchange transaction.
Paramelt is reflected in the 2005 results as an equity accounted
associate and Sasol Wax Danmark is consolidated as a
subsidiary.
Joint ventureOn 24 September 2004, the group disposed of its investment in
Sasol Southwest Energy LLC for R20 million. Following
impairments recognised in the previous year, the final disposal
realised a profit of R28 million.
AssociateDuring the year, the group reclassified its investment in
FFS Refiners (Pty) Limited from an investment in associate to
an investment held-for-sale as it is anticipated that the disposal
of this entity will be completed within the next year.
Share capital
New shares issuedThe company’s authorised share capital remained unchanged
during the year. A further 5 605 700 shares were issued during
the year in terms of the Sasol Share Incentive Scheme.
Share repurchase programmeNo shares were repurchased during the year. The total
shareholding of Sasol Investment Company (Pty) Limited in
Sasol Limited remains 60 111 477 shares representing 8,9% of
Sasol Limited’s issued share capital. Shareholders’ equity has
been reduced by the cost of these shares. No dividends are paid
in respect of these shares outside the group. These shares are
classified as treasury shares.
To the members of Sasol LimitedWe have audited the group annual financial statements and
annual financial statements of Sasol Limited set out on pages
25 to 131 for the year ended 30 June 2005. These financial
statements are the responsibility of the directors. Our
responsibility is to express an opinion on these financial
statements based on our audit.
ScopeWe conducted our audit in accordance with International
Standards on Auditing. Those standards require that we plan and
perform the audit to obtain reasonable assurance that the
financial statements are free of material misstatement. An audit
includes examining, on a test basis, evidence supporting the
amounts and disclosures in the financial statements. An audit
also includes assessing the accounting principles used and
significant estimates made by management as well as evaluating
the overall financial statement presentation. We believe that our
audit provides a reasonable basis for our opinion.
Audit opinionIn our opinion, the financial statements fairly present, in all
material respects, the financial position of the group and of the
company at 30 June 2005, and the results of their operations
and cash flows for the year then ended in accordance with
International Financial Reporting Standards and in the manner
required by the Companies Act in South Africa.
KPMG Inc.
Registered accountants and auditors
Chartered Accountants (SA)
Johannesburg
9 September 2005

sasol limited
directors’ report continued
26 27
Shares held in reserveThe 464 327 175 authorised but unissued ordinary shares of the
company continue to be held in reserve.
Note 37 provides further details regarding the share capital of
Sasol Limited.
American depositary shares At 30 June 2005, the company had in issue through The Bank of
New York as Depositary, and listed on the New York Stock
Exchange 35 855 101 (2004 – 34 942 945) American Depositary
Shares (ADS). Each ADS represents one ordinary share.
Sasol Share Incentive Scheme In terms of the Sasol Share Incentive Scheme 33 795 700 shares
(2004 – 39 401 400 shares) are under the control of the
directors for purposes of enabling Sasol Limited to allot shares
and to grant options in respect of shares to present and future
employees, including executive directors of Sasol Limited, its
subsidiaries and joint ventures. Note 38 provides further details
regarding the Sasol Share Incentive Scheme.
Dividends An interim dividend of 230 cents per share (2004 – 215 cents
per share) was paid on 11 April 2005. A final dividend in
respect of the year ended 30 June 2005 of 310 cents per share
(2004 – 235 cents per share) was declared on 12 September
2005. As the final dividend was declared subsequent to the
financial year end, in terms of IFRS, no provision has been
recognised in the consolidated annual financial statements in
respect of this final dividend.
The total dividend for the year amounted to 540 cents per share
(2004 – 450 cents per share).
The estimated total cash flow of the final dividend of 310 cents
per share, payable on 17 October 2005, is R1 912 million
(2004 – 235 cents per share – R1 440 million).
The board of directors is satisfied that the capital remaining after
payment of the final dividend is sufficient to support the current
operations and to facilitate future development of the business.
Property, plant and equipment Capital expenditure incurred during the year amounted to
R12 414 million (2004 – R10 888 million).
Capital expenditure authorised less expenditure incurred to
30 June 2005 amounted to R18 889 million (2004 – R24 691 million).
Further details of capital acquisitions and future projects are
provided in the chief financial officer’s review on pages 9 and 10
in the notes to the consolidated annual financial statements.
Directors Mr SB Pfeiffer resigned with effect from 31 October 2004.
Mr JH Fourie resigned with effect from 1 January 2005.
Mr PV Cox resigned as chief executive with effect from
30 June 2005.
Ms IN Mkhize was appointed to the board as a non-executive
director, with effect from 1 January 2005.
Messrs LPA Davies and TS Munday were appointed chief
executive and deputy chief executive respectively with effect
from 1 July 2005.
Ms VN Fakude was appointed to the board as an executive
director with effect from 1 October 2005.
The composition of the board of directors is given on
pages 72 and 73 of the annual review. The remuneration of
Sasol Limited’s directors is set out on pages 28 to 33.
AuditorsKPMG Inc. continued in office as auditors of Sasol Limited and
its subsidiaries. At the annual general meeting of 29 November
2005, shareholders will be requested to appoint KPMG Inc.
auditors of Sasol Limited for the 2006 financial year.
Post-balance sheet events In May 2005, the South African Competition Commission
conditionally recommended the approval of the proposed
joint venture between Sasol Limited and Petroliam Nasional
Berhad of their respective liquid fuels businesses, Sasol Oil
(Pty) Limited and Engen Limited, to be called Uhambo Oil
Limited, to the Competition Tribunal. Public hearings are
scheduled for October 2005 whereafter the Competition
Tribunal will give its ruling.
On 1 July 2005, a 25% interest in Republic of Mozambique
Pipeline Investments Company (Pty) Limited was sold to
iGas (Pty) Limited (owned by the South African Government)
for R609 million realising a profit of R189 million.
On 1 August 2005, Sasol announced that it is considering
the divestment from its Olefins & Surfactants business
including its Safol plant but excluding its comonomers
activities in South Africa. The potential divestment is subject
to an acceptable selling price being attained.
Secretary The company secretary of Sasol Limited is Dr NL Joubert.
His business and postal addresses appear on page 132.
Special resolutionsThe following special resolutions were registered during the year
Resolution
Sasol Limited17 December 2004 Authorised the directors to approve the purchase of a maximum of 10% of Sasol Limited’s shares by the
company or any of its subsidiaries, subject to the provisions of the South African Companies Act and the rulesand requirements of the JSE Limited.
Subsidiaries In order to give effect to the funding structure of the Sasol group without possible infringement of theborrowing powers of the group’s subsidiaries, the Articles of Association of certain of the group’s subsidiarieswere amended by inclusion of the following paragraph
“For purposes of determining the borrowing powers, long-term interest free loans with no fixed repayment termsfrom the company’s holding company or any wholly owned subsidiary of Sasol Limited will not be deemed to formpart of debt but will be deemed to be equity.”
The subsidiaries whose articles were amended were
• Sasol Mining (Pty) Limited
• Sasol Chemical Industries Limited
• Sasol Oil (Pty) Limited
• Sasol Petroleum International (Pty) Limited
Republic of Mozambique Pipeline Investments Company (Pty) Limited10 January 2005 Amended the articles of association to reflect the main business and object of the company and to amend
the share structure to enable the implementation of the options held by the Mozambican and South Africangovernments to acquire an interest in the company.

The approved cash salary and the annual performance bonus of
the executive directors’ remuneration are determined and paid
on the assessment that up to 25% of their time is related to
services rendered offshore as defined in terms of a separate
employment agreement with Sasol Holdings (Netherlands) BV,
which is reviewed and approved annually.
Fixed remuneration
The executive directors’ fixed remuneration was reviewed by the
compensation committee at its meeting in September 2004.
Following its established practice, the salaries were compared
with the upper-quartile pay levels of South African companies
to ensure sustainable performance and market
competitiveness. Reference is also made to the scope and
nature of an individual’s role and his or her performance and
experience. The intended market position is upper-quartile
remuneration for superior performance.
In addition to a cash salary, executives receive benefits that
include membership of the group’s medical health care scheme
and a choice of a comprehensive vehicle allowance or a
company car benefit. Retirement and risk benefits, including life
cover and death in-service benefits, also apply, subject to the
rules of the Sasol pension fund.
During the year, contributions calculated as a percentage of the
basic cash salary were paid to contributory retirement schemes
established and/or approved by the group and subject to the
rules of the scheme. The rate of contribution for each executive
director is structured to enable the executive director to retire at
the age of 60 years.
At the compensation committee meeting held on 3 June 2005,
the remuneration of the newly appointed chief executive and
deputy chief executive was determined and it was approved to
adjust the cash component of their remuneration packages on
promotion, with effect from 1 July 2005, by 40% and 30%
respectively.
Annual performance bonus
In addition to salary and benefits, each executive director and
member of group management participates in an annual cash
bonus plan to reward the achievement of agreed group
financial, business unit financial (where applicable), business
unit strategic and personal performance objectives.
The approved principles for the executive performance bonus
scheme for the year 1 July 2004 to 30 June 2005 were based on
group, individual, business and personal criteria/metrics. The
group financial performance target relates to earnings-per-
sasol limited
directors’ remuneration report
28 29
The compensation committee During the financial year ended 30 June 2005, the
compensation committee had five members, all of whom are
independent non-executive directors: Messrs P du P Kruger
(chairman), WAM Clewlow, S Montsi, BP Connellan and
Ms E le R Bradley. The chief executive is invited to all
committee meetings, but excuses himself when his own
remuneration is discussed.
With effect from 1 January 2006, Mr P du P Kruger will
be standing down as chairman and Mr PV Cox will
become chairman.
This committee has operated since 1989 under the delegated
authority of the Sasol Limited board of directors (board) to
support and advise on the group’s remuneration philosophy and
policy. The committee sets the remuneration and incentive
plans, as well as all grants and awards under the company’s
share incentive plan, for executive directors, members of the
group executive committee and group management in
accordance with its terms of reference approved by the board.
The compensation committee’s other responsibilities include:
• reviewing and approving principles on which short-term
incentives for all staff are based;
• approving the granting of share incentives to staff; and
• approving the overall cost of remuneration increases awarded
to staff.
The committee considers the views of the chief executive on
the remuneration and the performance of his colleagues. The
company secretary, the human resources group manager and
the manager responsible for group rewards and benefits assist
the committee with analysis of market information and trends.
In applying agreed remuneration principles, the compensation
committee is committed to reward behaviour that supports the
business strategy.
Group remuneration philosophy Recognising that the Sasol group is operating in a global
environment, the Sasol remuneration philosophy is founded
on four main principles:
• playing an integral part in supporting the implementation of
global Sasol business strategies;
• motivating and reinforcing individual and team performance;
• integrating financial and non-financial rewards and benefits;
and
• being equitably, fairly and consistently applied in relation
to job responsibility, the employment market and
personal performance.
Sasol’s application of remuneration practices in all businesses
and functions in South Africa and internationally are aligned to
four main guiding principles:
• aiming to be market competitive in specific labour markets in
which people are employed;
• determining the value proposition of the various positions
within job families or functions;
• ensuring that performance management forms an integral
part of remuneration, thereby influencing the remuneration
components of base pay and incentives; and
• applying good governance to remuneration practices within
approved structures.
The alignment of these remuneration principles aims to meet
the strategic objectives of:
• attracting, retaining and motivating key and talented people;
• competing in the marketplace with the intention of being a
preferred employer;
• rewarding individual, team and business performance, and
encouraging superior performance; and
• supporting Sasol’s six core values.
Policy on directors’ fees and remunerationThe directors are appointed to the board to bring the
competencies and experience appropriate to achieving the
group’s objectives as a global business. The purpose of
remuneration is to ensure that executive directors and senior
managers receive remuneration that is appropriate to their
scope of responsibility and contribution to the group’s
operating and financial performance, taking into account
industry norms, and external market and country benchmarks.
In applying its remuneration principles, the compensation
committee aims to encourage long-term performance and, at
all times, to align such performance with the strategic direction
and specific value-drivers of the business.
Executive directors’ remunerationThe current employment agreements of executive directors
outline the components of their remuneration. At present,
remuneration is divided into two components: a fixed
component and an at-risk component comprising an annual
performance bonus and long-term incentives in the form of the
current Sasol group share incentive scheme, ensuring that a
substantial portion of their package is linked to the
achievement of improved group business performance.
share growth compared with inflation. The weighting dedicated
to improved group business results varies from 50% for group
executive members, 60% for executive directors and 70%
for the chief executive. The balance of weightings is aimed
at incentivising meeting group strategic business and
personal objectives.
Performance criteria (or metrics) in the group may vary depending
on business-specific strategic value drivers and personal objectives
as agreed by the boards. Divisional financial targets measure mainly
operating profit improvements and fixed cash cost savings, while
value drivers derived from group business objectives include targets
agreed for safety and employment equity (for businesses based in
South Africa).
At its meeting of 3 September 2004, the compensation
committee agreed that for the year under review, the chief
executive may earn a bonus up to 80% of his fixed
remuneration and the other executive directors may earn
bonuses of up to 60% of their fixed remuneration for the year.
At its meeting on 9 September 2005, the compensation
committee received an overall assessment of the performance
of the executives participating in the incentive plan against the
agreed targets.
Following its review of the newly appointed chief executive and
deputy chief executive’s remuneration packages at its meeting
on 3 June 2005, the compensation committee agreed that the
chief executive may, with effect from 1 July 2005, earn a bonus
of up to 100% of fixed remuneration (previously 80%) and the
deputy chief executive up to 80% in line with market indicators.
The remuneration packages of the executive directors with
effect from 1 October were approved by the board at its
meeting of 9 September 2005.
During the year, the group incentive schemes were reviewed to
ensure that focused group business drivers will be applied on a
common basis for the financial year commencing 1 July 2005.
At its meeting on 9 September 2005, the committee considered
and approved a matrix of performance factors for senior
management. Employment equity, for South African businesses
and safety were given a higher weighting factor to emphasise
the importance of these issues into the future.
Non-executive directors’ feesThe current fees of non-executive directors were approved by
the shareholders at the annual general meeting of members
(AGM) of 26 November 2004. Fees are approved for an annual
period commencing on 1 July each year. The revised fees of the
non-executive directors will be submitted to the shareholders for
approval at the next AGM on 29 November 2005.

Directors’ service contractsThere are no fixed-term service contracts for executive or
non-executive directors. Executive directors have standard
employee service agreements with notice periods ranging
between 30 days and 90 days.
An executive director is required to retire from the board at the
age of 60, unless requested by the board to extend his or her
term. A non-executive director is required to retire at the end of
the year in which the director turns 70, unless the board, subject
to the articles of association and by unanimous resolution on a
year-to-year basis, extends the director’s term of office until the
end of the year in which he or she turns 73.
Directors’ share optionsExecutive directors
Directors participate in the Sasol share incentive scheme, which
is designed to recognise the contributions of senior staff to the
growth in the value of the group’s financial position and
performance and to retain key employees. Within the limits
imposed by the company’s shareholders and the JSE Limited
(formerly the JSE Securities Exchange, South Africa) options are
allocated to the directors and senior staff in proportion to their
contribution to the business as reflected by their seniority and
the group’s performance.
The options, which are allocated at the closing market price
ruling on the trading day immediately preceding the granting of
the option, vest after stipulated periods and are exercisable up
to a maximum of nine years from the date of allocation.
Options are granted for a period of nine years and vest as follows:
• two years – first third
• four years – second third
• six years – final third
In terms of the Sasol share incentive scheme, 60 million
shares (2004: 60 million shares) are under the control of
the directors for purposes of enabling Sasol Limited to allot
shares and to grant options for shares to current and future
Sasol Limited employees.
sasol limited
directors’ remuneration report continued
30 31
Annual directors’ fees for the period July 2004 to June 2005 are as follows
EmolumentsDirector Chairman
Board/Committee meeting Rand Rand
Sasol Limited board South African director 231 000 462 000Non-resident director US$79 500
Audit committee 115 500 231 000Compensation committee 69 000 138 000Risk & safety, health and environment committee 69 000 138 000Nomination and governance committee 69 000 138 000Subsidiary or divisional boards 115 500 231 000
The chairman of a board or a board committee is paid double the rate of a member. The deputy chairman of a board is paid one-and-
a-half times the rate of a member. Executive directors do not receive directors’ fees.
Directors’ remuneration for the year, excluding benefits resulting from share options, are as follows
Annual Retirement Other Total TotalSalary incentive* funding benefits 2005 2004
Executive directors R’000 R’000 R’000 R’000 R’000 R’000
PV Cox (CE and deputy chairman) 4 411 2 128 157 2 5311 9 227 5 031LPA Davies 2 975 851 536 2782 4 640 3 749JH Fourie9 – 743 – –2 743 3 045TS Munday 2 714 792 538 2723 4 316 3 452
Total 10 100 4 514 1 231 3 081 18 926 15 277
* Refers to incentives awarded, based on the company results for the 2004 financial year.1 The amount for Mr Cox includes travel benefits (R335 438), medical benefits (R19 300), leave encashment on retirement (R1 407 654) and cash in lieu of retirement
funding in compliance to retirement fund rules not allowing contributions after age 60 (R762 326). The amount also includes fringe benefits for vehicle insurance (R2 620), a security benefit (R3 300) and a benefit in terms of the company’s employees share savings scheme (R672).
2 The amount for Mr Davies includes vehicle benefits (R248 783) and medical benefits (R19 899), fringe benefits for vehicle insurance (R2 620), a security benefit (R3 300), and a benefit in terms of the company’s employee share savings scheme (R672).
3 The amount for Mr Munday includes vehicle benefits (R248 783), medical benefits (R20 555) and fringe benefits for vehicle insurance (R2 620).
Board Paid by Committee Total Totalmeeting fees subsidiaries fees 2005 2004
Non-executive directors R’000 R’000 R’000 R’000 R’000
P du P Kruger (chairman) 462 2 4561 345 3 263 3 014E le R Bradley 231 – 138 369 344WAM Clewlow2 231 – 282 513 559BP Connellan3 231 – 311 542 451MSV Gantsho4 231 – 69 300 279A Jain5 495 – – 495 487S Montsi6 231 – 195 426 279SB Pfeiffer7 170 – 12 182 487JE Schrempp5 509 – – 509 512IN Mkhize8 116 – 23 139 –CB Strauss 231 – 185 416 387JH Fourie9 116 346 – 462 312
Total 3 254 2 802 1 560 7 616 7 111
1 Inclusive of fringe benefits amounting to R30 808 (travel, insurance and security).2 Resigned as chairman from the audit committee with effect from 6 September 2004.3 Resigned as chairman of the risk & SHE committee and appointed as chairman of the audit committee with effect from 6 September 2004; appointed as member of the
compensation committee with effect from 1 March 2005.4 Resigned from the risk & SHE committee, and requested by the board to attend the audit committee meetings with effect from 6 September 2004.5 Fees paid in US dollars. Rand equivalent of US$79 500 at actual exchange rates.6 Appointed as chairman of the risk & SHE committee with effect from 6 September 2004; appointed as member of the compensation committee with effect from 1 March 2005.7 Fees paid in US dollars amount to US$26 500; resigned with effect from 31 October 2004; appointed to the risk & SHE committee with effect from 6 September 2004
and resigned at the end of October 2004.8 Appointed as non-executive director with effect from 1 January 2005; appointed as member of the risk & SHE committee with effect from 1 March 2005.9 Resigned as a non-executive director of Sasol Limited with effect from 1 January 2005.
The trustees of the Sasol share trust grant share options
as follows:
• When an employee is promoted or appointed to the eligibility
level of share options. In the case of new appointments,
within this category and according to established practice,
options are granted six months after appointment and are
based on satisfactory performance.
• Supplementary share option grants are normally granted
annually, in terms of formulae as approved by the
compensation committee.
• The granting of supplementary share options is considered
annually by the committee and approved by the trustees of
the Sasol share trust.
• The number of shares offered in the form of share option
grants is determined in accordance with the following
formulae:
– the number of shares offered for promotions is based
on a multiple of total annual cash salary divided by the
moving average share price over 24 months, prior to the
grant; and
– the number of supplementary shares offered is based on
an individual rating factor and meeting the company’s
performance growth targets in attributable profit
compared with the South African consumer price index
(CPI). The individual’s performance is based on an
assessment of the participants’ annually agreed
performance targets aiming to reward performance
exceeding expectations, while not rewarding substandard
performance. The company performance factor is
determined when the company’s profit growth exceeds
the current inflation, thereby ensuring that executives are
rewarded for achieving real growth in earnings when
tested against SA inflation.
Non-executive directorsNon-executive directors received a once-off allocation of share
options in 2000. The non-executive directors at the time were
granted 25 000 shares each, 12 500 vesting after two years and
12 500 vesting after four years from the date of the grant.

sasol limited
directors’ remuneration report continued
Share options granted
Share options granted
Balance at On Average rand Share
beginning 9 September price per share options Balance at
(number) of year 2004 (Rand) implemented Resignations end of year
Executive directors
PV Cox 561 400 84 200 111,20 (71 400) – 574 200
LPA Davies 295 400 39 700 111,20 (30 800) – 304 300
TS Munday 266 100 36 200 111,20 (26 200) – 276 100
Non-executive directors
P du P Kruger 12 500 – (12 500) – –
E le R Bradley 12 500 – (12 500) – –
WAM Clewlow 25 000 – – – 25 000
BP Connellan 25 000 – (25 000) – –
JH Fourie1 177 900 – (139 200) (38 700) –
S Montsi 25 000 – – – 25 000
JE Schrempp 25 000 – (25 000) – –
CB Strauss 25 000 – (25 000) – –
Total 1 450 800 160 100 (367 600) (38 700) 1 204 600
1 Resigned as a director with effect from 1 January 2005. The options indicated were granted to Mr JH Fourie when he was still an executive director.
Share options implemented
Rand Market Gain on implementation
Number of price per price per of share options
Implementation share options share option share option 2005 2004
dates implemented (Rand) (Rand) R’000 R’000
Executive directors
PV Cox 6 430 5 081
5 November 2004 40 400 25,10 122,65 3 941
5 November 2004 31 000 42,30 122,60 2 489
LPA Davies 2 717 1 392
3 November 2004 17 200 25,10 121,17 1 652
3 November 2004 13 600 42,30 120,58 1 065
TS Munday 29 March 2005 26 200 50,90 143,00 2 413 –
Non-executive directors
P du P Kruger 10 March 2005 12 500 53,80 147,10 1 166 –
E le R Bradley 29 November 2004 12 500 53,80 115,10 766 –
BP Connellan 7 April 2005 25 000 53,80 159,38 2 640 –
JH Fourie 12 618 –
22 December 2004 29 300 25,10 118,50 2 737
17 March 2005 26 500 42,30 154,50 2 973
17 March 2005 31 500 54,00 154,50 3 166
13 April 2005 51 900 78,70 150,80 3 742
JE Schrempp 29 November 2004 25 000 53,80 113,98 1 505 –
CB Strauss 10 March 2005 25 000 53,80 147,10 2 333 –
Total 367 600 32 588 6 473
The options outstanding at the end of the year vest during the following periods
Already Within 1 to 2 2 to 5 More than(number) vested 1 year years years 5 years Total
Executive directorsPV Cox 138 300 107 600 145 400 154 900 28 000 574 200LPA Davies 98 900 62 100 61 300 68 700 13 300 304 300TS Munday 112 800 58 100 50 200 43 000 12 000 276 100
Non-executive directorsWAM Clewlow 25 000 – – – – 25 000S Montsi 25 000 – – – – 25 000
Total 400 000 227 800 256 900 266 600 53 300 1 204 600
Beneficial shareholdingThe aggregate beneficial shareholding at 30 June 2005 of the directors of the company and their immediate families (none of which
has a holding greater than 1%) in the issued shares of the company are detailed below. There have been no material changes in these
shareholdings since that date.
At 30 June 2005, Messrs Gantsho, Jain, Munday, Montsi, Ms Mkhize and Prof Schrempp and their immediate families held no
beneficial shares in Sasol Limited.
Beneficial shareholding 2005 2004Number of Number of
shares shares
Executive directorsPV Cox 59 772 47 649LPA Davies 194 165
Non-executive directorsP du P Kruger 231 700 219 200E le R Bradley 298 000 285 500WAM Clewlow 13 195 13 195BP Connellan 10 500 1 000JH Fourie – 57 740CB Strauss 45 250 20 100
Total 658 611 644 549
Interest of directors in contractsThe directors have certified that they did not have a material interest in any transaction of any significance with the company or any of
its subsidiaries or joint ventures. Accordingly, no conflict of interest with regard to directors’ interests in contracts exists. There have
been no material changes since 30 June 2005 up to the date of this report. In accordance with the requirements of the South African
Companies Act, Sasol Limited maintains a register of directors’ interests in contracts.
Succession planning and leadership developmentThe Sasol board places considerable emphasis on succession planning at the executive and senior management level. Detailed and intensive
planning is conducted through the chairman’s office in consultation with the nomination and governance committee. The chief executive is
required by law to regularly report to the board on the group’s management development and employment equity programmes.
During the year, the company embarked on a comprehensive and focused succession management and career development process
for Sasol’s senior leadership. A profile of each senior executive will be compiled, based on a combination of structured discussions
around past, current and future experience and exposure.
This focused succession management process forms part of the group’s larger talent management drive and supports the link
between the long-term company strategy, the 10-year capital plan and the 10-year people plan. Talent management is an integrated
process throughout the organisation. Further optimisation and design to enhance the efficiency will continue.
32 33
General accounting terms
Acquisition date The date on which control in respect of subsidiaries, joint control in respect of joint ventures and significant
of a business influence in respect of associates commences.
Commissioning date The date that an item of property, plant and equipment, whether acquired or constructed, is brought into use.
Consolidated The financial results of the group which comprise the financial results of Sasol Limited and its subsidiaries,
financial statements the group’s proportionate interest in the financial results of joint ventures and its interest in associates.
Construction A contract specifically negotiated with a third party for the construction of an asset or a combination of
contract assets that are closely interrelated or interdependent in terms of their design, technology and function or
their ultimate purpose or use.
Control The ability, directly or indirectly, to govern the financial and operating policies of an entity so as to obtain
economic benefit from its activities. When assessing the ability to control an entity, the existence and effect
of potential voting rights that are presently exercisable or convertible are taken into account.
Discontinued An operation that, pursuant to a single plan, has been disposed of or abandoned or is classified as
operation held-for-sale.
Discount rate The rate used for purposes of determining discounted cash flows defined as the yield at balance sheet date on
AAA credit rated bonds (for entities outside South Africa) and relevant South African Government bonds
(for South African entities) that have maturity dates approximating the term of the related cash flows. This
pre-tax interest rate reflects the current market assessment of the time value of money. When determining
the cash flows, to the extent that the risks specific to the asset or liability are taken into account in
determining those cash flows, they are not included in determining the discount rate.
Disposal date The date on which control in respect of subsidiaries, joint control in respect of joint ventures and significant
of a business influence in respect of associates ceases.
Fair value The value for which an asset could be exchanged or a liability settled in a market related transaction.
Financial results Comprise the financial position (assets, liabilities and equity), results of operations (revenue and expenses)
and cash flows of the group or any entity within the group.
Held-for-sale item A non-current asset, group of assets or operation is designated as held-for-sale when its carrying amount will
be recovered principally through a sale transaction rather than through continuing use.
Long-term A period longer than twelve months from balance sheet date.
Measurement The currency that best reflects the economic substance of the underlying events and circumstances
currency relevant to an entity.
Qualifying asset An asset that necessarily takes a substantial period (normally in excess of twelve months) of time to get ready
for its intended use.
Recoverable amount The amount that reflects the greater of the net selling price and value in use that can be attributed to an asset
as a result of its ongoing use by the entity. In determining the value in use, expected pre-tax future cash flows
are discounted to their present values using the discount rate.
Related party Parties are considered to be related if one party has the ability to control the other party or exercise
significant influence over the other party in making financial and operating decisions.
Revenue Comprises turnover, dividends received and interest received.
Significant influence The ability, directly or indirectly, to participate in, but not exercise control over, the financial and operating
policy decisions of an entity so as to obtain economic benefit from its activities.
Turnover Comprises revenue generated by operating activities and includes sales of products, services rendered, licence
fees and royalties excluding value-added tax, fuel and excise duty and levies.
34 35
sasol limited group
accounting policies and glossary of financial reporting terms
Sasol Limited is the holding company of the Sasol group (the group) and is domiciled in the Republic of South Africa. The following
principal accounting policies were applied by the group for the financial year ended 30 June 2005. Except as otherwise disclosed,
these policies are consistent in all material respects with those applied in previous years.
Glossary of financial reporting terms
This glossary of financial reporting terms is provided to ensure clarity of meaning as certain terms may not always have the same
meaning or interpretation in other countries.
Group structures
Associate An entity, other than a subsidiary or joint venture, in which the group has significant influence over financial
and operating policies.
Company A legal business entity registered in terms of the applicable legislation of that country.
Entity Sasol Limited, a subsidiary, joint venture or associate.
Foreign entity An entity domiciled outside the Republic of South Africa whose activities are not an integral part or extension
of the group’s main South African operations.
Group The group comprises Sasol Limited, its subsidiaries and its interest in joint ventures and associates.
Integrated foreign An entity domiciled outside the Republic of South Africa whose activities are an integral part or extension
operation of the group’s main South African operations.
Joint venture An entity over which the group exercises joint control established under a contractual arrangement.
Operation A component of the group:
• that represents a separate major line of business or geographical area of operation; and
• can be distinguished separately for financial and operating purposes.
Business unit A distinguishable component of the group engaged in providing similar goods or services that are different to
those provided by other business units. The primary strategic business units are:
• Sasol Mining; • Sasol Olefins & Surfactants;
• Sasol Synfuels; • Sasol Polymers;
• Sasol Liquid Fuels Business; • Sasol Solvents; and
• Sasol Gas; • Sasol Synfuels International.
Classified as ‘Other businesses’ in the segment report:
• Sasol Technology; • Sasol Nitro;
• Sasol Petroleum International; • Merisol;
• Sasol Infrachem; • Sasol Financing; and
• Sasol Wax; • Corporate head office functions.
Subsidiary Any entity over which the group has the power to exercise control.

Inter-company transactions, balances and unrealised gains andlosses between entities are eliminated on consolidation. To theextent that a loss on a transaction provides evidence of areduction in the net realisable value of current assets or animpairment loss of a non-current asset, that loss is recognised inthe income statement.
In respect of joint ventures and associates, unrealised gains andlosses are eliminated to the extent of the group’s interest inthese entities. Unrealised gains and losses arising fromtransactions with associates are eliminated against theinvestment in the associate.
Subsidiaries The financial results of subsidiaries areconsolidated into the group’s results from the acquisition dateuntil the disposal date. Minority interest at the acquisitiondate is determined as the minority shareholders’ proportionateshare of the fair value of the net assets of subsidiaries acquired.
Joint ventures The financial results of joint ventures areproportionately consolidated into the group’s results fromthe acquisition date until the disposal date.
Associates The financial results of associates are included inthe group’s results according to the equity method from theacquisition date until the disposal date.
Under this method, subsequent to the acquisition date, thegroup’s share of profits or losses of associates is recognised inthe income statement as equity accounted earnings and itsshare of movements in equity reserves is recognised in thechanges in equity statement. All cumulative post-acquisitionmovements in the equity of associates are adjusted against thecost of the investment.
Goodwill relating to associates is included in the carrying valueof those associates. Any impairment of goodwill relating toassociates is recognised in the income statement as part ofequity accounted earnings of those associates.
If impaired, the carrying value of the group’s share of theunderlying assets of associates is written down to its estimatedrecoverable amount in accordance with the accounting policyon impairment.
Associates whose financial year ends on a date other than30 June are included in the consolidated financial statementsusing their most recently audited financial results. Adjustmentsare made to the associates’ financial results for materialtransactions and events between the group and the associatesin the intervening period. When the group’s share of losses inassociates equals or exceeds its interest in those associates, thegroup does not recognise further losses, unless the group has acontractual obligation in respect of those associates.
3 Measurement currency and foreign currencytranslations
Measurement currency The financial results of an entity areaccounted for in its measurement currency. The consolidatedfinancial statements are presented in rand.
sasol limited group
accounting policies and glossary of financial reporting termscontinued
36 37
Statement of compliance The consolidated financial statements are prepared incompliance with International Financial Reporting Standards(IFRS) and Interpretations of those standards, as adopted by theInternational Accounting Standards Board and applicablelegislation. During the current financial year, the followingaccounting standards were adopted before the mandatory dateof adoption for Sasol:
IFRS5 Non-current assets held for sale and discontinuedoperations;
IAS1 Presentation of financial statements;
IAS2 Inventories;
IAS8 Accounting policies, changes in accounting estimatesand errors;
IAS10 Events after the balance sheet date;
IAS16 Property, plant and equipment;
IAS17 Leases;
IAS27 Consolidated and separate financial statements;
IAS28 Investments in associates;
IAS31 Interests in joint ventures; and
IAS33 Earnings per share.
The following accounting standards, which are not yetmandatory for Sasol, have not been adopted in the current year:
IFRS2 Share based payment;
IFRS4 Insurance contracts;
IFRS6 Exploration for and evaluation of mineral resources;
IAS21 The effects of changes in foreign exchange rates;
IAS24 Related party disclosures;
IAS32 Financial instruments: disclosure and presentation; and
IAS39 Financial instruments: recognition and measurement.
Principal accounting policies1 Basis of preparation of financial results The consolidated financial statements are prepared using thehistoric cost convention except for specific financial instrumentsas described on pages 115 to 123, which are stated at fair value.
The consolidated financial statements are prepared on thegoing concern basis.
Except as otherwise disclosed, these accounting policies areconsistent with those applied in previous years.
These accounting policies are consistently applied throughoutthe group.
2 Basis of consolidation of financial results The consolidated financial statements reflect the financialresults of the group. All financial results are consolidated withsimilar items on a line by line basis except for investments in associates, which are included in the group’s results as set out below.
Financial instrument terms
Available-for-sale A financial asset, excluding a loan or receivable issued by an originating entity, an investment acquired
financial asset for trading purposes, a held-to-maturity investment and a derivative instrument.
An investment intended to be held for an indefinite period of time, which may be sold in response to needs for
liquidity or changes in interest rates, is classified as a non-current available-for-sale financial asset.
Cash and cash Comprise cash on hand, demand deposits and other short-term highly liquid investments.
equivalents
Cash flow hedge A hedge of the exposure to variability in cash flows, that is attributable to a particular risk associated with a
recognised asset or liability or a forecasted transaction, and that will affect the income statement.
Derivative instrument A financial instrument
• whose value changes in response to movements in a specified interest rate, commodity price, foreign
exchange rate or similar variable;
• that requires minimal initial net investment; and
• whose terms require or permit net settlement at a future date.
Effective interest rate The rate that discounts the expected future cash flows to the current net carrying amount of the financial
asset or financial liability.
Equity instrument Any financial instrument (including investments) that evidences a residual interest in the assets of an
enterprise after deducting all of its liabilities.
Financial asset Cash or cash equivalents, a right to receive cash or cash equivalents, an equity instrument or a right to
exchange a financial instrument under favourable conditions.
Financial liability A contractual obligation to pay cash or transfer other benefits or an obligation to exchange a financial
instrument under unfavourable conditions.
Monetary asset An asset which will be settled in a fixed or easily determinable amount of money.
Monetary liability A liability which will be settled in a fixed or easily determinable amount of money.
Trading investment An investment acquired principally for the purpose of generating short-term economic benefits through
trading activities.
Held-to- An investment, with a fixed maturity and fixed or determinable future payments, that management has
maturity investment the positive intent and ability to hold to maturity. The investment is classified as a non-current asset, except
when it has a maturity within twelve months from the balance sheet date, in which case it is classified as a
current asset.
Transaction date The date an entity commits itself to purchase or sell a financial instrument.
sasol limited group
accounting policies and glossary of financial reporting termscontinued
38 39
Oil and gas reserves are classified as proven when reasonablecertainty exists with regard to the economic recoverability thereofbased on marketing arrangements and the development thereofunder current economic and operating conditions.
Exploratory wells that discover potentially proven reserves remaincapitalised pending decisions on capital expenditure, or whenadditional exploratory drilling is under way or firmly planned inthe near future or when substantial progress towards obtainingregulatory approval for the development has been made.Progress in this regard is reassessed at least annually to ensureprogress is sufficient to justify carrying the cost as an asset. In allother cases, exploratory wells not meeting the criteria for provenreserves within one year of well completion are recognised in theincome statement.
Costs incurred to drill and equip development wells on provedproperties are capitalised.
Amortisation of capitalised exploration and development is basedon the units-of-production method, on a field-by-field basis,calculated using estimated proved developed oil and gas reserves.
Mining exploration
Mining exploration costs are recognised in the income statementuntil completion of a final feasibility study supporting proven andprobable reserves. Expenditure incurred subsequent to provenand probable reserves being identified is capitalised.
Expenditure on producing mines or development properties iscapitalised only when excavation or drilling is incurred to extendreserves or further delineate existing proven and probable reserves.
6 Business combinations (goodwill) The purchase method is used when an entity is acquired.On acquisition date, fair values are attributed to the identifiableassets and liabilities.
Fair values of the identifiable assets and liabilities aredetermined by reference to market values of those or similaritems, where available, or by discounting expected future cashflows using the discount rate to present values.
The cost of acquisition is the fair value of the group’scontribution in the form of assets transferred, shares issued orliabilities assumed at the acquisition date plus costs directlyattributable to the acquisition.
On acquisition date, goodwill is recognised when the cost of theacquisition exceeds the fair value of the group’s interest in the netidentifiable assets of the entity acquired. Up to 30 June 2004,goodwill is stated at cost less accumulated amortisation andimpairment. With effect from 1 July 2005, goodwill is not amortisedbut subjected to an annual impairment test. Accumulatedamortisation written off in previous years is not reversed.
The profit or loss realised on disposal or termination of an entityis calculated after taking into account the carrying value of anyrelated goodwill.
To the extent that the fair value of the net identifiable assets ofthe entity acquired exceeds the cost of acquisition, the excess isrecognised in the income statement on acquisition date.
Any pre-existing negative goodwill at 30 June 2004 waswritten off against opening accumulated profit in the changesin equity statement.
7 Long-term debt and equity investments The group classifies its investments in debt and equity securitiesinto the following categories:
• trading;
• held-to-maturity; and
• available-for-sale.
The classification is dependent on the purpose for which theinvestment is acquired. Management determines theclassification of its investments at the time of the purchase andre-evaluates such designation at least biannually.
Investments are stated initially on transaction date at costincluding transaction costs. Trading and available-for-saleinvestments are subsequently carried at fair value. Held-to-maturity investments are carried at amortised cost using theeffective interest rate method.
The fair values of investments are based on quoted bid prices oramounts derived using a discounted cash flow model. Fairvalues for unlisted equity securities are estimated usingmethods reflecting the specific economic circumstances of theinvestee. Equity securities for which fair values cannot bemeasured reliably are recognised at cost less impairment.
Gains and losses arising from revaluation of trading investmentsare recognised in the income statement. Unrealised gains andlosses arising from revaluation of available-for-sale investmentsare recognised in the changes in equity statement as aninvestment fair value reserve. On disposal or impairment of anavailable-for-sale investment, cumulative unrealised gains andlosses previously recognised in the changes in equity statementare included in determining the profit or loss on disposal of, orimpairment charge relating to, that investment, which isrecognised in the income statement.
8 Impairment of assets The group’s assets, other than inventories and deferred tax, arereviewed biannually or whenever events or changes incircumstances indicate that the carrying value may not berecoverable, to determine whether there is any indication ofimpairment. An annual impairment test is performed on allgoodwill, intangible assets not yet in use and intangible assetswith indefinite useful lives.
The impairment recognised in the income statement is theexcess of the carrying value over the recoverable amount.Recoverable amounts are estimated for individual assets or,where an individual asset cannot generate cash flowsindependently, the recoverable amount is determined for thelarger cash-generating unit to which the asset belongs.
With the exception of goodwill, a previously recognisedimpairment will be reversed insofar as estimates change as aresult of an event occurring after the impairment was
Foreign entities Income and expenditure transactions offoreign entities are translated at the average rate of exchangefor the year. All assets and liabilities, including fair valueadjustments arising on acquisition, are translated at the rate ofexchange ruling at the balance sheet date. Differences arisingon translation are recognised in the changes in equity statementas a foreign currency translation reserve.
On disposal of part or all of the investment, the proportionateshare of the related cumulative gains and losses previouslyrecognised in the foreign currency translation reserve in thechanges in equity statement are included in determining theprofit or loss on disposal of that investment recognised in theincome statement.
Integrated foreign operations Income and expendituretransactions of integrated foreign operations are treated as ifthey were transactions of the company holding the investment.These transactions are translated at the rate of exchange rulingat the transaction date or an average rate where there are anumber of similar transactions. Monetary assets and liabilitiesare translated at the rate of exchange ruling at the balancesheet date. Non-monetary assets and liabilities, stated athistorical cost, are translated at the rate of exchange ruling atthe transaction date. Non-monetary assets and liabilities,stated at fair value, are translated at the rate of exchange rulingat the date the fair values were determined. Differences arisingon conversion of monetary assets and liabilities are recognisedin the income statement.
Other foreign currency transactions Income and expendituretransactions are translated into the measurement currency ofthe entity at the rate of exchange ruling at the transaction date.
Monetary assets and liabilities are translated at the rate ofexchange ruling at the balance sheet date.
Differences arising on translation of monetary assets andliabilities are recognised in the income statement unless theyarise from cash flow hedges.
Differences arising on translation of available-for-sale financialassets are included in the changes in equity statement.
4 Property, plant and equipment Property, plant and equipment is stated at cost lessaccumulated depreciation and impairment. Land is notdepreciated.
The cost of self-constructed assets includes expenditure onmaterials, direct labour and an allocated proportion of projectoverheads. Cost also includes the estimated costs ofdismantling and removing the assets and site rehabilitationcosts to the extent that they relate to the construction of theasset as well as gains or losses on qualifying cash flow hedges.Borrowing costs are capitalised on qualifying assets.
When plant and equipment comprises major components withdifferent useful lives, these components are accounted for as
separate items. Expenditure incurred to replace or modify a
significant component of plant is capitalised and any remaining
book value of the component replaced is written off in the
income statement. All other expenditure is recognised in the
income statement.
Property, plant and equipment is depreciated to its estimatedresidual value on a straight-line basis over its expected usefullife. The depreciation methods, estimated remaining useful livesand residual values are reviewed at least annually. Thedepreciation rates applied are provided on page 62.
5 Intangible assets Intangible assets are stated at cost less accumulatedamortisation and impairment.
Intangible assets are recognised if it is probable that futureeconomic benefits will flow to the entity from the assets andthe costs of the assets can be reliably measured.
Intangible assets with finite useful lives are amortised on astraight-line basis over their estimated useful lives. Theamortisation methods and estimated remaining useful lives arereviewed at least annually. Amortisation rates applied areprovided on page 67. Intangible assets with an indefinite usefullife are not amortised but are tested at least annually forimpairment and the assessment of the estimated useful life ofthese assets reviewed at least annually.
Research and development Research expenditure is recognisedin the income statement.
Development expenditure relating to the production of new orsubstantially improved products or processes is capitalised if theproducts or processes are technically and commercially feasible.Cost includes expenditure on materials, direct labour and anallocated proportion of project overheads. All remainingdevelopment expenditure is recognised in the income statement.
Software Purchased software and the direct costs associatedwith the customisation and installation thereof are capitalised.Expenditure on internally-developed software is capitalised if itmeets the criteria for capitalising development expenditure.Expenditure incurred to restore or maintain the originallyassessed future economic benefits of existing software systemsis recognised in the income statement.
Patents and trademarks Expenditure on purchased patentsand trademarks is capitalised. Expenditure incurred to extendthe life of the patents or trademarks is capitalised. All otherexpenditure is recognised in the income statement.
Exploration and development – Oil and gas exploration
The successful efforts method is used to account for oil and gasexploration activities. Exploratory well and related drilling costsare capitalised pending further evaluation of reserves.
Geological and geophysical costs, dry exploratory wells and thecosts of carrying and retaining undeveloped properties arerecognised in the income statement.
sasol limited group
accounting policies and glossary of financial reporting termscontinued
40 41
expected to apply when the asset is realised or liability settled.
A deferred tax asset is recognised to the extent that it is probable
that future taxable profits will be available against which the
deferred tax asset can be realised.
The provision for deferred tax assets and liabilities reflects the
tax consequences that would follow from the expected recovery
or settlement of the carrying amount of its assets and liabilities.
Deferred tax liabilities have not been provided on undistributed
earnings of foreign subsidiaries where those earnings are not
expected to be distributed.
Secondary Taxation on Companies (STC) STC is recognised
as part of the current tax charge in the income statement when
the related dividend is declared. When dividends received in the
current year can be offset against future dividend payments to
reduce the STC liability, a deferred tax asset is recognised to the
extent of the future reduction in STC.
19 Revenue Revenue is recognised net of indirect taxes, rebates and
trade discounts and consists primarily of the sale of products,
services rendered, licence fees, royalties, dividends received
and interest received.
Revenue is recognised when the following criteria are met:
• evidence of an arrangement exists;
• delivery has occurred or services have been rendered and the
significant risks and rewards of ownership have been
transferred to the purchaser;
• transaction costs can be reliably measured;
• the selling price is fixed or determinable; and
• collectability is reasonably assured.
The timing of revenue recognition is as follows. Revenue from:
• the sale of products is recognised when the group no longer
retains continuing managerial involvement associated with
ownership;
• services rendered is based on the stage of completion of the
transaction, based on the proportion that costs incurred to
date bear to the total cost of the project;
• licence fees and royalties is recognised on an accrual basis;
• dividends received is recognised when the right to receive
payment is established; and
• interest received is recognised on a time proportion basis
using the effective interest rate method.
20 Construction contracts When the outcome of a construction contract can be estimated
reliably, contract revenue and contract costs associated with
that construction contract are recognised as revenue and
expenses respectively by reference to the stage of completion
of the contract activity at the balance sheet date. The stage of
completion is generally based on physical progress, man-hours
or costs incurred, based on the appropriate method for the type
of contract.
To the extent that the outcome of a construction contract
cannot be reliably measured, revenue is recognised only to the
extent of contract costs incurred that it is likely will be
recoverable.
Any expected loss on a construction contract is recognised
immediately in the income statement.
Contract costs relating to future activity on a contract are
recognised as an asset provided it is likely that they will be
recovered.
21 Deferred income Incentives received are recognised on a systematic basis in the
income statement over the periods necessary to match them
with the related costs which they are intended to compensate.
Incentives related to non-current assets are stated on the
balance sheet as deferred income and are recognised in the
income statement on a basis representative of the pattern of
use of the asset to which the incentive relates.
22 Leases Finance leases Leases where the group assumes substantially
all the benefits and risks of ownership, are classified as finance
leases. Finance leases are capitalised as property, plant and
equipment at the lower of fair value or the present value of the
minimum lease payments at the inception of the lease with an
equivalent amount being stated as a finance lease liability.
The capitalised amount is depreciated over the asset’s useful
life. Lease payments are allocated between capital repayments
and borrowing costs using the effective interest rate method.
To the extent that land constitutes a significant proportion
(greater than 25%) of a lease, the proportion of the lease
payments attributable to the land are classified as an
operating lease.
Operating leases Leases of assets under which all the risks and
benefits of ownership are effectively retained by the lessor are
classified as operating leases. Lease payments under an
operating lease are recognised in the income statement over the
lease term on a basis representative of the pattern of use.
23 Borrowing costs Borrowing costs are capitalised against qualifying assets.
Such borrowing costs are capitalised over the period during
which the asset is being acquired or constructed and borrowings
recognised. An impairment is reversed only to the extent thatthe asset’s carrying amount does not exceed the carryingamount that would have been determined had no impairmentbeen recognised. A reversal of an impairment is recognised inthe income statement.
9 Inventories Inventories are valued at the lower of cost and net realisable value.Cost includes expenditure incurred in acquiring, manufacturingand transporting the inventory to its present location.
Cost is determined as follows
Crude oil and other First-in-first-out valuation method raw materials (FIFO)
Process, maintenance Weighted average purchase priceand other materials
Work-in-progress Allocation of direct labour, anallocated proportion of overheadsand material costs incurred
Manufactured products Production cost according to FIFO including consignment inventory
Net realisable value is the estimated selling price in the ordinarycourse of business, less the cost of completion and sellingexpenses.
10 Trade and other receivables Trade and other receivables are stated at invoiced value lessprovision for doubtful debts.
11 Cash and cash equivalents Cash and cash equivalents are stated at carrying value which isdeemed to be fair value. For cash flow statement purposes bankoverdrafts are offset against cash and cash equivalents.
12 Restricted cash Cash which is subject to restrictions on its use is statedseparately at carrying value in the balance sheet.
13 Provisions A provision is recognised when the group has a legal orconstructive obligation arising from a past event that will probablybe settled, and a reliable estimate of the amount can be made.
Long-term provisions are determined by discounting theexpected future cash flows to their present value using thediscount rate. The increase in discounted long-term provisionsas a result of the passage of time is recognised as a deemedborrowing cost in the income statement.
Environmental rehabilitation provisions Estimated long-termenvironmental provisions, comprising pollution control,rehabilitation and mine closure, are based on the group’senvironmental policy taking into account current technological,environmental and regulatory requirements. The provision forrehabilitation is recognised as and when the environmentalliability arises. To the extent that the obligations relate to the
construction of an asset, they are capitalised as part of the cost
of those assets. All subsequent changes to the provisions are
recognised in the income statement.
Decommissioning costs of plant and equipment The
estimated present value of future decommissioning costs,
taking into account current environmental and regulatory
requirements, is capitalised as part of property, plant and
equipment, to the extent that they relate to the construction of
the asset, and the related provisions are raised. These estimates
are reviewed at least annually. All subsequent changes to the
provisions are recognised in the income statement.
Ongoing rehabilitation expenditure Ongoing rehabilitation
expenditure is recognised in the income statement.
14 Trade and other payables Trade and other payables are stated at cost.
15 Dividends payable Dividends payable and the related taxation thereon are
recognised as a liability in the period in which they are declared.
16 Share capital Issued share capital is stated in the changes in equity statement
at the amount of the proceeds received less directly attributable
issue costs.
17 Share repurchase programme When Sasol Limited’s shares are repurchased by a subsidiary, the
amount paid, including directly attributable costs, is disclosed
as a deduction from shareholders’ equity. Where such shares are
subsequently reissued, any consideration received is included in
the changes in equity statement.
18 Taxation The income tax charge is determined based on net income
before tax for the year and includes deferred tax and Secondary
Taxation on Companies.
Current tax The current tax charge is the calculated tax payable
on the taxable income for the year using substantially enacted tax
rates and any adjustments to tax payable in respect of prior years.
Deferred tax Deferred tax is provided for using the liability
method, on all temporary differences between the carrying
values of assets and liabilities for accounting purposes and the
amounts used for tax purposes. No deferred tax is provided on
temporary differences relating to:
• non-tax deductible goodwill;
• the initial recognition (other than in a business combination)
of an asset or liability to the extent that neither accounting
nor taxable profit is affected on acquisition; and
• investments in subsidiaries to the extent they will probably
not reverse in the foreseeable future.
The provision for deferred tax is calculated using enacted or
substantially enacted tax rates at balance sheet date that are

sasol limited group
accounting policies and glossary of financial reporting termscontinued
42 43
The fair value of financial instruments is determined as follows:
• short-term receivables (net of any provision for doubtful
debts) and payables, other than derivative instruments, at the
historic invoice amount;
• derivative instruments are marked to market at balance sheet
date; and
• long-term financial assets at the current market value if listed
or, if unlisted, the amount determined using appropriate
valuation methods.
Gains and losses arising on the revaluation at balance sheet
date of available-for-sale financial assets are recognised as an
investment fair value reserve in the changes in equity statement
until the asset is disposed of or impaired, at which time the
cumulative gain or loss is recognised in the income statement.
All derivative instruments are marked to market at balance
sheet date. Resulting gains or losses on derivative instruments,
excluding designated hedging instruments, are recognised in
the income statement.
All other gains and losses on revaluation to fair value of
financial instruments are recognised in the income statement on
valuation date.
Premiums or discounts arising from the difference between
the cost of financial instruments purchased or issued and the
amounts receivable or repayable at maturity are recognised as
borrowing costs using the effective interest rate method.
Hedge accounting The group is exposed to market risks from
changes in interest rates, foreign exchange rates and
commodity prices. The group uses derivative instruments to
hedge its exposure to fluctuations in interest rates, foreign
exchange rates and certain commodity prices.
The group’s criteria for a derivative instrument to be classified
as a hedge require that:
• the hedge transaction is expected to be highly effective in
achieving offsetting changes in fair value or cash flows
attributable to the hedged risk;
• the effectiveness of the hedge can be reliably measured
throughout the duration of the hedge;
• there is adequate documentation of the hedging relationship
at the inception of the hedge; and
• for cash flow hedges, the forecasted transaction that is the
subject of the hedge must be highly probable.
Where a derivative instrument is designated as a cash flow
hedge of an asset, liability or expected future transaction, the
effective part of any gain or loss arising on the derivative
instrument is classified as a cash flow hedge accounting reserve
in the changes in equity statement until the underlying
transaction occurs. The ineffective part of any gain or loss is
recognised in the income statement.
If the expected future transaction results in the recognition of
an asset or liability, the associated gain or loss is transferred
from the cash flow hedge accounting reserve in the changes in
equity statement to the underlying asset or liability on the
transaction date. Other cash flow hedge gains or losses are
recognised in the income statement at the same time as the
hedged transaction occurs.
When forward exchange contracts are entered into as fair value
hedges, no hedge accounting is applied. All gains and losses on
such contracts are recognised in the income statement.
26 Comparative figures Comparative figures are reclassified or restated where necessary
to afford a proper and more meaningful comparison of results
as set out in the affected notes to the financial statements.
27 Segment information Segment information is reported on both a business unit
(primary) and geographical (secondary) basis. This approach is
based on the manner in which segments are organised and
managed as well as management’s assessment that the risks
and rates of return are affected predominantly by differences in
the products produced and services rendered rather than the
geographical location of its activities. The basis of segmental
reporting is set out on pages 51 to 59.
28 Convenience conversion from rand to US dollars The principal reporting currency of the group is rand.
This currency reflects the economic substance of the
underlying events and circumstances of the group.
Supplementary US dollar information is provided for
convenience only.
The conversion to US dollars is performed as follows:
• assets and liabilities are translated at the closing rate of
exchange on balance sheet date;
• income and expenses are translated at average rates of
exchange for the years presented except for significant
transactions which are translated at rates of exchange ruling
on the transaction dates;
• shareholders’ equity, other than attributable earnings for the
year, is translated at the closing rate on each balance sheet
date; and
• the resulting translation differences are included in
shareholders’ equity.
have been incurred. Capitalisation ceases when construction is
interrupted for an extended period or when the asset is
substantially complete. Further borrowing costs are recognised
in the income statement.
Where funds are borrowed specifically for the purpose of acquiring
or constructing a qualifying asset, the amount of borrowing costs
eligible for capitalisation on that asset is the actual borrowing
costs incurred on the borrowing during the period.
Where funds are made available from general borrowings and
used for the purpose of acquiring or constructing qualifying
assets, the amount of borrowing costs eligible for capitalisation
is determined by applying a capitalisation rate to the
expenditures on these assets. The capitalisation rate is the
weighted average of the interest rates applicable to the
borrowings of the group that are outstanding during the period,
other than borrowings made specifically for the purpose of
obtaining qualifying assets.
The amount of borrowing costs capitalised will not exceed the
amount of borrowing costs incurred.
24 Employee benefits Short-term employee benefits Remuneration to employees is
recognised in the income statement. Provision is made for
accumulated leave and incentive bonuses.
Retirement benefits – pension The group operates or
contributes to defined benefit pension plans and defined
benefit plans for its employees in the countries in which it
operates. These plans are generally funded through payments
to trustee-administered funds as determined by annual
actuarial calculations.
Defined contribution pension plans Contributions to
defined contribution pension plans are recognised in the
income statement.
Post-retirement benefits – defined benefit pension plans
The group’s net obligation in respect of defined benefit pension
plans is actuarially calculated separately for each plan by
deducting the fair value of plan assets from the gross obligation
for post-retirement benefits. The gross obligation is determined
by estimating the future benefit attributable to employees in
return for services rendered to date.
This future benefit is discounted using the discount rate to
determine its present value. Independent actuaries perform this
calculation annually using the projected unit credit method.
Improvements to a defined benefit pension plan relating to past
service are recognised in the income statement as an expense
on a straight-line basis over the period during which the
benefits vest.
To the extent that, at the beginning of the financial year, any
cumulative unrecognised actuarial gain or loss exceeds ten
percent of the greater of the present value of the defined
benefit obligation and the fair value of the plan assets (the
corridor), that portion is recognised in the income statement
over the expected average remaining service lives of
participating employees. Actuarial gains or losses within the
corridor are not recognised.
Where the plan assets exceed the gross obligation, the asset
recognised is limited to the total of unrecognised net actuarial
losses, unrecognised past service costs related to improvements
to the defined benefit pension plan and the present value of any
future refunds from the plan or reductions in future
contributions to the plan.
Post-retirement benefits – healthcare The group provides post-
retirement healthcare benefits to certain of its retirees. The
entitlement of these benefits is usually based on the employee
remaining in service up to retirement age and the completion of a
minimum service period. The expected costs of these benefits are
accrued on a systematic basis over the expected remaining period
of employment, using the accounting methodology described in
respect of defined benefit pension plans above. Independent
actuaries perform the calculation of this obligation annually.
Equity and equity-related compensation benefits The Sasol
Share Incentive Scheme allows certain senior group employees
the option to acquire shares in Sasol Limited over a prescribed
period. The exercise price of these options equals the market
price of the underlying shares on the trading day immediately
preceding the granting of the option. Consequently no
compensation cost or obligation is recognised. When the
options are exercised, share capital is increased by the proceeds
received less directly attributable issue costs.
25 Financial instruments
Financial instruments are initially recognised on transaction date
at cost including transaction costs when the related contractual
rights or obligations exist. Certain financial instruments are
subsequently revalued.
Derivative instruments, financial instruments acquired for
trading purposes and available-for-sale financial assets are
stated at fair value. Held-to-maturity investments are stated
at cost taking into account any accumulated amortisation
and impairment.
Financial assets and liabilities are recognised when the group has
rights to receive or obligations to pay economic benefits and are
derecognised when these rights or obligations no longer exist.

sasol limited group
income statement
2005 2004 2003
for the year ended 30 June Note Rm Rm Rm
Turnover 26 69 239 60 151 64 555
Cost of sales and services rendered (42 267) (38 794) (39 347)
Gross profit 26 972 21 357 25 208
Non-trading income 27 417 343 604
Marketing and distribution expenditure (5 097) (4 920) (4 977)
Administrative expenditure (4 075) (3 744) (4 407)
Other operating expenditure (3 802) (2 687) (2 809)
Translation gains/(losses) 28 91 (1 035) (1 708)
Operating profit 29 14 506 9 314 11 911
Dividends and interest received 31 149 190 167
Income from associates 32 184 117 60
Borrowing costs 33 (587) (439) (225)
Net income before tax 14 252 9 182 11 913
Taxation 34 (4 568) (3 175) (4 007)
Earnings 9 684 6 007 7 906
Attributable toShareholders 9 573 5 940 7 817
Minority interests in subsidiaries 111 67 89
9 684 6 007 7 906
Basic earnings per share (cents) 36
attributable earnings basis 1 560 974 1 283
headline earnings basis 1 749 934 1 280
Diluted earnings per share (cents) 36
attributable earnings basis 1 533 964 1 262
headline earnings basis 1 719 925 1 259
Dividends per share (cents)
interim 230 215 215
final 310* 235 235
* Declared subsequent to 30 June 2005 and has been presented for information purposes only. No provision regarding this final dividend has been recognised.
45
sasol limited group
balance sheet
2005 2004 2003
at 30 June Note Rm Rm Rm
AssetsProperty, plant and equipment 1 56 550 46 858 42 363
Goodwill (and negative goodwill) 2 509 92 (314)
Intangible assets 3 1 900 2 236 2 051
Investments in securities 4 397 372 690
Investments in associates 5 608 471 270
Post-retirement benefit assets 6 300 239 451
Long-term receivables 7 1 091 899 778
Long-term prepaid expenses 8 106 128 30
Long-term financial assets 9 10 7 9
Deferred tax asset 19 409 306 194
Non-current assets 61 880 51 608 46 522
Investments held-for-sale 5 41 – –
Inventories 10 9 995 8 292 8 748
Trade receivables 11 8 668 7 551 7 713
Other receivables and prepaid expenses 12 3 716 3 420 2 773
Short-term financial assets 13 178 25 12
Cash restricted for use 14 1 002 527 665
Cash 14 2 509 2 063 3 186
Current assets 26 109 21 878 23 097
Total assets 87 989 73 486 69 619
Equity and liabilitiesShareholders’ equity 43 530 35 027 33 518
Minority interest 256 373 300
Total equity 43 786 35 400 33 818
Long-term debt 15 12 951 9 110 4 581
Long-term provisions 16 2 954 2 362 2 486
Post-retirement benefit obligations 17 2 970 2 724 2 589
Long-term deferred income 18 763 237 96
Deferred tax liability 19 6 286 5 768 6 113
Non-current liabilities 25 924 20 201 15 865
Short-term debt 20 3 300 3 265 6 481
Short-term financial liabilities 21 792 1 205 654
Short-term provisions 22 1 801 1 838 1 566
Short-term portion of deferred income 18 8 15 –
Tax payable 23 614 61 571
Trade payables 24 4 733 3 886 4 060
Other payables and accrued expenses 25 4 416 3 502 3 336
Bank overdraft 14 2 615 4 113 3 268
Current liabilities 18 279 17 885 19 936
Total equity and liabilities 87 989 73 486 69 619
44

sasol limited group
income statement (US dollar convenience translation)
2005 2004 2003
for the year ended 30 June US$m US$m US$m
47
sasol limited group
balance sheet (US dollar convenience translation)
2005 2004 2003
at 30 June US$m US$m US$m
46
AssetsProperty, plant and equipment 8 478 7 545 5 652
Goodwill (and negative goodwill) 76 15 (42)
Intangible assets 285 360 274
Investments in securities 60 60 92
Investments in associates 91 76 36
Post-retirement benefit assets 45 39 60
Long-term receivables 164 145 104
Long-term prepaid expenses 16 20 4
Long-term financial assets 1 1 1
Deferred tax asset 61 49 26
Non-current assets 9 277 8 310 6 207
Investments held-for-sale 6 – –
Inventories 1 499 1 335 1 167
Trade receivables 1 299 1 216 1 029
Other receivables and prepaid expenses 557 551 370
Short-term financial assets 27 4 2
Cash restricted for use 150 85 89
Cash 376 332 425
Current assets 3 914 3 523 3 082
Total assets 13 191 11 833 9 289
Equity and liabilitiesShareholders’ equity 6 526 5 640 4 472
Minority interest 38 60 40
Total equity 6 564 5 700 4 512
Long-term debt 1 942 1 467 611
Long-term provisions 443 380 332
Post-retirement benefit obligations 445 439 345
Long-term deferred income 114 38 13
Deferred tax liability 942 929 816
Non-current liabilities 3 886 3 253 2 117
Short-term debt 495 526 865
Short-term financial liabilities 119 194 87
Short-term provisions 270 296 209
Short-term portion of deferred income 1 2 –
Tax payable 92 10 76
Trade payables 710 626 542
Other payables and accrued expenses 662 564 445
Bank overdraft 392 662 436
Current liabilities 2 741 2 880 2 660
Total equity and liabilities 13 191 11 833 9 289
Converted at closing rate of rand per 1US$ 6,67 6,21 7,50
Turnover 11 150 8 747 7 149
Cost of sales and services rendered (6 807) (5 641) (4 357)
Gross profit 4 343 3 106 2 792
Non-trading income 67 50 67
Marketing and distribution expenditure (821) (716) (551)
Administrative expenditure (656) (544) (488)
Other operating expenditure (612) (391) (312)
Translation gains/(losses) 15 (151) (189)
Operating profit 2 336 1 354 1 319
Dividends and interest received 24 28 18
Income from associates 30 17 7
Borrowing costs (95) (64) (25)
Net income before tax 2 295 1 335 1 319
Taxation (736) (461) (444)
Earnings 1 559 874 875
Attributable toShareholders 1 541 864 865
Minority interests in subsidiaries 18 10 10
1 559 874 875
Basic earnings per share (cents)attributable earnings basis 251 142 142
headline earnings basis 282 136 142
Diluted earnings per share (cents)attributable earnings basis 247 140 140
headline earnings basis 277 134 139
Dividends per share (cents)interim 37 33 27
final 47* 38 31
Converted at average rate of rand per 1US$ 6,21 6,88 9,03
* Declared subsequent to 30 June 2005 and has been presented for information purposes only. No provision regarding this final dividend has been recognised.

49
sasol limited group
changes in equity statement
48
Foreigncurrency Cash flow
translation Investment hedge ShareShare reserve fair value accounting repurchase Accumulated Shareholders’ Minority Total
capital (Note 39) reserve reserve programme earnings equity interest equityfor the year ended 30 June Rm Rm Rm Rm Rm Rm Rm Rm Rm
Balance at 30 June 2002 2 706 2 218 2 (241) (3 429) 30 059 31 315 272 31 587
Shares issued 77 – – – – – 77 – 77
Decrease in foreign currency translation reserve for year – (2 487) – – – – (2 487) (16) (2 503)
Effect of cash flow hedge accounting – – – (128) – – (128) – (128)
Shares repurchased during year – – – – (185) – (185) – (185)
Attributable earnings for year – – – – – 7 817 7 817 89 7 906
Dividends paid – – – – – (2 835) (2 835) (65) (2 900)
Change in shareholding of subsidiaries – – – – – – – 20 20
Tax effects – (83) – 27 – – (56) – (56)
Balance at 30 June 2003 2 783 (352) 2 (342) (3 614) 35 041 33 518 300 33 818
Shares issued 109 – – – – – 109 – 109
Decrease in foreign currency translation reserve for year – (1 464) – – – – (1 464) (21) (1 485)
Transfer of reserves – 199 – (199) – – – – –
Disposal of businesses – 43 – (7) – – 36 – 36
Effect of cash flow hedge accounting – – – (462) – – (462) – (462)
Shares repurchased during year – – – – (33) – (33) – (33)
Attributable earnings for year – – – – – 5 940 5 940 67 6 007
Dividends paid – – – – – (2 745) (2 745) (37) (2 782)
Change in shareholding of subsidiaries – – – – – – – 64 64
Tax effects – 5 – 123 – – 128 – 128
Balance at 30 June 2004 2 892 (1 569) 2 (887) (3 647) 38 236 35 027 373 35 400
Shares issued 311 – – – – – 311 – 311
Effect of translation of foreign entities – 338 – – – – 338 11 349
Negative goodwill written off – (80) – – – 690 610 – 610
Disposal of businesses – (25) – – – – (25) – (25)
Effect of cash flow hedge accounting – – – 646 – – 646 – 646
Attributable earnings for year – – – – – 9 573 9 573 111 9 684
Dividends paid – – – – – (2 856) (2 856) (64) (2 920)
Change in shareholding of subsidiaries – – – – – – – (175) (175)
Tax effects – – – (94) – – (94) – (94)
Balance at 30 June 2005 3 203 (1 336) 2 (335) (3 647) 45 643 43 530 256 43 786

sasol limited group
segment information
51
sasol limited group
cash flow statement
2005 2004 2003
for the year ended 30 June Note Rm Rm Rm
Cash receipts from customers 68 263 59 952 64 696
Cash paid to suppliers and employees (49 451) (44 801) (48 699)
Cash generated by operating activities 41 18 812 15 151 15 997
Investment income 44 169 230 178
Borrowing costs paid 33 (1 523) (1 384) (1 286)
Tax paid 23 (3 753) (3 963) (5 527)
Cash available from operating activities 13 705 10 034 9 362
Dividends paid 45 (2 856) (2 745) (2 835)
Cash retained from operating activities 10 849 7 289 6 527
Additions to property, plant and equipment 1 (12 414) (10 888) (10 272)
Additions to intangible assets 3 (112) (530) (696)
Non-current assets sold 46 478 746 504
Acquisition of businesses 47 – (555) (155)
Cash acquired on acquisition of businesses 47 – 163 119
Disposal of businesses 48 36 283 –
Cash disposed of on disposal of businesses 48 (94) (2) –
Decrease/(increase) in investments 35 49 (184)
Increase in long-term receivables (156) (294) (37)
Cash utilised in investing activities (12 227) (11 028) (10 721)
Share capital issued 311 109 77
Share repurchase programme – (33) (185)
Dividends paid to minority shareholders (64) (37) (65)
Contributions from minority shareholders – 75 –
Increase in long-term debt 4 165 4 386 122
(Decrease)/increase in short-term debt (440) (2 616) 3 088
Cash effect of financing activities 3 972 1 884 3 037
Translation effects on cash and cash equivalents of
foreign entities 39 (175) (251) (255)
Increase/(decrease) in cash and cash equivalents 2 419 (2 106) (1 412)
Cash and cash equivalents at beginning of year (1 523) 583 1 995
Cash and cash equivalents at end of year 14 896 (1 523) 583
50
Classification of primary reporting segmentsThe group has eight primary reporting segments that are used
by management to make key operating decisions and assess
performance. They are Sasol Mining, Sasol Synfuels, Sasol Liquid
Fuels Business, Sasol Gas, Sasol Synfuels International, Sasol
Olefins & Surfactants, Sasol Polymers and Sasol Solvents.
Included in other businesses are Sasol Wax, Sasol Nitro, Merisol
and Sasol Petroleum International as well as the group support
services such as Sasol Technology, Sasol Infrachem, Sasol
Financing and the corporate head office functions.
LiabilitiesSegment liabilities are those operating liabilities that result
from the operating activities of a segment and that are either
directly attributable to the segment or can be allocated on
a reasonable basis. Segment liabilities do not include
income tax liabilities.
Sasol Financing acts as the group treasury and thus
borrows funds from external parties on behalf of the group.
Inter-segment liabilities are not included in the segment
liabilities reported.
AssetsSegment assets are those operating assets that are employed
by the segment in its operating activities that are directly
attributable to the segment or can be allocated on a
reasonable basis. Segment assets exclude income tax assets.
The classification of the geographical analysis of assets is
based on the location of the underlying assets. In the case
of current assets, this is based on the location of the
related customer.
Revenue recognitionTurnover is recognised upon delivery of the product to
the customer which, in accordance with the related
contractual terms, is the point at which the risks and
rewards of ownership pass to the customer.
Operating profitOperating profit is determined as the operating profit
of that business unit, after deducting unrealised profit
on transactions entered into with other business units.
Operating profit on a geographical basis is determined
based on the location of the underlying customers.
Number of employeesThe significant numbers of employees included in
other businesses comprise mainly those employees
providing support services to the group, specifically
those employed by Sasol Technology and Sasol Infrachem
as well as employees of Sasol Wax and Sasol Nitro.

53
sasol limited group
business segment information
52
Property, plant and equipment
Currentassets
Total consolidatedassets*
Other non-currentassets*Mining
Synfuels
Liquid Fuels Business
Gas
Synfuels International
Olefins & Surfactants
Polymers
Solvents
Other businesses
2005 2004 2005 2004 2005 2004 2005 2004 2005 2004 2005 2004 2005 2004
Rm Rm Rm Rm Rm Rm Rm Rm Rm Rm Rm Rm Rm Rm
Mining 543 500 490 612 1 033 1 112 3 062 3 112 272 247 528 470 3 862 3 829
Synfuels 1 970 1 277 1 093 1 043 3 063 2 320 11 138 8 230 263 333 939 751 12 340 9 314
Liquid Fuels Business 1 663 1 264 2 593 1 885 4 256 3 149 3 258 2 640 447 644 6 318 5 534 10 023 8 818
Gas 2 232 1 404 313 92 2 545 1 496 5 555 5 546 122 147 285 271 5 962 5 964
Synfuels International 2 337 1 189 828 210 3 165 1 399 4 858 2 696 249 114 969 145 6 076 2 955
Olefins & Surfactants 1 283 2 348 2 989 2 358 4 272 4 706 8 895 9 022 823 512 7 621 6 543 17 339 16 077
Polymers 932 295 847 626 1 779 921 10 385 5 665 779 555 2 219 1 884 13 383 8 104
Solvents 1 088 1 210 768 702 1 856 1 912 4 015 4 486 394 233 3 097 2 343 7 506 7 062
Other businesses 7 590 4 946 7 744 10 296 15 334 15 242 5 384 5 461 1 572 1 659 4 133 3 937 11 089 11 057
Total 19 638 14 433 17 665 17 824 37 303 32 257 56 550 46 858 4 921 4 444 26 109 21 878 87 580 73 180
US$m US$m US$m US$m US$m US$m US$m US$m US$m US$m US$m US$m US$m US$m
Mining 82 81 74 99 156 180 459 501 41 40 79 76 579 617
Synfuels 295 205 164 167 459 372 1 670 1 326 40 54 141 121 1 851 1 501
Liquid Fuels Business 249 204 389 304 638 508 488 425 67 104 947 891 1 502 1 420
Gas 335 226 47 15 382 241 833 893 18 24 43 44 894 961
Synfuels International 350 191 124 34 474 225 728 434 37 18 145 23 910 475
Olefins & Surfactants 192 378 448 379 640 757 1 334 1 453 123 82 1 142 1 054 2 599 2 589
Polymers 140 48 127 101 267 149 1 557 912 117 89 333 303 2 007 1 304
Solvents 163 195 115 113 278 308 602 722 59 38 464 377 1 125 1 137
Other businesses 1 138 796 1 161 1 658 2 299 2 454 807 879 236 267 620 634 1 663 1 780
Total 2 944 2 324 2 649 2 870 5 593 5 194 8 478 7 545 738 716 3 914 3 523 13 130 11 784
* excludes tax and deferred tax
Non-currentliabilities*
Currentliabilities*
Total consolidatedliabilities*
2005 2005 2005 2005 2005 2005 2005
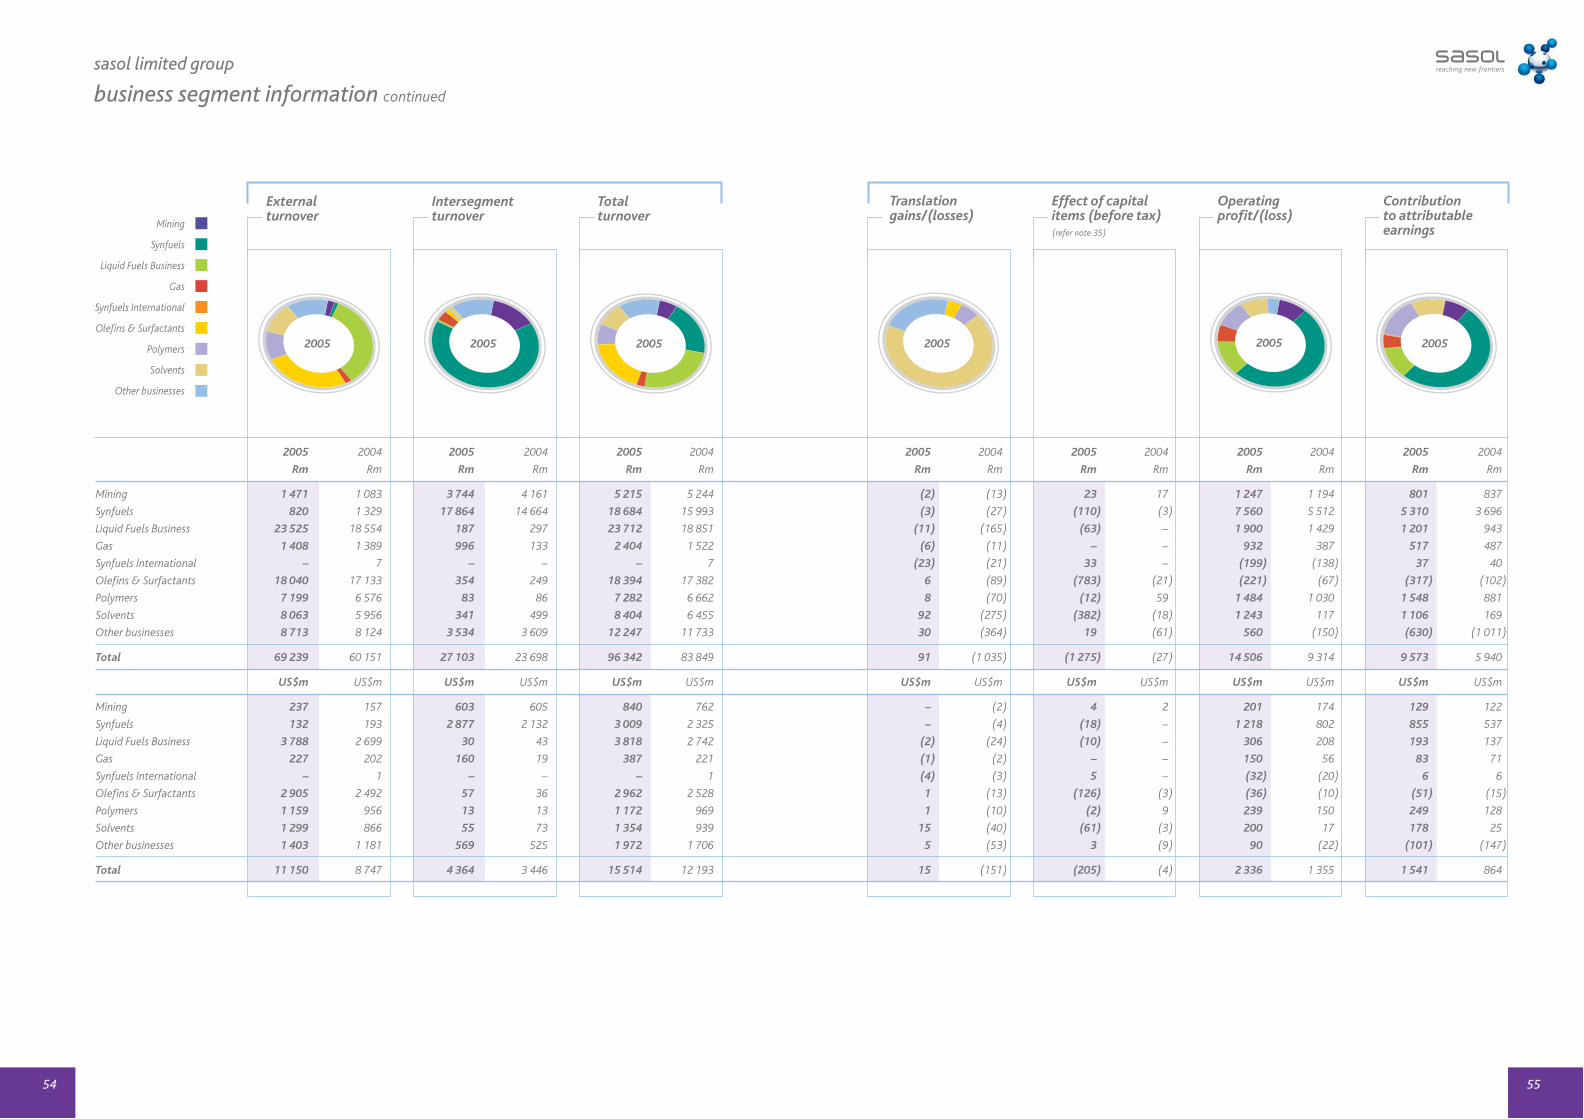
55
sasol limited group
business segment information continued
54
Translationgains/(losses)
Operatingprofit/(loss)
Contributionto attributableearnings
Intersegmentturnover
Totalturnover
Externalturnover
Effect of capitalitems (before tax)(refer note 35)
Mining
Synfuels
Liquid Fuels Business
Gas
Synfuels International
Olefins & Surfactants
Polymers
Solvents
Other businesses
2005 2004 2005 2004 2005 2004 2005 2004 2005 2004 2005 2004 2005 2004
Rm Rm Rm Rm Rm Rm Rm Rm Rm Rm Rm Rm Rm Rm
Mining 1 471 1 083 3 744 4 161 5 215 5 244 (2) (13) 23 17 1 247 1 194 801 837
Synfuels 820 1 329 17 864 14 664 18 684 15 993 (3) (27) (110) (3) 7 560 5 512 5 310 3 696
Liquid Fuels Business 23 525 18 554 187 297 23 712 18 851 (11) (165) (63) – 1 900 1 429 1 201 943
Gas 1 408 1 389 996 133 2 404 1 522 (6) (11) – – 932 387 517 487
Synfuels International – 7 – – – 7 (23) (21) 33 – (199) (138) 37 40
Olefins & Surfactants 18 040 17 133 354 249 18 394 17 382 6 (89) (783) (21) (221) (67) (317) (102)
Polymers 7 199 6 576 83 86 7 282 6 662 8 (70) (12) 59 1 484 1 030 1 548 881
Solvents 8 063 5 956 341 499 8 404 6 455 92 (275) (382) (18) 1 243 117 1 106 169
Other businesses 8 713 8 124 3 534 3 609 12 247 11 733 30 (364) 19 (61) 560 (150) (630) (1 011)
Total 69 239 60 151 27 103 23 698 96 342 83 849 91 (1 035) (1 275) (27) 14 506 9 314 9 573 5 940
US$m US$m US$m US$m US$m US$m US$m US$m US$m US$m US$m US$m US$m US$m
Mining 237 157 603 605 840 762 – (2) 4 2 201 174 129 122
Synfuels 132 193 2 877 2 132 3 009 2 325 – (4) (18) – 1 218 802 855 537
Liquid Fuels Business 3 788 2 699 30 43 3 818 2 742 (2) (24) (10) – 306 208 193 137
Gas 227 202 160 19 387 221 (1) (2) – – 150 56 83 71
Synfuels International – 1 – – – 1 (4) (3) 5 – (32) (20) 6 6
Olefins & Surfactants 2 905 2 492 57 36 2 962 2 528 1 (13) (126) (3) (36) (10) (51) (15)
Polymers 1 159 956 13 13 1 172 969 1 (10) (2) 9 239 150 249 128
Solvents 1 299 866 55 73 1 354 939 15 (40) (61) (3) 200 17 178 25
Other businesses 1 403 1 181 569 525 1 972 1 706 5 (53) 3 (9) 90 (22) (101) (147)
Total 11 150 8 747 4 364 3 446 15 514 12 193 15 (151) (205) (4) 2 336 1 355 1 541 864
2005 2005 2005 2005 2005 2005
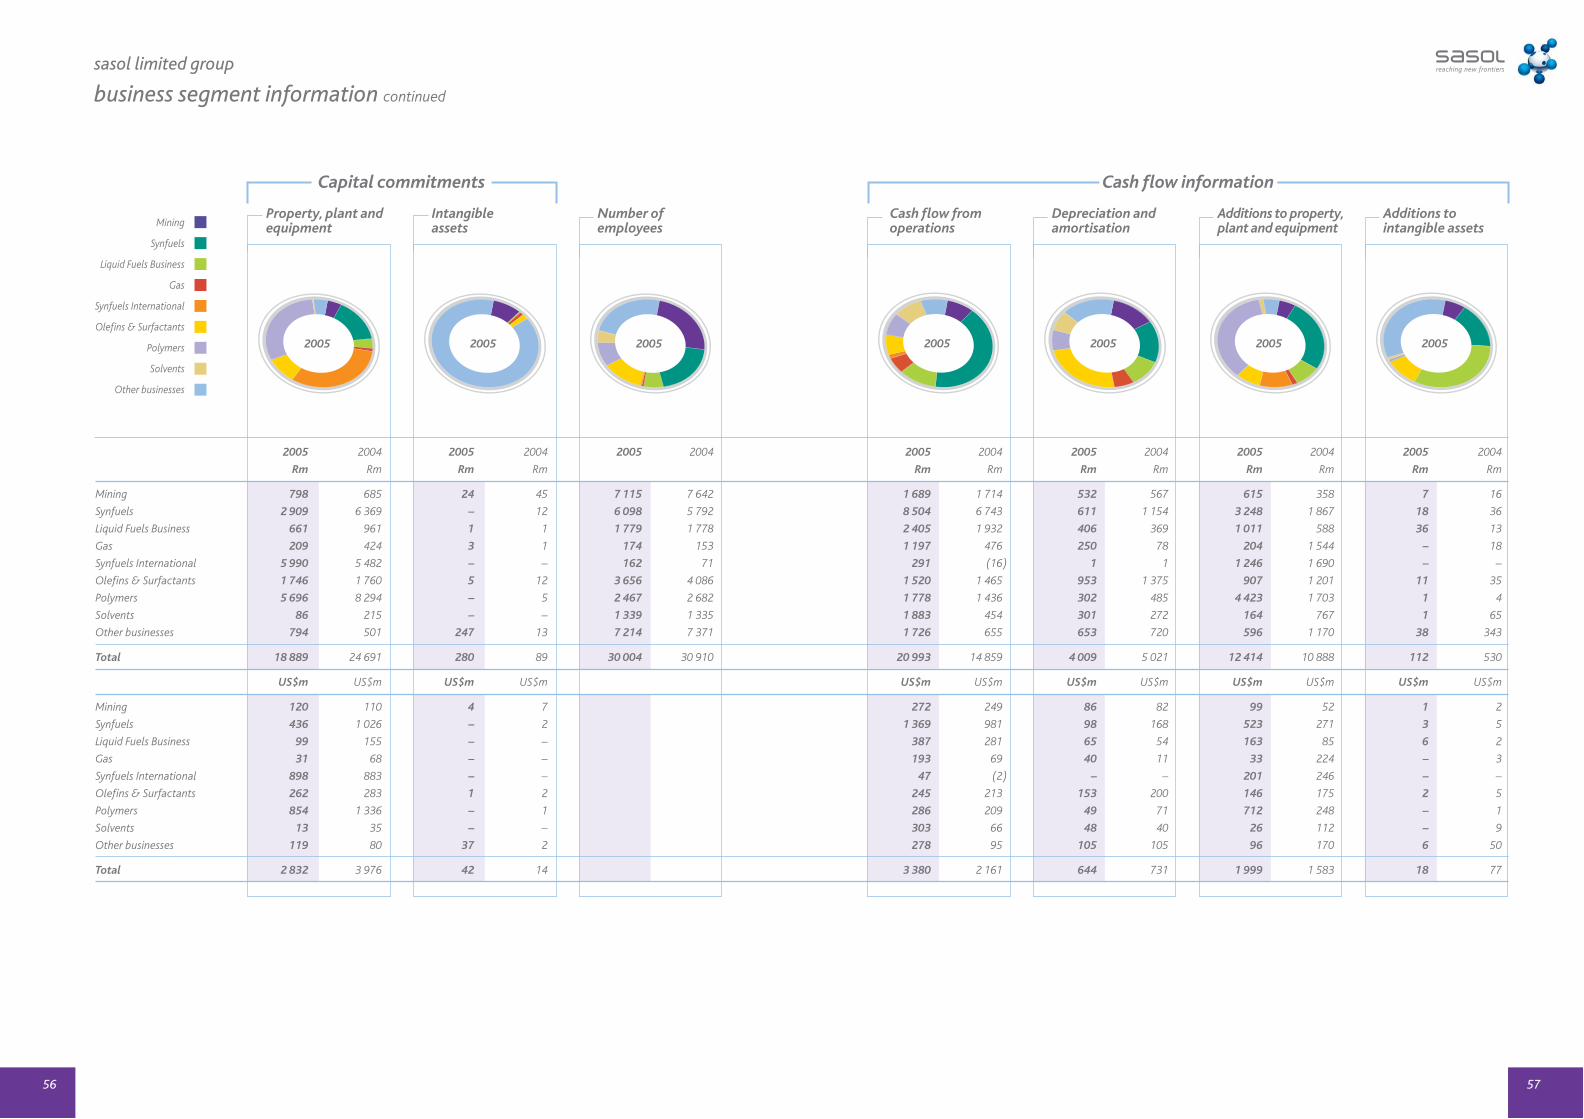
57
sasol limited group
business segment information continued
56
Cash flow fromoperations
Additions to property,plant and equipment
Additions to intangible assets
Intangible assets
Number of employees
Property, plant andequipment
Cash flow informationCapital commitments
Depreciation andamortisationMining
Synfuels
Liquid Fuels Business
Gas
Synfuels International
Olefins & Surfactants
Polymers
Solvents
Other businesses
2005 2004 2005 2004 2005 2004 2005 2004 2005 2004 2005 2004 2005 2004
Rm Rm Rm Rm Rm Rm Rm Rm Rm Rm Rm Rm
Mining 798 685 24 45 7 115 7 642 1 689 1 714 532 567 615 358 7 16
Synfuels 2 909 6 369 – 12 6 098 5 792 8 504 6 743 611 1 154 3 248 1 867 18 36
Liquid Fuels Business 661 961 1 1 1 779 1 778 2 405 1 932 406 369 1 011 588 36 13
Gas 209 424 3 1 174 153 1 197 476 250 78 204 1 544 – 18
Synfuels International 5 990 5 482 – – 162 71 291 (16) 1 1 1 246 1 690 – –
Olefins & Surfactants 1 746 1 760 5 12 3 656 4 086 1 520 1 465 953 1 375 907 1 201 11 35
Polymers 5 696 8 294 – 5 2 467 2 682 1 778 1 436 302 485 4 423 1 703 1 4
Solvents 86 215 – – 1 339 1 335 1 883 454 301 272 164 767 1 65
Other businesses 794 501 247 13 7 214 7 371 1 726 655 653 720 596 1 170 38 343
Total 18 889 24 691 280 89 30 004 30 910 20 993 14 859 4 009 5 021 12 414 10 888 112 530
US$m US$m US$m US$m US$m US$m US$m US$m US$m US$m US$m US$m
Mining 120 110 4 7 272 249 86 82 99 52 1 2
Synfuels 436 1 026 – 2 1 369 981 98 168 523 271 3 5
Liquid Fuels Business 99 155 – – 387 281 65 54 163 85 6 2
Gas 31 68 – – 193 69 40 11 33 224 – 3
Synfuels International 898 883 – – 47 (2) – – 201 246 – –
Olefins & Surfactants 262 283 1 2 245 213 153 200 146 175 2 5
Polymers 854 1 336 – 1 286 209 49 71 712 248 – 1
Solvents 13 35 – – 303 66 48 40 26 112 – 9
Other businesses 119 80 37 2 278 95 105 105 96 170 6 50
Total 2 832 3 976 42 14 3 380 2 161 644 731 1 999 1 583 18 77
20052005 20052005200520052005
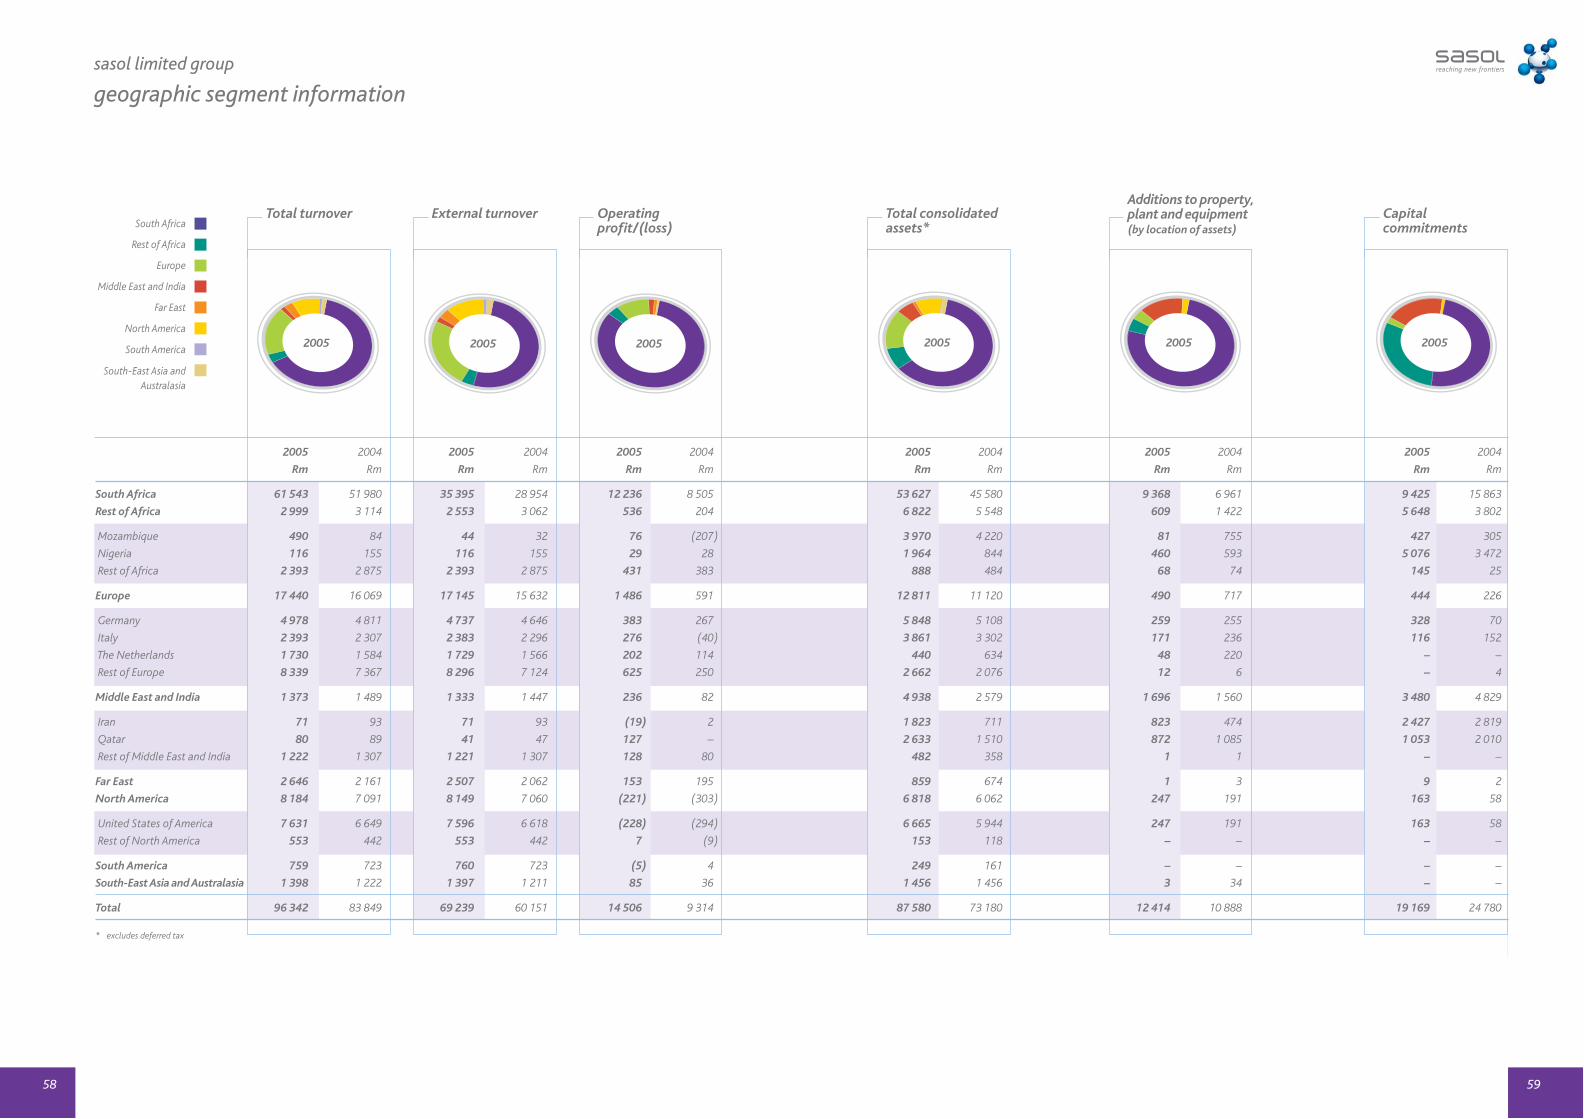
59
sasol limited group
geographic segment information
58
Additions to property,plant and equipment(by location of assets)
Capitalcommitments
External turnover Operatingprofit/(loss)
Total turnover Total consolidatedassets*South Africa
Rest of Africa
Europe
Middle East and India
Far East
North America
South America
South-East Asia and Australasia
2005 2004 2005 2004 2005 2004 2005 2004 2005 2004 2005 2004
Rm Rm Rm Rm Rm Rm Rm Rm Rm Rm Rm Rm
South Africa 61 543 51 980 35 395 28 954 12 236 8 505 53 627 45 580 9 368 6 961 9 425 15 863
Rest of Africa 2 999 3 114 2 553 3 062 536 204 6 822 5 548 609 1 422 5 648 3 802
Mozambique 490 84 44 32 76 (207) 3 970 4 220 81 755 427 305
Nigeria 116 155 116 155 29 28 1 964 844 460 593 5 076 3 472
Rest of Africa 2 393 2 875 2 393 2 875 431 383 888 484 68 74 145 25
Europe 17 440 16 069 17 145 15 632 1 486 591 12 811 11 120 490 717 444 226
Germany 4 978 4 811 4 737 4 646 383 267 5 848 5 108 259 255 328 70
Italy 2 393 2 307 2 383 2 296 276 (40) 3 861 3 302 171 236 116 152
The Netherlands 1 730 1 584 1 729 1 566 202 114 440 634 48 220 – –
Rest of Europe 8 339 7 367 8 296 7 124 625 250 2 662 2 076 12 6 – 4
Middle East and India 1 373 1 489 1 333 1 447 236 82 4 938 2 579 1 696 1 560 3 480 4 829
Iran 71 93 71 93 (19) 2 1 823 711 823 474 2 427 2 819
Qatar 80 89 41 47 127 – 2 633 1 510 872 1 085 1 053 2 010
Rest of Middle East and India 1 222 1 307 1 221 1 307 128 80 482 358 1 1 – –
Far East 2 646 2 161 2 507 2 062 153 195 859 674 1 3 9 2
North America 8 184 7 091 8 149 7 060 (221) (303) 6 818 6 062 247 191 163 58
United States of America 7 631 6 649 7 596 6 618 (228) (294) 6 665 5 944 247 191 163 58
Rest of North America 553 442 553 442 7 (9) 153 118 – – – –
South America 759 723 760 723 (5) 4 249 161 – – – –
South-East Asia and Australasia 1 398 1 222 1 397 1 211 85 36 1 456 1 456 3 34 – –
Total 96 342 83 849 69 239 60 151 14 506 9 314 87 580 73 180 12 414 10 888 19 169 24 780
* excludes deferred tax
2005 2005 2005 2005 2005 2005

2005 2004 2003
for the year ended 30 June Rm Rm Rm
1 Property, plant and equipment (continued)
CostBalance at beginning of year 81 235 75 254 70 898 Acquisition of businesses (refer note 47) – 490 371 Additions
to enhance existing operations 5 237 3 423 3 204 to expand operations 7 817 7 055 7 167
Borrowing costs capitalised (refer note 33) 1 116 1 105 1 053 Net transfer (to)/from intangible assets (refer note 3) (20) 180 34 Translation of foreign entities (refer note 39) 1 678 (3 837) (5 993)Disposal of businesses (refer note 48) (334) (832) – Disposals and scrapping (2 391) (1 603) (1 480)
Balance at end of year 94 338 81 235 75 254
ComprisingLand 610 600 656 Buildings and improvements 3 492 3 166 3 599 Plant, equipment and vehicles 67 325 62 393 53 899 Coal mining assets 5 003 5 525 5 311 Capital work in progress 17 908 9 551 11 789
94 338 81 235 75 254
Accumulated depreciation and impairmentBalance at beginning of year 34 377 32 891 32 445 Acquisition of businesses (refer note 47) – – 197 Current year charge (refer note 29) 3 591 4 723 4 468 Impairment of assets (refer note 35) 808 310 5 Net transfer (to)/from intangible assets (refer note 3) (23) 27 (24)Translation of foreign entities (refer note 39) 882 (2 010) (3 203)Disposal of businesses (refer note 48) (196) (536) –Disposals and scrapping (1 651) (1 028) (997)
Balance at end of year 37 788 34 377 32 891
ComprisingLand 15 – –Buildings and improvements 1 973 1 672 1 741 Plant, equipment and vehicles 32 844 29 576 28 340Coal mining assets 2 808 3 129 2 810 Capital work in progress 148 – –
37 788 34 377 32 891
Carrying valueLand 595 600 656 Buildings and improvements 1 519 1 494 1 858 Plant, equipment and vehicles 34 481 32 817 25 559 Coal mining assets 2 195 2 396 2 501Capital work in progress 17 760 9 551 11 789
Balance at end of year 56 550 46 858 42 363
As the group has more than five items of land and buildings a register is maintained in terms of paragraph 22(3) of Schedule 4of the South African Companies Act. The register is available for inspection at the registered office of Sasol Limited.
61
sasol limited group
non-current assets
60
2005 2004 2003
Note Rm Rm Rm
Property, plant and equipment 1 56 550 46 858 42 363
Goodwill (and negative goodwill) 2 509 92 (314)
Intangible assets 3 1 900 2 236 2 051
Investments in securities 4 397 372 690
Investments in associates 5 608 471 270
Post-retirement benefit assets 6 300 239 451
Long-term receivables 7 1 091 899 778
Long-term prepaid expenses 8 106 128 30
Long-term financial assets 9 10 7 9
Deferred tax asset 19 409 306 194
61 880 51 608 46 522
1 Property, plant and equipment
Buildings Plant, Coal Capitaland equipment mining work in
Land improvements and vehicles assets progress Total2005 Rm Rm Rm Rm Rm Rm
CostBalance at 30 June 2004 600 3 166 62 393 5 525 9 551 81 235
Additions – 89 1 302 325 11 338 13 054
to enhance existing operations – 82 379 325 4 451 5 237
to expand operations – 7 923 – 6 887 7 817
Borrowing costs capitalised – – 6 – 1 110 1 116
Transfer to intangible assets – – – – (36) (36)
Transfer from intangible assets – – – – 16 16
Work in progress capitalised – 224 3 800 115 (4 139) –
Translation of foreign entities 28 165 1 187 – 298 1 678
Disposal of businesses (6) (95) (231) – (2) (334)
Disposals and scrapping (12) (57) (1 132) (962) (228) (2 391)
Balance at 30 June 2005 610 3 492 67 325 5 003 17 908 94 338
Accumulated depreciation and impairmentBalance at 30 June 2004 – 1 672 29 576 3 129 – 34 377
Current year charge – 185 2 947 459 – 3 591
Impairment of assets 14 79 551 16 148 808
Transfer to intangible assets – – (23) – – (23)
Translation of foreign entities 1 92 789 – – 882
Disposal of businesses – (19) (177) – – (196)
Disposals and scrapping – (36) (819) (796) – (1 651)
Balance at 30 June 2005 15 1 973 32 844 2 808 148 37 788
Carrying value at 30 June 2005 595 1 519 34 481 2 195 17 760 56 550
Carrying value at 30 June 2004 600 1 494 32 817 2 396 9 551 46 858
notes to the financial statements
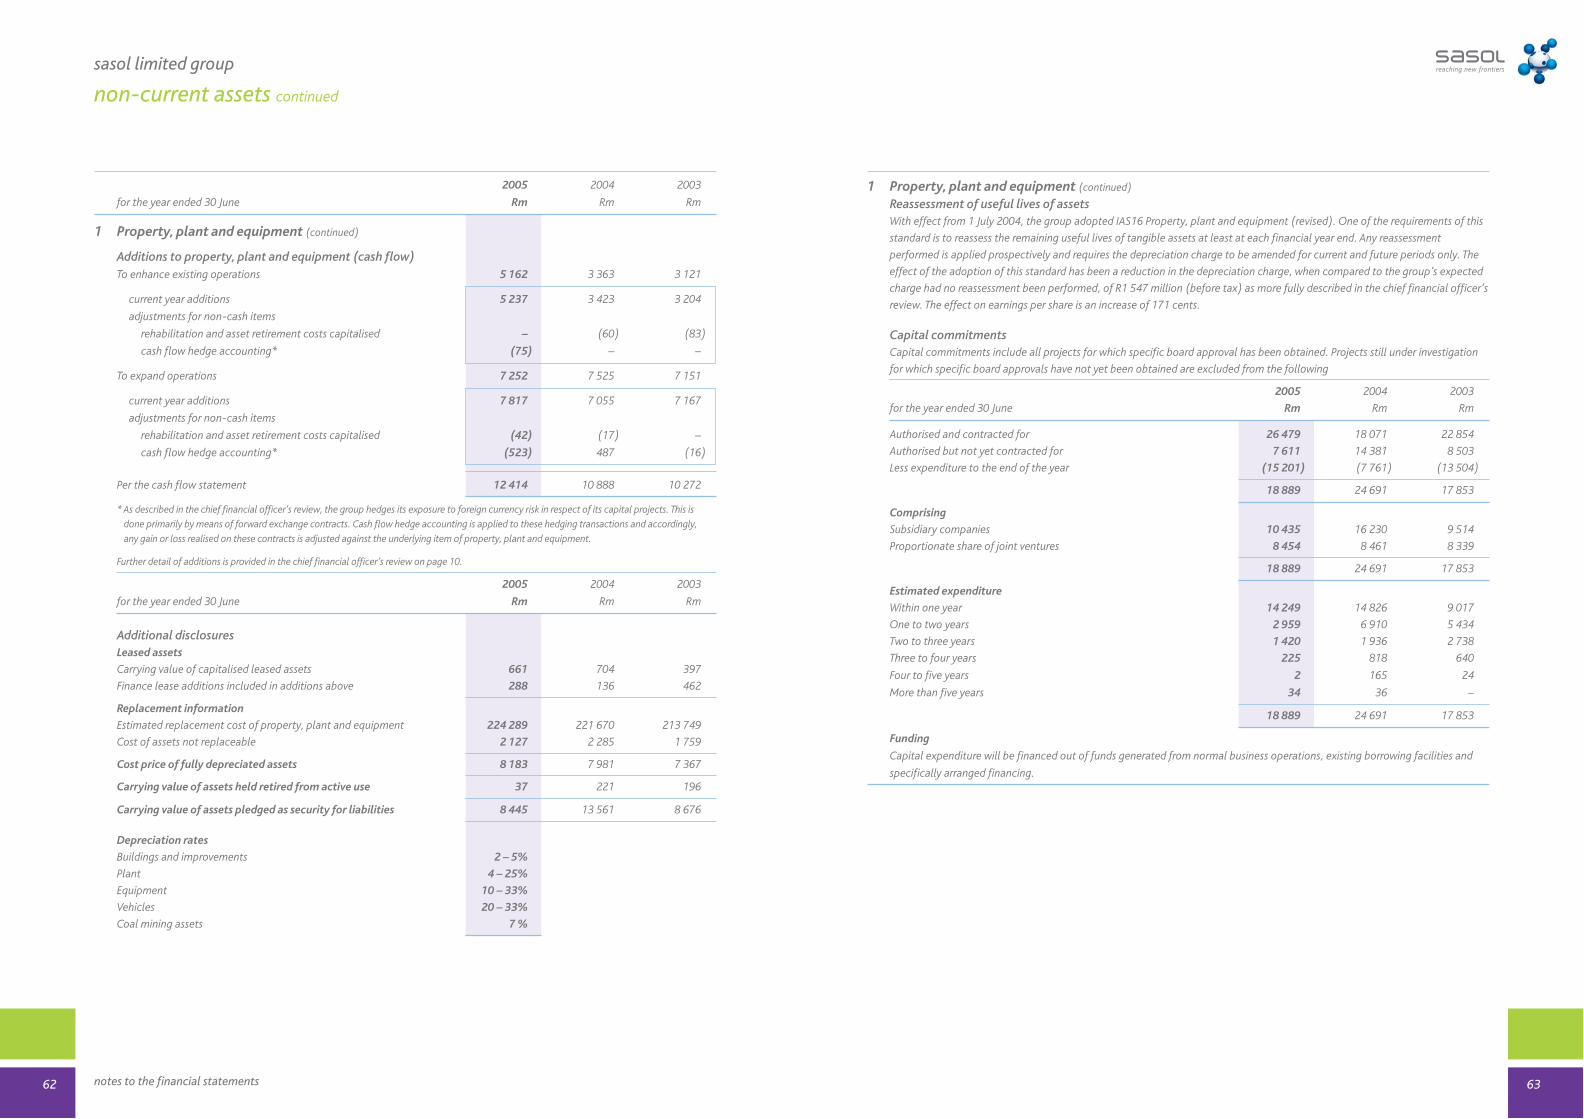
1 Property, plant and equipment (continued)
Reassessment of useful lives of assetsWith effect from 1 July 2004, the group adopted IAS16 Property, plant and equipment (revised). One of the requirements of this
standard is to reassess the remaining useful lives of tangible assets at least at each financial year end. Any reassessment
performed is applied prospectively and requires the depreciation charge to be amended for current and future periods only. The
effect of the adoption of this standard has been a reduction in the depreciation charge, when compared to the group’s expected
charge had no reassessment been performed, of R1 547 million (before tax) as more fully described in the chief financial officer’s
review. The effect on earnings per share is an increase of 171 cents.
Capital commitmentsCapital commitments include all projects for which specific board approval has been obtained. Projects still under investigation
for which specific board approvals have not yet been obtained are excluded from the following
2005 2004 2003
for the year ended 30 June Rm Rm Rm
Authorised and contracted for 26 479 18 071 22 854
Authorised but not yet contracted for 7 611 14 381 8 503
Less expenditure to the end of the year (15 201) (7 761) (13 504)
18 889 24 691 17 853
Comprising
Subsidiary companies 10 435 16 230 9 514
Proportionate share of joint ventures 8 454 8 461 8 339
18 889 24 691 17 853
Estimated expenditure
Within one year 14 249 14 826 9 017
One to two years 2 959 6 910 5 434
Two to three years 1 420 1 936 2 738
Three to four years 225 818 640
Four to five years 2 165 24
More than five years 34 36 –
18 889 24 691 17 853
Funding
Capital expenditure will be financed out of funds generated from normal business operations, existing borrowing facilities and
specifically arranged financing.
63
sasol limited group
non-current assets continued
2005 2004 2003
for the year ended 30 June Rm Rm Rm
1 Property, plant and equipment (continued)
Additions to property, plant and equipment (cash flow)To enhance existing operations 5 162 3 363 3 121
current year additions 5 237 3 423 3 204
adjustments for non-cash items
rehabilitation and asset retirement costs capitalised – (60) (83)
cash flow hedge accounting* (75) – –
To expand operations 7 252 7 525 7 151
current year additions 7 817 7 055 7 167
adjustments for non-cash items
rehabilitation and asset retirement costs capitalised (42) (17) –
cash flow hedge accounting* (523) 487 (16)
Per the cash flow statement 12 414 10 888 10 272
* As described in the chief financial officer’s review, the group hedges its exposure to foreign currency risk in respect of its capital projects. This is
done primarily by means of forward exchange contracts. Cash flow hedge accounting is applied to these hedging transactions and accordingly,
any gain or loss realised on these contracts is adjusted against the underlying item of property, plant and equipment.
Further detail of additions is provided in the chief financial officer’s review on page 10.
2005 2004 2003
for the year ended 30 June Rm Rm Rm
Additional disclosuresLeased assets
Carrying value of capitalised leased assets 661 704 397
Finance lease additions included in additions above 288 136 462
Replacement information
Estimated replacement cost of property, plant and equipment 224 289 221 670 213 749
Cost of assets not replaceable 2 127 2 285 1 759
Cost price of fully depreciated assets 8 183 7 981 7 367
Carrying value of assets held retired from active use 37 221 196
Carrying value of assets pledged as security for liabilities 8 445 13 561 8 676
Depreciation rates
Buildings and improvements 2 – 5%
Plant 4 – 25%
Equipment 10 – 33%
Vehicles 20 – 33%
Coal mining assets 7 %
62 notes to the financial statements
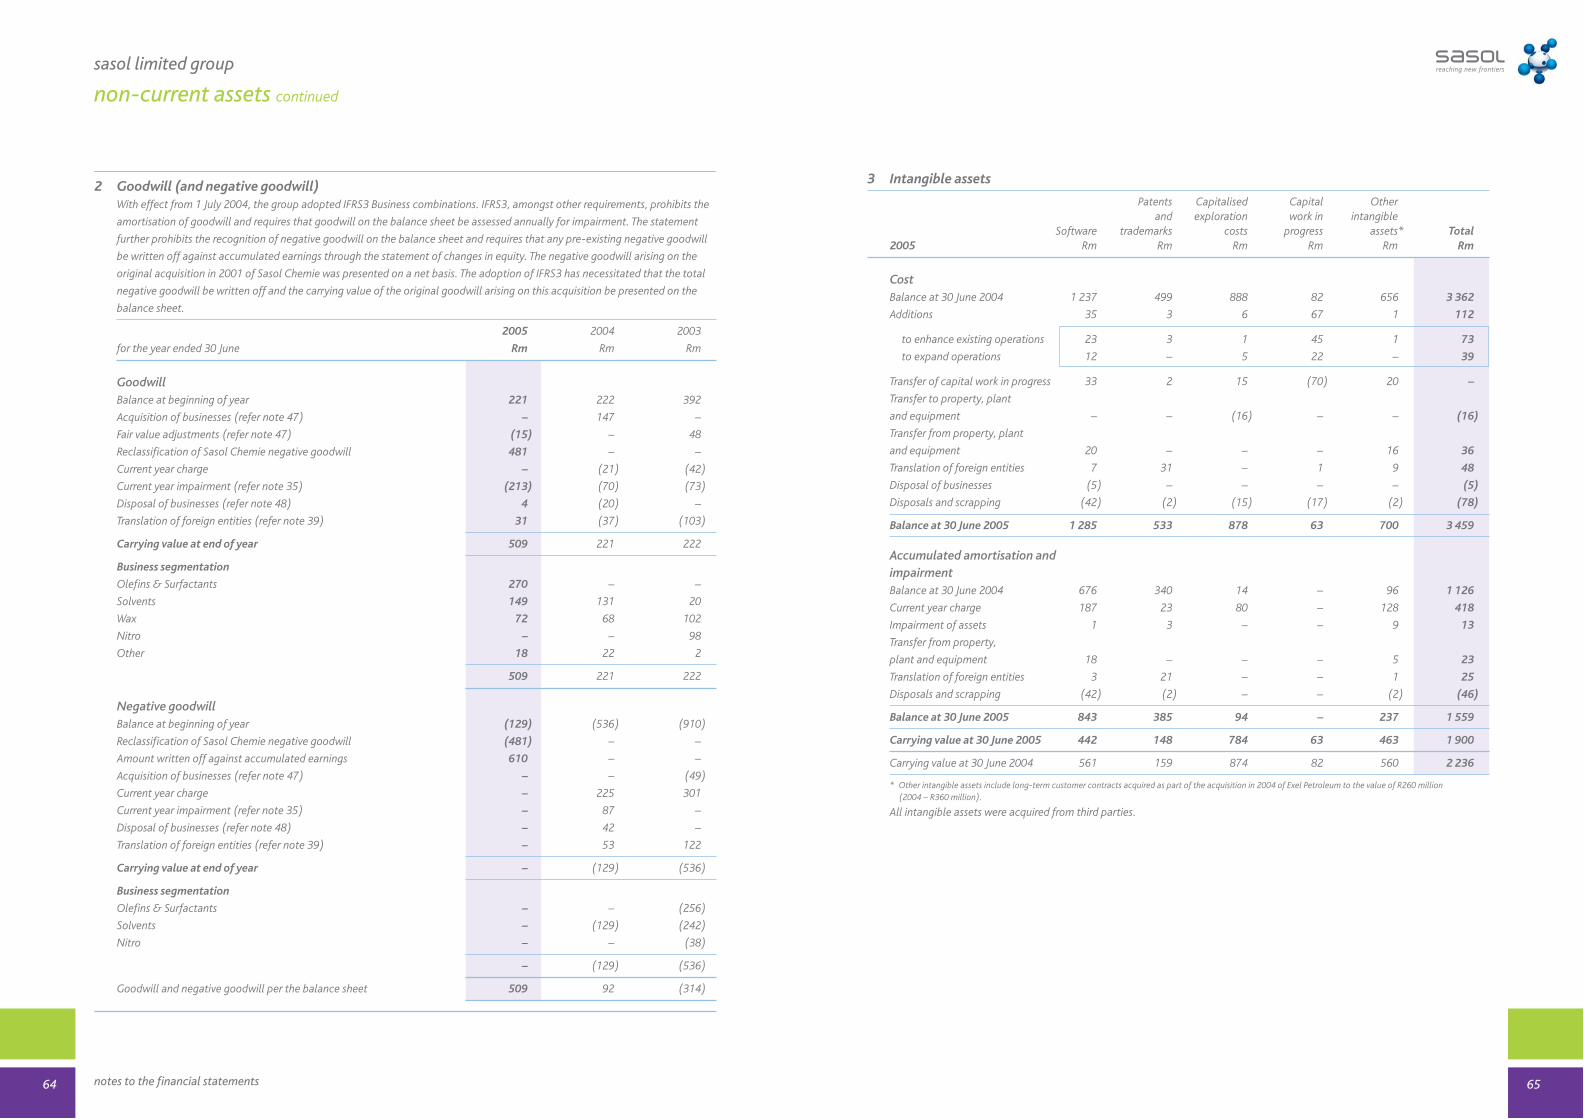
3 Intangible assets
Patents Capitalised Capital Otherand exploration work in intangible
Software trademarks costs progress assets* Total2005 Rm Rm Rm Rm Rm Rm
CostBalance at 30 June 2004 1 237 499 888 82 656 3 362
Additions 35 3 6 67 1 112
to enhance existing operations 23 3 1 45 1 73
to expand operations 12 – 5 22 – 39
Transfer of capital work in progress 33 2 15 (70) 20 –
Transfer to property, plant
and equipment – – (16) – – (16)
Transfer from property, plant
and equipment 20 – – – 16 36
Translation of foreign entities 7 31 – 1 9 48
Disposal of businesses (5) – – – – (5)
Disposals and scrapping (42) (2) (15) (17) (2) (78)
Balance at 30 June 2005 1 285 533 878 63 700 3 459
Accumulated amortisation and impairmentBalance at 30 June 2004 676 340 14 – 96 1 126
Current year charge 187 23 80 – 128 418
Impairment of assets 1 3 – – 9 13
Transfer from property,
plant and equipment 18 – – – 5 23
Translation of foreign entities 3 21 – – 1 25
Disposals and scrapping (42) (2) – – (2) (46)
Balance at 30 June 2005 843 385 94 – 237 1 559
Carrying value at 30 June 2005 442 148 784 63 463 1 900
Carrying value at 30 June 2004 561 159 874 82 560 2 236
* Other intangible assets include long-term customer contracts acquired as part of the acquisition in 2004 of Exel Petroleum to the value of R260 million (2004 – R360 million).
All intangible assets were acquired from third parties.
65
sasol limited group
non-current assets continued
2 Goodwill (and negative goodwill)With effect from 1 July 2004, the group adopted IFRS3 Business combinations. IFRS3, amongst other requirements, prohibits the
amortisation of goodwill and requires that goodwill on the balance sheet be assessed annually for impairment. The statement
further prohibits the recognition of negative goodwill on the balance sheet and requires that any pre-existing negative goodwill
be written off against accumulated earnings through the statement of changes in equity. The negative goodwill arising on the
original acquisition in 2001 of Sasol Chemie was presented on a net basis. The adoption of IFRS3 has necessitated that the total
negative goodwill be written off and the carrying value of the original goodwill arising on this acquisition be presented on the
balance sheet.
2005 2004 2003
for the year ended 30 June Rm Rm Rm
GoodwillBalance at beginning of year 221 222 392
Acquisition of businesses (refer note 47) – 147 –
Fair value adjustments (refer note 47) (15) – 48
Reclassification of Sasol Chemie negative goodwill 481 – –
Current year charge – (21) (42)
Current year impairment (refer note 35) (213) (70) (73)
Disposal of businesses (refer note 48) 4 (20) –
Translation of foreign entities (refer note 39) 31 (37) (103)
Carrying value at end of year 509 221 222
Business segmentation
Olefins & Surfactants 270 – –
Solvents 149 131 20
Wax 72 68 102
Nitro – – 98
Other 18 22 2
509 221 222
Negative goodwillBalance at beginning of year (129) (536) (910)
Reclassification of Sasol Chemie negative goodwill (481) – –
Amount written off against accumulated earnings 610 – –
Acquisition of businesses (refer note 47) – – (49)
Current year charge – 225 301
Current year impairment (refer note 35) – 87 –
Disposal of businesses (refer note 48) – 42 –
Translation of foreign entities (refer note 39) – 53 122
Carrying value at end of year – (129) (536)
Business segmentation
Olefins & Surfactants – – (256)
Solvents – (129) (242)
Nitro – – (38)
– (129) (536)
Goodwill and negative goodwill per the balance sheet 509 92 (314)
64 notes to the financial statements

2005 2004 2003
for the year ended 30 June Rm Rm Rm
3 Intangible assets (continued)
Additions to intangible assetsTo enhance existing operations 73 156 377
To expand operations 39 374 319
Per the cash flow statement 112 530 696
Cost price of fully amortised assets still in use 353 332 117
Amortisation ratesSoftware 33%
Patents and trademarks 20%
Capitalised exploration units-of-
production
Estimated future aggregate amortisation per annumWithin one year 400 599 436
One to two years 370 416 388
Two to three years 264 332 206
Three to four years 229 150 70
Four to five years 210 142 80
More than five years 427 597 871
1 900 2 236 2 051
Capital commitmentsCapital commitments include all projects for which specific board
approval has been obtained. Projects still under investigation for which
specific board approvals have not yet been obtained are excluded from
the following.
Authorised and contracted for 200 145 1 199
Authorised but not yet contracted for 129 16 7
Less expenditure (49) (72) (987)
280 89 219
These capital commitments are in respect of subsidiaries only.
Funding
Capital expenditure will be financed from funds generated out of normal business operations and existing borrowing facilities.
67
sasol limited group
non-current assets continued
2005 2004 2003
for the year ended 30 June Rm Rm Rm
3 Intangible assets (continued)
CostBalance at beginning of year 3 362 2 820 2 587
Acquisition of businesses (refer note 47) – 566 2
Additions
to enhance existing operations 73 156 377
to expand operations 39 374 319
Borrowing costs capitalised – – 8
Net transfer from/(to) property, plant and equipment (refer note 1) 20 (180) (34)
Translation of foreign entities (refer note 39) 48 (99) (195)
Disposal of businesses (refer note 48) (5) (16) –
Disposals and scrapping (78) (259) (244)
Balance at end of year 3 459 3 362 2 820
Comprising
Software 1 285 1 237 1 083
Patents and trademarks 533 499 644
Capitalised exploration 878 888 653
Capital work in progress 63 82 424
Other intangible assets 700 656 16
3 459 3 362 2 820
Accumulated amortisation and impairmentBalance at beginning of year 1 126 769 733
Acquisition of businesses (refer note 47) – – 2
Current year charge (refer note 29) 418 502 314
Impairment of assets (refer note 35) 13 13 5
Net transfer from/(to) property, plant and equipment (refer note 1) 23 (27) 24
Translation of foreign entities (refer note 39) 25 (54) (87)
Disposal of businesses (refer note 48) – (10) –
Disposals and scrapping (46) (67) (222)
Balance at end of year 1 559 1 126 769
Comprising
Software 843 676 361
Patents and trademarks 385 340 376
Capitalised exploration 94 14 29
Other intangible assets 237 96 3
1 559 1 126 769
Carrying valueSoftware 442 561 722
Patents and trademarks 148 159 268
Capitalised exploration 784 874 624
Capital work in progress 63 82 424
Other intangible assets 463 560 13
1 900 2 236 2 051
66 notes to the financial statements
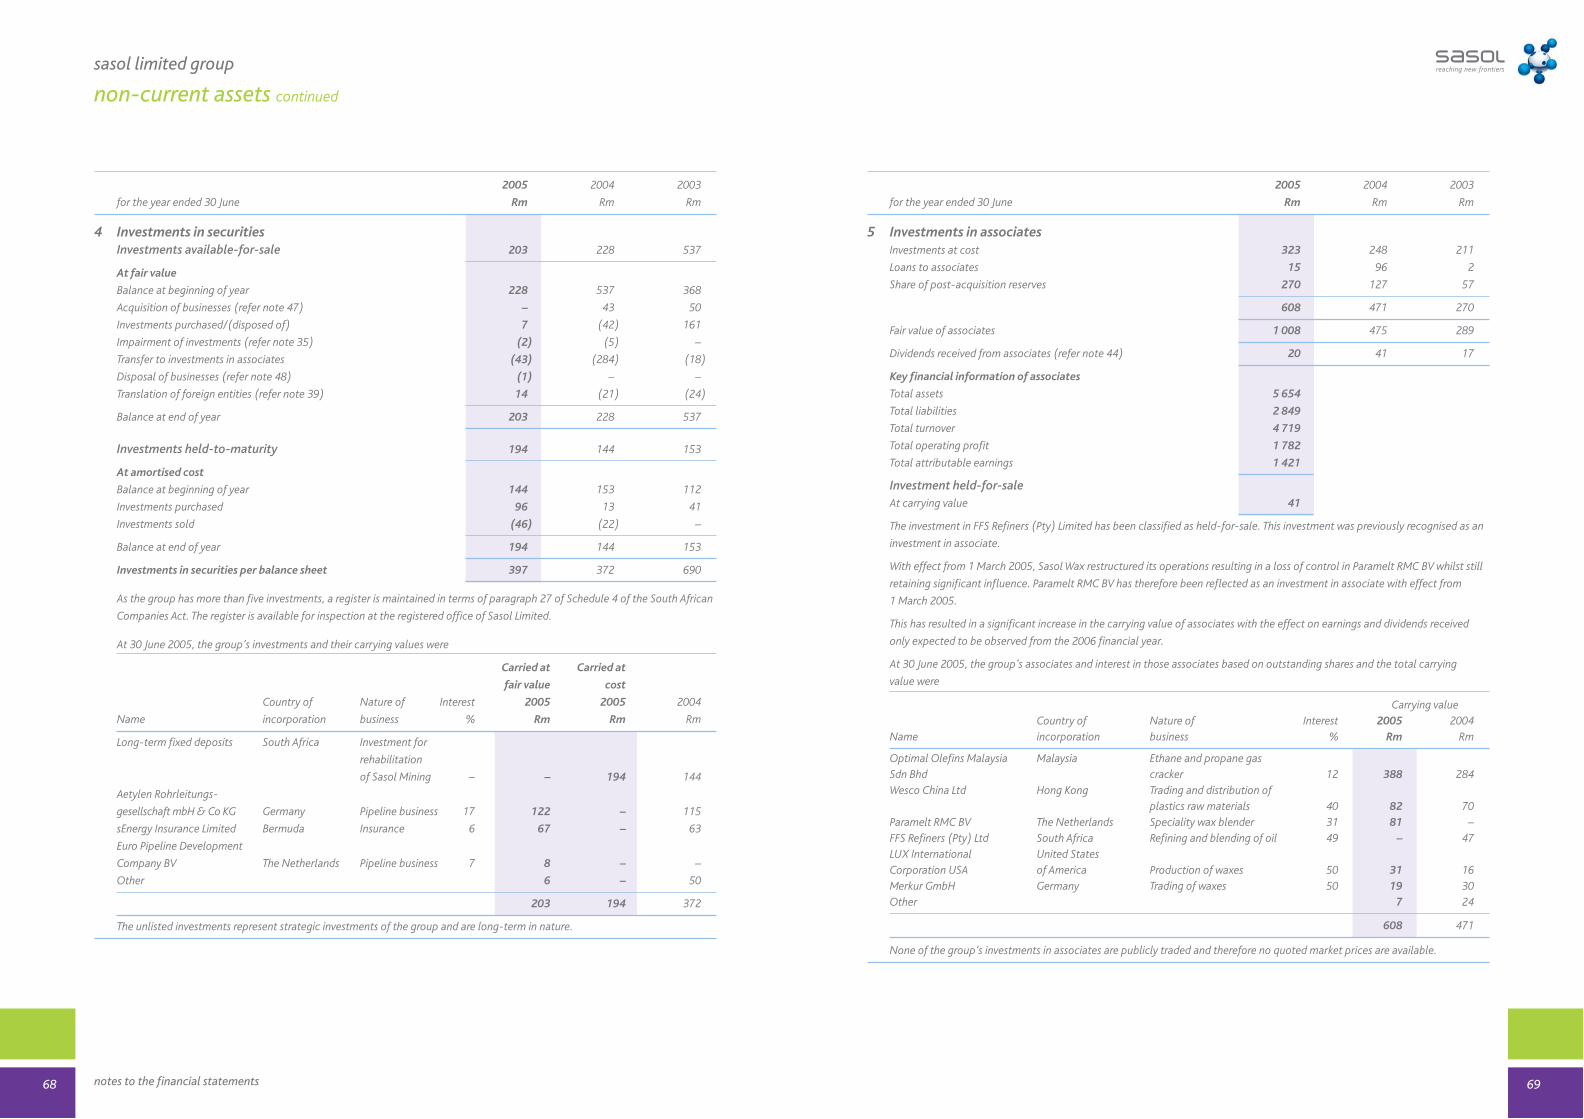
2005 2004 2003
for the year ended 30 June Rm Rm Rm
5 Investments in associatesInvestments at cost 323 248 211
Loans to associates 15 96 2
Share of post-acquisition reserves 270 127 57
608 471 270
Fair value of associates 1 008 475 289
Dividends received from associates (refer note 44) 20 41 17
Key financial information of associates
Total assets 5 654
Total liabilities 2 849
Total turnover 4 719
Total operating profit 1 782
Total attributable earnings 1 421
Investment held-for-saleAt carrying value 41
The investment in FFS Refiners (Pty) Limited has been classified as held-for-sale. This investment was previously recognised as an
investment in associate.
With effect from 1 March 2005, Sasol Wax restructured its operations resulting in a loss of control in Paramelt RMC BV whilst still
retaining significant influence. Paramelt RMC BV has therefore been reflected as an investment in associate with effect from
1 March 2005.
This has resulted in a significant increase in the carrying value of associates with the effect on earnings and dividends received
only expected to be observed from the 2006 financial year.
At 30 June 2005, the group’s associates and interest in those associates based on outstanding shares and the total carrying
value were
Carrying value Country of Nature of Interest 2005 2004
Name incorporation business % Rm Rm
Optimal Olefins Malaysia Malaysia Ethane and propane gas Sdn Bhd cracker 12 388 284 Wesco China Ltd Hong Kong Trading and distribution of
plastics raw materials 40 82 70Paramelt RMC BV The Netherlands Speciality wax blender 31 81 – FFS Refiners (Pty) Ltd South Africa Refining and blending of oil 49 – 47LUX International United StatesCorporation USA of America Production of waxes 50 31 16Merkur GmbH Germany Trading of waxes 50 19 30Other 7 24
608 471
None of the group’s investments in associates are publicly traded and therefore no quoted market prices are available.
69
sasol limited group
non-current assets continued
2005 2004 2003
for the year ended 30 June Rm Rm Rm
4 Investments in securitiesInvestments available-for-sale 203 228 537
At fair value
Balance at beginning of year 228 537 368
Acquisition of businesses (refer note 47) – 43 50
Investments purchased/(disposed of) 7 (42) 161
Impairment of investments (refer note 35) (2) (5) –
Transfer to investments in associates (43) (284) (18)
Disposal of businesses (refer note 48) (1) – –
Translation of foreign entities (refer note 39) 14 (21) (24)
Balance at end of year 203 228 537
Investments held-to-maturity 194 144 153
At amortised cost
Balance at beginning of year 144 153 112
Investments purchased 96 13 41
Investments sold (46) (22) –
Balance at end of year 194 144 153
Investments in securities per balance sheet 397 372 690
As the group has more than five investments, a register is maintained in terms of paragraph 27 of Schedule 4 of the South African
Companies Act. The register is available for inspection at the registered office of Sasol Limited.
At 30 June 2005, the group’s investments and their carrying values were
Carried at Carried at
fair value cost
Country of Nature of Interest 2005 2005 2004
Name incorporation business % Rm Rm Rm
Long-term fixed deposits South Africa Investment for
rehabilitation
of Sasol Mining – – 194 144
Aetylen Rohrleitungs-
gesellschaft mbH & Co KG Germany Pipeline business 17 122 – 115
sEnergy Insurance Limited Bermuda Insurance 6 67 – 63
Euro Pipeline Development
Company BV The Netherlands Pipeline business 7 8 – –
Other 6 – 50
203 194 372
The unlisted investments represent strategic investments of the group and are long-term in nature.
68 notes to the financial statements
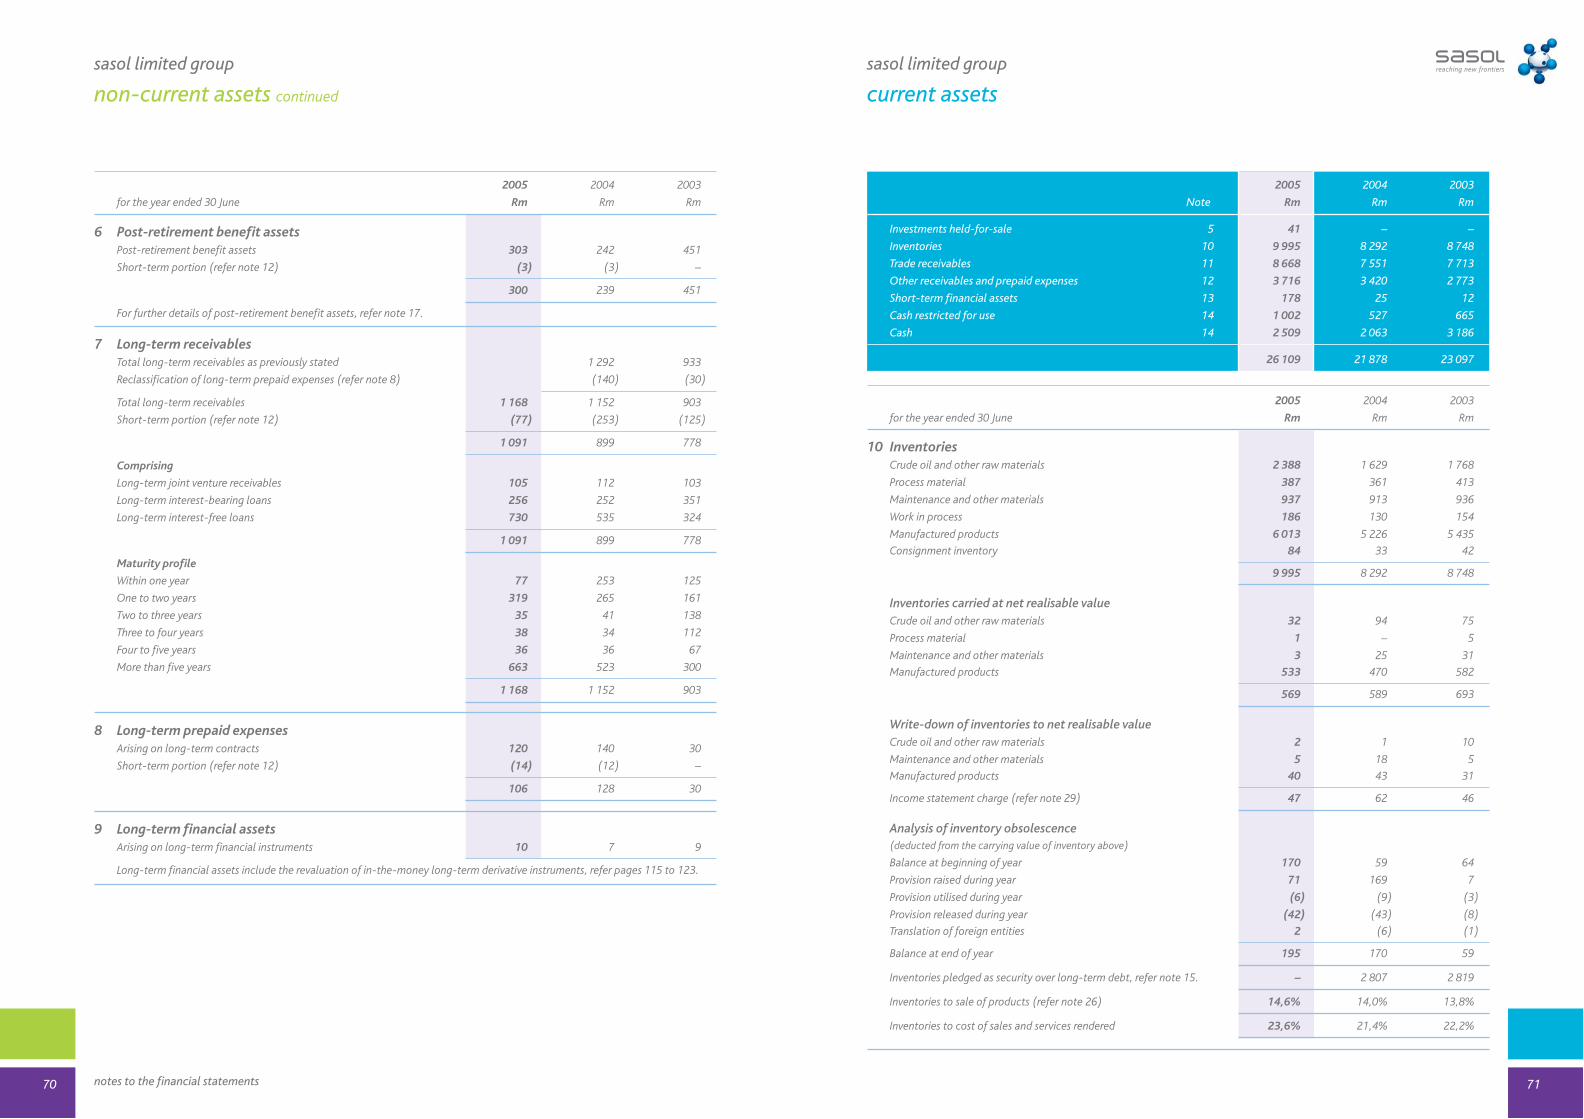
2005 2004 2003
Note Rm Rm Rm
Investments held-for-sale 5 41 – –
Inventories 10 9 995 8 292 8 748
Trade receivables 11 8 668 7 551 7 713
Other receivables and prepaid expenses 12 3 716 3 420 2 773
Short-term financial assets 13 178 25 12
Cash restricted for use 14 1 002 527 665
Cash 14 2 509 2 063 3 186
26 109 21 878 23 097
2005 2004 2003
for the year ended 30 June Rm Rm Rm
10 InventoriesCrude oil and other raw materials 2 388 1 629 1 768
Process material 387 361 413
Maintenance and other materials 937 913 936
Work in process 186 130 154
Manufactured products 6 013 5 226 5 435
Consignment inventory 84 33 42
9 995 8 292 8 748
Inventories carried at net realisable valueCrude oil and other raw materials 32 94 75
Process material 1 – 5
Maintenance and other materials 3 25 31
Manufactured products 533 470 582
569 589 693
Write-down of inventories to net realisable valueCrude oil and other raw materials 2 1 10
Maintenance and other materials 5 18 5
Manufactured products 40 43 31
Income statement charge (refer note 29) 47 62 46
Analysis of inventory obsolescence(deducted from the carrying value of inventory above)
Balance at beginning of year 170 59 64
Provision raised during year 71 169 7
Provision utilised during year (6) (9) (3)
Provision released during year (42) (43) (8)
Translation of foreign entities 2 (6) (1)
Balance at end of year 195 170 59
Inventories pledged as security over long-term debt, refer note 15. – 2 807 2 819
Inventories to sale of products (refer note 26) 14,6% 14,0% 13,8%
Inventories to cost of sales and services rendered 23,6% 21,4% 22,2%
71
sasol limited group
non-current assets continued
2005 2004 2003
for the year ended 30 June Rm Rm Rm
6 Post-retirement benefit assetsPost-retirement benefit assets 303 242 451
Short-term portion (refer note 12) (3) (3) –
300 239 451
For further details of post-retirement benefit assets, refer note 17.
7 Long-term receivablesTotal long-term receivables as previously stated 1 292 933
Reclassification of long-term prepaid expenses (refer note 8) (140) (30)
Total long-term receivables 1 168 1 152 903
Short-term portion (refer note 12) (77) (253) (125)
1 091 899 778
Comprising
Long-term joint venture receivables 105 112 103
Long-term interest-bearing loans 256 252 351
Long-term interest-free loans 730 535 324
1 091 899 778
Maturity profile
Within one year 77 253 125
One to two years 319 265 161
Two to three years 35 41 138
Three to four years 38 34 112
Four to five years 36 36 67
More than five years 663 523 300
1 168 1 152 903
8 Long-term prepaid expensesArising on long-term contracts 120 140 30
Short-term portion (refer note 12) (14) (12) –
106 128 30
9 Long-term financial assetsArising on long-term financial instruments 10 7 9
Long-term financial assets include the revaluation of in-the-money long-term derivative instruments, refer pages 115 to 123.
70
sasol limited group
current assets
notes to the financial statements
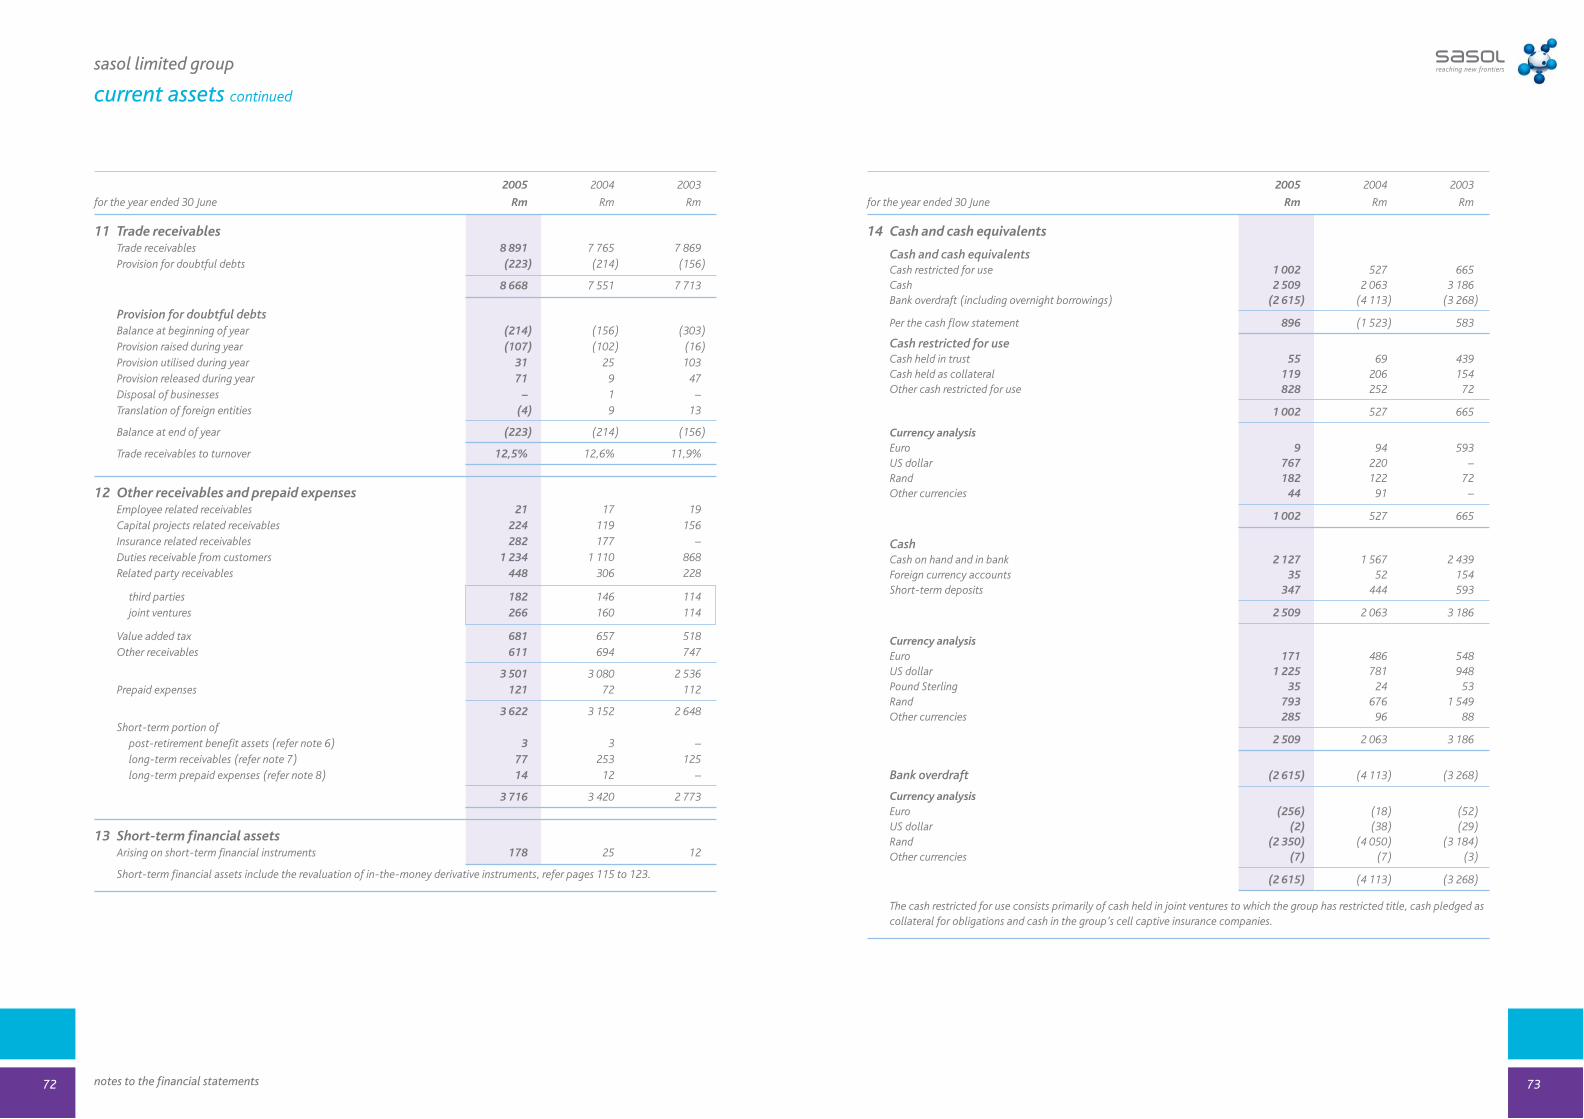
2005 2004 2003
for the year ended 30 June Rm Rm Rm
14 Cash and cash equivalents
Cash and cash equivalentsCash restricted for use 1 002 527 665Cash 2 509 2 063 3 186Bank overdraft (including overnight borrowings) (2 615) (4 113) (3 268)
Per the cash flow statement 896 (1 523) 583
Cash restricted for useCash held in trust 55 69 439Cash held as collateral 119 206 154Other cash restricted for use 828 252 72
1 002 527 665
Currency analysisEuro 9 94 593US dollar 767 220 –Rand 182 122 72Other currencies 44 91 –
1 002 527 665
CashCash on hand and in bank 2 127 1 567 2 439Foreign currency accounts 35 52 154Short-term deposits 347 444 593
2 509 2 063 3 186
Currency analysisEuro 171 486 548US dollar 1 225 781 948Pound Sterling 35 24 53Rand 793 676 1 549Other currencies 285 96 88
2 509 2 063 3 186
Bank overdraft (2 615) (4 113) (3 268)
Currency analysisEuro (256) (18) (52)US dollar (2) (38) (29)Rand (2 350) (4 050) (3 184)Other currencies (7) (7) (3)
(2 615) (4 113) (3 268)
The cash restricted for use consists primarily of cash held in joint ventures to which the group has restricted title, cash pledged ascollateral for obligations and cash in the group’s cell captive insurance companies.
73
sasol limited group
current assets continued
2005 2004 2003
for the year ended 30 June Rm Rm Rm
11 Trade receivablesTrade receivables 8 891 7 765 7 869Provision for doubtful debts (223) (214) (156)
8 668 7 551 7 713
Provision for doubtful debtsBalance at beginning of year (214) (156) (303)Provision raised during year (107) (102) (16)Provision utilised during year 31 25 103Provision released during year 71 9 47Disposal of businesses – 1 –Translation of foreign entities (4) 9 13
Balance at end of year (223) (214) (156)
Trade receivables to turnover 12,5% 12,6% 11,9%
12 Other receivables and prepaid expensesEmployee related receivables 21 17 19Capital projects related receivables 224 119 156Insurance related receivables 282 177 –Duties receivable from customers 1 234 1 110 868Related party receivables 448 306 228
third parties 182 146 114joint ventures 266 160 114
Value added tax 681 657 518Other receivables 611 694 747
3 501 3 080 2 536Prepaid expenses 121 72 112
3 622 3 152 2 648Short-term portion of
post-retirement benefit assets (refer note 6) 3 3 –long-term receivables (refer note 7) 77 253 125long-term prepaid expenses (refer note 8) 14 12 –
3 716 3 420 2 773
13 Short-term financial assetsArising on short-term financial instruments 178 25 12
Short-term financial assets include the revaluation of in-the-money derivative instruments, refer pages 115 to 123.
72 notes to the financial statements

2005 2004 2003
Note Rm Rm Rm
Long-term debt 15 12 951 9 110 4 581
Long-term provisions 16 2 954 2 362 2 486
Post-retirement benefit obligations 17 2 970 2 724 2 589
Long-term deferred income 18 763 237 96
Deferred tax liability 19 6 286 5 768 6 113
25 924 20 201 15 865
2005 2004 2003
for the year ended 30 June Rm Rm Rm
15 Long-term debtTotal long-term debt 13 966 9 677 5 479
Short-term portion (refer note 20) (1 015) (567) (898)
12 951 9 110 4 581
ComprisingSecured loans 5 598 4 668 3 522
Variable rate redeemable cumulative preference shares of subsidiaries 117 618 887
Finance leases 686 589 339
Unsecured loans 7 565 3 802 731
13 966 9 677 5 479
ReconciliationBalance at beginning of year 9 677 5 479 6 264
Acquisition of businesses (refer note 47) – 358 102
Loans raised 6 586 7 379 1 406
Loans repaid (2 421) (2 993) (1 284)
Effect of cash flow hedge accounting (43) 5 –
Disposal of businesses (refer note 48) – (33) –
Translation of foreign entities (refer note 39) 167 (518) (1 009)
Balance at end of year 13 966 9 677 5 479
Currency analysisEuro 3 415 1 189 2 222
US dollar 2 679 2 536 1 453
Rand 7 579 5 952 1 686
Other 293 – 118
13 966 9 677 5 479
Interest-bearing statusInterest-bearing debt 13 965 9 637 5 431
Non-interest bearing debt 1 40 48
13 966 9 677 5 479
75
sasol limited group
non-current liabilities
74
2005 2004 2003
for the year ended 30 June Rm Rm Rm
15 Long-term debt (continued)
Maturity profile
Within one year 1 015 567 898
One to two years 842 696 1 024
Two to three years 2 930 1 159 899
Three to four years 983 3 310 988
Four to five years 3 355 703 819
More than five years 4 841 3 242 851
13 966 9 677 5 479
Related party long-term debtThird parties 109 130 84
Joint ventures 80 93 19
189 223 103
Business segmentationFinancing 4 790
Gas 2 178
Synfuels International 1 613
Liquid Fuels Business 1 506
Petroleum International 1 172
Polymers 791
Solvents 762
Other 139
12 951
In terms of Sasol Limited’s Articles of Association, the group’s borrowing powers are limited to twice the sum of its stated capital
and reserves (2005 – R87 billion and 2004 – R70 billion).
notes to the financial statements
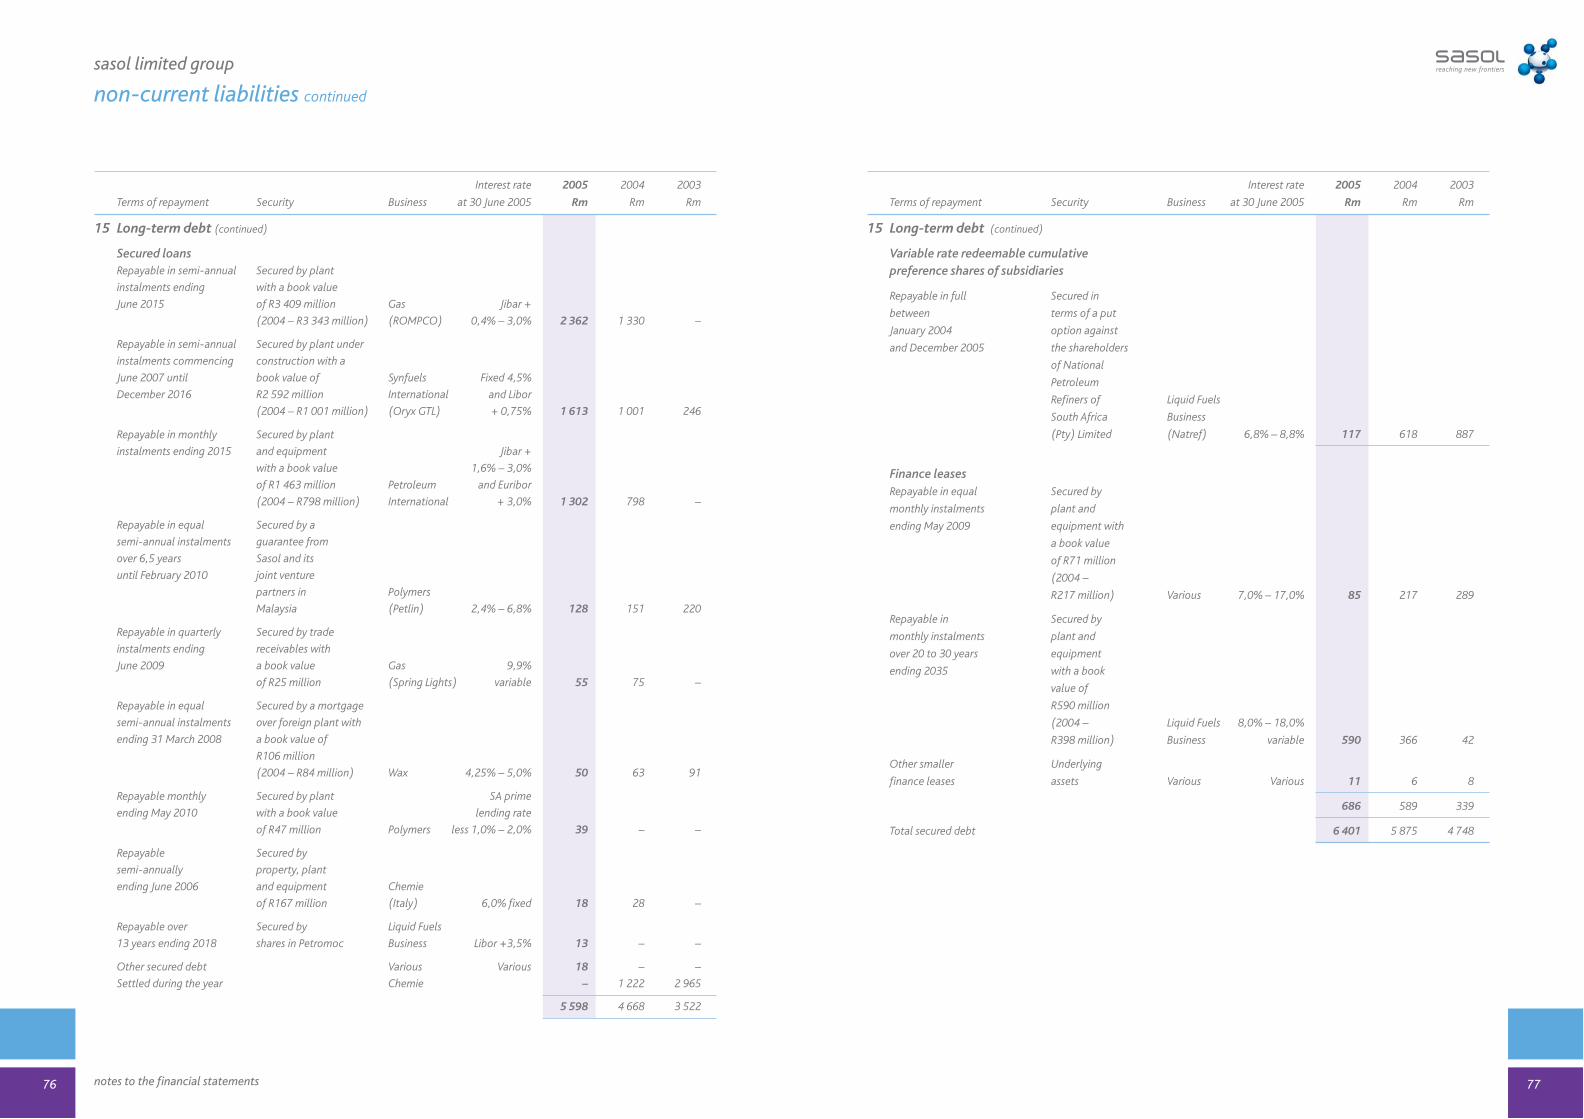
Interest rate 2005 2004 2003
Terms of repayment Security Business at 30 June 2005 Rm Rm Rm
15 Long-term debt (continued)
Secured loansRepayable in semi-annual Secured by plant
instalments ending with a book value
June 2015 of R3 409 million Gas Jibar +
(2004 – R3 343 million) (ROMPCO) 0,4% – 3,0% 2 362 1 330 –
Repayable in semi-annual Secured by plant under
instalments commencing construction with a
June 2007 until book value of Synfuels Fixed 4,5%
December 2016 R2 592 million International and Libor
(2004 – R1 001 million) (Oryx GTL) + 0,75% 1 613 1 001 246
Repayable in monthly Secured by plant
instalments ending 2015 and equipment Jibar +
with a book value 1,6% – 3,0%
of R1 463 million Petroleum and Euribor
(2004 – R798 million) International + 3,0% 1 302 798 –
Repayable in equal Secured by a
semi-annual instalments guarantee from
over 6,5 years Sasol and its
until February 2010 joint venture
partners in Polymers
Malaysia (Petlin) 2,4% – 6,8% 128 151 220
Repayable in quarterly Secured by trade
instalments ending receivables with
June 2009 a book value Gas 9,9%
of R25 million (Spring Lights) variable 55 75 –
Repayable in equal Secured by a mortgage
semi-annual instalments over foreign plant with
ending 31 March 2008 a book value of
R106 million
(2004 – R84 million) Wax 4,25% – 5,0% 50 63 91
Repayable monthly Secured by plant SA prime
ending May 2010 with a book value lending rate
of R47 million Polymers less 1,0% – 2,0% 39 – –
Repayable Secured by
semi-annually property, plant
ending June 2006 and equipment Chemie
of R167 million (Italy) 6,0% fixed 18 28 –
Repayable over Secured by Liquid Fuels
13 years ending 2018 shares in Petromoc Business Libor +3,5% 13 – –
Other secured debt Various Various 18 – –
Settled during the year Chemie – 1 222 2 965
5 598 4 668 3 522
77
sasol limited group
non-current liabilities continued
76
Interest rate 2005 2004 2003
Terms of repayment Security Business at 30 June 2005 Rm Rm Rm
15 Long-term debt (continued)
Variable rate redeemable cumulative preference shares of subsidiaries
Repayable in full Secured in
between terms of a put
January 2004 option against
and December 2005 the shareholders
of National
Petroleum
Refiners of Liquid Fuels
South Africa Business
(Pty) Limited (Natref) 6,8% – 8,8% 117 618 887
Finance leasesRepayable in equal Secured by
monthly instalments plant and
ending May 2009 equipment with
a book value
of R71 million
(2004 –
R217 million) Various 7,0% – 17,0% 85 217 289
Repayable in Secured by
monthly instalments plant and
over 20 to 30 years equipment
ending 2035 with a book
value of
R590 million
(2004 – Liquid Fuels 8,0% – 18,0%
R398 million) Business variable 590 366 42
Other smaller Underlying
finance leases assets Various Various 11 6 8
686 589 339
Total secured debt 6 401 5 875 4 748
notes to the financial statements

Interest rate 2005 2004 2003Terms of repayment Business at 30 June 2005 Rm Rm Rm
15 Long-term debt (continued)
Unsecured liabilities
Repayable on maturity in June 2010 Financing 3,375% fixed 2 407 – –
Repayable in August 2007 Financing 10,5% fixed 1 993 1 989 –
Repayable in semi-annual instalments Solvents Libor + 0,13%
ending December 2013 (Acrylates) & Jibar + 1,15% 758 792 –
Repayable in semi-annual Liquid Fuels
instalments ending Business 8,0% – 8,7%
December 2015 (Natref) variable 603 165 –
Repayable in May 2015 Polymers
(Arya) 2,6% 600 – –
Repayable in June 2013 Financing Libor +
0,13% 390 363 –
Repayable in semi-annual Liquid Fuels
instalments ending Business
January 2014 (Natref) 11,55% fixed 262 – –
Repayable quarterly ending May 2008 Liquid Fuels SA prime
Business lending rate 146 – –
Bankers acceptance with instalments Polymers
every 180 days (Petlin) 2,8% – 4,3% 133 124 –
Repayment terms not specified Liquid Fuels
Business (Natref) 8,0% fixed 63 63 48
Purchase consideration repayable in four
equal annual amounts until December 2006 Wax 2,2% variable 37 54 84
Repayable December 2011 Mining Variable 28 32 35Other Other Various 145 220 564
Total unsecured debt 7 565 3 802 731
Total long-term debt 13 966 9 677 5 479Repayable within one year included in short-term debt (1 015) (567) (898)
12 951 9 110 4 581
79notes to the financial statements
sasol limited group
non-current liabilities continued
78
Banking facilities and debt arrangements at 30 June 2005
Rand
equivalent Utilisation
Facility Expiry date Currency Rm Rm
Sasol Financing Uncommitted facilitiesCommercial banking facilities Various (short-term) Rand 11 880 2 328
Commercial paper programme None Rand 6 000 1 521
Committed facilityRevolving credit facility (syndicated) May 2008 Euro 3 226 663
Debt arrangementsRSA Bond August 2007 Rand 2 000 1 993
Japan Bank for International Cooperation June 2013 US dollar 390 390
Sasol Financing InternationalUncommitted facilitiesCommercial banking facilities Various (short-term) Euro 473 2
Debt arrangementEurobond June 2010 Euro 2 420 2 407
Other Sasol businessesAsset based financeRepublic of Mozambique Pipeline
Investments Company (Pty) Limited December 2015 Rand 2 362 2 362
Oryx GTL Limited (QSC) December 2015 US dollar 2 286 1 613
Sasol Petroleum Temane Limitada June 2015 Euro and rand 1 302 1 302
Debt arrangementsArya Sasol Polymer Company May 2015 Euro 1 564 728
National Petroleum Refiners of
South Africa (Pty) Limited Various Rand 1 491 982
Sasol Dia Acrylates (South Africa)
(Pty) Limited August 2006 US dollar and rand 984 750
Property finance leasesLiquid Fuels Business Various Rand 590 590
Other banking facilities and debt arrangements Various Various 2 329 1 235
39 297 18 866
ComprisingLong-term debt 12 951
Short-term debt 3 300
Bank overdraft (including overnight borrowings) 2 615
18 866
Financial covenantsCertain of the above facilities and debt arrangements are subject to financial covenants based on key financial ratios.
No events of default have occurred in the current financial year.

2005 2004 2003
for the year ended 30 June Rm Rm Rm
16 Long-term provisionsBalance at beginning of year 3 017 2 954 3 510
Acquisition of businesses (refer note 47) – – 12
Capitalised in property, plant and equipment (refer note 1) 42 77 83
Net income statement charge 744 511 55
increase for year 1 127 631 443
reversal of unutilised amounts (652) (143) (212)
effect of change in discount rate 92 (137) (227)
notional interest 177 160 51
Utilised during year (cash flow) (461) (359) (430)
Disposal of businesses (refer note 48) – (17) –
Translation of foreign entities (refer note 39) 72 (149) (276)
Balance at end of year 3 414 3 017 2 954
Less short-term portion (refer note 22) (460) (655) (468)
Long-term provisions 2 954 2 362 2 486
Comprising
Rehabilitation and asset retirement 2 634 2 401 2 317
Other 780 616 637
3 414 3 017 2 954
Estimated undiscounted obligation 14 735
Expected timing of utilisation of provision
Within one year 460 655 468
One to two years 295 448 393
Two to three years 243 173 187
Three to four years 131 170 158
Four to five years 353 98 149
More than five years 1 932 1 473 1 599
3 414 3 017 2 954
In accordance with the group’s published environmental policy and applicable legislation, a provision for rehabilitation is
recognised when the obligation arises.
The rehabilitation obligation includes estimated costs for the rehabilitation of coal mining and petrochemical sites. The amount
provided is calculated based on currently available facts and applicable legislation. It is envisaged that, based on the current
information available, any additional liability in excess of the amounts provided will not have a material adverse effect on its
financial condition, liquidity or cash flow.
The significant increase in the reversal of unutilised amounts is primarily attributable to the change in estimated useful lives of
property, plant and equipment as the rehabilitation provision is estimated based on the average remaining useful lives of the
related assets.
Other includes provisions in respect of personnel, rebates, discounts and bonuses.
81notes to the financial statements
sasol limited group
non-current liabilities continued
80
Rehabili-
tation Other Total
2005 2005 2005
for the year ended 30 June Rm Rm Rm
16 Long-term provisions (continued)
Balance at beginning of year 2 401 616 3 017
Capitalised in property, plant and equipment (refer note 1) 41 1 42
Net income statement charge 350 394 744
increase for year 707 420 1 127
reversal of unutilised amounts (626) (26) (652)
effect of change in discount rate 92 – 92
notional interest 177 – 177
Utilised during year (cash flow) (181) (280) (461)
Translation of foreign entities (refer note 39) 23 49 72
Balance at end of year 2 634 780 3 414
2005 2004 2003
for the year ended 30 June Rm Rm Rm
17 Post-retirement benefit obligationsPost-retirement healthcare benefits 1 772 1 613 1 365
Pension benefits (foreign) 1 239 1 148 1 252
Total post-retirement benefit obligations 3 011 2 761 2 617
Less short-term portion
post-retirement healthcare benefits (refer note 22) (31) (22) (26)
pension benefits (foreign) (refer note 22) (10) (15) (2)
2 970 2 724 2 589
Post-retirement healthcare benefitsThe group provides post-retirement healthcare benefits to certain of its retirees, principally in South Africa and the United States
of America. The method of accounting and the frequency of valuations for determining the liability are similar to those used for
defined benefit pension plans.
South AfricaThe post-retirement benefit plan provides certain healthcare and life assurance benefits to South African employees hired prior
to 1 January 1998, who retire and satisfy the necessary requirements of the medical fund. Generally, medical coverage provides
for a specified percentage of most medical expenses, subject to preset rules and maximum amounts. The cost of providing these
contributions is shared with the retirees. The plan is unfunded. The accumulated post-retirement benefit obligation is accrued
over the employee’s working life until full eligibility age.
United States of AmericaCertain other healthcare and life assurance benefits are provided for personnel employed in the United States of America.
Generally, medical coverage pays a specified percentage of most medical expenses, subject to preset maximum amounts and
reduced for payments made by Medicare. The cost of providing these benefits is shared with the retirees. The plan is also unfunded.
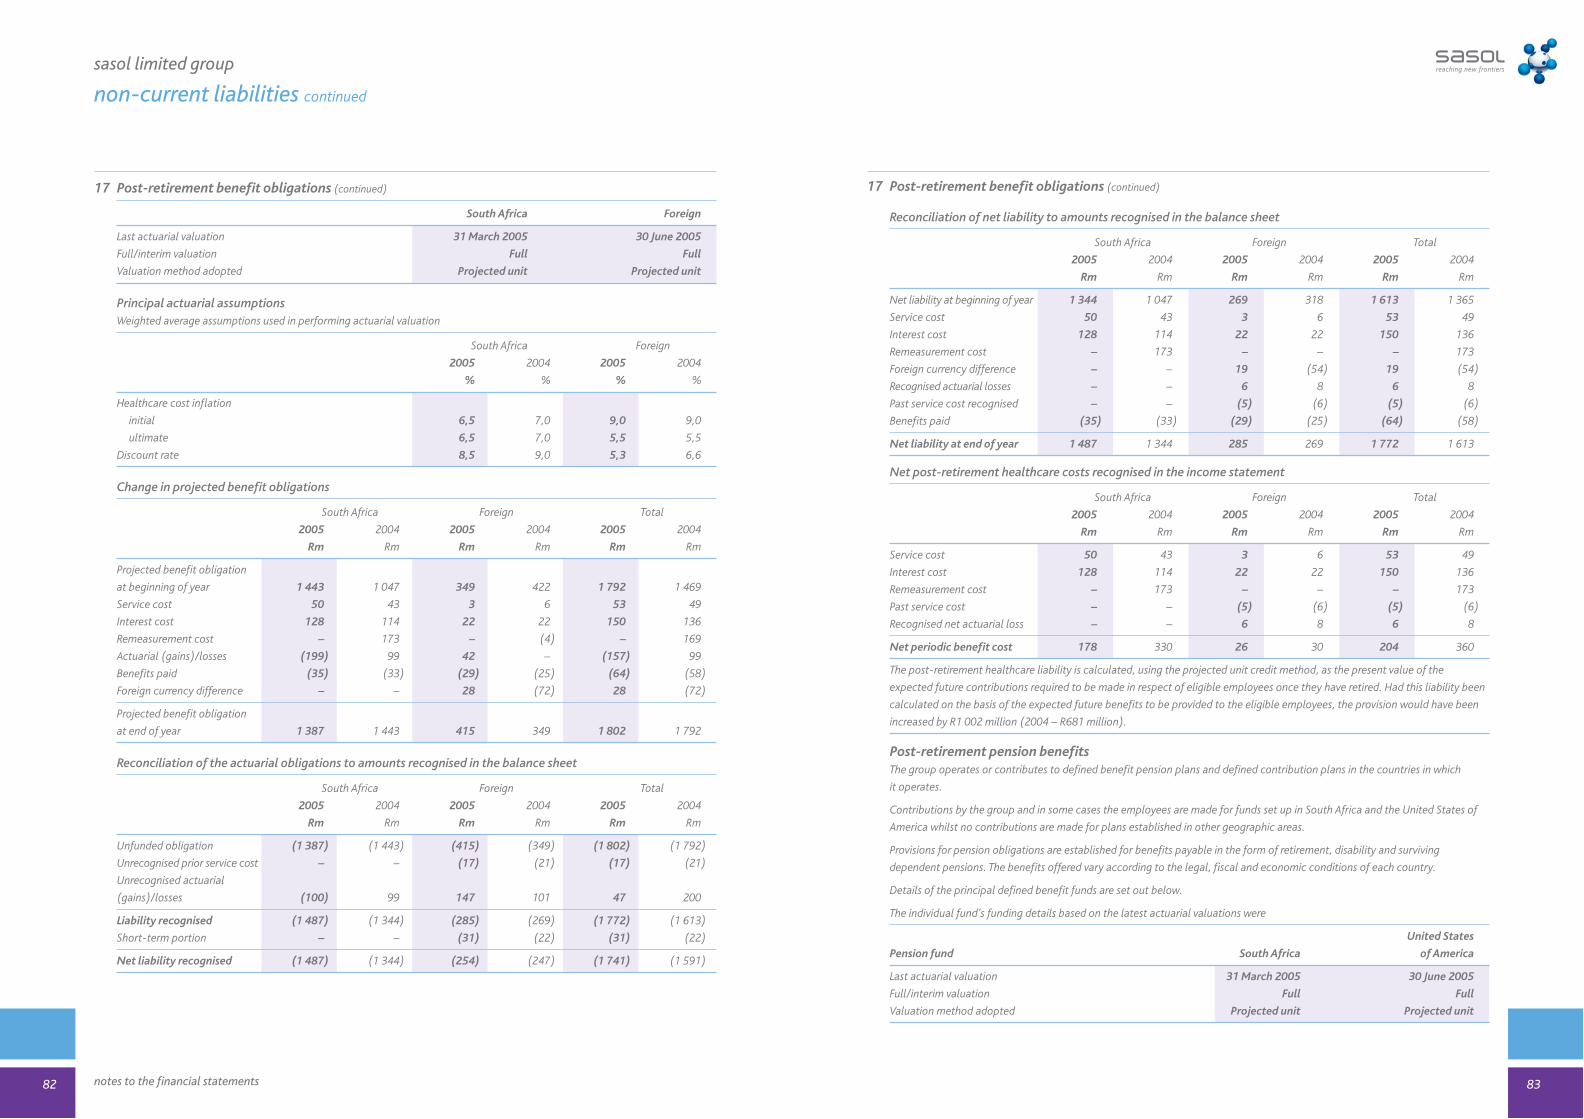
17 Post-retirement benefit obligations (continued)
South Africa Foreign
Last actuarial valuation 31 March 2005 30 June 2005
Full/interim valuation Full Full
Valuation method adopted Projected unit Projected unit
Principal actuarial assumptionsWeighted average assumptions used in performing actuarial valuation
South Africa Foreign
2005 2004 2005 2004
% % % %
Healthcare cost inflation
initial 6,5 7,0 9,0 9,0
ultimate 6,5 7,0 5,5 5,5
Discount rate 8,5 9,0 5,3 6,6
Change in projected benefit obligations
South Africa Foreign Total
2005 2004 2005 2004 2005 2004
Rm Rm Rm Rm Rm Rm
Projected benefit obligation
at beginning of year 1 443 1 047 349 422 1 792 1 469
Service cost 50 43 3 6 53 49
Interest cost 128 114 22 22 150 136
Remeasurement cost – 173 – (4) – 169
Actuarial (gains)/losses (199) 99 42 – (157) 99
Benefits paid (35) (33) (29) (25) (64) (58)
Foreign currency difference – – 28 (72) 28 (72)
Projected benefit obligation
at end of year 1 387 1 443 415 349 1 802 1 792
Reconciliation of the actuarial obligations to amounts recognised in the balance sheet
South Africa Foreign Total
2005 2004 2005 2004 2005 2004
Rm Rm Rm Rm Rm Rm
Unfunded obligation (1 387) (1 443) (415) (349) (1 802) (1 792)
Unrecognised prior service cost – – (17) (21) (17) (21)
Unrecognised actuarial
(gains)/losses (100) 99 147 101 47 200
Liability recognised (1 487) (1 344) (285) (269) (1 772) (1 613)
Short-term portion – – (31) (22) (31) (22)
Net liability recognised (1 487) (1 344) (254) (247) (1 741) (1 591)
83notes to the financial statements
sasol limited group
non-current liabilities continued
82
17 Post-retirement benefit obligations (continued)
Reconciliation of net liability to amounts recognised in the balance sheet
South Africa Foreign Total
2005 2004 2005 2004 2005 2004
Rm Rm Rm Rm Rm Rm
Net liability at beginning of year 1 344 1 047 269 318 1 613 1 365
Service cost 50 43 3 6 53 49
Interest cost 128 114 22 22 150 136
Remeasurement cost – 173 – – – 173
Foreign currency difference – – 19 (54) 19 (54)
Recognised actuarial losses – – 6 8 6 8
Past service cost recognised – – (5) (6) (5) (6)
Benefits paid (35) (33) (29) (25) (64) (58)
Net liability at end of year 1 487 1 344 285 269 1 772 1 613
Net post-retirement healthcare costs recognised in the income statement
South Africa Foreign Total
2005 2004 2005 2004 2005 2004
Rm Rm Rm Rm Rm Rm
Service cost 50 43 3 6 53 49
Interest cost 128 114 22 22 150 136
Remeasurement cost – 173 – – – 173
Past service cost – – (5) (6) (5) (6)
Recognised net actuarial loss – – 6 8 6 8
Net periodic benefit cost 178 330 26 30 204 360
The post-retirement healthcare liability is calculated, using the projected unit credit method, as the present value of the
expected future contributions required to be made in respect of eligible employees once they have retired. Had this liability been
calculated on the basis of the expected future benefits to be provided to the eligible employees, the provision would have been
increased by R1 002 million (2004 – R681 million).
Post-retirement pension benefitsThe group operates or contributes to defined benefit pension plans and defined contribution plans in the countries in which
it operates.
Contributions by the group and in some cases the employees are made for funds set up in South Africa and the United States of
America whilst no contributions are made for plans established in other geographic areas.
Provisions for pension obligations are established for benefits payable in the form of retirement, disability and surviving
dependent pensions. The benefits offered vary according to the legal, fiscal and economic conditions of each country.
Details of the principal defined benefit funds are set out below.
The individual fund’s funding details based on the latest actuarial valuations were
United States
Pension fund South Africa of America
Last actuarial valuation 31 March 2005 30 June 2005
Full/interim valuation Full Full
Valuation method adopted Projected unit Projected unit
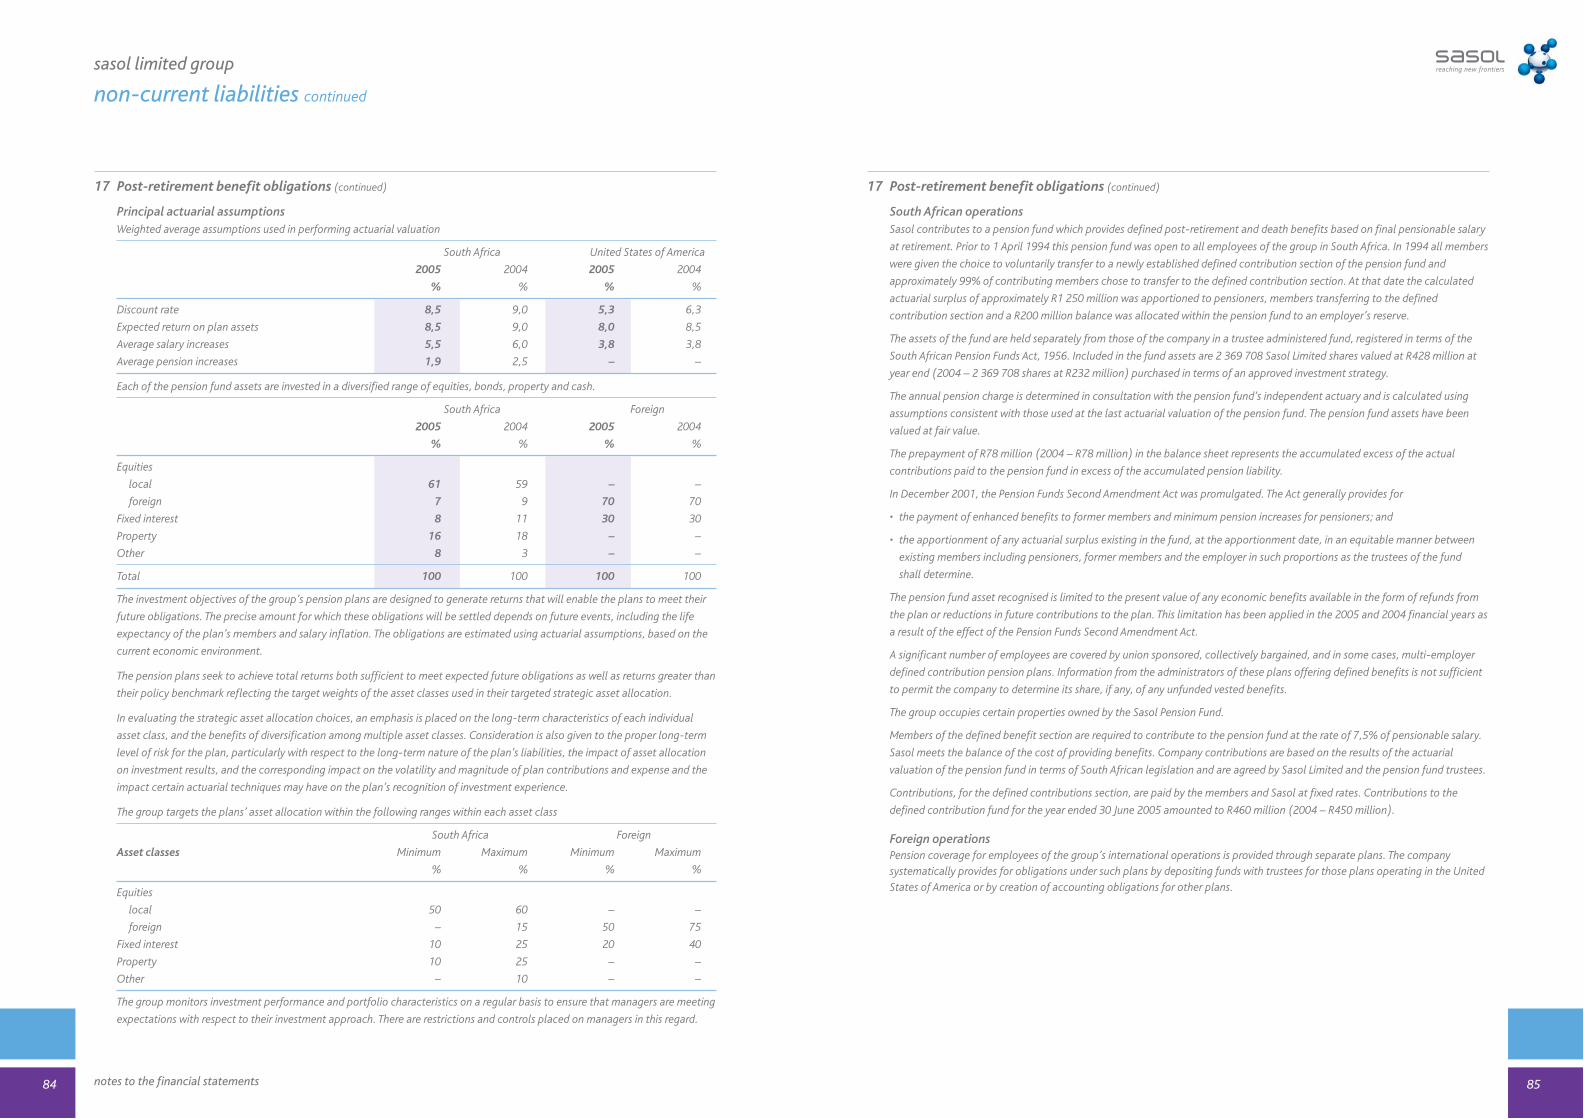
17 Post-retirement benefit obligations (continued)
Principal actuarial assumptionsWeighted average assumptions used in performing actuarial valuation
South Africa United States of America
2005 2004 2005 2004
% % % %
Discount rate 8,5 9,0 5,3 6,3
Expected return on plan assets 8,5 9,0 8,0 8,5
Average salary increases 5,5 6,0 3,8 3,8
Average pension increases 1,9 2,5 – –
Each of the pension fund assets are invested in a diversified range of equities, bonds, property and cash.
South Africa Foreign
2005 2004 2005 2004
% % % %
Equities
local 61 59 – –
foreign 7 9 70 70
Fixed interest 8 11 30 30
Property 16 18 – –
Other 8 3 – –
Total 100 100 100 100
The investment objectives of the group’s pension plans are designed to generate returns that will enable the plans to meet their
future obligations. The precise amount for which these obligations will be settled depends on future events, including the life
expectancy of the plan’s members and salary inflation. The obligations are estimated using actuarial assumptions, based on the
current economic environment.
The pension plans seek to achieve total returns both sufficient to meet expected future obligations as well as returns greater than
their policy benchmark reflecting the target weights of the asset classes used in their targeted strategic asset allocation.
In evaluating the strategic asset allocation choices, an emphasis is placed on the long-term characteristics of each individual
asset class, and the benefits of diversification among multiple asset classes. Consideration is also given to the proper long-term
level of risk for the plan, particularly with respect to the long-term nature of the plan’s liabilities, the impact of asset allocation
on investment results, and the corresponding impact on the volatility and magnitude of plan contributions and expense and the
impact certain actuarial techniques may have on the plan’s recognition of investment experience.
The group targets the plans’ asset allocation within the following ranges within each asset class
South Africa Foreign
Asset classes Minimum Maximum Minimum Maximum
% % % %
Equities
local 50 60 – –
foreign – 15 50 75
Fixed interest 10 25 20 40
Property 10 25 – –
Other – 10 – –
The group monitors investment performance and portfolio characteristics on a regular basis to ensure that managers are meeting
expectations with respect to their investment approach. There are restrictions and controls placed on managers in this regard.
85notes to the financial statements
sasol limited group
non-current liabilities continued
84
17 Post-retirement benefit obligations (continued)
South African operationsSasol contributes to a pension fund which provides defined post-retirement and death benefits based on final pensionable salary
at retirement. Prior to 1 April 1994 this pension fund was open to all employees of the group in South Africa. In 1994 all members
were given the choice to voluntarily transfer to a newly established defined contribution section of the pension fund and
approximately 99% of contributing members chose to transfer to the defined contribution section. At that date the calculated
actuarial surplus of approximately R1 250 million was apportioned to pensioners, members transferring to the defined
contribution section and a R200 million balance was allocated within the pension fund to an employer’s reserve.
The assets of the fund are held separately from those of the company in a trustee administered fund, registered in terms of the
South African Pension Funds Act, 1956. Included in the fund assets are 2 369 708 Sasol Limited shares valued at R428 million at
year end (2004 – 2 369 708 shares at R232 million) purchased in terms of an approved investment strategy.
The annual pension charge is determined in consultation with the pension fund’s independent actuary and is calculated using
assumptions consistent with those used at the last actuarial valuation of the pension fund. The pension fund assets have been
valued at fair value.
The prepayment of R78 million (2004 – R78 million) in the balance sheet represents the accumulated excess of the actual
contributions paid to the pension fund in excess of the accumulated pension liability.
In December 2001, the Pension Funds Second Amendment Act was promulgated. The Act generally provides for
• the payment of enhanced benefits to former members and minimum pension increases for pensioners; and
• the apportionment of any actuarial surplus existing in the fund, at the apportionment date, in an equitable manner between
existing members including pensioners, former members and the employer in such proportions as the trustees of the fund
shall determine.
The pension fund asset recognised is limited to the present value of any economic benefits available in the form of refunds from
the plan or reductions in future contributions to the plan. This limitation has been applied in the 2005 and 2004 financial years as
a result of the effect of the Pension Funds Second Amendment Act.
A significant number of employees are covered by union sponsored, collectively bargained, and in some cases, multi-employer
defined contribution pension plans. Information from the administrators of these plans offering defined benefits is not sufficient
to permit the company to determine its share, if any, of any unfunded vested benefits.
The group occupies certain properties owned by the Sasol Pension Fund.
Members of the defined benefit section are required to contribute to the pension fund at the rate of 7,5% of pensionable salary.
Sasol meets the balance of the cost of providing benefits. Company contributions are based on the results of the actuarial
valuation of the pension fund in terms of South African legislation and are agreed by Sasol Limited and the pension fund trustees.
Contributions, for the defined contributions section, are paid by the members and Sasol at fixed rates. Contributions to the
defined contribution fund for the year ended 30 June 2005 amounted to R460 million (2004 – R450 million).
Foreign operationsPension coverage for employees of the group’s international operations is provided through separate plans. The companysystematically provides for obligations under such plans by depositing funds with trustees for those plans operating in the UnitedStates of America or by creation of accounting obligations for other plans.
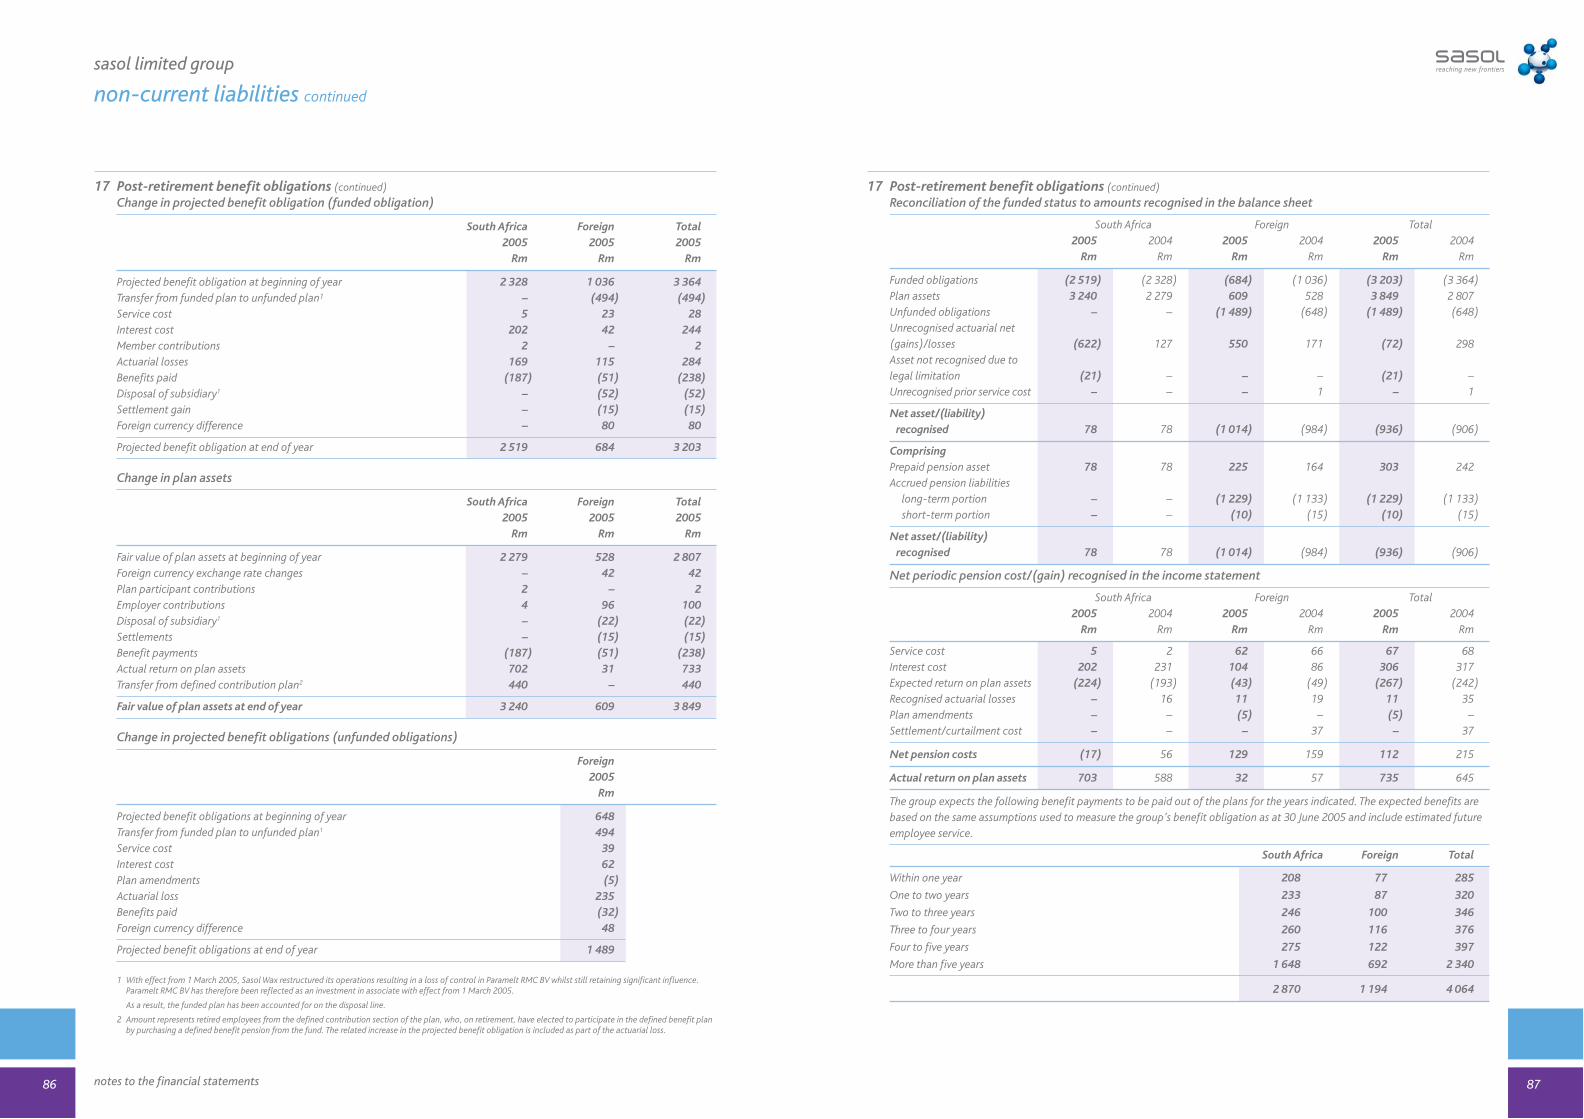
17 Post-retirement benefit obligations (continued)
Change in projected benefit obligation (funded obligation)
South Africa Foreign Total2005 2005 2005
Rm Rm Rm
Projected benefit obligation at beginning of year 2 328 1 036 3 364Transfer from funded plan to unfunded plan1 – (494) (494)Service cost 5 23 28Interest cost 202 42 244Member contributions 2 – 2Actuarial losses 169 115 284Benefits paid (187) (51) (238)Disposal of subsidiary1 – (52) (52)Settlement gain – (15) (15)Foreign currency difference – 80 80
Projected benefit obligation at end of year 2 519 684 3 203
Change in plan assets
South Africa Foreign Total2005 2005 2005
Rm Rm Rm
Fair value of plan assets at beginning of year 2 279 528 2 807Foreign currency exchange rate changes – 42 42Plan participant contributions 2 – 2Employer contributions 4 96 100Disposal of subsidiary1 – (22) (22)Settlements – (15) (15)Benefit payments (187) (51) (238)Actual return on plan assets 702 31 733Transfer from defined contribution plan2 440 – 440
Fair value of plan assets at end of year 3 240 609 3 849
Change in projected benefit obligations (unfunded obligations)
Foreign2005
Rm
Projected benefit obligations at beginning of year 648Transfer from funded plan to unfunded plan1 494Service cost 39Interest cost 62Plan amendments (5)Actuarial loss 235Benefits paid (32)Foreign currency difference 48
Projected benefit obligations at end of year 1 489
1 With effect from 1 March 2005, Sasol Wax restructured its operations resulting in a loss of control in Paramelt RMC BV whilst still retaining significant influence.Paramelt RMC BV has therefore been reflected as an investment in associate with effect from 1 March 2005.
As a result, the funded plan has been accounted for on the disposal line.
2 Amount represents retired employees from the defined contribution section of the plan, who, on retirement, have elected to participate in the defined benefit planby purchasing a defined benefit pension from the fund. The related increase in the projected benefit obligation is included as part of the actuarial loss.
87notes to the financial statements
sasol limited group
non-current liabilities continued
86
17 Post-retirement benefit obligations (continued)
Reconciliation of the funded status to amounts recognised in the balance sheet
South Africa Foreign Total2005 2004 2005 2004 2005 2004
Rm Rm Rm Rm Rm Rm
Funded obligations (2 519) (2 328) (684) (1 036) (3 203) (3 364)Plan assets 3 240 2 279 609 528 3 849 2 807Unfunded obligations – – (1 489) (648) (1 489) (648)Unrecognised actuarial net (gains)/losses (622) 127 550 171 (72) 298Asset not recognised due tolegal limitation (21) – – – (21) –Unrecognised prior service cost – – – 1 – 1
Net asset/(liability) recognised 78 78 (1 014) (984) (936) (906)
ComprisingPrepaid pension asset 78 78 225 164 303 242Accrued pension liabilities
long-term portion – – (1 229) (1 133) (1 229) (1 133)short-term portion – – (10) (15) (10) (15)
Net asset/(liability) recognised 78 78 (1 014) (984) (936) (906)
Net periodic pension cost/(gain) recognised in the income statement
South Africa Foreign Total2005 2004 2005 2004 2005 2004
Rm Rm Rm Rm Rm Rm
Service cost 5 2 62 66 67 68Interest cost 202 231 104 86 306 317Expected return on plan assets (224) (193) (43) (49) (267) (242)Recognised actuarial losses – 16 11 19 11 35Plan amendments – – (5) – (5) –Settlement/curtailment cost – – – 37 – 37
Net pension costs (17) 56 129 159 112 215
Actual return on plan assets 703 588 32 57 735 645
The group expects the following benefit payments to be paid out of the plans for the years indicated. The expected benefits arebased on the same assumptions used to measure the group’s benefit obligation as at 30 June 2005 and include estimated futureemployee service.
South Africa Foreign Total
Within one year 208 77 285
One to two years 233 87 320
Two to three years 246 100 346
Three to four years 260 116 376
Four to five years 275 122 397
More than five years 1 648 692 2 340
2 870 1 194 4 064
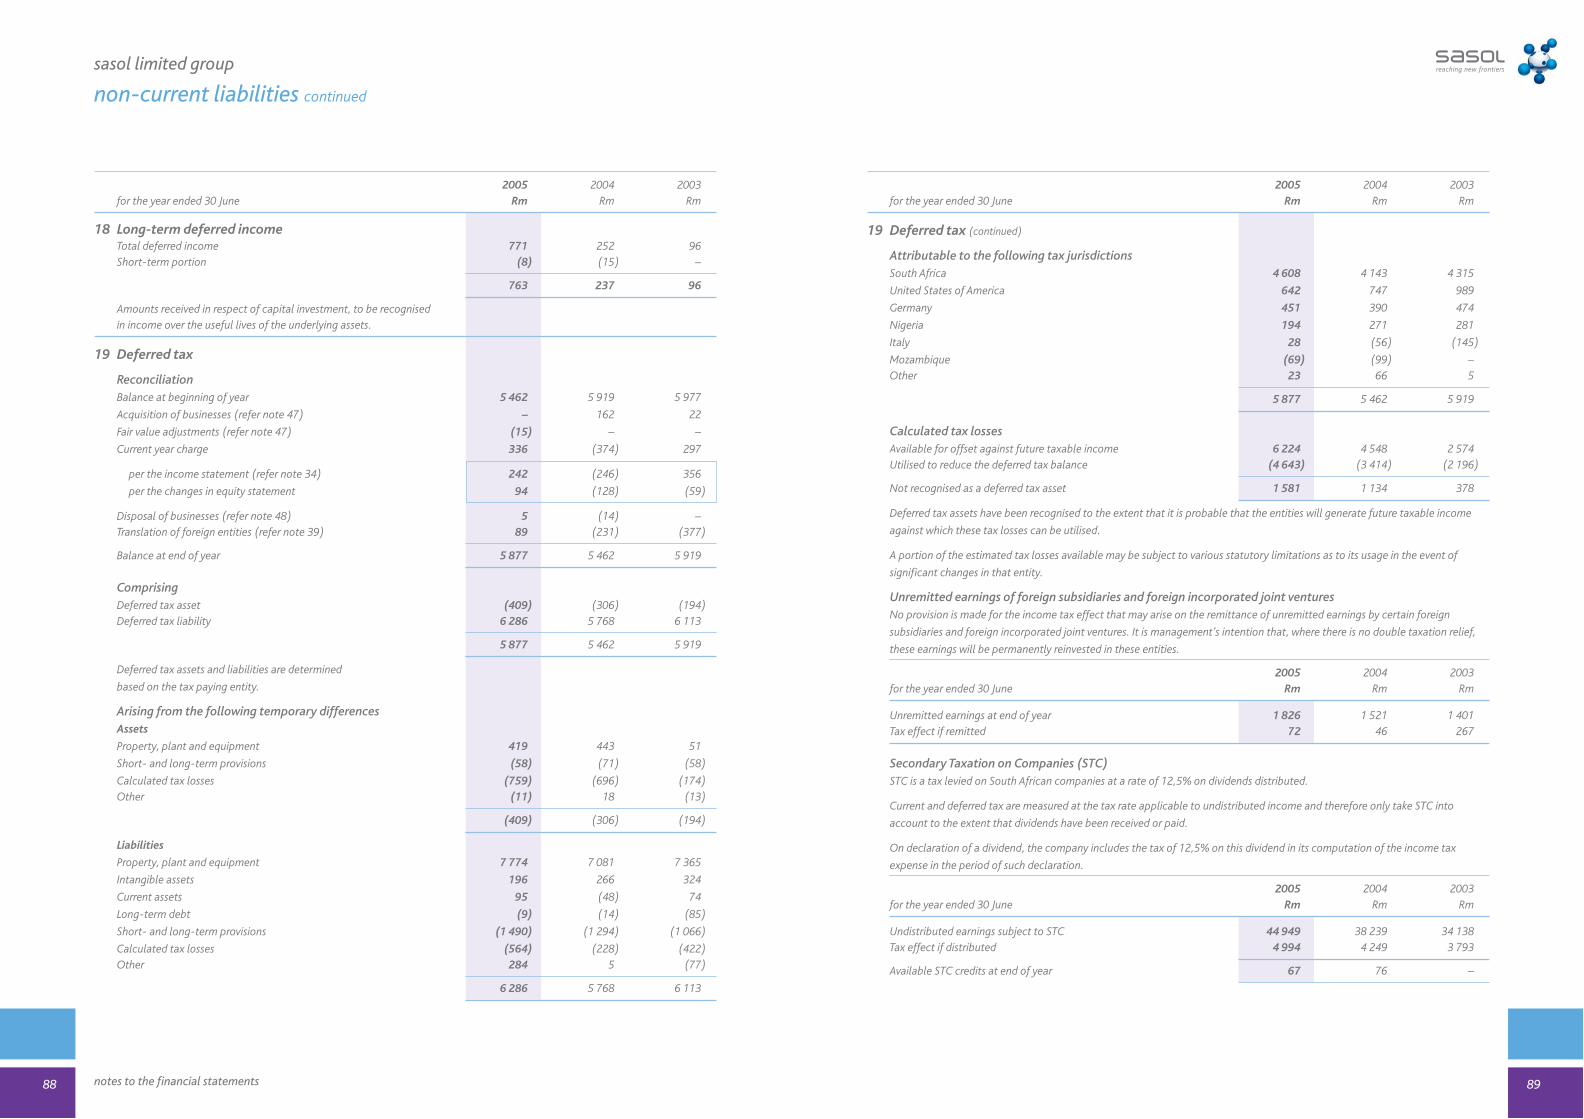
2005 2004 2003for the year ended 30 June Rm Rm Rm
18 Long-term deferred incomeTotal deferred income 771 252 96Short-term portion (8) (15) –
763 237 96
Amounts received in respect of capital investment, to be recognised in income over the useful lives of the underlying assets.
19 Deferred tax
ReconciliationBalance at beginning of year 5 462 5 919 5 977
Acquisition of businesses (refer note 47) – 162 22
Fair value adjustments (refer note 47) (15) – –
Current year charge 336 (374) 297
per the income statement (refer note 34) 242 (246) 356
per the changes in equity statement 94 (128) (59)
Disposal of businesses (refer note 48) 5 (14) –Translation of foreign entities (refer note 39) 89 (231) (377)
Balance at end of year 5 877 5 462 5 919
ComprisingDeferred tax asset (409) (306) (194)Deferred tax liability 6 286 5 768 6 113
5 877 5 462 5 919
Deferred tax assets and liabilities are determined
based on the tax paying entity.
Arising from the following temporary differencesAssets
Property, plant and equipment 419 443 51
Short- and long-term provisions (58) (71) (58)
Calculated tax losses (759) (696) (174)Other (11) 18 (13)
(409) (306) (194)
Liabilities
Property, plant and equipment 7 774 7 081 7 365
Intangible assets 196 266 324
Current assets 95 (48) 74
Long-term debt (9) (14) (85)
Short- and long-term provisions (1 490) (1 294) (1 066)
Calculated tax losses (564) (228) (422)Other 284 5 (77)
6 286 5 768 6 113
89notes to the financial statements
sasol limited group
non-current liabilities continued
88
2005 2004 2003for the year ended 30 June Rm Rm Rm
19 Deferred tax (continued)
Attributable to the following tax jurisdictionsSouth Africa 4 608 4 143 4 315
United States of America 642 747 989
Germany 451 390 474
Nigeria 194 271 281
Italy 28 (56) (145)
Mozambique (69) (99) –Other 23 66 5
5 877 5 462 5 919
Calculated tax lossesAvailable for offset against future taxable income 6 224 4 548 2 574Utilised to reduce the deferred tax balance (4 643) (3 414) (2 196)
Not recognised as a deferred tax asset 1 581 1 134 378
Deferred tax assets have been recognised to the extent that it is probable that the entities will generate future taxable income
against which these tax losses can be utilised.
A portion of the estimated tax losses available may be subject to various statutory limitations as to its usage in the event of
significant changes in that entity.
Unremitted earnings of foreign subsidiaries and foreign incorporated joint venturesNo provision is made for the income tax effect that may arise on the remittance of unremitted earnings by certain foreign
subsidiaries and foreign incorporated joint ventures. It is management’s intention that, where there is no double taxation relief,
these earnings will be permanently reinvested in these entities.
2005 2004 2003for the year ended 30 June Rm Rm Rm
Unremitted earnings at end of year 1 826 1 521 1 401Tax effect if remitted 72 46 267
Secondary Taxation on Companies (STC)STC is a tax levied on South African companies at a rate of 12,5% on dividends distributed.
Current and deferred tax are measured at the tax rate applicable to undistributed income and therefore only take STC into
account to the extent that dividends have been received or paid.
On declaration of a dividend, the company includes the tax of 12,5% on this dividend in its computation of the income tax
expense in the period of such declaration.
2005 2004 2003for the year ended 30 June Rm Rm Rm
Undistributed earnings subject to STC 44 949 38 239 34 138Tax effect if distributed 4 994 4 249 3 793
Available STC credits at end of year 67 76 –

Note 2005 2004 2003
Rm Rm Rm
Short-term debt 20 3 300 3 265 6 481
Short-term financial liabilities 21 792 1 205 654
Short-term provisions 22 1 801 1 838 1 566
Short-term portion of deferred income 18 8 15 –
Tax payable 23 614 61 571
Trade payables 24 4 733 3 886 4 060
Other payables and accrued expenses 25 4 416 3 502 3 336
Bank overdraft (including overnight borrowings) 14 2 615 4 113 3 268
18 279 17 885 19 936
2005 2004 2003for the year ended 30 June Rm Rm Rm
20 Short-term debtComprisingCommercial paper in issue 1 522 1 521 3 288Revolving credit 663 1 023 1 184Bank loans 77 106 995Short-term joint venture debt 20 46 114Other 3 2 2
Short-term external loans 2 285 2 698 5 583Short-term portion of long-term debt (refer note 15) 1 015 567 898
3 300 3 265 6 481
ReconciliationBalance at beginning of year 2 698 5 583 2 637Acquisition of businesses (refer note 47) – – 16Loans raised 496 2 787 5 185Loans repaid (936) (5 403) (2 097)Effect of cash flow hedge accounting – (13) –Disposal of businesses (refer note 48) – (188) –Translation of foreign entities (refer note 39) 27 (68) (158)
Balance at end of year 2 285 2 698 5 583
Currency analysisEuro 116 449 335US dollar 620 673 1 286Rand 1 542 1 567 3 954Other currencies 7 9 8
2 285 2 698 5 583Interest bearing statusInterest bearing 2 285 2 698 5 578Non-interest bearing – – 5
2 285 2 698 5 583SecuritySecured – 37 915Unsecured 2 285 2 661 4 668
2 285 2 698 5 583
91notes to the financial statements
sasol limited group
current liabilities
90
2005 2004 2003
for the year ended 30 June Rm Rm Rm
20 Short-term debt (continued)
Business segmentationFinancing 2 185
Liquid Fuels Business 294
Gas 242
Polymers 214
Petroleum International 131
Other 234
3 300
21 Short-term financial liabilitiesArising on short-term financial instruments 792 1 205 654
Short-term financial liabilities include the revaluation of
out-of-the-money derivative instruments, refer pages 115 to 123.
22 Short-term provisionsEmployee provisions 920 741 414
Other provisions 380 405 656
1 300 1 146 1 070
Short-term portion of
long-term provisions (refer note 16) 460 655 468
post-retirement benefit obligations (refer note 17) 41 37 28
1 801 1 838 1 566
Reconciliation
Balance at beginning of year 1 146 1 070 1 534
Acquisition of businesses (refer note 47) – 2 1
Net movement (refer note 42) 138 162 (322)
income statement charge 1 278 1 293
reversal of unutilised amounts (49) (43)
provisions utilised (1 091) (1 088)
Disposal of businesses (refer note 48) (15) (7) –
Translation of foreign entities (refer note 39) 31 (81) (143)
Balance at end of year 1 300 1 146 1 070
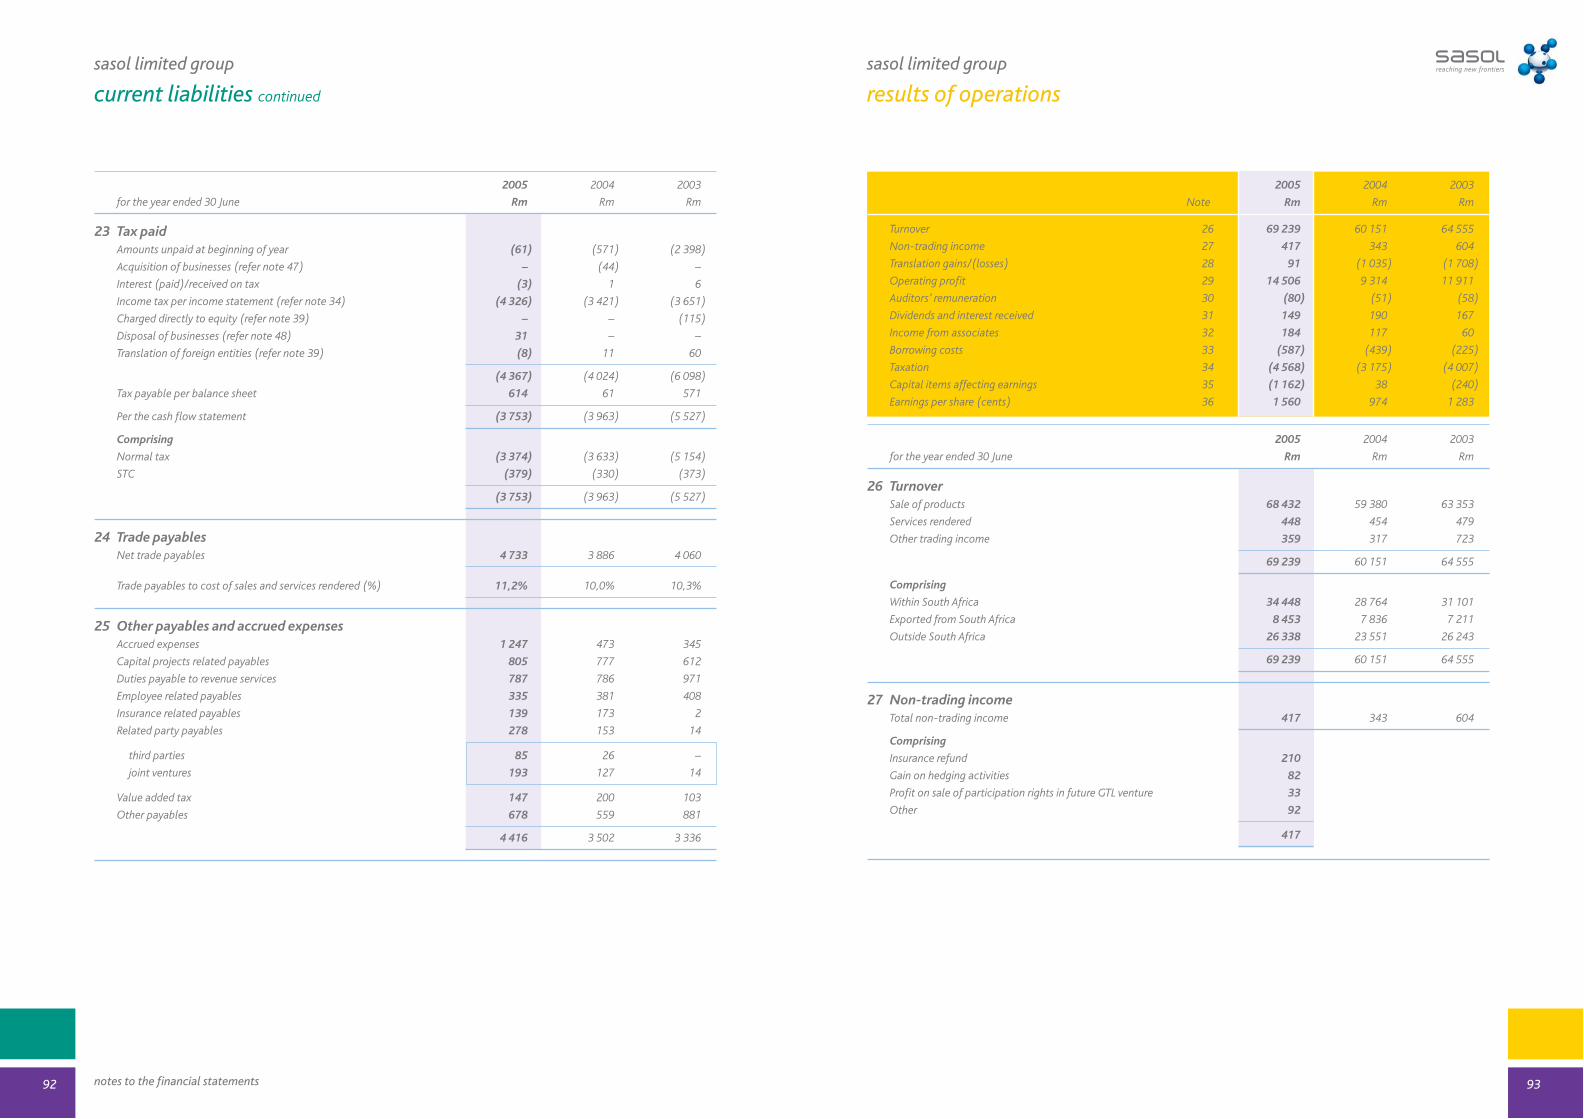
sasol limited group
results of operations
2005 2004 2003
for the year ended 30 June Rm Rm Rm
23 Tax paidAmounts unpaid at beginning of year (61) (571) (2 398)
Acquisition of businesses (refer note 47) – (44) –
Interest (paid)/received on tax (3) 1 6
Income tax per income statement (refer note 34) (4 326) (3 421) (3 651)
Charged directly to equity (refer note 39) – – (115)
Disposal of businesses (refer note 48) 31 – –
Translation of foreign entities (refer note 39) (8) 11 60
(4 367) (4 024) (6 098)
Tax payable per balance sheet 614 61 571
Per the cash flow statement (3 753) (3 963) (5 527)
Comprising
Normal tax (3 374) (3 633) (5 154)
STC (379) (330) (373)
(3 753) (3 963) (5 527)
24 Trade payablesNet trade payables 4 733 3 886 4 060
Trade payables to cost of sales and services rendered (%) 11,2% 10,0% 10,3%
25 Other payables and accrued expensesAccrued expenses 1 247 473 345
Capital projects related payables 805 777 612
Duties payable to revenue services 787 786 971
Employee related payables 335 381 408
Insurance related payables 139 173 2
Related party payables 278 153 14
third parties 85 26 –
joint ventures 193 127 14
Value added tax 147 200 103
Other payables 678 559 881
4 416 3 502 3 336
93notes to the financial statements
sasol limited group
current liabilities continued
92
2005 2004 2003
Note Rm Rm Rm
Turnover 26 69 239 60 151 64 555
Non-trading income 27 417 343 604
Translation gains/(losses) 28 91 (1 035) (1 708)
Operating profit 29 14 506 9 314 11 911
Auditors’ remuneration 30 (80) (51) (58)
Dividends and interest received 31 149 190 167
Income from associates 32 184 117 60
Borrowing costs 33 (587) (439) (225)
Taxation 34 (4 568) (3 175) (4 007)
Capital items affecting earnings 35 (1 162) 38 (240)
Earnings per share (cents) 36 1 560 974 1 283
2005 2004 2003
for the year ended 30 June Rm Rm Rm
26 TurnoverSale of products 68 432 59 380 63 353
Services rendered 448 454 479
Other trading income 359 317 723
69 239 60 151 64 555
Comprising
Within South Africa 34 448 28 764 31 101
Exported from South Africa 8 453 7 836 7 211
Outside South Africa 26 338 23 551 26 243
69 239 60 151 64 555
27 Non-trading incomeTotal non-trading income 417 343 604
Comprising
Insurance refund 210
Gain on hedging activities 82
Profit on sale of participation rights in future GTL venture 33
Other 92
417
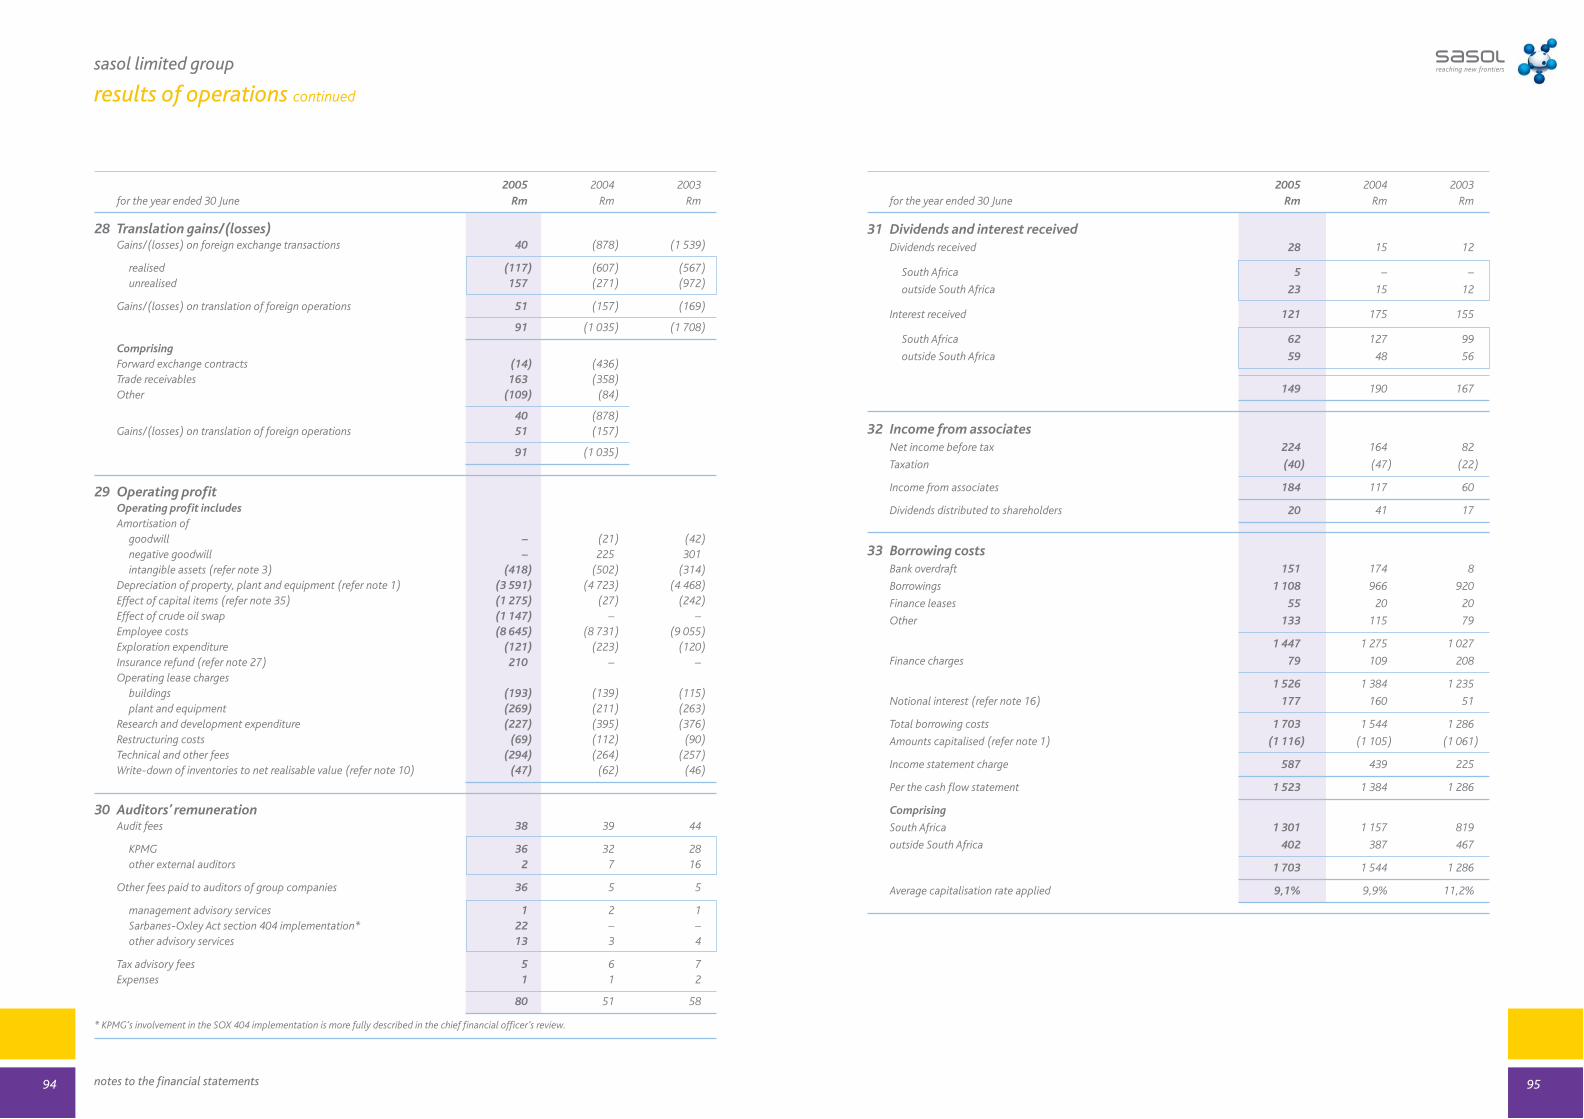
2005 2004 2003for the year ended 30 June Rm Rm Rm
28 Translation gains/(losses)Gains/(losses) on foreign exchange transactions 40 (878) (1 539)
realised (117) (607) (567)unrealised 157 (271) (972)
Gains/(losses) on translation of foreign operations 51 (157) (169)
91 (1 035) (1 708)
ComprisingForward exchange contracts (14) (436)Trade receivables 163 (358)Other (109) (84)
40 (878)Gains/(losses) on translation of foreign operations 51 (157)
91 (1 035)
29 Operating profitOperating profit includesAmortisation of
goodwill – (21) (42)negative goodwill – 225 301intangible assets (refer note 3) (418) (502) (314)
Depreciation of property, plant and equipment (refer note 1) (3 591) (4 723) (4 468)Effect of capital items (refer note 35) (1 275) (27) (242)Effect of crude oil swap (1 147) – –Employee costs (8 645) (8 731) (9 055)Exploration expenditure (121) (223) (120)Insurance refund (refer note 27) 210 – –Operating lease charges
buildings (193) (139) (115)plant and equipment (269) (211) (263)
Research and development expenditure (227) (395) (376)Restructuring costs (69) (112) (90)Technical and other fees (294) (264) (257)Write-down of inventories to net realisable value (refer note 10) (47) (62) (46)
30 Auditors’ remunerationAudit fees 38 39 44
KPMG 36 32 28other external auditors 2 7 16
Other fees paid to auditors of group companies 36 5 5
management advisory services 1 2 1Sarbanes-Oxley Act section 404 implementation* 22 – –other advisory services 13 3 4
Tax advisory fees 5 6 7Expenses 1 1 2
80 51 58
* KPMG’s involvement in the SOX 404 implementation is more fully described in the chief financial officer’s review.
95notes to the financial statements
sasol limited group
results of operations continued
94
2005 2004 2003for the year ended 30 June Rm Rm Rm
31 Dividends and interest receivedDividends received 28 15 12
South Africa 5 – –
outside South Africa 23 15 12
Interest received 121 175 155
South Africa 62 127 99
outside South Africa 59 48 56
149 190 167
32 Income from associatesNet income before tax 224 164 82
Taxation (40) (47) (22)
Income from associates 184 117 60
Dividends distributed to shareholders 20 41 17
33 Borrowing costsBank overdraft 151 174 8
Borrowings 1 108 966 920
Finance leases 55 20 20
Other 133 115 79
1 447 1 275 1 027
Finance charges 79 109 208
1 526 1 384 1 235
Notional interest (refer note 16) 177 160 51
Total borrowing costs 1 703 1 544 1 286
Amounts capitalised (refer note 1) (1 116) (1 105) (1 061)
Income statement charge 587 439 225
Per the cash flow statement 1 523 1 384 1 286
Comprising
South Africa 1 301 1 157 819
outside South Africa 402 387 467
1 703 1 544 1 286
Average capitalisation rate applied 9,1% 9,9% 11,2%
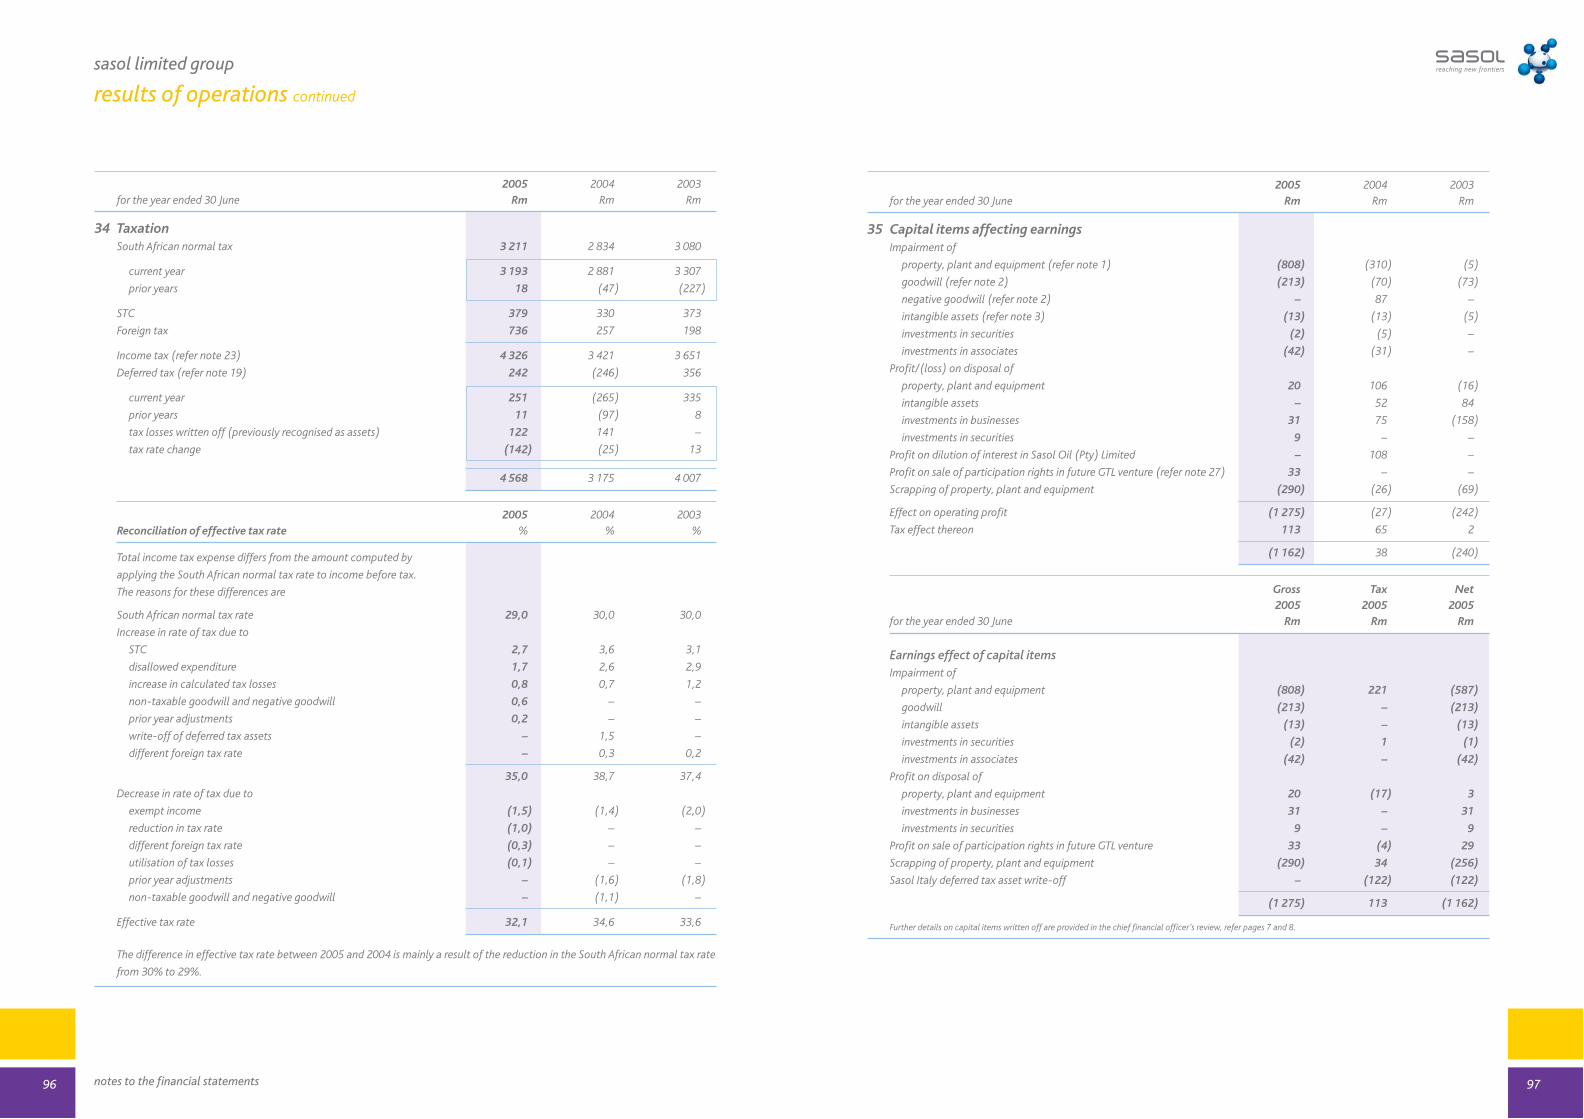
2005 2004 2003for the year ended 30 June Rm Rm Rm
34 TaxationSouth African normal tax 3 211 2 834 3 080
current year 3 193 2 881 3 307
prior years 18 (47) (227)
STC 379 330 373
Foreign tax 736 257 198
Income tax (refer note 23) 4 326 3 421 3 651
Deferred tax (refer note 19) 242 (246) 356
current year 251 (265) 335
prior years 11 (97) 8
tax losses written off (previously recognised as assets) 122 141 –
tax rate change (142) (25) 13
4 568 3 175 4 007
2005 2004 2003Reconciliation of effective tax rate % % %
Total income tax expense differs from the amount computed by
applying the South African normal tax rate to income before tax.
The reasons for these differences are
South African normal tax rate 29,0 30,0 30,0
Increase in rate of tax due to
STC 2,7 3,6 3,1
disallowed expenditure 1,7 2,6 2,9
increase in calculated tax losses 0,8 0,7 1,2
non-taxable goodwill and negative goodwill 0,6 – –
prior year adjustments 0,2 – –
write-off of deferred tax assets – 1,5 –
different foreign tax rate – 0,3 0,2
35,0 38,7 37,4
Decrease in rate of tax due to
exempt income (1,5) (1,4) (2,0)
reduction in tax rate (1,0) – –
different foreign tax rate (0,3) – –
utilisation of tax losses (0,1) – –
prior year adjustments – (1,6) (1,8)
non-taxable goodwill and negative goodwill – (1,1) –
Effective tax rate 32,1 34,6 33,6
The difference in effective tax rate between 2005 and 2004 is mainly a result of the reduction in the South African normal tax rate
from 30% to 29%.
97notes to the financial statements
sasol limited group
results of operations continued
96
2005 2004 2003for the year ended 30 June Rm Rm Rm
35 Capital items affecting earningsImpairment of
property, plant and equipment (refer note 1) (808) (310) (5)
goodwill (refer note 2) (213) (70) (73)
negative goodwill (refer note 2) – 87 –
intangible assets (refer note 3) (13) (13) (5)
investments in securities (2) (5) –
investments in associates (42) (31) –
Profit/(loss) on disposal of
property, plant and equipment 20 106 (16)
intangible assets – 52 84
investments in businesses 31 75 (158)
investments in securities 9 – –
Profit on dilution of interest in Sasol Oil (Pty) Limited – 108 –
Profit on sale of participation rights in future GTL venture (refer note 27) 33 – –
Scrapping of property, plant and equipment (290) (26) (69)
Effect on operating profit (1 275) (27) (242)
Tax effect thereon 113 65 2
(1 162) 38 (240)
Gross Tax Net2005 2005 2005
for the year ended 30 June Rm Rm Rm
Earnings effect of capital itemsImpairment of
property, plant and equipment (808) 221 (587)
goodwill (213) – (213)
intangible assets (13) – (13)
investments in securities (2) 1 (1)
investments in associates (42) – (42)
Profit on disposal of
property, plant and equipment 20 (17) 3
investments in businesses 31 – 31
investments in securities 9 – 9
Profit on sale of participation rights in future GTL venture 33 (4) 29
Scrapping of property, plant and equipment (290) 34 (256)
Sasol Italy deferred tax asset write-off – (122) (122)
(1 275) 113 (1 162)
Further details on capital items written off are provided in the chief financial officer’s review, refer pages 7 and 8.
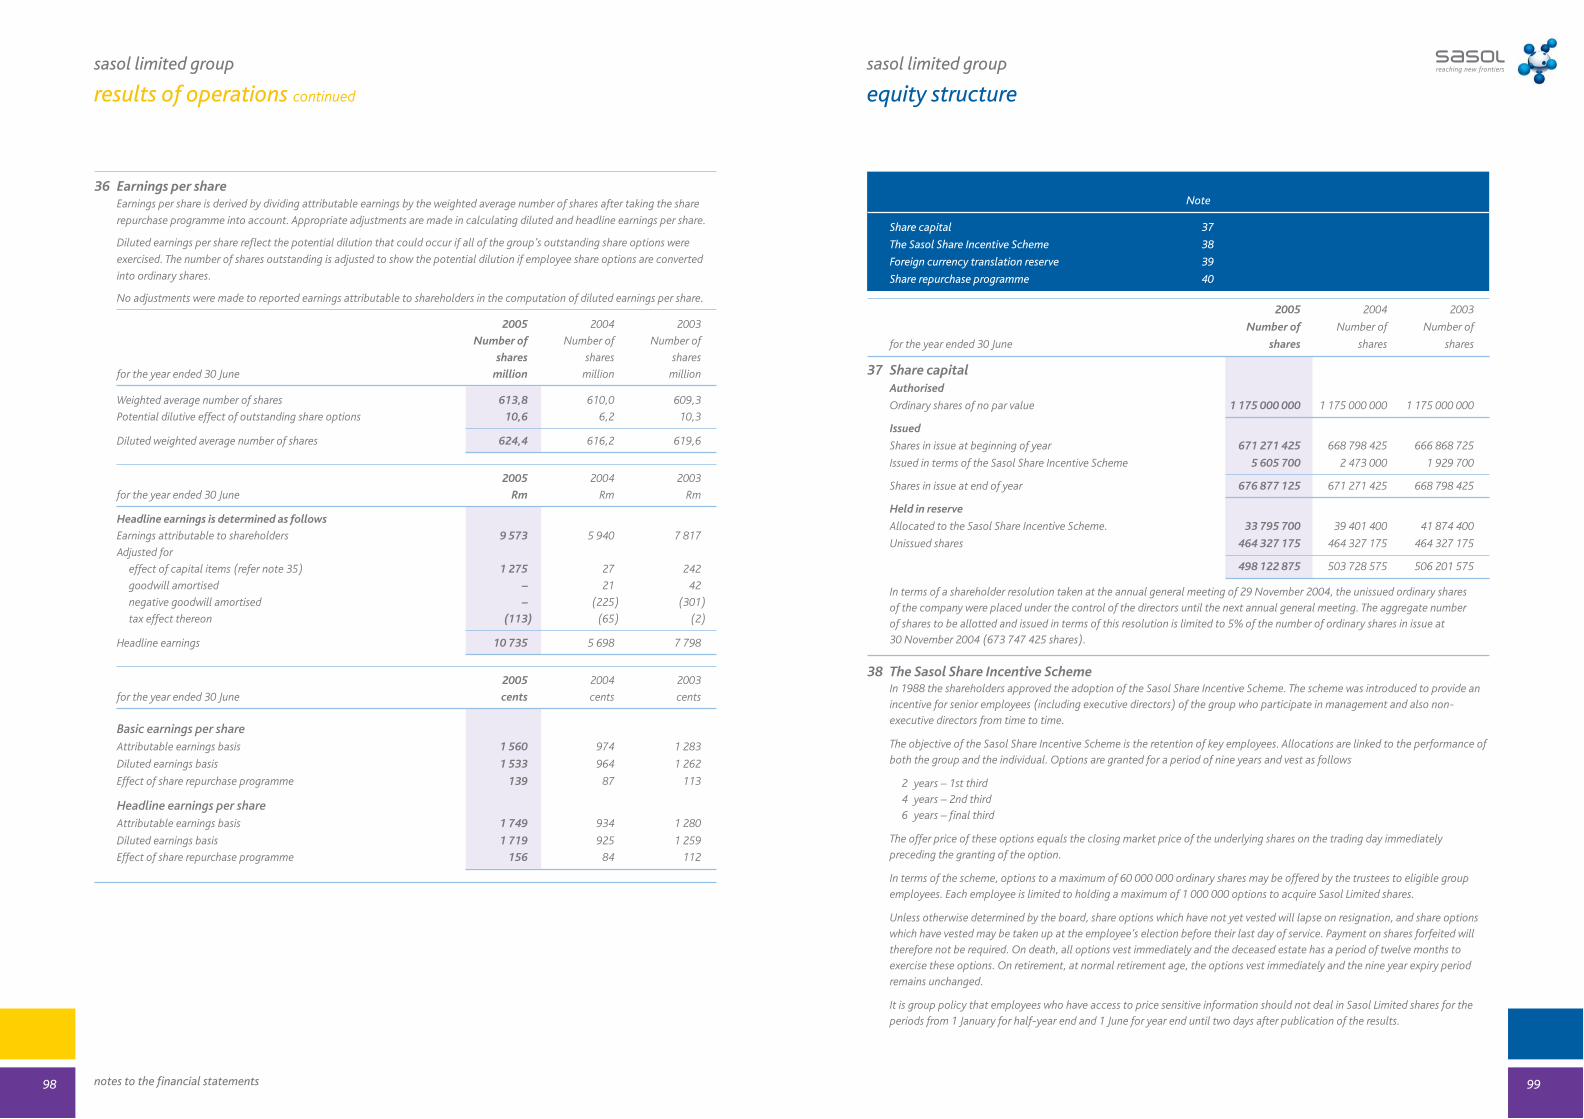
sasol limited group
equity structure
36 Earnings per shareEarnings per share is derived by dividing attributable earnings by the weighted average number of shares after taking the share
repurchase programme into account. Appropriate adjustments are made in calculating diluted and headline earnings per share.
Diluted earnings per share reflect the potential dilution that could occur if all of the group’s outstanding share options were
exercised. The number of shares outstanding is adjusted to show the potential dilution if employee share options are converted
into ordinary shares.
No adjustments were made to reported earnings attributable to shareholders in the computation of diluted earnings per share.
2005 2004 2003
Number of Number of Number of
shares shares shares
for the year ended 30 June million million million
Weighted average number of shares 613,8 610,0 609,3
Potential dilutive effect of outstanding share options 10,6 6,2 10,3
Diluted weighted average number of shares 624,4 616,2 619,6
2005 2004 2003
for the year ended 30 June Rm Rm Rm
Headline earnings is determined as follows
Earnings attributable to shareholders 9 573 5 940 7 817
Adjusted for
effect of capital items (refer note 35) 1 275 27 242
goodwill amortised – 21 42
negative goodwill amortised – (225) (301)
tax effect thereon (113) (65) (2)
Headline earnings 10 735 5 698 7 798
2005 2004 2003
for the year ended 30 June cents cents cents
Basic earnings per shareAttributable earnings basis 1 560 974 1 283
Diluted earnings basis 1 533 964 1 262
Effect of share repurchase programme 139 87 113
Headline earnings per shareAttributable earnings basis 1 749 934 1 280
Diluted earnings basis 1 719 925 1 259
Effect of share repurchase programme 156 84 112
99notes to the financial statements
sasol limited group
results of operations continued
98
Note
Share capital 37
The Sasol Share Incentive Scheme 38
Foreign currency translation reserve 39
Share repurchase programme 40
2005 2004 2003
Number of Number of Number of
for the year ended 30 June shares shares shares
37 Share capitalAuthorised
Ordinary shares of no par value 1 175 000 000 1 175 000 000 1 175 000 000
Issued
Shares in issue at beginning of year 671 271 425 668 798 425 666 868 725
Issued in terms of the Sasol Share Incentive Scheme 5 605 700 2 473 000 1 929 700
Shares in issue at end of year 676 877 125 671 271 425 668 798 425
Held in reserve
Allocated to the Sasol Share Incentive Scheme. 33 795 700 39 401 400 41 874 400
Unissued shares 464 327 175 464 327 175 464 327 175
498 122 875 503 728 575 506 201 575
In terms of a shareholder resolution taken at the annual general meeting of 29 November 2004, the unissued ordinary sharesof the company were placed under the control of the directors until the next annual general meeting. The aggregate numberof shares to be allotted and issued in terms of this resolution is limited to 5% of the number of ordinary shares in issue at30 November 2004 (673 747 425 shares).
38 The Sasol Share Incentive SchemeIn 1988 the shareholders approved the adoption of the Sasol Share Incentive Scheme. The scheme was introduced to provide anincentive for senior employees (including executive directors) of the group who participate in management and also non-executive directors from time to time.
The objective of the Sasol Share Incentive Scheme is the retention of key employees. Allocations are linked to the performance ofboth the group and the individual. Options are granted for a period of nine years and vest as follows
2 years – 1st third4 years – 2nd third6 years – final third
The offer price of these options equals the closing market price of the underlying shares on the trading day immediatelypreceding the granting of the option.
In terms of the scheme, options to a maximum of 60 000 000 ordinary shares may be offered by the trustees to eligible groupemployees. Each employee is limited to holding a maximum of 1 000 000 options to acquire Sasol Limited shares.
Unless otherwise determined by the board, share options which have not yet vested will lapse on resignation, and share optionswhich have vested may be taken up at the employee’s election before their last day of service. Payment on shares forfeited willtherefore not be required. On death, all options vest immediately and the deceased estate has a period of twelve months toexercise these options. On retirement, at normal retirement age, the options vest immediately and the nine year expiry periodremains unchanged.
It is group policy that employees who have access to price sensitive information should not deal in Sasol Limited shares for theperiods from 1 January for half-year end and 1 June for year end until two days after publication of the results.

2005 2004 2003
Number of Number of Number of
for the year ended 30 June shares shares shares
38 The Sasol Share Incentive Scheme (continued)
Shares allotted 26 204 300 20 598 600 18 125 600
Share options granted 24 975 700 27 097 900 26 495 200
Available for allocation 8 820 000 12 303 500 15 379 200
60 000 000 60 000 000 60 000 000
Movements in the number of options granted
Balance at beginning of year 27 097 900 26 495 200 24 067 000
Options granted 4 208 800 3 950 700 4 942 300
Options converted to shares (5 605 700) (2 473 000) (1 929 700)
Options forfeited (43 700) (63 100) (44 000)
Options expired (681 600) (811 900) (540 400)
Balance at end of year 24 975 700 27 097 900 26 495 200
Vesting periods of options granted
Already vested 5 034 700 5 567 000 2 829 700
Within one year 5 826 000 5 165 200 5 518 400
One to two years 5 522 300 5 765 000 4 847 200
Two to three years 3 206 100 4 435 500 4 736 700
Three to four years 2 797 700 3 391 100 4 736 400
Four to five years 1 218 200 1 496 700 2 231 600
More than five years 1 370 700 1 277 400 1 595 200
24 975 700 27 097 900 26 495 200
2005 2004 2003
for the year ended 30 June Rand Rand Rand
Average price at which share options were granted during year 120,34 90,99 107,76
Average market price of options traded during year 138,73 94,78 107,87
2005 2004 2003
for the year ended 30 June Rm Rm Rm
Compensation expense (not recognised) 137 146 144
Being the compensation expense that would have been recognised had
a fair value model been applied, calculated using the Black Scholes
model based on the following assumptions
risk free interest rate 9,25% 10,75% 11,75%
volatility 34% 37% 45%
dividend yield 4,3% 4,3% 4,0%
vesting period 2, 4, 6 years 2, 4, 6 years 2, 4, 6 years
Weighted average value of options issued during year (rand) 33,44 28,40 39,70
101notes to the financial statements
sasol limited group
equity structure continued
100
Weighted Weighted
average average
Number of option price remaining life
at 30 June 2005 shares Rand years
38 The Sasol Share Incentive Scheme (continued)
Range of exercise pricesDetails of unimplemented share options granted up to 30 June 2005
R20,01 – R30,00 1 431 100 24,94 1,95
R30,01 – R40,00 974 900 37,62 3,69
R40,01 – R50,00 2 267 700 42,49 3,37
R50,01 – R60,00 3 055 400 54,50 3,61
R60,01 – R70,00 555 400 69,02 4,91
R70,01 – R80,00 3 221 300 78,64 5,07
R80,01 – R90,00 3 866 100 88,11 6,92
R90,01 – R100,00 802 700 96,87 7,74
R100,01 – R110,00 1 046 500 105,02 7,08
R110,01 – R120,00 6 466 300 114,20 6,87
R120,01 – R130,00 384 600 125,73 8,31
R130,01 – R140,00 156 500 132,57 6,13
R140,01 – R150,00 266 400 144,21 9,00
R150,01 – R160,00 396 700 156,30 9,00
R160,01 – R170,00 – – –
R170,01 – R180,00 84 100 170,20 9,00
24 975 700 83,18
Details of unimplemented options vested at 30 June 2005
R20,01 – R30,00 387 400 24,95
R30,01 – R40,00 362 400 37,77
R40,01 – R50,00 637 600 42,07
R50,01 – R60,00 1 155 500 54,23
R60,01 – R70,00 139 900 69,30
R70,01 – R80,00 762 900 78,46
R80,01 – R90,00 324 800 89,23
R90,01 – R100,00 44 100 93,71
R100,01 – R110,00 113 800 106,81
R110,01 – R120,00 1 064 800 115,88
R120,01 – R130,00 – –
R130,01 – R140,00 41 500 132,40
5 034 700 70,82
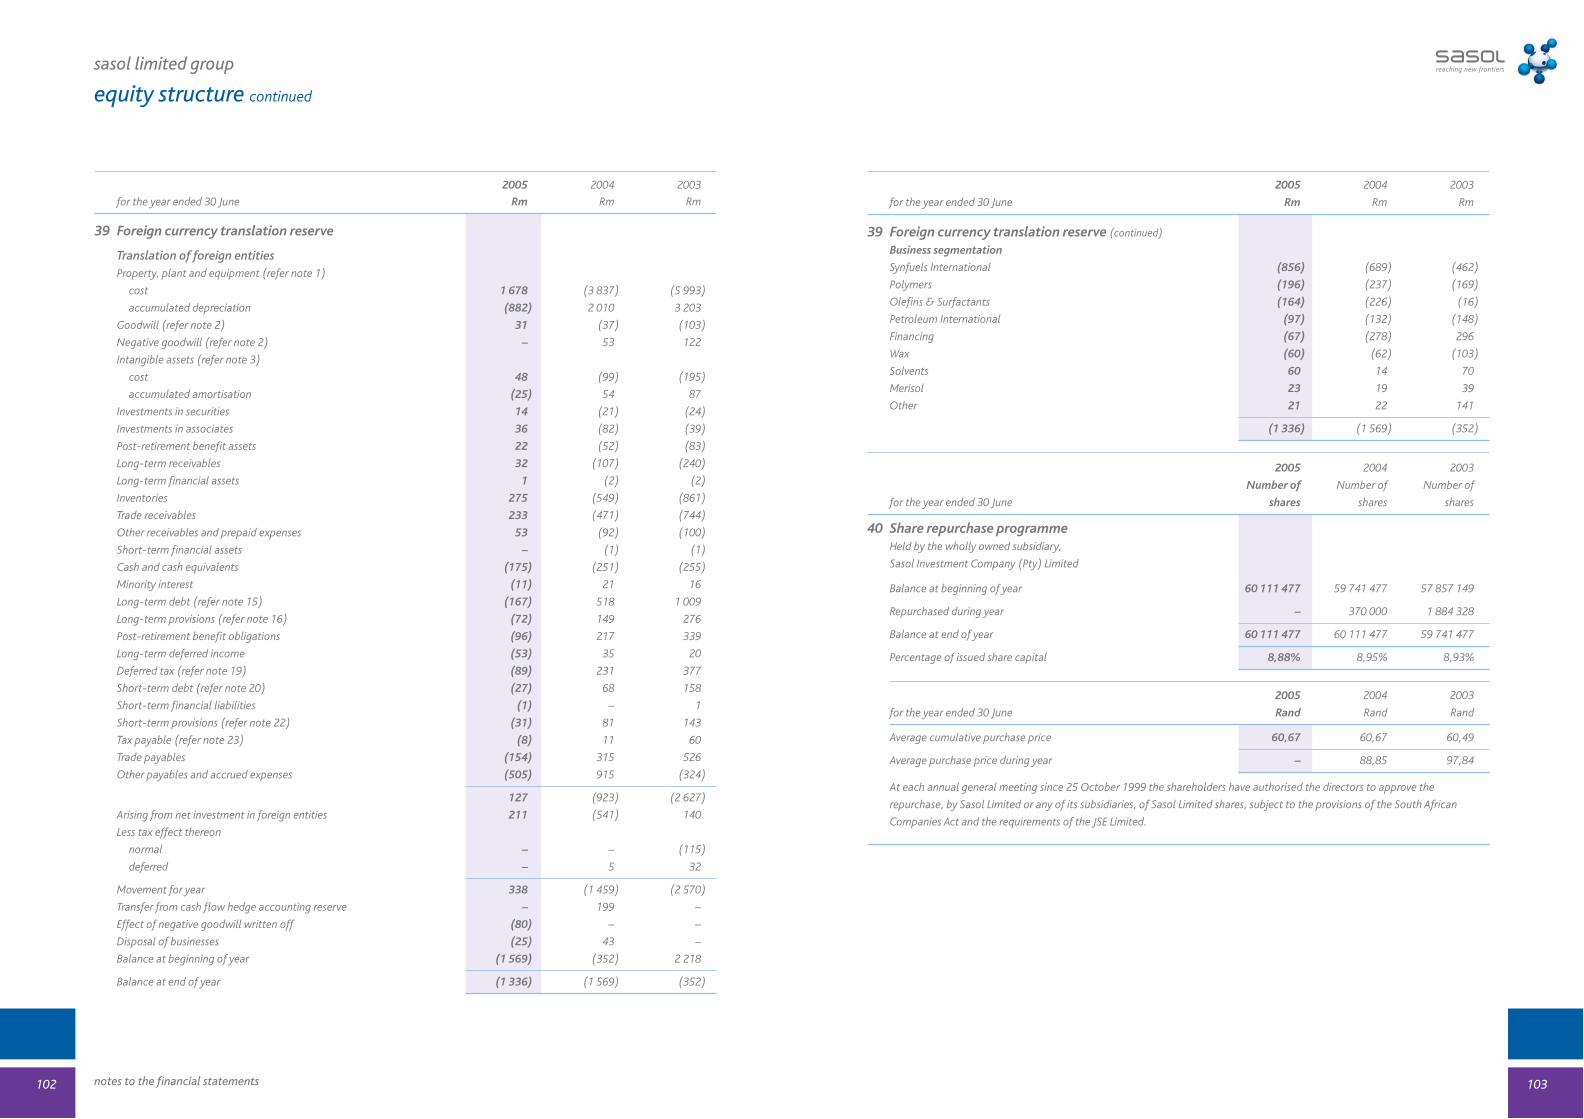
2005 2004 2003
for the year ended 30 June Rm Rm Rm
39 Foreign currency translation reserve
Translation of foreign entitiesProperty, plant and equipment (refer note 1)
cost 1 678 (3 837) (5 993)
accumulated depreciation (882) 2 010 3 203
Goodwill (refer note 2) 31 (37) (103)
Negative goodwill (refer note 2) – 53 122
Intangible assets (refer note 3)
cost 48 (99) (195)
accumulated amortisation (25) 54 87
Investments in securities 14 (21) (24)
Investments in associates 36 (82) (39)
Post-retirement benefit assets 22 (52) (83)
Long-term receivables 32 (107) (240)
Long-term financial assets 1 (2) (2)
Inventories 275 (549) (861)
Trade receivables 233 (471) (744)
Other receivables and prepaid expenses 53 (92) (100)
Short-term financial assets – (1) (1)
Cash and cash equivalents (175) (251) (255)
Minority interest (11) 21 16
Long-term debt (refer note 15) (167) 518 1 009
Long-term provisions (refer note 16) (72) 149 276
Post-retirement benefit obligations (96) 217 339
Long-term deferred income (53) 35 20
Deferred tax (refer note 19) (89) 231 377
Short-term debt (refer note 20) (27) 68 158
Short-term financial liabilities (1) – 1
Short-term provisions (refer note 22) (31) 81 143
Tax payable (refer note 23) (8) 11 60
Trade payables (154) 315 526
Other payables and accrued expenses (505) 915 (324)
127 (923) (2 627)
Arising from net investment in foreign entities 211 (541) 140
Less tax effect thereon
normal – – (115)
deferred – 5 32
Movement for year 338 (1 459) (2 570)
Transfer from cash flow hedge accounting reserve – 199 –
Effect of negative goodwill written off (80) – –
Disposal of businesses (25) 43 –
Balance at beginning of year (1 569) (352) 2 218
Balance at end of year (1 336) (1 569) (352)
103notes to the financial statements
sasol limited group
equity structure continued
102
2005 2004 2003
for the year ended 30 June Rm Rm Rm
39 Foreign currency translation reserve (continued)
Business segmentation
Synfuels International (856) (689) (462)
Polymers (196) (237) (169)
Olefins & Surfactants (164) (226) (16)
Petroleum International (97) (132) (148)
Financing (67) (278) 296
Wax (60) (62) (103)
Solvents 60 14 70
Merisol 23 19 39
Other 21 22 141
(1 336) (1 569) (352)
2005 2004 2003
Number of Number of Number of
for the year ended 30 June shares shares shares
40 Share repurchase programmeHeld by the wholly owned subsidiary,
Sasol Investment Company (Pty) Limited
Balance at beginning of year 60 111 477 59 741 477 57 857 149
Repurchased during year – 370 000 1 884 328
Balance at end of year 60 111 477 60 111 477 59 741 477
Percentage of issued share capital 8,88% 8,95% 8,93%
2005 2004 2003
for the year ended 30 June Rand Rand Rand
Average cumulative purchase price 60,67 60,67 60,49
Average purchase price during year – 88,85 97,84
At each annual general meeting since 25 October 1999 the shareholders have authorised the directors to approve the
repurchase, by Sasol Limited or any of its subsidiaries, of Sasol Limited shares, subject to the provisions of the South African
Companies Act and the requirements of the JSE Limited.

2005 2004 2003
Note Rm Rm Rm
Cash generated by operating activities 41 18 812 15 151 15 997Cash flow from operations 42 20 993 14 859 15 986Movement in working capital 43 (2 181) 292 11Investment income 44 169 230 178Dividends paid 45 (2 856) (2 745) (2 835)Non-current assets sold 46 478 746 504Acquisition of businesses 47 – (555) (155)Disposal of businesses 48 36 283 –
2005 2004 2003
for the year ended 30 June Rm Rm Rm
41 Cash generated by operating activitiesCash flow from operations (refer note 42) 20 993 14 859 15 986Movement in working capital (refer note 43) (2 181) 292 11
18 812 15 151 15 997
42 Cash flow from operationsOperating profit 14 506 9 314 11 911Adjusted for
amortisation ofgoodwill – 21 42negative goodwill – (225) (301)intangible assets 418 502 314
capitalised exploration expenditure written off 33 153 –deferred income 466 191 51depreciation of property, plant and equipment 3 591 4 723 4 468effect of cash flow hedge accounting 23 33 (46)impairment of
property, plant and equipment 808 310 5goodwill 213 70 73negative goodwill – (87) –intangible assets 13 13 5investments in securities 2 5 –investments in associates 42 31 –
(profit)/loss on disposal ofproperty, plant and equipment (20) (106) 16intangible assets – (52) (84)investments in businesses (31) (75) 158investments in securities (9) – –
movement in provision for doubtful debts 9 58 (147)movement in long-term prepaid expenses 22 – –movement in long-term provisions
income statement charge 567 351 55utilisation (461) (359) (430)
movement in short-term provisions 138 162 (322)movement in post-retirement benefit
assets (39) – (37)obligations 154 387 140
profit on dilution of interest in Sasol Oil (Pty) Limited – (108) –scrapping of property, plant and equipment 290 26 69translation of net investment in foreign entities 211 (541) –write-down of inventories to net realisable value 47 62 46
20 993 14 859 15 986
105notes to the financial statements
sasol limited group
liquidity and capital resources
104
2005 2004 2003for the year ended 30 June Rm Rm Rm
43 Movement in working capital
Movement in inventoriesPer the balance sheet (1 703) 456 265Acquisition of businesses (refer note 47) – 8 142Write-down of inventories to net realisable value (47) (62) (46)Disposal of businesses (refer note 48) (68) (122) –Translation of foreign entities (refer note 39) 275 (549) (861)
(1 543) (269) (500)
Movement in trade receivablesPer the balance sheet (1 117) 162 1 281Acquisition of businesses (refer note 47) – 333 325Movement in provision for doubtful debts (9) (58) 147Disposal of businesses (refer note 48) (83) (165) –Translation of foreign entities (refer note 39) 233 (471) (744)
(976) (199) 1 009
Movement in other receivables and prepaid expensesPer the balance sheet (296) (647) (1 252)Movement in short-term portion of long-term receivables (188) 143 –Acquisition of businesses (refer note 47) – 2 31Disposal of businesses (refer note 48) (13) (13) –Translation of foreign entities (refer note 39) 53 (92) (100)
(444) (607) (1 321)
Movement in trade payablesPer the balance sheet 847 (174) (166)Acquisition of businesses (refer note 47) – (514) (91)Disposal of businesses (refer note 48) 39 117 –Translation of foreign entities (refer note 39) (154) 315 526
732 (256) 269
Movement in other payables and accrued expensesPer the balance sheet 914 166 838Acquisition of businesses (refer note 47) – (3) (372)Effect of cash flow hedge accounting – (9) –Disposal of businesses (refer note 48) 45 24 –Translation of foreign entities (refer note 39) (505) 915 (324)
454 1 093 142
Movement in financial assets and liabilitiesLong-term financial assets (2) – (2)Short-term financial assets 15 (12) 219Short-term financial liabilities (417) 542 195
(404) 530 412
Movement in working capital (2 181) 292 11
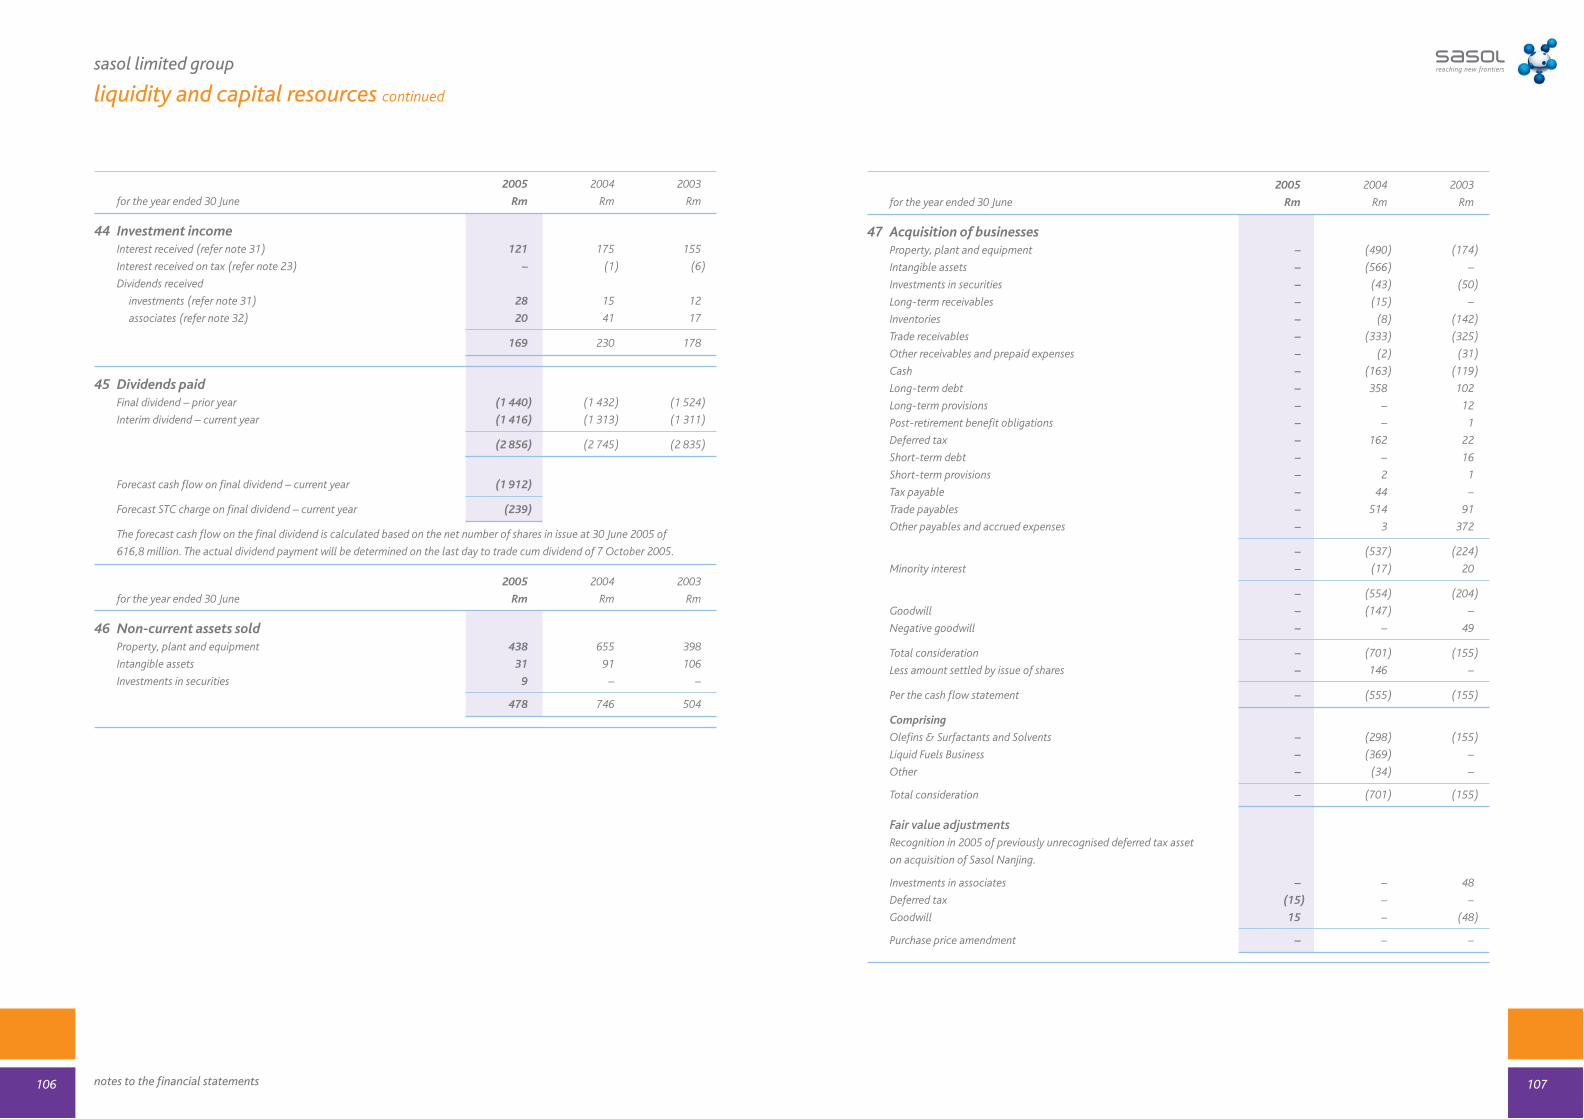
2005 2004 2003
for the year ended 30 June Rm Rm Rm
44 Investment incomeInterest received (refer note 31) 121 175 155
Interest received on tax (refer note 23) – (1) (6)
Dividends received
investments (refer note 31) 28 15 12
associates (refer note 32) 20 41 17
169 230 178
45 Dividends paidFinal dividend – prior year (1 440) (1 432) (1 524)
Interim dividend – current year (1 416) (1 313) (1 311)
(2 856) (2 745) (2 835)
Forecast cash flow on final dividend – current year (1 912)
Forecast STC charge on final dividend – current year (239)
The forecast cash flow on the final dividend is calculated based on the net number of shares in issue at 30 June 2005 of
616,8 million. The actual dividend payment will be determined on the last day to trade cum dividend of 7 October 2005.
2005 2004 2003
for the year ended 30 June Rm Rm Rm
46 Non-current assets soldProperty, plant and equipment 438 655 398
Intangible assets 31 91 106
Investments in securities 9 – –
478 746 504
107notes to the financial statements
sasol limited group
liquidity and capital resources continued
106
2005 2004 2003
for the year ended 30 June Rm Rm Rm
47 Acquisition of businessesProperty, plant and equipment – (490) (174)
Intangible assets – (566) –
Investments in securities – (43) (50)
Long-term receivables – (15) –
Inventories – (8) (142)
Trade receivables – (333) (325)
Other receivables and prepaid expenses – (2) (31)
Cash – (163) (119)
Long-term debt – 358 102
Long-term provisions – – 12
Post-retirement benefit obligations – – 1
Deferred tax – 162 22
Short-term debt – – 16
Short-term provisions – 2 1
Tax payable – 44 –
Trade payables – 514 91
Other payables and accrued expenses – 3 372
– (537) (224)
Minority interest – (17) 20
– (554) (204)
Goodwill – (147) –
Negative goodwill – – 49
Total consideration – (701) (155)
Less amount settled by issue of shares – 146 –
Per the cash flow statement – (555) (155)
Comprising
Olefins & Surfactants and Solvents – (298) (155)
Liquid Fuels Business – (369) –
Other – (34) –
Total consideration – (701) (155)
Fair value adjustmentsRecognition in 2005 of previously unrecognised deferred tax asset
on acquisition of Sasol Nanjing.
Investments in associates – – 48
Deferred tax (15) – –
Goodwill 15 – (48)
Purchase price amendment – – –
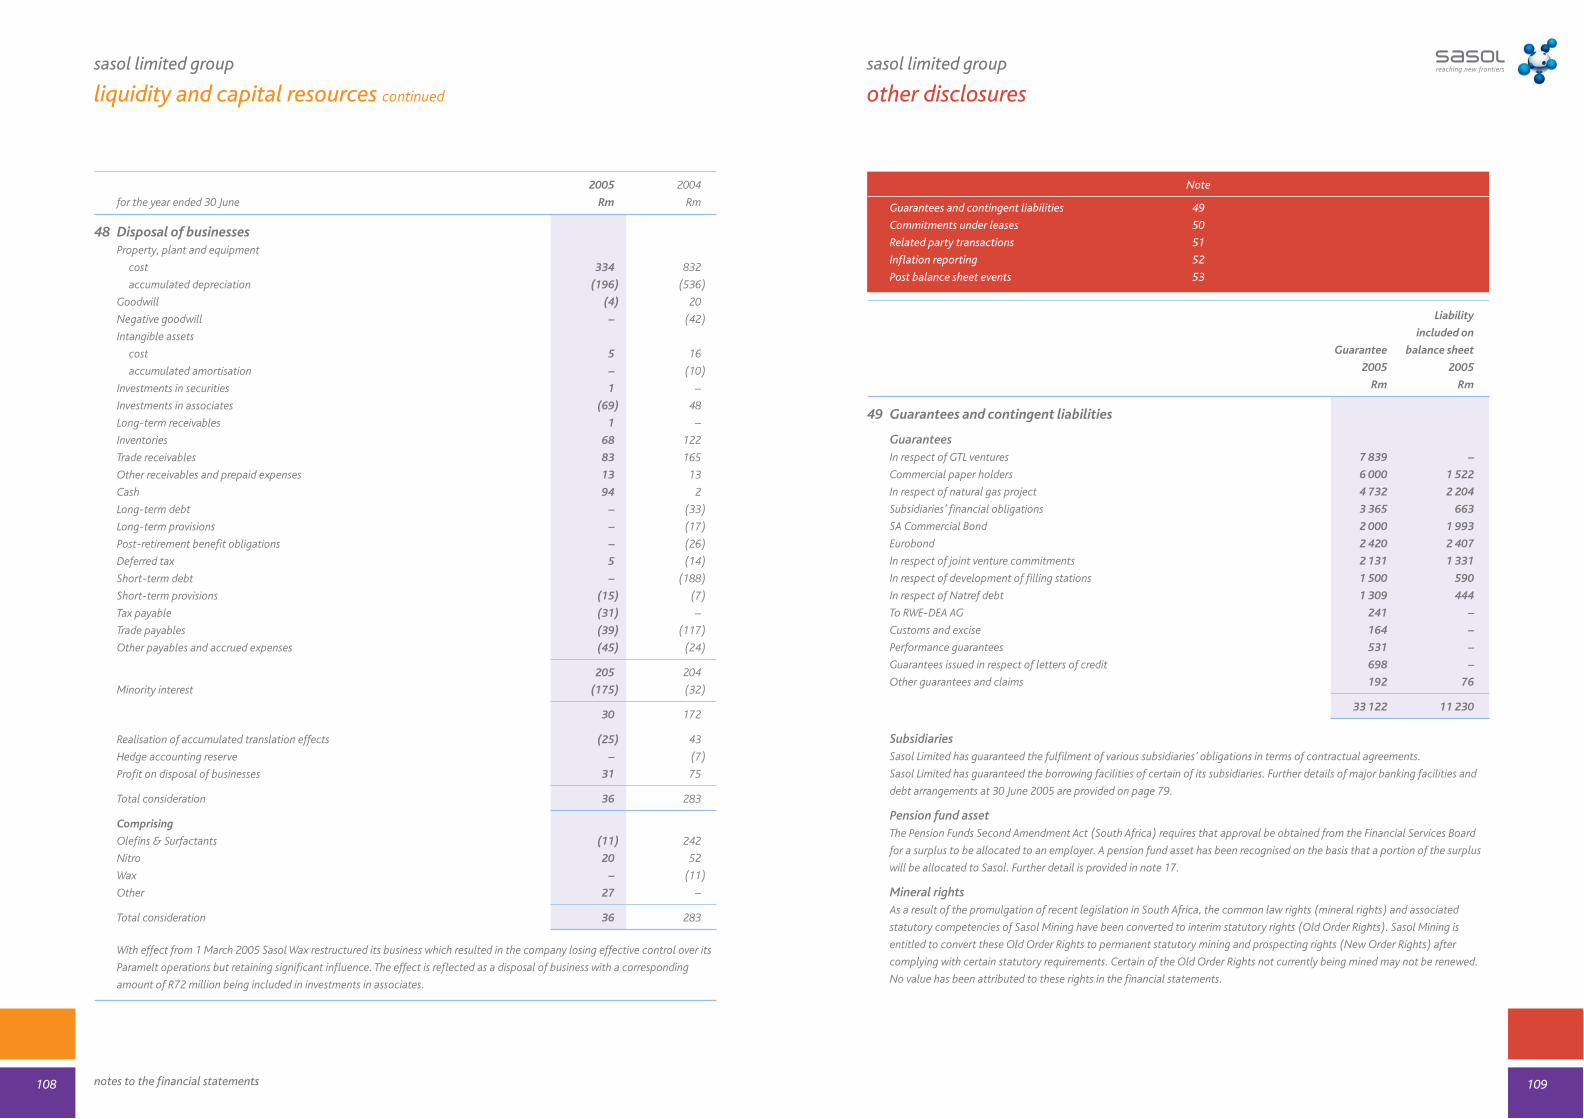
notes to the financial statements
sasol limited group
liquidity and capital resources continued
2005 2004
for the year ended 30 June Rm Rm
48 Disposal of businessesProperty, plant and equipment
cost 334 832
accumulated depreciation (196) (536)
Goodwill (4) 20
Negative goodwill – (42)
Intangible assets
cost 5 16
accumulated amortisation – (10)
Investments in securities 1 –
Investments in associates (69) 48
Long-term receivables 1 –
Inventories 68 122
Trade receivables 83 165
Other receivables and prepaid expenses 13 13
Cash 94 2
Long-term debt – (33)
Long-term provisions – (17)
Post-retirement benefit obligations – (26)
Deferred tax 5 (14)
Short-term debt – (188)
Short-term provisions (15) (7)
Tax payable (31) –
Trade payables (39) (117)
Other payables and accrued expenses (45) (24)
205 204
Minority interest (175) (32)
30 172
Realisation of accumulated translation effects (25) 43
Hedge accounting reserve – (7)
Profit on disposal of businesses 31 75
Total consideration 36 283
Comprising
Olefins & Surfactants (11) 242
Nitro 20 52
Wax – (11)
Other 27 –
Total consideration 36 283
With effect from 1 March 2005 Sasol Wax restructured its business which resulted in the company losing effective control over its
Paramelt operations but retaining significant influence. The effect is reflected as a disposal of business with a corresponding
amount of R72 million being included in investments in associates.
108
sasol limited group
other disclosures
109
Note
Guarantees and contingent liabilities 49
Commitments under leases 50
Related party transactions 51
Inflation reporting 52
Post balance sheet events 53
Liability
included on
Guarantee balance sheet
2005 2005
Rm Rm
49 Guarantees and contingent liabilities
GuaranteesIn respect of GTL ventures 7 839 –
Commercial paper holders 6 000 1 522
In respect of natural gas project 4 732 2 204
Subsidiaries’ financial obligations 3 365 663
SA Commercial Bond 2 000 1 993
Eurobond 2 420 2 407
In respect of joint venture commitments 2 131 1 331
In respect of development of filling stations 1 500 590
In respect of Natref debt 1 309 444
To RWE-DEA AG 241 –
Customs and excise 164 –
Performance guarantees 531 –
Guarantees issued in respect of letters of credit 698 –
Other guarantees and claims 192 76
33 122 11 230
SubsidiariesSasol Limited has guaranteed the fulfilment of various subsidiaries’ obligations in terms of contractual agreements.
Sasol Limited has guaranteed the borrowing facilities of certain of its subsidiaries. Further details of major banking facilities and
debt arrangements at 30 June 2005 are provided on page 79.
Pension fund assetThe Pension Funds Second Amendment Act (South Africa) requires that approval be obtained from the Financial Services Board
for a surplus to be allocated to an employer. A pension fund asset has been recognised on the basis that a portion of the surplus
will be allocated to Sasol. Further detail is provided in note 17.
Mineral rightsAs a result of the promulgation of recent legislation in South Africa, the common law rights (mineral rights) and associated
statutory competencies of Sasol Mining have been converted to interim statutory rights (Old Order Rights). Sasol Mining is
entitled to convert these Old Order Rights to permanent statutory mining and prospecting rights (New Order Rights) after
complying with certain statutory requirements. Certain of the Old Order Rights not currently being mined may not be renewed.
No value has been attributed to these rights in the financial statements.

49 Guarantees and contingent liabilities (continued)
Dorothy Molefi and others
Certain plaintiffs have sued Sasol Limited and National Petroleum Refiners of South Africa (Pty) Limited and various other
defendants in two claims in a United States District Court. The plaintiffs are represented by attorney Edward Fagan. These claims
are similar to many already served against a large number of multi-national corporations worldwide. The claims against Sasol
were consolidated with other related claims against many other multi-national corporations before the Federal Court of New
York. In November 2004 the plaintiffs’ claims in the related cases were dismissed.
Competition mattersNationwide Poles
The Competition Commission received a complaint against Sasol Oil (CarboTar division) in April 2003. The complaint was
referred by the plaintiff to the Competition Tribunal. The Competition Tribunal found against Sasol that during the period of the
complaint Sasol was a dominant firm whose conduct met the test required in establishing prohibited price discrimination. The
company filed a notice of appeal and the appeal was heard by the Competition Appeal Court during September 2005. We are
currently awaiting the outcome of the appeal.
Fertiliser competition matters
The Competition Commission alleges that Sasol, Omnia and Kynoch have engaged in price fixing or market sharing agreements
and has decided to refer its findings to the Competition Tribunal. The Commission has recommended the imposition of an
administrative penalty of 10% on turnover. Should a maximum fine be imposed on the basis of the fertiliser and ammonia
turnover of Sasol Nitro, the fine would be of the order of R320 million. Sasol has applied to the Competition Appeal Court to
have the referral set aside on the basis that a substantially similar complaint was previously rejected by the Commission and Sasol
believes the Commission did not comply with certain requirements of the Competition Act in carrying out its investigation. The
application was heard during September 2005. We are currently awaiting the outcome of the appeal.
Wax competition matters
During April 2005 the European Commission conducted an investigation at the offices of Sasol Wax International AG and its
subsidiary Sasol Wax GmbH, both located in Hamburg, Germany. A parallel investigation is being conducted by the US
Department of Justice in the USA. The investigations in the US and European Union arise from alleged anticompetitive behaviour
among industry members in the paraffin wax industry. Sasol is cooperating with the competition authorities in Europe and the
US in order to clarify this issue.
Nitro competition matters
A plaintiff filed a complaint against Sasol Nitro alleging that Sasol was engaged in an exclusionary act by refusing to supply
goods to the plaintiff. Submissions were made to the Competition Commission to the effect that during 2002, Sasol was unable
to supply the product to the plaintiff due to product shortages, that it is not dominant in the supply of that product and that it
had not engaged in price discrimination.
Other litigation
From time to time Sasol companies are involved in litigation in the normal course of business. Although the outcome of these
proceedings and claims cannot be predicted with certainty, the company does not believe that the outcome of any of these cases
would have a material effect on the company’s financial results.
Environmental orders
The group is subject to numerous national and local laws and regulations that regulate the discharge of materials into the
environment or that otherwise relate to the protection of human health and the environment in all locations in which it operates.
As with the oil and gas and chemical industries generally, compliance with existing and anticipated environmental, health, safety
and process safety laws and regulations increases the overall cost of business, including capital costs to construct, maintain, and
upgrade equipment and facilities. These laws and regulations have required, and are expected to continue to require, the group
to incur significant expenditures of both a capital and expense nature.
49 Guarantees and contingent liabilities (continued)
LitigationEDC pipeline litigation
Sasol North America Inc had numerous separate pending cases which originated as a result of a 1994 rupture of the Conoco
Ethylene Dichloride (EDC) pipeline connecting Conoco’s dock to Sasol North America’s vinyl chloride monomer plant in the
United States of America. Plaintiffs sought compensatory and punitive damages as a result of alleged exposure to EDC while
employed as contractors, hired by Conoco, to clean up the EDC. As of 30 June 2005 there is a class action and 13 lawsuits
brought by approximately 500 plaintiffs pending. Sasol North America has successfully obtained a substantial amount of
insurance coverage from costs incurred in connection with this litigation but is not seeking additional coverage.
Under the Asset and Share purchase agreement with RWE-DEA for the acquisition of Condea, the costs in respect of the
EDC pipeline cases are reimbursable by RWE-DEA less insurance and tax benefits.
Sulphur dioxide release
During January 2003 Sasol North America Inc and the ConocoPhillips refinery released a quantity of sulphur dioxide to the
environment as a result of a power outage in the ConocoPhillips Lake Charles refinery. Lawsuits were filed against ConocoPhillips
and Sasol North America has since been added as a defendant. At 30 June 2005 more than 600 lawsuits have been filed on behalf
of more than 20 000 plaintiffs. ConocoPhillips and Sasol North America are jointly defending the lawsuits and Sasol’s liability for
defence and settlement costs has been limited to an amount that is not material for group purposes.
Alumina supply contract
A plaintiff has filed a suit against Sasol Olefins & Surfactants Germany and Sasol North America in March 2005 alleging breach
of a 2001 alumina supply contract as well as monopolisation and price discrimination in the high purity alumina market resulting
in damages totalling US$60 million. On 8 September 2005, the plaintiff dismissed its suit without prejudice.
Yellow Rock litigation
In July 2005 Sasol North America received notice of suit by Yellow Rock LLC alleging over US$1 million in damages and seeking
an injunction that would require Sasol North America to remove its ethylene from Salt Storage Dome 1-A in Sulphur, Louisiana.
The suit alleges that in winter 2004 Dome 1-A was leaking ethylene and caused the ‘blow out’ of an oil and gas exploration well
being drilled by Yellow Rock. A well integrity assessment performed by an independent consultant in early 2005 had concluded
that the Dome 1-A was not leaking. These results were conveyed to Yellow Rock and were signed off by the Louisiana Department
of Natural Resources, but did not deter the filing of suit.
Fly ash plant
Sasol Synfuels (Pty) Limited is in legal proceedings with regard to its alleged obligations in respect of the operation of the fly ash
plant in Secunda. The plaintiff has claimed damages of R313 million relating to their inability to develop their fly ash business and
a projected loss of future cash flows. The trial is in progress.
Retail filling station guidelines
The Gauteng Department of Agriculture Conservation Environment and Land Affairs (DACE) has developed guidelines relating to
the development and upgrading of filling stations within the Gauteng region in South Africa which constrain the development of
service stations. A number of applications for authorisation of filling stations in which Sasol Oil (Pty) Limited has an interest have
been rejected. A number of appeals were lodged, one of which was taken on review to the High Court. Sasol was successful
insofar as the court found that DACE had relied on inappropriate and irrelevant considerations in coming to its decision. The State
took the matter on appeal to the Supreme Court of Appeal and the appeal was successful.
Joel Nagashigo and others
A class action in a New York District Court by an undisclosed number of plaintiffs (represented by attorney Edward Fagan) are
each claiming US$1 million plus punitive damages of US$5 million in respect of each claim based on negligence, product
liability, failure to warn of dangers and emotional distress together with actual damages for past and future medical expenses.
Sasol Limited and National Petroleum Refiners of South Africa (Pty) Limited and other non-Sasol companies are cited as
defendants. During December 2004, the court dismissed the complaint for lack of personal jurisdiction and on the basis of
inconvenient forum.
111notes to the financial statements
sasol limited group
other disclosures continued
110
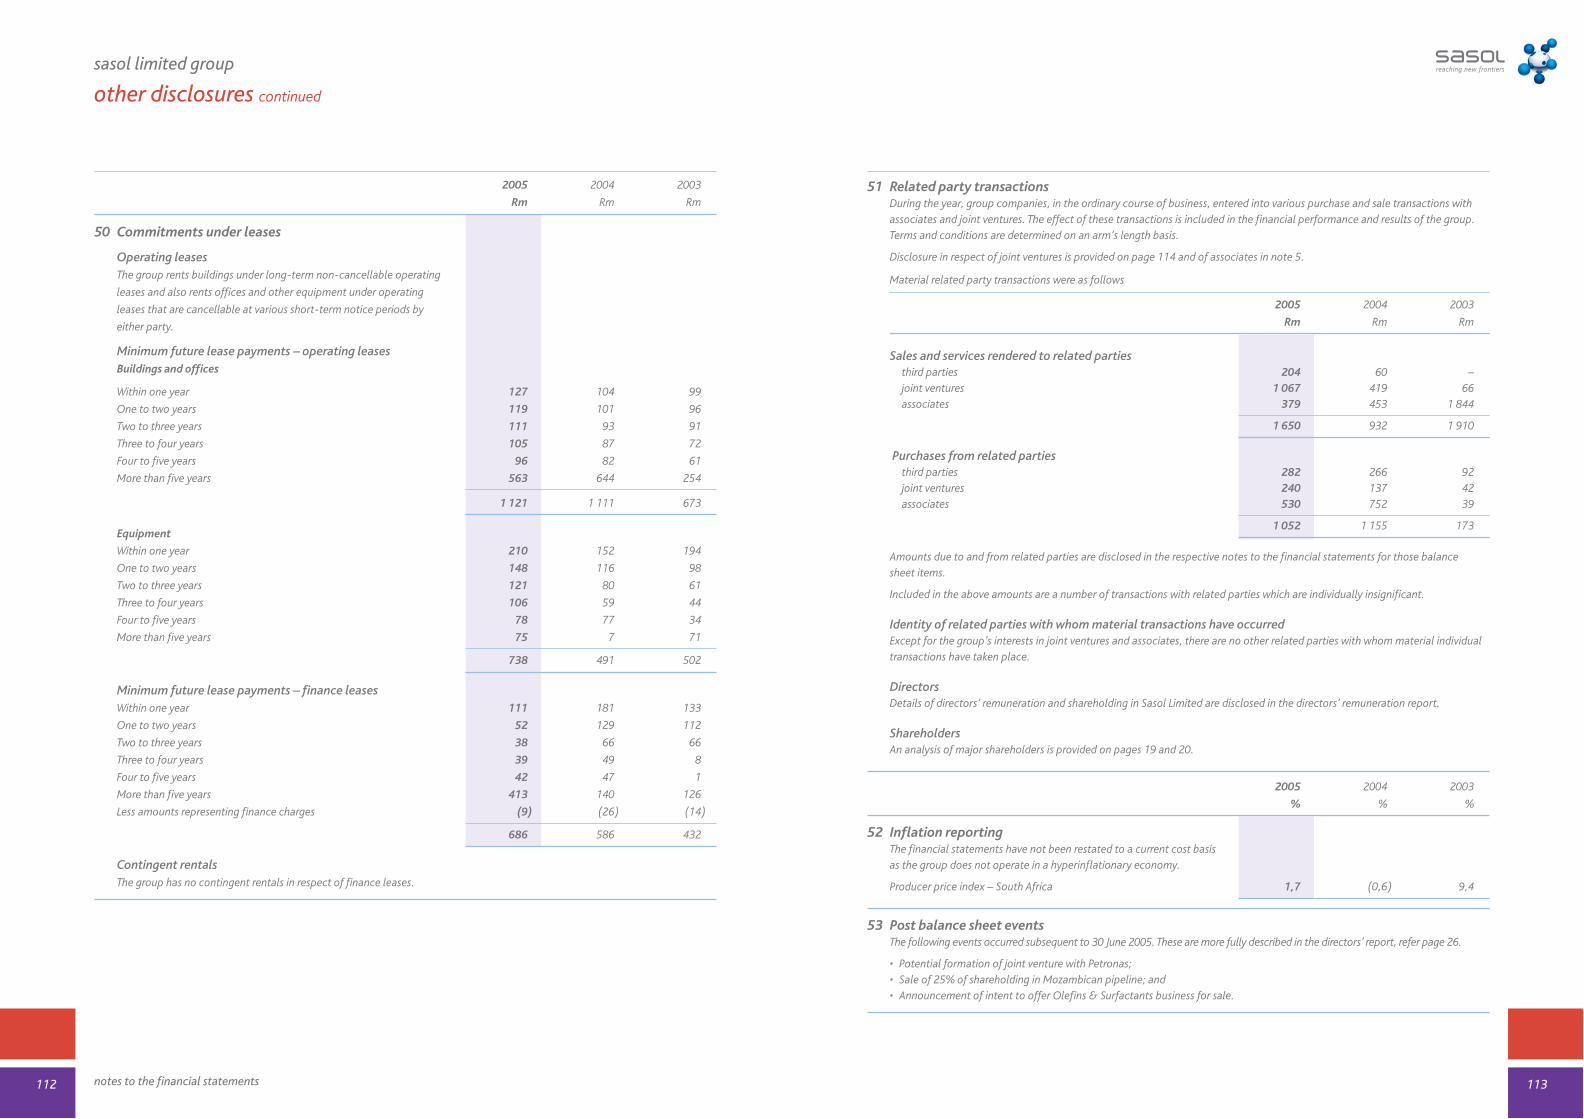
2005 2004 2003
Rm Rm Rm
50 Commitments under leases
Operating leasesThe group rents buildings under long-term non-cancellable operating
leases and also rents offices and other equipment under operating
leases that are cancellable at various short-term notice periods by
either party.
Minimum future lease payments – operating leasesBuildings and offices
Within one year 127 104 99
One to two years 119 101 96
Two to three years 111 93 91
Three to four years 105 87 72
Four to five years 96 82 61
More than five years 563 644 254
1 121 1 111 673
Equipment
Within one year 210 152 194
One to two years 148 116 98
Two to three years 121 80 61
Three to four years 106 59 44
Four to five years 78 77 34
More than five years 75 7 71
738 491 502
Minimum future lease payments – finance leasesWithin one year 111 181 133
One to two years 52 129 112
Two to three years 38 66 66
Three to four years 39 49 8
Four to five years 42 47 1
More than five years 413 140 126
Less amounts representing finance charges (9) (26) (14)
686 586 432
Contingent rentalsThe group has no contingent rentals in respect of finance leases.
113
sasol limited group
other disclosures continued
112
51 Related party transactionsDuring the year, group companies, in the ordinary course of business, entered into various purchase and sale transactions withassociates and joint ventures. The effect of these transactions is included in the financial performance and results of the group.Terms and conditions are determined on an arm’s length basis.
Disclosure in respect of joint ventures is provided on page 114 and of associates in note 5.
Material related party transactions were as follows
2005 2004 2003
Rm Rm Rm
Sales and services rendered to related partiesthird parties 204 60 –joint ventures 1 067 419 66associates 379 453 1 844
1 650 932 1 910
Purchases from related partiesthird parties 282 266 92joint ventures 240 137 42associates 530 752 39
1 052 1 155 173
Amounts due to and from related parties are disclosed in the respective notes to the financial statements for those balance sheet items.
Included in the above amounts are a number of transactions with related parties which are individually insignificant.
Identity of related parties with whom material transactions have occurredExcept for the group’s interests in joint ventures and associates, there are no other related parties with whom material individualtransactions have taken place.
DirectorsDetails of directors’ remuneration and shareholding in Sasol Limited are disclosed in the directors’ remuneration report.
ShareholdersAn analysis of major shareholders is provided on pages 19 and 20.
2005 2004 2003
% % %
52 Inflation reportingThe financial statements have not been restated to a current cost basisas the group does not operate in a hyperinflationary economy.
Producer price index – South Africa 1,7 (0,6) 9,4
53 Post balance sheet eventsThe following events occurred subsequent to 30 June 2005. These are more fully described in the directors’ report, refer page 26.
• Potential formation of joint venture with Petronas;• Sale of 25% of shareholding in Mozambican pipeline; and• Announcement of intent to offer Olefins & Surfactants business for sale.
notes to the financial statements

sasol limited group
financial risk management and financial instruments
Additional disclosure provided for information purposes. In accordance with the group’s accounting policy, the results of joint
ventures are proportionately consolidated on a line by line basis and include intercompany transactions and balances.
Spring PolymersSasol Lights joint Dia 2005 2004 2003
GTL Merisol Gas ventures* Acrylates Other** Total Total TotalRm Rm Rm Rm Rm Rm Rm Rm Rm
Balance sheet
Property, plant and equipment 3 954 298 – 1 716 1 449 143 7 560 4 878 1 379
Other non-current assets 8 7 61 269 130 21 496 (267) 168
Current assets 1 001 263 18 366 614 104 2 366 1 271 627
Total assets 4 963 568 79 2 351 2 193 268 10 422 5 882 2 174
Shareholders’ equity 1 600 327 10 869 1 029 125 3 960 2 061 963
Long-term debt (interest-bearing) 1 621 48 54 928 754 54 3 459 2 417 433
Long-term provisions – 29 – 74 – – 103 20 44
Other non-current liabilities 918 27 – – – 2 947 455 392
Interest-bearing current liabilities 5 47 6 242 4 28 332 242 –
Non-interest bearing current liabilities 819 90 9 238 406 59 1 621 687 342
Total equity and liabilities 4 963 568 79 2 351 2 193 268 10 422 5 882 2 174
Income statement
Turnover – 528 62 977 1 127 349 3 043 1 990 945
Operating profit/(loss) (64) 28 27 20 161 82 254 (83) (35)
Other charges (2) (3) (7) (19) (70) (3) (104) (60) (1)
Net income before tax (66) 25 20 1 91 79 150 (143) (36)
Taxation (2) (16) (7) (3) 111 (17) 66 (29) (37)
Attributable earnings/(loss) (68) 9 13 (2) 202 62 216 (172) (73)
Cash flow statement
Cash flow from operations 430 28 31 53 242 91 875 (253) 134
Movement in working capital 429 28 – (13) (88) 3 359 (370) 14
Taxation (paid)/received (93) (5) (2) (12) – – (112) (29) 289
Other charges (47) (5) (7) (37) (74) (3) (173) (82) (54)
Cash available from operations 719 46 22 (9) 80 91 949 (734) 383
Dividends paid – – – – – (2) (2) (3) (46)
Cash retained from operations 719 46 22 (9) 80 89 947 (737) 337
Cash flow from investing activities (1 475) (115) – (584) (33) (6) (2 213) (2 918) (1 335)
Cash flow from financing activities 1 270 16 (19) 577 (33) (78) 1 733 3 720 1 098
Decrease/(increase) in cash and
cash equivalents 514 (53) 3 (16) 14 5 467 65 100
* Comprising Arya Sasol Polymers, Petlin and DPI Plastics.
** Includes Sasol Huntsman, African Amines, Sasol Oil Petromoc, Sasol Lurgi, Macadam Franchise Company and Sasol Fibres.
At 30 June 2005, the group’s share of the total capital commitments of joint ventures amounted to R8 454 million
(2004 – R8 461 million; 2003 – R8 339 million).
The GTL businesses’ costs are associated with the advancing GTL projects in Qatar and Nigeria and evaluation of other projects in
accordance with the group’s strategy.
115
sasol limited group
interest in joint ventures
114
IntroductionThe Sasol group has a risk management and central treasury function that manages the financial risks relating to the group’s
operations. The group’s liquidity, credit, foreign currency, interest rate and commodity price risks are continuously monitored. The
group has developed a comprehensive risk management process to monitor and control these risks. The group risk management
committee and senior management meet regularly to review and, if appropriate, approve the implementation of optimal strategies
for the effective management of financial risk.
Risk profileIn the course of the group’s business operations it is exposed to financial risks relating to liquidity, credit, foreign currency, interest
rate and commodity price risk. Risk management relating to each of these risks is discussed under the headings below. The group’s
objective in using derivative instruments for hedging purposes is to reduce the uncertainty over future cash flows arising from foreign
currency, interest rate and commodity price risk exposures.
Liquidity riskThe group manages liquidity risk by effectively managing its working capital, capital expenditure and cash flows. The group finances
its operations through a mixture of retained earnings, short-and long-term bank funding, a commercial paper programme and
corporate bond issues. Adequate banking facilities and reserve borrowing capacities are maintained (refer page 79). The group has
sufficient undrawn call/demand borrowing facilities, which could be utilised to fund any potential shortfall in cash resources.
Credit riskCredit risk, or the risk of counterparties defaulting, is controlled by the application of credit approvals, limits and monitoring
procedures. Where appropriate, the group obtains appropriate collateral to mitigate risk. Counterparty credit limits are in place and
are reviewed and approved by the respective subsidiary boards.
Trade receivables consist of a large number of customers spread across diverse industries and geographical areas. Adequate provision
is made for doubtful debts. No single customer represents more than 10% of the group’s total turnover or total trade receivables for
the years ended 30 June 2005 and 30 June 2004.
Treasury counterparties consist of a diversified group of prime financial institutions. The group does not expect any treasury
counterparties to fail to meet their obligations, given their high credit ratings.
Credit risk exposure in respect of trade receivables is analysed as follows
2005 2005 2004 2004
By business segment Rm % Rm %
Mining 139 2 66 1
Synfuels 112 1 120 2
Liquid Fuels Business 1 976 23 1 894 25
Gas 146 2 156 2
Olefins & Surfactants 2 955 34 2 487 33
Polymers 878 10 847 11
Solvents 1 302 15 1 041 14
Other businesses 1 160 13 940 12
8 668 100 7 551 100

2005 2005 2004 2004
By geographic location Rm % Rm %
South Africa 3 362 39 3 209 42
Rest of Africa 372 4 220 3
Europe 2 860 33 2 445 32
Germany 610 7 629 8
Italy 827 10 466 6
The Netherlands 142 2 188 2
Rest of Europe 1 281 14 1 162 16
Middle East and India 233 3 230 3
Far East 374 4 349 5
North America 973 11 790 11
South America 243 3 155 2
South-East Asia and Australasia 251 3 153 2
8 668 100 7 551 100
Foreign exchange riskThe group’s operations have various foreign currencies as their measurement currencies and, consequently, are exposed to exchange
rate fluctuations that have an impact on cash flows and financing activities. Foreign exchange risks are managed through the group’s
financing policies and the selective use of forward exchange contracts, cross currency swaps and cross currency options. Foreign
exchange contracts are utilised to reduce foreign currency exposures arising from imports into South Africa.
All foreign exchange derivative contracts are supported by underlying commitments or receivables.
The fair value gain/(loss) calculated below was determined by recalculating the daily forward rates for each currency using a forward
rate interpolator model. The net market value of all forward exchange contracts at year end was then calculated by comparing the
forward exchange contracted rates to the equivalent year end market foreign exchange rates. The present value of these net market
values were then calculated using the appropriate currency specific discount curve.
117
sasol limited group
financial risk management and financial instruments continued
116
The following forward exchange contracts and cross currency swaps were held at 30 June 2005
Contract Contract Averageforeign amount rate Estimated
currency – rand of fair valueamount equivalent exchange gain/(loss)million Rm (calculated) Rm
Forward exchange contractsRelated to transactions which have already occurredImports – capitalUS dollar 6 43 6,94 (2)Euro 5 41 8,75 (3)
84 (5)
Imports – goodsUS dollar 107 717 6,68 –Euro 1 10 8,23 –Other currencies – US$ equivalent 5 36 7,03 (2)
763 (2)
ExportsUS dollar 78 505 6,47 (40)Euro 4 30 8,04 –Pound Sterling 7 78 11,77 (1)Other currencies – US$ equivalent 11 75 6,63 (1)
688 (42)
Other payables (liabilities)US dollar 49 332 6,73 3Euro – 4 8,13 –Pound Sterling 2 24 12,03 –Other currencies – US$ equivalent 1 9 6,67 (1)
369 2
Other receivables (assets)US dollar 228 1 482 6,49 (24)Euro – – 2
1 482 (22)
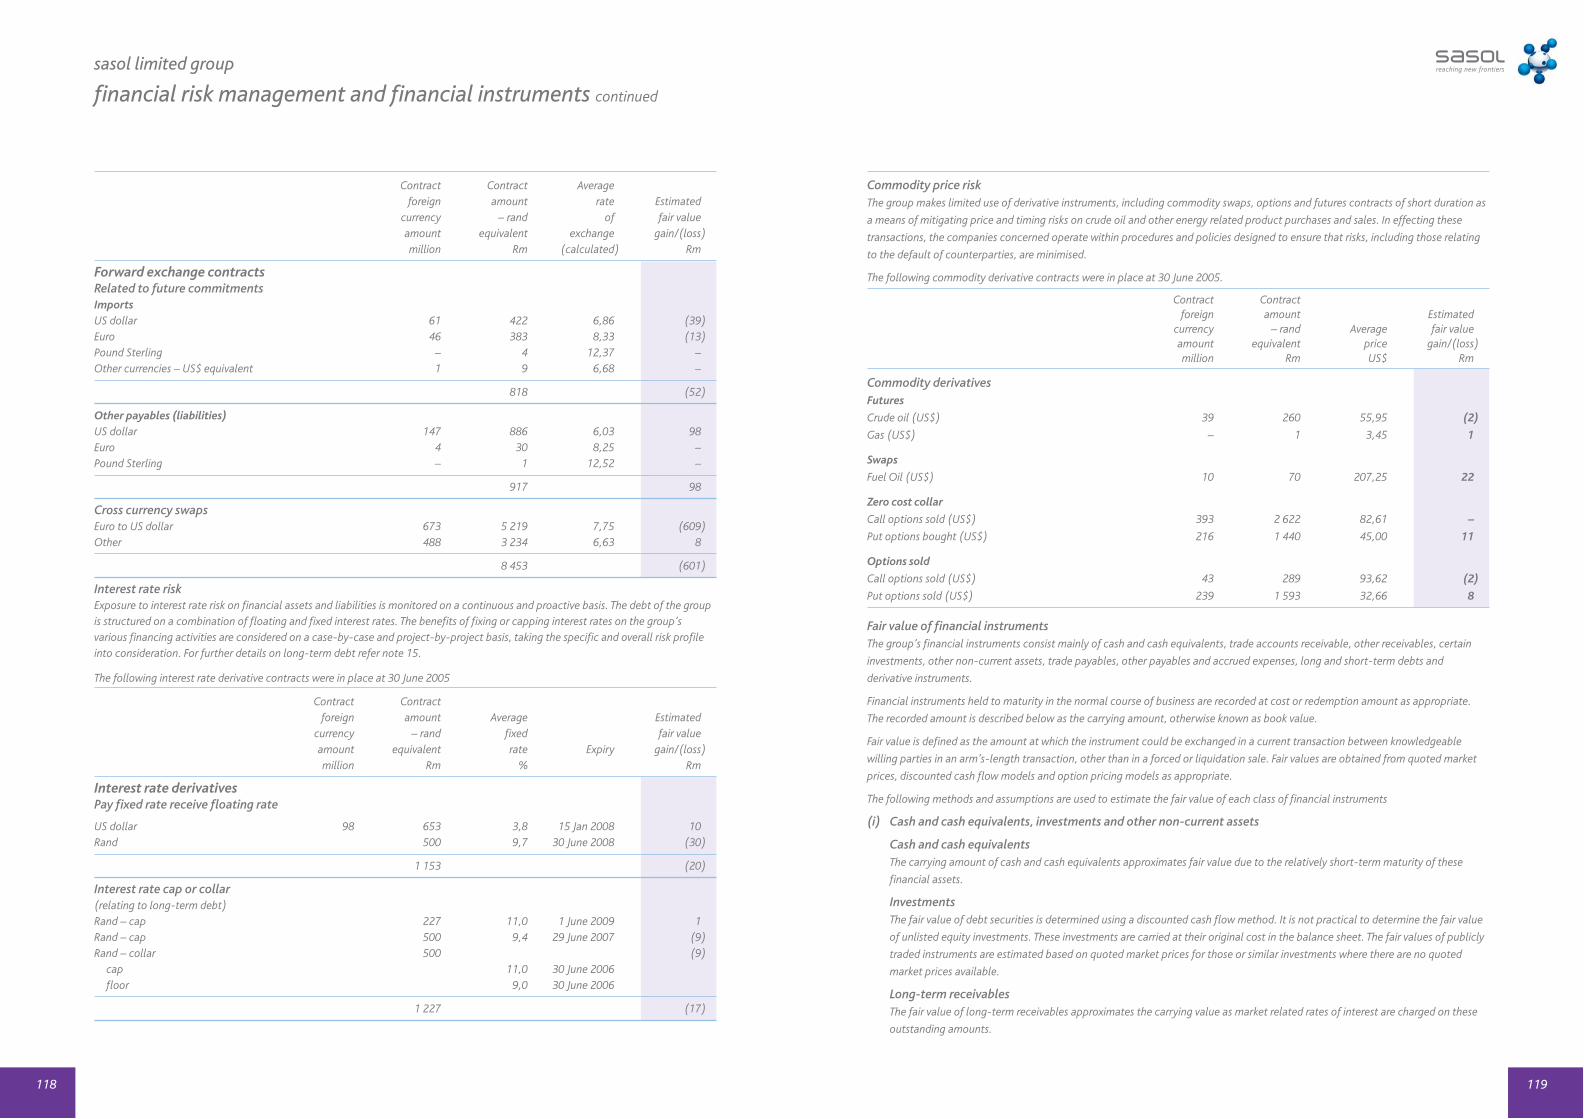
Contract Contract Averageforeign amount rate Estimated
currency – rand of fair valueamount equivalent exchange gain/(loss)million Rm (calculated) Rm
Forward exchange contractsRelated to future commitmentsImportsUS dollar 61 422 6,86 (39)Euro 46 383 8,33 (13)Pound Sterling – 4 12,37 –Other currencies – US$ equivalent 1 9 6,68 –
818 (52)
Other payables (liabilities)US dollar 147 886 6,03 98Euro 4 30 8,25 –Pound Sterling – 1 12,52 –
917 98
Cross currency swapsEuro to US dollar 673 5 219 7,75 (609)Other 488 3 234 6,63 8
8 453 (601)
Interest rate riskExposure to interest rate risk on financial assets and liabilities is monitored on a continuous and proactive basis. The debt of the groupis structured on a combination of floating and fixed interest rates. The benefits of fixing or capping interest rates on the group’svarious financing activities are considered on a case-by-case and project-by-project basis, taking the specific and overall risk profileinto consideration. For further details on long-term debt refer note 15.
The following interest rate derivative contracts were in place at 30 June 2005
Contract Contractforeign amount Average Estimated
currency – rand fixed fair valueamount equivalent rate Expiry gain/(loss)million Rm % Rm
Interest rate derivativesPay fixed rate receive floating rate
US dollar 98 653 3,8 15 Jan 2008 10Rand 500 9,7 30 June 2008 (30)
1 153 (20)
Interest rate cap or collar(relating to long-term debt)Rand – cap 227 11,0 1 June 2009 1Rand – cap 500 9,4 29 June 2007 (9)Rand – collar 500 (9)
cap 11,0 30 June 2006floor 9,0 30 June 2006
1 227 (17)
119
sasol limited group
financial risk management and financial instruments continued
118
Commodity price riskThe group makes limited use of derivative instruments, including commodity swaps, options and futures contracts of short duration as
a means of mitigating price and timing risks on crude oil and other energy related product purchases and sales. In effecting these
transactions, the companies concerned operate within procedures and policies designed to ensure that risks, including those relating
to the default of counterparties, are minimised.
The following commodity derivative contracts were in place at 30 June 2005.
Contract Contractforeign amount Estimated
currency – rand Average fair valueamount equivalent price gain/(loss)million Rm US$ Rm
Commodity derivativesFutures
Crude oil (US$) 39 260 55,95 (2)
Gas (US$) – 1 3,45 1
Swaps
Fuel Oil (US$) 10 70 207,25 22
Zero cost collar
Call options sold (US$) 393 2 622 82,61 –
Put options bought (US$) 216 1 440 45,00 11
Options sold
Call options sold (US$) 43 289 93,62 (2)
Put options sold (US$) 239 1 593 32,66 8
Fair value of financial instrumentsThe group’s financial instruments consist mainly of cash and cash equivalents, trade accounts receivable, other receivables, certain
investments, other non-current assets, trade payables, other payables and accrued expenses, long and short-term debts and
derivative instruments.
Financial instruments held to maturity in the normal course of business are recorded at cost or redemption amount as appropriate.
The recorded amount is described below as the carrying amount, otherwise known as book value.
Fair value is defined as the amount at which the instrument could be exchanged in a current transaction between knowledgeable
willing parties in an arm’s-length transaction, other than in a forced or liquidation sale. Fair values are obtained from quoted market
prices, discounted cash flow models and option pricing models as appropriate.
The following methods and assumptions are used to estimate the fair value of each class of financial instruments
(i) Cash and cash equivalents, investments and other non-current assets
Cash and cash equivalentsThe carrying amount of cash and cash equivalents approximates fair value due to the relatively short-term maturity of these
financial assets.
InvestmentsThe fair value of debt securities is determined using a discounted cash flow method. It is not practical to determine the fair value
of unlisted equity investments. These investments are carried at their original cost in the balance sheet. The fair values of publicly
traded instruments are estimated based on quoted market prices for those or similar investments where there are no quoted
market prices available.
Long-term receivablesThe fair value of long-term receivables approximates the carrying value as market related rates of interest are charged on these
outstanding amounts.
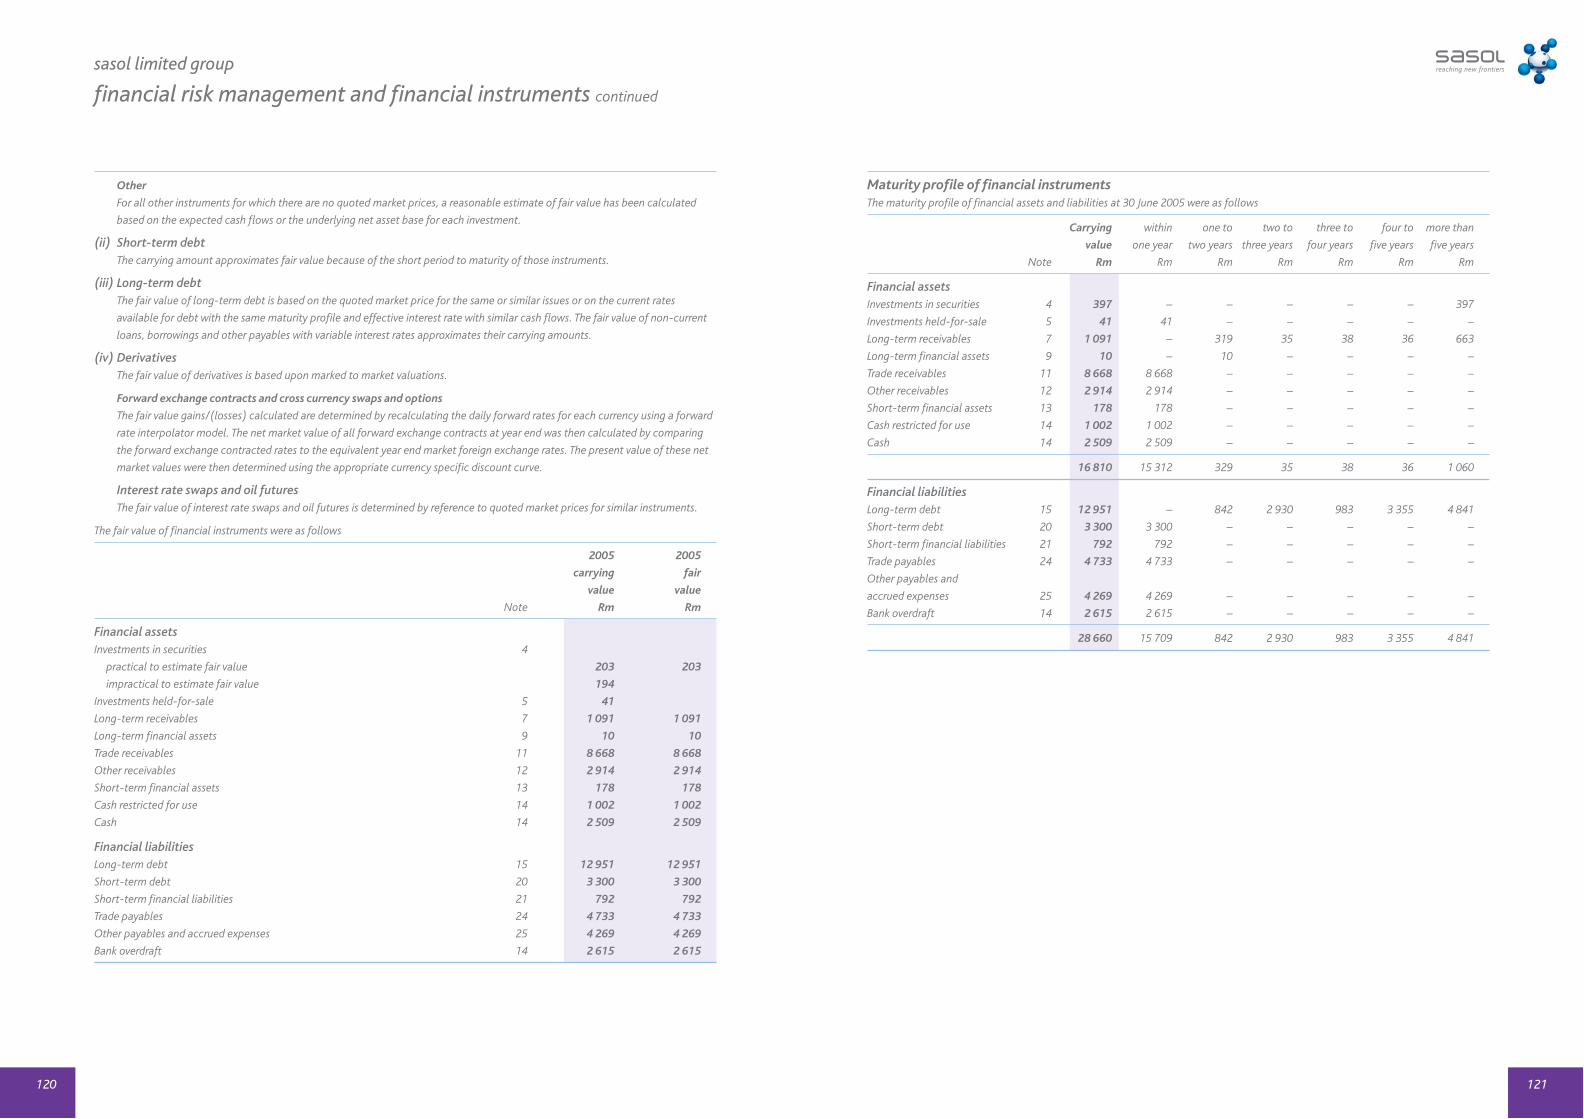
Other
For all other instruments for which there are no quoted market prices, a reasonable estimate of fair value has been calculated
based on the expected cash flows or the underlying net asset base for each investment.
(ii) Short-term debtThe carrying amount approximates fair value because of the short period to maturity of those instruments.
(iii) Long-term debtThe fair value of long-term debt is based on the quoted market price for the same or similar issues or on the current rates
available for debt with the same maturity profile and effective interest rate with similar cash flows. The fair value of non-current
loans, borrowings and other payables with variable interest rates approximates their carrying amounts.
(iv) DerivativesThe fair value of derivatives is based upon marked to market valuations.
Forward exchange contracts and cross currency swaps and options
The fair value gains/(losses) calculated are determined by recalculating the daily forward rates for each currency using a forward
rate interpolator model. The net market value of all forward exchange contracts at year end was then calculated by comparing
the forward exchange contracted rates to the equivalent year end market foreign exchange rates. The present value of these net
market values were then determined using the appropriate currency specific discount curve.
Interest rate swaps and oil futuresThe fair value of interest rate swaps and oil futures is determined by reference to quoted market prices for similar instruments.
The fair value of financial instruments were as follows
2005 2005
carrying fair
value value
Note Rm Rm
Financial assetsInvestments in securities 4
practical to estimate fair value 203 203
impractical to estimate fair value 194
Investments held-for-sale 5 41
Long-term receivables 7 1 091 1 091
Long-term financial assets 9 10 10
Trade receivables 11 8 668 8 668
Other receivables 12 2 914 2 914
Short-term financial assets 13 178 178
Cash restricted for use 14 1 002 1 002
Cash 14 2 509 2 509
Financial liabilitiesLong-term debt 15 12 951 12 951
Short-term debt 20 3 300 3 300
Short-term financial liabilities 21 792 792
Trade payables 24 4 733 4 733
Other payables and accrued expenses 25 4 269 4 269
Bank overdraft 14 2 615 2 615
121
sasol limited group
financial risk management and financial instruments continued
120
Maturity profile of financial instrumentsThe maturity profile of financial assets and liabilities at 30 June 2005 were as follows
Carrying within one to two to three to four to more than
value one year two years three years four years five years five years
Note Rm Rm Rm Rm Rm Rm Rm
Financial assetsInvestments in securities 4 397 – – – – – 397
Investments held-for-sale 5 41 41 – – – – –
Long-term receivables 7 1 091 – 319 35 38 36 663
Long-term financial assets 9 10 – 10 – – – –
Trade receivables 11 8 668 8 668 – – – – –
Other receivables 12 2 914 2 914 – – – – –
Short-term financial assets 13 178 178 – – – – –
Cash restricted for use 14 1 002 1 002 – – – – –
Cash 14 2 509 2 509 – – – – –
16 810 15 312 329 35 38 36 1 060
Financial liabilitiesLong-term debt 15 12 951 – 842 2 930 983 3 355 4 841
Short-term debt 20 3 300 3 300 – – – – –
Short-term financial liabilities 21 792 792 – – – – –
Trade payables 24 4 733 4 733 – – – – –
Other payables and
accrued expenses 25 4 269 4 269 – – – – –
Bank overdraft 14 2 615 2 615 – – – – –
28 660 15 709 842 2 930 983 3 355 4 841

Contract within one to two to
amount one year two years three years
Rm Rm Rm Rm
Forward exchange contractsTransactions which have already occurredImports – capital
US dollar 43 43 – –
Euro 41 41 – –
84 84 – –
Imports – goods
US dollar 717 717 – –
Euro 10 10 – –
Other currencies 36 33 3 –
763 760 3 –
Exports
US dollar 505 505 – –
Euro 30 30 – –
Pound Sterling 78 78 – –
Other currencies 75 75 – –
688 688 – –
Other payables (liabilities)
US dollar 332 332 – –
Euro 4 4 – –
Pound Sterling 24 24 – –
Other currencies 9 4 4 1
369 364 4 1
Other receivables (assets)
US dollar 1 482 1 482 – –
123
sasol limited group
financial risk management and financial instruments continued
122
Contract within one one to two to more than
amount year two years four years four years
Rm Rm Rm Rm Rm
Related to future commitmentsImportsUS dollar 422 413 9 – –
Euro 383 383 – – –
Pound Sterling 4 4 – – –
Other currencies 9 9 – – –
818 809 9 – –
Other payables (liabilities)US dollar 886 886 – – –
Euro 1 1 – – –
Pound Sterling 30 30 – – –
917 917 – – –
Cross currency swaps
Euro to US dollar 5 219 5 219 – – –
Other 3 234 1 201 – 106 1 927
8 453 6 420 – 106 1 927
Interest rate derivativesPay fixed rate receive floating rate
US dollar 653 65 136 300 152
Rand 500 – – 500 –
1 153 65 136 800 152
Interest rate cap or collar
Rand 1 227 500 500 38 189
Commodity derivativesFutures
Crude oil 260 260 – – –
Gas 1 1 – – –
261 261 – – –
Swaps
Fuel oil 70 70 – – –
Zero cost collar
Call options sold (US$) 2 622 2 622 – – –
Put options bought (US$) 1 440 1 440 – – –
4 062 4 062 – – –
Options sold 1 882 1 431 451 – –
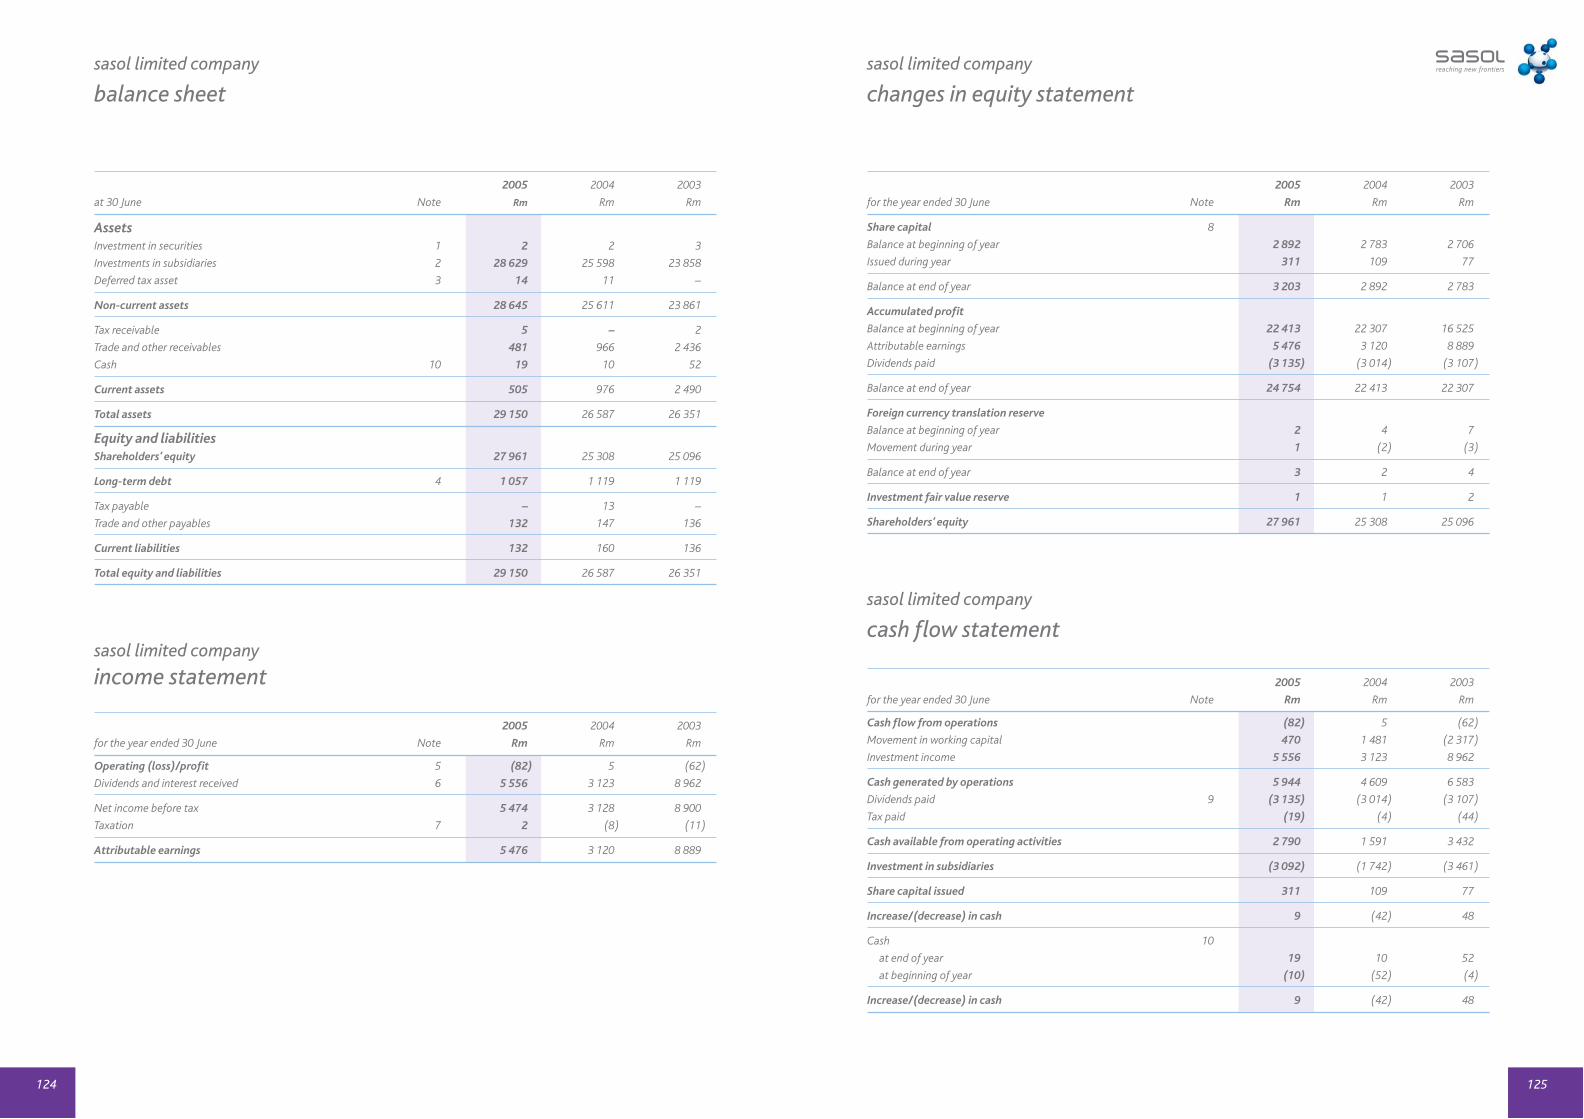
125124
sasol limited company
balance sheet
2005 2004 2003
at 30 June Note Rm Rm Rm
AssetsInvestment in securities 1 2 2 3
Investments in subsidiaries 2 28 629 25 598 23 858
Deferred tax asset 3 14 11 –
Non-current assets 28 645 25 611 23 861
Tax receivable 5 – 2
Trade and other receivables 481 966 2 436
Cash 10 19 10 52
Current assets 505 976 2 490
Total assets 29 150 26 587 26 351
Equity and liabilitiesShareholders’ equity 27 961 25 308 25 096
Long-term debt 4 1 057 1 119 1 119
Tax payable – 13 –
Trade and other payables 132 147 136
Current liabilities 132 160 136
Total equity and liabilities 29 150 26 587 26 351
sasol limited company
income statement
2005 2004 2003
for the year ended 30 June Note Rm Rm Rm
Operating (loss)/profit 5 (82) 5 (62)
Dividends and interest received 6 5 556 3 123 8 962
Net income before tax 5 474 3 128 8 900
Taxation 7 2 (8) (11)
Attributable earnings 5 476 3 120 8 889
sasol limited company
changes in equity statement
2005 2004 2003
for the year ended 30 June Note Rm Rm Rm
Share capital 8
Balance at beginning of year 2 892 2 783 2 706
Issued during year 311 109 77
Balance at end of year 3 203 2 892 2 783
Accumulated profit
Balance at beginning of year 22 413 22 307 16 525
Attributable earnings 5 476 3 120 8 889
Dividends paid (3 135) (3 014) (3 107)
Balance at end of year 24 754 22 413 22 307
Foreign currency translation reserve
Balance at beginning of year 2 4 7
Movement during year 1 (2) (3)
Balance at end of year 3 2 4
Investment fair value reserve 1 1 2
Shareholders’ equity 27 961 25 308 25 096
sasol limited company
cash flow statement
2005 2004 2003
for the year ended 30 June Note Rm Rm Rm
Cash flow from operations (82) 5 (62)
Movement in working capital 470 1 481 (2 317)
Investment income 5 556 3 123 8 962
Cash generated by operations 5 944 4 609 6 583
Dividends paid 9 (3 135) (3 014) (3 107)
Tax paid (19) (4) (44)
Cash available from operating activities 2 790 1 591 3 432
Investment in subsidiaries (3 092) (1 742) (3 461)
Share capital issued 311 109 77
Increase/(decrease) in cash 9 (42) 48
Cash 10
at end of year 19 10 52
at beginning of year (10) (52) (4)
Increase/(decrease) in cash 9 (42) 48
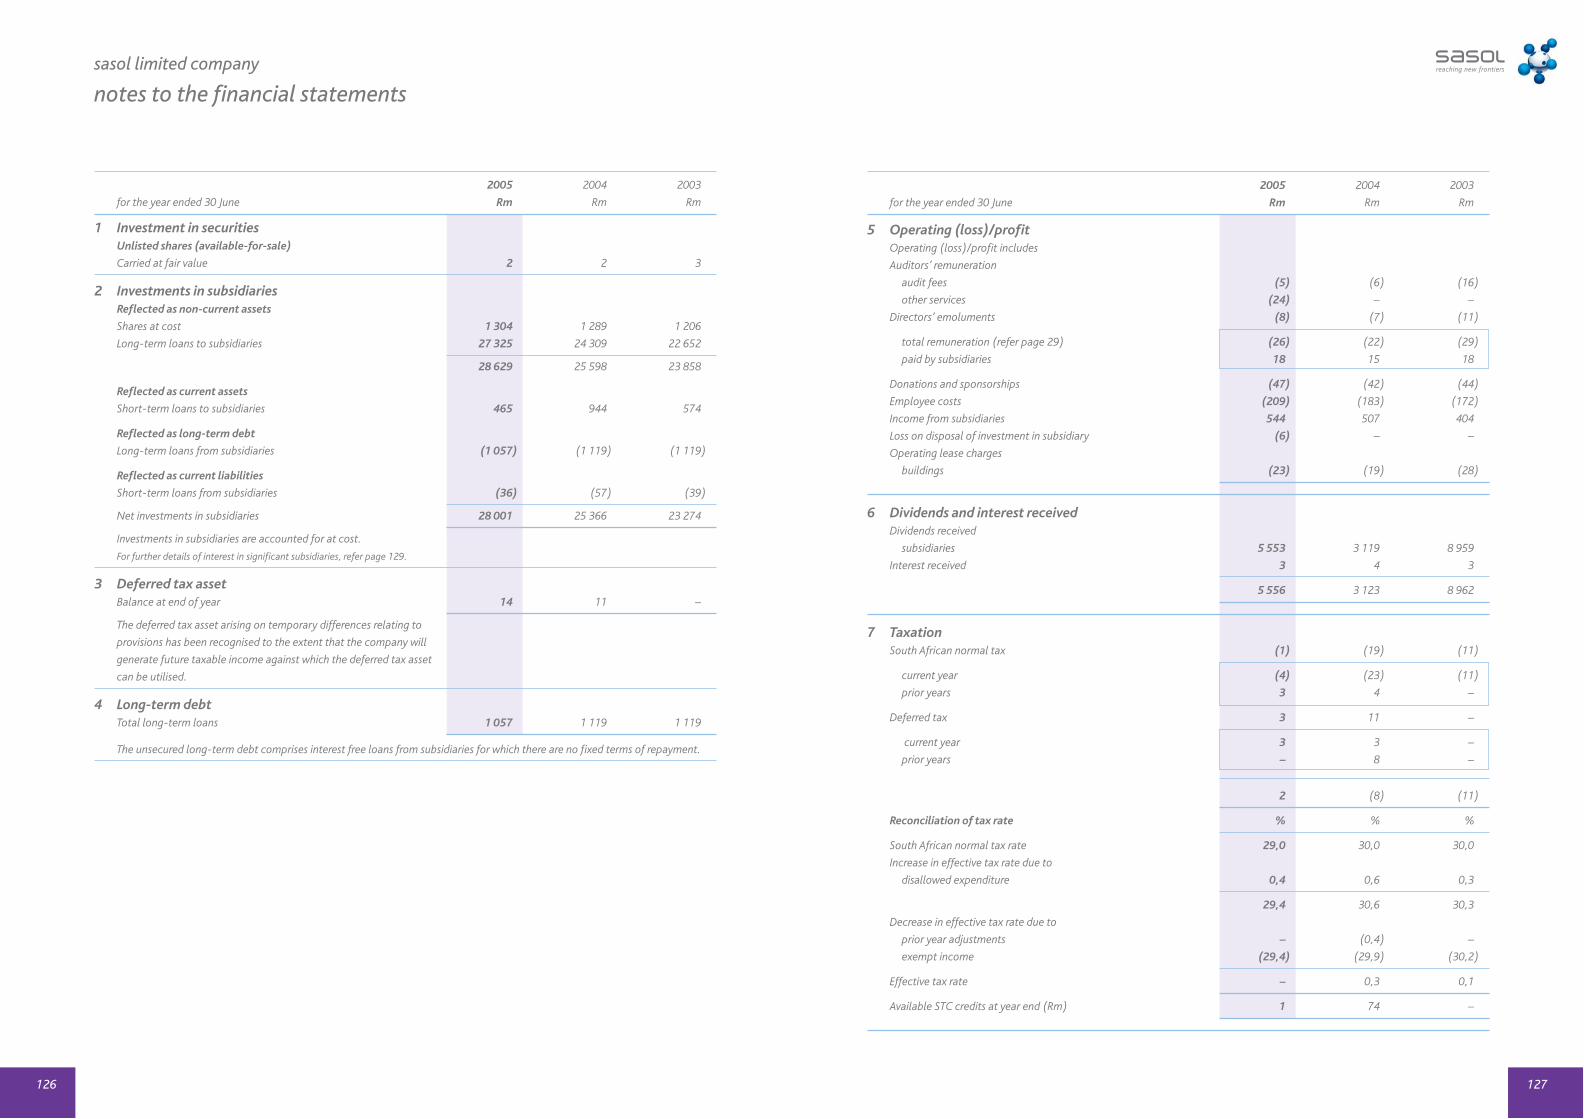
127126
sasol limited company
notes to the financial statements
2005 2004 2003
for the year ended 30 June Rm Rm Rm
1 Investment in securitiesUnlisted shares (available-for-sale)
Carried at fair value 2 2 3
2 Investments in subsidiariesReflected as non-current assets
Shares at cost 1 304 1 289 1 206
Long-term loans to subsidiaries 27 325 24 309 22 652
28 629 25 598 23 858
Reflected as current assets
Short-term loans to subsidiaries 465 944 574
Reflected as long-term debt
Long-term loans from subsidiaries (1 057) (1 119) (1 119)
Reflected as current liabilities
Short-term loans from subsidiaries (36) (57) (39)
Net investments in subsidiaries 28 001 25 366 23 274
Investments in subsidiaries are accounted for at cost.
For further details of interest in significant subsidiaries, refer page 129.
3 Deferred tax assetBalance at end of year 14 11 –
The deferred tax asset arising on temporary differences relating to
provisions has been recognised to the extent that the company will
generate future taxable income against which the deferred tax asset
can be utilised.
4 Long-term debtTotal long-term loans 1 057 1 119 1 119
The unsecured long-term debt comprises interest free loans from subsidiaries for which there are no fixed terms of repayment.
2005 2004 2003
for the year ended 30 June Rm Rm Rm
5 Operating (loss)/profitOperating (loss)/profit includes
Auditors’ remuneration
audit fees (5) (6) (16)
other services (24) – –
Directors’ emoluments (8) (7) (11)
total remuneration (refer page 29) (26) (22) (29)
paid by subsidiaries 18 15 18
Donations and sponsorships (47) (42) (44)
Employee costs (209) (183) (172)
Income from subsidiaries 544 507 404
Loss on disposal of investment in subsidiary (6) – –
Operating lease charges
buildings (23) (19) (28)
6 Dividends and interest receivedDividends received
subsidiaries 5 553 3 119 8 959
Interest received 3 4 3
5 556 3 123 8 962
7 TaxationSouth African normal tax (1) (19) (11)
current year (4) (23) (11)
prior years 3 4 –
Deferred tax 3 11 –
current year 3 3 –
prior years – 8 –
2 (8) (11)
Reconciliation of tax rate % % %
South African normal tax rate 29,0 30,0 30,0
Increase in effective tax rate due to
disallowed expenditure 0,4 0,6 0,3
29,4 30,6 30,3
Decrease in effective tax rate due to
prior year adjustments – (0,4) –
exempt income (29,4) (29,9) (30,2)
Effective tax rate – 0,3 0,1
Available STC credits at year end (Rm) 1 74 –

129
sasol limited company
notes to the financial statements continued
sasol limited company
Interest in significant operating subsidiaries and incorporated joint ventures
128
2005 2004 2003
Number Number Number
for the year ended 30 June of shares of shares of shares
8 Share capitalAuthorised
Ordinary shares of no par value 1 175 000 000 1 175 000 000 1 175 000 000
Issued
Ordinary shares of no par value 676 877 125 671 271 425 668 798 425
For further details of share capital, refer note 37 in the group annual financial statements.
2005 2004 2003
for the year ended 30 June Rm Rm Rm
9 Dividends paidFinal dividend – prior year
external shareholders (1 440) (1 432) (1 524)
subsidiary company (141) (140) (146)
Interim dividend – current year
external shareholders (1 416) (1 313) (1 311)
subsidiary company (138) (129) (126)
(3 135) (3 014) (3 107)
Expected cashflow on final dividend – current year
external shareholders (1 912)
subsidiary company (186)
10 CashCash and bank balance 19 10 52
11 Guarantees and contingent liabilitiesGuarantees and claims 29 808 22 693 10 054
Unutilised borrowing facilities guaranteed 12 450 15 721 14 774
The company has guaranteed the fulfilment of various subsidiaries’
obligations in terms of contractual agreements.
12 Commitments under operating leasesThe company rents buildings and equipment under
long-term non-cancellable operating leases.
Maturity profileWithin one year 32 18 21
One to two years 33 20 22
Two to three years 34 22 24
Three to four years 40 24 26
Four to five years 45 27 28
More than five years 305 285 332
489 396 453
Nominal Investment Loans to/(from)issued at cost subsidiaries
share Interest 2005 2004 2005 2004Name Nature of business capital % Rm Rm Rm Rm
Operating subsidiariesDirect
Sasol Mining (Pty) Limited Coal mining activities Rm 215 100 456 456 31 31
Sasol Synfuels (Pty) Limited Production of liquid fuels,gases and chemical products Rm 100 100 676 676 518 518
Sasol Technology Engineering services, research(Pty) Limited and development and
technology transfer Rm 1 100 1 1 176 (62)
Sasol Financing Management of cash (Pty) Limited resources, investment and
procurement of loans for South African operations R 200 100 – – 4 041 4 535
Sasol Investment Company Holding company of the (Pty) Limited group’s foreign investments
and investment in movable and immovable property R 200 100 – – 13 597 11 413
Sasol Chemical Industries Production and marketingLimited of mining explosives, gases,
petrochemicals, fertilisers and refining of tar acids R 152 100 – – 3 829 2 396
Sasol Gas Holdings Holding company of the (Pty) Limited group’s gas interests R 100 100 – – 1 209 1 957
Sasol Oil (Pty) Limited Marketing of fuels and lubricants R 1 077 98 83 83 275 374
Indirect
ChemCity (Pty) Limited Supporting empowered small, micro and medium enterprises’ requirements in order to enable them to thrive in the chemical industry R 477 100
Republic of Owning and operating of the Mozambique Pipeline natural gas transmission pipeline Investments Company between Temane in Mozambique (Pty) Limited and Secunda in South Africa for
the transportation of natural gas produced in Mozambique to markets in Mozambique and South Africa Rm 10 100
Sasol Chemical Holdings Investment in the Sasol International (Pty) Limited Chemie group R 370 100
Sasol Chemicals Marketing and distribution ofEurope Limited a chemical products GBP 20 000 100
Sasol Chemicals Marketing and distribution of Pacific Limited b chemical products HKD 10 000 100
Sasol-Chem Inc c Marketing and distribution of chemical products US$ 85 100

sasol limited company
Interest in significant operating subsidiaries and incorporated joint ventures continued
131130
Nominalissued
share InterestName Nature of business capital %
Operating subsidiaries (continued)
Indirect
Sasol Financing Management of cash resources,International plc d investment and procurement of
loans for operations outside South Africa US$ 1 001 100
Sasol Gas Limited Marketing, distribution and transportation of pipeline gas and the maintenance and operation of pipelines used for the transportation of various types of gas R 1 000 100
Sasol Germany GmbH e Production, marketing and distribution of waxes and wax related products Euro m 70 100
Sasol Italy SpA f Trading and transportation of oil products, petrochemicals and chemical products and their derivatives Euro m 23 100
Sasol North America Inc c Manufacturing of commodity and special chemicals US$m 318 100
Sasol Oil International Limited d Buying and selling of crude oil US$ 1 100
Sasol Petroleum Exploration, production, marketing International (Pty) Limited and distribution of petroleum and
natural gas R 100 100
Sasol Polymers International Holding company of Sasol Investments (Pty) Limited Polymers foreign investments R 100 100
Sasol Synfuels International Conversion and marketing of (Pty) Limited liquid fuels and chemical
products R 100 100
Sasol Wax International Holding company of the Sasol Aktiengesellschaft e Wax operations Euro m 33 100
Sasol Wax (SA) Production, marketing and (Pty) Limited distribution of paraffin waxes R 100 000 100
Tosas Beherend (Pty) Limited Investment R 100 70
National Petroleum Refiners of South Africa (Pty) Limited Refining of crude oil Rm 128 64
Nominalissued
share InterestName Nature of business capital %
Incorporated joint venturesIndirect
Sasol Dia Acrylates Production of acrylic acid (South Africa) (Pty) Limited and acrylates R’000 1 002 75
Sasol Dia Acrylates Marketing of acrylic acid (Pty) Limited and acrylates R’000 1 002 50
Arya Sasol Polymer Company g Production of polyethylene Rial m 800 50
DPI Holdings (Pty) Limited Holding company of DPI group which manufactures and markets plastic piping systems R 2 000 50
Merisol LP c Production, marketing and distribution of phenolics US$m 71 50
Sasol Chevron Holdings Management of the group’sLimited h joint venture interests with
Chevron corporation US$ 12 000 50
Sasol-Huntsman Production and marketing of maleicGmbH & Co KG e anhydride Euro m 20 50
Namibia Liquid Fuel Marketing and distribution of(Pty) Limited i petroleum products N$ 100 49
Oryx GTL Limited Manufacturing and marketing (QSC) j of synthetic fuels from gas US$m 242 49
Spring Lights Gas Marketing of pipeline gas in the (Pty) Limited Durban South area R 1 000 49
Petlin (Malaysia) Sdn Bhd k Manufacturing and marketing of low-density polyethylene pellets RM m 52 40
Except as indicated below, all companies are registered in the Republic of South Africa.
Foreign registered companies
(a) Registered in the United Kingdom. Share capital stated in Pound Sterling.(b) Registered in Hong Kong. Share capital stated in Hong Kong dollars.(c) Registered in the United States of America. Share capital stated in United States dollars.(d) Registered in the Isle of Man. Share capital stated in United States dollars.(e) Registered in Germany. Share capital stated in Euro.(f) Registered in Italy. Share capital stated in Euro.(g) Registered in Iran. Share capital stated in Rials.(h) Registered in Bermuda. Share capital stated in United States dollars.(i) Registered in Namibia. Share capital stated in Namibian dollars.( j) Registered in Qatar. Share capital stated in United States dollars.(k) Registered in Malaysia. Share capital stated in Malaysian ringgets.
The company’s interest in the aggregate profits and losses of subsidiaries amounts to R10 847 million (2004 – R7 198 million) profits
and R1 197 million (2004 – R1 259 million) losses.
The group maintains a register of all subsidiaries and incorporated joint ventures, available for inspection at the registered office of
Sasol Limited.

132
Shareholder information helpline
We have reserved 0800 202 361 as the South African toll-free
number and +27 (0) 11 870 8222 for shareholders calling
from outside South Africa.
The toll-free inbound telephone helpline will enable
shareholders to obtain information regarding the resolutions
and to provide assistance for completing proxy forms.
Depositary Bank
The Bank of New York
Depositary Receipts Division
101 Barclay Street
New York 10286, New York
The Bank of New York maintains a sponsored dividend
reinvestment and direct purchase programme for Sasol’s
Depositary Receipts. As a participant in Global BuyDIRECTSM,
investors benefit from the direct ownership of their Depositary
Receipts, the efficiency of receiving corporate communications
directly from the Depositary Receipts issuer, and the savings
resulting from the reduced brokerage and transaction costs.
Additional information is available at www.globalbuydirect.com
Questions or correspondence about Global BuyDIRECT should
be addressed to:
The Bank of New York
Investor Relations
PO Box 11258
Church Street Station
New York, New York 10286-1258
Toll-free telephone for US Global BuyDIRECT participants:
1-888-BNY-ADRS
Telephone for international callers: 212-815-3700
E-mail: [email protected]
Company registration number
1979/003231/06
Addresses
Business address and registered office
1 Sturdee Avenue, Rosebank 2196
Republic of South Africa
Postal and electronic addresses andtelecommunication numbers
PO Box 5486, Johannesburg 2000
Republic of South Africa
Telephone +27 (0) 11 441-3111
Telefax +27 (0) 11 788-5092
Website: http://www.sasol.com
Share registrars
Computershare Investor Services 2004 (Pty) Limited
70 Marshall Street, Johannesburg 2001
Republic of South Africa
PO Box 61051, Marshalltown 2107
Republic of South Africa
Telephone +27 (0) 11 370-7700
Investor relations
Telephone +27 (0) 11 441-3420
Telefax +27 (0) 11 441-3481
e-mail: [email protected]
Sasol group corporate affairs department
Telephone: +27 (0) 11 441-3249
Telefax: +27 (0) 11 441-3236
contact information
This annual report must be read in conjunction with our annual report under the Securities Exchange Act of 1934 on Form 20-F to befiled with the United States Securities and Exchange Commission during October 2005. The Form 20-F is available on our website atwww.sasol.com.
Note on measurement: Besides applying barrels (b) and cubic feet (cf) for reporting on oil and gas reserves and production, Sasol applies SystèmeInternational (SI) metric measures for all global operations. A ton (also spelt as tonne) denotes one metric ton equivalent to 1 000 kilograms (kg) or about 2 200 imperial pounds. Sasol’s reference to a metric ton should not be confused with an imperial ton equivalent to 2 240 pounds (or about 1 016 kg). In addition, in line with a particular South African distinction under the auspices of the South African Bureau of Standards (SABS), all Sasolglobal reporting emanating from South Africa uses the decimal comma (eg 3,5) instead of the more familiar decimal point (eg 3.5) used in the UK,USA and elsewhere. Similarly, a hard space is used to distinguish thousands in numeric figures (eg 2 500) instead of a comma (eg 2,500).A billion is defined as 1 000 million.