sas® inventory optimization workbench 5.3: user s guide ... · the correct bibliographic citation...
TRANSCRIPT
SAS® Inventory Optimization Workbench 5.3: User’s Guide, Second Edition
SAS® Documentation
The correct bibliographic citation for this manual is as follows: SAS Institute Inc. 2017. SAS® Inventory Optimization Workbench 5.3: User’s Guide, Second Edition. Cary, NC: SAS Institute Inc.
SAS® Inventory Optimization Workbench 5.3: User’s Guide, Second Edition
Copyright © 2017, SAS Institute Inc., Cary, NC, USA
All Rights Reserved. Produced in the United States of America.
For a hard copy book: No part of this publication may be reproduced, stored in a retrieval system, or transmitted, in any form or by any means, electronic, mechanical, photocopying, or otherwise, without the prior written permission of the publisher, SAS Institute Inc.
For a web download or e-book: Your use of this publication shall be governed by the terms established by the vendor at the time you acquire this publication.
The scanning, uploading, and distribution of this book via the Internet or any other means without the permission of the publisher is illegal and punishable by law. Please purchase only authorized electronic editions and do not participate in or encourage electronic piracy of copyrighted materials. Your support of others' rights is appreciated.
U.S. Government License Rights; Restricted Rights: The Software and its documentation is commercial computer software developed at private expense and is provided with RESTRICTED RIGHTS to the United States Government. Use, duplication, or disclosure of the Software by the United States Government is subject to the license terms of this Agreement pursuant to, as applicable, FAR 12.212, DFAR 227.7202-1(a), DFAR 227.7202-3(a), and DFAR 227.7202-4, and, to the extent required under U.S. federal law, the minimum restricted rights as set out in FAR 52.227-19 (DEC 2007). If FAR 52.227-19 is applicable, this provision serves as notice under clause (c) thereof and no other notice is required to be affixed to the Software or documentation. The Government’s rights in Software and documentation shall be only those set forth in this Agreement.
SAS Institute Inc., SAS Campus Drive, Cary, NC 27513-2414
April 2017
SAS® and all other SAS Institute Inc. product or service names are registered trademarks or trademarks of SAS Institute Inc. in the USA and other countries. ® indicates USA registration.
Other brand and product names are trademarks of their respective companies.
P1:invoptug

Contents
Using This Book . . . . . . . . . . . . . . . . . . . . . . . . . . . . . . . . . . . . . . . . . . . . . . . . . . . . . . . viiWhat’s New in SAS Inventory Optimization Workbench 5.3 . . . . . . . . . . . . . . . . . . . . ixAccessibility . . . . . . . . . . . . . . . . . . . . . . . . . . . . . . . . . . . . . . . . . . . . . . . . . . . . . . . . . . . xi
PART 1 Introduction To SAS Inventory Optimization Workbench 1
Chapter 1 / About SAS Inventory Optimization Workbench . . . . . . . . . . . . . . . . . . . . . . . . . . . . . . . . . . . 3What is SAS Inventory Optimization Workbench? . . . . . . . . . . . . . . . . . . . . . . . . . . 3Benefits of Using SAS Inventory Optimization Workbench . . . . . . . . . . . . . . . . . . 4How Does SAS Inventory Optimization Workbench Work? . . . . . . . . . . . . . . . . . . 5
Chapter 2 / Managing Access to SAS Inventory Optimization Workbench . . . . . . . . . . . . . . . . . . . . . . 9Roles and Capabilities . . . . . . . . . . . . . . . . . . . . . . . . . . . . . . . . . . . . . . . . . . . . . . . . . 9Logging On To SAS Inventory Optimization Workbench . . . . . . . . . . . . . . . . . . . 10Logging Off From SAS Inventory Optimization Workbench . . . . . . . . . . . . . . . . . 10
Chapter 3 / Understanding the SAS Inventory Optimization Workbench User Interface . . . . . . . . . 13Overview of the SAS Inventory Optimization Workbench User Interface . . . . . 13Inventory Performance Workspace . . . . . . . . . . . . . . . . . . . . . . . . . . . . . . . . . . . . . 14Orders Workspace . . . . . . . . . . . . . . . . . . . . . . . . . . . . . . . . . . . . . . . . . . . . . . . . . . . 15Reports Workspace . . . . . . . . . . . . . . . . . . . . . . . . . . . . . . . . . . . . . . . . . . . . . . . . . . . 16Components of the User Interface . . . . . . . . . . . . . . . . . . . . . . . . . . . . . . . . . . . . . . 16Define Your Preferences . . . . . . . . . . . . . . . . . . . . . . . . . . . . . . . . . . . . . . . . . . . . . . 16Time Zones and the User Interface . . . . . . . . . . . . . . . . . . . . . . . . . . . . . . . . . . . . . 18Performing Common Tasks In SAS Inventory Optimization Workbench . . . . . . 18Where to Find Help . . . . . . . . . . . . . . . . . . . . . . . . . . . . . . . . . . . . . . . . . . . . . . . . . . . 20
PART 2 Analyzing Inventory Performance 21
Chapter 4 / Introduction to Inventory Performance . . . . . . . . . . . . . . . . . . . . . . . . . . . . . . . . . . . . . . . . . 23Monitoring and Analyzing Inventory Performance . . . . . . . . . . . . . . . . . . . . . . . . . 23
Chapter 5 / Analyzing Inventory Performance by Products . . . . . . . . . . . . . . . . . . . . . . . . . . . . . . . . . . 27About Analyzing Inventory Performance by Products . . . . . . . . . . . . . . . . . . . . . . 27Analyzing the Inventory Performance of All Products . . . . . . . . . . . . . . . . . . . . . . 28Analyzing the Inventory Performance of a Product across Facilities . . . . . . . . . 29Analyzing the Inventory Performance for a Product and Facility Combination . 31
Chapter 6 / Analyzing Inventory Performance by Facilities and Networks . . . . . . . . . . . . . . . . . . . . . 33About Analyzing Inventory Performance by Facilities . . . . . . . . . . . . . . . . . . . . . . 33

Analyzing the Inventory Performance by All Facilities . . . . . . . . . . . . . . . . . . . . . . 34Analyzing the Inventory Performance of All Products Present in a Facility . . . . 35Analyzing the Inventory Performance of a Facility and a
Product Combination . . . . . . . . . . . . . . . . . . . . . . . . . . . . . . . . . . . . . . . . . . . . . . 36
Chapter 7 / Managing Alert Settings . . . . . . . . . . . . . . . . . . . . . . . . . . . . . . . . . . . . . . . . . . . . . . . . . . . . . . 37Overview of Alert Settings . . . . . . . . . . . . . . . . . . . . . . . . . . . . . . . . . . . . . . . . . . . . . 37Manage Alert Settings . . . . . . . . . . . . . . . . . . . . . . . . . . . . . . . . . . . . . . . . . . . . . . . . 37
PART 3 Working with Base Orders 39
Chapter 8 / Introduction to Base Orders . . . . . . . . . . . . . . . . . . . . . . . . . . . . . . . . . . . . . . . . . . . . . . . . . . 41Overview of Base Orders . . . . . . . . . . . . . . . . . . . . . . . . . . . . . . . . . . . . . . . . . . . . . . 41Types of Base Orders . . . . . . . . . . . . . . . . . . . . . . . . . . . . . . . . . . . . . . . . . . . . . . . . . 41Statuses of a Base Order . . . . . . . . . . . . . . . . . . . . . . . . . . . . . . . . . . . . . . . . . . . . . . 42Base Orders Workflow . . . . . . . . . . . . . . . . . . . . . . . . . . . . . . . . . . . . . . . . . . . . . . . . 43Guidelines for Base Orders . . . . . . . . . . . . . . . . . . . . . . . . . . . . . . . . . . . . . . . . . . . . 45
Chapter 9 / Understanding the User Interface of the Base Orders Category . . . . . . . . . . . . . . . . . . . 47Overview of the Base Orders Category . . . . . . . . . . . . . . . . . . . . . . . . . . . . . . . . . . 47Products Subcategory . . . . . . . . . . . . . . . . . . . . . . . . . . . . . . . . . . . . . . . . . . . . . . . . 47Facilities Subcategory . . . . . . . . . . . . . . . . . . . . . . . . . . . . . . . . . . . . . . . . . . . . . . . . . 48
Chapter 10 / Monitoring Information about Base Orders . . . . . . . . . . . . . . . . . . . . . . . . . . . . . . . . . . . . 49Monitoring Information about Base Orders for All Products . . . . . . . . . . . . . . . . . 49Monitoring Information about Base Orders for a Product across Facilities . . . . 52Monitoring Information about Base Orders for All Facilities . . . . . . . . . . . . . . . . . 55Monitoring Information about Base Orders for a Facility . . . . . . . . . . . . . . . . . . . . 57Monitoring Information about Base Orders for a Product
and Facility Combination . . . . . . . . . . . . . . . . . . . . . . . . . . . . . . . . . . . . . . . . . . . 60
Chapter 11 / Managing Base Orders . . . . . . . . . . . . . . . . . . . . . . . . . . . . . . . . . . . . . . . . . . . . . . . . . . . . . . 65Editing a Base Order . . . . . . . . . . . . . . . . . . . . . . . . . . . . . . . . . . . . . . . . . . . . . . . . . . 65Add a Base Order . . . . . . . . . . . . . . . . . . . . . . . . . . . . . . . . . . . . . . . . . . . . . . . . . . . . 68Evaluate a Base Order . . . . . . . . . . . . . . . . . . . . . . . . . . . . . . . . . . . . . . . . . . . . . . . . 69Delete a Base Order . . . . . . . . . . . . . . . . . . . . . . . . . . . . . . . . . . . . . . . . . . . . . . . . . . 70Cancel Base Orders . . . . . . . . . . . . . . . . . . . . . . . . . . . . . . . . . . . . . . . . . . . . . . . . . . 71Reset a Base Order . . . . . . . . . . . . . . . . . . . . . . . . . . . . . . . . . . . . . . . . . . . . . . . . . . 71
Chapter 12 / Managing Replenishment Locks for Base Orders . . . . . . . . . . . . . . . . . . . . . . . . . . . . . . . 73Overview of Replenishment Locks . . . . . . . . . . . . . . . . . . . . . . . . . . . . . . . . . . . . . . 73Managing Replenishment Locks for Base Orders . . . . . . . . . . . . . . . . . . . . . . . . . 73
Chapter 13 / Promoting Base Orders . . . . . . . . . . . . . . . . . . . . . . . . . . . . . . . . . . . . . . . . . . . . . . . . . . . . . 77Overview of Promoting Base Orders . . . . . . . . . . . . . . . . . . . . . . . . . . . . . . . . . . . . 77Promote Base Orders . . . . . . . . . . . . . . . . . . . . . . . . . . . . . . . . . . . . . . . . . . . . . . . . . 77
iv Contents

PART 4 Working with Promotional Orders 79
Chapter 14 / Introduction to Promotional Orders . . . . . . . . . . . . . . . . . . . . . . . . . . . . . . . . . . . . . . . . . . . 81About Promotional Orders . . . . . . . . . . . . . . . . . . . . . . . . . . . . . . . . . . . . . . . . . . . . . 81Guidelines for Promotional Orders . . . . . . . . . . . . . . . . . . . . . . . . . . . . . . . . . . . . . . 81Promotional Orders in a Two-Echelon Network . . . . . . . . . . . . . . . . . . . . . . . . . . . 82Promotional Orders in a Single-Echelon Network . . . . . . . . . . . . . . . . . . . . . . . . . 83
Chapter 15 / Monitoring Promotional Orders for Vendors . . . . . . . . . . . . . . . . . . . . . . . . . . . . . . . . . . . 85Viewing All Promotions . . . . . . . . . . . . . . . . . . . . . . . . . . . . . . . . . . . . . . . . . . . . . . . . 85Viewing Details about a Promotion . . . . . . . . . . . . . . . . . . . . . . . . . . . . . . . . . . . . . . 87Viewing Details about the Promotional Orders for a Product . . . . . . . . . . . . . . . . 89
Chapter 16 / Managing Promotional Orders Suggested for Vendors . . . . . . . . . . . . . . . . . . . . . . . . . . 93Edit the Order Quantity for a Vendor . . . . . . . . . . . . . . . . . . . . . . . . . . . . . . . . . . . . 93View Facilities . . . . . . . . . . . . . . . . . . . . . . . . . . . . . . . . . . . . . . . . . . . . . . . . . . . . . . . 94Edit the Order Quantity for a Promotional Order . . . . . . . . . . . . . . . . . . . . . . . . . . 95View the Impact of an Edited Order . . . . . . . . . . . . . . . . . . . . . . . . . . . . . . . . . . . . . 97Manage Locks for Promotional Orders for a Vendor . . . . . . . . . . . . . . . . . . . . . . . 99Cancel a Promotional Order for a Vendor . . . . . . . . . . . . . . . . . . . . . . . . . . . . . . . 101View History . . . . . . . . . . . . . . . . . . . . . . . . . . . . . . . . . . . . . . . . . . . . . . . . . . . . . . . . 104View Stores . . . . . . . . . . . . . . . . . . . . . . . . . . . . . . . . . . . . . . . . . . . . . . . . . . . . . . . . 106
Chapter 17 / Monitoring Promotional Orders at Customer-Facing Facilities . . . . . . . . . . . . . . . . . . 107Viewing All Promotions at Customer-Facing Facilities . . . . . . . . . . . . . . . . . . . . 107Viewing Details about a Promotion at a Customer-Facing Facility . . . . . . . . . . 109Viewing Details about Promotional Orders for a Product at
Customer-Facing Facilities . . . . . . . . . . . . . . . . . . . . . . . . . . . . . . . . . . . . . . . . . 111Edit a Promotional Order at a Customer-Facing Facility . . . . . . . . . . . . . . . . . . . 112
Chapter 18 / Managing Replenishment Locks for Promotional Orders . . . . . . . . . . . . . . . . . . . . . . . 115Overview of Replenishment Locks . . . . . . . . . . . . . . . . . . . . . . . . . . . . . . . . . . . . . 115Lock a Promotional Order . . . . . . . . . . . . . . . . . . . . . . . . . . . . . . . . . . . . . . . . . . . . 115Unlock a Promotional Order . . . . . . . . . . . . . . . . . . . . . . . . . . . . . . . . . . . . . . . . . . 117
Chapter 19 / Promoting Promotional Orders . . . . . . . . . . . . . . . . . . . . . . . . . . . . . . . . . . . . . . . . . . . . . . 119Overview of Promoting Promotional Orders . . . . . . . . . . . . . . . . . . . . . . . . . . . . . 119Promote Promotional Order for Vendors . . . . . . . . . . . . . . . . . . . . . . . . . . . . . . . . 119Promote Promotional Orders at a Customer-Facing Facility . . . . . . . . . . . . . . . 120
PART 5 Analyzing and Understanding Scenarios 121
Chapter 20 / Introduction to Scenario Analysis . . . . . . . . . . . . . . . . . . . . . . . . . . . . . . . . . . . . . . . . . . . 123Overview of Scenario Analysis . . . . . . . . . . . . . . . . . . . . . . . . . . . . . . . . . . . . . . . . 123Scenario Statuses . . . . . . . . . . . . . . . . . . . . . . . . . . . . . . . . . . . . . . . . . . . . . . . . . . . 124Scenario Analysis Workflow . . . . . . . . . . . . . . . . . . . . . . . . . . . . . . . . . . . . . . . . . . 127
Chapter 21 / Understanding the Scenario Analysis Category . . . . . . . . . . . . . . . . . . . . . . . . . . . . . . . 131Scenarios Category . . . . . . . . . . . . . . . . . . . . . . . . . . . . . . . . . . . . . . . . . . . . . . . . . 131Viewing the Results of a Scenario . . . . . . . . . . . . . . . . . . . . . . . . . . . . . . . . . . . . . 133
Contents v

Chapter 22 / Performing an Internal Facility Scenario Analysis . . . . . . . . . . . . . . . . . . . . . . . . . . . . . 137About the Internal Facility Scenario . . . . . . . . . . . . . . . . . . . . . . . . . . . . . . . . . . . . 137Create an Internal Facility Scenario . . . . . . . . . . . . . . . . . . . . . . . . . . . . . . . . . . . . 138Viewing the Results of an Internal Facility Scenario . . . . . . . . . . . . . . . . . . . . . . 139Recalculate Metric Values for an Internal Facility . . . . . . . . . . . . . . . . . . . . . . . . 141Promote the Target Service Level for an Internal Facility . . . . . . . . . . . . . . . . . . 142
Chapter 23 / Performing a Customer-Facing Facility Scenario Analysis . . . . . . . . . . . . . . . . . . . . . . 145About the Customer-Facing Facility Scenario . . . . . . . . . . . . . . . . . . . . . . . . . . . 145Create a Customer-Facing Facility Scenario . . . . . . . . . . . . . . . . . . . . . . . . . . . . 146Viewing the Results of a Customer-Facing Facility Scenario . . . . . . . . . . . . . . 148Re-optimize the Scenario Results . . . . . . . . . . . . . . . . . . . . . . . . . . . . . . . . . . . . . 149Recalculate Metric Values . . . . . . . . . . . . . . . . . . . . . . . . . . . . . . . . . . . . . . . . . . . . 150The Difference between Recalculation and Re-Optimization . . . . . . . . . . . . . . 151Promote the Target Service Level . . . . . . . . . . . . . . . . . . . . . . . . . . . . . . . . . . . . . 152
Chapter 24 / Performing an Ad Hoc Scenario Analysis . . . . . . . . . . . . . . . . . . . . . . . . . . . . . . . . . . . . 155About the Ad Hoc Scenario . . . . . . . . . . . . . . . . . . . . . . . . . . . . . . . . . . . . . . . . . . . 155Create an Ad Hoc Scenario . . . . . . . . . . . . . . . . . . . . . . . . . . . . . . . . . . . . . . . . . . . 156Viewing the Results of an Ad Hoc Scenario . . . . . . . . . . . . . . . . . . . . . . . . . . . . . 158Obtaining Demand Data from SAS Forecast Analyst Workbench . . . . . . . . . . 161Promote the Defined Values of a Set . . . . . . . . . . . . . . . . . . . . . . . . . . . . . . . . . . . 166
Chapter 25 / Performing an Optimization Override Scenario Analysis . . . . . . . . . . . . . . . . . . . . . . . 169About the Optimization Override Scenario . . . . . . . . . . . . . . . . . . . . . . . . . . . . . . 169Create an Optimization Override Scenario . . . . . . . . . . . . . . . . . . . . . . . . . . . . . . 170Viewing the Results of an Optimization Override Scenario . . . . . . . . . . . . . . . . 171Edit and Reset Constraints . . . . . . . . . . . . . . . . . . . . . . . . . . . . . . . . . . . . . . . . . . . 172Evaluate the Optimization Values . . . . . . . . . . . . . . . . . . . . . . . . . . . . . . . . . . . . . . 172View the Impact of Your Changes . . . . . . . . . . . . . . . . . . . . . . . . . . . . . . . . . . . . . 173Promote Constraints . . . . . . . . . . . . . . . . . . . . . . . . . . . . . . . . . . . . . . . . . . . . . . . . . 173
Chapter 26 / Working with a Scenario . . . . . . . . . . . . . . . . . . . . . . . . . . . . . . . . . . . . . . . . . . . . . . . . . . . 175Edit a Scenario . . . . . . . . . . . . . . . . . . . . . . . . . . . . . . . . . . . . . . . . . . . . . . . . . . . . . 175Delete a Scenario . . . . . . . . . . . . . . . . . . . . . . . . . . . . . . . . . . . . . . . . . . . . . . . . . . . 176Create a Copy of a Scenario . . . . . . . . . . . . . . . . . . . . . . . . . . . . . . . . . . . . . . . . . . 176Run a Scenario . . . . . . . . . . . . . . . . . . . . . . . . . . . . . . . . . . . . . . . . . . . . . . . . . . . . . 177View Messages . . . . . . . . . . . . . . . . . . . . . . . . . . . . . . . . . . . . . . . . . . . . . . . . . . . . . 177
PART 6 Generating Reports 181
Chapter 27 / Working with Reports . . . . . . . . . . . . . . . . . . . . . . . . . . . . . . . . . . . . . . . . . . . . . . . . . . . . . . 183About Reports . . . . . . . . . . . . . . . . . . . . . . . . . . . . . . . . . . . . . . . . . . . . . . . . . . . . . . 183Understanding the Reports Workspace . . . . . . . . . . . . . . . . . . . . . . . . . . . . . . . . . 183View a Report . . . . . . . . . . . . . . . . . . . . . . . . . . . . . . . . . . . . . . . . . . . . . . . . . . . . . . 184Create a Report . . . . . . . . . . . . . . . . . . . . . . . . . . . . . . . . . . . . . . . . . . . . . . . . . . . . . 185
Recommended Reading . . . . . . . . . . . . . . . . . . . . . . . . . . . . . . . . . . . . . . . . . . . . . 187Glossary . . . . . . . . . . . . . . . . . . . . . . . . . . . . . . . . . . . . . . . . . . . . . . . . . . . . . . . . . . . 189Index . . . . . . . . . . . . . . . . . . . . . . . . . . . . . . . . . . . . . . . . . . . . . . . . . . . . . . . . . . . . . . 191
vi Contents

Using This Book
Audience
SAS Inventory Optimization Workbench is designed for persons who are responsible for performing any or all of the following tasks:
n monitoring and analyzing high-level performance of the inventory and making decisions based on the analysis
n maintaining a balance between the inventory stock levels and customer service agreements
n reviewing inventory levels, inventory turns, and inventory costs
n analyzing supply chain performance and suggesting optimal service levels and lead times based on budgets and costs
n generating optimal order quantities
You might be assigned to a specific role, which determines the tasks that you can perform. This documentation focuses on all tasks that you can perform in SAS Inventory Optimization Workbench.
Prerequisites
You need to have a user ID and password for logging on to SAS Inventory Optimization Workbench.
vii

viii Using This Book

Whatʼs New
What’s New in SAS Inventory Optimization Workbench 5.3
Overview
This chapter describes the new features and functionality that are added in SAS Inventory Optimization Workbench 5.3 and in the first maintenance release of SAS Inventory Optimization Workbench 5.3.
SAS Inventory Optimization Workbench 5.3 contains new features that affect the following areas:
n enhancements on the user interface
n permitting a group of users to access a set of data
First Maintenance Release of SAS Inventory Optimization Workbench 5.3
The first maintenance release of SAS Inventory Optimization Workbench 5.3 enables you to obtain the output of custom analysis that you performed in the first maintenance release of SAS Forecast Analyst Workbench 5.3. Custom analysis uses SAS Stored Processes that enable analysts to use customized methods of analysis to obtain predicted demand. After you obtain the predicted demand, you can use it in ad hoc scenario analysis to envision various scenarios of inventory optimization. You can also obtain the predicted demand (in the form of output of custom analysis) through batch integration in order to optimize the inventory.
Enhancements on the User Interface
The user interface of SAS Inventory Optimization Workbench 5.3 contains the following enhancements:
ix

n advanced filter is provided to search products and facilities based on their attributes in the Orders workspace.
n the title of the views in the Inventory Performance workspace and the Orders workspace contains the product ID and the location ID along with the names of products and locations
n the Orders workspace displays projected back orders
Permitting a Group of Users to Access a Set of Data
All users in a group can work on all products and facility combinations in a network. Administrators can define the groups to suite the business need. Users in a group can review and act upon each other’s products and facilities.
For example, suppose buyer 1, buyer 2, and buyer 3 belong to the Laptop Planners group. By providing permission to the Laptop Planners group to work on the Europe, buyer 1, buyer 2, and buyer 3 can work on all replenishment orders that belong to Europe. They can share the responsibilities within the group based on business priorities.
Multiple groups can contain different users in order to access different sets of replenishment orders. For example, suppose all planners in the Europe Laptop Planners group can work on all replenishment orders for laptop that belong to Europe and all planners in the Asia Laptop Planners group can work on all replenishment orders for laptop in the Asia.
x What’s New in SAS Inventory Optimization Workbench 5.3

AccessibilityFor information about the accessibility of this product, see Accessibility Features of SAS Inventory Optimization Workbench 5.3 at support.sas.com.
xi

xii What’s New in SAS Inventory Optimization Workbench 5.3

Part 1
Introduction To SAS Inventory Optimization Workbench
Chapter 1About SAS Inventory Optimization Workbench . . . . . . . . . . . . . . . . . . . . . . . . 3
Chapter 2Managing Access to SAS Inventory Optimization Workbench . . . . . . . . . . . 9
Chapter 3Understanding the SAS Inventory Optimization Workbench User Interface . . . . . . . . . . . . . . . . . . . . . . . . . . . . . . . . . . . . . . . . . 13
1

2

1About SAS Inventory Optimization Workbench
What is SAS Inventory Optimization Workbench? . . . . . . . . . . . . . . . . . . . . . . . . . . . . 3
Benefits of Using SAS Inventory Optimization Workbench . . . . . . . . . . . . . . . . . . . 4Manage a Variety of Products Efficiently . . . . . . . . . . . . . . . . . . . . . . . . . . . . . . . . . . . . . 4Better Accommodation of Product Life Cycles . . . . . . . . . . . . . . . . . . . . . . . . . . . . . . . . 4Cohesive Understanding of Fragmented Supply Chain Networks . . . . . . . . . . . . . . 4Manage a Globalized Supply Chain . . . . . . . . . . . . . . . . . . . . . . . . . . . . . . . . . . . . . . . . . 5Execute Supply Chain Strategies Successfully . . . . . . . . . . . . . . . . . . . . . . . . . . . . . . . 5
How Does SAS Inventory Optimization Workbench Work? . . . . . . . . . . . . . . . . . . . . 5
What is SAS Inventory Optimization Workbench?
SAS Inventory Optimization Workbench is an inventory optimization and planning module of the SAS Demand-Driven Planning and Optimization suite. SAS Inventory Optimization Workbench helps inventory analysts and buyers track, monitor, and predict the inventory for products. Whether you are operating your business within a country or across countries, SAS Inventory Optimization Workbench is an easy and powerful tool to use. SAS Inventory Optimization Workbench helps organizations with a single-echelon or multi-echelon network to gain instant visibility and an understanding of the inventory performance for their products without needing to rely on manual calculations and judgments.
SAS Inventory Optimization Workbench has the capabilities of SAS solutions—analytics, data integration, and business intelligence. SAS Inventory Optimization Workbench enables your organization to perform the following tasks:
n obtain an understanding of the inventory performance of your product portfolio
n perform scenario analysis on the products of your choice in order to meet the targeted service level within your budget
n review and track the suggested replenishment orders (including base orders and promotional orders), and place manual orders for products of your choice
3

n create reports in order to timely inform management about inventory planning and distribution
Benefits of Using SAS Inventory Optimization Workbench
Manage a Variety of Products Efficiently
Today's supply chains are expected to be responsive to unforeseen changes in supply or demand. This expectation results in placing granular inventories as close to the customers as possible. The highly granular positioning of inventory at various locations makes the usual inventory management techniques obsolete. Thus, the traditional rule of relying on inventory KPIs is no longer capable of delivering acceptable results to the customers.
With SAS Inventory Optimization Workbench, you can obtain a clear understanding of the inventory performance of the complete portfolio of your products and of the facilities that these products are associated with. You can use this information to do the following:
n reduce the uncertainty of predicting demand that is generated from various facilities
n lower the stress of managing an increased variety of products in the supply chain
n increase the responsiveness within the supply chain and distribution network
Better Accommodation of Product Life Cycles
In addition to the variety of customized products, the life cycle of these products has been shrinking. Today, the life cycle of some products can be measured in months as compared to years. For example, the life cycle of mobile phones is currently just a few months, and some automobile manufacturers have decreased the product life cycle from more than seven years to about four years. This reduction in product life cycle increases pressure in the supply chain and distribution network to find a best match between supply and demand.
Using the analytical and data integration capabilities of SAS Inventory Optimization Workbench, inventory analysts can identify new products, obsolete products, and phased-out products easily, and they can monitor their inventory performance efficiently. Buyers can also manage replenishment orders for these products by considering their life cycle, demand, and other business-specific factors.
Cohesive Understanding of Fragmented Supply Chain Networks
Organizations shed their non-core functions and integrate the outsourced functions in order to take advantage of the competencies that they did not originally have. This methodology gives rise to a new ownership structure in the supply chain and in the distribution network. The supply chain is broken into
4 Chapter 1 / About SAS Inventory Optimization Workbench
many owners, and each owner has its own policies and interests. This situation makes the supply chain more difficult than ever to coordinate.
With the help of SAS Inventory Optimization Workbench, you can get a cohesive understanding of the entire distribution network, whether it is single echelon or multi-echelon. Inventory analysts can understand the details of each facility and product that is involved in the supply chain and distribution network.
Manage a Globalized Supply Chain
Whether your organization is doing business within a country or across countries, SAS Inventory Optimization Workbench displays the health of the supply chain network, which alerts you to critical situations. SAS Inventory Optimization Workbench impacts the entire supply chain and distribution network in the following ways:
n reduces the stress of globalization on a supply chain that contains facilities that are far apart and that lack efficient coordination among themselves
n potentially increases global sales when many companies from around the world are competing
Execute Supply Chain Strategies Successfully
SAS Inventory Optimization Workbench enables you to execute supply chain strategies easily and to remain competitive. SAS Inventory Optimization Workbench also enables you to change or modify supply chain strategies based on changing business requirements. You execute your supply chain strategy by specifying parameters such as product succession, planning horizon, single or multi-echelon distribution network, and so on.
How Does SAS Inventory Optimization Workbench Work?
You can use SAS Inventory Optimization Workbench in one of two modes, automatic and interactive.
n automatic mode: Calculates the optimal inventory policies and suggests optimal quantities to be ordered or redistributed across the network.
n interactive mode: You can review the results of optimization and conduct a scenario analysis to arrive at an optimal service level or lead time. You can add manual base orders and edit promotional orders in order to achieve the target service level.
How Does SAS Inventory Optimization Workbench Work? 5

Figure 1.1 How SAS Inventory Optimization Workbench Works
SAS Inventory Optimization Workbench can be logically divided into the following functions:
n optimizing policy parameters
n generating suggested order quantities and key performance indicators (KPIs)
When the inventory optimization process runs, it generates the optimal inventory policies. An administrator can set the frequency of running the inventory optimization process on a daily, weekly, monthly, or quarterly basis. For more information, see SAS Inventory Optimization Workbench: Administrator’s Guide.
SAS Inventory Optimization Workbench optimizes inventory to meet target service levels based on specific inputs or constraints. You can view and analyze the performance of the supply chain in terms of actual versus target values of service level, lead time, and demand across the products and networks.
SAS Inventory Optimization Workbench also suggests replenishment orders (for base stock and promotional stock) based on the inventory level, demand, lead time, and other required parameters. Buyers can review these replenishment orders and promote them. The promoted replenishment orders can be sent to your enterprise resource planning (ERP) system or order management system. Based on the inventory status, you can view the following product categorizations and replenishment suggestions:
n For products with normal or excess inventory, SAS Inventory Optimization Workbench suggests no replenishment orders.
n For products with low inventory:
o SAS Inventory Optimization Workbench suggests replenishment from the primary source to meet the targeted service levels.
o SAS Inventory Optimization Workbench suggests replenishment from the primary source and from the alternative source to meet the targeted service levels.
6 Chapter 1 / About SAS Inventory Optimization Workbench

o If there are cost constraints, SAS Inventory Optimization Workbench suggests only partial replenishment, and service levels are not met.
o If there are low stocks in the network, SAS Inventory Optimization Workbench suggests only partial replenishment, and service levels are not met.
You can view these replenishment suggestions in the Orders workspace.
Scenario analysis and inventory performance analysis are the primary tasks of an inventory analyst and are part of the Inventory Performance workspace. Suggesting orders is primarily a buyer’s task and is part of the Orders workspace.
How Does SAS Inventory Optimization Workbench Work? 7

8 Chapter 1 / About SAS Inventory Optimization Workbench

2Managing Access to SAS Inventory Optimization Workbench
Roles and Capabilities . . . . . . . . . . . . . . . . . . . . . . . . . . . . . . . . . . . . . . . . . . . . . . . . . . . . . . . 9
Logging On To SAS Inventory Optimization Workbench . . . . . . . . . . . . . . . . . . . . . 10
Logging Off From SAS Inventory Optimization Workbench . . . . . . . . . . . . . . . . . . 10
Roles and Capabilities
Each user has access to different functionality depending on the assigned role for that user. Each role is mapped to a set of predefined capabilities. A capability, also known as an application action, defines the operations that a user can perform.
SAS Inventory Optimization Workbench is shipped with two predefined roles: Analyst and Buyer.
Using SAS Management Console, an administrator can modify the roles and specify the capabilities that meet the guidelines of your organization. If you have questions about your assigned roles, contact your administrator.
The following table lists the roles, role descriptions, and information about restrictions to the application-specific features, if any.
Table 2.1 SAS Inventory Optimization Workbench User Roles and Descriptions
Role Name Role Description Application-Specific Feature Restrictions
Buyer A buyer can handle a limited number of facilities and products.
A buyer is involved in maintaining the inventory of the products. A buyer is associated with every unique combination of product and facility.
n In the Inventory Performance workspace, a buyer can view aggregated values of the inventory metrics for only those facility and product pairs that belong to him or her.
n In the Orders workspace, a buyer can view base orders and promotional orders for the products and facilities that belong to him or her.
n In the Reports workspace, a buyer can create and generate reports.
9

Role Name Role Description Application-Specific Feature Restrictions
Analyst An analyst has complete control over the Inventory Performance workspace. An analyst can analyze the performance of the inventory of all products across all facilities and networks.
n In the Inventory Performance workspace, an analyst can analyze the performance of inventory of all products across all facilities and networks.
n In the Scenarios category, the analyst can generate scenarios and analyze the output of those scenarios. The analyst can promote the scenario results in order to use them in the next run of the optimization process.
n In the Orders workspace, the analyst can view the base orders and promotional orders but cannot edit them or add them.
n In the Reports workspace, an inventory analyst can create and generate reports.
Logging On To SAS Inventory Optimization Workbench
To display the SAS Inventory Optimization Workbench logon window, go to the URL that is supplied by your administrator or paste the URL into the address field of your web browser. For example, you might enter http://server01.abc.com/SASInventoryOptimizationWorkbench/.
To log on to SAS Inventory Optimization Workbench:
1 Enter your user ID and password.
Note: Your password is case sensitive. Your user ID might also be case sensitive, depending on the operating system that hosts the web application server. For assistance, contact your administrator.
2 Click Log On or press Enter.
The Inventory Performance workspace is displayed.
Logging Off From SAS Inventory Optimization Workbench
To log off from SAS Inventory Optimization Workbench, click Log Off on the application bar.
If you lose your connection to SAS Inventory Optimization Workbench (for example, your session times out), you must begin again at the point where you last saved your work.
If your connection to SAS Inventory Optimization Workbench remains inactive for a certain time, your session might time out. By default, if there is no activity for 30 minutes, the application prompts you to either continue the session or to log off from the application. If you do not select either of the options within a certain time (the default time is 10 seconds), the application automatically logs
10 Chapter 2 / Managing Access to SAS Inventory Optimization Workbench

you off and displays the Session Timed Out page. Your administrator can change the inactivity period, countdown period, and availability of the Log On button on the Session Timed Out page.
Logging Off From SAS Inventory Optimization Workbench 11

12 Chapter 2 / Managing Access to SAS Inventory Optimization Workbench

3Understanding the SAS Inventory Optimization Workbench User Interface
Overview of the SAS Inventory Optimization Workbench User Interface . . . . . 13
Inventory Performance Workspace . . . . . . . . . . . . . . . . . . . . . . . . . . . . . . . . . . . . . . . . . 14Overview of the Inventory Performance Workspace . . . . . . . . . . . . . . . . . . . . . . . . . 14Products Category . . . . . . . . . . . . . . . . . . . . . . . . . . . . . . . . . . . . . . . . . . . . . . . . . . . . . . . . 14Facilities and Networks Category . . . . . . . . . . . . . . . . . . . . . . . . . . . . . . . . . . . . . . . . . . 14Scenarios Category . . . . . . . . . . . . . . . . . . . . . . . . . . . . . . . . . . . . . . . . . . . . . . . . . . . . . . . 15
Orders Workspace . . . . . . . . . . . . . . . . . . . . . . . . . . . . . . . . . . . . . . . . . . . . . . . . . . . . . . . . . . 15Overview of the Orders Workspace . . . . . . . . . . . . . . . . . . . . . . . . . . . . . . . . . . . . . . . . 15Base Orders Category . . . . . . . . . . . . . . . . . . . . . . . . . . . . . . . . . . . . . . . . . . . . . . . . . . . . 15Promotional Orders Category . . . . . . . . . . . . . . . . . . . . . . . . . . . . . . . . . . . . . . . . . . . . . . 15
Reports Workspace . . . . . . . . . . . . . . . . . . . . . . . . . . . . . . . . . . . . . . . . . . . . . . . . . . . . . . . . . 16
Components of the User Interface . . . . . . . . . . . . . . . . . . . . . . . . . . . . . . . . . . . . . . . . . . 16
Define Your Preferences . . . . . . . . . . . . . . . . . . . . . . . . . . . . . . . . . . . . . . . . . . . . . . . . . . . . 16
Time Zones and the User Interface . . . . . . . . . . . . . . . . . . . . . . . . . . . . . . . . . . . . . . . . . . 18
Performing Common Tasks In SAS Inventory Optimization Workbench . . . . . 18Add a Comment By Using the Comments Manager Pane . . . . . . . . . . . . . . . . . . . . 18Using the Advanced Search Option . . . . . . . . . . . . . . . . . . . . . . . . . . . . . . . . . . . . . . . . 19Manage Columns in the User Interface . . . . . . . . . . . . . . . . . . . . . . . . . . . . . . . . . . . . . 19
Where to Find Help . . . . . . . . . . . . . . . . . . . . . . . . . . . . . . . . . . . . . . . . . . . . . . . . . . . . . . . . . 20Help Menu . . . . . . . . . . . . . . . . . . . . . . . . . . . . . . . . . . . . . . . . . . . . . . . . . . . . . . . . . . . . . . . 20
Overview of the SAS Inventory Optimization Workbench User Interface
The SAS Inventory Optimization Workbench user interface contains workspaces, categories, and views that enable you to perform related tasks within the application. Each workspace contains categories, and each category also contains views. A workspace is represented by a workspace button on the application bar.
13

The SAS Inventory Optimization Workbench user interface contains the following workspaces:
n Inventory Performance workspace with the icon
n Orders workspace with the icon
n Reports workspace with the icon
When you log on to SAS Inventory Optimization Workbench, the Inventory Performance workspace appears by default. However, you can choose to display a different workspace as the default workspace.
Inventory Performance Workspace
Overview of the Inventory Performance Workspace
The Inventory Performance workspace contains categories, and these categories contain various views. Using the categories and their views, you can monitor and analyze the performance of the inventory based on certain metrics such as lead time, demand, service level, and inventory cost. You can also generate different scenarios and ensure that you have optimally analyzed the inventory performance.
The Inventory Performance workspace is divided into the following categories:
n Products
n Facilities and Networks
n Scenarios
Products Category
In the Products category, you can monitor and analyze the inventory performance of all products that are assigned to you. Double-click a product to view its inventory performance over associated facilities. You can double-click a facility to view the inventory performance for the selected product and facility combination.
For more information, see Chapter 5, “Analyzing Inventory Performance by Products,” on page 27.
Facilities and Networks Category
In the Facilities and Networks category, you can monitor and analyze the inventory performance of all products over the facilities that are assigned to you. Double-click a facility to view the performance of all products in that facility. You can double-click a product to view the inventory performance for the selected product and facility combination.
For more information, see Chapter 6, “Analyzing Inventory Performance by Facilities and Networks,” on page 33.
14 Chapter 3 / Understanding the SAS Inventory Optimization Workbench User Interface

Scenarios Category
In the Scenarios category, you can thoroughly analyze different scenarios. You can study the impact of a change in input parameters such as service level, lead time, and demand on the overall network cost. Using this category, you can find the optimum service level for operating within the budgeted inventory costs. You can simulate the impact on network cost for varying percentages of the service level.
For more information, see Chapter 20, “Introduction to Scenario Analysis,” on page 123.
Orders Workspace
Overview of the Orders Workspace
By considering the inventory performance of products and the target service level, budget, and other important metrics, SAS Inventory Optimization Workbench suggests replenishment orders. You can monitor base and promotional orders in the Orders workspace. In addition to monitoring the suggested orders, you can also add manual orders for products. You can monitor the orders for base stock and for promotional stock.
The following categories of the Orders workspace enable you to monitor the orders:
n Base Orders category
n Promotional Orders category
To open a category, click the category in the category pane.
Base Orders Category
In the Base Orders category, you work with the base orders that are suggested by SAS Inventory Optimization Workbench for the products that are associated with you. The Base Orders category contains the following subcategories:
n Products category: You can work with the base orders that are suggested for products that belong to you.
n Facilities category: You can view the base orders for products that are present in each facility that belongs to you.
Promotional Orders Category
In the Promotional Orders category, you can work with promotions and promotional orders. SAS Inventory Optimization Workbench suggests promotional orders for vendors and promotional orders at customer-facing facilities in a two-echelon network. The Promotional Orders category contains the following subcategories:
n Vendors subcategory: You can work with promotional orders that are suggested for vendors.
Orders Workspace 15

n Customer-Facing Facilities subcategory: You can work with promotional orders that are suggested for customer-facing facilities.
Reports Workspace
The Reports workspace enables you to generate various types of reports and to analyze vital business information. SAS Inventory Optimization Workbench is tightly integrated with SAS Web Report Studio in order to perform reports-related tasks.
For more information, see Chapter 27, “Working with Reports,” on page 183.
Components of the User Interface
The SAS Inventory Optimization Workbench user interface contains the following components:
n application bar: The application bar is located at the top of the application window and is a part of the application banner. The application bar contains the File menu, Help menu, the workspace buttons, and the Log Off button.
n toolbar: All views contain a toolbar. The toolbar contains buttons that you can use to perform frequent tasks.
n File menu
n Help menu: For details, see “Where to Find Help” on page 20.
n workspace buttons: Use the workspace buttons to switch between workspaces.
n Logoff option
n Tile pane: The Tile pane appears at the bottom of the user interface. The Tile pane consists of the Actions and Layout menus.
In SAS Inventory Optimization Workbench user interface, you can work on multiple views simultaneously. The Tile pane displays all the views that are currently open. You can click a view in the Tile pane to work on that view.
n status bar: The status bar appears at the bottom of the application window. The status bar displays the user name of the user who is logged on.
Define Your Preferences
You can define the global preferences for all the SAS products that you are working on. You can also define preferences specifically for SAS Inventory Optimization Workbench.
To define preferences:
16 Chapter 3 / Understanding the SAS Inventory Optimization Workbench User Interface

1 Select File Preferences. The Preferences window appears. The left pane is the category pane. The name of the right pane changes depending on the option that you select in the category pane.
2 In the category pane, click Global Preferences, and then define the global preferences.
The following table describes the fields in the Global Preferences pane.
Table 3.1 Description of Fields in the Global Preferences Pane
Field Description
User locale Select a user locale from the list to specify the geographic region, language, and conventions. This setting might also apply to some SAS web applications that are not displayed with the Adobe Flash player.
Theme Select a theme from the list. The theme specifies the collection of colors, graphics, fonts, and effects that appear in the application.
Invert application colors
Select this check box to invert all of the colors in the application window, including text and graphical elements. You can also temporarily invert or revert the colors for an individual application session by pressing Ctrl+~.
Override settings for focus indicator
Select this check box to change the settings for the focus indicator when you are accessing the application with the keyboard. You can change the color, thickness, and opacity in order to identify the current focus. You can choose a custom color, select the thickness of the color up to 30 pixels, and select opacity up to 100%.
3 In the category pane, expand SAS Inventory Optimization Workbench, and click General.
4 Define the general preferences.
The following table describes the fields of the General pane.
Table 3.2 Description of Fields in the General Pane
Field Description
Open application using this workspace
Select a workspace that appears as the default workspace when you log on to SAS Inventory Optimization Workbench.
Show this number of recent items
Enter the number of recent items that you want to view in the Recent Work option of the File menu.
For example, when you set this option to 15, the Recent Work option displays the last 15 items that you worked on.
Workspace bar
Show both icons and labels
Select this option to view both icons and labels on the user interface.
Define Your Preferences 17

Field Description
Show icons only Select this option to view only icons on the user interface.
Show labels only Select this option to view only labels on the user interface.
5 (Optional) In the title bar of the right pane, click the Reset to Defaults link to reset all the options to their default values.
6 Click OK.
Time Zones and the User Interface
You can access the user interface of SAS Inventory Optimization Workbench by using a browser. SAS Inventory Optimization Workbench does not perform the time zone conversion automatically if the SAS Inventory Optimization Workbench server and browser are located in different time zones. Therefore, the performance of the inventory and optimization results that you see for a date and time on the user interface is for that particular server date and time. You must perform the time zone conversion manually to determine the exact performance of inventory and optimization results in your time zone.
Performing Common Tasks In SAS Inventory Optimization Workbench
Add a Comment By Using the Comments Manager Pane
You can add comments to the following items after you select them:
n a product
n a facility and network
n a scenario
n an order
For example, select a product in the Product category in the Inventory Performance workspace to add a comment about that product.
Comments include information that is specific to the item that you selected or information that you might want to share and discuss with others.
If you have the required permission, you can perform the following tasks:
n create a new topic
You can enter a subject and description for the new topic. You can select the priority of the topic and attach files to the comment.
n reply to a topic
18 Chapter 3 / Understanding the SAS Inventory Optimization Workbench User Interface

n search for a topic to comment on
To add a comment:
1 Select an item that you want to comment on.
2 In the Comments Manager pane, enter the title of the topic and a description.
3 Click Post.
Using the Advanced Search Option
Overview of Using the Advanced Search Option
In all the views in the SAS Inventory Optimization Workbench UI, you can use the advanced search option to search for the data that you want. Click , and then select the options that you want to base your search on. For example, select the New product option as the product type in the advanced search in order to view the products that have been recently introduced.
The options in the advanced search change depending on the view that you are in. For example, if you are working in the Products category in the Orders workspace, the advanced search contains options that are specific to that category.
You can search for the products and facilities based on their attributes in the Orders workspace.
Define Attribute Settings for Advanced Search
You can search the products and facilities based on their attributes in the Orders workspace. You can specify the attributes that you want to appear in the advanced search option in the Orders workspace.
To define the attributes settings for advanced search in the Orders workspace:
1 In the status bar of the Orders workspace, click . The Define Attribute Settings for Advanced Search window appears.
2 Click the Product Attributes and Facility Attributes tabs, and select attributes.
3 Click Save. The selected attributes appear on the advanced search option in the Orders workspace. You can use these attributes along with the regular advanced search options to search for the products and facilities.
Manage Columns in the User Interface
You can choose the columns that you want to be in the user interface. By choosing the columns of the data table, you can view only the information that you are interested in.
To manage columns:
1 Go to the category for which you want to manage columns, and click . The Manage Columns window appears.
Performing Common Tasks In SAS Inventory Optimization Workbench 19
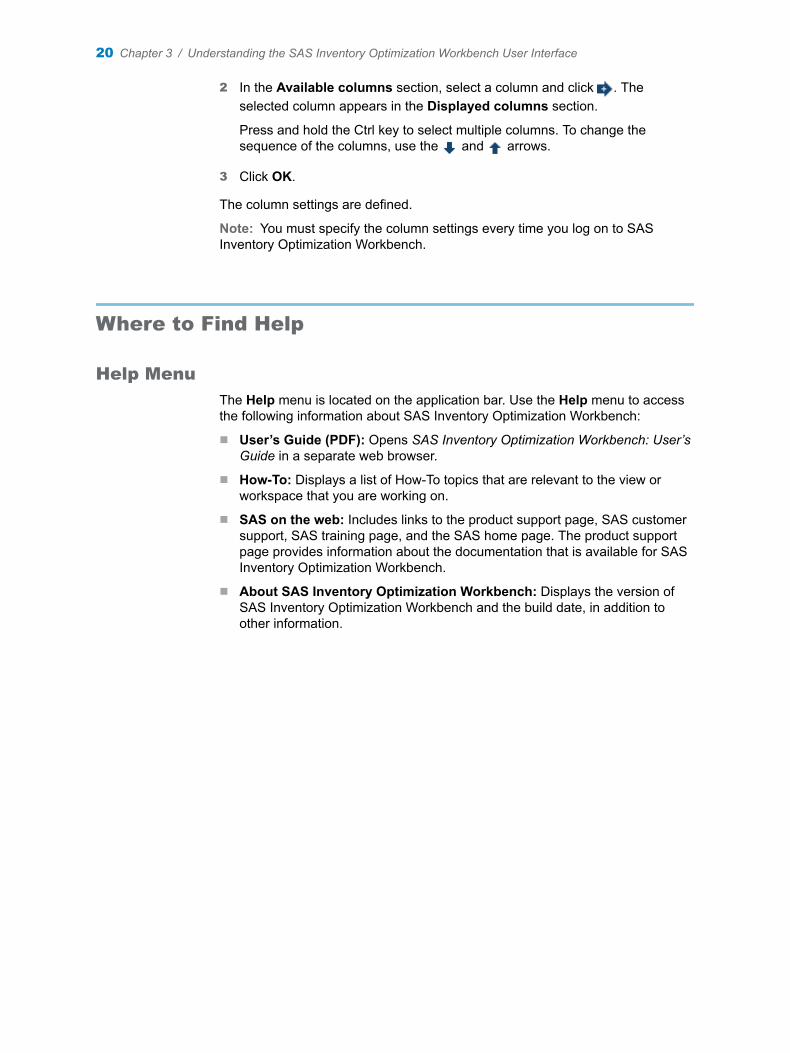
2 In the Available columns section, select a column and click . The selected column appears in the Displayed columns section.
Press and hold the Ctrl key to select multiple columns. To change the sequence of the columns, use the and arrows.
3 Click OK.
The column settings are defined.
Note: You must specify the column settings every time you log on to SAS Inventory Optimization Workbench.
Where to Find Help
Help Menu
The Help menu is located on the application bar. Use the Help menu to access the following information about SAS Inventory Optimization Workbench:
n User’s Guide (PDF): Opens SAS Inventory Optimization Workbench: User’s Guide in a separate web browser.
n How-To: Displays a list of How-To topics that are relevant to the view or workspace that you are working on.
n SAS on the web: Includes links to the product support page, SAS customer support, SAS training page, and the SAS home page. The product support page provides information about the documentation that is available for SAS Inventory Optimization Workbench.
n About SAS Inventory Optimization Workbench: Displays the version of SAS Inventory Optimization Workbench and the build date, in addition to other information.
20 Chapter 3 / Understanding the SAS Inventory Optimization Workbench User Interface

Part 2
Analyzing Inventory Performance
Chapter 4Introduction to Inventory Performance . . . . . . . . . . . . . . . . . . . . . . . . . . . . . . 23
Chapter 5Analyzing Inventory Performance by Products . . . . . . . . . . . . . . . . . . . . . . . 27
Chapter 6Analyzing Inventory Performance by Facilities and Networks . . . . . . . . . . 33
Chapter 7Managing Alert Settings . . . . . . . . . . . . . . . . . . . . . . . . . . . . . . . . . . . . . . . . . . . 37
21

22

4Introduction to Inventory Performance
Monitoring and Analyzing Inventory Performance . . . . . . . . . . . . . . . . . . . . . . . . . . . 23Overview of Inventory Performance . . . . . . . . . . . . . . . . . . . . . . . . . . . . . . . . . . . . . . . . 23Key Components of Monitoring and Analyzing Inventory Performance . . . . . . . . 23
Monitoring and Analyzing Inventory Performance
Overview of Inventory Performance
The Inventory Performance workspace enables you to monitor and analyze the performance of the products that are a part of the complete supply chain. This analysis is based on certain key performance indicators (KPIs) or metrics such as lead time, demand, service level, inventory cost, and so on.
The Inventory Performance workspace displays the inventory policies that were sent to the enterprise resource planning (ERP) system or supply chain management (SCM) system. During the inventory optimization process, SAS Inventory Optimization Workbench reviews the inventory performance against the metrics that you specified. As an inventory analyst, you can monitor the output of inventory optimization policies in the Inventory Performance workspace.
The inventory optimization process optimizes your inventory to meet the required service level. Inventory cost and service level are the key output performance indicators of the optimization process. Lead time and demand are the main inputs to the inventory optimization process and are considered as the key input performance indicators.
Key Components of Monitoring and Analyzing Inventory Performance
Key Performance Indicators
Lead Timethe average transportation time between the source and destination facilities, as measured over a given past period. The inventory optimization process uses lead time as one of the constraints. Therefore, the less the difference is
23

between the actual lead time value and the target lead time value, the more accurate are the optimization results.
Demandthe quantity of a product that is ordered at a particular facility. You need to provide the forecasted demand data for products in the source tables. The inventory optimization process uses the forecasted demand data for customer-facing facilities to calculate order policies: reorder level, order up-to level, and safety stock. Based on these policies, the inventory optimization process generates replenishment suggestions. The accuracy of the replenishment suggestions depends on the difference between the actual demand values and the forecasted demand values that are used for optimization.
Service Levela measure of the fulfillment of customer demand. The inventory optimization process considers the following types of service levels for a facility and item pair:
Fill Ratethe fraction of demand that is satisfied by on-hand inventory.
Ready Ratethe probability that a specified number of stockouts will occur in a given period.
Inventory Costthe cost of the closing inventory for the previous period.
Inventory Quantitythe quantity of the closing inventory for the previous period.
Safety Stockthe additional units of inventory that are stored as protection against possible stockouts.
Weeks of Supplythe ratio of the actual demand for a period to the average inventory for that period.
Reviewing the Performance of Products
You can monitor the inventory KPI from a product perspective or from a distribution network perspective. The Products category enables you to monitor the KPIs of products that are associated with you. You can also monitor all the facilities where the category is defined or stored. The Facilities and Networks category enables you to track the performance of products that are in a given distribution level.
In both of these categories, you can drill down from the aggregate level to a product level or a location level. You can also monitor the inventory performance of the products in a time-phased manner. Both actual and target values of the metrics (except lead time) are displayed at the aggregate level. The target values are pre-configured or are derived as a part of the inventory optimization process. You can compare these actual values with the corresponding target values to review the inventory status and to identify the products or facilities that might be a cause of concern.
The products and facilities that have performance issues in terms of service level, lead time, or demand are highlighted in the user interface, based on
24 Chapter 4 / Introduction to Inventory Performance

certain alert thresholds. You can set and control these alert threshold values for different products and facilities.
You can also initiate a what-if scenario analysis for the non-performing facility and product pairs to evaluate the outcomes under different supply chain constraints.
Inventory Performance Capabilities
In the Inventory Performance workspace, you can view the actual and target values for all the KPIs. These KPI values are either aggregated over products or facilities, or are displayed as distinct values at each facility and product level. You can compare the actual values of the metrics with the corresponding target values in order to review the inventory status and to identify the products or facilities that might require attention. For example, providing the sum of the demand of all products at a location, or providing the average lead time of all products in all locations might not serve as good input for analysis. The interface does not provide this aggregated information, but displays some relative metrics such as percentage of high lead time and percentage of low lead time.
Monitoring and Analyzing Inventory Performance 25

26 Chapter 4 / Introduction to Inventory Performance

5Analyzing Inventory Performance by Products
About Analyzing Inventory Performance by Products . . . . . . . . . . . . . . . . . . . . . . . 27
Analyzing the Inventory Performance of All Products . . . . . . . . . . . . . . . . . . . . . . . 28Overview . . . . . . . . . . . . . . . . . . . . . . . . . . . . . . . . . . . . . . . . . . . . . . . . . . . . . . . . . . . . . . . . 28The Inventory Performance Workspace for an Analysis of All Products . . . . . . . 28Analyze the Inventory Performance of All Products . . . . . . . . . . . . . . . . . . . . . . . . . . 29
Analyzing the Inventory Performance of a Product across Facilities . . . . . . . . . 29Overview . . . . . . . . . . . . . . . . . . . . . . . . . . . . . . . . . . . . . . . . . . . . . . . . . . . . . . . . . . . . . . . . 29The Inventory Performance Workspace for an Analysis across Facilities . . . . . . 29Analyze the Inventory Performance for a Product across Facilities . . . . . . . . . . . 30
Analyzing the Inventory Performance for a Product and Facility Combination . . . . . . . . . . . . . . . . . . . . . . . . . . . . . . . . . . . . . . . . . . . . . . . . . . . . . . . . 31
Overview . . . . . . . . . . . . . . . . . . . . . . . . . . . . . . . . . . . . . . . . . . . . . . . . . . . . . . . . . . . . . . . . 31The Inventory Performance Workspace for an Analysis of a
Product and Facility Combination . . . . . . . . . . . . . . . . . . . . . . . . . . . . . . . . . . . . . . . . 31Analyze the Inventory Performance for a Product and Facility Combination . . . 32
About Analyzing Inventory Performance by Products
In the Products category of the Inventory Performance workspace, you can monitor the inventory performance of all products that are associated with you. In other words, you can monitor the inventory performance of your portfolio of products. Based on your organizational structure, these products can be present within a facility or across facilities in the distribution network.
The information that you obtain from the Products category enables you to understand market dynamics across facilities and to prepare a strategy for distributing the products across those facilities.
In the Products category, you can perform the following tasks:
n analyze the inventory performance of all products that belong to you
n analyze the inventory performance of a product across all facilities
n analyze the inventory performance of a product and facility combination
27

Analyzing the Inventory Performance of All Products
Overview
You can monitor and analyze the inventory performance of all products over the supply chain network. This analysis is based on metrics such as lead time, demand, service level, sales, and inventory cost. The Inventory Performance workspace displays the aggregated actual values and the aggregated target values for service level and for inventory cost. It also displays the percentage of products with target values that are either too high or too low compared to the actual values.
In the Products category, you can perform the following main tasks:
n view aggregated metric values for products
n compare the actual and target service level values at the aggregated level and identify the percentage of products that have breached the lead time and demand thresholds
n view and modify alert settings for a product
The Inventory Performance Workspace for an Analysis of All Products
Inventory Performance Data Table
The inventory performance data table displays the following information:
n list of all products that belong to you
n name and ID of each product
n number of facilities that have a particular product
n actual, target, and percent aggregated metric values (such as values for service level, lead time, sales, demand, and so on)
Using the data table, you can quickly view your portfolio of products and compare the aggregated metric values of the products. Double-click a product to view its details.
Properties Pane
The Properties pane displays the following properties of the selected product:
n identification of the product
n name of the product
n number of facilities that have that product
n date on which the inventory optimization process was last run
n attributes of the selected product
28 Chapter 5 / Analyzing Inventory Performance by Products
Click the Show details link to display the attributes and their values for that product.
Inventory Metrics Pane
The Inventory Metrics pane displays the metric values for the selected product.
Comments Manager Pane
For more information about the Comments Manager pane, see “Add a Comment By Using the Comments Manager Pane” on page 18.
Analyze the Inventory Performance of All Products
To analyze the inventory performance of all products:
n In the Inventory Performance workspace, click the Products category.
SAS Inventory Optimization Workbench displays the list of all products that are associated with you. The metric details of these products are also displayed.
Analyzing the Inventory Performance of a Product across Facilities
Overview
SAS Inventory Optimization Workbench enables you to monitor how a product is performing across various facilities. The actual, target, and percent metric values of the selected product help you analyze its performance across facilities. For example, you can analyze the performance of televisions and projectors across the facilities in Detroit and Indiana by monitoring the actual and target service levels.
The Product Attributes and Facility Attributes panes enable you to view the attributes of the product and the attributes of the selected facility.
You can set alerts in order to monitor the performance of the selected product across facilities. You can search the facilities based on the performance of the selected product. You can define the metric values in the search criteria in order to search the facilities. The user interface displays the facilities in which the performance of the selected product satisfies the search criteria.
The Inventory Performance Workspace for an Analysis across Facilities
Inventory Performance Data Table
The inventory performance data table displays the following information for the selected product:
n list of facilities in which the selected product is present
Analyzing the Inventory Performance of a Product across Facilities 29

n name and ID of the facility
n actual, target, and percent aggregated metric values of the selected product for the corresponding facility
Using the data table, you can compare the metric values of the selected product across different facilities. Double-click the facility to view the inventory performance details of the facility and product combination.
Product Attributes Pane
The Product Attributes pane enables you to view attributes information about the product. This pane displays the following information for the selected product:
n name of the product
n product ID
n attributes of the product (for example, color, size, and so on)
Facility Attributes Pane
The Facility Attributes pane enables you to view attributes information about the facility that you select in the data table. This pane displays the following information for the selected facility:
n name of the facility
n facility ID
n attributes of the facility (such as location, storage capacity, location code, and so on)
Analyze the Inventory Performance for a Product across Facilities
To analyze the inventory performance for a product across facilities:
1 In the Inventory Performance workspace, click the Products category. SAS Inventory Optimization Workbench displays the inventory performance for all products.
2 Double-click a product. Alternatively, select a product and click Open.
The view with the title Inventory Metrics for Product Product ID Product name displays the inventory performance details about the selected product across the facilities in which it is present.
You can perform the following tasks when you are analyzing the performance of a product across facilities:
n analyze the inventory performance of the product and facility combination
n export the inventory performance information of the product into Microsoft Excel
n manage columns
n sort the content of a column
30 Chapter 5 / Analyzing Inventory Performance by Products

Analyzing the Inventory Performance for a Product and Facility Combination
Overview
SAS Inventory Optimization Workbench enables you to monitor the inventory performance of a product at a particular facility. You can view the metric values for the past period, the current period, and the planning horizon. The metric values for these time periods help you analyze inventory policies and trends in demand and supply patterns. The information that you obtain from this view helps you plan a product distribution strategy for the selected facility.
The Inventory Performance Workspace for an Analysis of a Product and Facility Combination
Plot View
The Plot view displays the values of all metrics for the past period, the current period, and the planning horizon for the selected product and facility pair. You can view the metric values of the selected product in the Graph view, the Table view, or in a divided view that contains both a table and a graph. In the divided view, press and hold the Ctrl key to select multiple metrics in the table in order to view their plots in different colors in the Graph view.
The metric values for the current period are highlighted in the table. SAS Inventory Optimization Workbench displays the past period, depending on the setting that the administrator has defined.
Product Attributes Pane
The Products Attributes pane displays the following information:
n name of the selected product
n product ID
n attributes of the selected product (such as color, size, weight, and so on)
Facility Attributes Pane
The Facility Attributes pane displays the following information:
n name of the facility
n facility ID
n attributes of the facility (such as location, storage capacity, and so on)
Analyzing the Inventory Performance for a Product and Facility Combination 31

Analyze the Inventory Performance for a Product and Facility Combination
Analyze the inventory performance for a product and facility combination in one of the following ways:
n In the Products category:
1 In the Inventory Performance workspace, click the Products category. SAS Inventory Optimization Workbench displays aggregated metric values of products in a tabular form.
2 Double-click a product. The view with the title Inventory Metrics for Product Product ID Product name opens and displays the inventory performance of the selected products across facilities.
3 Double-click a facility. The view with the title Periodic Inventory Metrics for Product and Facility Product ID Product name Facility ID Facility name opens and displays the inventory performance of the selected product at the selected facility.
n In the Facilities and Networks category:
1 In the Inventory Performance workspace, click the Facilities and Networks category. SAS Inventory Optimization Workbench displays the aggregated metric values of products across facilities.
2 Double-click a facility. The view with the title Inventory Metrics for Facility Facility ID Facility name opens and displays the metric values of all products that are present in the selected facility.
3 Double-click a product. The view with the title Periodic Inventory Metrics for Facility and Product Facility ID Facility name Product ID Product name opens and displays the metric values of the selected product at the selected facility.
32 Chapter 5 / Analyzing Inventory Performance by Products

6Analyzing Inventory Performance by Facilities and Networks
About Analyzing Inventory Performance by Facilities . . . . . . . . . . . . . . . . . . . . . . . 33
Analyzing the Inventory Performance by All Facilities . . . . . . . . . . . . . . . . . . . . . . . 34Overview . . . . . . . . . . . . . . . . . . . . . . . . . . . . . . . . . . . . . . . . . . . . . . . . . . . . . . . . . . . . . . . . 34The Inventory Performance Workspace for an Analysis of All Facilities . . . . . . . 34Analyze Inventory Performance by Facilities . . . . . . . . . . . . . . . . . . . . . . . . . . . . . . . . 35
Analyzing the Inventory Performance of All Products Present in a Facility . . 35Overview . . . . . . . . . . . . . . . . . . . . . . . . . . . . . . . . . . . . . . . . . . . . . . . . . . . . . . . . . . . . . . . . 35The Inventory Performance Workspace for an Analysis of All Products . . . . . . . 35Analyze the Inventory Performance of All Products That
Are Present in a Facility . . . . . . . . . . . . . . . . . . . . . . . . . . . . . . . . . . . . . . . . . . . . . . . . . 36
Analyzing the Inventory Performance of a Facility and a Product Combination . . . . . . . . . . . . . . . . . . . . . . . . . . . . . . . . . . . . . . . . . . . . . . . . . . . . . . . 36
About Analyzing Inventory Performance by Facilities
In the Facilities and Networks category of the Inventory Performance workspace, you can monitor the inventory performance of all products that are present in various facilities. In other words, you can monitor the following information:
n facilities and networks that belong to you
n products that are present in these facilities and networks
n inventory performance of those products by facility
Based on your organizational structure, these facilities might be located within a geographical area or distributed across various geographies. SAS Inventory Optimization Workbench enables you to monitor all facilities and analyze the performance of products that are present in each of these facilities.
The information that you obtain from the Facilities and Networks category enables you to understand the market dynamics across facilities and to prepare a strategy for distributing the products across those facilities.
In the Facilities and Networks category, you can perform the following tasks:
n view all facilities and networks that are associated with you and analyze the inventory performance of all products
33
n view a list of products that are present in a facility and analyze the inventory performance of those products
n analyze the inventory performance of a product and facility combination
Analyzing the Inventory Performance by All Facilities
Overview
You can view a list of all facilities and networks that are associated with you and analyze the inventory performance of all products that are present in those facilities. This analysis is based on metrics such as lead time, demand, service level, sales, and inventory cost. The Facilities and Networks category displays the following information:
n the aggregated actual and target values for service level and inventory cost
n the percentage of products with values that are either too high or too low, compared to the actual values
In the Facility and Networks category, you can perform the following main tasks:
n view a list of facilities and networks that belong to you
n view aggregated metric values for products that are present in the facilities
n compare the actual and target service level values at the aggregated level and identify the percentage of products in a facility that have breached the lead time and demand thresholds
n view and modify alert settings for the products that are present in a facility
The Inventory Performance Workspace for an Analysis of All Facilities
Inventory Performance Data Table
The inventory performance data table displays the following information:
n list of all facilities that belong to you
n name and ID of the facility
n number of products that are present in the corresponding facility and network
n actual, target, and percent aggregated metric values (such as service level, lead time, sales, demand, and so on)
Using the data table, you can quickly view your portfolio of facilities and compare the aggregated metric values. Double-click a facility to view details about it.
Properties Pane
The Properties pane displays the following properties for a particular facility:
n name and ID of the facility
34 Chapter 6 / Analyzing Inventory Performance by Facilities and Networks

n number of products that the selected facility contains
n attributes of the facility (for example, location type code, climatic conditions)
Click the Show details link to display the name of the attributes and their values.
n date on which the inventory optimization process was last run
Comments Manager Pane
For more information about the Comments Manager pane, see “Add a Comment By Using the Comments Manager Pane” on page 18.
Analyze Inventory Performance by Facilities
To analyze inventory performance by facilities:
n In the Inventory Performance workspace, click the Facilities and Networks category.
SAS Inventory Optimization Workbench displays the list of all facilities that are associated with you. The metric details about these facilities are also displayed.
Analyzing the Inventory Performance of All Products Present in a Facility
Overview
As an inventory analyst, you can monitor the inventory performance of all products that are present in a facility that is associated with you. You can monitor and analyze the performance of the products at a distinct facility by using the actual, target, and percent metric values. For example, you can analyze the performance of all products that are present in the Detroit facility by monitoring the actual service level and the target service level.
The Facility Attributes and Product Attributes panes enable you to view the attributes of the facility and of the selected product. You can set alerts in order to monitor the performance of the products that are present in a particular facility.
The Inventory Performance Workspace for an Analysis of All Products
Inventory Performance Data Table
The inventory performance data table displays the following information for the selected facility:
n list of all products that are present in the selected facility and network
n name and ID of the product
n actual, target, and percent metric values for each product
Analyzing the Inventory Performance of All Products Present in a Facility 35

Using the inventory performance data table, you can compare the metric values of all products that are present in the facility. Double-click the product to view the inventory performance details of the facility and product combination.
Facility Attributes Pane
The Facility Attributes pane displays the following information:
n name and ID of the facility
n attributes of the facility (for example, location, storage capacity, and so on)
Product Attributes Pane
The Product Attributes pane displays the following information:
n name and ID of the product
n attributes of the product (for example, color, size, and so on)
Analyze the Inventory Performance of All Products That Are Present in a Facility
To analyze the inventory performance of all products that are present in a facility:
1 In the Inventory Performance workspace, click the Facilities and Networks category. SAS Inventory Optimization Workbench displays a list of all facilities and the aggregated metric values for products that are present in each facility.
2 Double-click a facility. Alternatively, select a facility and click Open. The view with the title Inventory Metrics for Facility Facility ID Facility name opens and displays the inventory performance details of all products that are present in the selected facility.
Analyzing the Inventory Performance of a Facility and a Product Combination
SAS Inventory Optimization Workbench enables you to monitor the inventory performance of a product at a particular facility. You can view the metric values for the past period, the current period, and the planning horizon. The metric values for these time periods help you analyze inventory policies and the trends in demand and supply patterns. The information that you obtain from this view helps you plan a product distribution strategy for the selected facility.
You can analyze the inventory performance of a facility and product combination in the Products category and in the Facilities and Networks category.
For more information, see “Analyzing the Inventory Performance for a Product and Facility Combination” on page 31.
36 Chapter 6 / Analyzing Inventory Performance by Facilities and Networks
7Managing Alert Settings
Overview of Alert Settings . . . . . . . . . . . . . . . . . . . . . . . . . . . . . . . . . . . . . . . . . . . . . . . . . . 37
Manage Alert Settings . . . . . . . . . . . . . . . . . . . . . . . . . . . . . . . . . . . . . . . . . . . . . . . . . . . . . . 37
Overview of Alert Settings
Alerts help you identify the products or facilities that are not meeting your expectations. Alerts in the Inventory Performance workspace highlight a row in the data table that has a considerably high or low service level, lead time, or demand value. You can review this row or drill down into the row to identify whether the problem in the metric value is caused by the corresponding product or by the facility.
Alert conditions for a particular facility and product pair are different from those for facility and product combinations at aggregate levels.
All alert settings that you define are retained during the inventory optimization process. After that process is complete, SAS Inventory Optimization Workbench displays an alert on the user interface when the actual metric value for a facility and product pair exceeds the upper bound of the threshold or is lower than the lower bound of the threshold.
Manage Alert Settings
You can view the current settings for threshold conditions that generate alerts based on the metric values. If you want to specify a different threshold, you can modify these threshold conditions. You can view and modify alert settings for facility and product combinations in both the Products category and in the Facilities and Networks category.
To manage alert settings:
1 In the data table of the Products or Facilities and Networks category, select a row and click . The Alert Settings window appears and displays information about alert settings for all metrics of the selected facility and product combination.
2 Edit the alert setting values for one or more metrics, and click OK.
37

38 Chapter 7 / Managing Alert Settings
Part 3
Working with Base Orders
Chapter 8Introduction to Base Orders . . . . . . . . . . . . . . . . . . . . . . . . . . . . . . . . . . . . . . . 41
Chapter 9Understanding the User Interface of the Base Orders Category . . . . . . . . 47
Chapter 10Monitoring Information about Base Orders . . . . . . . . . . . . . . . . . . . . . . . . . . 49
Chapter 11Managing Base Orders . . . . . . . . . . . . . . . . . . . . . . . . . . . . . . . . . . . . . . . . . . . . 65
Chapter 12Managing Replenishment Locks for Base Orders . . . . . . . . . . . . . . . . . . . . . 73
Chapter 13Promoting Base Orders . . . . . . . . . . . . . . . . . . . . . . . . . . . . . . . . . . . . . . . . . . . 77
39

40

8Introduction to Base Orders
Overview of Base Orders . . . . . . . . . . . . . . . . . . . . . . . . . . . . . . . . . . . . . . . . . . . . . . . . . . . 41
Types of Base Orders . . . . . . . . . . . . . . . . . . . . . . . . . . . . . . . . . . . . . . . . . . . . . . . . . . . . . . . 41
Statuses of a Base Order . . . . . . . . . . . . . . . . . . . . . . . . . . . . . . . . . . . . . . . . . . . . . . . . . . . 42
Base Orders Workflow . . . . . . . . . . . . . . . . . . . . . . . . . . . . . . . . . . . . . . . . . . . . . . . . . . . . . . 43
Guidelines for Base Orders . . . . . . . . . . . . . . . . . . . . . . . . . . . . . . . . . . . . . . . . . . . . . . . . . 45
Overview of Base Orders
By using the Base Orders category, buyers can review and manage the replenishment orders that are suggested by SAS Inventory Optimization Workbench. In order to suggest optimal base orders, SAS Inventory Optimization Workbench considers the following input parameters for each product and facility combination pair within a multi-echelon network:
n demand (for example, projected customer demand)
n service level (for example, target service level)
n receipts of products from various channels (for example, receipt from the primary channel or from an alternate channel)
n inventory position (for example, on-hand inventory and in-transit inventory)
n delivery of base orders
n other parameters that are specified
Types of Base Orders
Based on the current inventory position and the projected service levels, products from each facility are categorized in the following ways:
n normal products
SAS Inventory Optimization Workbench suggests no orders or transshipments for these products. The average projected service level for normal products is higher than or equal to the lower bound of the target
41

service level. Inventory positions are within the range of the reorder level and order up-to level.
Even though SAS Inventory Optimization Workbench does not suggest a base order for the products that have normal stock, you can add a base order. This type of order is called a manual order.
n overstock products
SAS Inventory Optimization Workbench suggests no orders or transshipments for these products. The average projected service level is higher than or equal to the lower bound of the target service level. Inventory positions are higher than the order up-to level.
Even though SAS Inventory Optimization Workbench does not suggest a base order for products that are overstocked, you can add a base order. This type of order is called a manual order.
n low stock products
SAS Inventory Optimization Workbench recommends replenishment orders for these products. The replenishment orders can be further divided based on the order source and the ability of the source to fulfill the order under the cost constraints. The following divisions are possible:
o primary source
The average projected service level is higher than or equal to the lower bound of target service level. Orders are placed only from primary suppliers, and no transshipments are received.
o primary and alternate source
The average projected service level is higher than or equal to the lower bound of target service level. The inventory pool supplies the necessary transshipments from the primary and alternative sources.
o partial replenishment
Average projected service level is lower than the lower bound of the target service level. Excess inventories exist in the inventory pool, and shipping is possible. However, the transshipment module does not suggest the orders because they are not cost effective. If you are willing to ignore the cost impact, you can receive inventory from the inventory pool in order to fix the shortage problem.
o incomplete replenishment
The average projected service level is lower than the lower bound of the target service level. Either excess inventories are not available in the inventory pool or delivery times are not feasible. Even if you are willing to pay a high cost for the inventory, there is insufficient inventory that can be received to fix the shortage problem. To fix the shortage issue, you must order additional inventory from locations that are outside the inventory pool or from external vendors.
Statuses of a Base Order
Every order in the Base Orders category has a specific status. The following table describes the statuses.
42 Chapter 8 / Introduction to Base Orders

Table 8.1 Statuses of a Base Order
Status Description
Open The base order is open. The Open base orders are susceptible to changes during evaluation. SAS Inventory Optimization Workbench might change the base order quantity, projected service level, and cost of an open base order in the network when a base order is evaluated.
You can edit a base order that is in the Open status.
Evaluating SAS Inventory Optimization Workbench is currently evaluating the base order. During the evaluation process, you cannot edit the base orders for the selected product at any facility within the network.
Evaluated The base order has been evaluated after editing, but the results of the evaluation have not been accepted or rejected.
Failed to evaluate
The base order failed the evaluation process. Consult your administrator to determine the reason for the failure. The reason is stored in the stored process logs. After the error is removed, you can edit the base order in order to re-evaluate it.
Locked The base order is locked and can be promoted. During the evaluation process, SAS Inventory Optimization Workbench considers the details of the locked base orders but does not suggest any changes to the order quantity of those orders.
Promoting The base order is being promoted.
Promoted The base order has been promoted and is ready to be used by your enterprise resource planning (ERP) system for additional processing. Promoted base orders are stored in the output tables.
Failed to promote
The base order failed to be promoted. Consult your administrator to determine the reason for the failure. The reason is stored in the stored process logs.
Canceled The base order has been canceled for the selected product and facility. The quantity of a base order in the Canceled state is zero. Click the Canceled link in the Orders Portfolio section to view all the canceled base orders.
Base Orders Workflow
To work with base orders, use the following workflow:
1 In the Base Orders category, open the Products subcategory to monitor your portfolio of products. In this subcategory, you can view the following information for the selected product:
n the number of product and facility combinations that contain each type of base order
Base Orders Workflow 43

n other essential information about the base orders (such as replenishment type, projected service level, and so on)
Alternatively, in the Base Orders category, open the Facilities subcategory to monitor the base orders that are suggested for the facilities that are associated with you. In this subcategory, you can view the following information for the selected facility:
n the number of products that have the following types of base orders:
o primary source
o primary and alternate source
o partial replenishment
o incomplete replenishment
o manual
n other essential information about the base orders
SAS Inventory Optimization Workbench also displays the product and facility combinations that contain a normal stock of products and those that are overstocked.
2 Monitor the replenishment summary for a product and facility pair by viewing the detailed information about the relevant base orders. You can monitor the replenishment summary for all products in the Products subcategory or for all products at a particular a facility in the Facilities subcategory.
You can also monitor the replenishment details such as detailed metric information for the current period and for the future period.
3 Analyze the base orders for a product at a facility. You can perform your analysis in the Products subcategory or in the Facilities subcategory.
4 (Optional) Add a manual base order for the product and facility combinations that contain a normal stock of products or for the product and facility combinations that are overstocked. SAS Inventory Optimization Workbench does not suggest base orders for the products that contain normal stock or that are overstocked.
For more information about adding a manual base order, see “Add a Base Order” on page 68.
5 (Optional) After reviewing factors such as market conditions, facility environment, constraints, and so on, edit the base orders that are in the Open status. When you edit a base order, you perform the following tasks:
a change the order quantity, modify the transfer mode, add a vendor to receive orders, split the base order, or change the transfer mode to Custom and then change the lead time and cost
For more information about editing an order, see “Editing a Base Order” on page 65.
b evaluate the base order after you edit it
The status of the base order changes from Open to Evaluating. After the base order is evaluated completely, the status changes to Evaluated.
For more information about evaluating an order, see “Evaluate a Base Order” on page 69.
44 Chapter 8 / Introduction to Base Orders

c accept or reject the base order
After you accept or reject the base order, the status of the base order changes from Evaluated to Open.
6 Lock the base orders when you are satisfied with the information that is associated with them. The status of the base orders changes from Open to Locked.
For more information about locking an order, see “Managing Replenishment Locks for Base Orders” on page 73.
7 Promote the base orders that are in Locked status. After the base orders are promoted, the status changes from Locked to Promoted. When the base orders are promoted, they are ready to be processed by your organization’s ERP system.
For more information about promoting orders, see “Promote Base Orders” on page 77.
Guidelines for Base Orders
Consider the following guidelines when you are working in the Base Orders category:
n SAS Inventory Optimization Workbench suggests base orders for a unique combination of product and facility. For example, base orders can be suggested for the following product and facility combinations:
o Facility 1 – Camera CTX180
o Facility 2 – Camera CTX180
o Facility 3 – Camera CTX180
o Facility 1 – Camera CTX280
By suggesting base orders for unique combinations of products and facilities, buyers can more easily analyze and manage the base orders.
n Every facility contains a base stock of products. The base stock is separate from the promotional stock of products. A promotional stock of products is not mandatory.
n The base stock of products is used when no promotion is in effect. The promotional stock of products is used only for promotions or special events at the facility. SAS Inventory Optimization Workbench suggests orders for the base stock and for the promotional stock separately. The base orders are tracked and monitored in the Base Orders category.
n SAS Inventory Optimization Workbench suggests base orders only for facilities that have a low stock of a particular product. SAS Inventory Optimization Workbench does not suggest base orders for facilities that are overstocked or that contain a normal stock of products.
n A product can have a promotional demand or a base demand, but not both simultaneously. During a planning period, SAS Inventory Optimization Workbench suggests either a promotional order or a base order for each product at a facility.
Guidelines for Base Orders 45

46 Chapter 8 / Introduction to Base Orders

9Understanding the User Interface of the Base Orders Category
Overview of the Base Orders Category . . . . . . . . . . . . . . . . . . . . . . . . . . . . . . . . . . . . . . 47
Products Subcategory . . . . . . . . . . . . . . . . . . . . . . . . . . . . . . . . . . . . . . . . . . . . . . . . . . . . . . 47
Facilities Subcategory . . . . . . . . . . . . . . . . . . . . . . . . . . . . . . . . . . . . . . . . . . . . . . . . . . . . . . 48
Overview of the Base Orders Category
In the Base Orders category, you can monitor and analyze the replenishment orders that are suggested for all products and facilities that belong to you. The Base Orders category contains the following subcategories:
n Products
n Facilities
Products Subcategory
The Products subcategory displays base orders that are suggested for all products that belong to you. In the various views of the Products subcategory, you can perform the following tasks:
n monitor the portfolio of all products that belong to you, and monitor the base orders for these products
n view the summary and details of replenishment for all product and facility combinations for which base orders are suggested
n review and work with the base orders
When you open the Base Orders category, the Products subcategory opens by default.
47
Facilities Subcategory
The Facilities subcategory displays the replenishment orders for all products that are in the facilities that belong to you. You can monitor the base orders that are suggested for both internal facilities and customer-facing facilities. In the various views of the Facilities subcategory, you can perform the following tasks:
n view a list of all facilities that belong to you, and view the base orders that are suggested for all the products that are in these facilities
n view the summary and details of replenishment for all products that are in a particular facility
n review and work with the base orders
48 Chapter 9 / Understanding the User Interface of the Base Orders Category

10Monitoring Information about Base Orders
Monitoring Information about Base Orders for All Products . . . . . . . . . . . . . . . . . 49Overview . . . . . . . . . . . . . . . . . . . . . . . . . . . . . . . . . . . . . . . . . . . . . . . . . . . . . . . . . . . . . . . . 49The Base Orders Workspace for an Analysis of All Products . . . . . . . . . . . . . . . . . 50Monitor Information about Base Orders for All Products . . . . . . . . . . . . . . . . . . . . . 52
Monitoring Information about Base Orders for a Product across Facilities . . 52Overview . . . . . . . . . . . . . . . . . . . . . . . . . . . . . . . . . . . . . . . . . . . . . . . . . . . . . . . . . . . . . . . . 52The Base Orders Workspace for an Analysis across Facilities . . . . . . . . . . . . . . . 53Monitor Information about Base Orders for a Product across Facilities . . . . . . . . 54
Monitoring Information about Base Orders for All Facilities . . . . . . . . . . . . . . . . . 55Overview . . . . . . . . . . . . . . . . . . . . . . . . . . . . . . . . . . . . . . . . . . . . . . . . . . . . . . . . . . . . . . . . 55The Base Orders Workspace for an Analysis of All Facilities . . . . . . . . . . . . . . . . . 55Monitor Information of Base Orders for All Facilities . . . . . . . . . . . . . . . . . . . . . . . . . 57
Monitoring Information about Base Orders for a Facility . . . . . . . . . . . . . . . . . . . . 57Overview . . . . . . . . . . . . . . . . . . . . . . . . . . . . . . . . . . . . . . . . . . . . . . . . . . . . . . . . . . . . . . . . 57The Base Orders Workspace for an Analysis of a Facility . . . . . . . . . . . . . . . . . . . . 58Monitor Information about Base Orders for a Facility . . . . . . . . . . . . . . . . . . . . . . . . 59
Monitoring Information about Base Orders for a Product and Facility Combination . . . . . . . . . . . . . . . . . . . . . . . . . . . . . . . . . . . . . . . . . . . . . . . . . . . 60
Overview . . . . . . . . . . . . . . . . . . . . . . . . . . . . . . . . . . . . . . . . . . . . . . . . . . . . . . . . . . . . . . . . 60The Base Orders Workspace for an Analysis of a Product
and Facility Combination . . . . . . . . . . . . . . . . . . . . . . . . . . . . . . . . . . . . . . . . . . . . . . . . 60Monitor Information about Base Orders for a Product and
Facility Combination . . . . . . . . . . . . . . . . . . . . . . . . . . . . . . . . . . . . . . . . . . . . . . . . . . . . 62
Monitoring Information about Base Orders for All Products
Overview
SAS Inventory Optimization Workbench displays information about base orders for all products that are associated with you over the entire supply chain network. In the Products subcategory, you can perform the following main tasks:
49

n view a list of all products that are part of your portfolio
n view the number of facilities that currently have a particular product
n view the number of facilities that have a particular product for which base orders are suggested
n view the properties of a particular product
n lock, unlock, and promote base orders
Use the information in this subcategory to determine which products require your immediate attention. Double-click a product in order to monitor information about base orders that are suggested for that product.
The Base Orders Workspace for an Analysis of All Products
Data Table
The data table in the Products subcategory displays the following information:
n name and ID of the product
This icon in the Product Name column indicates that the product is a new product.
n the number of facilities that currently have a particular product
n the number of product and facility combinations for which base orders are suggested
n the number of product and facility combinations that have shortages of the products for the current period
The Orders Portfolio section, the Properties pane, and the Comments Manager pane display the information about the product that you select in the data table.
Orders Portfolio Section
The Orders Portfolio section displays a snapshot of the base orders that are suggested for the selected product. The following table describes the fields of the Orders Portfolio section.
Table 10.1 Fields of the Orders Portfolio Section
Field Description
Overstock Displays the number of facilities in which the selected product is overstocked. SAS Inventory Optimization Workbench does not suggest orders for products that are overstocked.
Normal Stock Displays the number of facilities in which the stock of the selected product is sufficient. SAS Inventory Optimization Workbench does not suggest orders for products that are sufficiently stocked.
50 Chapter 10 / Monitoring Information about Base Orders

Field Description
Current Shortages Displays the number of facilities in which the stock of the selected product is low for the current period.
Primary Source Displays the total number of facilities in which the base orders for the selected product can be replenished entirely from the primary source.
Primary and Alternate Source
Displays the number of facilities whose base orders for the selected product can be partially fulfilled from the primary source. The remaining base orders are transferred from one or more alternate sources.
Partial Replenishment Displays the number of facilities whose base orders for the selected product can be optimally replenished from the primary and alternate sources. However, this optimal solution (the lowest cost solution) only partially replenishes the low stock products. Inventory might be available at alternate sources, but transferring the inventory from those sources is costlier than not making an order.
Incomplete Replenishment
Displays the number of facilities whose base orders for the selected product cannot be replenished. Replenishment is not possible because of insufficient excess inventory in the primary or alternate sources.
Manual Displays the number of facilities for which the base orders were added manually.
Click the link that is associated with each field to view the details about the facilities. For example, click the link that is associated with the Primary Source field to view all facilities for which base orders for the selected product can be entirely replenished from the primary source.
The Orders Portfolio section also displays the number of facilities that have base orders that are in the following statuses:
n Open
n Evaluated
n Locked
n Promoted
n Canceled
Click the Show detailed portfolio link to view details about the status of the base orders. For more information about the Portfolio view, see “Portfolio View” on page 51.
Portfolio View
In addition to the information that is displayed in the Orders Portfolio section, the Portfolio view displays the following information about the selected product:
n the number of facilities whose base orders for the selected product are in the following statuses: Promoted, Promoting, and Failed to Promote
SAS Inventory Optimization Workbench also displays whether these base orders are Optimized, Incomplete, or Manual.
Monitoring Information about Base Orders for All Products 51

n the number of facilities whose base orders for the selected product are in the following statuses: Evaluated, Evaluating, and Failed to Evaluate
SAS Inventory Optimization Workbench displays whether these base orders are Optimized, Incomplete, or Manual.
Properties Pane
The Properties pane displays the following information:
n date on which the inventory optimization process was last run
n a link to the attribute-related information about the selected product
Comments Manager Pane
For more information about the Comments Manager pane, see “Add a Comment By Using the Comments Manager Pane” on page 18
Monitor Information about Base Orders for All Products
You can monitor the information about base orders for all products that belong to you if you have permission to do so.
To monitor the information about base orders for all products:
n In the Orders workspace, expand the Base Orders category, and click Products.
SAS Inventory Optimization Workbench displays a list of all products that belong to you and aggregated information about base orders for those products.
Monitoring Information about Base Orders for a Product across Facilities
Overview
SAS Inventory Optimization Workbench enables you to monitor information about the base orders that are suggested for a product across facilities. You can check the replenishment details, which include the periodic metric values for a particular facility. You can lock, unlock, and promote base orders that are suggested for the selected product at a facility.
Use the information in this view to determine which base orders require your immediate attention. For example, if the projected service level is less than the target service level, an icon is displayed that indicates that an immediate action is required.
52 Chapter 10 / Monitoring Information about Base Orders

The Base Orders Workspace for an Analysis across Facilities
Replenishment Summary Table
The Replenishment Summary table displays the following information about base orders that are suggested for the selected product:
n status of the base orders that are associated with each facility
n name and ID of the facility
n replenishment type
n average projected service level, in percent, for the facility
A warning icon in front of the average projected service level indicates that the average projected service level is less than that of the target service level. A tick mark icon indicates that the average projected service level is higher than the lower bound value of the service level for the facility and product.
Click to obtain the latest information about the base orders for the facility. You can obtain information such as status of the order, order quantity, and so on.
Replenishment Details Table
The Replenishment Details table displays the metric values for the selected product, for the current period and horizon. These metric values are for the facility that you selected in the Replenishment Summary table. The Replenishment Details table enables you to compare the metric values for the current period and the current planning horizon.
The Replenishment Details table displays the values for the following metrics:
n projected customer demand
n variation in customer demand
n projected internal transfer of orders
n variation in internal transfer of orders
n re-order level
n order up-to level
n order quantity
n receipts of orders from the primary channel
n order quantity from the alternate channel
n number of alternate sources
n receipt of products from alternate channels
n shipment quantity to the primary channel
n shipment quantity to alternate channels
n beginning on-hand inventory
n confirmed receipt of products
Monitoring Information about Base Orders for a Product across Facilities 53
n optimal on-hand inventory
n projected backorder
n projected receipts
n optimal future receipts
n excess on-hand inventory
n inventory shortage
n projected ending on-hand inventory
n projected service level, in percent
n target service level, in percent
n safety stock
Replenishment Metrics Pane
The Replenishment Metrics pane displays the following information for the selected product and facility combination:
n total quantity of the products requested
n total number of base orders
n transfer cost
n total cost
n service level, in percent, that is targeted at the selected facility
n lower bound of the service level, in percent
n upper bound of the service level, in percent
n projected service level at the selected facility
n penalty cost
n holding cost
n product cost
Attribute Details Pane
The Attribute Details pane displays the attributes of the selected product and facility.
Monitor Information about Base Orders for a Product across Facilities
You can monitor the information about base orders for a product across facilities if you have permission to do so.
To monitor the information about base orders for a product across facilities:
1 In the Orders workspace, expand the Base Orders category, and click Products. The Products subcategory displays the list of all products that belong to you.
2 In the Products subcategory, double-click a product.
54 Chapter 10 / Monitoring Information about Base Orders

The Replenishment Summary for Product Product ID Product name view displays the information about base orders for the selected product across facilities.
Monitoring Information about Base Orders for All Facilities
Overview
SAS Inventory Optimization Workbench displays the information about base orders for all facilities that are associated with you over the entire supply chain network. In the Facilities subcategory, you can perform the following main tasks:
n view a list of all facilities that are associated with you
n view the number of products that are in the facility
n view the number of products that are in the facility and that contain orders
n view properties of the facility
n lock, unlock, and promote the base orders
Use the information in this subcategory to determine whether a facility requires your immediate attention. Double-click a facility to monitor the detailed information about base orders that are suggested for the products in that facility.
The Base Orders Workspace for an Analysis of All Facilities
Data Table
The data table in the Facilities subcategory displays the following information:
n name and ID of the facility
n the type of the facility. The icon indicates that the facility is customer-facing or external. The icon indicates that the facility is an internal facility.
n number of products that are in a facility
n number of products that are in a facility and that contain base orders
n number of products that cannot fulfill the required service level due to shortages in the current period
Orders Portfolio
The Orders Portfolio section of the Facilities subcategory displays a snapshot of base orders that are suggested for the products that are in the selected facility. The following table describes the fields of the Orders Portfolio section.
Monitoring Information about Base Orders for All Facilities 55

Table 10.2 Fields of the Orders Portfolio Section
Field Description
Overstock Displays the number of products that are in the selected facility and that are overstocked.
Normal Stock Displays the number of products in the selected facility that contain sufficient stock.
Current Shortages Displays the number of products in the selected facility that contain low stock for the current period.
Primary Source Displays the total number of products in the selected facility whose base orders can be replenished entirely from the primary source.
Primary and Alternate Source
Displays the total number of products in the selected facility whose base orders can be partially fulfilled from the primary source. The remaining base orders are transferred from one or more alternate sources.
Partial Replenishment
Displays the number of products in the selected facility whose base orders can be optimally replenished from the primary and alternate sources. However, this optimal solution (the lowest cost solution) only partially replenishes the low-stock products. Inventory might be available at alternate sources, but transferring the inventory from those sources is costlier than not making an order.
Incomplete Replenishment
Displays the number of products in the selected facility whose base orders cannot be replenished. Replenishment is not possible because of insufficient excess inventory in the primary or alternate sources.
Manual Displays the number of products in the selected facility for which the base orders were added manually.
Click the link that is associated with each field to view the details about the products. For example, click the link that is associated with the Primary Source field to view all products for which base orders can be entirely replenished from the primary source.
The Orders Portfolio section also displays the number of products that have base orders that are in the following statuses:
n Open
n Evaluated
n Locked
n Promoted
n Canceled
Click the Show detailed portfolio link to view details about the status of the base orders. For more information about the Portfolio view, see “Portfolio View” on page 57.
56 Chapter 10 / Monitoring Information about Base Orders

Portfolio View
In addition to the information that is displayed in the Orders Portfolio section, the Portfolio view displays the following information about the selected product:
n the number of products whose base orders are in the following statuses: Promoted, Promoting, and Failed to Promote
SAS Inventory Optimization Workbench also displays whether these base orders are Optimized, Incomplete, or Manual.
n the number of facilities whose base orders for the selected product are in the following statuses: Evaluated, Evaluating, and Failed to Evaluate
SAS Inventory Optimization Workbench displays whether these base orders are Optimized, Incomplete, or Manual.
Properties Pane
The Properties pane displays the following information:
n date on which the inventory optimization process was last run
n attribute-related information about the selected facility
Comments Manager Pane
For more information about the Comments Manager pane, see “Add a Comment By Using the Comments Manager Pane” on page 18.
Monitor Information of Base Orders for All Facilities
You can monitor the information of base orders for all facilities that belong to you if you have permission to do so.
To monitor the information about base orders for all facilities:
n In the Orders workspace, expand the Base Orders category, and click Facilities.
SAS Inventory Optimization Workbench displays the list of all facilities that belong to you and information about base orders for those facilities.
Monitoring Information about Base Orders for a Facility
Overview
SAS Inventory Optimization Workbench enables you to monitor information about base orders for products that are in a particular facility. You can monitor information such as replenishment type, base order quantity, and so on. You can also check the replenishment details, which include periodic metric values. You can lock, unlock, and promote base orders that are suggested for your products.
Use the information in this view to determine which base orders require your immediate attention. For example, if the projected service level is less than the
Monitoring Information about Base Orders for a Facility 57

target service level, an icon is displayed that indicates that immediate attention is required.
The Base Orders Workspace for an Analysis of a Facility
Replenishment Summary Table
The Replenishment Summary table displays the following information about base orders that are suggested for products in the selected facility:
n status of the base orders that are suggested for the product (for example, Locked or Unlocked )
n name and ID of the product, and the status of the product
The icon indicates that the product is new. The icon indicates that the
product is obsolete. The icon indicates that the product is phased out.
n replenishment type
n order quantity for the product
n projected service level, in percent
An icon in front of the projected service level indicates that the service level in less than, greater than, or equal to the target service level.
Replenishment Details Section
The Replenishment Details section displays the metric values for the selected product, for the current period and horizon. The Replenishment Details table enables you to compare the metric values for the current period and the current planning horizon.
The Replenishment Details table displays the values for the following metrics:
n projected customer demand
n variation in customer demand
n projected internal transfer of orders
n variation in internal transfer of orders
n re-order level
n order up-to level
n receipts of orders from the primary channel
n order quantity from the alternate channel
n number of alternate sources
n receipts of products from alternate channels
n shipment quantity to the primary channel
n shipment quantity to alternate channels
n beginning on-hand inventory
n confirmed receipts of products
58 Chapter 10 / Monitoring Information about Base Orders

n optimal on-hand inventory
n projected receipts
n projected backorder
n optimal future receipts
n excess on-hand inventory
n inventory shortages
n projected ending on-hand inventory
n projected service level, in percent
n target service level, in percent
n safety stock
Replenishment Metrics Pane
The Replenishment Metrics pane gives you a quick view of the information related to replenishment metrics for the base orders of the selected product. Double-click the product in the Replenishment Summary table to view detailed information about the base orders that are suggested for that product.
The Replenishment Metrics pane displays the following information about the base orders for the selected product:
n total order quantity
n number of base orders
n transfer cost
n target service level, in percent
n lower bound of the service level, in percent
n upper bound of the service level, in percent
n projected service level, in percent
n penalty cost
n holding cost
n product cost
Attribute Details Pane
The Attribute Details pane displays the attributes of the selected product and facility.
Monitor Information about Base Orders for a Facility
You can monitor the information of base orders that are suggested for products in a particular facility if you have permission to do so.
To monitor information about base orders for a facility:
1 In the Orders workspace, expand the Base Orders category, and click Facilities. SAS Inventory Optimization Workbench displays a list of all facilities that belong to you.
Monitoring Information about Base Orders for a Facility 59

2 In the Facilities subcategory, double-click a facility.
The view with the title Replenishment Summary for Facility Facility ID Facility name displays the information about base orders that are suggested for the products in that facility.
Monitoring Information about Base Orders for a Product and Facility Combination
Overview
By monitoring information about base orders for a product in a particular facility, you can view specific information about the product. This information includes the quantity of the product that is required and detailed metric information about the current period and horizon. The information that you obtain helps you relate the current inventory position to future business requirements.
You can view summary information about base orders on the Summary tab, and details about the base orders on the Base Order Details tab. The Summary tab displays metric information in graphical form, tabular form, or in a combined view. The Base Order Details tab displays details about the base orders. You can perform various actions on the base order. For more information about managing a base order, see Chapter 11, “Managing Base Orders,” on page 65.
The Base Orders Workspace for an Analysis of a Product and Facility Combination
Summary Tab
The Summary tab displays metrics information in the following forms for the selected product and facility combination:
n graphical form: SAS Inventory Optimization Workbench displays the metrics information for the current period and horizon in a line chart. Select a metric in the table in order to view it in the line chart.
n tabular form: SAS Inventory Optimization Workbench displays the metrics information for the current period and horizon in a table. The metric values for the current period are highlighted.
n combined view: SAS Inventory Optimization Workbench displays the metric values in both a graph and a table. The graph shows the line chart for the metric that you select in the table.
Click to view only a graph, click to view only a table, or click to view a graph and a table simultaneously.
Base Order Details Tab
The Base Order Details tab contains a toolbar, the Base Orders table, the Recommended Orders section, and the Order Details pane. Using these components, you can view the base orders and perform actions on them.
60 Chapter 10 / Monitoring Information about Base Orders

SAS Inventory Optimization Workbench displays the Recommended Orders section if you edited and accepted a base order.
The toolbar contains the following buttons:
Table 10.3 Buttons on the Base Order Details Toolbar
Button Description
Click this button to add a base order to the selected product and facility. You can add a base order in order to obtain products from vendors.
For more information about adding a base order, see “Add a Base Order” on page 68.
Click this button to split the selected base order. You can split an order into multiple orders, based on your business requirements.
Click this button to delete the selected base order.
For more information about deleting a base order, see “Delete a Base Order” on page 70.
Click this button to select a substitute product for the selected product. If the base order is not satisfied on time, the substitute order takes the place of the product.
The Base Orders table contains the following fields:
Table 10.4 Fields in the Base Orders Table
Field Description
Source The type of the source (such as Primary or Alternate) from which the base order will be fulfilled.
Source ID The ID of the source.
Source Name The name of the source, such as WH Indiana 5.
Lead Time in Days The number of days that are required to deliver the product to the specified facility. If you change the transfer mode when you are editing a base order, the lead time also changes.
Order Quantity The number of products that are included in the base order. Click this column to change the order quantity.
Transfer Mode The way that the product will be transported. You can change the transfer mode while you are editing a base order. If you change the transfer mode, the lead time and transfer cost might change.
To specify a customized transfer mode, select Custom.
Transfer Cost The cost that is required to fulfill the base order.
Excess On-Hand inventory
The excess on-hand inventory of the product at the source.
Monitoring Information about Base Orders for a Product and Facility Combination 61

Field Description
Substitute Product ID
The ID of the substitute product.
Substitute Facility ID
The ID of the substitute facility.
The Recommended Orders section displays the base orders that were originally suggested by SAS Inventory Optimization Workbench.
The Order Details pane displays the following information about the selected base order:
n excess on-hand inventory of the products at the source
n inventory shortages
n name and ID of the vendor who will satisfy the base order
n maximum quantity of the base order
n safety stock of products that must be maintained at the facility
n optimal on-hand inventory
n name of the substitute product
n name of the substitute facility
Note: The Recommended Orders section is available when you edit the base orders.
Monitor Information about Base Orders for a Product and Facility Combination
If you have the required permissions, you can monitor the information about base orders for a product and facility combination in one of the following ways:
n In the Products subcategory:
1 In the Orders workspace, expand the Base Orders category, and click Products. SAS Inventory Optimization Workbench displays a list of products that belong to you.
2 Double-click a product. The view with the title Replenishment Summary for Product Product ID Product name displays a list of facilities that have the selected product.
3 Double-click a facility.
n In the Facilities subcategory:
1 On the Orders workspace, expand the Base Orders category, and click Facilities. SAS Inventory Optimization Workbench displays a list of all facilities that belong to you.
2 Double-click a facility. The view with the title Replenishment Summary for Facility Facility ID Facility name displays a list of all products that are in that facility.
62 Chapter 10 / Monitoring Information about Base Orders

3 Double-click a product.
Monitoring Information about Base Orders for a Product and Facility Combination 63

64 Chapter 10 / Monitoring Information about Base Orders

11Managing Base Orders
Editing a Base Order . . . . . . . . . . . . . . . . . . . . . . . . . . . . . . . . . . . . . . . . . . . . . . . . . . . . . . . . 65Overview . . . . . . . . . . . . . . . . . . . . . . . . . . . . . . . . . . . . . . . . . . . . . . . . . . . . . . . . . . . . . . . . 65Edit the Order Quantity . . . . . . . . . . . . . . . . . . . . . . . . . . . . . . . . . . . . . . . . . . . . . . . . . . . 66Modify the Transfer Mode for a Base Order . . . . . . . . . . . . . . . . . . . . . . . . . . . . . . . . . 66Split a Base Order . . . . . . . . . . . . . . . . . . . . . . . . . . . . . . . . . . . . . . . . . . . . . . . . . . . . . . . . 67Add a Substitute Product . . . . . . . . . . . . . . . . . . . . . . . . . . . . . . . . . . . . . . . . . . . . . . . . . . 67
Add a Base Order . . . . . . . . . . . . . . . . . . . . . . . . . . . . . . . . . . . . . . . . . . . . . . . . . . . . . . . . . . . 68
Evaluate a Base Order . . . . . . . . . . . . . . . . . . . . . . . . . . . . . . . . . . . . . . . . . . . . . . . . . . . . . . 69
Delete a Base Order . . . . . . . . . . . . . . . . . . . . . . . . . . . . . . . . . . . . . . . . . . . . . . . . . . . . . . . . 70
Cancel Base Orders . . . . . . . . . . . . . . . . . . . . . . . . . . . . . . . . . . . . . . . . . . . . . . . . . . . . . . . . 71
Reset a Base Order . . . . . . . . . . . . . . . . . . . . . . . . . . . . . . . . . . . . . . . . . . . . . . . . . . . . . . . . . 71
Editing a Base Order
Overview
When you are not satisfied with a suggested base order, you can manually change its values. You can modify the order quantity of a base order, split an order, modify the transfer mode, or add an order from a vendor. You can edit the base orders that are in the Open state.
You can delay or advance the delivery of a part of a specific order by splitting the order and then specifying different transfer modes for the new orders. You can reset the split orders back to the original order.
Base orders for incomplete replenishments are not fulfilled because there are an insufficient quantity of products in the network. You can fulfill these orders by ordering these products from external vendors. After you assign a vendor to the base orders, you must specify the customer transfer mode, cost of transfer, lead time, and transfer amount.
You can re-edit a base order. If you are editing a base order again, the original order details are available for comparison. For base orders that are of the incomplete replenishment type, you can add orders from vendors as the orders from an alternate source.
65

After you edit a base order, you must evaluate it in order to accept or reject the changes. Until you accept or reject the changes, all base orders for the selected product in the entire network are locked and cannot be worked on.
Edit the Order Quantity
After you consider the optimal on-hand inventory, inventory shortage, maximum order quantity, and safety stock for your products, you might want to change the quantity of a product that is included in the base order.
To edit the quantity of a product:
1 When you are monitoring the information about base orders for a product and facility combination in the Replenishment Details for Product and Facility view, click the Base Order Details tab. SAS Inventory Optimization Workbench displays details about the base orders that are suggested.
For more information, “Monitor Information about Base Orders for a Product and Facility Combination” on page 62.
2 In the Base Orders table, select a base order and click the Order Quantity column.
3 Type the new value and press Enter.
You can enter a minimum value of 0. You can increase the order quantity by the excess inventory that is available at the source.
After you edit the order quantity, you must evaluate the base order and then accept it. For more information about evaluating a base order, see “Evaluate a Base Order” on page 69.
Modify the Transfer Mode for a Base Order
You can change the transfer mode for a base order, and then specify the lead time and transfer cost for the new mode of transfer.
To modify the transfer mode for a base order:
1 When you are monitoring base orders for a product and facility in the Replenishment Details for Product and Facility view, click the Base Order Details tab. SAS Inventory Optimization Workbench displays details about the base orders that are suggested.
For more information, see “Monitor Information about Base Orders for a Product and Facility Combination” on page 62.
2 In the Base Orders table, select a base order and click the Transfer Mode column.
3 In the Transfer Mode column, select an option from the list. The lead time and transfer cost for the selected order is automatically calculated.
4 If you select Custom as the transfer mode, specify the lead time and transfer cost values in the Lead Time and Transfer Cost columns.
Note: When you select the custom transfer mode, the lead time must be less than the total planning horizon.
66 Chapter 11 / Managing Base Orders

After you modify the transfer mode for a base order, you must evaluate the base order and then accept it.
Split a Base Order
If you want to delay or advance the delivery of a part of a base order, you can split the base order and specify different transfer modes for the new order. In effect, the lead time for the new orders changes. You can also reset the split orders back to the original order.
To split a base order:
1 When you are monitoring information about base orders for a product and facility in the Replenishment Details for Product and Facility view, click the Base Order Details tab. SAS Inventory Optimization Workbench displays a list of base orders that are suggested.
For more information, see “Monitor Information about Base Orders for a Product and Facility Combination” on page 62.
2 Click . The Split Order window appears.
3 In the Split Order window, enter the number of orders that you want to split the order into and click OK.
The base order is split into the number of specified orders.
4 (Optional) In the Transfer Mode column, select an option from the list.
After you split a base order, you must evaluate it and accept the changes. For more information, see “Evaluate a Base Order” on page 69.
Add a Substitute Product
If a substitute product is available for an order that is partially or incompletely replenished, then you can specify a substitute product in order to fulfill the base order. Details about the substitute product are included in the promoted order.
To add a substitute product:
1 When you are monitoring base order details about a product and facility in the Replenishment Details for Product and Facility view, click the Base Order Details tab. SAS Inventory Optimization Workbench displays a list of base orders that are suggested.
For more information, see “Monitor Information about Base Orders for a Product and Facility Combination” on page 62.
2 On the Base Order Details tab, click , and then select Add Substitute Product. The Manage Substitute Product window appears.
3 Select a product and click OK.
The substitute product is added. You must evaluate the base order and then accept the changes. For more information, see “Evaluate a Base Order” on page 69.
Editing a Base Order 67

Add a Base Order
When you foresee a sudden demand for your products at a particular facility, you can add a base order. You can add the order to a product of any type, such as a product that is designated as low stock, normal stock, or overstock. For the base orders that are partially or incompletely replenished, you can fulfill the target service level by adding a base order.
When you add a base order to a normal stock or overstocked product, you can track the newly added base order in the Manual category of the Orders Portfolio section.
You can also add a base order for the vendor. In other words, you can place the order for a vendor and anticipate the order to be fulfilled from the vendor. You cannot anticipate the order to be fulfilled from an internal facility.
The following prerequisites apply:
n You must have permission to add a base order.
n The existing base orders for the product must be in the Open state.
To add a base order:
1 When you are monitoring base orders for a product at a particular facility in the Replenishment Details for Product and Facility view, click the Base Order Details tab. SAS Inventory Optimization Workbench displays the base orders that are suggested.
For more information, see “Monitor Information about Base Orders for a Product and Facility Combination” on page 62.
2 Click . The Add Order window appears.
3 Enter information in each field. The following table describes the fields.
Table 11.1 Description of Fields in the Add Order Window
Field Description
Vendor Name The name of the vendor.
Primary Vendor Displays whether the vendor is primary.
Order Quantity The quantity of products to be ordered.
4 Click OK. The base order is added with the following information: Source as Alternate, Transfer Mode as Custom, and Lead Time as zero days.
5 (Optional) Modify the lead time, transfer mode, and transfer cost with realistic information. For more information, see “Modify the Transfer Mode for a Base Order” on page 66.
After you manually add the base order, you must evaluate the base orders and then accept or reject the changes. For more information, see “Evaluate a Base Order” on page 69.
68 Chapter 11 / Managing Base Orders
Evaluate a Base Order
You evaluate a base order in order to understand the impact of changes that you made to it. If you accept the changes, SAS Inventory Optimization Workbench saves the modified information about the base order. If you reject the changes, SAS Inventory Optimization Workbench saves the original information about the base order.
When you evaluate a base order, SAS Inventory Optimization Workbench calculates the impact of the edited base order on the entire network and displays the results. While evaluating a base order, the inventory optimization process is run and you cannot edit the base orders that are suggested for that product at all facilities in the network.
The following prerequisites apply:
n You must have permission to evaluate a base order.
n The base order must be in the Open state.
n You must have performed at least one of the following tasks: edited the base order, added a manual base order, split a base order, or canceled a base order.
To evaluate a base order:
1 When you are monitoring information about a base order for a product and facility in the Replenishment Details for Product and Facility view, click the Base Order Details tab. SAS Inventory Optimization Workbench displays all base orders that are suggested for the product at that facility.
For more information, see “Monitor Information about Base Orders for a Product and Facility Combination” on page 62.
2 Add a new base order, or edit the existing base order to change the order quantity, transfer mode, cost, or lead time.
For more information about editing a base order, see “Editing a Base Order” on page 65. For more information about adding a base order, see “Add a Base Order” on page 68.
After you edit a base order or add a base order from a vendor, a message appears.
3 Click the Evaluate link. SAS Inventory Optimization Workbench runs the inventory optimization process to calculate the impact of the new or edited order on the entire network. After the evaluation is completed, the Show results link becomes available.
4 Click Show results. The Evaluate Orders window appears and displays the impact of the changes that you made.
5 Compare the earlier metric values with the latest metric values.
The following table describes the fields in the Evaluate Orders window.
Evaluate a Base Order 69

Table 11.2 Description of Fields in the Evaluate Orders Window
Field Description
Metrics Displays metrics about the base order.
Current Displays the original metric values that were suggested for the selected base order.
New Displays the metrics that resulted from the modifications.
6 Click Accept to accept all the changes that you made. Click Reject to reject the changes.
Delete a Base Order
When a product and facility combination contains multiple base orders, you can delete a base order that is not required.
Note: You cannot delete all the base orders. At least one of the base orders from the primary source must remain.
The following prerequisites apply:
n You must have permission to delete a base order.
n The base order must be in the Open state.
n At least two base orders are present for the selected product at the specified facility. You cannot delete a base order that is the only order for the selected product and facility combination.
To delete a base order:
1 When you are monitoring the information about base orders for a product and facility in the Replenishment Details for Product and Facility view, click the Base Orders tab. SAS Inventory Optimization Workbench displays all the base orders.
For more information, see “Monitor Information about Base Orders for a Product and Facility Combination” on page 62
2 Select a base order, and click . A confirmation message appears.
Note: You cannot delete a base order if it is the only base order for the selected product and facility combination and that base order is generated for the primary source.
3 Click OK.
The selected base order is removed, and you must evaluate and accept the changes in order to completely delete the base order from SAS Inventory Optimization Workbench.
For more information about evaluating a base order, see “Evaluate a Base Order” on page 69.
70 Chapter 11 / Managing Base Orders
Cancel Base Orders
Cancel base orders when you want to perform the following tasks:
n make the order quantity for all base orders zero
n make the order quantity for base orders available to other facilities in the network
The following prerequisites apply:
n You must have permission to cancel base orders
n The base orders must be in the Open state.
To cancel base orders:
1 Perform one of the following tasks:
n If you are monitoring the base orders for a product, select a facility.
For more information, see “Monitor Information about Base Orders for a Product across Facilities” on page 54.
n If you are monitoring the base orders for a facility, select a product.
For more information, see “Monitor Information about Base Orders for a Facility” on page 59.
n If you are monitoring the base orders for a product and facility combination, select a base order.
For more information, see “Monitor Information about Base Orders for a Product and Facility Combination” on page 62.
2 Click . A confirmation message appears.
3 Click Yes.
The base orders are evaluated, and you must accept or reject the changes. For more information, see Step 4 on page 69. The canceled base orders are available in the Canceled category of the Orders Portfolio section.
Reset a Base Order
After you have edited a base order, you can reset the base order to its original values.
The following prerequisites apply:
n You must have permission to reset a base order.
n You must have edited the base order.
To reset a base order:
1 When you are monitoring the base orders for a product and facility in the Replenishment Details for Product and Facility view, click the Base
Reset a Base Order 71

Order Details tab. SAS Inventory Optimization Workbench displays a list of all base orders.
For more information, see “Monitor Information about Base Orders for a Product and Facility Combination” on page 62.
2 Select a base order, and click . A confirmation message appears.
3 Click OK.
All changes that you made to the selected base order are reset to original values.
72 Chapter 11 / Managing Base Orders

12Managing Replenishment Locks for Base Orders
Overview of Replenishment Locks . . . . . . . . . . . . . . . . . . . . . . . . . . . . . . . . . . . . . . . . . . 73
Managing Replenishment Locks for Base Orders . . . . . . . . . . . . . . . . . . . . . . . . . . . 73Lock or Unlock a Base Order . . . . . . . . . . . . . . . . . . . . . . . . . . . . . . . . . . . . . . . . . . . . . . 73Define Auto-Replenishment Settings . . . . . . . . . . . . . . . . . . . . . . . . . . . . . . . . . . . . . . . 74
Overview of Replenishment Locks
You can lock a base order so that it cannot be edited. After you lock a base order, its status changes from Open to Locked. SAS Inventory Optimization Workbench does not consider the base orders that are in the locked state during the evaluation process. The order quantity for base orders that are in the Locked state is not changed.
You must unlock a base order to edit it. After a base order is unlocked, its status changes from Locked to Open. You can change the order quantity of all base orders that are in the Open state for a product during the evaluation process.
Managing Replenishment Locks for Base Orders
Lock or Unlock a Base Order
You can lock or unlock a base order from different places in SAS Inventory Optimization Workbench. However, the procedures are the same. Depending on where you are in the user interface, select either a product or a facility and click
to lock one or more base orders, or click to unlock one or more base orders. If you select a facility, the action is performed on all the products in that facility.
Clicking locks all base orders that are in the Open state. Clicking unlocks all base orders that are in the Locked state.
73

Define Auto-Replenishment Settings
By defining auto-replenishment settings, you can choose to lock and promote the base orders automatically if you have permission to do so. The auto-replenishment settings help you to not spend time on reviewing each base order.
You can choose to automatically lock all primary base orders or all primary and alternate base orders. You can also choose to automatically promote all fulfilled and incomplete orders. The auto-replenishment settings take effect during the next run of the inventory optimization process.
Note: SAS Inventory Optimization Workbench applies the auto-replenishment settings to all base orders for the products and facilities that belong to you.
To define the auto-replenishment settings:
1 On the status bar in the Orders workspace, click . The Define Auto-Replenishment Settings window appears.
2 Select the appropriate option. The following table describes the auto-replenishment settings.
Table 12.1 Description of Options in the Define Auto-Replenishment Settings Window
Option Description
Auto Lock Select the type of base orders that you want to automatically lock:n primary replenishmentn primary and alternate replenishmentn partial replenishmentn incomplete replenishment
Lock Primary Select this check box to automatically lock all base orders that are both in the Open state and that are to be fulfilled from the primary source.
Lock Primary and Alternate
Select this check box to automatically lock all base orders that are both in the Open state and that are to be fulfilled from the primary and alternate sources.
Lock Partial Select this check box to automatically lock all base orders that are both in the Open state and that are to be optimally fulfilled from the primary source and from the alternate sources. However, this optimal solution only partially replenishes the low stock products.
Lock Incomplete Select this check box to automatically lock all base orders that are both in the Open state and that cannot be replenished. The replenishment is not possible because of insufficient excess inventory in the primary or alternate sources.
74 Chapter 12 / Managing Replenishment Locks for Base Orders

Option Description
Auto Promote Select the type of base orders that you want to automatically promote:n primary replenishmentn primary and alternate replenishmentn partial replenishmentn incomplete replenishment
Promote Primary Select this check box to automatically promote all base orders that are both in the Open state and that are to be fulfilled from the primary source.
Promote Primary and Alternate
Select this check box to automatically promote all base orders that are both in the Open state and that are to be fulfilled from the primary and alternate sources.
Promote Partial Select this check box to automatically promote all base orders that are both in the Open state and that are to be optimally fulfilled from the primary source and from the alternate sources. However, this optimal solution only partially replenishes the low stock products.
Promote Incomplete Select this check box to automatically promote all base orders that are both in the Open state and that cannot be replenished. The replenishment is not possible because of insufficient excess inventory in the primary or alternate sources.
3 Click OK.
Managing Replenishment Locks for Base Orders 75

76 Chapter 12 / Managing Replenishment Locks for Base Orders

13Promoting Base Orders
Overview of Promoting Base Orders . . . . . . . . . . . . . . . . . . . . . . . . . . . . . . . . . . . . . . . . 77
Promote Base Orders . . . . . . . . . . . . . . . . . . . . . . . . . . . . . . . . . . . . . . . . . . . . . . . . . . . . . . . 77
Overview of Promoting Base Orders
You promote a base order in order to submit that order to the external enterprise resource planning (ERP) system that your organization uses. By promoting base orders, the base order details are copied to the database tables. You can promote the base orders that are in the Locked state. After the base orders are promoted, they are copied to the PROMOTED_ORDER_DETAILS table. The administrator can copy data from this table and load the data into the tables that are required by your ERP system.
Promote Base Orders
You can promote a base order from different places in SAS Inventory Optimization Workbench. However, the procedures are the same. Depending on where you are in the user interface, select either a product or a facility and click
to promote one or more base orders. If you select a facility, the action is performed on all products in that facility.
77

78 Chapter 13 / Promoting Base Orders

Part 4
Working with Promotional Orders
Chapter 14Introduction to Promotional Orders . . . . . . . . . . . . . . . . . . . . . . . . . . . . . . . . . 81
Chapter 15Monitoring Promotional Orders for Vendors . . . . . . . . . . . . . . . . . . . . . . . . . 85
Chapter 16Managing Promotional Orders Suggested for Vendors . . . . . . . . . . . . . . . . 93
Chapter 17Monitoring Promotional Orders at Customer-Facing Facilities . . . . . . . . 107
Chapter 18Managing Replenishment Locks for Promotional Orders . . . . . . . . . . . . . 115
Chapter 19Promoting Promotional Orders . . . . . . . . . . . . . . . . . . . . . . . . . . . . . . . . . . . . 119
79

80

14Introduction to Promotional Orders
About Promotional Orders . . . . . . . . . . . . . . . . . . . . . . . . . . . . . . . . . . . . . . . . . . . . . . . . . . 81
Guidelines for Promotional Orders . . . . . . . . . . . . . . . . . . . . . . . . . . . . . . . . . . . . . . . . . . 81
Promotional Orders in a Two-Echelon Network . . . . . . . . . . . . . . . . . . . . . . . . . . . . . . 82
Promotional Orders in a Single-Echelon Network . . . . . . . . . . . . . . . . . . . . . . . . . . . 83
About Promotional Orders
By using the Promotional Orders category, buyers can review and manage promotional orders that are suggested by SAS Inventory Optimization Workbench. SAS Inventory Optimization Workbench supports single-echelon and two-echelon networks for promotional orders. By considering the promotional demand and periodicity of the inventory optimization process, buyers can work with promotional orders during the promotional planning period.
Guidelines for Promotional Orders
The following guidelines apply to promotional orders:
n Promotional orders can be generated only for a single-echelon or two-echelon network.
n If a product contains both base orders and promotional orders, the lead time for each type of order might be different.
n The planning horizon for the promotional orders of a product is greater than the sum of the total lead time of the network and the review period for vendors and customer-facing facilities. (A network includes both internal facilities and customer-facing facilities.)
n The lead time for a product across all customer-facing facilities that are part of an internal facility is the same for all facilities.
n A product at a facility can exist only in one promotion at a time. A product cannot exist in multiple promotions at a facility simultaneously.
n Inventory for promotional stock is different from the inventory for base stock at a facility.
81

n A promotional order for a product can contain a different lead time, price, or vendor than a base order for the same product.
n If a promotion spans multiple periods, SAS Inventory Optimization Workbench generates a separate promotional order for a product for each period.
For example, suppose the periodicity is weekly and a promotion spans three weeks. SAS Inventory Optimization Workbench generates three promotional orders.
n When the promotion period is less than the periodicity of the optimization process, SAS Inventory Optimization Workbench aggregates the demand according to the periodicity of the optimization process.
For example, suppose the periodicity of the optimization process is weekly and the promotion occurs on two different days in that week. SAS Inventory Optimization Workbench aggregates the demand of these two promotions.
Promotional Orders in a Two-Echelon Network
In a two-echelon network, SAS Inventory Optimization Workbench suggests promotional orders for vendors and for customer-facing facilities. The distribution center receives products from vendors. The products are then distributed to customer-facing facilities.
SAS Inventory Optimization Workbench suggests milestones for promotional orders based on the following factors:
n promotion planning period
n periodicity of the inventory optimization process
n promotional demand
n lead time of the product
Milestones are reviewing orders for vendors, finalizing orders for vendors, reviewing orders for customer-facing facilities, and finalizing orders for customer-facing facilities.
The following table describes these milestones.
Table 14.1 Milestones in a Two-Echelon Network
Milestone Description
Review promotional orders for vendors
SAS Inventory Optimization Workbench first suggests promotional orders for vendors. During the review period, the buyer can view the promotional orders for all products that are included in the promotion. SAS Inventory Optimization Workbench shows detailed information for each product.
As a buyer, you can review the order quantities for each vendor and edit them if you need to. If you edit the order quantity, you can view the impact of your changes.
82 Chapter 14 / Introduction to Promotional Orders

Milestone Description
Finalize promotional orders for vendors
You must negotiate with each vendor and then confirm the order quantity. You can negotiate with the vendor for better rates, discounts, and other offers. After you are satisfied with the vendor, you can finalize the promotional order for the vendor. You can lock and then promote the order so that the order can be processed.
At the end of this milestone, SAS Inventory Optimization Workbench sends all promotional orders for vendors that are in the Promoted state to a database. The administrator can then send these orders to your organization’s enterprise resource planning (ERP) system so that the distribution center receives the products.
Review promotional orders for customer-facing facilities
You can obtain the demand from the store manager of each customer-facing facility. Then you can review and analyze the demand so that the products can be distributed.
As a buyer, you can review the order quantities, and edit them if required.
Finalize promotional orders for customer-facing facilities
You edit the order quantity and then promote the promotional order. At the end of this milestone, SAS Inventory Optimization Workbench sends all promotional orders for customer-facing facilities that are in the Promoted status to a database. The administrator can then send these orders to your organization’s ERP system so that the products are distributed to the customer-facing facilities.
Promotional Orders in a Single-Echelon Network
In a single-echelon network, SAS Inventory Optimization Workbench suggests promotional orders to vendors. The products are received from vendors and are distributed directly to the customer-facing facilities. There is no distribution center in a single-echelon network.
SAS Inventory Optimization Workbench suggests milestones for promotional orders based on the following factors:
n promotion planning period
n periodicity of the inventory optimization process
n promotional demand
n lead time of the product
These milestones are reviewing promotional orders for vendors and finalizing promotional orders for vendors. The following table describes these milestones.
Promotional Orders in a Single-Echelon Network 83

Table 14.2 Description of Milestones in a Single-Echelon Network
Milestone Description
Review promotional orders for vendors
SAS Inventory Optimization Workbench first suggests promotional orders for vendors. During the review period, the buyer can view the promotional orders for all products that are included in the promotion. SAS Inventory Optimization Workbench shows detailed information about each product.
As a buyer, you can review the order quantities for each vendor and edit them if you need to. If you edit the order quantity, you can view the impact of your changes.
Finalize promotional orders for vendors
You must negotiate with each vendor and confirm the order quantity. You can negotiate with the vendor for better rates, discounts, and other offers. After you are satisfied with the vendor, you can finalize the promotional order for that vendor. You can lock and then promote the order so that the order can be processed.
At the end of this milestone, SAS Inventory Optimization Workbench sends all promotional orders for vendors that are in the Promoted status to a database. The administrator can then send these orders to your organization’s ERP system so that the products can be sent to the customer-facing facilities.
84 Chapter 14 / Introduction to Promotional Orders

15Monitoring Promotional Orders for Vendors
Viewing All Promotions . . . . . . . . . . . . . . . . . . . . . . . . . . . . . . . . . . . . . . . . . . . . . . . . . . . . . 85About Viewing All Promotions . . . . . . . . . . . . . . . . . . . . . . . . . . . . . . . . . . . . . . . . . . . . . 85The Promotional Orders Workspace for an Analysis of All Promotions . . . . . . . . 85View All Promotions . . . . . . . . . . . . . . . . . . . . . . . . . . . . . . . . . . . . . . . . . . . . . . . . . . . . . . 86
Viewing Details about a Promotion . . . . . . . . . . . . . . . . . . . . . . . . . . . . . . . . . . . . . . . . . . 87Overview . . . . . . . . . . . . . . . . . . . . . . . . . . . . . . . . . . . . . . . . . . . . . . . . . . . . . . . . . . . . . . . . 87View Details of a Promotion . . . . . . . . . . . . . . . . . . . . . . . . . . . . . . . . . . . . . . . . . . . . . . . 87The Promotional Orders Workspace for an Analysis of a Promotion . . . . . . . . . . 87
Viewing Details about the Promotional Orders for a Product . . . . . . . . . . . . . . . . 89Overview . . . . . . . . . . . . . . . . . . . . . . . . . . . . . . . . . . . . . . . . . . . . . . . . . . . . . . . . . . . . . . . . 89View Details about Promotional Orders for a Product . . . . . . . . . . . . . . . . . . . . . . . . 89The Promotional Orders Workspace for an Analysis of
Promotional Orders about a Product . . . . . . . . . . . . . . . . . . . . . . . . . . . . . . . . . . . . . 90
Viewing All Promotions
About Viewing All Promotions
SAS Inventory Optimization Workbench enables you to view all promotions that are associated with you. You can also view a snapshot of a promotion. The information that you obtain from this view helps you understand the health of the promotion.
Double-click a promotion to view the products that are involved in that promotion.
The Promotional Orders Workspace for an Analysis of All Promotions
Data Table
The data table displays the information about all promotions that belong to you. The following table describes the fields of the data table.
85

Table 15.1 Description of Fields in the Data Table
Field Description
Promotion ID The promotion ID.
Promotion Name The name of the promotion.
Promotion Start Date
The start date of the promotion.
Promotion End Date
The end date of the promotion.
Number of Products
The number of products that are involved in the promotion.
Total Promotional Orders
The total number of promotional orders that are suggested for the vendors.
Orders Portfolio
The Orders Portfolio section displays the following information for a selected promotion that contains promotional orders for vendors:
n number of promotional orders that need to be reviewed in the current period
n number of promotional orders that need to be finalized in the current period
The Orders Portfolio section also displays the number of promotional orders that are in each status, such as Open, Locked, Promoted, or Canceled.
SAS Inventory Optimization Workbench also displays the number of orders for which an action is not required. An action on a promotional order is not required because the milestone of reviewing or finalizing a promotional order has not yet arrived. In such a case, products that are associated with these orders are not displayed in the Vendors: Product Summary for Promotion view.
Properties Pane
The Properties pane displays the following information about the selected promotion:
n name and ID of the promotion
n number of products that are involved in the promotion
Comments Manager Pane
For more information about the Comments Manager pane, “Add a Comment By Using the Comments Manager Pane” on page 18.
View All Promotions
By simultaneously viewing all promotions with suggested orders for vendors, you can determine which promotion requires immediate action.
86 Chapter 15 / Monitoring Promotional Orders for Vendors
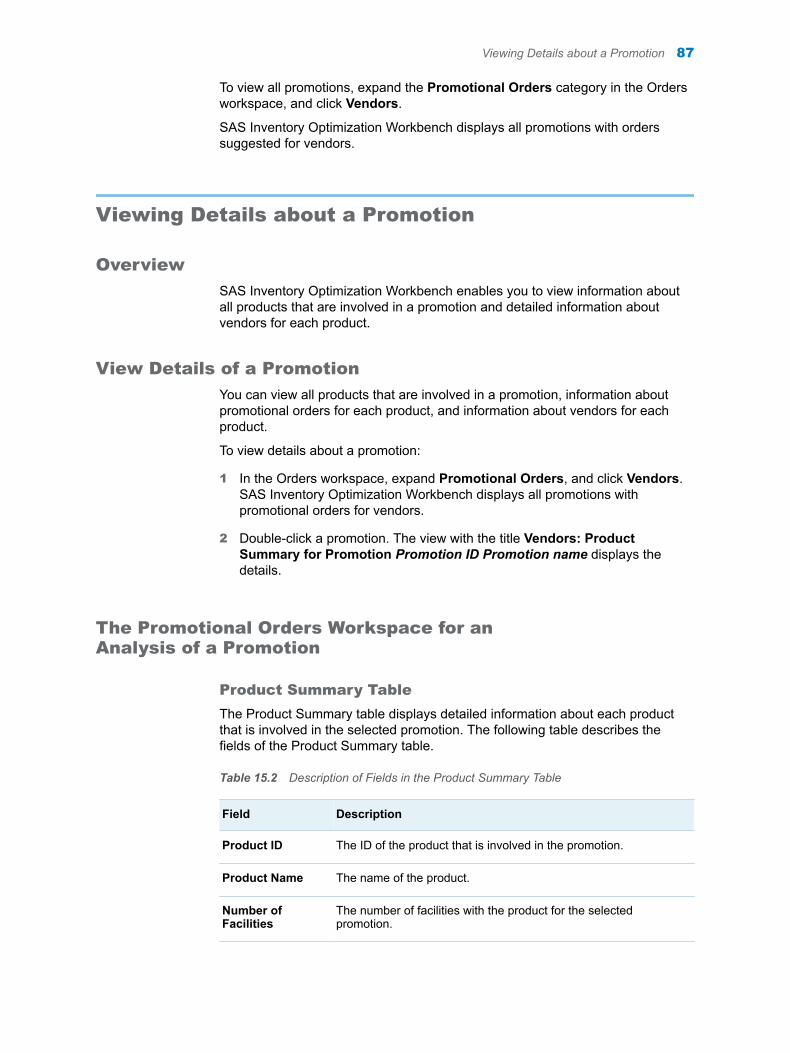
To view all promotions, expand the Promotional Orders category in the Orders workspace, and click Vendors.
SAS Inventory Optimization Workbench displays all promotions with orders suggested for vendors.
Viewing Details about a Promotion
Overview
SAS Inventory Optimization Workbench enables you to view information about all products that are involved in a promotion and detailed information about vendors for each product.
View Details of a Promotion
You can view all products that are involved in a promotion, information about promotional orders for each product, and information about vendors for each product.
To view details about a promotion:
1 In the Orders workspace, expand Promotional Orders, and click Vendors. SAS Inventory Optimization Workbench displays all promotions with promotional orders for vendors.
2 Double-click a promotion. The view with the title Vendors: Product Summary for Promotion Promotion ID Promotion name displays the details.
The Promotional Orders Workspace for an Analysis of a Promotion
Product Summary Table
The Product Summary table displays detailed information about each product that is involved in the selected promotion. The following table describes the fields of the Product Summary table.
Table 15.2 Description of Fields in the Product Summary Table
Field Description
Product ID The ID of the product that is involved in the promotion.
Product Name The name of the product.
Number of Facilities
The number of facilities with the product for the selected promotion.
Viewing Details about a Promotion 87

Field Description
Number of Vendors
The number of vendors from which this promotional order can be fulfilled.
Action Required The action that you must perform on the promotional orders for this product. For example, you might need to review the order or finalize the order.
Total Final Order Quantity
The total final order quantity for the products, aggregated over the different facilities in the promotional order. The total final order quantity might be different from the suggested order quantity if you edited the final order quantity.
Total Suggested Order Quantity
The total order quantity for the products, aggregated over the different facilities.
Start Date of Finalization Period
The start date of the finalization period. You must promote the promotional order during the finalization period. When you promote the promotional order for the product, SAS Inventory Optimization Workbench copies the orders to the PROMOTED_PROMO_VENDOR_ORDER_DTLS table.
Start Date of Receipts Due Period
The start date of the receipts due period. The products are delivered to the facility by the receipts due period.
Vendors Summary Section
The Vendors Summary section displays the list of the vendors for whom the promotional order for the selected product is suggested. The vendors in this list can satisfy the promotional order. You can edit the aggregated order quantity for the vendor, lock and unlock the promotional orders at vendor, and so on.
The following table describes the fields in the Vendor Summary section.
Table 15.3 Description of Fields in the Vendor Summary Section
Fields Description
Status The status of the aggregated promotional order for the vendor.
Vendor ID The vendor ID.
Vendor Name The name of the vendor for whom the promotional order is suggested for the selected product.
Number of Facilities
The number of facilities to which the vendor is providing the selected product.
Total Final Order Quantity
The total final order quantity of products, aggregated over all facilities.
Total Suggested Order Quantity
The total order quantity suggested by SAS Inventory Optimization Workbench for the vendor.
88 Chapter 15 / Monitoring Promotional Orders for Vendors

You can also perform the following actions in the Vendors Summary section:
n lock a promotional order for a vendor
n unlock a promotional order for a vendor
n view the facilities that the vendor supplies
n edit the total final order quantity
n view the impact of your changes on the promotional order
Properties Pane
The Properties pane displays the following information:
n name and ID of the product
n number of vendors with the selected product
n action required for the promotional order
Comments Manager Pane
For more information about the Comments Manager pane, see “Add a Comment By Using the Comments Manager Pane” on page 18.
Viewing Details about the Promotional Orders for a Product
Overview
You can view the promotional orders for a product that are suggested for vendors. You can edit, review, and finalize a promotional order.
View Details about Promotional Orders for a Product
To view the promotional order details about a product:
1 In the Orders workspace, expand Promotional Orders and click Vendors. SAS Inventory Optimization Workbench displays all promotions that contain promotional orders that have been suggested for vendors.
2 Double-click a promotion. The view with the title Vendors: Product Summary for Promotion Promotion ID Promotion name displays the list of products that are involved in a promotion.
3 Double-click a product. The view with the title Vendors: Order Details for Product for Promotion Product ID Product name Promotion ID Promotion name displays the details about all promotional orders for that product.
Viewing Details about the Promotional Orders for a Product 89

The Promotional Orders Workspace for an Analysis of Promotional Orders about a Product
Order Details Table
The Order Details table displays the promotional orders, by vendor, for the selected product. Each promotional order that is suggested for a vendor is the unique combination of promotion, product, facility, vendor, action required, and start date of the finalization period.
The following table describes the fields in the Order Details table.
Table 15.4 Description of Fields in the Order Details Table
Field Description
Status Displays the status of the promotional order . The icon indicates that the promotional order is locked. The icon indicates that the promotional order is unlocked.
Facility ID The facility ID.
Facility Name The name of the facility.
Facility Type The type of the facility. The facility type can be internal or external. The icon indicates that the facility is an external or
customer-facing facility. The icon indicates that the facility is an internal facility.
Action Required The action that you must perform on the promotional order. For example, you might need to review the order or finalize the order.
Vendor ID The vendor ID.
Primary Vendor Displays whether the promotional order is suggested for the primary vendor.
Final Order Quantity
The final order quantity that is placed to the vendor for the promotional order.
Suggested Order Quantity
The order quantity that is suggested by SAS Inventory Optimization Workbench for the promotional order.
Start Date of Finalization Period
The start date of the finalization period. You must promote the order during the finalization period.
Start Date of Receipt Due Period
The start date of the receipt due period. The products are delivered to the internal facility by the receipts due period in a two-echelon network.
Lot Size The lot size. The lot size is the quantity of products that must be present in a lot or batch.
90 Chapter 15 / Monitoring Promotional Orders for Vendors

Field Description
Min-Max Order Quantity
The minimum and maximum order quantities. The minimum and maximum order quantities must be multiples of the lot size.
Viewing Details about the Promotional Orders for a Product 91

92 Chapter 15 / Monitoring Promotional Orders for Vendors

16Managing Promotional Orders Suggested for Vendors
Edit the Order Quantity for a Vendor . . . . . . . . . . . . . . . . . . . . . . . . . . . . . . . . . . . . . . . . 93
View Facilities . . . . . . . . . . . . . . . . . . . . . . . . . . . . . . . . . . . . . . . . . . . . . . . . . . . . . . . . . . . . . . 94
Edit the Order Quantity for a Promotional Order . . . . . . . . . . . . . . . . . . . . . . . . . . . . . 95
View the Impact of an Edited Order . . . . . . . . . . . . . . . . . . . . . . . . . . . . . . . . . . . . . . . . . 97
Manage Locks for Promotional Orders for a Vendor . . . . . . . . . . . . . . . . . . . . . . . . . 99About Locks of a Promotional Order for a Vendor . . . . . . . . . . . . . . . . . . . . . . . . . . . 99Lock a Promotional Order for a Vendor . . . . . . . . . . . . . . . . . . . . . . . . . . . . . . . . . . . . . 99Unlock a Promotional Order for a Vendor . . . . . . . . . . . . . . . . . . . . . . . . . . . . . . . . . 100
Cancel a Promotional Order for a Vendor . . . . . . . . . . . . . . . . . . . . . . . . . . . . . . . . . . 101
View History . . . . . . . . . . . . . . . . . . . . . . . . . . . . . . . . . . . . . . . . . . . . . . . . . . . . . . . . . . . . . . . 104
View Stores . . . . . . . . . . . . . . . . . . . . . . . . . . . . . . . . . . . . . . . . . . . . . . . . . . . . . . . . . . . . . . . 106
Edit the Order Quantity for a Vendor
You might want to negotiate with a vendor for more offers and discounts, and then finalize the order quantity. The negotiated order quantity might be different from the order quantity that is suggested by SAS Inventory Optimization Workbench.
To edit the order quantity for a vendor:
1 When you are viewing details about a promotion, select a product. The Vendors Summary section of the Vendors: Product Summary for Promotion view displays the list of all vendors that are available to supply the selected product .
For more information, see “View Details of a Promotion” on page 87.
2 Select a vendor and click the Total Final Order Quantity column.
3 Type a new value and press Enter.
After you edit the order quantity for a vendor, you must view the impact of the change on the affected facilities. For more information, see “View the Impact of an Edited Order” on page 97.
93

View Facilities
You can view a list of facilities to which the vendor is supplying the selected product for promotion. These facilities might be internal or external facilities, based on the type of the network.
You can also view the originally suggested order quantity for the facilities.
To view facilities:
1 When you are viewing details about a promotion, select a product. The Vendors Summary section of the Vendors: Product Summary for Promotion view displays a list of all vendors that are available to supply the selected product.
2 In the Vendors Summary section, select a vendor and click . The Order Details window appears and displays the list of all facilities to which the vendor is supplying the product.
The following table describes the fields in the Order Details window.
Table 16.1 Description of Fields in the Order Details Window
Field Button
Status The status of the facility. The icon indicates that the facility is in the Locked state. The icon indicates that the facility is in the Open state.
Facility ID The facility ID.
Facility Name The name of the facility.
Facility Type The type of the facility. The icon indicates that the facility is an external or customer-facing facility. The icon indicates
that the facility is an internal facility.
Final Order Quantity
The final order quantity.
Suggested Order Quantity
The order quantity that was originally suggested by SAS Inventory Optimization Workbench.
Lot Size The lot size. The lot size is the quantity of products that must be present in a lot or batch.
Min-Max Order Quantity
The minimum and maximum order quantity.
94 Chapter 16 / Managing Promotional Orders Suggested for Vendors

Edit the Order Quantity for a Promotional Order
You can edit the order quantity for a promotional order that is in the Open state. For example, you might want to increase the order quantity to satisfy a sudden rise in the promotional demand.
You can edit the promotional order quantity after you have edited the order quantity or when you are viewing details about the order.
n After you edit the order quantity for a vendor:
1 When you are viewing details about a promotion, select a product. The Vendors Summary section displays all vendors that are available to supply the selected product.
2 If you have not already done so, select a vendor and edit the total final order quantity for vendor. The View impact link appears.
3 Click View impact. The Impact Details window appears.
4 Select a facility and click the Final Order Quantity column.
Note: The facility that you are selecting must be in the Open state.
5 In the Final Order Quantity column, type a new value and press Enter.
n When you are viewing the details of a promotional order:
1 When you are viewing the details of a promotional order, click . The Edit Order window appears.
2 Enter the appropriate information.
The following table describes the fields of the Edit Order window.
Table 16.2 Description of Fields in the Edit Order Window
Field Description
Edit order quantity
Enter the order quantity for the selected facility.
If the order quantity is not a multiple of the lot size, the
icon is displayed beside the field. Ensure that the order quantity is a multiple of the lot size.
Suggested order quantity
The promotional order quantity that is suggested by SAS Inventory Optimization Workbench.
Edit the Order Quantity for a Promotional Order 95

Field Description
Select adjustment option
Select one of the following adjustment options:n Adjust order quantity for vendor: Select this option when
you want to adjust the order quantity for the vendor by modifying the order quantity for the selected facility. This option does not adjust the order quantity for other facilities belonging to the same vendor.
For example, change the order quantity for facility F1 from 550 to 650 for product XYZ to increase the vendor order quantity from 1150 to 1250.
Note: In order to use this option, the vendor must be in the Open state.
n Adjust order quantity for other facilities for vendor: Select this option when you want to adjust the order quantity for other facilities belonging to the same vendor by modifying the order quantity of the selected facility.
SAS Inventory Optimization Workbench performs the adjustment based on the proportion of the existing suggested order quantity for each facility.
This option does not adjust the order quantity for the vendor. However, it adjusts the order quantity of all facilities that belong to the same vendor.
For example, edit the order quantity for facility F1 from 550 to 650 to adjust the order quantity for facility F2 from 300 to 240 and for facility F3 from 200 to 160.
Note: In order to use this option, a promotional order for at least one of the remaining facilities belonging to the same vendor must be in the Open state.
Adjustment Option Details
Adjusted order quantity for vendor
The order quantity that you specified when you edited the order quantity for the selected facility.
Note: This field is displayed if you selected the Adjust order quantity for vendor option.
Current order quantity for vendor
The current order quantity for the vendor.
Note: This field is displayed if you selected the Adjust order quantity for vendor option.
Suggested order quantity for vendor
The order quantity that was suggested originally by SAS Inventory Optimization Workbench.
Note: This field is displayed if you selected the Adjust order quantity for vendor option.
Lock vendor Select this check box to lock the promotional order for this vendor so that the aggregated promotional order quantity for this vendor does not change.
Note: This field is displayed if you selected the Adjust order quantity for vendor option.
96 Chapter 16 / Managing Promotional Orders Suggested for Vendors

Field Description
Status The status of the promotional order. The icon indicates that the promotional order is in the Locked state. The icon indicates that the promotional order is in the Open state.
Note: This field is displayed if you selected the Adjust order quantity for other facilities for vendor option.
Facility ID The ID of the facility that belongs to the same vendor.
Note: This field is displayed if you selected the Adjust order quantity for other facilities for vendor option.
Facility Name The name of the facility that belongs to the same vendor.
Note: This field is displayed if you selected the Adjust order quantity for other facilities for vendor option.
Facility Type The type of the facility. The icon indicates that the facility is an external or customer-facing facility. The icon indicates
that the facility is an internal facility.
Note: This field is displayed if you selected the Adjust order quantity for other facilities for vendor option.
Final Order Quantity
The final order quantity for the facility.
Note: This field is displayed if you selected the Adjust order quantity for other facilities for vendor option.
Suggested Order Quantity
The promotional order quantity that was originally suggested by SAS Inventory Optimization Workbench.
Note: This field is displayed if you selected the Adjust order quantity for other facilities for vendor option.
Lot Size The lot size for the product. The lot size is the quantity of products that must be present in a lot or batch. If the final order quantity is not a multiple of the lot size, is displayed.
Note: This field is displayed if you selected the Adjust order quantity for other facilities for vendor option.
Min-Max Order Quantity
The minimum and maximum order quantities for the product. The minimum and maximum order quantities must be multiples of the lot size.
Note: This field is displayed if you selected the Adjust order quantity for other facilities for vendor option.
3 Click Save.
View the Impact of an Edited Order
You must view the impact of the changes that you made to the vendor order quantity, and then save the changes. After you change the vendor order
View the Impact of an Edited Order 97

quantity, you might want to make changes to the order quantity of the facilities that belong to that vendor.
For example, after you negotiate and obtain a better discount from the vendor, the final order quantity is increased from 650 to 1000. You might want to pass on this offer to facility F1 and facility F2 by changing their order quantities from 300 to 600 and from 250 to 400.
The following prerequisites apply:
n The vendor must be in the Open state.
n You must have edited the final order quantity for the vendor.
To view the impact of an edited order:
1 After you edit the final order quantity for the vendor, click View impact. The Impact Details window appears.
2 Review the impact of the change that you made for the selected vendor.
The following table describes the fields in the Impact Details window.
Table 16.3 Description of Fields in the Impact Details Window
Field Description
Status The status of the promotional order. The icon indicates that the promotional order is in the Locked state.
Facility ID The facility ID.
Facility Name The name of the facility for the promotional order.
Facility Type The type of the facility. The icon indicates that the facility is a customer-facing or external facility. The icon indicates
that the facility is an internal facility.
Final Order Quantity
The final order quantity for the promotional order for the selected product and facility, as suggested for the vendor.
Enter a new value after you finalize the order quantity with the vendor. The promotional order must be in the Open state in order for you to edit this order.
Suggested Order Quantity
The promotional order quantity that is suggested by SAS Inventory Optimization Workbench.
Lot Size The lot size of the product for the promotional order. The lot size is the quantity of products that must be present in a lot or batch.
Min-Max Order Quantity
The minimum and maximum order quantities for the promotional order. The minimum and maximum order quantities must be multiples of the lot size.
3 Click Save.
Changes are saved for the promotional order.
98 Chapter 16 / Managing Promotional Orders Suggested for Vendors

Manage Locks for Promotional Orders for a Vendor
About Locks of a Promotional Order for a Vendor
After you have negotiated with a vendor for better discounts and rates, and finalized the promotional order quantity, you can lock the promotional order. After you lock this promotional order, the final order quantity for the vendor cannot be changed.
If you obtain better rates and discounts from the vendor and you want to pass them on to subsequent promotional orders, unlock the promotion order. After you unlock the promotional order, the status of the promotional order changes to Open. Then you can edit the final order quantity, view the impact, and save or reset your changes.
Lock a Promotional Order for a Vendor
To lock a promotional order for a vendor:
1 When you are viewing the details of a promotion in the Vendors Summary section, click . The Order Details window appears.
For more information, see “View Details of a Promotion” on page 87.
Note: The promotional order for that vendor and the promotional order of at least one of the facilities for that vendor must be in the Open state in order to lock it.
2 Enter the appropriate information. The following table describes the fields in the Order Details window.
Table 16.4 Description of Fields and Buttons in the Order Details Window
Field or Button Description
Enter total final order quantity
The total final order quantity for the vendor. This field is available when the promotional order for at least one of the facilities for the vendor is in the Open state.
Current order quantity for vendor
The current order quantity for the vendor.
Suggested order quantity for vendor
The order quantity that was originally suggested by SAS Inventory Optimization Workbench.
Click this button to lock the promotional order for the selected facility. This button is available when the promotional order at the selected facility is in the Open state.
Manage Locks for Promotional Orders for a Vendor 99

Field or Button Description
Click this button to open the promotional order for the selected facility. This button is available when the promotional order at the selected facility is in the Locked state.
Status The status of the promotional order. The icon indicates that the promotional order for the facility is in the Locked state. The icon indicates that the promotional order for the facility is in the Open state.
Facility ID The ID of the facility that belongs to the same vendor.
Facility Name The name of the facility that belongs to the same vendor.
Facility Type The type of the facility. The icon indicates that the facility is an external or customer-facing facility. The icon indicates
that the facility is an internal facility.
Final Order Quantity
The final order quantity for the facility.
Suggested Order Quantity
The promotional order quantity that was originally suggested by SAS Inventory Optimization Workbench.
Lot Size The lot size for the product. The lot size is the quantity of products that must be present in a lot or batch. If the final order quantity is not a multiple of the lot size, a warning icon is displayed.
Min-Max Order Quantity
The minimum and maximum order quantity for the product. The minimum and maximum order quantity must be a multiple of the lot size.
3 Click Save and Lock.
The status of the promotional order for that vendor changes from Open to Locked.
Unlock a Promotional Order for a Vendor
To unlock a promotional order for a vendor:
n When you are viewing details about a promotion in the Vendors Summary section, click .
For more information, see “View Details of a Promotion” on page 87.
Note: The promotional order for the vendor must be in the Locked state in order to unlock it.
The status of the promotional order for this vendor changes from Locked to Open.
100 Chapter 16 / Managing Promotional Orders Suggested for Vendors

Cancel a Promotional Order for a Vendor
You can cancel a promotional order that was suggested for a vendor for a product and facility combination. When you cancel a promotional order that was suggested for a vendor, you can choose one of the following options:
n retain the order quantity for the vendor and adjust the order quantity for other facilities that belong to that vendor
n adjust the order quantity for the vendor
The promotional order must be in the Open state.
To cancel a promotional order:
1 When you are viewing details about a promotional order for a product in the Vendors: Order Details for Product for Promotion view, select a promotional order and click . The Cancel Order window appears.
2 Enter the appropriate information.
The following table describes the buttons and fields of the Cancel Order window.
Cancel a Promotional Order for a Vendor 101
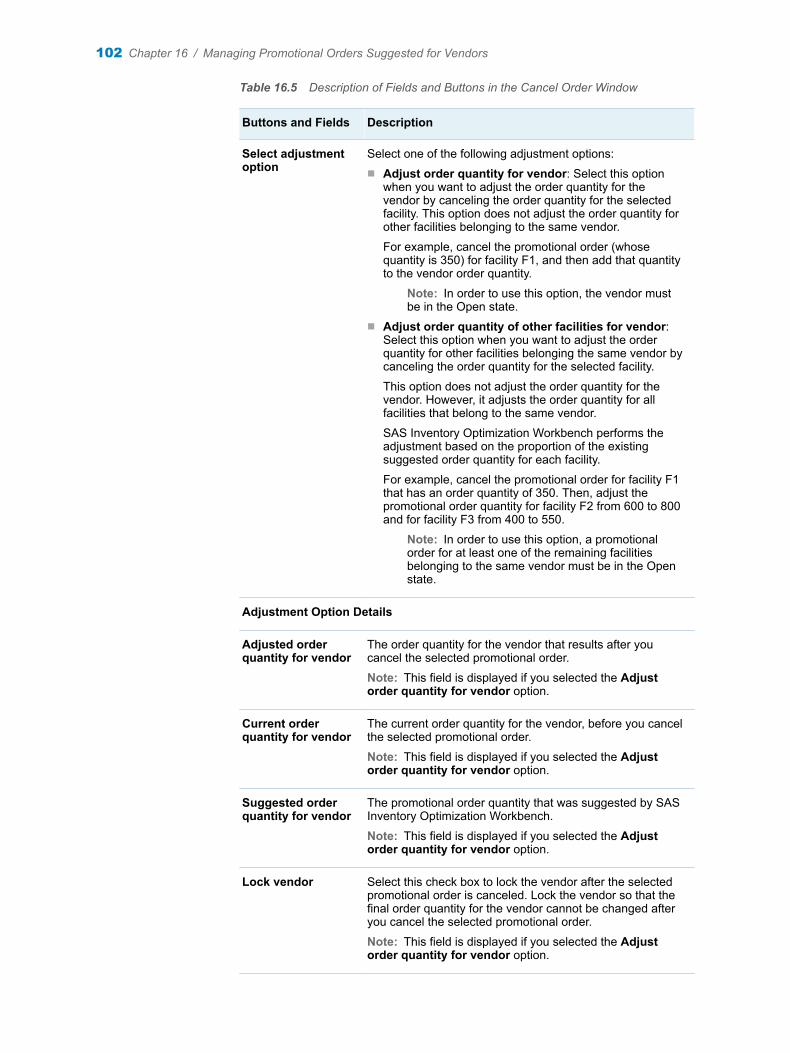
Table 16.5 Description of Fields and Buttons in the Cancel Order Window
Buttons and Fields Description
Select adjustment option
Select one of the following adjustment options:n Adjust order quantity for vendor: Select this option
when you want to adjust the order quantity for the vendor by canceling the order quantity for the selected facility. This option does not adjust the order quantity for other facilities belonging to the same vendor.
For example, cancel the promotional order (whose quantity is 350) for facility F1, and then add that quantity to the vendor order quantity.
Note: In order to use this option, the vendor must be in the Open state.
n Adjust order quantity of other facilities for vendor: Select this option when you want to adjust the order quantity for other facilities belonging the same vendor by canceling the order quantity for the selected facility.
This option does not adjust the order quantity for the vendor. However, it adjusts the order quantity for all facilities that belong to the same vendor.
SAS Inventory Optimization Workbench performs the adjustment based on the proportion of the existing suggested order quantity for each facility.
For example, cancel the promotional order for facility F1 that has an order quantity of 350. Then, adjust the promotional order quantity for facility F2 from 600 to 800 and for facility F3 from 400 to 550.
Note: In order to use this option, a promotional order for at least one of the remaining facilities belonging to the same vendor must be in the Open state.
Adjustment Option Details
Adjusted order quantity for vendor
The order quantity for the vendor that results after you cancel the selected promotional order.
Note: This field is displayed if you selected the Adjust order quantity for vendor option.
Current order quantity for vendor
The current order quantity for the vendor, before you cancel the selected promotional order.
Note: This field is displayed if you selected the Adjust order quantity for vendor option.
Suggested order quantity for vendor
The promotional order quantity that was suggested by SAS Inventory Optimization Workbench.
Note: This field is displayed if you selected the Adjust order quantity for vendor option.
Lock vendor Select this check box to lock the vendor after the selected promotional order is canceled. Lock the vendor so that the final order quantity for the vendor cannot be changed after you cancel the selected promotional order.
Note: This field is displayed if you selected the Adjust order quantity for vendor option.
102 Chapter 16 / Managing Promotional Orders Suggested for Vendors

Buttons and Fields Description
Click this button to lock the selected promotional order in the Cancel Order window. The status of the promotional order changes from Open to Locked. You can lock the promotional order after you adjust the final order quantity. This button is not available if the promotional order is already in the Locked state.
Note: This button is displayed if you selected the Adjust order quantity for other facilities for vendor option.
Click this button to unlock the selected promotional order in the Cancel Order window. The status of the promotional order changes from Locked to Open. You can unlock the promotional order to adjust the final order quantity. This button is not available if the promotional order is already in the Open state.
Note: This button is displayed if you selected the Adjust order quantity for other facilities for vendor option.
Status The status of the promotional order. The icon indicates that the promotional order is in the Locked state. The icon
indicates that the promotional order is in the Open state.
Note: This field is displayed if you selected the Adjust order quantity for other facilities for vendor option.
Facility ID The ID of the facility that belongs to the same vendor.
Note: This field is displayed if you selected the Adjust order quantity for other facilities for vendor option.
Facility Name The name of the facility that belongs to the same vendor.
Note: This field is displayed if you selected the Adjust order quantity for other facilities for vendor option.
Facility Type The type of the facility. The icon indicates that the facility is an external or customer-facing facility. The icon
indicates that the facility is an internal facility.
Note: This field is displayed if you selected the Adjust order quantity for other facilities for vendor option.
Final Order Quantity
The final order quantity for the facility after automatically adjusting the order quantity by canceling the selected promotional order. Enter a new value, and then press Enter.
Note: This field is displayed if you selected the Adjust order quantity for other facilities for vendor option.
Suggested Order Quantity
The promotional order quantity that was originally suggested by SAS Inventory Optimization Workbench.
Note: This field is displayed if you selected the Adjust order quantity for other facilities for vendor option.
Cancel a Promotional Order for a Vendor 103

Buttons and Fields Description
Lot Size The lot size for the product. The lot size is the quantity of products that must be present in a lot or batch. If the final order quantity is not a multiple of the lot size, a warning icon is displayed.
Note: This field is displayed if you selected the Adjust order quantity for other facilities for vendor option.
Min-Max Order Quantity
The minimum and maximum order quantities for the product. The minimum and maximum order quantities must be a multiple of the lot size.
Note: This field is displayed if you selected the Adjust order quantity for other facilities for vendor option.
3 Click Save.
View History
By viewing the history of a promotional order, you can take appropriate action on it. You can view the history of the promotional order that is suggested for a vendor and of the promotional order that is suggested at a facility.
SAS Inventory Optimization Workbench displays information about the promotional order for each run of the inventory optimization process. For example, suppose the periodicity of the inventory optimization process is weekly, the promotion planning period is eight weeks, and you are in the eighth week of planning. You can view the order history for the last seven inventory optimization runs.
To view the promotional order:
n When you are viewing details about the promotional orders for a product in the Vendors: Order Details for Product for Promotion view, click . The History Details window appears and displays detailed historical information about the promotional order.
For more information about viewing the promotional order details of a product suggested for a vendor, see “View Details about Promotional Orders for a Product” on page 89.
For more information about viewing the promotional order details for a product at a customer-facing facility, see “View Promotional Order Details of a Product at a Customer-Facing Facility” on page 112
The following table describes the fields and buttons in the History Details table.
Table 16.6 Description of Fields in the History Details Window
Field and Button Description
Click this button to export the historical information to Microsoft Excel.
104 Chapter 16 / Managing Promotional Orders Suggested for Vendors

Field and Button Description
Status The status of the promotional order. The icon indicates that the promotional order is in the Locked state. The icon indicates that the promotional order is in the Open state.
Order Generated The date on which the order was generated by SAS Inventory Optimization Workbench.
Facility ID The ID of the facility that belongs to the same vendor.
Facility Name The name of the facility that belongs to the same vendor.
Facility Type The type of the facility. The icon indicates that the facility is an
external or customer-facing facility. The icon indicates that the facility is an internal facility.
Vendor ID The vendor ID for whom the order is suggested.
Note: This column is available only when you are viewing the history of a promotional order that is suggested for a vendor.
Source ID The source ID from whom the promotional order is to be fulfilled.
Note: This column is available only when you are viewing the history for a promotional order that is suggested at a customer-facing facility in a two-echelon network.
Action required The action required for the promotional order. For example, you might need to finalize or review the order.
Order Edited Displays the icon if the promotional order has been edited.
Final Order Quantity
The final quantity for the promotional order.
Suggested Order Quantity
The promotional order quantity that was originally suggested by SAS Inventory Optimization Workbench.
Start Date of the Finalization Period
The start date of the finalization period. You must promote the promotional order during the finalization period. When you promote the order, SAS Inventory Optimization Workbench places the order to the assigned vendors.
Start Date of Receipt Due Period
The start date of the receipts due period. The receipts due period is the period during which the products will be received at the facility.
Lot Size The lot size for the product. The lot size is the quantity of products that must be present in a lot or batch. If the final order quantity is not a multiple of the lot size, a warning icon is displayed.
Min-Max Order Quantity
The minimum and maximum order quantities for the product. The minimum and maximum order quantities must be multiples of the lot size.
View History 105

View Stores
You can view the list of external or customer-facing facilities that have placed promotional orders to the internal facility in a two-echelon network. You can view this information in the Vendors subcategory.
When you are viewing the promotional order details of a product in the Vendors: Order Details for Product for Promotion view, click . The View Stores window appears and displays a list of all external facilities and their promotional orders.
106 Chapter 16 / Managing Promotional Orders Suggested for Vendors

17Monitoring Promotional Orders at Customer-Facing Facilities
Viewing All Promotions at Customer-Facing Facilities . . . . . . . . . . . . . . . . . . . . . 107About Viewing All Promotions . . . . . . . . . . . . . . . . . . . . . . . . . . . . . . . . . . . . . . . . . . . . 107The Promotional Orders Workspace for an Analysis of All Promotions . . . . . . . 108View All Promotions . . . . . . . . . . . . . . . . . . . . . . . . . . . . . . . . . . . . . . . . . . . . . . . . . . . . . 109
Viewing Details about a Promotion at a Customer-Facing Facility . . . . . . . . . . 109Overview . . . . . . . . . . . . . . . . . . . . . . . . . . . . . . . . . . . . . . . . . . . . . . . . . . . . . . . . . . . . . . . 109The Promotional Orders Workspace for an Analysis of a
Promotion at a Customer-Facing Facility . . . . . . . . . . . . . . . . . . . . . . . . . . . . . . . . 109View Details of a Promotion at a Customer-Facing Facility . . . . . . . . . . . . . . . . . . 110
Viewing Details about Promotional Orders for a Product at Customer-Facing Facilities . . . . . . . . . . . . . . . . . . . . . . . . . . . . . . . . . . . . . . . . . . . . . . . . 111
Overview . . . . . . . . . . . . . . . . . . . . . . . . . . . . . . . . . . . . . . . . . . . . . . . . . . . . . . . . . . . . . . . . 111The Promotional Orders Workspace for an Analysis of a
Promotion of a Product . . . . . . . . . . . . . . . . . . . . . . . . . . . . . . . . . . . . . . . . . . . . . . . . . 111View Promotional Order Details of a Product at a Customer-Facing Facility . . 112
Edit a Promotional Order at a Customer-Facing Facility . . . . . . . . . . . . . . . . . . . . 112
Viewing All Promotions at Customer-Facing Facilities
About Viewing All Promotions
SAS Inventory Optimization Workbench enables you to view all promotions that are associated with you. You can also view a snapshot of a promotion. The information that you obtain from this view helps you understand the health of the promotion.
Double-click a promotion to view the products that are involved in that promotion.
107

The Promotional Orders Workspace for an Analysis of All Promotions
Data Table
The data table displays information about all promotions that belong to you. The following table describes the fields of the data table.
Table 17.1 Description of Fields in the Data Table
Field Description
Promotion ID The identification number of the promotion. The identification number can be alphanumeric and can include special characters. For example, NYP2014
Promotion Name The name of the promotion.
Promotion Start Date
The start date of the promotion.
Promotion End Date
The end date of the promotion.
Number of Products
The number of products that are involved in the promotion.
Total Orders The total number of promotional orders that are suggested for the customer-facing facilities.
Orders Portfolio Section
The Orders Portfolio section displays the following information about the selected promotion that contains promotional orders for customer-facing facilities:
n number of promotional orders that need to be reviewed in the current period
n number of promotional orders that need to be finalized in the current period
The Orders Portfolio section also displays the number of promotional orders that are in a particular status, such as Open, Locked, Promoted, or Canceled.
SAS Inventory Optimization Workbench also displays the number of orders for which an action is not required. An action on a promotional order is not required because the milestone of reviewing or finalizing a promotional order has not yet arrived. In such a case, products that are associated with these orders are not displayed in the Customer-Facing Facilities: Product Summary for Promotion view.
Properties Pane
The Properties pane displays the following information for the selected promotion:
n name and ID of the promotion
108 Chapter 17 / Monitoring Promotional Orders at Customer-Facing Facilities

n number of products that are involved in the promotion
Comments Manager Pane
For more information about the Comments Manager pane, see “Add a Comment By Using the Comments Manager Pane” on page 18.
View All Promotions
By simultaneously viewing all promotions with suggested orders at customer-facing facilities, you can determine which promotion requires your immediate attention.
To view all promotions:
n In the Orders workspace, expand the Promotional Orders category and click Customer-Facing Facilities.
SAS Inventory Optimization Workbench displays all promotions with suggested promotional orders at customer-facing facilities.
Viewing Details about a Promotion at a Customer-Facing Facility
Overview
SAS Inventory Optimization Workbench enables you to view information about all products that are involved in a promotion. You can also view detailed information about any promotional orders for each product.
The Promotional Orders Workspace for an Analysis of a Promotion at a Customer-Facing Facility
Product Summary Table
The Product Summary table displays detailed information about each product that is involved in the selected promotion. The following table describes the fields of the Product Summary table.
Table 17.2 Description of Fields in the Product Summary Table
Field Description
Product ID The ID of the product that is involved in the promotion.
Product Name The name of the product.
Number of Facilities
The number of facilities at which the product is present.
Viewing Details about a Promotion at a Customer-Facing Facility 109

Field Description
Action Required The action that is required to be performed on the promotional orders for the product. For example, you might need to review the order or finalize the order.
Total Final Order Quantity
The total final order quantity of the products in the promotional order. The total final order quantity might be different from the suggested order quantity if you edited that quantity.
Total Suggested Order Quantity
The total order quantity that is suggested by SAS Inventory Optimization Workbench for the products in the promotional order.
Start Date of Finalization Period
The start date of the finalization period. You must promote the promotional order during the finalization period. By promoting the promotional order for the product, SAS Inventory Optimization Workbench places the order to the assigned vendors.
Start Date of Receipts Due Period
The start date of the receipts due period. The receipts due period is the period during which the products will be delivered to the facility. After the products are delivered to the facility, the buyer can allocate or distribute them to the appropriate customer-facing facilities.
Properties Pane
The Properties pane displays the following information:
n name and ID of the product
n number of vendors for the selected product
n action required for the promotional order
Comments Manager Pane
For more information about the Comments Manager pane, see “Add a Comment By Using the Comments Manager Pane” on page 18.
View Details of a Promotion at a Customer-Facing Facility
You can view all products that are involved in a promotion, information about a promotional order for each product, and the vendors that are available for each product.
To view details of a promotion:
1 In the Orders workspace, expand Promotional Orders, and click Customer-Facing Facilities. SAS Inventory Optimization Workbench displays all promotions that have promotional orders at customer-facing facilities.
2 Double-click a promotion.
The view with the title Customer-facing Facilities: Product Summary for Promotion Promotion ID Promotion name displays the list of all products and their promotional order details.
110 Chapter 17 / Monitoring Promotional Orders at Customer-Facing Facilities

Viewing Details about Promotional Orders for a Product at Customer-Facing Facilities
Overview
You can view the promotional orders for a product that are suggested at a customer-facing facility. You can edit the promotional orders. You can also review and finalize a promotional order.
The Promotional Orders Workspace for an Analysis of a Promotion of a Product
Order Details Table
The Order Details table displays the promotional orders of the selected product for customer-facing facilities. Each promotional order that is suggested for a customer-facing facility is the unique combination of promotion, product, facility, vendor, action required, and start date of finalization period.
The following table describes the fields in the Order Details table.
Table 17.3 Description of Fields in the Order Details Table
Field Description
Status The status of the promotional order. The icon indicates that the promotional order is locked. The icon indicates that the promotional order is unlocked.
Facility ID The facility ID.
Facility Name The name of the facility.
Action Required The action required to be performed on the promotional order. For example, you might need to review or finalize the promotional order.
Source ID The ID of the source from which the promotional order will be fulfilled
Final Order Quantity
The final order quantity that is placed to the vendor for the promotional order.
Suggested Order Quantity
The order quantity that is suggested by SAS Inventory Optimization Workbench for the promotional order.
Start Date of Finalization Period
The start date of the finalization period. You must promote the order during the finalization period.
Viewing Details about Promotional Orders for a Product at Customer-Facing Facilities111
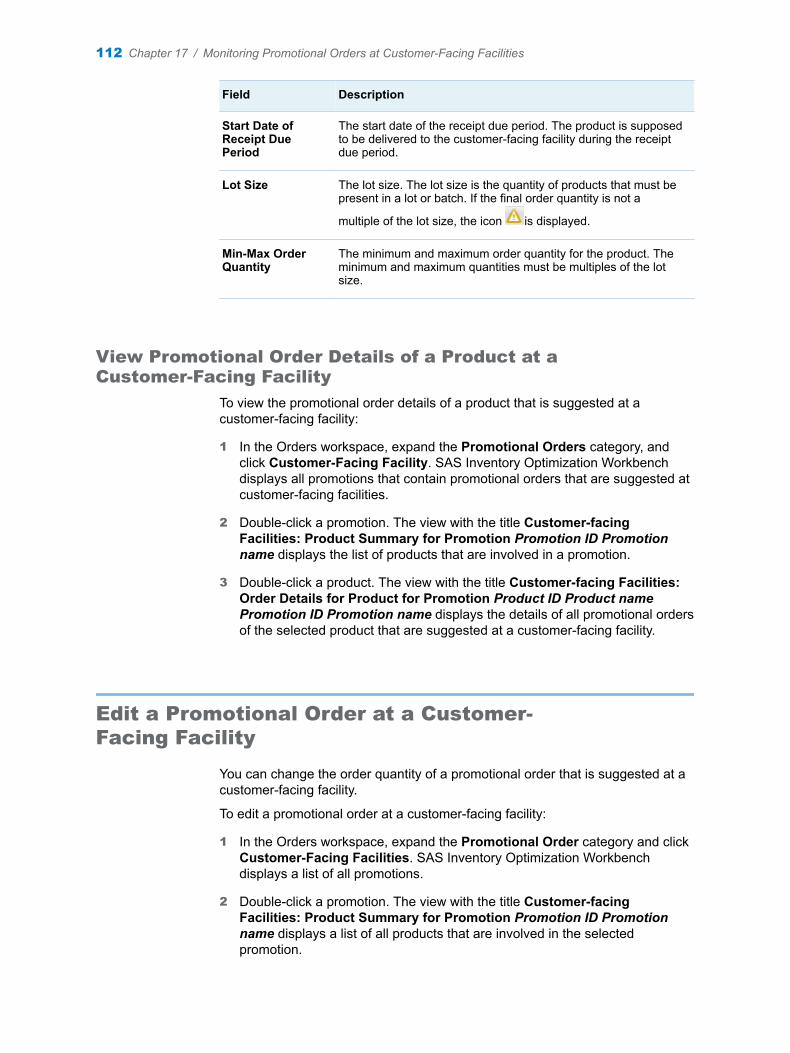
Field Description
Start Date of Receipt Due Period
The start date of the receipt due period. The product is supposed to be delivered to the customer-facing facility during the receipt due period.
Lot Size The lot size. The lot size is the quantity of products that must be present in a lot or batch. If the final order quantity is not a
multiple of the lot size, the icon is displayed.
Min-Max Order Quantity
The minimum and maximum order quantity for the product. The minimum and maximum quantities must be multiples of the lot size.
View Promotional Order Details of a Product at a Customer-Facing Facility
To view the promotional order details of a product that is suggested at a customer-facing facility:
1 In the Orders workspace, expand the Promotional Orders category, and click Customer-Facing Facility. SAS Inventory Optimization Workbench displays all promotions that contain promotional orders that are suggested at customer-facing facilities.
2 Double-click a promotion. The view with the title Customer-facing Facilities: Product Summary for Promotion Promotion ID Promotion name displays the list of products that are involved in a promotion.
3 Double-click a product. The view with the title Customer-facing Facilities: Order Details for Product for Promotion Product ID Product name Promotion ID Promotion name displays the details of all promotional orders of the selected product that are suggested at a customer-facing facility.
Edit a Promotional Order at a Customer-Facing Facility
You can change the order quantity of a promotional order that is suggested at a customer-facing facility.
To edit a promotional order at a customer-facing facility:
1 In the Orders workspace, expand the Promotional Order category and click Customer-Facing Facilities. SAS Inventory Optimization Workbench displays a list of all promotions.
2 Double-click a promotion. The view with the title Customer-facing Facilities: Product Summary for Promotion Promotion ID Promotion name displays a list of all products that are involved in the selected promotion.
112 Chapter 17 / Monitoring Promotional Orders at Customer-Facing Facilities

3 Double-click a product. The view with the title Customer-facing Facilities: Order Details for Product for Promotion Product ID Product name Promotion ID Promotion name displays a list of all promotional orders that are suggested for the product at the customer-facing facility.
4 Select a promotional order, and click . The Edit Order window appears.
5 In the Enter order quantity field, enter the new value.
6 Click Save.
Edit a Promotional Order at a Customer-Facing Facility 113

114 Chapter 17 / Monitoring Promotional Orders at Customer-Facing Facilities
18Managing Replenishment Locks for Promotional Orders
Overview of Replenishment Locks . . . . . . . . . . . . . . . . . . . . . . . . . . . . . . . . . . . . . . . . . 115
Lock a Promotional Order . . . . . . . . . . . . . . . . . . . . . . . . . . . . . . . . . . . . . . . . . . . . . . . . . 115
Unlock a Promotional Order . . . . . . . . . . . . . . . . . . . . . . . . . . . . . . . . . . . . . . . . . . . . . . . 117
Overview of Replenishment Locks
You can lock a promotional order in order to prepare it to be submitted to the external enterprise resource planning (ERP) system.
Locking a promotional order is useful when you have finalized the order quantity and you do not want to change it. When you lock a promotional order, it cannot be edited. When a promotional order is locked, its status changes from Open to Locked. When you promote a locked promotional order, it is submitted to the ERP system.
You must unlock a promotional order that is in the Locked state in order to edit it. When a promotional order is unlocked, its status changes from Locked to Open.
Lock a Promotional Order
You can lock the promotional orders from different views in the Promotional Orders category.
To lock all promotional orders for a product that are suggested for vendors:
1 In the Orders workspace, expand the Promotional Orders category and click Vendors. SAS Inventory Optimization Workbench displays all promotions that have promotional orders for vendors.
2 Double-click a promotion. The view with the title Vendors: Product Summary for Promotion Promotion ID Promotion name displays a list of all products with promotional orders that are suggested for vendors.
3 Select a product and click . All promotional orders for the selected product that are in the Open state are locked.
115

To lock a single promotional order for a product that is suggested for a vendor:
1 In the Orders workspace, expand the Promotional Orders category and click Vendors. SAS Inventory Optimization Workbench displays all promotions that have promotional orders for vendors.
2 Double-click a promotion. The view with the title Vendors: Product Summary for Promotion Promotion ID Promotion name displays a list of all products that are in the promotion.
3 Double-click a product. The view with the title Vendors: Order Details for Product for Promotion Product ID Product name Promotion ID Promotion name displays a list of all promotional orders for the selected product.
4 Select a promotional order that is in the Open state and click . The selected promotional order is locked.
To lock all promotional orders for a product that are suggested at a customer-facing facility:
1 In the Orders workspace, expand the Promotional Orders category and click Customer-Facing Facility. SAS Inventory Optimization Workbench displays a list of all promotions that are suggested at customer-facing facilities.
2 Double-click a promotion. The view with the title Customer-facing Facilities: Product Summary for Promotion Promotion ID Promotion name displays a list of all products with promotional orders that are suggested at customer-facing facilities.
3 Select a product and click . All promotional orders that are in the Open state for the selected product are locked.
To lock a single promotional order for a product that is suggested at a customer-facing facility:
1 In the Orders workspace, expand the Promotional Orders category and click Customer-Facing Facilities. SAS Inventory Optimization Workbench displays a list promotions that are suggested at customer-facing facilities.
2 Double-click a promotion. The view with the title Customer-facing Facilities: Product Summary for Promotion Promotion ID Promotion name displays a list of all products that are in the promotion.
3 Double-click a product. The view with the title Customer-facing Facilities: Order Details for Product for Promotion Product ID Product name Promotion ID Promotion name displays a list of all promotional orders that are suggested for the product and customer-facing facility.
4 Select a promotional order that is in the Open state, and click . The selected promotional order is locked.
116 Chapter 18 / Managing Replenishment Locks for Promotional Orders

Unlock a Promotional Order
You can unlock the promotional orders from different views in the Promotional Orders category.
To unlock all promotional orders for a product that are suggested for vendors:
1 In the Orders workspace, expand the Promotional Orders category and click Vendors. SAS Inventory Optimization Workbench displays all promotions with promotional orders that are suggested for vendors.
2 Double-click a promotion. The view with the title Vendors: Product Summary for Promotion Promotion ID Promotion name displays a list of all products with promotional orders that are suggested for vendors.
3 Select a product, and click . All promotional orders for the selected product that are in the Locked state are unlocked.
To unlock a single promotional order of a product that is suggested for a vendor:
1 In the Orders workspace, expand the Promotional Orders category and click Vendors. SAS Inventory Optimization Workbench displays all promotions with promotional orders that are suggested for vendors.
2 Double-click a promotion. The view with the title Vendors: Product Summary for Promotion Promotion ID Promotion name displays a list of all products that are in the promotion.
3 Double-click a product. The view with the title Vendors: Order Details for Product for Promotion Product ID Product name Promotion ID Promotion name displays a list of all promotional orders of the selected product.
4 Select a promotional order that is in the Locked state and click . The selected promotional order is unlocked.
To unlock all promotional orders of a product that are suggested at a customer-facing facility:
1 In the Orders workspace, expand the Promotional Orders category and click Customer-Facing Facility. SAS Inventory Optimization Workbench displays a list of all promotions that are suggested at customer-facing facilities.
2 Double-click a promotion. The view with the title Customer-facing Facilities: Product Summary for Promotion Promotion ID and Promotion name displays a list of all products with promotional orders that are suggested at customer-facing facilities.
3 Select a product and click . All promotional orders that are in the Locked state for the selected product are unlocked.
To unlock a single promotional order for a product that is suggested at a customer-facing facility:
Unlock a Promotional Order 117

1 In the Orders workspace, expand the Promotional Orders category and click Customer-Facing Facilities. SAS Inventory Optimization Workbench displays a list promotions that are suggested at customer-facing facilities.
2 Double-click a promotion. The view with the title Customer-facing Facilities: Product Summary for Promotion Promotion ID Promotion name displays a list of all products that are in the promotion.
3 Double-click a product. The view with the title Customer-facing Facilities: Order Details for Product for Promotion Product ID Product name Promotion ID Promotion name displays a list of all promotional orders that are suggested for that product and customer-facing facility.
4 Select a promotional order that is in the Locked state, and click . The selected promotional order is unlocked.
118 Chapter 18 / Managing Replenishment Locks for Promotional Orders

19Promoting Promotional Orders
Overview of Promoting Promotional Orders . . . . . . . . . . . . . . . . . . . . . . . . . . . . . . . . 119
Promote Promotional Order for Vendors . . . . . . . . . . . . . . . . . . . . . . . . . . . . . . . . . . . 119
Promote Promotional Orders at a Customer-Facing Facility . . . . . . . . . . . . . . . . 120
Overview of Promoting Promotional Orders
Promote a promotional order to submit that order to the external enterprise resource planning (ERP) system that your organization uses. When you promote these orders, the promotional order details are copied to the database tables.
You can promote promotional orders that are suggested for a vendor or for a customer-facing facility. The promotional orders that are suggested for the vendors are copied to the PROMOTED_PROMO_VENDOR_ORDER_DTLS table. The promotional orders that are suggested for the customer-facing facilities are copied to the PROMOTED_PROMO_STORE_ALLOC_DTLS table. The administrator can copy data from these tables and load it into the required tables in the ERP system.
Promote Promotional Order for Vendors
You can promote all promotional orders that are suggested for vendors, or you can promote a single promotional order.
n To promote multiple promotional orders:
1 When you are viewing the details of a promotion in the view with the title Vendors: Product Summary for Promotion Promotion ID Promotion name , select a product and click . A confirmation message appears.
For more information, see “View Details of a Promotion” on page 87.
2 Click Yes.
All promotional orders that are in the Locked state for the selected product are promoted.
n To promote a single promotion order:
119

1 When you are viewing the promotional order details of a product in the view with the title Vendors: Order Details for Product for Promotion Product ID Product name Promotion ID Promotion name, select a promotional order and click . A confirmation message appears.
For more information, see “View Details about Promotional Orders for a Product” on page 89.
Note: The selected promotional order must be in the Locked state.
2 Click Yes.
The selected promotional order is promoted.
Promote Promotional Orders at a Customer-Facing Facility
You can promote multiple promotional orders that are suggested at a customer-facing facility, or you can promote a single promotional order.
n To promote multiple promotional orders:
1 When you are viewing the details of a promotion in the view with the title Customer-facing Facilities: Product Summary for Promotion Promotion ID Promotion name, select a product and click . A confirmation message appears.
2 Click Yes.
All promotional orders that are in the Locked state for the selected product are promoted.
n To promote a single promotion order
1 When you are viewing the promotional order details for a product in the view with the title Customer-facing Facilities: Order Details for Product for Promotion Product ID Product name Promotion ID Promotion name, select a promotional order and click . A confirmation message appears.
Note: The selected promotional order must be in the Locked state.
2 Click Yes.
The selected promotional order is promoted.
120 Chapter 19 / Promoting Promotional Orders

Part 5
Analyzing and Understanding Scenarios
Chapter 20Introduction to Scenario Analysis . . . . . . . . . . . . . . . . . . . . . . . . . . . . . . . . . 123
Chapter 21Understanding the Scenario Analysis Category . . . . . . . . . . . . . . . . . . . . . 131
Chapter 22Performing an Internal Facility Scenario Analysis . . . . . . . . . . . . . . . . . . . 137
Chapter 23Performing a Customer-Facing Facility Scenario Analysis . . . . . . . . . . . . 145
Chapter 24Performing an Ad Hoc Scenario Analysis . . . . . . . . . . . . . . . . . . . . . . . . . . . 155
Chapter 25Performing an Optimization Override Scenario Analysis . . . . . . . . . . . . . 169
Chapter 26Working with a Scenario . . . . . . . . . . . . . . . . . . . . . . . . . . . . . . . . . . . . . . . . . 175
121

122

20Introduction to Scenario Analysis
Overview of Scenario Analysis . . . . . . . . . . . . . . . . . . . . . . . . . . . . . . . . . . . . . . . . . . . . 123
Scenario Statuses . . . . . . . . . . . . . . . . . . . . . . . . . . . . . . . . . . . . . . . . . . . . . . . . . . . . . . . . . 124About Scenario Statuses . . . . . . . . . . . . . . . . . . . . . . . . . . . . . . . . . . . . . . . . . . . . . . . . . 124Tasks Permitted in Each Scenario Status . . . . . . . . . . . . . . . . . . . . . . . . . . . . . . . . . 124Scenario Statuses That Display the Expired Icon . . . . . . . . . . . . . . . . . . . . . . . . . . 127
Scenario Analysis Workflow . . . . . . . . . . . . . . . . . . . . . . . . . . . . . . . . . . . . . . . . . . . . . . . 127
Overview of Scenario Analysis
With scenario analysis, you can study the impact of a change in metrics such as service level, lead time, or product cost on the overall network cost. You can find the optimum service level at which to operate within the budgeted inventory costs. You can also simulate the impact of the change on the network cost for varying percentages of the service level.
SAS Inventory Optimization Workbench supports the following types of scenarios for analysis:
n The customer-facing facility scenario enables you to ascertain the optimum service level for a group of products in order to meet the specified budget constraints. This scenario analysis is also helpful when the inventory cost of your network is within the budget, but the service levels of products are suboptimal at the customer-facing facilities. With this scenario analysis, you can set the optimum service level that minimizes the stockouts and cost penalties that are associated with the customer-facing facilities.
n The internal facility scenario is aimed at the primary distribution network. The warehouses or facilities that supply products to customer-facing warehouses and depots need to maintain the downstream service level. This service level in turn depends on the downstream service level of the customer-facing facilities. This analysis enables you to ascertain service levels so as to meet the service level of downstream customer-facing depots or facilities.
n The ad hoc scenario is a free-form analysis that simulates the impact of input parameters like service level, lead time, and product cost on the overall network cost. Using this scenario, you can compare metrics with different input parameters. You can also compare scenarios based on different metrics.
n The optimization override scenario enables you to override the optimization values that SAS Inventory Optimization Workbench has suggested. You can
123

override the optimized values when they are not meeting your business requirements.
Scenario Statuses
About Scenario Statuses
Each scenario in SAS Inventory Optimization Workbench is in a certain a status. The status helps you understand and maintain a consistent workflow in order to analyze and foresee various business assumptions. Whenever you perform a task on the scenario, the status of the scenario changes. For example, when you create a scenario, the status of the scenario changes to Created. When you run a scenario, the status of the scenario changes to Executing.
Tasks Permitted in Each Scenario Status
The following table explains the scenario statuses and the tasks that are permitted when a scenario is in a particular status.
Table 20.1 Description of Different Statuses of a Scenario
Status Description Tasks Permitted
Created The scenario has been created and is ready for the optimization process to be run.
You can perform the following tasks on the scenario:n editn runn copyn delete
Executing The scenario is processing and providing the optimization or recalculation results.
You can copy the scenario.
Executed The scenario has executed and generated the optimization or recalculation results without any error.
You can perform the following tasks on the scenario:n editn runn promote the metric valuesn copyn deleten view results
124 Chapter 20 / Introduction to Scenario Analysis

Status Description Tasks Permitted
Executed (expired) The scenario has executed and generated the results in the last run of the optimization process. Because the most recent data might not have been available, the results of the scenario might be obsolete. You can rerun the scenario in order to view the latest optimization results.
You can perform the following tasks on the scenario:n editn runn copyn deleten view results
Executed with errors The scenario has executed and generated optimization results with one or more errors. The cause of the error differs based on the scenario type:n For the internal facility scenario
and the customer-facing facility scenario, the recalculation process might have failed for any of the selected networks. The results view of the scenario displays only optimized values. You can promote the optimized values.
n For the ad hoc scenario, the optimization process might have failed for at least one of the sets. Optimized values for the sets that were processed without any errors are displayed. You can promote the optimized values of the sets that were processed without errors.
You can perform the following tasks on the scenario:n editn runn promote the metric valuesn copyn deleten view results
Executed with errors (expired) The scenario has executed and generated optimization results with one or more errors in the last run of the optimization process. Because the most recent data might not have been available, the results of this scenario are obsolete. You can rerun the scenario in order to view the latest optimization results.
You can perform the following tasks on the scenario:n editn runn copyn deleten view results
Scenario Statuses 125

Status Description Tasks Permitted
Failed The scenario processing failed. The scenario encountered errors due to failure of the optimization process or due to data-related problems. The exact cause of the error differs based on the scenario type:n For the customer-facing facility
scenario, the calculation of current values and optimized values for all the selected facility and product pairs might have failed.
n For the internal facility scenario, the calculation of current values for any of the selected networks might have failed.
n For the ad hoc scenario, the calculation of current values or of optimized values for all the sets might have failed.
Note: You cannot promote the scenario results with this status, and the results view shows no output.
You can perform the following tasks on the scenario:n editn copyn delete
Deleting The scenario is being deleted from SAS Inventory Optimization Workbench.
You cannot perform any task on a scenario that is in this status.
Failed to delete An error occurred while the scenario was being deleted.
You can delete the scenario.
Promoting The scenario is being promoted. You can create a copy of the scenario.
Promoted The scenario has been promoted. The target service level or the values of the promoted set of the ad hoc scenario have been saved in the transactional database in order to use them in the next run of the optimization process.
You can perform the following tasks on the scenario:n copyn deleten view results
Promoted (expired) The target service level or the values of the set of the ad hoc scenario were promoted in the last run of the optimization process. More current data might be available. You must rerun the scenario in order to obtain the latest optimization results. If you are satisfied with the optimization results, you can promote the scenario.
You can perform the following tasks on the scenario:n runn copyn deleten view results
126 Chapter 20 / Introduction to Scenario Analysis

Status Description Tasks Permitted
Failed to promote An error occurred while the scenario was being promoted.
You can perform the following tasks on the scenario:n copyn deleten view results
Failed to promote (expired) An error occurred when the scenario was being promoted in the last run of the optimization process. More current data might be available. You must run the scenario again in order to obtain the latest optimization results.
You can perform the following tasks on the scenario:n runn copyn deleten view results
Scenario Statuses That Display the Expired Icon
The optimization process runs on a schedule that is based on the periodicity that the administrator has defined in the configuration parameters. For example, if the periodicity is defined as weekly, the inventory optimization process is run weekly. After the inventory optimization process is run, new sets of data might become available for inventory optimization. For more information about periodicity, see SAS Inventory Optimization Workbench: Administrator’s Guide.
Because more current data becomes available, the results of the existing scenarios that were obtained during the past run of the inventory optimization process become obsolete. SAS Inventory Optimization Workbench displays the
icon next to the status of these scenarios to indicate that their results are obsolete.
For example, scenario ABC was executed during the last run of the inventory optimization process and is in the Executed status. Because more current data
is available, SAS Inventory Optimization Workbench displays the icon next to the status Executed.
Scenarios with the following statuses can also be expired:
n Executed
n Executed with errors
n Promoted
n Failed to promote
You can run the scenario again in order to view the scenario results with the latest data.
Scenario Analysis Workflow
In the Scenarios category, you can use the following workflow to analyze various business scenarios.
Scenario Analysis Workflow 127

1 Create a new scenario. You can create one of the following scenarios based on your business requirements.
n Customer-facing facility scenario: Choose this scenario when you want to set optimum service levels to minimize the stockouts and cost penalties that are associated with the customer-facing facilities.
For more information about creating a customer-facing facility scenario, see “Create a Customer-Facing Facility Scenario” on page 146.
n Internal facility scenario: Choose this scenario when you want to set the optimum service levels for the warehouses and depots that supply products to the customer-facing facilities.
For more information about creating an internal facility scenario, see “Create an Internal Facility Scenario” on page 138.
n Ad hoc scenario: Choose this scenario when you want to analyze the impact of input parameters (such as service level, lead time, or product cost) on the overall network cost.
For more information about creating ad hoc scenario, see “Create an Ad Hoc Scenario” on page 156
n Optimization override scenario: Choose this scenario when you want to override the optimized value that SAS Inventory Optimization Workbench has suggested.
For more information about optimization override scenario, see “Create an Optimization Override Scenario” on page 170.
After you create the scenario, the status of the scenario becomes Created.
2 After you create the scenario, run the scenario in order to generate the scenario results. When you run the scenario, the status of the scenario changes from Created to Executing. After the scenario results are generated, the status of the scenario becomes Executed.
3 View the results of the scenario. You can view the overall results, view results by facilities, or view results by products.
For more information about viewing the results of an internal facility scenario, see “View Results of an Internal Facility Scenario” on page 139.
For more information about viewing results of the customer-facing facility scenario, see “View Results of a Customer-Facing Facility Scenario” on page 148.
For more information about viewing the results of an ad hoc scenario, see “View Results of an Ad Hoc Scenario” on page 158.
For more information about viewing the results of an optimization override scenario, see “View Results of an Optimization Override Scenario” on page 171.
4 (Optional) Compare the current and optimized metric values for the scenario. Consider the following factors when you are comparing the scenario results:
n the data that is available to you
n the purpose of your scenario analysis
n your organizational environment
n current market conditions
128 Chapter 20 / Introduction to Scenario Analysis
n the suite of products, location of facilities, and type of distribution network or supply chain network
n the goal of your organization or department
n constraints
You can use the service level, lead time, order up-to level, holding cost, and other metric values in order to compare the current and optimized metric values. You can compare these values in tabular form or in graphs.
If the optimized metric values are not satisfactory, you might consider improving the optimization results. You can perform one of the following tasks:
n If you are working with the customer-facing facility scenario, you can recalculate the metric values by specifying the service levels. You can also re-optimize the metric values for all products and facilities by specifying a different budget and a different service level.
For more information about re-optimizing the scenario results, see “Re-optimize the Scenario Results” on page 149.
For more information about recalculating the metric values, see “Recalculate Metric Values” on page 150.
n If you are working with the internal facility scenario, recalculate the metric values.
For more information about recalculating the metric values, see “Recalculate Metric Values for an Internal Facility” on page 141.
5 (Optional) Even after you recalculate or re-optimize the values, you can edit the scenario if the results are still unsatisfactory.
For more information about editing the scenario, see “Edit a Scenario” on page 175.
6 After you are satisfied with the scenario results, promote the metric values that are used in the scenario. The status of the scenario changes from Executed to Promoted.
SAS Inventory Optimization Workbench uses the promoted values in the next run of the optimization process and again provides the optimization results. SAS Inventory Optimization Workbench continues to use these promoted values until you promote new values.
For more information about promoting the target service level of a customer-facing facility scenario, see “Promote the Target Service Level” on page 152.
For more information about promoting the target service level of an internal facility scenario, see “Promote the Target Service Level for an Internal Facility” on page 142.
For more information about promoting the defined values of an ad hoc scenario, see “Promote the Defined Values of a Set” on page 166.
For more information about promoting the constraints of an optimization override scenario, see “Promote Constraints” on page 173.
Scenario Analysis Workflow 129

130 Chapter 20 / Introduction to Scenario Analysis

21Understanding the Scenario Analysis Category
Scenarios Category . . . . . . . . . . . . . . . . . . . . . . . . . . . . . . . . . . . . . . . . . . . . . . . . . . . . . . . 131About the Scenarios Category . . . . . . . . . . . . . . . . . . . . . . . . . . . . . . . . . . . . . . . . . . . . 131Scenarios Data Table . . . . . . . . . . . . . . . . . . . . . . . . . . . . . . . . . . . . . . . . . . . . . . . . . . . . 132Properties Pane . . . . . . . . . . . . . . . . . . . . . . . . . . . . . . . . . . . . . . . . . . . . . . . . . . . . . . . . . 133Comments Manager Pane . . . . . . . . . . . . . . . . . . . . . . . . . . . . . . . . . . . . . . . . . . . . . . . 133
Viewing the Results of a Scenario . . . . . . . . . . . . . . . . . . . . . . . . . . . . . . . . . . . . . . . . . 133About the Results of a Scenario . . . . . . . . . . . . . . . . . . . . . . . . . . . . . . . . . . . . . . . . . . 133Toolbar . . . . . . . . . . . . . . . . . . . . . . . . . . . . . . . . . . . . . . . . . . . . . . . . . . . . . . . . . . . . . . . . . 134Overall Results Tab . . . . . . . . . . . . . . . . . . . . . . . . . . . . . . . . . . . . . . . . . . . . . . . . . . . . . . 134Results by Facilities Tab . . . . . . . . . . . . . . . . . . . . . . . . . . . . . . . . . . . . . . . . . . . . . . . . . 135Results by Products Tab . . . . . . . . . . . . . . . . . . . . . . . . . . . . . . . . . . . . . . . . . . . . . . . . . 135Scenario Properties Pane . . . . . . . . . . . . . . . . . . . . . . . . . . . . . . . . . . . . . . . . . . . . . . . . 135Ad Hoc Set Properties Pane . . . . . . . . . . . . . . . . . . . . . . . . . . . . . . . . . . . . . . . . . . . . . 135Summary Pane . . . . . . . . . . . . . . . . . . . . . . . . . . . . . . . . . . . . . . . . . . . . . . . . . . . . . . . . . 135
Scenarios Category
About the Scenarios Category
You create and analyze scenarios in the Scenarios category. You can view a summary of all the scenarios and then choose to view the details of a scenario. You can edit, create a copy of, or delete an existing scenario.
You can modify metrics such as service level, lead time, and the unit cost of a product in a scenario, and then view the impact of this change on other metrics such as total inventory cost, on-hand cost, and so on. After you are satisfied with the results of a scenario, you can promote these values. When you promote the values, the underlying tables are updated with the new data.
In the Scenarios category, you can perform the following tasks:
n view a summary of all the existing scenarios
n create a scenario
n execute a scenario
n manage an existing scenario by performing activities such as edit, delete, and copy
131

n view scenario results in a tabular format, graphical format, or both
n promote metric values
n filter scenarios by using the scenario type, the date on which the scenario was created, status, and so on
n view details about any warnings or errors that occurred during scenario processing
Scenarios Data Table
The Scenarios category displays a data table that contains a summary of all the scenarios that have been created for the facilities and products that you are responsible for. In this view, you can create a new scenario, and view, copy, edit, delete, or promote an existing scenario.
The following table explains the columns in the Scenarios category data table.
Table 21.1 Description of Columns in the Scenarios Data Table
Column Description
Name The name of the scenario. The column also contains icons that indicate the type of the scenario.
Description The description of the scenario.
Type The type of the scenario.
Status The status of each scenario and the results expired icon that is associated with it. A scenario can be in one of the following statuses:n Createdn Executingn Executedn Executed with errorsn Failedn Deletingn Failed to deleten Promotingn Promotedn Failed to promote
Product Count The number of products that are selected in the scenario analysis.
Facility Count The number of facilities that are selected in the scenario analysis.
Network Count The number of networks that are selected in the scenario analysis.
Note: For customer-facing facility scenarios, the network count is always zero.
Created Date The date on which the scenario was created.
132 Chapter 21 / Understanding the Scenario Analysis Category

Column Description
Created By The user name of the person who created the scenario.
Modified Date The date on which the scenario was last modified.
Modified By The user name of the person who last modified the scenario.
Last Run Date The date on which the scenario was last run.
Last Run By The user name of the person who last ran the scenario.
Properties Pane
The Properties pane in the Scenarios category displays the following information for the selected scenario:
n name and description of the scenario
n type of the scenario
n status of the scenario
n date on which the scenario was created
n user name of the person who created the scenario
n date on which the scenario was last modified
n user name of the person who last modified the scenario
n an indicator explaining whether the scenario is expired
n the name of the forecast that is linked to the ad hoc scenario
Comments Manager Pane
For more information about the Comments Manager pane, see “Add a Comment By Using the Comments Manager Pane” on page 18.
Viewing the Results of a Scenario
About the Results of a Scenario
To view the results of a scenario, double-click a scenario that has run at least once. SAS Inventory Optimization Workbench opens a separate view and displays the results of the selected scenario. You can view the overall results of the scenario or view the scenario results by facilities or by products. The Properties pane also displays the properties of the scenario.
Viewing the Results of a Scenario 133

Toolbar
The following buttons on the toolbar enable you to perform frequently performed tasks quickly. Not all buttons are available for all types of scenarios.
Table 21.2 Toolbar for the Results of the Scenario
Button Description
Click this button to promote the values for the scenario.
For more information about promoting the target service level of an internal facility scenario, see “Promote the Target Service Level for an Internal Facility” on page 142.
For more information about promoting the target service level of customer-facing facility scenario, see “Promote the Target Service Level” on page 152.
For more information about promoting defined values of ad hoc scenario, see “Promote the Defined Values of a Set” on page 166.
For more information about promoting constraint values of an optimization override scenario, see “Promote Constraints” on page 173.
When you are viewing the results of a customer-facing facility scenario, click this button to re-optimize the scenario.
For more information about re-optimizing scenario results, see “Re-optimize the Scenario Results” on page 149.
When you are viewing the results of an optimization override scenario, click this button to evaluate the optimization values.
For more information about evaluating the optimized values, see “Evaluate the Optimization Values” on page 172.
Click this button to recalculate the scenario results.
For more information about recalculating the metric values of internal facility scenario, see “Recalculate Metric Values for an Internal Facility” on page 141.
For more information about recalculating the metric values of customer-facing facility scenario, see “Recalculate Metric Values” on page 150.
Click this button to view the messages. For more information viewing messages for scenarios, see “View Messages” on page 177.
Overall Results Tab
The Overall Results tab displays the aggregated values for metrics across all selected products in the network. You can view the results in tabular format, in graphical format, or in both formats.
Note: The Overall Results tab is not displayed for a customer-facing facility scenario.
134 Chapter 21 / Understanding the Scenario Analysis Category

Results by Facilities Tab
The Results by Facilities tab displays the results of the scenario, grouped by facilities across all products. You can view the results in tabular format, in graphical format, or in both formats.
Results by Products Tab
The Results by Products tab displays the results of the scenario, grouped by products and facility. You can view the results in tabular format, in graphical format, or in both formats.
Scenario Properties Pane
The Scenario Properties pane displays the following information about the scenario:
n name of the scenario
n description of the scenario
n type of the scenario
n status of the scenario
n date on which the scenario was created
n user name of the person who created the scenario
n user name of the person who last modified the scenario
n date on which the scenario was last modified
n an indicator explaining whether the scenario is expired
Ad Hoc Set Properties Pane
The Ad Hoc Set Properties pane displays the following information for each set that you created:
n name of the input metric that you modified
n mode that you used to define the metric
n input value of the metric
You can choose a different set to view its properties.
Note: The Ad Hoc Set Properties pane is displayed only for the results of the ad hoc scenario.
Summary Pane
The scenario results display the following summary panes:
n summary of all facilities
n summary of the selected product or selected facility
Viewing the Results of a Scenario 135

A summary of all facilities displays the aggregated metric values of all facilities and products. This pane is displayed only for the results of a customer-facing facility scenario.
A summary of the selected product or the selected facility displays the metric values of the product or facility that you selected. For example, on the Results by Facilities tab, when you select a facility, the Summary pane displays the metric values for the selected facility.
136 Chapter 21 / Understanding the Scenario Analysis Category

22Performing an Internal Facility Scenario Analysis
About the Internal Facility Scenario . . . . . . . . . . . . . . . . . . . . . . . . . . . . . . . . . . . . . . . . 137
Create an Internal Facility Scenario . . . . . . . . . . . . . . . . . . . . . . . . . . . . . . . . . . . . . . . . 138
Viewing the Results of an Internal Facility Scenario . . . . . . . . . . . . . . . . . . . . . . . . 139View Results of an Internal Facility Scenario . . . . . . . . . . . . . . . . . . . . . . . . . . . . . . 139View Overall Results . . . . . . . . . . . . . . . . . . . . . . . . . . . . . . . . . . . . . . . . . . . . . . . . . . . . 140View the Results by Facilities . . . . . . . . . . . . . . . . . . . . . . . . . . . . . . . . . . . . . . . . . . . . 140View Results by Products . . . . . . . . . . . . . . . . . . . . . . . . . . . . . . . . . . . . . . . . . . . . . . . . 141
Recalculate Metric Values for an Internal Facility . . . . . . . . . . . . . . . . . . . . . . . . . . 141
Promote the Target Service Level for an Internal Facility . . . . . . . . . . . . . . . . . . . 142
About the Internal Facility Scenario
The internal facility scenario enables you to optimize the service level values for non-customer-facing facilities (internal facilities) for a given network. By optimizing the service level values for internal facilities, the customer-facing facilities in the network can serve the customers better. The internal service level values are optimized such that they are achieved at the lowest possible inventory cost.
To perform this analysis, you select products, facilities, and networks. You do not specify a constraint. The service level values of customer-facing facilities are used to calculate service levels for the internal facilities. You can specify a threshold value, in percent, in order to trigger an alert on the results.
The scenario generates values for the following metrics at the aggregated level for each facility and product pair:
n target service level
n order up-to level
n pipeline cost
n on-hand cost
n on-hand holding cost
n total cost
137

You can modify or override the optimal service level value that is recommended at each facility and product combination and recalculate the scenario results. SAS Inventory Optimization Workbench considers the modified or overridden value when it recalculates all the metric values for that facility and product combination.
You can view the metric values for the following settings:
n current settings
n optimized settings that you obtain after the scenario is run
n recalculated settings
You can submit or promote the optimal service level values that are recommended or that you supplied for the facility and product pairs. SAS Inventory Optimization Workbench uses the promoted service level values for the next run of the inventory optimization process.
Create an Internal Facility Scenario
You can create an internal facility scenario to analyze different business scenarios and the impact of those business scenarios on the service level and inventory cost.
You must have permission to create an internal facility scenario.
To create an internal facility scenario:
1 In the Inventory Performance workspace, click Scenarios. The Scenarios category appears.
2 Click , and then select Internal Facility Scenario Analysis. The Internal Facility Scenario Analysis page appears.
3 Enter information in each field. The following table describes the fields.
Table 22.1 Internal Facility Scenario Fields and Descriptions
Field Description
Name Enter a name for the scenario.
Note: This is a required field. The scenario name must be unique and must be a valid SAS name. For more information about SAS naming conventions, see SAS Language Reference: Concepts.
Description Enter a short description for the scenario. The description can be a maximum of 255 characters.
Scenario Products and Facilities
Select Products
Select products for the scenario. To select products, click Select. The Products window appears.
In the Products window, the icon indicates that the product is a combined product.
Note: This is a required field.
138 Chapter 22 / Performing an Internal Facility Scenario Analysis

Field Description
Select Facilities
Select facilities for the scenario. To select facilities, click Select. The Facilities window appears.
Note: This is a required field.
Select Networks
Select networks for the scenario. To select networks, click Select. The Networks window appears.
Note: This is a required field.
Alert Settings
Specify a threshold value in percent to trigger an alert on the scenario results
Select the check box and then enter the threshold value, in percent, that will trigger an alert on the scenario results. If the scenario result is greater than or less than the threshold value that you entered, SAS Inventory Optimization Workbench displays an alert icon next to the following metric values:n target service leveln order up-to leveln pipeline costn on-hand costn on-hand holding costn total cost
4 Select one of the following run options:
n Select the Save and Run option, and then clickSave and Run to save the scenario settings and to run the scenario to view results.
n Select the Save only option, and then click Save only to save the scenario settings. If you select this option, the scenario is not run.
Viewing the Results of an Internal Facility Scenario
View Results of an Internal Facility Scenario
You can view the results of an internal facility scenario in order to analyze the optimized service levels of the internal facilities for given service levels at customer-facing facilities.
The following prerequisites apply:
n You must have permission to view the results of the internal facility scenario.
n The internal facility scenario analysis must be in one of the following states: Executed, Executed (expired), Executed with errors, Executed with errors (expired), Promoted, Promoted (expired), Failed to promote, or Failed to promote (expired).
To view the results of the internal facility scenario analysis:
Viewing the Results of an Internal Facility Scenario 139

1 In the Inventory Performance workspace, click Scenarios. The Scenarios category appears.
2 Double-click an internal facility scenario analysis.
SAS Inventory Optimization Workbench opens a view in which you can view the results of the selected internal facility scenario.
View Overall Results
The Overall Results tab of the internal facility scenario displays the aggregated values for the following metrics for the selected products and facilities in the network:
n target service level
n order up-to level
n pipeline cost
n on-hand cost
n on-hand holding cost
n total cost
SAS Inventory Optimization Workbench displays the aggregated current values, optimized values, and recalculated values. You can view the aggregated values in tabular format, in graphical format, and in a combined view. The graphical format contains metric values in bar charts.
View the Results by Facilities
The Results by Facilities tab of the internal facility scenario displays the aggregated values for the following metrics across all products in the selected networks:
n target service level
n order up-to level
n total cost
n pipeline cost
n on-hand cost
n on-hand holding cost
The Results by Facilities tab displays the aggregated results for the current settings, the optimized values, and the recalculated values. On the Results by Facilities tab, you can view the aggregated metric values in the following ways:
n combined view
By default, SAS Inventory Optimization Workbench displays the aggregated values in the combined view. The upper section of the Results by Facility tab displays the metric values in bar charts. The lower section displays the metric values in tabular form.
n graphical format
SAS Inventory Optimization Workbench displays separate bar charts for each metric. Every bar chart displays current values, optimized values, and
140 Chapter 22 / Performing an Internal Facility Scenario Analysis

recalculated values on the X-axis, and the metric value on the Y-axis. The bar charts display metric values for the facility that is selected in the table.
n tabular format
SAS Inventory Optimization Workbench displays current values, optimized values, and recalculated values in a tabular format. The table also displays the number of products that are present in the facility. Double-click the product to view results by products. Select a metric in the View results by list to view its values in a tabular form.
The facilities that are selected for the scenario are indicated by the icon.
View Results by Products
The Results by Products tab of the internal facility scenario displays metric values by products. You can select a facility to view the metric values for all products in that facility.
On Results by Products tab, the left pane displays a list of all facilities and networks that are a part of the internal facility scenario. Select a facility or network to view its products in the right pane in a tabular format.
You can recalculate the metric values if you foresee a different target service level. For more information about recalculating the metric values, see “Recalculate Metric Values for an Internal Facility” on page 141.
The table contains a list of all products of the selected facility and the metric values for those products.
Recalculate Metric Values for an Internal Facility
You might foresee a target service level for a product and facility pair that is different from the optimized target service level. SAS Inventory Optimization Workbench enables you to change the target service level. This target service level is called the recalculated target service level. SAS Inventory Optimization Workbench considers the target service level value that you provided when it recalculates the metric values for the remaining products in the entire network.
By specifying a different target service level and recalculating the metric values, you can perform the following tasks:
n compare the current values, optimized values, and recalculated values of all metrics for all products in the network
n analyze how a change in target service level for one of the products changes metric values for the rest of the products within the network
n understand the performance of inventory in the network
The following prerequisites apply:
n You must have permission to recalculate the metric values.
n The internal facility scenario must be in the Executed state or in the Executed with errors state.
To recalculate the metric values:
Recalculate Metric Values for an Internal Facility 141

1 In the Inventory Performance workspace, click Scenarios. The Scenarios category appears.
2 Double-click an internal facility scenario. SAS Inventory Optimization Workbench displays the results for the selected internal facility.
3 Click the Results by Products tab. SAS Inventory Optimization Workbench displays the results of the internal facility scenario by product.
4 Select the facility and product pair, and enter a value in the Recalculated Target Service Level field.
Note: You can enter values for multiple products and facilities.
5 Click .
SAS Inventory Optimization Workbench considers the new target service level for the facility and product combination pairs, and then recalculates the metric values for the remaining products in the network.
Promote the Target Service Level for an Internal Facility
After you compare the current values, optimized values, and recalculated metric values, you can promote the target service level if the optimized or recalculated metric values are satisfactory. By promoting the target service level, you can use the target service level values for all facilities that are in the network in the next run of the optimization process. SAS Inventory Optimization Workbench applies the service level values to the entire network in the next run of the inventory optimization process in order to analyze the inventory performance and suggest replenishment orders.
Note: When you promote a target service level, SAS Inventory Optimization Workbench saves the service level values in the transactional database, which should be loaded to stage. Consult your administrator about how to load the promoted values from the transactional database to stage in order to use them in the next run of the optimization process.
You can promote a scenario only once. You can view the promoted scenario, but you cannot make any changes to it. If you want to promote a scenario again, create a copy of the scenario, modify the settings, and then promote the settings.
The following prerequisites apply:
n You must have permission to promote a scenario.
n The internal facility scenario must be in the Executed state or in the Executed with errors state.
To promote the target service level for an internal facility scenario:
1 In the Inventory Performance workspace, click Scenarios. The Scenario category appears.
2 Double-click an internal facing facility scenario. SAS Inventory Optimization Workbench displays the results of the scenario.
142 Chapter 22 / Performing an Internal Facility Scenario Analysis

3 (Optional) Recalculate the scenario results. For more information about recalculating, see “Recalculate Metric Values for an Internal Facility” on page 141.
4 When you are viewing the results of the scenario, click . The Promote window appears.
5 In the Select scenario values to be promoted list, select one of the following options:
n Optimized: Select this option when you want to promote the target service level values that SAS Inventory Optimization Workbench has provided.
n Recalculated: Select this option when you want to promote the target service level values that you have foreseen and calculated.
Note: This option is available only if the scenario has been recalculated.
6 Click OK.
After you click OK, the state of the scenario changes to Promoting. After the scenario values are completely promoted, the state of the scenario changes to Promoted. If an error occurs while the scenario values are being promoted, the state of the scenario becomes Failed to promote.
After the scenario is promoted, the target service level values are stored in the SCENARIO_PROMOTED_VALUES table in the transactional database. Contact your administration in order to copy the target service level values to STG_SCENARIO_PROMOTED_VALUES table in order to use them in the next run of the inventory optimization process.
Promote the Target Service Level for an Internal Facility 143

144 Chapter 22 / Performing an Internal Facility Scenario Analysis

23Performing a Customer-Facing Facility Scenario Analysis
About the Customer-Facing Facility Scenario . . . . . . . . . . . . . . . . . . . . . . . . . . . . . . 145
Create a Customer-Facing Facility Scenario . . . . . . . . . . . . . . . . . . . . . . . . . . . . . . . 146
Viewing the Results of a Customer-Facing Facility Scenario . . . . . . . . . . . . . . . 148View Results of a Customer-Facing Facility Scenario . . . . . . . . . . . . . . . . . . . . . . 148View the Results by Facilities . . . . . . . . . . . . . . . . . . . . . . . . . . . . . . . . . . . . . . . . . . . . 148View the Results by Products . . . . . . . . . . . . . . . . . . . . . . . . . . . . . . . . . . . . . . . . . . . . 149
Re-optimize the Scenario Results . . . . . . . . . . . . . . . . . . . . . . . . . . . . . . . . . . . . . . . . . . 149
Recalculate Metric Values . . . . . . . . . . . . . . . . . . . . . . . . . . . . . . . . . . . . . . . . . . . . . . . . . 150
The Difference between Recalculation and Re-Optimization . . . . . . . . . . . . . . . . 151
Promote the Target Service Level . . . . . . . . . . . . . . . . . . . . . . . . . . . . . . . . . . . . . . . . . . 152
About the Customer-Facing Facility Scenario
The customer-facing facility scenario enables you to maximize the service level values for a group of products and a group of customer-facing facilities. To perform this analysis, you can provide a minimum service level constraint, a total budget constraint for all the customer-facing facilities in the scenario, or both. You can also choose not to specify a constraint.
You can specify a threshold value, in percent, in order to trigger an alert on the results.
You can modify or override the optimal service level value that is recommended by the scenario at a facility and product level, and then recalculate the metric values for that facility and product pair.
You can modify the total budget constraint and set a minimum service level value for all facilities and products and again optimize the scenario. When you are re-optimizing the scenario, SAS Inventory Optimization Workbench considers the overridden minimum service level and total budget constraint in order to produce optimal metric values for all the facility and product pairs.
You can submit or promote the service level values that are recommended or that you supplied for the facility and product pairs. SAS Inventory Optimization
145

Workbench uses the promoted service level values and budget for the next run of the inventory optimization process.
Create a Customer-Facing Facility Scenario
The customer-facing facility scenario enables you to ascertain the optimum service level for a group of products to meet the specified budget constraints. This analysis is also helpful when the inventory cost of your network is within the budget, but the service levels of product are suboptimal at the customer-facing facilities. With this analysis, you can set the optimum service level to minimize the stockouts and cost penalties that are associated with the facilities.
If you specify only the service level constraint, then the scenario sets the specified service level to all product and facility combinations included in the scenario. The scenario also calculates the total budget to attain the specified minimum service level.
If you specify a total budget constraint, then the scenario produces optimal service levels at the customer-facing facilities that meet the budget constraint.
If you specify both the constraints, then the scenario performs the following tasks:
n produces optimal service levels that are not lower than the service level constraint
n produces optimal service levels that also meet the budget constraint
If the analysis cannot meet both the constraints, then the analysis satisfies only the budget constraint.
If you do not specify any constraints, the analysis uses the current total cost across the selected customer-facing facilities as the constraint and generates the optimal service level values for the facility and product pairs.
You must have permission to create a customer-facing facility scenario.
To create a customer-facing facility scenario:
1 In the Inventory Performance workspace, click Scenarios. The Scenarios category appears.
2 Click , and select Customer-Facing Facility Scenario. The Customer-Facing Facility Scenario page appears.
3 Enter information in each field. The following table describes the fields.
Table 23.1 Fields on the Customer-Facing Facility Scenario Page
Field Description
Name Enter a name for the scenario.
Note: This is a required field. The scenario name must be unique and must be a valid SAS name. For more information about SAS naming conventions, see SAS Language Reference: Concepts.
146 Chapter 23 / Performing a Customer-Facing Facility Scenario Analysis

Field Description
Description Enter a short description for the scenario in a maximum of 255 characters.
Scenario Products and Facilities
Select Products Select products for the scenario. To select products, click Select. The Products window appears.
When you are selecting products in the Products window, the icon indicates that the product is a combined product.
Note: This is a required field.
Select Facilities Select facilities for the scenario. To select facilities, click Select. The Facilities window appears.
Note: This is a required field.
Scenario Settings
Apply budget constraint
Click this check box, and then enter a value in the Set total budget constraint in USD for all customer-facing facilities in the scenario field.
SAS Inventory Optimization Workbench considers the budget constraint in order to produce optimal service levels for all products included in the scenario.
Set a minimum service level in percent that the scenario can suggest
Click this check box, and then enter a value in the field. SAS Inventory Optimization Workbench considers the service level that you entered in order to produce optimal service level. The scenario does not produce service levels that are less than the constraint value.
Alert Settings
Specify a threshold value in percent to trigger an alert on the scenario results
Select the check box, and then enter the threshold value, in percent, in order to trigger an alert in the scenario results table. If the scenario result is greater than or less than the threshold value that you entered, SAS Inventory Optimization Workbench displays an alert icon in the results table.
4 Select one of the following run options:
n Select the Save and Run option, and then click Save and Run to save the scenario settings and to run the scenario in order to view results.
n Select the Save only option, and then click Save only to save the scenario settings. If you select this option, the scenario is not run.
Create a Customer-Facing Facility Scenario 147

Viewing the Results of a Customer-Facing Facility Scenario
View Results of a Customer-Facing Facility Scenario
You can view the results of a customer-facing facility scenario in order to analyze how to maximize the service levels for a group of products in customer-facing facilities.
The following prerequisites apply:
n You must have permission to view the results of the customer-facing facility scenario.
n The customer-facing facility scenario must be in one of the following states: Executed, Executed with errors, Executed with errors (expired), Promoted, Failed to promote, and Failed to promote (expired).
To view the results of a customer-facing facility scenario:
1 In the Inventory Optimization workspace, click Scenarios. The Scenarios category appears.
2 Double-click a customer-facing facility scenario.
SAS Inventory Optimization Workbench opens a view in which you can view the results of the selected customer-facing facility scenario.
View the Results by Facilities
The Results by Facilities tab of the customer-facing facility scenario displays the aggregated values of all the selected facilities across all products. The Results by Facilities tab displays facility ID, the name of the facility, and the aggregated values for the following metrics:
n current target service level
n optimized target service level
n recalculated target service level
n current order up-to level
n optimized order up-to level
n recalculated order up-to level
n current inventory cost
n optimized inventory cost
n recalculated inventory cost
The Results by Facilities tab displays these metric values along with the number of products that are in a facility in a tabular form. An alert icon indicates that the metric value is less than or greater than the threshold value that you defined while you were creating the scenario.
148 Chapter 23 / Performing a Customer-Facing Facility Scenario Analysis

You can double-click a facility to view results for that facility by product.
View the Results by Products
The Results by Products tab of the customer-facing facility scenario displays the metric values by products. On Results by Products tab, the left pane displays a list of all facilities that are a part of the customer-facing facility. Select a facility to view its products in the right pane in a tabular format.
You can select a facility in the left pane to view the metric values for all products in the right pane.
The table contains a list of all products of the selected facility and the following metric values:
n target lead time
n demand
n unit cost
n current target service level
n optimized target service level
n recalculated target service level
n current order up-to level
n optimized order up-to level
n recalculated order up-to level
n current inventory cost
n optimized inventory cost
n recalculated inventory cost
You can recalculate the metric values if you foresee a different target service level. For more information about recalculating metric values, see “Recalculate Metric Values” on page 150.
You can re-optimize the scenario results by providing a different budget constraint and different minimum target service level values. For more information about re-optimizing scenario results, see “Re-optimize the Scenario Results” on page 149.
Re-optimize the Scenario Results
After you consider the organizational factors (such as working capital requirements, demand for the products, upcoming promotions, marketing plan, and so on) and you examine the optimized metric values, you might foresee a different minimum service level or overall budget for the products. By re-optimizing the scenario results, you can analyze various scenarios in order to implement organizational inventory strategies that maximize sales and inventory productivity.
When you re-optimize the scenario results, SAS Inventory Optimization Workbench applies the budget constraint and minimum service level that you set to all facilities and products included in the scenario. Re-optimizing the scenario
Re-optimize the Scenario Results 149

results produces the new inventory cost and new minimum service levels for all facilities and products.
The following prerequisites apply:
n You must have permission to re-optimize the scenario results
n The customer-facing facility scenario must be in one of the following states: Executed or Executed with errors.
To re-optimize the customer-facing facility scenario:
1 In the Inventory Performance workspace, click Scenarios. The Scenarios category appears.
2 Double-click a customer-facing facility scenario. SAS Inventory Optimization Workbench displays the results of the selected customer-facing facility scenario.
3 Click . The Optimization Settings window appears.
4 Enter the appropriate information in each field. The following table describes each field.
Table 23.2 Fields in the Optimization Settings Window
Field Description
Apply budget constraint
Select this check box and enter a value in the Set inventory budget in USD field. SAS Inventory Optimization Workbench produces optimal service levels at the customer-facing facilities that meet the budget constraints.
Apply minimum service level
Select this check box and enter a value in the Set minimum service level in percent field. If you enter a minimum service level, SAS Inventory Optimization Workbench performs the following tasks:n applies the new minimum service level to all products
and facilities in the scenarion considers the overall budget of all customer-facing
facilities n produces service levels that are greater than the
constraint value
5 Click Re-optimize.
Recalculate Metric Values
You can recalculate the metric values for the selected product and facility pair by specifying the target service level.
You might want to recalculate the metric values after examining the following factors:
n your organization environment
150 Chapter 23 / Performing a Customer-Facing Facility Scenario Analysis

n current market conditions
n the suite of products
n any promotional events
n constraints
When you define a target service level for the selected combination of product-facility pairs, SAS Inventory Optimization Workbench performs the following tasks:
n considers the target service level values for the combination of product-facility pairs that you define
n optimizes the budget and service levels for the rest of the products
You recalculate the metric values when you want to change the service level for a specific product and facility pairs.
The following prerequisites apply:
n You must have permission to recalculate the scenario results.
n The customer-facing facility scenario must be in one of the following states: Executed or Executed with errors.
To recalculate the scenario results:
1 In the Inventory Performance workspace, click Scenarios. The Scenarios category appears.
2 Double-click a customer-facing facility scenario. SAS Inventory Optimization Workbench displays the results of the scenario.
3 When you are viewing the results of the customer-facing facility scenario, click the Results by Products tab. SAS Inventory Optimization Workbench displays the results of the customer-facing facility scenario by products.
4 In the Recalculated Target Service Level field on the Results by Product tab, enter a value.
Note: You can enter the value for multiple pairs of facility and product-level products.
5 Click .
SAS Inventory Optimization Workbench considers the target service level for the product and facility pairs. Then, it optimizes and produces new metric values for the remaining facility and products pairs that are in the scenario. The calculated target service level values are displayed in the Recalculated Target Service Level column in the data table.
The Difference between Recalculation and Re-Optimization
After you compare the current and optimized metric values, you can recalculate the target service level or re-optimize the metric values. The following table describes the difference between recalculation and re-optimization.
The Difference between Recalculation and Re-Optimization 151

Table 23.3 Difference between Recalculation and Re-Optimization
Recalculation Re-Optimization
You specify the target service level for selected products for a particular facility.
You specify the budget and service level constraints for all products and facilities that are included in the scenario.
Based on the specified service level for the selected products, SAS Inventory Optimization Workbench calculates the service levels for the rest of the products for the facility. During recalculation, SAS Inventory Optimization Workbench performs the following tasks:n considers the service level of the
selected products as the minimum service level and tries to calculate the service level for the selected products that is greater than the specified service level
n calculates the service level and other metric values for the rest of the products
Based on the specified budget and target service level values, SAS Inventory Optimization Workbench optimizes the values for all products and facilities in the scenario.
Choose this option when you want to set the service level for a few products and you want to analyze the service level and other metric values for the rest of the products for a particular facility.
Choose this option when you want to re-optimize the budget and service level for all products and facilities that are included in the scenario.
Promote the Target Service Level
After you compare the current values, optimized values, and recalculated metric values, if the optimized or recalculated metric values are satisfactory, you can promote the target service level. By promoting the target service level, you can use the target service level values for all facilities and products in the next run of the optimization process. SAS Inventory Optimization Workbench applies the service level values to the selected facilities and products in the next run of the inventory optimization process in order to analyze the inventory performance and to suggest replenishment orders.
Note: When you promote a target service level, SAS Inventory Optimization Workbench saves the service level values in the transactional database, which should be loaded to stage. Contact your administrator about how to load the promoted values from the transactional database to stage in order to use them in the next run of the optimization process.
You can promote a scenario only once. You can view the promoted scenario, but you cannot make any changes to it. If you want to promote a scenario again, then you need to create a copy of the scenario, modify the settings, and then promote the values.
The following prerequisites apply:
n You must have permission to promote a scenario.
152 Chapter 23 / Performing a Customer-Facing Facility Scenario Analysis

n The customer-facing facility scenario must be in the Executed state.
To promote the target service level for a customer-facing facility scenario:
1 In the Inventory Performance workspace, click Scenarios. The Scenarios category appears.
2 Double-click a customer-facing facility scenario. SAS Inventory Optimization Workbench displays the results of the scenario.
3 (Optional) Recalculate the metric values of the scenario. For more information about recalculating metric values, see “Recalculate Metric Values” on page 150.
4 (Optional) Re-optimize the scenario results. For more information about re-optimizing the scenario results, see “Re-optimize the Scenario Results” on page 149.
5 When you are viewing the results of the customer-facing facility, click . The Promote window appears.
6 In the Select scenario values to be promoted list, select one of the following options:
n Optimized: Select this option if you want to promote the values that SAS Inventory Optimization Workbench has provided.
n Recalculated: Select this option if you want to promote the values that you have foreseen and calculated.
Note: This option is available only if you have recalculated the scenario results.
7 Click OK.
After you click OK, the state of the scenario changes to Promoting. After the scenario values are completely promoted, the state of the scenario changes to Promoted. If an error occurs while the scenario values are being promoted, the state of the scenario becomes Failed to promote.
After the scenario is promoted, the target service level values are stored in the SCENARIO_PROMOTED_VALUES table in the transactional database. Contact your administration in order to copy the target service level values to STG_SCENARIO_PROMOTED_VALUES table in order to use them in the next run of the inventory optimization process.
Promote the Target Service Level 153

154 Chapter 23 / Performing a Customer-Facing Facility Scenario Analysis

24Performing an Ad Hoc Scenario Analysis
About the Ad Hoc Scenario . . . . . . . . . . . . . . . . . . . . . . . . . . . . . . . . . . . . . . . . . . . . . . . . 155
Create an Ad Hoc Scenario . . . . . . . . . . . . . . . . . . . . . . . . . . . . . . . . . . . . . . . . . . . . . . . . 156
Viewing the Results of an Ad Hoc Scenario . . . . . . . . . . . . . . . . . . . . . . . . . . . . . . . . 158View Results of an Ad Hoc Scenario . . . . . . . . . . . . . . . . . . . . . . . . . . . . . . . . . . . . . . 158View Overall Results . . . . . . . . . . . . . . . . . . . . . . . . . . . . . . . . . . . . . . . . . . . . . . . . . . . . 159View Results by Facilities . . . . . . . . . . . . . . . . . . . . . . . . . . . . . . . . . . . . . . . . . . . . . . . . 159View Results by Products . . . . . . . . . . . . . . . . . . . . . . . . . . . . . . . . . . . . . . . . . . . . . . . . 160
Obtaining Demand Data from SAS Forecast Analyst Workbench . . . . . . . . . . . 161About Obtaining Demand from SAS Forecast Analyst Workbench . . . . . . . . . . 161Obtain Demand Data from SAS Forecast Analyst Workbench . . . . . . . . . . . . . . 161Status of a Forecast While Obtaining Demand . . . . . . . . . . . . . . . . . . . . . . . . . . . . . 163Status of a Plan While Obtaining Demand . . . . . . . . . . . . . . . . . . . . . . . . . . . . . . . . . 165Status of a Custom Analysis While Obtaining Demand . . . . . . . . . . . . . . . . . . . . . 165
Promote the Defined Values of a Set . . . . . . . . . . . . . . . . . . . . . . . . . . . . . . . . . . . . . . . 166
About the Ad Hoc Scenario
The ad hoc scenario enables you to evaluate the impact of network variables on policy parameters and costs. To perform this analysis, you can specify new values for the following input parameters:
n service level
n lead time
n product cost
You can create multiple sets. Each set can contain different input values. However, if you create a set without any input settings, then that set is not saved and is not used for analysis.
You can specify a threshold value, in percent, in order to trigger an alert on the scenario results. The analysis generates values for the following metrics for each set:
n target service level
n target lead time
155

n order up-to level
n pipeline cost
n on-hand cost
n on-hand holding cost
n total cost
You can also view the metric values for the current settings in the results of the ad hoc scenario. You can submit or promote any one set. SAS Inventory Optimization Workbench uses the promoted values in the next run of the inventory optimization process.
Create an Ad Hoc Scenario
You can create an ad hoc scenario to analyze different business scenarios and their impact on inventory.
You must have permission to create an ad hoc scenario.
To create an ad hoc scenario:
1 Use one of the following approaches:
n In the Scenarios category, you can create an ad hoc scenario from scratch. Select products, facilities, and networks of your choice to create the ad hoc scenario.
1 In the Inventory Performance workspace, click the Scenarios category. The Scenarios category appears.
2 Click and then select Ad Hoc Scenario. The New Scenario–Ad Hoc Scenario page appears. Continue to Step 2 on page 157.
n In the Products category, you can create the ad hoc scenario for the products that you selected in the Products category.
1 In the Inventory Performance workspace, click the Products category. The Products category appears.
2 Select the product for which you want to create an ad hoc scenario, and click . The New Scenario–Ad Hoc Scenario page appears with the product that you selected. Continue to Step 2 on page 157.
Note: Press and hold the Ctrl key to select multiple products.
n In the Facilities and Networks category, you can create an ad hoc scenario for the facilities and networks that you selected in the Facilities and Networks category.
1 In the Inventory Performance workspace, click the Facilities and Networks category. The Facilities and Networks category appears.
2 Select the facility and network for which you want to create an ad hoc scenario, and click . The New Scenario–Ad Hoc Scenario page appears with the facility and network that you selected. Continue to Step 2 on page 157.
156 Chapter 24 / Performing an Ad Hoc Scenario Analysis
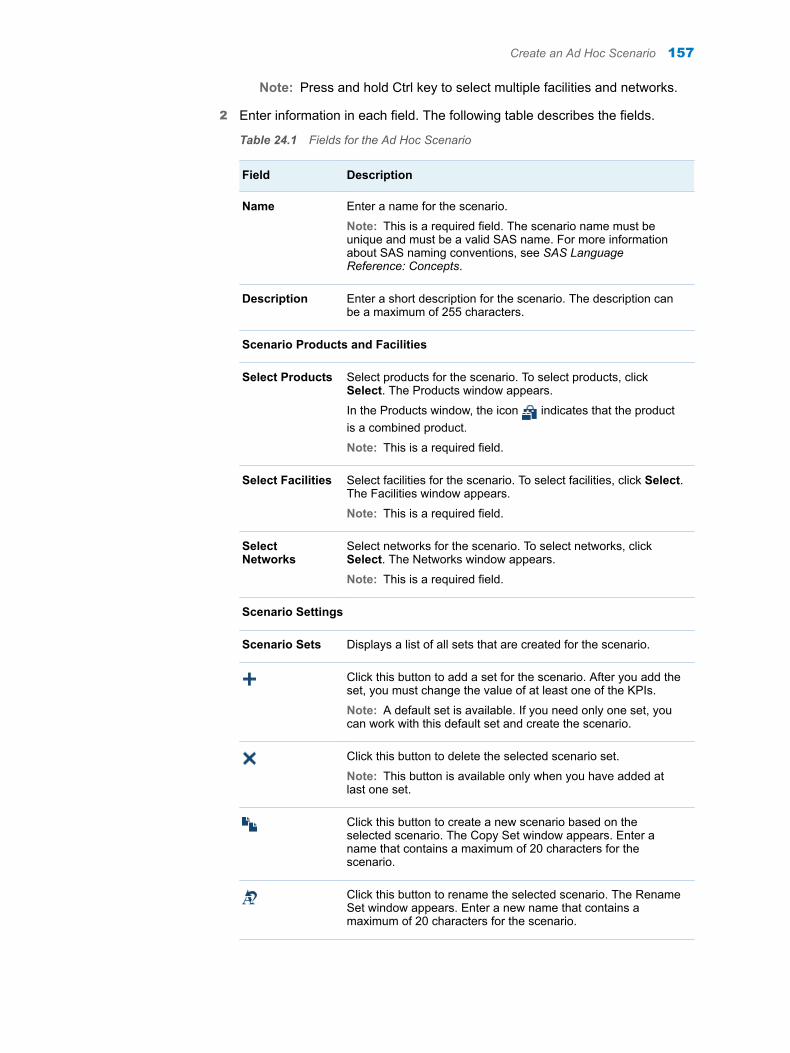
Note: Press and hold Ctrl key to select multiple facilities and networks.
2 Enter information in each field. The following table describes the fields.
Table 24.1 Fields for the Ad Hoc Scenario
Field Description
Name Enter a name for the scenario.
Note: This is a required field. The scenario name must be unique and must be a valid SAS name. For more information about SAS naming conventions, see SAS Language Reference: Concepts.
Description Enter a short description for the scenario. The description can be a maximum of 255 characters.
Scenario Products and Facilities
Select Products Select products for the scenario. To select products, click Select. The Products window appears.
In the Products window, the icon indicates that the product is a combined product.
Note: This is a required field.
Select Facilities Select facilities for the scenario. To select facilities, click Select. The Facilities window appears.
Note: This is a required field.
Select Networks
Select networks for the scenario. To select networks, click Select. The Networks window appears.
Note: This is a required field.
Scenario Settings
Scenario Sets Displays a list of all sets that are created for the scenario.
Click this button to add a set for the scenario. After you add the set, you must change the value of at least one of the KPIs.
Note: A default set is available. If you need only one set, you can work with this default set and create the scenario.
Click this button to delete the selected scenario set.
Note: This button is available only when you have added at last one set.
Click this button to create a new scenario based on the selected scenario. The Copy Set window appears. Enter a name that contains a maximum of 20 characters for the scenario.
Click this button to rename the selected scenario. The Rename Set window appears. Enter a new name that contains a maximum of 20 characters for the scenario.
Create an Ad Hoc Scenario 157

Field Description
Target service level
If you want the service level to be a target metric, select this check box. Select one of the following options, and then enter a value in the field:n Set value to: Set all service levels to a percentage value.n Increase value by: Increase all service level values by a
percentage value.n Decrease value by: Decrease all service level values by a
percentage value.
Note: Valid values are between 0.01% to 99.99%.
Target lead time If you want the lead time to be a target metric, select this check box. Select one of the following options, and then enter a value in the field:n Set value to: Set all lead time values to a particular day.n Increase value by: Increase all lead time values by the
specified number of days.n Decrease value by: Decrease all lead time values by the
specified number of days.
Unit cost Click this check box, select one of the following options from the list for unit cost, and then enter a value in the field:n Set value to: Set the unit cost to a particular value in US
dollars.n Increase value by: Increase the unit cost of all products by
a particular value in US dollars.n Decrease value by: Decrease the unit cost of all products
by a particular value in US dollars.
Enter threshold to trigger alert on the scenario results (%)
Select the check box, and then enter the threshold percentage value in order to trigger an alert in the scenario results table. If the scenario result is greater than or less than the threshold value that you enter, SAS Inventory Optimization Workbench displays an alert icon in the results table.
3 Select one of the following run options:
n Select the Save and Run option, and then click Save and Run to save the scenario settings and to run the scenario in order to view results.
n Select the Save only option, and then click Save only to save the scenario settings. If you select this option, the scenario is not run.
Viewing the Results of an Ad Hoc Scenario
View Results of an Ad Hoc Scenario
An ad hoc scenario analysis enables you to determine how a change in certain metric values for a group of products and facilities impacts their policy parameters and costs.
158 Chapter 24 / Performing an Ad Hoc Scenario Analysis

The following prerequisites apply:
n You must have permission to view the results of an ad hoc scenario.
n The ad hoc scenario must be in one of the following states: Executed, Executed (expired), Executed with errors, Executed with errors (expired), Promoted, Promoted (expired), Failed to promote, or Failed to promote (expired).
To view the results of an ad hoc scenario analysis:
1 In the Inventory Performance workspace, click Scenarios. The Scenario category appears.
2 Double-click an ad hoc scenario.
SAS Inventory Optimization Workbench opens a view in which you can view the results of the selected ad hoc scenario.
View Overall Results
The Overall Results tab displays aggregated values for the following metrics across all products in the network:
n target service level
n target lead time
n order up-to level
n pipeline cost
n on-hand cost
n on-hand holding cost
n total cost
The aggregated values are displayed for all sets that you created in the ad hoc scenario. You can view the aggregated values in graphical format (in bar charts), tabular format, or in both formats.
View Results by Facilities
The Results by Facilities tab displays metric values by facilities. You can select a facility in order to view and analyze the following metric values:
n target service level
n target lead time
n demand
n order up-to level
n pipeline cost
n on-hand cost
n on-hand holding cost
n total cost
The Results by Facilities tab displays the aggregated values of all products that are in the selected facility, for all sets. On the Results by Facilities tab, you can view the aggregated metric values in the following ways:
Viewing the Results of an Ad Hoc Scenario 159
n combined view
By default, SAS Inventory Optimization Workbench displays aggregated values in a combined view, which displays both the tabular format and the graphical format. The upper section of the Results by Facilities tab displays metric values in bar charts. The lower section displays the metric values in the tabular form.
n graphical format
SAS Inventory Optimization Workbench displays separate bar charts for each metric. Every bar chart displays metric values for the default set and for the sets that you created on the X-axis, and the metric values on the Y-axis. The bar charts display metric values for the facility that you select in the table.
n tabular format
SAS Inventory Optimization Workbench displays metric values for the current set and for the sets that you created in tabular format. Select a metric in the View results by list to view its values.
The facilities that are selected for the scenario are indicated by the icon.
View Results by Products
The Results by Products tab displays metric values by products. You can select a facility in order to view the metric values for all products in that facility. You can view the following metric values for a product:
n target service level
n target lead time
n demand
n order up-to level
n pipeline cost
n on-hand cost
n on-hand holding cost
n total cost
n unit cost
On the Results by Products tab, the left pane displays a list of all facilities and networks that are a part of the ad hoc scenario. Select a facility or network in order to view its products in the right pane. The right pane contains the View results by list and a table with the resulting values. The table contains a list of all products that are in the facility that you select in the left pane. The table also displays the product ID, the current aggregated metric value, and the optimized metric value for all sets that were created in the ad hoc scenario. The following table explains the fields in the table.
160 Chapter 24 / Performing an Ad Hoc Scenario Analysis

Table 24.2 Description of Fields on Results by Products Tab
Field Description
View result by
Select a metric value from the list to view its optimized value.
Product Name
The name of the product.
Product ID The unique identification of the product.
Current The current value for the metric that you selected in the View result by list.
Set The optimized value for the metric that you selected in the View result by list. SAS Inventory Optimization Workbench displays the optimized values for each set that you created in the ad hoc scenario. If the optimized metric value of any set is less than or greater than the specified threshold value, SAS Inventory Optimization Workbench displays an alert icon.
Obtaining Demand Data from SAS Forecast Analyst Workbench
About Obtaining Demand from SAS Forecast Analyst Workbench
You can obtain the baseline demand data for products and facilities that are included in the ad hoc scenario. You can obtain the demand data by creating a forecast, a plan, or a custom analysis in SAS Forecast Analyst Workbench. After you obtain the baseline demand from SAS Forecast Analyst Workbench, SAS Inventory Optimization Workbench creates a new set with that demand and other metrics information. You can compare the metrics of the new set with those of the existing sets for analysis.
Obtain Demand Data from SAS Forecast Analyst Workbench
The following prerequisites apply:
n SAS Forecast Analyst Workbench must be installed on your system.
n The ad hoc scenario must be in one of the following states: Executed, Executed (expired), Executed with errors, and Executed with errors (expired).
n You must have permissions in SAS Forecast Analyst Workbench to work on the products and locations that you select for the ad hoc scenario.
To obtain demand data from SAS Forecast Analyst Workbench:
Obtaining Demand Data from SAS Forecast Analyst Workbench 161

1 In the Inventory Performance workspace, click Scenarios. The Scenarios category appears.
2 Double-click an ad hoc scenario. SAS Inventory Optimization Workbench displays the results of the ad hoc scenario.
3 When you are viewing the results of the scenario, click . The Obtain Demand Data from SAS Forecast Analyst Workbench window appears.
4 Enter information in each field. The following table describes the fields.
Table 24.3 Description of Fields in the Obtain Demand Data from SAS Forecast Analyst Workbench Window
Field Description
Set name Enter a name for the set that is to be created for obtaining demand data from SAS Forecast Analyst Workbench. The demand results are imported into SAS Inventory Optimization Workbench.
If you create a forecast in SAS Forecast Analyst Workbench, SAS Inventory Optimization Workbench creates the set after the forecast has been created, diagnosed, and accepted in SAS Forecast Analyst Workbench.
If you create a plan in SAS Forecast Analyst Workbench, SAS Inventory Optimization Workbench creates the set after the plan is created and collaboration planning is performed on the plan in SAS Forecast Analyst Workbench.
Select existing set
Select an existing set from the list in order to copy the metrics information and to create a new set. SAS Inventory Optimization Workbench uses the metric information of the set that you selected and the demand that is predicted in SAS Forecast Analyst Workbench to create the new set. After the demand from SAS Forecast Analyst Workbench is imported into SAS Inventory Optimization Workbench, you can compare the metrics of new set with the existing sets for analysis.
Create a forecast
Select this option to create a forecast in SAS Forecast Analyst Workbench and then obtain demand from the forecast.
Create a custom analysis
Select this option to obtain demand that is generated by performing custom analysis in SAS Forecast Analyst Workbench.
Create a plan Select this option to obtain consensus demand from SAS Forecast Analyst Workbench.
Forecast name
Enter a name for the forecast. SAS Forecast Analyst Workbench creates the new forecast with the name that you entered. You must use this forecast to obtain demand in SAS Inventory Optimization Workbench. Based on the options that you selected in the previous fields, you can include this forecast in your plan or custom analysis.
Note: The forecast name must be unique and must be a valid SAS name. For more information about SAS naming conventions, see SAS Language Reference: Concepts.
Description Enter a short description for the forecast. The description can be a maximum of 255 characters.
162 Chapter 24 / Performing an Ad Hoc Scenario Analysis

Field Description
Diagnose forecast automatically
Select this check box to diagnose the forecast automatically in SAS Forecast Analyst Workbench.
Total products included
The total number of products that are included in the ad hoc scenario. SAS Forecast Analyst Workbench creates the forecast with the products that are included in the ad hoc scenario.
Total facilities included
The total number of facilities that are included in the ad hoc scenario. SAS Forecast Analyst Workbench creates the forecast with the facilities that are included in the ad hoc scenario.
5 Click OK. A confirmation message appears.
6 Click Close.
7 If you selected Create a plan, then you must complete the following steps in SAS Forecast Analyst Workbench:
a Create the plan in SAS Forecast Analyst Workbench, and include the forecast that you created.
b Complete the collaboration process manually on the plan in SAS Forecast Analyst Workbench, in order to obtain the demand in SAS Inventory Optimization Workbench.
8 If you selected Create a custom analysis, complete the following steps in SAS Forecast Analyst Workbench:
a Create a custom analysis based on the forecast.
Note: If you want to use three-stage modeling analysis to generate the predicted values, you must edit the forecast to include independent variables, and then generate predicted values.
b Complete the custom analysis process manually in SAS Forecast Analyst Workbench in order to obtain the demand in SAS Inventory Optimization Workbench.
The information is sent to SAS Forecast Analyst Workbench. Now, you must work in SAS Forecast Analyst Workbench to import the demand into SAS Inventory Optimization Workbench.
For more information, see SAS Forecast Analyst Workbench: User’s Guide and SAS Forecast Analyst Workbench: Administrator’s Guide.
Status of a Forecast While Obtaining Demand
When you create a forecast in SAS Forecast Analyst Workbench, SAS Inventory Optimization Workbench shows the status of the forecast. The status of the forecast is displayed beside the Refresh link in the results of the ad hoc scenario. Click Refresh to obtain the latest status of the forecast. If the status of the forecast in SAS Forecast Analyst Workbench is Accepted and you click Refresh in SAS Inventory Optimization Workbench, SAS Inventory Optimization Workbench imports the demand and creates a new set.
Obtaining Demand Data from SAS Forecast Analyst Workbench 163

The following table describes the possible statuses of the forecast that are displayed in SAS Inventory Optimization Workbench.
Table 24.4 Statuses of Forecast Displayed In SAS Inventory Optimization Workbench
Status Description
Scenario details are submitted for creating the forecast in SAS Forecast Analyst Workbench.
Scenario details have been submitted for creating the forecast in SAS Forecast Analyst Workbench. After the forecast is created, you can work on it in SAS Forecast Analyst Workbench.
Draft The forecast is being created, and the necessary information is being retrieved from the database.
Forecast is being created.
SAS Forecast Analyst Workbench is in the process of creating the analytical base tables (ABTs) for the forecast.
Forecast is created. The forecast is completely created in SAS Forecast Analyst Workbench and is ready for you to apply statistical models to it.
Diagnosing The forecasting process is generating the predicted values for the forecast in SAS Forecast Analyst Workbench.
Forecast is diagnosed. The predicted values are available for the forecast.
An error occurred in creating the forecast.
An error occurred while the forecast was being created.
Forecast is accepted. The statistical model has been applied to the forecast in SAS Forecast Analyst Workbench, and the predicted values are satisfactory.
Scheduled The forecast is scheduled to run periodically in batch mode in SAS Forecast Analyst Workbench.
Warning: Forecast is diagnosed with errors.
The forecast has been diagnosed, but at least one time series contains an error.
Forecast is being deleted.
The forecast is being deleted from SAS Forecast Analyst Workbench. After the forecast is deleted, you can create the forecast again through SAS Inventory Optimization Workbench. The button becomes available.
An error occurred in deleting the forecast.
An error occurred while the forecast was being deleted from SAS Forecast Analyst Workbench.
Forecast is being accepted.
The forecast is being accepted in SAS Forecast Analyst Workbench.
Refreshing the data for the forecast.
The data is being refreshed for the forecast in SAS Forecast Analyst Workbench.
Data of the forecast is imported.
After the forecast in SAS Forecast Analyst Workbench is accepted and you click Refresh in SAS Inventory Optimization Workbench, the forecast data is imported into SAS Inventory Optimization Workbench.
164 Chapter 24 / Performing an Ad Hoc Scenario Analysis

After the information from SAS Forecast Analyst Workbench is obtained, you can compare the metric values of the sets.
Note: You cannot edit the ad hoc scenario, which contains a set whose values are obtained from SAS Forecast Analyst Workbench.
Status of a Plan While Obtaining Demand
When you create a plan in SAS Forecast Analyst Workbench, SAS Inventory Optimization Workbench shows the status of the plan. The status is displayed beside the Refresh link in the results of the ad hoc scenario. Click Refresh to obtain the latest status of the forecast.
When the status of the forecast is Accepted and you click Refresh in SAS Inventory Optimization Workbench, the following outcomes are possible:
n If the collaboration planning process is in progress in SAS Forecast Analyst Workbench, SAS Inventory Optimization Workbench displays the status as Forecast is accepted. Complete the collaboration planning and close plan.
n If multiple plans are available for the forecast, SAS Inventory Optimization Workbench displays the status as Click Refresh to select a plan. Click the Refresh link that is beside the status so that you can select a plan in the Select a Plan window.
n If the status of the plan is Plan closed in SAS Forecast Analyst Workbench, SAS Inventory Optimization Workbench imports the demand and creates a new set.
Status of a Custom Analysis While Obtaining Demand
When you create a custom analysis in SAS Forecast Analyst Workbench, SAS Inventory Optimization Workbench shows the status of the custom analysis. The status is displayed beside the Refresh link in the results of the ad hoc scenario. Click Refresh to obtain the latest status of the forecast and custom analysis.
When the forecast is available in SAS Forecast Analyst Workbench and you click Refresh in SAS Inventory Optimization Workbench, the following outcomes are possible:
n If the process of custom analysis has not started in SAS Forecast Analyst Workbench, SAS Inventory Optimization Workbench displays the status as Forecast is available. Create the custom analysis and then complete the process in SAS Forecast Analyst Workbench.
n If the process of custom analysis is in progress in SAS Forecast Analyst Workbench, SAS Inventory Optimization Workbench displays the status as Forecast is available. Complete the custom analysis process in SAS Forecast Analyst Workbench.
n If the output of custom analysis is not in the format that is required by SAS Inventory Optimization Workbench, SAS Inventory Optimization Workbench displays the status as Output of the custom analysis does not contain required information for integration. In this case, ensure that the output of
Obtaining Demand Data from SAS Forecast Analyst Workbench 165

custom analysis can be consumed by SAS Inventory Optimization Workbench.
n If the there are multiple custom analyses available for the forecast, SAS Inventory Optimization Workbench displays the status as Click Refresh to select a custom analysis. Click the Refresh link that is beside the status to select an analysis in the Select an Analysis window.
n If the process of custom analysis is completed in SAS Forecast Analyst Workbench, SAS Inventory Optimization Workbench imports the demand and creates a new set.
Promote the Defined Values of a Set
After you compare the metric values of the current data and the sets that are created and you are satisfied with the results of any of the sets, you can promote the values of that set. By promoting the values of a set, you submit or promote the following values in order to use them in the next run of the optimization process:
n target service level
n target lead time
n product cost
SAS Inventory Optimization Workbench applies these values to the products and facilities that you selected in the scenario in the next run of the optimization process in order to analyze the inventory performance and suggest replenishment orders.
Note: When you promote the target service level, target lead time, and product cost of a set, SAS Inventory Optimization Workbench saves these values in the transactional database. These values must be loaded from the transactional database to stage. Contact your administrator about how to load the promoted values from the transactional database to stage in order to use them in the next run of the optimization process.
You can promote the ad hoc scenario set only once. You can view the promoted scenario, but you cannot make any changes to it. If you want to promote a set again, then you need to create a copy of the scenario, modify the settings, and then promote the set.
The following prerequisites apply:
n You must have permission to promote settings for the ad hoc scenario.
n The scenario must be in the Executed state.
To promote settings for ad hoc scenario:
1 In the Inventory Performance workspace, click Scenarios. The Scenarios category appears.
2 Double-click an ad hoc scenario. SAS Inventory Optimization Workbench displays the results of the ad hoc scenario.
3 When you are viewing the results of the scenario, click . The Promote window appears.
166 Chapter 24 / Performing an Ad Hoc Scenario Analysis
4 In the Scenario set to promote list, select a set, and click OK.
Note: SAS Inventory Optimization Workbench displays sets that are executed and that have produced results. SAS Inventory Optimization Workbench does not display sets that do not have results.
After you click OK, the state of the scenario changes to Promoting. After the scenario settings are completely promoted, the state of the scenario changes to Promoted. If an error occurs while the scenario settings are being promoted, the state of the scenario becomes Failed to promote.
After the scenario is promoted, the promoted values are stored in the SCENARIO_PROMOTED_VALUES table in the transactional database. Contact your administration in order to copy the promoted values to the STG_SCENARIO_PROMOTED_VALUES table in order to use them in the next run of the inventory optimization process.
Promote the Defined Values of a Set 167

168 Chapter 24 / Performing an Ad Hoc Scenario Analysis

25Performing an Optimization Override Scenario Analysis
About the Optimization Override Scenario . . . . . . . . . . . . . . . . . . . . . . . . . . . . . . . . . 169
Create an Optimization Override Scenario . . . . . . . . . . . . . . . . . . . . . . . . . . . . . . . . . 170
Viewing the Results of an Optimization Override Scenario . . . . . . . . . . . . . . . . . 171View Results of an Optimization Override Scenario . . . . . . . . . . . . . . . . . . . . . . . . 171
Edit and Reset Constraints . . . . . . . . . . . . . . . . . . . . . . . . . . . . . . . . . . . . . . . . . . . . . . . . 172
Evaluate the Optimization Values . . . . . . . . . . . . . . . . . . . . . . . . . . . . . . . . . . . . . . . . . . 172
View the Impact of Your Changes . . . . . . . . . . . . . . . . . . . . . . . . . . . . . . . . . . . . . . . . . . 173
Promote Constraints . . . . . . . . . . . . . . . . . . . . . . . . . . . . . . . . . . . . . . . . . . . . . . . . . . . . . . 173
About the Optimization Override Scenario
The optimization override scenario enables you to perform the following tasks:
n view the optimization values that SAS Inventory Optimization Workbench suggests for the selected products and facilities
n analyze different scenarios by modifying the constraint values, and then view the impact of these constraints on the up-stream nodes within the network
n promote the constraint values that are optimal for your business requirements
When you promote the constraint values, you can choose the number of periods for which you want to override the values.
Use the optimization override scenario when the optimized values are different from your business requirement. For example, suppose that after the current promotion is completed, the demand for product A (which is very costly) is going to be reduced for the next two months. However, SAS Inventory Optimization Workbench suggests a safety stock of 124 units of product A. In this case, you can analyze different scenarios by modifying the order up-to level for product A, and then overriding the optimization values so that the safety stock is 86 units for the next two months.
169

Create an Optimization Override Scenario
Create an optimization override scenario in order to analyze the optimization values for the selected products and facilities, and then override the optimization values that are suggested by SAS Inventory Optimization Workbench.
You must have permission to create an optimization override scenario.
To create an optimization override scenario:
1 In the Inventory Performance workspace, click Scenarios. The Scenarios category appears.
2 Click and then select Optimization Override Scenario. The Optimization Override Scenario page appears.
3 Enter information in each field. The following table describes the fields.
Table 25.1 Fields for the Optimization Override Scenario
Field Description
Name Enter a name for the scenario.
Note: This is a required field. The scenario name must be unique and must be a valid SAS name. For more information about SAS naming conventions, see SAS Language Reference: Concepts.
Description Enter a short description for the scenario. The description can be a maximum of 255 characters.
Scenario Products and Facilities
Products Select products for the scenario. To select products, click Select. The Products window appears.
In the Products window, the icon indicates that the product is a combined product.
Note: This is a required field.
Facilities Select facilities for the scenario. To select facilities, click Select. The Facilities window appears.
Note: This is a required field.
Note: You can select only customer-facing facilities.
Scenario Settings
170 Chapter 25 / Performing an Optimization Override Scenario Analysis

Field Description
Select start date
Select the start date of the period from the list. This is the start date of the period for which you want to analyze the optimization values and possibly override them.
SAS Inventory Optimization Workbench displays the dates based on the periodicity that the administrator has specified for running the inventory optimization process. If the inventory optimization process runs weekly, the Select start date field displays all future dates on which the optimization process is going to run.
Select end date Select the end date of the period from the list. This is the end date of the period for which you want to analyze the optimization values and possibly override them.
SAS Inventory Optimization Workbench displays all future end dates based on the start date that you selected and the periodicity of the inventory optimization process.
For example, suppose the periodicity is weekly and you selected the start date 05May2014. In this case, the Select end date field displays the following end dates: 12May2014, 19May2014, 26May2014, and 02Jun2014.
Number of optimization runs to override
Displays the optimization runs for which you want to override values. SAS Inventory Optimization Workbench uses the inventory optimization values that you override for this number of optimization runs.
4 Select one of the following run options:
n Select the Save and Run option, and then click Save and Run to save the scenario settings and run the scenario to view results.
n Select the Save only option, and then click Save only to save the scenario settings. If you select this option, the scenario is not run.
Viewing the Results of an Optimization Override Scenario
View Results of an Optimization Override Scenario
You can view the metrics for the selected products and facilities. You can also view the impact of the constraints on the selected products and facilities after you have modified the constraints.
The following prerequisites apply:
n You must have permission to view the results of an optimization override scenario.
n The scenario must be in one of the following statuses: Executed, Executed with errors, Executed with errors (expired), Promoted, Failed to promote, or Failed to promote (expired).
Viewing the Results of an Optimization Override Scenario 171

To view the results of the optimization override scenario:
1 In the Inventory Performance workspace, click Scenarios. The Scenarios category displays a list of all scenarios.
2 Double-click an optimization override scenario.
SAS Inventory Optimization Workbench opens a view in which you can view the results of the selected optimization override scenario. SAS Inventory Optimization Workbench displays a list of facilities in the left pane and the products that are in the facility in the right pane, along with the constraint values.
The facilities that are selected for the scenario are indicated by the icon .
Edit and Reset Constraints
Edit the constraints to analyze different scenarios and to use the constraints that are most suitable for your business requirements. If the edited constraints are not satisfactory, you can reset the constraints in order to retain the last evaluated values.
To edit and reset the constraints:
1 In the Inventory Performance workspace, click Scenarios. The Scenarios category appears.
2 Double-click an optimization override scenario. SAS Inventory Optimization Workbench opens a view in which you can view the results of the selected optimization override scenario.
3 Select a facility and product, and click . The Edit Constraints window appears.
4 Edit the Edit order up to level value.
As you edit the order up-to level, the reorder up-to level and the safety stock values also change for the selected product.
5 Click OK.
SAS Inventory Optimization Workbench displays the edited values of order up-to-level, reorder up-to-level, and safety stock.
6 If the edited constraint values are not satisfactory, click to reset the constraints.
After you edit the constraint values, you must evaluate the scenario in order to view the changes. For more information about evaluating the optimization values, see “Evaluate the Optimization Values” on page 172.
Evaluate the Optimization Values
After you modify the constraints in the optimization scenario, you must evaluate the scenario. SAS Inventory Optimization Workbench runs the inventory
172 Chapter 25 / Performing an Optimization Override Scenario Analysis

optimization process in order to use the constraint values and to generate the optimization values for all products and facilities within the network.
To evaluate the optimization values:
n When you are viewing the results of an optimization override scenario, click .
For more information about viewing the results of an optimization override scenario, see “View Results of an Optimization Override Scenario” on page 171.
After the evaluation has completed, the status of the scenario becomes Evaluated.
View the Impact of Your Changes
You can view the impact of the constraints that you modified for the selected product and facilities. SAS Inventory Optimization Workbench also displays the impact on the upstream nodes within the network.
To view the impact, when you are viewing the results of the optimization override
scenario, click .
The View Impact window appears and displays the impact of the constraints on all the products and facilities that are within the network.
Promote Constraints
Promote the constraints if they meet your business requirements. SAS Inventory Optimization Workbench uses the constraint values in the next run of the inventory optimization process and then generates the metrics. SAS Inventory Optimization Workbench uses the specified constraint values for the number of inventory optimization runs that you selected when you created the optimization override scenario.
To promote the constraints:
1 When you are viewing the results of the optimization override scenario, click . A confirmation message appears.
2 Click OK.
The state of the scenario changes to Promoting. After the scenario settings are completely promoted, the state of the scenario changes to Promoted. If an error occurs during the promotion process, the state of the scenario becomes Failed to promote.
After the scenario is promoted, the promoted values are stored in the SCENARIO_OPT_OVERRIDE_PARAMS table in the transactional database. Contact your administration in order to copy the promoted values to the STG_SCENARIO_OPT_OVERRIDE_PARAMS table in order to use them for the defined runs of the inventory optimization process.
Promote Constraints 173

174 Chapter 25 / Performing an Optimization Override Scenario Analysis

26Working with a Scenario
Edit a Scenario . . . . . . . . . . . . . . . . . . . . . . . . . . . . . . . . . . . . . . . . . . . . . . . . . . . . . . . . . . . . 175
Delete a Scenario . . . . . . . . . . . . . . . . . . . . . . . . . . . . . . . . . . . . . . . . . . . . . . . . . . . . . . . . . . 176
Create a Copy of a Scenario . . . . . . . . . . . . . . . . . . . . . . . . . . . . . . . . . . . . . . . . . . . . . . . 176
Run a Scenario . . . . . . . . . . . . . . . . . . . . . . . . . . . . . . . . . . . . . . . . . . . . . . . . . . . . . . . . . . . . 177
View Messages . . . . . . . . . . . . . . . . . . . . . . . . . . . . . . . . . . . . . . . . . . . . . . . . . . . . . . . . . . . . 177
Edit a Scenario
If you are not satisfied with the results of an existing scenario, then you might want to modify the settings of that scenario and save the new values. The scenario is processed again with the new values.
Note: You cannot edit an ad hoc scenario that contains a set whose values are obtained from SAS Forecast Analyst Workbench.
The following prerequisites apply:
n You must have permission to edit a scenario.
n The scenario must be in one of the following states: Created, Executed, Executed (expired), Executed with errors, Executed with errors (expired), and Failed.
To edit a scenario:
1 In the Inventory Performance workspace, click Scenarios. The Scenarios category appears.
2 Select a scenario, and click . The Edit Scenario page appears and displays the current settings of the scenario.
3 Edit the scenario options that you want to change.
For more information about fields of the internal facility scenario, see Table 22.1 on page 138.
For more information about fields of the customer-facing facility scenario, see Table 23.1 on page 146.
For more information about fields of the ad hoc scenario, see Table 24.1 on page 157.
175

4 Select one of the following run options:
n Select the Save and Run option, and then click Save and Run to save the scenario settings and run the scenario to view results.
n Select the Save only option, and then click Save only to save the scenario settings. If you select this option, the scenario is not run.
Delete a Scenario
If you do not want to use a scenario or its results, you can delete the scenario. You can delete a scenario that is in any of the statuses.
You must have permission to delete a scenario.
To delete a scenario
1 In the Inventory Performance workspace, click Scenarios. The Scenarios category appears.
2 Select a scenario, and click . A confirmation message appears.
Note: Press and hold Ctrl key to select multiple scenarios.
3 Click OK.
The scenario is deleted.
Note: When you delete an ad hoc scenario, the forecast (if any) that is associated with the ad hoc scenario in SAS Forecast Analyst Workbench is also deleted.
Create a Copy of a Scenario
You can create a copy of an existing scenario. A new scenario that consists of the same settings as the original scenario is created. You can then modify or retain the existing scenario settings. If you want to modify the settings of a scenario that is already promoted, you can create a copy of it and then make the necessary changes in the copied scenario. You can create a copy of the scenario that is in any of the statuses.
When you are copying an ad hoc scenario, the set that was obtained from SAS Forecast Analyst Workbench is not copied into the new scenario.
You must have permission to create a copy of the scenario.
To create a copy of a scenario:
1 In the Inventory Performance workspace, click Scenarios. The Scenarios category appears.
2 In the Scenarios category, select a scenario, and click . The Copy Scenario window appears.
3 Enter a name for the scenario.
176 Chapter 26 / Working with a Scenario

Note: The scenario name must be unique and must be a valid SAS name. For more information about SAS naming conventions, see SAS Language Reference: Concepts.
4 Click OK.
The scenario is created and is in the Created state.
Run a Scenario
You can run a scenario to calculate and optimize the scenario results with latest input values.
The following prerequisites apply:
n You must have permission to run a scenario.
n The scenario must be in one of the following states: Created, Executed, Executed (expired), Executed with errors, Executed with errors (expired), Promoted (expired), or Failed to promote (expired).
To run a scenario:
1 In the Inventory Performance workspace, click Scenarios. The Scenarios category appears.
2 Select a scenario, and click .
SAS Inventory Optimization Workbench begins to run the scenario and changes the state of the scenario to Executing.
View Messages
You can view the following types of messages in SAS Inventory Optimization Workbench:
n notes
n errors
n warnings
You can view global messages and detailed messages. Global messages contain information at the scenario level. Detailed messages contain information at the product and facility combination level.
You must have permission to view the messages.
To view messages:
1 In the Inventory Performance workspace, click Scenarios. The Scenarios category appears.
2 In the Scenarios category, select the scenario and click . The Messages window appears with two tabs — global messages and detailed messages.
The following table explains the fields in the Messages window.
View Messages 177

Field Description
Global Messages
The messages that are applicable at the scenario level. You can read the content of the message and take appropriate action to proceed.
Example: ERROR: Data is not available for the selected combination. Select valid combinations for facilities and products in the scenario.
Detailed Messages
The messages that are applicable for the product-facility combination pair.
Facility ID The unique identification for the facility.
Facility Name The name of the facility for which the message is shown.
Product ID The unique identification for product.
Product Name The name of the product for which the message is shown.
Optimization Process
The process during which the message occurred for the product-facility combination, or the name of the set in the ad hoc scenario for which the message occurred.
For example, SAS Inventory Optimization Workbench displays Optimized if the message is occurred during optimization.
For an internal facility scenario, the message can occur in one of the following processes:n Current: Indicates that the message occurred for the current
scenario values. The scenario has not yet run to generate the optimized values.
n Optimized: Indicates that the message occurred during optimization.
n Recalculated: Indicates that the message occurred during recalculation.
For a customer-facing facility scenario, the message can occur in one of the following processes:n Current: Indicates that the message occurred for the current
scenario values. The scenario has not yet run to generate the optimized values.
n Optimized: Indicates that the message occurred during optimization.
n Recalculated: Indicates that the message occurred during recalculation.
n Rerun Optimization: Indicates that the message occurred when you ignored the minimum service level constraint, applied the budget, and ran the optimization process.
Data Set The name of the SAS data set.
178 Chapter 26 / Working with a Scenario

Field Description
Total messages
The contents of the message. This section displays the following types of messages and its content:n Notesn Warningsn Errors
You can read the content of the message and take appropriate action.
Example: ERROR: Missing value is found at HOLDINGCOST.
View Messages 179

180 Chapter 26 / Working with a Scenario

Part 6
Generating Reports
Chapter 27Working with Reports . . . . . . . . . . . . . . . . . . . . . . . . . . . . . . . . . . . . . . . . . . . . 183
181

182

27Working with Reports
About Reports . . . . . . . . . . . . . . . . . . . . . . . . . . . . . . . . . . . . . . . . . . . . . . . . . . . . . . . . . . . . . 183
Understanding the Reports Workspace . . . . . . . . . . . . . . . . . . . . . . . . . . . . . . . . . . . . 183About the Reports Workspace . . . . . . . . . . . . . . . . . . . . . . . . . . . . . . . . . . . . . . . . . . . . 183The Toolbar in the Reports Workspace . . . . . . . . . . . . . . . . . . . . . . . . . . . . . . . . . . . . 184Properties Pane . . . . . . . . . . . . . . . . . . . . . . . . . . . . . . . . . . . . . . . . . . . . . . . . . . . . . . . . . 184
View a Report . . . . . . . . . . . . . . . . . . . . . . . . . . . . . . . . . . . . . . . . . . . . . . . . . . . . . . . . . . . . . 184
Create a Report . . . . . . . . . . . . . . . . . . . . . . . . . . . . . . . . . . . . . . . . . . . . . . . . . . . . . . . . . . . . 185
About Reports
With SAS Inventory Optimization Workbench, you can generate reports in order to analyze vital business information. SAS Inventory Optimization Workbench is tightly integrated with SAS Visual Analytics and SAS Web Report Studio to perform report-related tasks.
In the Reports workspace, you can perform the following tasks:
n view a report
n create a report
n search for a report
n refresh reports
Understanding the Reports Workspace
About the Reports Workspace
Use the Reports workspace to create and view business reports.
The Reports workspace contains a toolbar, a table that lists all reports, and a properties pane. The table in the Reports workspace displays the following information:
n name of the report
n description of the report
183

n date on which the report was created
The Toolbar in the Reports Workspace
The toolbar contains the following buttons:
Table 27.1 Buttons in the Reports Workspace
Button Description
Click this button and then select one of the following options to create a business report:n Create Report in SAS Visual Analyticsn Create Report in SAS Web Report StudioWhen you select an option, the browser opens either SAS Visual Analytics Designer or SAS Web Report Studio on a separate tab.
For more information, see SAS Visual Analytics: User’s Guide or SAS Web Report Studio: User’s Guide.
Click this button to refresh the reports that are available in the workspace.
Click this button to export the list of reports to Microsoft Excel. SAS Inventory Optimization Workbench exports the name of each report, its description, and the date on which the report was created.
Properties Pane
The Properties pane in the Reports workspace contains the properties of the selected report.
The following properties of the selected reports are displayed:
n name and description of the report
n name of the application in which the report was created (SAS Visual Analytics or SAS Web Report Studio)
n location of the report
n date on which the report was created
n date on which the report was last modified
View a Report
You can view a report that was created in SAS Visual Analytics in SAS Visual Analytics Viewer. You can view a report that was created in SAS Web Report Studio in SAS Web Report Studio.
While you are viewing a report in SAS Visual Analytics, you can edit it if you have the required permission.
184 Chapter 27 / Working with Reports

You must have permission to view a report.
To view a report:
n In the Reports workspace, double-click a report. Alternatively, select a report, and click Open.
Create a Report
You can create a report in order to understand and analyze vital business information.
You must have permission to create a report.
To create a report:
1 In the Reports workspace, click , and then select one of the following options:
n Create Report in SAS Web Report Studio
n Create Report in SAS Visual Analytics
2 Specify the report criteria, and click OK.
For more information, see SAS Web Report Studio: User’s Guide or SAS Visual Analytics: User’s Guide.
Create a Report 185

186 Chapter 27 / Working with Reports

Recommended Readingn SAS Inventory Optimization Workbench 5.3: Administrator’s Guide
n SAS Inventory Optimization Workbench 5.3: Data Reference Guide
n SAS Forecast Analyst Workbench 5.3: User’s Guide
n SAS Forecast Analyst Workbench 5.3: Administrator’s Guide
n SAS Demand Classification and Clustering 6.1: User's Guide
n Demand-Driven Inventory Optimization and Replenishment
For a complete list of SAS publications, go to sas.com/store/books. If you have questions about which titles you need, please contact a SAS Representative:
SAS BooksSAS Campus DriveCary, NC 27513-2414Phone: 1-800-727-0025Fax: 1-919-677-4444Email: [email protected] address: sas.com/store/books
187

188 Recommended Reading

Glossaryactual demand
the number of orders that are received over the period under consideration for a facility and item pair.
base periodthe interval of time in which one inventory replenishment order is allowed.
dimensiona data element that categorizes values in a data set into non-overlapping categories that can be used to group, filter, and label the data in meaningful ways. Hierarchies within a dimension typically represent different groupings of information that pertains to a single concept. For example, a Time dimension might consist of two hierarchies: (1) Year, Month, and Date, and (2) Year, Week, and Day.
facility-and-item paira unit for inventory analysis that consists of a particular item together with its facility.
fill ratea service measure that indicates the fraction of demand that is satisfied from on-hand inventory.
fixed ordering costthe predetermined cost that is incurred each time a replenishment order is placed. This cost includes the expense that is associated with processing an order and is usually independent of the size of the order.
internal transfer orderthe order or demand that is placed by the facilities. Demand from the end customers is not considered.
inventory turnsthe ratio of the total cost of items that are sold to the average inventory units of the items, over a given period.
inventory unitsthe quantity of items in the inventory.
item inceptiona value that indicates whether the item is in-house or bought out.
MAPESee mean absolute percent error
mean absolute percent errorthe average of the absolute percentage errors. Short form: MAPE.
189

multi-echelon networkthe distribution network that has at least one facility and item pair with more than one echelon level. The echelon level of a facility and item pair represents its relative position in a network. The echelon level of a pair is equal to the maximum echelon level of all its successor facility and item pairs plus one. If a facility and item pair does not have successors, its echelon level is one.
order-up-to levelthe target inventory level.
pipeline costthe per unit per period cost of transportation of an item.
planning horizonthe number of periods into the future for which predictions are made.
ready ratethe probability that the on-hand inventory level at the end of a review time period is positive.
reorder levelthe inventory level at which a replenishment order should be placed.
replenishment policya set of guidelines that determine the quantities for orders that are placed to restock inventory.
service levela measure of the fulfillment of customer demand.
solution data layeran intermediate layer of tables provided by the solution to save the customer source data in the required manner.
transshipmentthe transfer of goods or items between facilities to rebalance the inventory or to prepare for a shortage in the primary or normal source of supply.
190 Glossary

Index
A
ad hoc scenarioscreate 156overview 155promote 166
addbase orders 68
alert settingsmanage 37modify 37overview 37view 37
auto-replenishment settings 74
B
base ordersadd 68cancel 71delete 70edit 65evaluate 69guidelines 45monitor for a facility 59monitor for a product 54monitor for a product and a facility
62monitor for all facilities 57monitor for all products 52promote 77reset 71split 67workflow 43
C
cancelbase orders 71promotional order for vendor 101
capabilities 9copy
set 157create
ad hoc scenario 156customer-facing facility scenario
146forecast 161internal facility scenario 138optimization override scenario 170reports 185set 157
customer-facing facility scenarioscreate 146overview 145promote 152re-optimize 149recalculate 150
D
deletebase orders 70set 157
E
editbase orders 65order quantity 66order quantity for a promotional
order 95order quantity for vendor 93promotional order at customer-
facing facility 112transfer mode 66
evaluatebase orders 69optimization override scenario 172
F
fill rate 23
191

G
guidelinesfor base orders 45for promotional orders 81
I
input indicators 23internal facility scenarios
create 138overview 137promote 142recalculate 141
inventory optimization processautomatic mode 5interactive mode 5
inventory performanceanalyze by facilities 35analyze for a product across
facilities 30analyze for a product and a facility
combination 32analyze for all products 29analyze for all products in a facility
36overview 27, 33
Inventory Performance workspacecapabilities of 25features of 23introduction 23
inventory quantity 23inventory turns 23
K
key performance indicators 23KPIs
See key performance indicators
L
lockbase orders 73promotional order for vendor 99promotional orders 115
logging off 10logging on 10
M
managealert settings 37
metricsthresholds for 37
minimum service level 150
N
networksingle-echelon 83two-echelon network 82
O
optimization override scenarioscreate 169, 170edit constraints 172evaluate 172promote 173
order quantityadjust for other facilities of vendor
96adjust for vendor 96
ordersbase orders 41promotional orders 81
output indicators 23overview
of ad hoc scenario 155of customer-facing facility scenario
145of internal facility scenario 137of optimization override scenario
169of reports 183of scenarios 123
P
promotead hoc scenario 166base orders 77customer-facing facility scenario
152internal facility scenario 142optimization override scenario 173promotional order for vendors 119promotional orders at customer-
facing facility 120
192 Index

promotional orderscancel 101edit 93, 95, 112finalize for customer-facing facilities
83finalize for vendors 83, 84guidelines 81in single-echelon network 83in two-echelon network 82lock 99, 115monitor for vendors 86promote 119, 120review for customer-facing facilities
83review for vendors 82, 84unlock 100, 117
R
re-optimizecustomer-facing facility scenario
149ready rate 23recalculate
customer-facing facility scenario150
internal facility scenario 141replenishment type
incomplete 42partial 42primary and alternate source 42primary source 42
reportscreate 185overview 183view 184
resetbase orders 71
roles 9
S
safety stock 23SAS Demand-Driven Planning and
Optimization suite 3SAS Forecast Analyst Workbench
161
scenarioscopy 176delete 176edit 175overview 123run 177view messages 177workflow 127
service level types 23solution
benefits of 4overview 3working of 5
statusesof base orders 42of scenarios 124
substitute product 67
U
unlockbase orders 73promotional order for vendor 100promotional orders 117
V
vendors 88view
details of a promotional order at customer-facing facility 112
facilities present in a promotional order 94
history of promotional orders 104impact of constraints 173impact of edited promotional order
97report 184stores 106
W
workflowof scenarios 127
Index 193

194 Index

