saroc, 16 may 2007 martin small director road safety department for transport, energy and...
TRANSCRIPT

SAROC, 16 May 2007
Martin Small
Director Road Safety
Department for Transport, Energy and Infrastructure
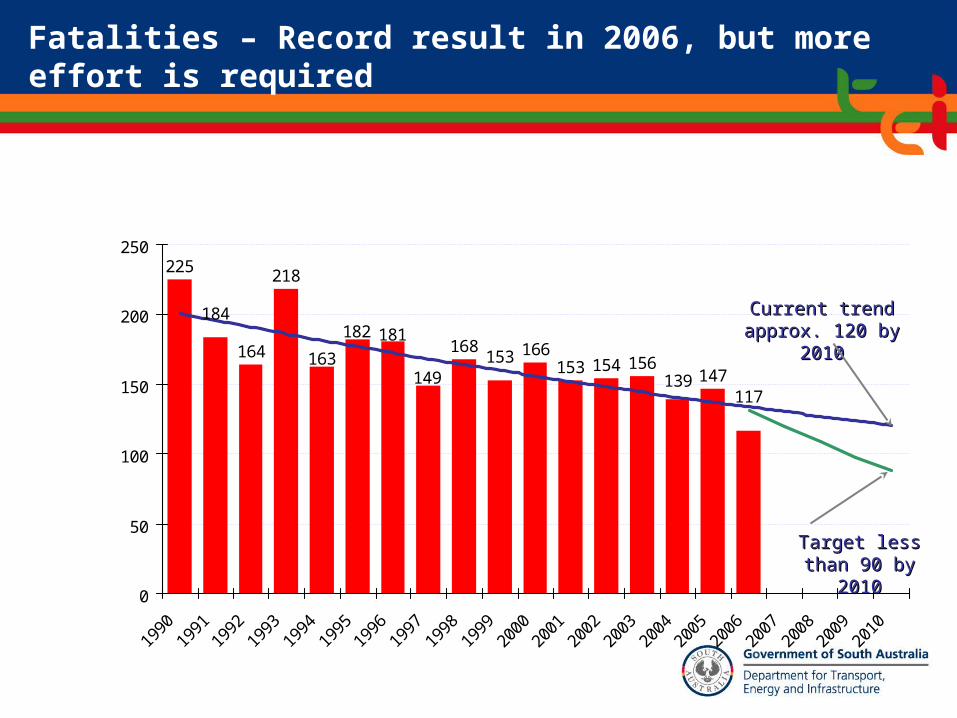
225
164
218
168 166153 154 156
147117
139149
181182
163
184
153
0
50
100
150
200
250
1990
1991
1992
1993
1994
1995
1996
1997
1998
1999
2000
2001
2002
2003
2004
2005
2006
2007
2008
2009
2010
Nu
mb
er o
f N
um
ber
of
fata
liti
esfa
tali
ties
Current trend Current trend approx. 120 by approx. 120 by
20102010
Target less than Target less than 90 by 201090 by 2010
Fatalities – Record result in 2006, but more effort is required

2058
17201566 16081600 1605 1538 1468
1294 1349
2397
16001549 15141521
15091326
0
500
1000
1500
2000
2500
3000
1990
1991
1992
1993
1994
1995
1996
1997
1998
1999
2000
2001
2002
2003
2004
2005
2006
2007
2008
2009
2010
Num
ber
Num
ber
of of
seri
ou
s se
riou
s in
juri
es
inju
ries
Current trend Current trend approx. 1200 by approx. 1200 by
20102010
Target less than Target less than 1000 by 20101000 by 2010
Serious Injuries – Good progress overall, but more effort is required

Australia’s Safe System

Fa
tality risk
%
0
10
20
30
40
50
60
70
80
90
100
0 10 20 30 40 50 60 70 80 90 100 110 120 130
Collision speed km/h
0
10
20
30
40
50
60
70
80
90
100
0 10 20 30 40 50 60 70 80 90 100 110 120 130
Collision speed km/h
Fa
tality risk
%
Fatality Risk for Head-onor Fixed Object Crash
Human Tolerance to Physical Force (Rural)
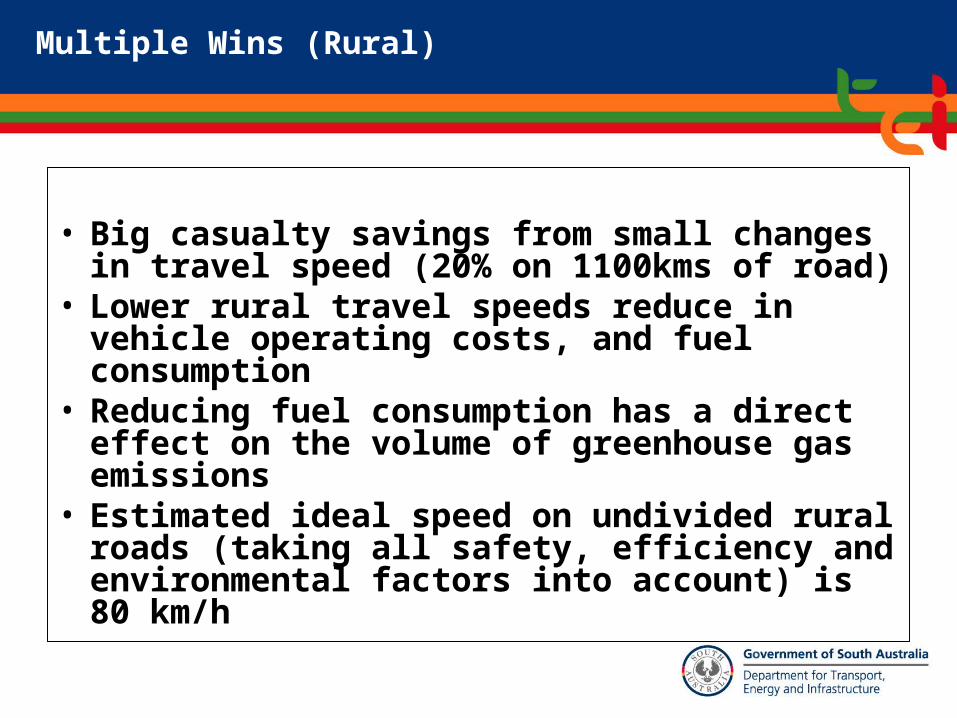
• Big casualty savings from small changes in travel speed (20% on 1100kms of road)
• Lower rural travel speeds reduce in vehicle operating costs, and fuel consumption
• Reducing fuel consumption has a direct effect on the volume of greenhouse gas emissions
• Estimated ideal speed on undivided rural roads (taking all safety, efficiency and environmental factors into account) is 80 km/h
Multiple Wins (Rural)

Fa
tality risk
%
0
10
20
30
40
50
60
70
80
90
100
0 10 20 30 40 50 60 70 80 90 100 110 120 130Collision speed km/h
0
10
20
30
40
50
60
70
80
90
100
0 10 20 30 40 50 60 70 80 90 100 110 120 130Collision speed km/h
Fa
tality risk
%
Fatality Risk for Pedestrian Crash
Human Tolerance to Physical Force (Urban)

Distribution of Vehicle Speed
No. o
f Veh
icle
s
2002 52 km/h
200548 km/h Fewer @
extreme speeds
More @ slower speeds
4 km/h difference = 23% casualty crash reduction
Results of 50km/h Default Urban Change
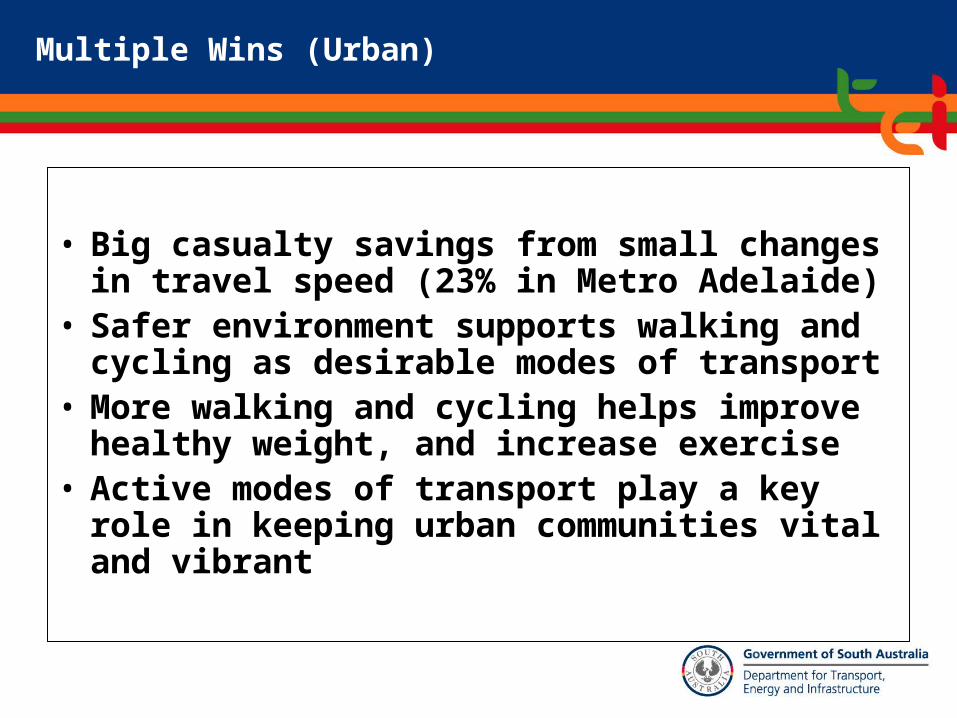
• Big casualty savings from small changes in travel speed (23% in Metro Adelaide)
• Safer environment supports walking and cycling as desirable modes of transport
• More walking and cycling helps improve healthy weight, and increase exercise
• Active modes of transport play a key role in keeping urban communities vital and vibrant
Multiple Wins (Urban)

Fatalities and serious injuries by area, 2002-2006
Region Fatalities Serious InjuriesTotal serious
casualties
Central Local Government Region
106 915 1021
Eyre Peninsula LGA 24 210 234
Murray and Mallee LGA
79 634 713
Southern and Hills LGA
99 795 894
South East LGA 69 466 535
Spencer Gulf Cities 17 250 267
Total rural 394 3270 3664
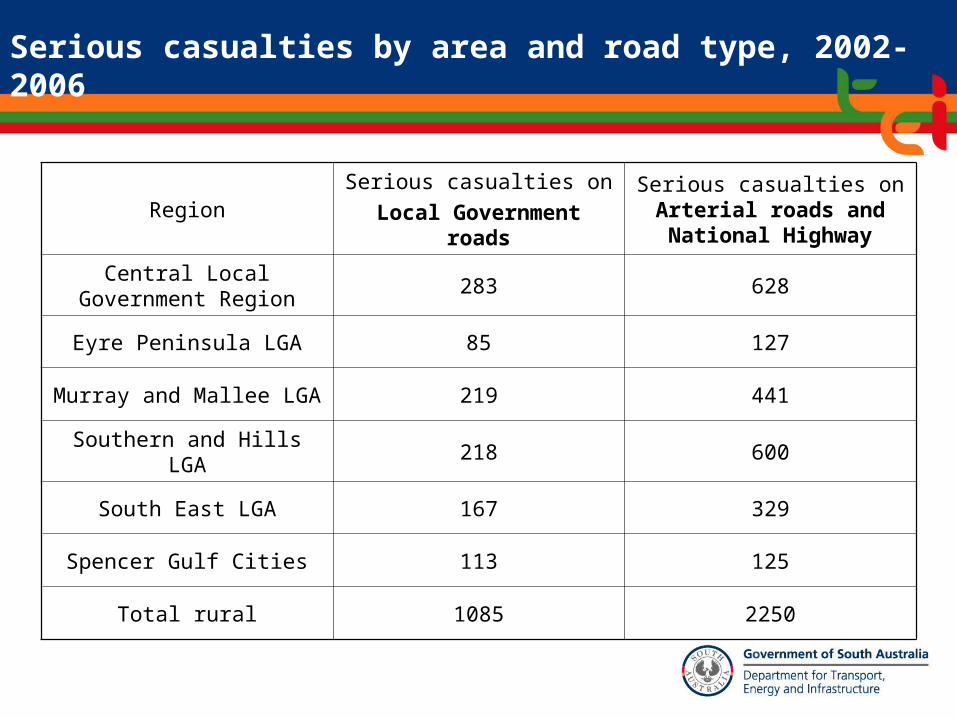
Serious casualties by area and road type, 2002-2006
RegionSerious casualties on
Local Government roads
Serious casualties on Arterial roads and National
Highway
Central Local Government Region
283 628
Eyre Peninsula LGA 85 127
Murray and Mallee LGA 219 441
Southern and Hills LGA 218 600
South East LGA 167 329
Spencer Gulf Cities 113 125
Total rural 1085 2250
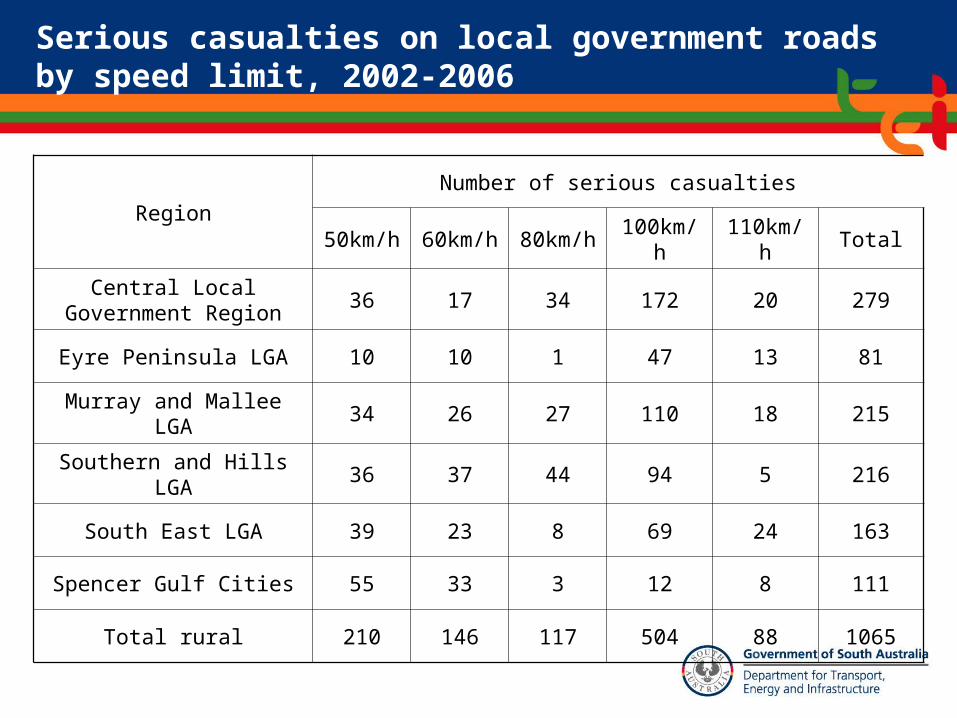
Serious casualties on local government roads by speed limit, 2002-2006
RegionNumber of serious casualties
50km/h 60km/h 80km/h 100km/h 110km/h Total
Central Local Government Region
36 17 34 172 20 279
Eyre Peninsula LGA 10 10 1 47 13 81
Murray and Mallee LGA 34 26 27 110 18 215
Southern and Hills LGA 36 37 44 94 5 216
South East LGA 39 23 8 69 24 163
Spencer Gulf Cities 55 33 3 12 8 111
Total rural 210 146 117 504 88 1065

Serious casualties on arterial roads by speed limit,2002-2006
RegionNumber of serious casualties
50km/h 60km/h 80km/h 100km/h 110km/h Total
Central Local Government Region
18 36 50 127 390 621
Eyre Peninsula LGA 2 5 6 8 106 127
Murray and Mallee LGA 13 37 24 70 280 424
Southern and Hills LGA 17 97 154 265 63 596
South East LGA 18 42 16 37 214 327
Spencer Gulf Cities 11 52 5 2 55 125
Total rural 79 269 255 509 1108 2220

Serious crash types in rural areas, 2002-2006
1156
665
321
216
125 109 105 10445 36 33 15
0
200
400
600
800
1000
1200
Number of fatal and serious crashes

BAC of driver and rider fatalities in rural areas, 2003-2006
0.15 or above26%
0.08-0.1499%
0.05-0.0792%
Zero or below 0.0563%
47 drivers and riders killed per year in 47 drivers and riders killed per year in rural areas are tested for BAC levelsrural areas are tested for BAC levels
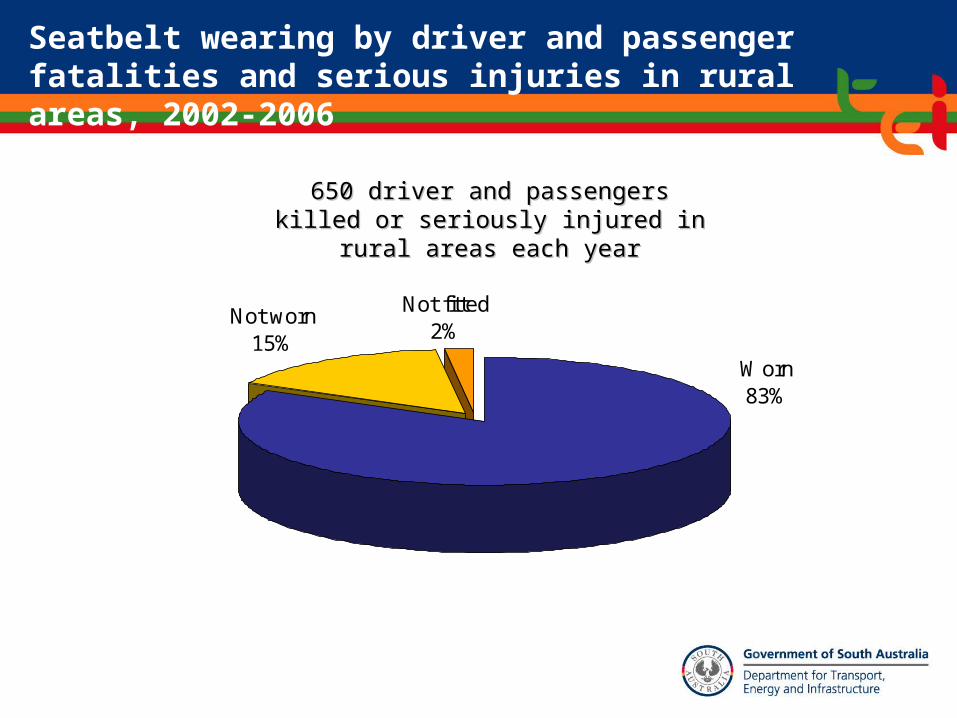
Seatbelt wearing by driver and passenger fatalities and serious injuries in rural areas, 2002-2006
Not worn15%
Not fitted2%
Worn83%
650 driver and passengers killed or 650 driver and passengers killed or seriously injured in rural areas each yearseriously injured in rural areas each year

Average Average number of number of
fatalities 2003-fatalities 2003-20052005
Population Population sizesize
Average fatality rate Average fatality rate per 100,000 per 100,000 populationpopulation
Adelaide metropolitanAdelaide metropolitan 6060 1,128,7441,128,744 5.315.31
South EastSouth East 1515 63,00063,000 23.323.3
Mid North and Yorke Mid North and Yorke PeninsulaPeninsula 1717 113,640113,640 15.315.3
Eyre PeninsulaEyre Peninsula 66 33,70033,700 18.818.8
Riverland and MurraylandRiverland and Murrayland 1414 68,45068,450 20.920.9
Spencer Gulf and Far NorthSpencer Gulf and Far North 88 46,74546,745 17.817.8
Adelaide Hills, Fleurieu and Adelaide Hills, Fleurieu and Kangaroo IslandKangaroo Island 2121 103,290103,290 20.320.3
Rural South Australia TotalRural South Australia Total 8787 428,875428,875 20.320.3
Regional Fatality Rates
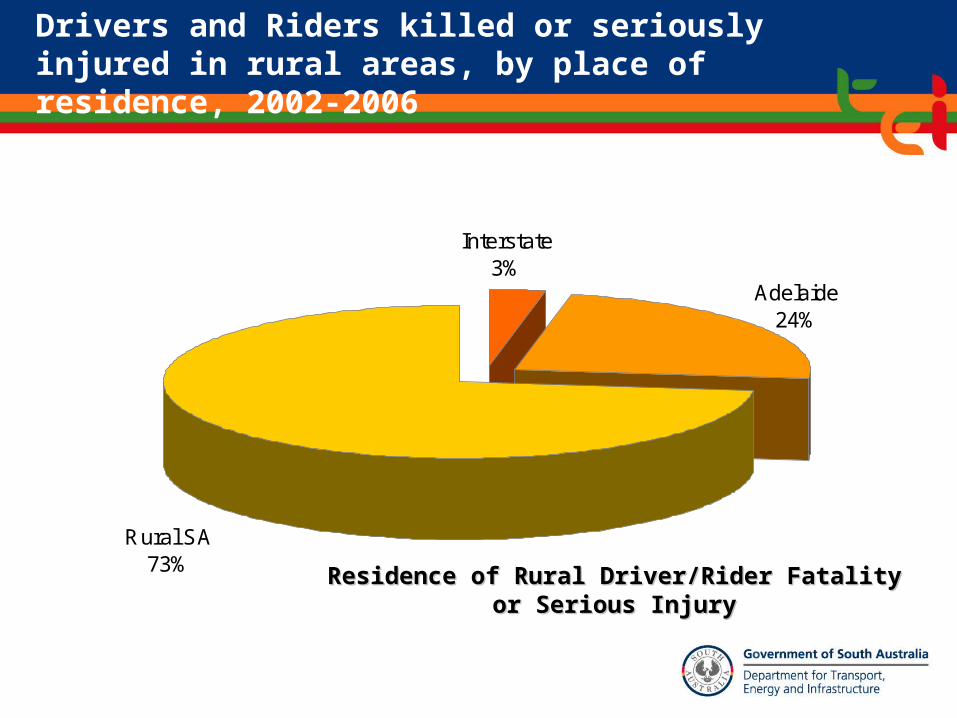
Drivers and Riders killed or seriously injured in rural areas, by place of residence, 2002-2006
Adelaide24%
Rural SA73%
Interstate3%
Residence of Rural Driver/Rider Fatality or Residence of Rural Driver/Rider Fatality or Serious InjurySerious Injury
• Local Government has a big stake in road safety
• As major network operators
• As community leaders
• As good corporates and employers– Safety of infrastructure– Safety of vehicle fleet– Safe of community
Local government and road safety
• Maintaining and/or developing strong relationships and partnerships
• Engaging communities on the issues they face, and providing professional analysis of those issues
• Building voluntary commitments to change from communities, the business sector, professions etc
How do we work together?