sarcophagid larvae and their relationship with the
TRANSCRIPT

LARVAE OF SARCOPHAGIDAE (INSECTA: DIPTERA) AND
THEIR RELATIONSHIP WITH THE PITCHER PLANTS
(SARRACENIACEAE: SARRACENIA) OF
SOUTHEASTERN U.S. BOGS
Except where reference is made to the work of others, the work described in this thesis is my own or was done in collaboration with my advisory committee. This thesis does not
include proprietary or classified information.
_________________________________________ Angela Marie Spano Underwood
Certificate of Approval: _________________________ Wayne E. Clark Professor Entomology _________________________ Robert Lishak Associate Professor Biological Sciences
_________________________ Debbie R. Folkerts, Chair Assistant Professor Biological Sciences
_________________________ George Flowers Acting Dean Graduate School

LARVAE OF SARCOPHAGIDAE (INSECTA: DIPTERA) AND
THEIR RELATIONSHIP WITH THE PITCHER PLANTS
(SARRACENIACEAE: SARRACENIA) OF
SOUTHEASTERN U.S. BOGS
Angela Marie Spano Underwood
A Thesis
Submitted to
the Graduate Faculty of
Auburn University
in Partial Fulfillment of the
Requirements for the
Degree of
Master of Science
Auburn, Alabama December 18, 2009

iii
LARVAE OF SARCOPHAGIDAE (INSECTA: DIPTERA) AND
THEIR RELATIONSHIP WITH THE PITCHER PLANTS
(SARRACENIACEAE: SARRACENIA) OF
SOUTHEASTERN U.S. BOGS
Angela Marie Spano Underwood
Permission is granted to Auburn University to make copies of this thesis at its discretion, upon request of individuals or institutions and at their expense. The author reserves all
publication rights.
______________________________ Signature of Author
______________________________ Date of Graduation

iv
VITA
Angela Marie (Spano) Underwood is the daughter of Earl and Beverly May and
Bill and Melanie Spano. She earned a Bachelor of Arts degree in Biology and
Psychology from Huntingdon College in 2001, graduating Magna Cum Laude with
Honors in Biology. Married in November 2007 to Will Underwood, she accepted a
position with Weeks Bay National Estuarine Research Reserve in January 2008. Angela
is passionate about her love of nature and enjoys spending time outdoors with her
husband. They reside in Magnolia Springs, Alabama and spend their free time
botanizing, photographing nature, and bird watching.

v
THESIS ABSTRACT
LARVAE OF SARCOPHAGIDAE (INSECTA: DIPTERA) AND
THEIR RELATIONSHIP WITH THE PITCHER PLANTS
(SARRACENIACEAE: SARRACENIA) OF
SOUTHEASTERN U.S. BOGS
Angela Marie Spano Underwood
Master of Science, December 18, 2009 (B.A., Huntingdon College, 2001)
55 Typed Pages
Directed by Debbie R. Folkerts
Larvae of diptera of the family Sarcophagidae from bogs in Mississippi, Alabama,
and Florida were collected, reared, and identified to species. Additionally, the effect of
sarcophagid larvae on nutrient uptake in white-topped pitcher plant leaves (Sarracenia
leucophylla) was examined at Crawford bog in south Alabama. The influence of
sarcophagid larvae on nutrition of pitcher plants has not been previously recorded in the
literature.
I reared Sarcophaga sarraceniae, Fletcherimyia abdita , and F. celarata from
pitchers of S. leucophylla. In Alabama, all three species occurred at Crawford Bog while

vi
only S. sarraceniae and F. abdita occurred at Splinter Hill Bog. I reared F. abdita from
pitchers of S. alata occurring in Desoto West Bog in Mississippi. Two species of
sarcophagids, F. rileyi and F. jonesi, were reared from pitchers of S. flava. Both
occurred at Sumatra Bog in Florida, while only F. rileyi was found at Crawford Bog. I
also calculated sarcophagid larval frequencies in S. leucophylla and S. flava at Crawford
Bog during 2004 and 2005. In 2004, 70% of S. leucophylla leaves surveyed contained at
least one sarcophagid larva. In 2005, only 58% of leaves contained larvae, but among
these, four were occupied by multiple larvae. Eighty-six percent and 94% of S. flava
leaves in 2004 and 2005 respectively were occupied by at least one larva. During both
years, 4 of the occupied pitchers contained multiple larvae.
Nutrition field experiments were conducted at Crawford Bog during the summers
of 2004 and 2005. I demonstrated a strong positive relationship between the addition of
prey and leaf concentrations of macronutrients (N, P, and K). In each experimental
group, pitchers supplemented with prey and with prey plus larvae contained significantly
higher nutrient levels than the other experimental conditions (except 2004 potassium
control). Additionally, I demonstrated that larvae do not negatively affect plant nutrition.
Pitchers supplemented with prey plus sarcophagid larvae showed a strong trend towards
higher nutrient levels than pitchers with prey only.

vii
ACKNOWLEGEMENTS
I would like to thank my advisor Debbie Folkerts. You are a wonderful mentor
and friend. Thank you for everything you have taught me, in the field and about life.
Also, thanks to Debbie and George for teaching so many of us how to love all aspects of
the natural world around us.
Thank you also to my committee members, Dr. Bob Lishak and Dr Wayne Clark,
for your assistance and guidance with this project.
Thanks to my lab mates who showed me some of the finer points of graduate
school and provided support and guidance with coursework.
Special thanks are extended to Rachel Foster, my lab mate and best friend. I can
never repay you for all of your support and you unending willingness to listen. I would
also like to extend a very special thank you to Travis Folk for his friendship, support, and
statistics expertise.
I can’t fully express my thanks and gratitude for my family and friends for their
unconditional support and love, especially during the trying times. A special thanks to
my husband Will for always encouraging me and pushing me to keep going. Your
understanding, support, and love are extraordinary.
Lastly, thank you to the Graduate School and Alabama Wildflower Society for
providing research funding. Without your financial support, this project would not have
been possible.

viii
Style manual or journal used: Southeastern Naturalist
Computer software used: Microsoft Word, SAS 9.0, SigmaPlot 8.0

ix
TABLE OF CONTENTS
LIST OF FIGURES ............................................................................................................ x LIST OF TABLES............................................................................................................. xi I. INTRODUCTION....................................................................................................... 1 II. METHODS................................................................................................................... 9
STUDY SITE.......................................................................................................... 9 LARVAL FREQUENCY AND SPECIES IDENTIFICATION .......................... 10 NUTRITION STUDY .......................................................................................... 12 STATISTICAL ANALYSIS ................................................................................ 13
III. RESULTS .................................................................................................................. 15
LARVAL FREQUENCY IN PITCHERS ............................................................ 15 SPECIES OF SARCOPHAGIDAE ...................................................................... 15 NUTRITION STUDY .......................................................................................... 16
IV. DISCUSSION............................................................................................................ 19 V. CONCLUSIONS........................................................................................................ 24 LITERATURE CITED ..................................................................................................... 25

x
LIST OF FIGURES
Figure 1. Least square mean differences in nitrogen content showing 95% confidence limits (CL) from leaves of Sarracenia leucophylla subjected to experimental treatments during the spring of 2004 & 2005……………………..30 Figure 2. Least square mean differences in phosphorus content showing 95% confidence limits (CL) from leaves of Sarracenia leucophylla subjected to experimental treatments during the spring of 2004 & 2005…………………..…31 Figure 3. Least square mean differences in calcium content showing 95% confidence limits (CL) from leaves of Sarracenia leucophylla subjected to experimental treatments during the spring of 2004 & 2005……………………..32 Figure 4. Least square mean differences in magnesium content showing 95% confidence limits (CL) from leaves of Sarracenia leucophylla subjected to experimental treatments during the spring of 2004 & 2005……………………..33 Figure 5. Least square mean differences in potassium content showing 95% confidence limits (CL) from leaves of Sarracenia leucophylla subjected to experimental treatments during the spring of 2004 & 2005……………………..34

xi
LIST OF TABLES
Table 1. Pitcher plants and associated sarcophagid fly species results from four bogs in the southeastern U. S…………………………………………………….35
Table 2. Least squares mean comparisons for 2004 first tier nutrient analysis of S. leucophylla……….............................................................................................36 Table 3. Least squares mean comparisons for 2005 first tier nutrient analysis of S. leucophylla ……………………………………………………………………37 Table 4. Least squares mean comparisons for 2004 second tier nutrient analysis of S. leucophylla...………………………………………………………………..…38 Table 5. Least squares mean comparisons for 2005 second tier nutrient analysis of S. leucophylla ………………………………………………………………....…41 Table 6. Least square means of nutrient levels for unmanipulated pitchers of S. leucophylla in 2004 and 2005 with 95% confidence limits…….…………......43

1
INTRODUCTION
Carnivory in plants is defined by the ability of a plant to attract, capture, and
digest prey items, as well as absorb nutrients from the decomposed prey mass (Lloyd
1942). Carnivorous plants are found in every region of the world except the high Arctic,
Antarctica, and extreme deserts (Givnish 1989), where they tend to inhabit areas
characterized by sunny, open environments with moist, nutrient poor soils (Givnish et al.
1984, Plummer 1963). Soils in areas suitable for carnivorous plants are mostly acidic
(Chandler & Anderson 1976, Juniper et al. 1989, Plummer 1963, Roberts and Oosting
1958), although a few carnivorous plants are found in habitats where soils are neutral to
basic (Mandossian 1965, Wherry 1929). Scientists hypothesize that the evolution of
carnivory in plants was an adaptation to these low nutrient levels and unfavorable soil
moisture and pH conditions (Givnish et al. 1984). According to Givnish (1989),
carnivory has arisen independently at least six times with there being 538 or more
carnivorous plant species found in 18 genera and eight families.
Early investigators were disinclined to believe that plants could capture and
consume animal matter. In reference to pitcher plants, these investigators felt that the lid
of the pitcher was only a mechanism to help conserve water in the plant (Lloyd 1942).
Others felt that pitchers were refuges for insects trying to escape the weather and other
animals (Lloyd 1942, Schnell 2002). Even William Bartram (1791), who realized that
insects were caught and trapped by pitchers, felt it doubtful that caught insects would

2
“serve for aliment or support to these kinds of plants.” Through detailed
experimentation using Drosera rotundifolia L. (Roundleaf Sundew), Charles Darwin
(1875) was the first to show that plants did actually trap and digest invertebrates and
absorb the resulting nutrients. A few years later, Francis Darwin (1878) demonstrated
that captured prey enhanced growth and seed production in Drosera rotundifolia.
Since then, several studies have shown that prey provide an alternative source of
nutrients for carnivorous plants. Experiments by Hepburn et al. (1920) demonstrated the
absorption of nitrogenous compounds and phosphorous in pitcher plants. Plummer and
Kethley (1964) used radioisotopes to show that the leaves of Sarracenia flava L. (Yellow
Pitcherplant). not only absorb sulfur and phosphorous but also translocate these elements
to other parts of the plant, thus they concluded these elements are of importance to the
plant. Williams (1966) used C14 - labeled fruit flies to verify the absorption of animal
proteins by Sarracenia purpurea L. (Purple Pitcherplant). Christensen (1976) found that
prey capture led to significantly higher tissue concentrations of nitrogen and phosphorous
in Sarracenia flava, although addition of insects had no effect on concentrations of
potassium, calcium, and magnesium. Schulze et al. (1997) found that insect derived
nitrogen was an important resource for pitchers of Darlingtonia californica Torr.
(California Pitcherplant). Additionally, recent studies have shown that the presence of
prey increases growth, reproduction, and root nutrient uptake in carnivorous plants
(Adamec 2002, Hanslin and Karlsson 1996, Thoren and Karlsson 1998, Thum 1988),
allowing these plants to survive where soil nutrient concentrations may be low.
Within North America, diversity of carnivorous plants is highest in pitcher plant
bogs of the southeastern United States (Folkerts 1982). Pitcher plant bogs are so named

3
because they are visually dominated by pitcher plants of the genus Sarracenia
(Sarraceniaceae), although grasses and sedges are often more abundant. Eight species of
pitcher plants are typically recognized in the genus (Bell 1949, McDaniel 1971) although
up to eleven may be distinguished, depending on taxonomic opinion. One species, S.
purpurea, occurs in deep sphagnum bogs from British Columbia, Canada, south to the
Coastal Plain of South Carolina and Georgia as well as in pitcher plant bogs of the Gulf
Coastal Plain. Seven additional species occur in pitcher plant bogs within the Atlantic
and Gulf Coastal Plain of the southeastern United States.
Even though pitcher plant habitats in the southeast may be classified into eleven
habitat types (Folkerts 1991), they have many characteristics in common. Most bogs
where Sarracenia occur are open and sunny and contain sandy to loamy soils that are
saturated for at least a portion of the year. High amounts of water passing through the soil
causes leaching of nutrient cations, resulting in nutrient poor, acidic soils (Platt 1999).
A distinct assemblage of plants is associated with bogs and is adapted to
frequent, moderate growing-season fire (Platt 1999). Natural occurrence of fire is
caused by lightning strikes during summertime storms. These regularly occurring fires
reduce the fuel load, causing cooler burns. Fire within these ecosystems helps remove
old growth and competition from woody species, as well as opens up bare soil for seed
germination.
Pitcher plants of the genus Sarracenia are herbaceous, rhizomatous plants that
possess funnel-shaped leaves which act as passive pitfall traps to capture a variety of prey
(Lloyd 1942). Prey are attracted to the traps by odor, coloration, and nectar (Juniper et al.
1989, Lloyd 1942, Slack 1979). Differences in these characteristics along with variation
4
of leaf morphology within the genus make species of pitcher plants attractive to different
types of insects (Folkerts 1999). In S. minor Walt. (Hooded Pitcherplant) and S. rubra
Walt. (Red Pitcherplant), nectaries along the frontal wing help direct ants from the
ground into the pitcher (Fish 1976, Harper 1918, Schnell 2002, Slack 1979). The smaller,
decumbent pitchers of S. psittacina Michx. (Parrot Pitcherplant) specialize in capturing
crawling insects. Other species, such as S. flava and S. leucophylla Raf. (White-topped
Pitcherplant), have evolved large, flower-like pitchers that contain combinations of UV-
absorbing dark centers, radiating stripes and peripheral dots which advertise nectaries
around the hood of the pitcher and tend to be attractive to flying insects, especially
Hymenoptera (Biesmeijer et al. 2005, Slack 1979) and Lepidoptera (Folkerts, 1999).
Escape of prey is prevented by downward pointing hairs, a smooth, waxy surface that
provides no footing, and in some species by an intoxicating chemical, coniine (Mody et
al. 1976), which is released by the leaf. Captured prey material is digested by a
combination of enzymatic (Hepburn et al 1927), bacterial (Plummer and Jackson 1963),
and commensal activity (Bradshaw and Creelman 1984).
Not only do leaves of pitcher plants act as traps for prey, but they also function as
microhabitats for a variety of arthropod associates. Sarracenia purpurea has a short-
form, open-topped pitcher that holds a watery phytotelm (plant held water) harboring a
number of aquatic insects. Pitchers of the tall-form species have a hood which covers the
pitcher orifice, and normally hold a moist mass of decomposing prey in a phytotelm that
is rarely watery. Arthropod associates of pitcher plants include many endemic mite
species, lepidopteran herbivores, a facultatively nesting wasp, and members of several
dipteran families, notably several species of sarcophagid flies in the genera Fletcherimyia
5
(formally Blaesoxipha) and Sarcophaga (Dahlem and Naczi 2006, Folkerts 1999, Forsyth
and Robertson 1975, Hepburn and Jones 1919, Jones, 1904, 1907, 1908, 1918, 1920,
1921, Judd 1959, Swales 1969, 1972, Rymal and Folkerts 1982, Wray and Brimley
1943).
Members of the family Sarcophagidae vary greatly in their lifestyles. The
majority of sarcophagid species are parasites of invertebrates (Aldrich 1914, 1915), while
others scavenge on dead animals (Aldrich 1914, 1915, Forsyth and Robertson 1975) or
parasitize vertebrates (Kamal 1958). Interestingly, one species in the genus Sarcophaga
and several species in the genus Fletcherimyia are obligately associated with pitcher
plants in North America (Aldrich 1916, Dahlem and Naczi, 2006, San Jean 1957). A
similar relationship is observed in the tropics of Asia and Australia between sarcophagid
species and the old world pitcher plants of the genus Nepenthes L. (Beaver 1979, Lever
1956, Shinonaga and Beaver 1979, Souza Lopes 1958, Yeates et al. 1989). These pitcher
inhabiting species are the only members of the family considered to have truly aquatic
larvae (Johannsen 1935). The large, whitish maggots of these species can be found
feeding within the prey mass in pitchers or floating at the surface of the fluid that may be
contained by the leaves. These larvae are able to live in pitchers and escape digestion by
producing antiproteases that protect them from digestive enzymes secreted by the plant
(Hepburn and Jones 1919). Typically only one larva is found per pitcher (Farkas and
Brust 1986, Fish and Hall, 1978, Hardwick and Giberson 1996), due to aggression and
cannibalism among larvae developing in the same pitcher (Forsyth & Robertson 1975).
This behavior may be an adaption to limited food supply, and according to Beaver
(1979), a similar behavior occurs in the sarcophagid species Pierretia urceola Shinonaga

6
& Beaver, the larvae of which live in Nepenthes pitchers in Malaysia. This behavior is
unique among sarcophagids, although competition for resources occurs among non-
pitcher dwelling species and has been shown to reduce the size of larvae, pupae, and
adults, as well as population sizes (Beaver 1973, Kamal 1958). Although single larvae
are typical, on occasion, multiple larvae have been observed in pitchers (Yanoviak and
Folkerts 1991, Yeates et al. 1989, personal observation). Frequency and number of
sarcophagid larvae in pitchers varies over time and geographically. In 1955, Judd (1959)
observed only 3% of S. purpurea pitchers surveyed were inhabited by larvae and no
pitchers contained multiple larvae, whereas in 1956, 32% of leaves contained larvae, with
6 of these leaves containing multiple larvae. Forsyth and Robertson (1975) observed
93.2% of 106 occupied S. purpurea pitchers contained a single larva, with multiple larvae
per pitcher occurring during peak density. Fish (1976) reported that 64% of S. minor
leaves were occupied by single larvae.
Mature larvae crawl from the pitchers and pupate in the soil at the base of the
plant. Late season larvae appear to overwinter in the soil (Farkas and Brust 1986,
Yanoviak and Folkerts 1991). Only the larvae inhabit Sarracenia leaves, while adults
rarely enter pitchers. Adult flies prefer new leaves (Fish and Hall 1978, Forsyth and
Robertson 1975) and larger leaves (Krawchuck and Taylor 2003) for larviposition and
usually larviposit from the edge of the orifice, although they may roost in the flower
heads of pitcher plants (Argo 1964, Jones 1908, Krawchuck and Taylor 1999, Swales
1972). Jones (1908) reported up to four adult flies of Sarcophaga sarraceniae Riley
crowding into blossoms of Sarracenia flava, indicating their possible role as pollinators.

7
However, research has shown that large-flowered species of pitchers plants are pollinated
by queen bumblebees (Schnell 1983, G. Folkerts pers. comm.).
Recent researchers have emphasized the dynamics of phytotelm communities in
S. purpurea (Hamilton and Duffield 2002, Heard 1994, Kneitel and Miller 2003, Miller
et. al., 2002, 2002b, Rango 1999b), but few authors have investigated the sarcophagid
species specifically (Dahlem and Naczi 2006, Krawchuk and Taylor 1999, Rango 1999)
and rarely has the system been investigated in the Gulf Coastal Plain (Fish 1976) or in
tall-form pitcher plants. Moreover, it has not been shown whether consumption of prey
by sarcophagids is detrimental to pitchers. Fish (1976) estimated that larvae may
consume up to 50% of prey material and felt this to be detrimental to the host plant.
However, Folkerts (1999) observed that most prey-consumers could occur in pitchers
without any noticeable damage to the plants. In fact, inhabitants may have beneficial
effects on pitchers.
As early as 1882 Schimper (quoted by Hepburn et al. 1927) reasoned that
“innumerable worms” in the leaves “possibly participate in the transformation of the
animal bodies into soluble components”. Additionally, Hubbard (1896) said the
following about maggots of Sarcophaga saraceniae Riley:
“… (they) are so uniformly present and so abundant in every species of pitcher-
plant which I have examined from the swamps of Lake Superior to the bay-heads
of Florida that I am constrained to think they have a more intimate connection
with the economy of the plant than has been assigned to them. They certainly aid
materially in disintegrating the mass of accumulated insects in the pitchers, and I
see no reason for considering that they rob the plant of its proper food, since they
8
must add their own excreta to the macerated digestive material, and this may
serve the needs of the plant well, or even better, than the disintegration of the
animal matter produced by its own fluid”.
More recently, Bradshaw and Creelman (1984) showed that the degradation of prey by
midge and mosquito larvae is beneficial to S. purpurea. Could degradation of prey by
sarcophagid larvae also be beneficial to the plants?
Little direct information is known about the relationship of sarcophagid flies with
tall-form pitcher plants. Therefore, my study focused on the ecological relationship of
sarcophagid larvae inhabiting pitcher plants in pitcher plant bogs in southwest Alabama
and elsewhere in the southeastern United States. The objectives of the study included:
1) Measuring the frequency of sarcophagid larvae inhabiting pitchers of S. leucophylla
and S. flava; 2) Identifying species of sarcophagids associated with species of Sarracenia
in several bogs across the southeastern United States 3) Determining the average nutrient
content of white-topped pitcher plant leaves; 4) Evaluating the effects of sarcophagid
larvae on nutrient uptake in white-topped pitcher plant leaves.

9
METHODS
STUDY SITE
The primary study site, Crawford Bog, is located in Conecuh National Forest in
Covington County, Alabama. It is a seepage bog (as defined by Folkerts 1991),
approximately 5.67 hectares in size, characterized by open, sunny habitat and dominated
by herbaceous plant species. Carnivorous species include 3 species of pitchers plants (S.
leucophylla, S. flava, and S. psittacina), two species of sundews (Drosera tracyi
Macfarlane and D. capillaris Poir.), and two species of bladderworts (Utricularia cornuta
Michx. and U. subulata L.). At Crawford Bog, different varieties of S. leucophylla and S.
flava were found, as well as hybrids between the two species. Although S. purpurea has
not been discovered at the site, possible hybrids between S. purpurea and S.leucophylla
have been found indicating either the past presence of S. purpurea at Crawford Bog or
close proximity to a bog containing S. purpurea. Other herbaceous species include
grasses (Aristida beyrichiana Trin. & Rupr, Ctenium aromaticum [Walt.] Wood and
Panicum spp.), sedges (Dichromena latifolia Baldw.), asters (Chaptalia tomentosa Vent.,
Liatris., Balduina., Helenium and Bidens spp.), terrestrial orchids (Calopogon pallidus
Chapman , C. tuberosus [L.] B.S.P, Cleistes bifaria [Fern.] Catling & Gregg, and
Pogonia ophioglossoides [L.] Ker-Gawl), milkweed (Asclepias lanceolata Walt. and A.
longifolia Michx.), goldencrest (Lophiola americanum [Pursh] Wood), milkworts

10
(Polygala lutea L. and P. cruciata L.), meadowbeauties (Rhexia alifanus Walt. and
Rhexia lutea Walt.), hatpins (Eriocaulon and Lachnocaulon spp.), groundpine
(Lycopodium alopecuroides L.), and Sphagnum. The study site is bordered on the north
by a silvicultural clear-cut. Examination of aerial photographs and soil profiles suggests
that the bog at one time extended beyond its present boundary. The upslope vegetation
on the east and south side of the bog consists of an upper canopy of mature slash and
longleaf pine (Pinus elliottii Engelm. and P. palustris P.Mill.) with an understory of
small gallberry (Ilex glabra [L.] Gray), blueberries (Vaccinium spp.), huckleberry
(Gaylussacia sp.) and gopher apple (Licania michauxii Prance) among other species. The
west portion of the bog transitions from open, bog habitat into a dense bay swamp that
occupies the floodplain of a nearby creek. A small stream bisects the site and is
surrounded by a shrub bog consisting mainly of Ilex glabra, sweetbay (Magnolia
virginiana L.), wax myrtle (Myrica cerifera L.), and black titi (Cliftonia monophylla
[Lam.] Britt. ex Sarg ). The bog proper contains few scattered woody species (I. glabra
and P. elliottii) and is maintained by the National Forest Service using frequent,
prescribed fire, averaging a burn every 2 to 3 years (Michael Heard, FMO USFS
Conecuh National Forest, pers. comm.).
LARVAL FREQUENCY AND SPECIES IDENTIFICATION
In order to determine the natural level of use of pitchers by sarcophagid larvae,
arbitrarily selected pitchers of S. leucophylla and S. flava were split open with a razor and
examined for the presence of sarcophagid larvae. During the two year study, 100 pitchers
of each species were examined, for a total of 200 pitchers. The percentage of pitchers

11
occupied by larvae on a yearly basis was calculated by dividing the number of occupied
pitchers by the total number of pitchers sampled in that year.
For identification, larvae were collected each year from pitchers of S. leucophylla
and S. flava at Crawford Bog and reared to adult in the lab. Twenty larvae were taken
from pitchers of each plant species each year for a total of 80 larvae. Additionally, I
opportunistically collected larvae from three other sites in the southeastern U.S.
Each larva was placed in an individual clear polystyrene vial with distilled water
and freeze-killed crickets. Vials were then placed in individual plastic jars containing
bog soil for pupation and covered with No-See-Um© netting to prevent escape of
specimens. Rearings were conducted in an environmental chamber at 26º and 70%
humidity. Although specimens were kept in a controlled environment, pupal mortality
was high. Dahlem and Naczi (2006) felt that pupal mortality was high in their study due
to insufficient humidity in the rearing containers. In my experience, soil moisture was
difficult to maintain even in a climate controlled rearing chamber and pupae often
desiccated before eclosion. In another study, pupal survival was better achieved by
loosely placing a lid over the rearing jars, thus helping to maintain humidity and soil
moisture (G. Folkerts pers. comm.).
Adult specimens were freeze-killed and pinned. The genitalia of male
sarcophagids were spread using a method detailed by Dahlem and Naczi (2006). Female
sarcophagids were dissected allowing for the examination of sternites 6, 7 and 8.
Specimens were then identified using the keys and figures found in Aldrich (1916),
Dahlem and Naczi (2006), and Roback (1954).

12
NUTRITION STUDY
A field study was conducted during the spring and summer of 2004 and 2005 at
Crawford Bog in order to detect the effect of sarcophagid larvae on nutrition in pitchers.
Data were collected from April 10-June 24, 2004 and May 17-July 9, 2005. The study
site was inspected each year in the early spring for newly emerging leaves of Sarracenia
leucophylla. As leaves of pitcher plants develop, the orifice remains closed, excluding all
prey items until the pitcher reaches a mature height. In 2004, 50 nearly opened pitchers
of relatively equal size were bagged with insect exclusion netting and cotton, while in
2005, only 40 pitchers were bagged due to the elimination of one of the experimental
treatments. The insect exclusion bags were made out of a fine, No-See-Um© (0.3mm
mesh) and tied with cotton drawstrings. Bags were placed over the top portion of the
pitcher. The opening of the bag was lined with cotton batting to cushion the leaves and
increase the effectiveness of the seal as the drawstrings were closed. The bags were tied
to numbered wire flags for identification and to support the leaves. After opening, each
leaf was arbitrarily subjected to one of several experimental treatments: 1) Control:
bagged, no prey or larvae added; 2) Larvae (2004 season only): bagged, larvae added; 3)
Prey: bagged, prey added; 4) Prey and larvae: bagged, prey and larvae added;
5) Unmanipulated: not bagged, naturally captured prey and larvae (potentially) present.
Larvae used in the experiment were approximately 2nd instars and were taken from other
pitchers of S. leucophylla at the study site. Prey consisted of pre-weighed crickets. In
2004, 10 freeze-killed crickets weighing 4.0g +/- 0.1 g were placed into each pitcher
receiving prey, while in 2005, 5 crickets weighing 2.0 g +/- 0.1g were placed in pitchers.

13
The lower amount of prey in the second year more accurately mimicked natural
conditions as judged in the first year of the study.
After approximately 10 weeks, leaves were cut off at ground level, placed in
plastic bags, and transported to the lab in coolers. In the lab, each pitcher was cleaned
with distilled water and then taken to the Auburn University Soils Laboratory. At the
soils lab, levels of calcium (Ca), potassium (K), magnesium (Mg), phosphorous (P),
aluminum (Al), boron (B), barium (Ba), cadmium (Cd), cobalt (Co), chromium (Cr),
copper (Cu), iron (Fe), manganese (Mn), sodium (Na), nickel (Ni), lead (Pb), and zinc
(Zn) in leaves were analyzed using inductively coupled plasma (ICP) emission
spectroscopy and were reported in parts per million (ppm). Percent nitrogen (N) and
carbon (C) were determined using a combustion method.
I tested two hypotheses: 1) If the addition of prey has an effect on nutrition within
pitchers, then we will see either an increase or decrease in nutrient levels; I predicted that
the addition of prey would increase the nutrient content of leaves. 2) If consumption of
prey by sarcophagid larvae has an effect on nutrient levels within pitchers, then nutrient
content will differ between the treatment groups; I predicted that the addition of larvae to
pitchers with prey would increase nutrient content of leaves.
STATISTICAL ANALYSIS
Multivariate Analysis of Variance (MANOVA) was used to examine the overall
effect of experimental manipulations on the uptake of nutrients by pitcher plants. This
approach allowed for a comparison of the effects of experimental manipulation on a
number of nutrient values without compounding the error associated with individual

14
ANOVA’s. Roy’s Greatest Root, which is a conservative estimate of variance and is
robust for small sample sizes, was used to determine the significance of overall effects.
Differences in means between treatment groups for each nutrient were evaluated at α =
0.05. All statistical analyses were conducted using SAS (v 9.1).
Analysis was conducted in a two tier approach. In the first tier of the analysis,
data from each year were examined to determine the influence of the aforementioned
experimental treatments on the following nutrients: Nitrogen (N), Phosphorous (P),
Calcium (Ca), Magnesium (Mg), and Potassium (K). These nutrients were identified
from the primary literature as being limited in availability in acidic soils (Chapin and
Pastor 1995, Christensen 1976, Plummer 1963). The second tier of the analysis was
purely exploratory in nature. MANOVA was used to evaluate the effects of the
experimental treatments on all of the measured nutrient levels. Micronutrient levels in
pitcher plant leaves are poorly understood and little studied. My exploratory analysis
provides baseline levels for measurable nutrients and allows for comparison of trends
among the effects of experimental treatments on these nutrient levels. I will draw few
conclusions from these exploratory analyses; rather I provide these data to spur further
research into this area.

15
RESULTS
LARVAL FREQUENCY IN PITCHERS
In 2004, 70% of S. leucophylla leaves surveyed at Crawford Bog contained at
least one sarcophagid larva. Of these pitchers, only one contained multiple larvae. In
2005, the percentage of leaves occupied by at least one larva dropped to 58%, but out of
these leaves, four were occupied by multiple larvae, with one leaf containing 5 larvae.
Eighty-six percent and 94% of S. flava leaves in 2004 and 2005 respectively were
occupied by at least one larva. During each year, 4 of the occupied pitchers contained
multiple larvae.
SPECIES OF SARCOPHAGIDAE
I reared Sarcophaga sarraceniae, Fletcherimyia abdita Pape , and F. celarata
Aldrich from pitchers of S. leucophylla. All three species occurred at Crawford Bog in
Covington County, AL while only S. sarraceniae and F. abdita occurred at Splinter Hill
Bog in Baldwin County, AL. Two species of sarcophagids were reared from pitchers of
S. flava. Fletcherimyia. rileyi Aldrich and F. jonesi Aldrich both occurred at Sumatra
Bog in Appalachicola, FL, while only F. rileyi was found at Crawford Bog (Table 1). I
reared F. abdita from pitchers of S. alata occurring in Desoto West Bog in Desoto
National Forest, MS. I saw no overlap in the fly species inhabiting the syntopic pitcher
plants, S. leucophylla and S. flava; however, one of the fly species found in S. leucophylla
was also found in S. alata at a site where no S. leucophylla occurs.
16
NUTRITION STUDY
2004 First Tier Analysis
The MANOVA for the 2004 analysis revealed an overall significant effect of the
experimental treatments on mean nutrient levels (Roy’s Greatest Root = 1.60, DF 5,44, p
< 0.001). Figure 1 shows the mean comparisons for nitrogen in 2004. Pitchers
containing prey (treatment 3) and those containing prey plus larvae (treatment 4) did not
significantly differ from each other but had significantly higher levels of nitrogen than
pitchers in the other treatment groups. Figure 2 shows mean comparisons for
phosphorous in 2004. Pitchers containing prey and larvae (treatment 4) and those
containing prey only (treatment 3) did not differ from each other but contained
significantly higher phosphorous levels than pitchers in the other treatment groups.
Calcium levels were highest in pitchers supplemented with prey (treatment 3) and those
with prey and larvae (treatment 4), but none of the treatments differed significantly from
the control group (treatment 1) (Figure 3). Magnesium levels were highest in pitchers
that were supplemented with prey (treatment 3), but no group differed significantly from
control pitchers (treatment 1) (Figure 4). Potassium levels were highest in the
unmanipulated pitchers (treatment 5) and those containing both prey and larvae
(treatment 4), but none of the groups differed significantly in potassium levels compared
to control condition (treatment 1) (Figure 5).

17
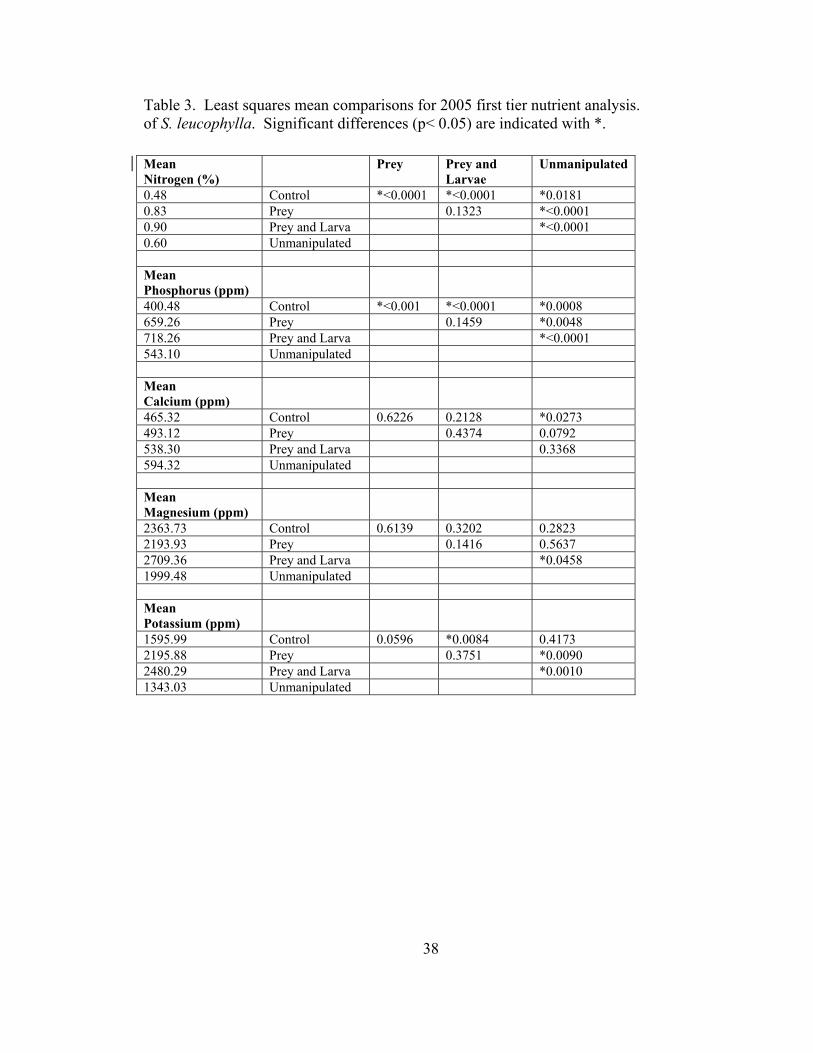
2005 First Tier Analysis
MANOVA results for 2005 indicated that there was a significant overall effect of
the treatment groups on nutrient levels in the leaves of white-topped pitcher plants (Roy’s
Greatest Root 3.65, DF 5,33, p < 0.0001). Mean percent nitrogen was significantly
higher in pitchers subjected to supplemental feeding (treatment 3) and those with both
larvae and supplemental food (treatment 4) than in control pitchers (treatment 1) and
unmanipulated pitchers (treatment 5) (Figure 1). Similarly, mean phosphorous levels did
not differ between pitchers fed and with larvae (treatment 4) and those fed only
(treatment 3), but did differ significantly from both control (treatment 1) and
unmanipulated pitchers (treatment 5) (Figure 2). Calcium levels in unmanipulated
pitchers (treatment 5) were significantly higher than those in control pitchers (treatment
1), but otherwise no mean differences were significant (Figure 3). Mean magnesium
levels differed significantly between the unmanipulated group (treatment 5) and the prey
and larvae group (treatment 4), but no other differences were significant (Figure 4).
Mean potassium levels where highest in the prey and larvae (treatment 4) and prey group
(treatment 3), while unmanipulated (treatment 5) and control group (treatment 1) did not
differ from each other (Figure 5).
Second Tier Analysis Results of the second tier analysis are shown in Table 4 and Table 5. It is
interesting to note that in both years, Zn and Na show a similar pattern to N, P, and K in
my first tier analysis. Additionally, there was a pattern for the control treatment
(treatment 1) to contain significantly higher levels of metallic elements (Ni, Cd 2004 only

18
and Cr both years) than the other experimental groups, not including unmanipulated
pitchers.

19
DISCUSSION
Published data on the flesh flies inhabiting pitcher plants have been rare and
confusing. Dahlem and Naczi (2006) published a comprehensive literature review and
revision of the sarcophagid flies associated with pitcher plants of North America. This
work helped guide my identifications and also provided a basis for comparison with my
data.
From the four sites sampled, I was able to identify one fly species in the genus
Sarcophaga and four species in the genus Fletcherimyia. Sarcophaga sarraceniae is
considered a generalist (Rymal and Folkerts 1982) and is the most common pitcher plant
sarcophagid from sites in the southeastern U.S. (Dahlem and Naczi 2006, Yanoviak and
Folkerts 1991). In my study it was the most abundant species found in S. leucophylla and
S. alata, followed by F. abdita. Additionally, F. celarata was reared only from pitchers
of S. leucophylla. Fletcherimyia celarata is considered to be only associated with S.
leucophylla (Dahlem and Naczi 2006) and may be the third most common sarcophagid
species collected in bogs of Mississippi, Alabama, and the Florida Panhandle (Yanoviak
and Folkerts 1991).
In agreement with other authors, I found F. jonesi and F. rileyi in pitchers of S.
flava. These flies are generally associated with pitchers of S. flava (Aldrich 1916,
Dahlem and Naczi 2006, Hepburn and Jones 1919) and S. minor (Aldrich 1916, Fish
1976), the latter of which does not occur within my study area. I did not rear any S.

20
sarraceniae from pitchers of S. flava although previous published studies indicate that the
species uses S. flava as a host pitcher (Aldrich 1916, Dahlem and Naczi 2006, Jones
1904, 1908). While I had high pupal mortality among larvae sampled from S. flava, it is
possible that my failure to find S. sarraceniae in these pitchers could be attributed to a
host preference for pitchers of S. leucophylla over S. flava when they occur syntopically.
One objective of my study was to determine whether sarcophagid larvae influence
the dynamics of nutrition within the leaves of pitcher plants. It is one matter to determine
whether a single sarcophagid larva may affect nutrition within a single pitcher, but in
order to determine whether or not fly larvae influence a significant portion of a
population, I needed to determine the frequency of sarcophagid flies inhabiting my main
study area, Crawford Bog. Previous research has concentrated on the frequency of fly
species in northern and eastern bogs (Forsyth and Robertson 1975, Hamilton and
Duffield 2002, Hardwick and Giberson 1996, Judd 1959, Rango 1999b). However,
published data on larval densities in southern bogs are limited (Fish 1976), and none have
been reported concerning the pitcher plant species S. leucophylla and S. flava.
In 2004 and 2005 respectively, 70% and 58% of S. leucophylla leaves surveyed at
Crawford Bog contained larvae. Within the same years, 86% and 94% of S. flava leaves
were occupied. Research in northern bogs has shown that larviposition does not begin
until early June (Forsyth & Robertson 1975) and peak larval density occurs between late
July and August (Forsyth & Robertson 1975, Hardwick & Giberson 1996, Rango 1999b).
During peak larval density in northern bogs, 67%-85% of pitchers surveyed contained
larvae (Forsyth & Robertson 1975, Hardwick & Giberson 1996, Rango 1999b). Because
I surveyed for larvae only once during each field season, peak larval density and the onset

21
and duration of larviposition cannot be determined from my work. However, suitable
pitchers for larviposition are available over a much larger period of time because of the
extended growing season in the southern U.S. As a result, larviposition most likely
begins earlier and ends later in southern bogs, and there may be multiple (Yanoviak and
Folkerts 1991) and overlapping generations of flies during the season. The larval
densities recorded at Crawford Bog equal or exceed those reported for the peak larval
densities in northern bogs and lead to the conclusion that the majority of pitchers in
southern bogs are occupied and potentially affected by the presence of sarcophagid larvae
at some point during the growing season.
My final objectives in this study were to: 1) Document nutrient levels in pitchers;
2) Evaluate the influence of prey on nutrient content of pitcher leaves; and 3) Examine
the interaction of sarcophagid larvae with pitcher plants. There are few data in the
literature documenting nutrient levels in the leaves of pitcher plants in the southeastern
United States. I sampled ten unmanipulated leaves of S.leucophylla each year of the
study and analyzed them to provide baseline nutrient data. As would be expected,
nutrient content within these pitchers was variable, likely due to the fact that pitchers
contained variable amounts of prey (Table 6.).
Next, I was interested in determining whether the addition of supplemental prey
produces a detectable effect on the nutrition of pitchers and whether the presence of
sarcophagid larvae is detrimental or beneficial to the plants. I performed the study over a
two year period and examined the results independently because of the evolution of my
experimental methods and differences in my sampling period. My results indicate a
strong positive relationship between the addition of prey and concentrations of
22
macronutrients (N, P, and K) in the sampled leaves. In each of these groups, pitchers
supplemented with prey (treatment 3) and with prey plus larvae (treatment 4) contained
significantly higher nutrient levels than in the other experimental conditions (except 2004
potassium control). This complements previous studies which demonstrated the benefits
of carnivory to plant nutrition (Adamec 2002, Christensen 1976, Hanslin and Karlsson
1996, Hepburn et al.1920, Schulze et al. 1997, Thoren and Karlsson 1998, Thum 1988,
Williams 1966). It is interesting to note that when the amount of prey was decreased by
half in the second year of the study, the trend for increased nutrient levels was still
strongly evident.
More importantly, this study provides novel data indicating that the presence of
sarcophagid larvae is not detrimental to the nutrition of the plant. In my study, pitchers
supplemented with prey plus larvae (treatment 4) showed a strong trend toward higher
nutrient levels than pitchers with prey only (treatment 3). As demonstrated by Bradshaw
and Creelman (1984) in the phytotelm holding pitcher plant species, S. purpurea, the
addition of larval associates may increase the rate of break down of prey, as well as,
increase nitrogen availability to the plant due to nitrogen compounds, mainly ammonia,
found in the excreta of the larva. Additionally, the movement of larvae among the prey
mass may increase colonization by bacteria and stimulate the secretion of additional
digestive compounds, thus causing prey to decompose more rapidly. Perhaps a larger
sample size would have allowed for statistical differentiation between these two groups
(prey only and prey plus larvae). Moreover, my evaluation of nutrient uptake in leaves
was conducted through an indirect approach of measuring overall leaf nutrient content. It
may be valuable to conduct further research involving a similar experimental setup but

23
using a more direct approach of measurement, such as tracing radioisotopes as done in
previous studies (Plummer and Kethley 1964, Williams 1966). As it is, my data provide
a clear indication that the presence of sarcophagid larvae does not lower the nutrients
available from prey to pitcher plants. The trend for increase in nutrient uptake in the
presence of larvae is less clear.

24
CONCLUSIONS
In this study, I find evidence to strengthen the argument that carnivory is
beneficial to the nutrition of pitcher plants. As has been shown in previous studies, N, P,
and K appear to be the major macronutrients absorbed by leaves of plants, reflecting their
limited availability within the habitat. Moreover, initial evidence is provided that shows
sarcophagid fly species associated with pitcher plants do not cause harm to the plants. In
fact, there is a trend for increased nutrition in pitcher leaves that are occupied by these fly
larvae. An understanding of the ecology of pitcher associates is crucial in the effort to
preserve these endangered ecosystems.
25
LITERATURE CITED Adamec, L. 2002. Leaf absorption of mineral nutrients in carnivorous plants stimulates root nutrient uptake. New Phytologist 155:89-100. Aldrich, J.M. 1914. A new sarcophagid parasite of grasshoppers. Journal of Agricultural Research 2:435–446. ______. 1915. The economic relations of the sarcophagidae. Journal of Economic Entomology 8:242-247 ______. 1916. Sarcophaga and Allies in North America. Entomological Society of America, Thomas Say Foundation, Volume I. Murphey-Bivins Co. Press, Lafayette, IN. 301 pp Argo, V.N. 1964. Insect-trapping plants. Natural History 73:28-33. Bartram, W. 1791. Travels through North and South Carolina, Georgia, East and West Florida. Publishing Info Beaver, R.A. 1973. The effects of larval competition on puparial size in Sarcophaga spp. (Diptera: Sarcophagidae) breeding in dead snails. Journal of Entomology 48:1-9. ______. 1979. Biological studies of the fauna of pitcher plants (Nepenthes) in West Malaysia. Annales de la Société Entomologique de France 15:3-17. Beismeijer, J.C., M. Giurfa, D. Koedam, S.G. Potts, D.M. Joel, and A. Dafni. 2005. Convergent evolution: floral guides, stingless bee nest entrances, and insectivorous pitchers. Naturwissenschaften 92:444-450. Bell, C.R. 1949. A cytotaxonomic study of the Sarraceniaceae of North America. Journal of the Elisha Mitchell Scientific Society 72:142-152. Bradshaw, W.E., and R.A. Creelman. 1984. Mutualism between the carnivorous purple pitcher plant and its inhabitants. American Midland Naturalist 112:294-304. Chandler, G.E. and J.W. Anderson. 1976. Studies on the nutrition and growth of Drosera species with reference to the carnivorous habit. New Phytologist 76:129-141.
26
Chapin, C.T. and J. Pastor. 1995. Nutrient limitations in the nothern pitcher plant Sarracenia purpurea. Canadian Journal of Botany 73: 728-734. Christensen, N.L. 1976. The role of carnivory in Sarracenia flava L. with regard to specific nutrient deficiencies. The Journal of the Mitchell Society 92:144-147. Dahlem, G.A. and R.F.C. Naczi. 2006. Flesh flies (Diptera: Sarcophagidae) associated with North American pitcher plants (Sarraceniaceae), with descriptions of three new species. Annals of the Entomological Society of America 99:218-240. Darwin, C.R. 1875. Insectivorous Plants. John Murray Press, London, England. 462 pp. Darwin, F. 1878. Experiments on the nutrition of Drosera rotundifolia. Journal of the Linnean Society Botany 17:17-32. Farkas, M.J. and R.A Brust. 1986. Pitcher plant sarcophagids from Manitoba and Ontario. The Canadian Entomologist 118:1307-1308 Fish, D. 1976. Insect-plant relationships of the insectivorous pitcher plant Sarracenia minor. The Florida Entomologist 59:199-203. Fish, D. and D.W. Hall. 1978. Succession and stratification of aquatic insects inhabiting the leaves of the insectivorous pitcher plant, Sarracenia purpurea. American Midland Naturalist 99:172-183. Folkerts, D.R. 1999. Pitcher plant wetlands of the southeastern United States: arthropod associates. Pp.247-278, In Invertebrates in Freshwater Wetlands of North America: Ecology and Management. D.P Batzer, R.B. Rader and S.A. Wissinger (Eds.). John Wiley & Sons, Inc., NY. 1100 pp. Folkerts, G.W. 1982. The Gulf Coast pitcher plant bogs. American Scientist 70:261-267. ______. 1991. A preliminary classification of pitcher plants habitats in the southeastern United States. Journal of the Alabama Academy of Science 62:199-225. Forsyth, A.B., and R J. Robertson. 1975. K reproductive strategy and larval behavior of the pitcher plant sarcophagid fly, Blaesoxipha fletcheri. Canadian Journal of Zoology 53:199-203. Givnish, T.J. 1989. Ecology and evolution of carnivorous plants. Pp. 243-290, In Plant-Animal Interactions. W.G. Abramson (Ed.). McGraw-Hill, Toronto, Candada. 480 pp.

27
Givnish, T.J., E.L. Burkhardt, R.E. Happel, and J.D. Weintraub. 1984. Carnivory in the bromeliad Brocchinia reducta, with a cost-benefit model for the general restriction of carnivorous plants to sunny, moist, nutrient-poor habitats. American Naturalist 124:479-497. Hamilton, R., IV, and R.M. Duffield. 2002. Novel observations of midge and mosquito larval population dynamics in leaves of the northern pitcher plant, Sarracenia purpurea L. Hydrobiologia 482:191-196. Hanslin, H.M. and P.S. Karlsson. 1996. Nitrogen uptake from prey and substrate as affected by prey capture level and plant reproductive status in four carnivorous plant species. Oecologia 106:370-375. Hardwick, M.L. and D.J. Giberson. 1996. Aquatic insect populations in transplanted and natural populations of the purple pitcher plant, Sarracenia purpurea, on Prince Edward Island, Canada. Canadian Journal of Zoology 74:1956-1963. Harper, R.M. 1918. The American pitcher plants. Journal of the Elisha Mitchell Scientific Society 34:110-125. Heard, S.B. 1994. Pitcher plant midges and mosquitoes: a processing chain commensalism. Ecology 75:1647-1660. Hepburn, J.S., and F.M. Jones. 1919. Occurrence of antiproteases in the larvae of the Sarcophaga associates of Sarracenia flava. Contributions of the Botanical Laboratory of the University of Pennsylvania 4:460-463. Hepburn, J.S., E.Q. St. John, and F.M. Jones. 1920. The absorption of nutrients and allied phenomena in the pitchers of the Sarraceniaceae. Journal of the Franklin Institute 189:147-184. Hepburn, J.S., F.M. Jones, and E.Q. St. John. 1927. Biochemical studies of the North American Sarraceniaceae. Transactions of the Wagner Free Institute of Science of Philadelphia 11. Hubbard, H.G. 1896. Some insects which brave the dangers of the pitcher plant. Proceedings of the Entomological Society of Washington 3:314-318. Johannsen, O.A. 1935. Aquatic Diptera, Part II. Orthorrhapha-Brachycera and Cyclorrhapha. Memoirs of the Cornell University Agricultural Experiment Station No. 177. Jones, F.M. 1904. Pitcher plant insects I. Entomological News 15:14-17. ______. 1907. Pitcher plant insects II. Entomological News 18:413-420.
28
______. 1908. Pitcher plant insects. III. Entomological News 19:150-156. ______. 1918. Dohrniphora venusta Coquillet (Diptera) in Sarracenia flava. Entomological News 29:299-302. ______. 1920. Another pitcher-plant insect (Diptera, Sciarinae). Entomological News 31:91-94. ______. 1921. Pitcher-plants and their moths. Natural History 21:297-316. Judd, W.W. 1959. Studies of the Byron bog in southwestern Ontario. X. Inquilines and victims of the pitcher plant, Sarracenia purpurea L. Canadian Entomologist 91:171-180. Juniper, B.E., R.J. Robins, D.M. Joel. 1989. The Carnivorous Plants. Academic Press, San Diego, California. 368pp. Kamal, A S. 1958. Comparative study of the thirteen species of sarcosaprophagous Calliphoridae and Sarcophagidae (Diptera). I. Bionomics. Annals of the Entomological Society of America 51:261-271. Kneitel, J.M. and T.E. Miller. 2003. Dispersal rates affect species composition in metacommunities of Sarracenia purpurea inquilines. The American Naturalist 162:165-171. Krawchuck, M.A. and P.D. Taylor. 1999. Roosting behavior by Fletcherimyia fletcheri (Diptera: Sarcophagidae) in Sarracenia purpurea (Sarraceniaceae). The Canadian Entomologist 131:829-830. ______. 2003. Changing importance of habitat structure across multiple spatial scales for three species of insects. Oikos 103:153-161. Lever, R.J.A.W. 1956. Notes on some flies recorded from pitcher plants. Malayan Nature Journal 10:109-110. Lloyd, F.E. 1942. The Carnivorous Plants. Chronica Botanica, Waltham, MA. 352 pp. Mandossian, A.J. 1965. Plant associates of Sarracenia pupurea (pitcher plant) in acid and alkaline habitats. The Michigan Botanist 4:107-114. McDaniel, S. 1971. The genus Sarracenia (Sarraceniaceae). Bulletin of the Tall Timbers Research Station 9:1-36. Miller, T.E., L. Horth, and R.H. Reeves. 2002. Trophic interactions in the phytotelmata communities of the pitcher plant, Sarracenia purpurea. Community Ecology 3.

29
Miller, T.E., J.M. Kneitel, and J.H. Burns. 2002b. Effect of community structure on invasion success and rate. Ecology 83:898-905. Mody N.V., R. Henson, P.A. Hedin, U. Kokpol, D.H. Miles. 1976. Isolation of the insect paralyzing agent coniine from Sarracenia flava. Experientia 32:829-30. Platt, W.J. 1999. Southeastern pine savannas. Pp. 23-51, In Savannas, Barrens, and Rock Outcrop Plant Communities of North America. R.C. Anderson, J.S. Fralish, and J.M. Baskin. Cambridge University Press, Cambridge, U.K. 470 pp. Plummer, G.L. 1963. Soils of the pitcher plant habitats in the Georgia Coastal Plain. Ecology 44:727-734. Plummer, G.L. and T.H. Jackson. 1963. Bacterial activities within the sarcophagus of the insectivorous plant, Sarracenia flava. American Midland Naturalist 69: 462- 469. Plummer, G.L. and J.B. Kethley. 1964. Foliar absorption of amino acids, peptides and other nutrients by the pitcher plant Sarracenia flava. Botanical Gazette 125:245-260. Rango, J.J. 1999. Resource dependent larviposition behavior of a pitcher plant flesh fly, Fletchererimyia fletcheri (Aldrich) (Diptera: Sarcophagidae). Journal of the New York Entomological Society 107:82-86. ______. 1999b. Summer phenology of aquatic insect communities inhabiting the leaves of the northern pitcher plant, Sarracenia purpurea L. Northeastern Naturalist 6:19-30. Roback, S.S. 1954. The evolution and taxonomy of the sarcophaginae (Diptera, Sarcophagidae. Illinois Biological Monogaraphs 23:1-181.
Roberts, P.R. and H.J. Oosting. 1958. Responses of venus fly trap (Dionaea muscipula) to factors involved in its endemism. Ecological Monographs 28:193-218. Rymal, D.E., and G.W. Folkerts. 1982. Insects associated with pitcher plants (Sarracenia: Sarraceniaceae) and their relationship to pitcher plant conservation: a review. Journal of the Alabama Academy of Science 53:131-151. San Jean, J. 1957. Taxonomic studies of the Sarcophaga larvae of New York with notes on adults. Memoirs of the Cornell University Agricultural Experiment Station 349:1-115. Schnell, D.E. 1983. Notes on the pollination of Sarracenia flava L. (Sarraceniaceae) in the piedmont province on North Carolina. Rhodora 85:405-420.
30
______. 2002. Carnivorous Plants of the United States and Canada. Timber Press, Portland, OR. 468pp. Schulze, W., E.D. Schulze, J.S. Pate, and A.N. Gillison. 1997. The nitrogen supply from soils and insects during growth of the pitcher plants Nepenthes mirabilis, Cephalotus follicularis and Darlingtonia californica. Oecologia 112:464-471.
Shinonaga, S. and R.A. Beaver. 1979. Pierretia urceola: a new species of sarcophagid fly found living in Nepenthes pitcher plants in West Malaysia. Annales de la Société Entomologique de France 15:37-40. Slack, A. 1979. Carnivorous Plants. Ebury Press, London, England. 240 pp. Souza Lopes, H. de. 1958. Dipetera: Sarcophagidae. Insects of Micronesia 13:15-49. Swales, D.E. 1969. Sarracenia purpurea L. as host and carnivore at Lac Carre, Terrebonne Co., Quebec. Part I. Le Naturaliste Canadien 96:759-763. ______. 1972. Sarracenia purpurea L. as host and carnivore at Lac Carre, Terrebonne Co., Quebec. Part II. Le Naturaliste Canadien 99: 41-47. Thoren, M. and P.S. Karlsson. 1998. Effects of supplementary feeding on growth and reproduction of three carnivorous plant species in a subarctic environment. Journal of Ecology 86:501-510. Thum, M. 1988. The significance of carnivory for the fitness of Drosera in its natural habitat. Oecologia 75:472-480. Wherry, T. 1929. Acidity relations of the sarracenias. Journal of the Washington Academy of Sciences 19:379-390. Williams, R.M. 1966. Utilization of animal protein by the pitcher plant, Sarracenia purpurea. The Michigan Botanist 5:14-17. Wray, D.L. and C.S. Brimley. 1943. The insect inquilines and victims of pitcher plants in North Carolina. Annals of the Entomological Society of America 36:128-137. Yanoviak, S.P. and G.W. Folkerts. 1991. Sarcophagid flies associated with pitcher plants (Sarracenia sp.) in the Central Gulf region. Journal of the Alabama Academy of Science 62:80. Yeates, D.K., H. De Souza Lopes, and G.B. Montieth. 1989. A commensal sarcophagid (Diptera: Sarcophagidae) in Nepenthes mirabilis (Nepenthaceae) pitchers in Australia. Australian Entomological Magazine 16: 33-40.

31
Figure 1. Least square mean differences in nitrogen content showing 95% CL of leaves of Sarracenia leucophylla subjected to experimental treatments during the spring of 2004 & 2005. All samples were collected from Crawford Bog in the Conecuh National Forest (Covington Co., AL). All leaves, except unmanipulated, were bagged prior to leaf opening in the spring to exclude prey and plant associates. Control leaves were bagged prior to opening and never subjected to additional manipulation. In 2004, larva indicates leaves in which one sarcophagid fly larva was added after leaf opening. Unmanipulated leaves were not bagged, representing a natural population. In 2004, 4g prey indicates 4 grams of crickets added after leaf opening. In 2005, 2g prey indicates 2 grams of crickets added after leaf opening. In 2004, 4g prey & larva indicates leaves in which 4 grams of crickets and one sarcophagid larva were added after leaf opening. In 2005, 2g prey & larva indicates leaves in which 2 grams of crickets and one sarcophagid larva were added after leaf opening.
Percent Nitrogen 2004
control larva unmanipulated 4g prey 4g prey & larva
LS m
ean
0.4
0.6
0.8
1.0
1.2
Percent Nitrogen 2005
control unmanipulated 2g prey 2g prey & larva
LS m
ean
0.4
0.6
0.8
1.0
1.2

32
Figure 2. Least square mean differences in phosphorus content showing 95% CL of leaves of Sarracenia leucophylla subjected to experimental treatments during the spring of 2004 & 2005. All samples were collected from Crawford Bog in the Conecuh National Forest (Covington Co., AL). All leaves, except unmanipulated, were bagged prior to leaf opening in the spring to exclude prey and plant associates. Control leaves were bagged prior to opening and never subjected to additional manipulation. In 2004, larva indicates leaves in which one sarcophagid fly larva was added after leaf opening. Unmanipulated leaves were not bagged, representing a natural population. In 2004, 4g prey indicates 4 grams of crickets added after leaf opening. In 2005, 2g prey indicates 2 grams of crickets added after leaf opening. In 2004, 4g prey & larva indicates leaves in which 4 grams of crickets and one sarcophagid larva were added after leaf opening. In 2005, 2g prey & larva indicates leaves in which 2 grams of crickets and one sarcophagid larva were added after leaf opening.
Phosphorus (ppm) 2004
control larva unmanipulated 4g prey 4g prey & larva
LS m
ean
0
200
400
600
800
1000
1200
Phosphorus (ppm) 2005
control unmanipulated 2g prey 2g prey & larva
LS m
ean
0
200
400
600
800
1000
1200

33
Figure 3. Least square mean differences in calcium content showing 95% CL of leaves of Sarracenia leucophylla subjected to experimental treatments during the spring of 2004 & 2005. All samples were collected from Crawford Bog in the Conecuh National Forest (Covington Co., AL). All leaves, except unmanipulated, were bagged prior to leaf opening in the spring to exclude prey and plant associates. Control leaves were bagged prior to opening and never subjected to additional manipulation. In 2004, larva indicates leaves in which one sarcophagid fly larva was added after leaf opening. Unmanipulated leaves were not bagged, representing a natural population. In 2004, 4g prey indicates 4 grams of crickets added after leaf opening. In 2005, 2g prey indicates 2 grams of crickets added after leaf opening. In 2004, 4g prey & larva indicates leaves in which 4 grams of crickets and one sarcophagid larva were added after leaf opening. In 2005, 2g prey & larva indicates leaves in which 2 grams of crickets and one sarcophagid larva were added after leaf opening.
Calcium (ppm) 2004
control larva unmanipulated 4g prey 4g prey & larva
LS m
ean
0
200
400
600
800
1000
1200
Calcium (ppm) 2005
control unmanipulated 2g prey 2g prey & larva
LS m
ean
0
200
400
600
800
1000
1200

34
Figure 4. Least square mean differences in magnesium content showing 95% CL of leaves of Sarracenia leucophylla subjected to experimental treatments during the spring of 2004 & 2005. All samples were collected from Crawford Bog in the Conecuh National Forest (Covington Co., AL). All leaves, except unmanipulated, were bagged prior to leaf opening in the spring to exclude prey and plant associates. Control leaves were bagged prior to opening and never subjected to additional manipulation. In 2004, larva indicates leaves in which one sarcophagid fly larva was added after leaf opening. Unmanipulated leaves were not bagged, representing a natural population. In 2004, 4g prey indicates 4 grams of crickets added after leaf opening. In 2005, 2g prey indicates 2 grams of crickets added after leaf opening. In 2004, 4g prey & larva indicates leaves in which 4 grams of crickets and one sarcophagid larva were added after leaf opening. In 2005, 2g prey & larva indicates leaves in which 2 grams of crickets and one sarcophagid larva were added after leaf opening.
Magnesium (ppm) 2004
control larva unmanipulated 4g prey 4g prey & larva
LS m
ean
0
1000
2000
3000
4000
5000
Magnesium (ppm) 2005
control unmanipulated 2g prey 2g prey & larva
LS m
ean
0
1000
2000
3000
4000
5000

35
Figure 5. Least square mean differences in potassium content showing 95% CL of leaves of Sarracenia leucophylla subjected to experimental treatments during the spring of 2004 & 2005. All samples were collected from Crawford Bog in the Conecuh National Forest (Covington Co., AL). All leaves, except unmanipulated, were bagged prior to leaf opening in the spring to exclude prey and plant associates. Control leaves were bagged prior to opening and never subjected to additional manipulation. In 2004, larva indicates leaves in which one sarcophagid fly larva was added after leaf opening. Unmanipulated leaves were not bagged, representing a natural population. In 2004, 4g prey indicates 4 grams of crickets added after leaf opening. In 2005, 2g prey indicates 2 grams of crickets added after leaf opening. In 2004, 4g prey & larva indicates leaves in which 4 grams of crickets and one sarcophagid larva were added after leaf opening. In 2005, 2g prey & larva indicates leaves in which 2 grams of crickets and one sarcophagid larva were added after leaf opening.
Potassium (ppm) 2004
control larva unmanipulated 4g prey 4g prey & larva
LS m
ean
0
500
1000
1500
2000
2500
3000
Potassium (ppm) 2005
control unmanipulated 2g prey 2g prey & larva
LS m
ean
0
500
1000
1500
2000
2500
3000

36
Table 1. Pitcher plants and associated sarcophagid fly species from four bogs in the southeastern U. S.
.
Crawford Bog Covington Co., AL
Splinter Hill Bog Baldwin Co., AL
Sumatra Bog Liberty Co., FL
Desoto West Bog Harrison Co., MS
Sarracenia leucophylla
Sarcophaga sarraceniae (3 ♂, 5 ♀) Fletcherimyia abdita (2 ♂) Fletcherimyia celarata (1 ♂)
Sarcophaga sarraceniae (8 ♂, 4 ♀) Fletcherimyia abdita (5♂, 2♀)
Sarracenia flava
Fletcherimyia rileyi (3♂, 1♀)
Fletcherimyia rileyi (1♂, 1♀) Fletcherimyia jonesi (1♀)
Sarracenia alata
Sarcophaga sarraceniae (4♂, 3♀) Fletcherimyia. abdita (1♂, 1♀)

37
Table 2. Least squares mean comparisons for 2004 first tier nutrient analysis of S. leucophylla. Significant differences (p< 0.05) are indicated with *.
Mean Nitrogen (%)
Larvae Prey Prey and Larvae
Unmanipulated
0.55 Control 0.9591 *<0.0001 *<0.0001 *0.0185 0.54 Larvae *<0.0001 *<0.0001 *0.0163 1.06 Prey 0.4492 *0.0063 1.14 Prey and Larva *0.0007 0.78 Unmanipulated Mean Phosphorus (ppm)
483.87 Control 0.9214 *0.0017 *<0.0001 *0.0165 471.44 Larvae *0.0012 *<0.0001 *0.0129 902.93 Prey 0.1595 0.3973 1082.11 Prey and Larva *0.0271 795.89 Unmanipulated Mean Calcium (ppm)
828.52 Control 0.6904 0.1939 0.5272 0.1491 891.24 Larvae 0.3635 0.8142 0.0682 1034.88 Prey 0.4991 *0.0078 928.24 Prey and Larva *0.0409 598.80 Unmanipulated Mean Magnesium (ppm)
3939.97 Control 0.9304 0.4844 0.6333 0.0591 3986.93 Larvae 0.5402 0.5727 *0.0489 4316.66 Prey 0.2421 *0.0113 3683.33 Prey and Larva 0.1524 2905.48 Unmanipulated Mean Potassium (ppm)
1761.20 Control 0.8468 0.4599 0.1119 0.0715 1700.39 Larvae 0.3524 0.0761 *0.0473 1994.43 Prey 0.3857 0.2771 2268.51 Prey and Larva 0.8236 2338.67 Unmanipulated
38
Table 3. Least squares mean comparisons for 2005 first tier nutrient analysis. of S. leucophylla. Significant differences (p< 0.05) are indicated with *.
Mean Nitrogen (%)
Prey Prey and Larvae
Unmanipulated
0.48 Control *<0.0001 *<0.0001 *0.0181 0.83 Prey 0.1323 *<0.0001 0.90 Prey and Larva *<0.0001 0.60 Unmanipulated Mean Phosphorus (ppm)
400.48 Control *<0.001 *<0.0001 *0.0008 659.26 Prey 0.1459 *0.0048 718.26 Prey and Larva *<0.0001 543.10 Unmanipulated Mean Calcium (ppm)
465.32 Control 0.6226 0.2128 *0.0273 493.12 Prey 0.4374 0.0792 538.30 Prey and Larva 0.3368 594.32 Unmanipulated Mean Magnesium (ppm)
2363.73 Control 0.6139 0.3202 0.2823 2193.93 Prey 0.1416 0.5637 2709.36 Prey and Larva *0.0458 1999.48 Unmanipulated Mean Potassium (ppm)
1595.99 Control 0.0596 *0.0084 0.4173 2195.88 Prey 0.3751 *0.0090 2480.29 Prey and Larva *0.0010 1343.03 Unmanipulated

39
Table 4. Least squares mean comparisons for 2004 second tier nutrient analysis of S. leucophylla. Significant differences (p< 0.05) are indicated with *.
Mean Aluminum (ppm)
Larvae Prey Prey and Larvae
Unmanipulated
55.16 Control 0.4292 0.1825 0.4459 0.3423 67.98 Larvae 0.5809 0.9772 0.0856 76.91 Prey 0.5616 *0.0253 67.51 Prey and Larva 0.0907 39.73 Unmanipulated Mean Boron (ppm)
7.76 Control 0.2562 0.0546 0.6567 0.1297 9.20 Larvae *0.0031 0.1171 *0.0099 5.28 Prey 0.1340 0.6693 7.20 Prey and Larva 0.2789 5.82 Unmanipulated Mean Barium (ppm)
18.09 Control 0.1657 0.3145 0.1558 0.2437 23.07 Larvae *0.0193 *0.0065 *0.0129 14.50 Prey 0.6719 0.8705 12.99 Prey and Larva 0.7942 13.92 Unmanipulated Mean Cadmium (ppm)
0.35 Control 0.0785 0.2102 0.6642 *0.0243 0.48 Larvae *0.0036 *0.0302 *0.0002 0.25 Prey 0.4086 0.2951 0.31 Prey and Larva 0.0647 0.17 Unmanipulated Mean Cobalt (ppm)
0.08 Control 0.6944 0.3016 0.9776 0.1207 0.09 Larvae 0.1566 0.6738 0.0542 0.04 Prey 0.3147 0.5941 0.08 Prey and Larva 0.1273 0.02 Unmanipulated Mean Chromium (ppm)
5.45 Control *0.0078 *0.0089 *0.0106 *0.0011 1.85 Larvae 0.9614 0.9088 0.4907 1.92 Prey 0.9437 0.4610 2.00 Prey and Larva 0.4222 0.95 Unmanipulated

40
Mean Copper (ppm)
Larvae Prey Prey and Larvae
Unmanipulated
16.96 Control 0.8412 0.5062 0.7450 0.3558 17.53 Larvae 0.3880 0.9005 0.4683 15.07 Prey 0.3239 0.1159 17.88 Prey and Larva 0.5477 19.59 Unmanipulated Mean Iron (ppm)
87.26 Control 0.0853 0.3604 0.7788 *0.0080 54.82 Larvae 0.4078 *0.0470 0.3155 70.22 Prey 0.2339 0.0708 92.47 Prey and Larva *0.0038 36.11 Unmanipulated Mean Manganese (ppm)
97.78 Control 0.0700 0.1450 0.9379 0.2397 135.69 Larvae 0.7110 0.0822 *0.0039 128.07 Prey 0.1670 *0.0104 99.38 Prey and Larva 0.2107 73.44 Unmanipulated Mean Sodium (ppm)
811.03 Control 0.2992 *0.0044 *0.0007 0.9131 1019.28 Larvae 0.0579 *0.0134 0.3519 1405.19 Prey 0.5341 *0.0060 1529.43 Prey and Larva *0.0010 832.79 Unmanipulated Mean Nickel (ppm)
5.12 Control *0.0085 *0.0054 *0.0190 *0.0020 2.14 Larvae 0.8622 0.7528 0.5967 1.96 Prey 0.6255 0.7217 2.49 Prey and Larva 0.3999 1.57 Unmanipulated Mean Lead (ppm)
0.55 Control 0.6654 0.1845 0.7018 0.6406 0.43 Larvae 0.3680 0.9603 0.3700 0.20 Prey 0.3425 0.0762 0.45 Prey and Larva 0.3969 0.67 Unmanipulated

41
Mean Zinc (ppm)
Larvae Prey Prey and Larvae
Unmanipulated
19.42 Control 0.9157 *0.0040 *<0.0001 0.0679 18.60 Larvae *0.0030 *<0.0001 0.0541 42.75 Prey *0.0335 0.2504 59.60 Prey and Larva *0.0016 33.80 Unmanipulated Mean Carbon (%)
45.44 Control 0.4580 0.8068 0.3957 0.2199 45.22 Larvae 0.3253 0.1153 0.0524 45.51 Prey 0.5440 0.3236 45.68 Prey and Larva 0.7009 45.79 Unmanipulated

42
Table 5. Least squares mean comparisons for 2005 second tier nutrient analysis of S. leucophylla. Significant differences (p< 0.05) are indicated with *.
Mean Aluminum (ppm)
Prey Prey and Larvae
Unmanipulated
34.85 Control 0.4135 0.5953 *0.0319 41.46 Prey 0.7892 0.1683 39.25 Prey and Larva 0.1102 52.7 Unmanipulated Mean Boron (ppm)
5.71 Control 0.4569 0.1761 0.7070 6.37 Prey *0.0418 0.2656 4.46 Prey and Larva 0.3186 5.38 Unmanipulated Mean Cadmium (ppm)
0.02 Control 0.6354 0.4896 0.4779 0.03 Prey 0.2524 0.2398 0.01 Prey and Larva 1.0000 0.01 Unmanipulated Mean Chromium (ppm)
0.95 Control 0.0895 0.0733 *0.0158 0.42 Prey 0.8844 0.4340 0.37 Prey and Larva 0.5368 0.17 Unmanipulated Mean Copper (ppm)
14.16 Control 0.1032 0.4231 0.2611 7.48 Prey *0.0199 *0.0079 17.48 Prey and Larva 0.7651 18.71 Unmanipulated Mean Iron (ppm)
1.33 Control 0.1111 0.1331 0.3279 8.66 Prey 0.9579 0.5247 8.41 Prey and Larva 0.5708 5.78 Unmanipulated Mean Manganese (ppm)
81.05 Control 0.4288 0.7621 0.6903 62.60 Prey 0.6384 0.2373 73.83 Prey and Larva 0.4909 90.31 Unmanipulated

43
Mean Sodium (ppm)
Prey Prey and Larvae
Unmanipulated
551.82 Control *<0.0001
*<0.0001 0.6432
1294.74 Prey 0.4367 *0.0003 1429.12 Prey and Larva *<0.0001 629.50 Unmanipulated Mean Nickel (ppm)
1.86 Control 0.3337 0.6944 0.6219 2.46 Prey 0.5804 0.6323 2.11 Prey and Larva 0.9303 2.16 Unmanipulated Mean Lead (ppm)
0.11 Control 0.5702 *0.0204 0.8765 0.78 Prey 0.0803 0.6794 2.92 Prey and Larva *0.0340 0.29 Unmanipulated Mean Zinc (ppm)
13.07 Control 0.0638 *0.0017 0.2155 18.44 Prey 0.1315 0.5184 22.89 Prey and Larva *0.0361 16.61 Unmanipulated Mean Carbon (%)
45.79 Control 0.3903 0.3562 0.8036 45.61 Prey 0.9300 0.2702 45.59 Prey and Larva 0.2464 45.84 Unmanipulated

44
Table 6. Least square means of nutrient levels for unmanipulated pitchers of S. leucophylla in 2004 and 2005 with 95% confidence limits (CL). Cells marked with * indicate values not measured. Nutrient LS Mean Lower CL Upper CL 2004 2005 2004 2005 2004 2005 Nitrogen (%) 0.78 0.60 0.65 0.53 0.92 0.66 Phosphorus (ppm) 795.89 543.08 617.48 487.65 974.29 598.51 Calcium (ppm) 598.80 594.32 375.95 513.96 821.65 674.69 Magnesium (ppm) 2905.48 1999.48 2144.56 1520.60 3666.40 2478.36 Potassium (ppm) 2338.67 1343.03 1893.05 900.69 2784.29 1785.37 Aluminum (ppm) 39.73 52.70 16.85 41.23 62.62 64.16 Boron (ppm) 5.82 5.38 4.04 4.12 7.61 6.63 Barium (ppm) 13.92 * 8.89 * 18.95 * Cadmium (ppm) 0.17 0.01 0.06 0.00 0.28 0.03 Cobalt (ppm) 0.02 * 0.00 * 0.07 * Chromium (ppm) 0.95 0.17 0.00 0.00 2.80 0.61 Copper (ppm) 19.59 18.71 15.57 12.99 23.61 24.44 Iron (ppm) 36.11 5.78 9.85 0.00 62.36 12.21 Manganese (ppm) 73.44 90.31 44.35 57.22 102.53 123.39 Sodium (ppm) 832.79 629.50 550.43 390.84 1115.15 868.15 Nickel (ppm) 1.57 2.16 0.03 1.28 3.11 3.03 Lead (ppm) 0.67 0.29 0.30 0.00 1.04 1.95 Zinc (ppm) 33.80 16.61 22.85 12.58 44.74 20.63 Carbon (%) 45.80 45.84 45.39 45.54 46.20 46.15