sar.kangwon.ac.krtranslate this pagesar.kangwon.ac.kr/rse/chapter07_multispec.ppt ·...
TRANSCRIPT

Dr. John R. JensenDr. John R. JensenDepartment of GeographyDepartment of Geography
University of South CarolinaUniversity of South CarolinaColumbia, SC 29208Columbia, SC 29208
Multispectral Remote Sensing SystemsMultispectral Remote Sensing Systems
Jensen, 2000Jensen, 2000

Overview Overview
Jensen, 2000Jensen, 2000

Remote Sensing Raster (Matrix) Data FormatRemote Sensing Raster (Matrix) Data Format0127255Brightness value
range (typically 8 bit)
Associatedgray-scale
10151720151618211718202218202224123415432Columns ( j) Bands (k ) 1234X axisPicture element (pixel) at location Line 4, Column 4, in Band 1 has a Brightness Value of 24, i.e., BV4,4,1 = 24 .
blackgraywhite21232225Lines or rows (i)
Jensen, 2000Jensen, 2000

Types of Detector Configurations Used for Types of Detector Configurations Used for Multispectral and Hyperspectral Remote SensingMultispectral and Hyperspectral Remote Sensing
Scanning Mirror
and Discrete Detectors
LensScan mirrorLinear Array “pushbroom”Objective b.Dispersing
elementLensCollimatorSlitObjectiveHyperspectral
Area Array d. a. c.Linear Array“whiskbroom”Dispersing
elementLensCollimatorObjective
apertureScan mirrorBlueNIRBlueNIR e.Lens andfiltration
Digital Frame Camera Area
Arrays
Detectors(multiple arrays)
Detectors
Jensen, 2000

Detector Configurations Detector Configurations Used for Panchromatic, Used for Panchromatic,
Multispectral and Multispectral and Hyperspectral Remote Hyperspectral Remote
SensingSensing
Jensen, 2000Jensen, 2000

Chronological Launch and Retirement History of the Landsat Satellite SeriesChronological Launch and Retirement History of the Landsat Satellite Series
Jensen, 2000Jensen, 2000

Landsat Multispectral Scanning System (MSS)Landsat Multispectral Scanning System (MSS)
Jensen, 2000Jensen, 2000
Attitude-control subsystem
Wideband recorder electronics
Attitudemeasurement
sensor
Multispectral Scanner (MSS)Return Beam
Vidicon (RBV) cameras (3)
Data collection
antenna
Solar array

Inclination of the Landsat Orbit to Inclination of the Landsat Orbit to Maintain A Sun-synchronous OrbitMaintain A Sun-synchronous Orbit
Jensen, 2000Jensen, 2000
N
S

Landsat Multispectral Scanning System (MSS) OrbitLandsat Multispectral Scanning System (MSS) Orbit
Jensen, 2000Jensen, 2000
Orbit 16, day 2Orbit 2, day 1Orbit 15, day 2Orbit 1, day 1185 km wide2875 km at equator159 km

Jensen, 2000Jensen, 2000
Orbit Tracks of Landsat 1, 2, or 3 Orbit Tracks of Landsat 1, 2, or 3 During A Single Day of CoverageDuring A Single Day of Coverage

Jensen, 2000Jensen, 2000
Landsat 4 and 5 Worldwide Reference SystemLandsat 4 and 5 Worldwide Reference System

Components of the Components of the Landsat Multispectral Landsat Multispectral
Scanner (MSS) System Scanner (MSS) System on Landsat 1 Through 5on Landsat 1 Through 5
Jensen, 2000Jensen, 2000
Jensen, 2000Jensen, 2000
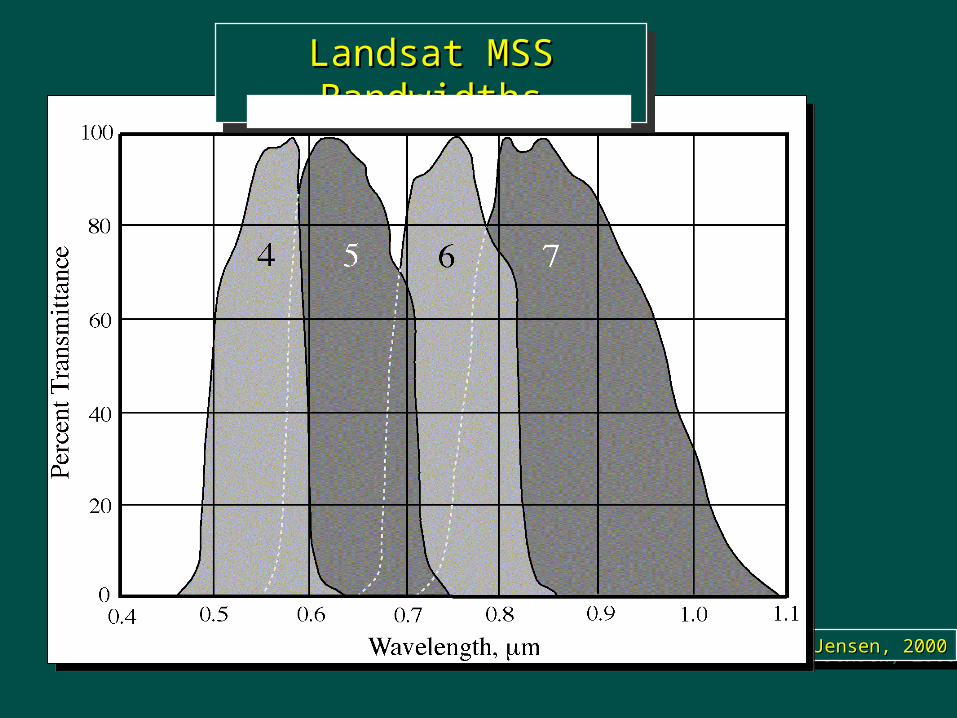
Landsat MSS BandwidthsLandsat MSS Bandwidths

Jensen, 2000Jensen, 2000
Terrestrial Images Terrestrial Images of Goleta, CA of Goleta, CA
Obtained on March Obtained on March 4, 1972 Using the 4, 1972 Using the
Landsat MSSLandsat MSS
Band 4 (0.5 - 0.6 Band 4 (0.5 - 0.6 m)m)
Band 5 (0.7 - 0.8 Band 5 (0.7 - 0.8 m)m)

Jensen, 2000Jensen, 2000
Relationship Between the Original 79 x 79 m IFOV Relationship Between the Original 79 x 79 m IFOV of the Landsat MSS and the Rate at Which It of the Landsat MSS and the Rate at Which It
Was Resampled (every 9.95 Was Resampled (every 9.95 s)s)

Jensen, 2000Jensen, 2000
Landsat 4 and 5 Platform with Associated Landsat 4 and 5 Platform with Associated Sensor and Telecommunication SystemsSensor and Telecommunication SystemsHigh-gain
antennaMultispectral
Scanner (MSS)Solararraypanel
Thematic Mapper
(TM)
Global positioningsystem antenna
Attitude controlmodule
Propulsionmodule
Power module

Jensen, 2000Jensen, 2000
Components of the Components of the Landsat 4 and 5 Landsat 4 and 5
Thematic MapperThematic Mapper

Jensen, 2000Jensen, 2000
Spectral and Spatial Resolution of the Landsat Multispectral Scanner (MSS), Spectral and Spatial Resolution of the Landsat Multispectral Scanner (MSS), Landsat 4 and 5 Thematic Mapper (TM), Landsat 7 Enhanced Thematic Landsat 4 and 5 Thematic Mapper (TM), Landsat 7 Enhanced Thematic
Mapper Plus (ETMMapper Plus (ETM++), SPOT 1, 2, and 3 High Resolution Visible (HRV), and ), SPOT 1, 2, and 3 High Resolution Visible (HRV), and SPOT 4 High Resolution Visible Infrared (HRVIR) Sensor SystemsSPOT 4 High Resolution Visible Infrared (HRVIR) Sensor Systems

Jensen, 2000Jensen, 2000
Seven Bands of Landsat Seven Bands of Landsat Thematic Mapper Data of Thematic Mapper Data of Charleston, SC, Obtained Charleston, SC, Obtained
on February 3, 1994on February 3, 1994

Jensen, 2000Jensen, 2000
Reflectance of the Upper Surface of A Reflectance of the Upper Surface of A Sycamore Leaf at Different Moisture ContentsSycamore Leaf at Different Moisture Contents

Jensen, 2000
Landsat 7 Enhanced Thematic Mapper Plus

Landsat 7 Image of Landsat 7 Image of Palm Spring, CA Palm Spring, CA
30 x 30 m 30 x 30 m (bands 4,3,2 = RGB)(bands 4,3,2 = RGB)
Jensen, 2000Jensen, 2000

Landsat 7 Image of Landsat 7 Image of Palm Spring, CA Palm Spring, CA
30 x 30 m 30 x 30 m (bands 7,4,2 = RGB)(bands 7,4,2 = RGB)
Jensen, 2000Jensen, 2000

First Landsat 7 ETMFirst Landsat 7 ETM++ Image Obtained Image Obtained over Sioux Falls, SD on April 18, 1999over Sioux Falls, SD on April 18, 1999
Jensen, 2000

Schematic of the Landsat Enhanced Schematic of the Landsat Enhanced Thematic Mapper Plus (ETMThematic Mapper Plus (ETM++))
Jensen, 2000

GOES East and West CoverageGOES East and West Coverage140˚E 180˚E 20˚E Useful GOES
coverage Communication
range GOES
West GOES
East 140˚W 100˚W 60˚W 20˚W GOES
West GOESEast

GOES Imager Optical ElementsGOES Imager Optical ElementsD D D D D Visible detectors (8) Spectral balance filter Dichroic beamsplitter (Db) Db Collimating lens Mirror Primary mirror Secondary mirror Mirror Mirror Db focuslens vacuumwindow cooler window 10.7 12 6.75 3.9 Colliating
lens filter filter filter Depolarizer Visible bandpass filter Radiant flux (Φ)fro the terrain
4 5 3 2 1 filter 0.52 – 0.72
Jensen, 2000Jensen, 2000

GOES East and West CoverageGOES East and West Coverage
GOES East GOES East InfraredInfrared
August 25, 1989August 25, 1989
GOES East GOES East VisibleVisible
August 25, 1989August 25, 1989
Jensen, 2000Jensen, 2000

GOES East GOES East August 25, 1989August 25, 1989
GOES East InfraredGOES East Infrared GOES East VisibleGOES East Visible
GOES East GOES East Water VaporWater Vapor
Jensen, 2000Jensen, 2000

Advanced Very High Resolution Radiometer Advanced Very High Resolution Radiometer (AVHRR) Data Acquisition Characteristics(AVHRR) Data Acquisition Characteristics
Satellite or local zenith
angle
Zenith line
Solar zenith angle
typical scan pointEarth
(center)SunNOAA Polar
OrbiterSatellite
scan angleSatellite subpoint (nadir)
Jensen, 2000Jensen, 2000

Advanced Very High Advanced Very High Resolution Radiometer Resolution Radiometer (AVHRR) Bandwidths(AVHRR) Bandwidths
Jensen, 2000Jensen, 2000

Advanced Very High Advanced Very High Resolution Radiometer Resolution Radiometer
(AVHRR) Imagery(AVHRR) Imagery
Jensen, 2000Jensen, 2000

Advanced Very High Resolution Radiometer Advanced Very High Resolution Radiometer (AVHRR) Mosaic of the Conterminous United States(AVHRR) Mosaic of the Conterminous United States
Jensen, 2000Jensen, 2000

Global Normalized Difference Vegetation Index Global Normalized Difference Vegetation Index (NDVI) Image Produced Using Advanced Very High (NDVI) Image Produced Using Advanced Very High
Resolution Radiometer (AVHRR) ImageryResolution Radiometer (AVHRR) Imagery
Jensen, 2000Jensen, 2000

Characteristics of the Daedalus Airborne Multispectral Scanner (AMS)Characteristics of the Daedalus Airborne Multispectral Scanner (AMS)
Jensen, 2000Jensen, 2000

Near-infrared Band 6 (0.76 - 0.90 Near-infrared Band 6 (0.76 - 0.90 m) Airborne Terrestrial Applications m) Airborne Terrestrial Applications Sensor (ATLAS) Image of Sullivan’s Island, SC Obtained October 15, 1998Sensor (ATLAS) Image of Sullivan’s Island, SC Obtained October 15, 1998
Jensen, 2000Jensen, 2000

CAMS Band 6 (0.76 - 0.90 CAMS Band 6 (0.76 - 0.90 m) data acquired on m) data acquired on September 23, 1996 and scanned at 2.5 x 2.5 mSeptember 23, 1996 and scanned at 2.5 x 2.5 m
Sun City near Hilton Head, South CarolinaSun City near Hilton Head, South Carolina
Jensen, 2000

CAMS Band 6 (0.76 - 0.90 m) at 2.5 x 2.5 m (September 23, 1996)
Scanned NAPP (0.70 - 0.90 m) at 2.5 x 2.5 m (January 22, 1994)
Color compositeRGB = CAMS, NAPP, none
Sun City near Hilton Head, South CarolinaSun City near Hilton Head, South Carolina
Jensen, 2000

Pre-dawn Thermal Pre-dawn Thermal Infrared Imagery of Infrared Imagery of the Four Mile Creek the Four Mile Creek
Plume in the Plume in the Savannah River near Savannah River near
Augusta, GeorgiaAugusta, Georgia
Jensen, 2000

Chronological Launch History of the SPOT SatellitesChronological Launch History of the SPOT Satellites
Jensen, 2000

SPOT Satellite SPOT Satellite System System
ComponentsComponents
Jensen, 2000
Courtesy of Courtesy of SPOT Image, Inc.SPOT Image, Inc.

Scanning Electron Scanning Electron Microscope Image of the Microscope Image of the Front Surface of a CCD Front Surface of a CCD Linear Array Like that Linear Array Like that
Used in the SPOT HRV Used in the SPOT HRV Sensor SystemsSensor Systems
Jensen, 2000
100 m
10 m
Courtesy of Courtesy of SPOT Image, Inc.SPOT Image, Inc.

SPOT NADIR ViewSPOT NADIR View
Jensen, 2000
60 km swath width
3 km overlap
117 km total width

SPOT Off -NADIR ViewSPOT Off -NADIR View
Jensen, 2000
Nadir data collection
Off-Nadir Viewing
Off-nadir data
collection
Orbital track at nadir

SPOT Off -NADIR Revisit CapabilitiesSPOT Off -NADIR Revisit Capabilities
Jensen, 2000

SPOT Stereoscopic Viewing CapabilitiesSPOT Stereoscopic Viewing Capabilities
Jensen, 2000
Stereoscopic model
Pass on day DPass on day D+1

Comparison of the Detail ofComparison of the Detail of30 x 30 m Landsat TM Band 3 Data 30 x 30 m Landsat TM Band 3 Data and SPOT 10 x 10 m Panchromatic and SPOT 10 x 10 m Panchromatic
Data of Charleston, SCData of Charleston, SC
Jensen, 2000
Courtesy of Courtesy of SPOT Image, Inc.SPOT Image, Inc.

Geographic Coverage of the SPOT HRV and Landsat Geographic Coverage of the SPOT HRV and Landsat Thematic Mapper Remote Sensing SystemsThematic Mapper Remote Sensing Systems
Jensen, 2000

Columbia Reef on Cozumel Island, Mexico
SPOT XS Band 1 SPOT XS Band 1 (0.50 - 0.59 (0.50 - 0.59 m) April 19, 1988m) April 19, 1988
Perimeter = 80,880 haPerimeter = 80,880 haArea = 398 mArea = 398 m22
Courtesy of Courtesy of SPOT Image, Inc.SPOT Image, Inc. Jensen, 2000

Portion of the First Global Portion of the First Global 10-day Synthesis Image 10-day Synthesis Image
Produced Using the SPOT Produced Using the SPOT Vegetation Sensor Vegetation Sensor
May 11-20, 1998May 11-20, 1998
Jensen, 2000Courtesy of SPOT Image, Inc.Courtesy of SPOT Image, Inc.

Indian Remote Sensing Indian Remote Sensing Satellite (IRS-1D) Satellite (IRS-1D)
Panchromatic Image of Panchromatic Image of Downtown San Diego, Downtown San Diego,
CA at 5 x 5 mCA at 5 x 5 m
Jensen, 2000

Multi-angle Imaging Multi-angle Imaging Spectroradiometer Spectroradiometer
(MISR) Onboard (MISR) Onboard TerraTerra
70.5˚ Df 60˚ Cf 45.6˚ Bf 0˚ nadir 70.5˚ Da 60˚ Ca 26.1˚ Af 26.1˚ Aa 45.6˚ Ba425 – 467 nmSensorsView angle 70.5˚ 60˚ 60˚ 70.5˚ 45.6˚ 45.6˚ 26.1˚ 26.1˚ 0˚ DfCf BfAfAnAaBaCaDa 275 x 275 m 1.1 x 1.1 km 275 m x 1.1 km543 – 571 nm660 – 682 nm846 – 886 nm
Jensen, 2000

IKONOS IKONOS Panchromatic Images Panchromatic Images
of Washington, DCof Washington, DC
Jensen, 20001 x 1 m spatial resolution1 x 1 m spatial resolution

IKONOS Panchromatic Stereopair of Columbia, SC AirportIKONOS Panchromatic Stereopair of Columbia, SC Airport
November 15, 2000November 15, 2000Jensen, 2000

IKONOS Imagery of Columbia, SC Obtained on October 28, 2000IKONOS Imagery of Columbia, SC Obtained on October 28, 2000
Panchromatic 1 x 1 mPanchromatic 1 x 1 m Pan-sharpened multispectral 4 x 4 mPan-sharpened multispectral 4 x 4 m

Imaging SpectrometryImaging Spectrometry
Jensen, 2000

NASA AVIRIS: Advanced Visible Infrared Imaging Spectrometer
Jensen, 2000

Airborne Visible Airborne Visible Infrared Imaging Infrared Imaging
Spectrometer Spectrometer (AVIRIS) Datacube of (AVIRIS) Datacube of
Sullivan’s Island Sullivan’s Island Obtained on Obtained on
October 26, 1998October 26, 1998
Jensen, 2000

Hyperspectral Crop Hyperspectral Crop Classification Using Classification Using
AVIRIS DataAVIRIS Data
Jensen, 2000

Area Array Pushbroom Imaging Spectrometer ConceptArea Array Pushbroom Imaging Spectrometer Concept
Jensen, 2000
512 pixels
512 pixels

Positive Systems, Inc., ImageryPositive Systems, Inc., Imagery
GreenGreen RedRed Near-InfraredNear-Infrared
System ComponentsSystem Components Jensen, 2000Jensen, 2000

Emerge Spatial, Inc., ImageryEmerge Spatial, Inc., Imagery
GreenGreen RedRed Near-InfraredNear-Infrared
Jensen, 2000

Litton Emerge Spatial, Inc., CIR image Litton Emerge Spatial, Inc., CIR image (RGB = NIR,R,G) of Dunkirk, NY, at 1 (RGB = NIR,R,G) of Dunkirk, NY, at 1 x 1 m obtained on December 12, 1998x 1 m obtained on December 12, 1998
Natural color image (RGB = RGB) of Natural color image (RGB = RGB) of a N.Y. Power Authority lake at 1 x 1 a N.Y. Power Authority lake at 1 x 1
ft obtained on October 13, 1997ft obtained on October 13, 1997
Jensen, 2000

Digital Frame Camera Imagery of Harbour Town, Hilton Head, SCDigital Frame Camera Imagery of Harbour Town, Hilton Head, SC
1 x 1 ft 1 x 1 ft spatial spatial
resolutionresolution

SPIN-2SPIN-2
Jensen, 2000

Earth Observing System - Earth Observing System - TerraTerra Instruments Instruments
ASTERASTER - Advanced Spaceborne Thermal Emission and Reflection - Advanced Spaceborne Thermal Emission and Reflection RadiometerRadiometerCERESCERES - Clouds and the Earth’s Radiant Energy System - Clouds and the Earth’s Radiant Energy SystemMISRMISR - Multi-angle Imaging Spectroradiometer - Multi-angle Imaging SpectroradiometerMODISMODIS - Moderate-resolution Imaging Spectroradiometer - Moderate-resolution Imaging SpectroradiometerMOPITTMOPITT - Measurement of Pollution in the Troposphere - Measurement of Pollution in the Troposphere
Jensen, 2000Jensen, 2000

DisciplineDiscipline EOS-AM InstrumentsEOS-AM InstrumentsMeasurementMeasurement
AtmosphereAtmosphere Cloud Properties Cloud Properties MODIS, MISR, ASTERMODIS, MISR, ASTERRadiative Energy FluxesRadiative Energy Fluxes CERES, MODIS, MISRCERES, MODIS, MISRPrecipitationPrecipitationTropospheric ChemistryTropospheric Chemistry MOPITTMOPITTStratospheric ChemistryStratospheric ChemistryAerosol PropertiesAerosol Properties MISR, MODISMISR, MODISAtmospheric TemperatureAtmospheric Temperature MODISMODISAtmospheric HumidityAtmospheric Humidity MODISMODISLightningLightning
Earth Observing System MeasurementsEarth Observing System Measurements
Jensen, 2000Jensen, 2000

DisciplineDiscipline EOS-AM InstrumentsEOS-AM InstrumentsMeasurementMeasurement
LandLand Land Cover/Land Use ChangeLand Cover/Land Use Change MODIS, MISR, ASTERMODIS, MISR, ASTERVegetation DynamicsVegetation Dynamics MODIS, MISR, ASTERMODIS, MISR, ASTERSurface TemperatureSurface Temperature MODIS, ASTERMODIS, ASTERFire OccurrenceFire Occurrence MODIS, ASTERMODIS, ASTERVolcanic EffectsVolcanic Effects MODIS, MISR, ASTERMODIS, MISR, ASTERSurface WetnessSurface Wetness
Earth Observing System MeasurementsEarth Observing System Measurements
Jensen, 2000Jensen, 2000

DisciplineDiscipline EOS-AM InstrumentsEOS-AM InstrumentsMeasurementMeasurement
OceanOcean Surface TemperatureSurface Temperature MODISMODISPhytoplankton Phytoplankton MODIS, MISRMODIS, MISRDissolved Organic MatterDissolved Organic Matter MODIS, MISRMODIS, MISRSurface Wind FieldsSurface Wind FieldsOcean Surface TopographyOcean Surface Topography
CryosphereCryosphere Land Ice ChangeLand Ice Change ASTERASTERSea IceSea Ice MODIS, ASTERMODIS, ASTERSnow CoverSnow Cover MODIS, ASTERMODIS, ASTER
Solar RadiationSolar Radiation Total Solar RadiationTotal Solar RadiationUltraviolet Spectral IrradianceUltraviolet Spectral Irradiance
Earth Observing System MeasurementsEarth Observing System Measurements

Earth Observing System - Earth Observing System - TerraTerra Instruments Instruments
MODIS - MODIS - Moderate-resolution Imaging SpectroradiometerModerate-resolution Imaging Spectroradiometer
Spectral RangeSpectral Range 0.4 - 14.4 0.4 - 14.4 mmSpectral CoverageSpectral Coverage ++55˚, 2330 km swath55˚, 2330 km swathSpatial ResolutionSpatial Resolution 250 m (2 bands), 500 m (5 bands), 1000 m (29 bands) 250 m (2 bands), 500 m (5 bands), 1000 m (29 bands)
ASTER - ASTER - Advanced Spaceborne Thermal Emission and Reflection Advanced Spaceborne Thermal Emission and Reflection RadiometerRadiometer
Spectral RangeSpectral Range VNIR 0.4 - 14.4 VNIR 0.4 - 14.4 m, SWIR 1.6 - 2.5 m, SWIR 1.6 - 2.5 m, TIR 8 - 12 m, TIR 8 - 12 mmSpatial ResolutionSpatial Resolution 15 m (VNIR : 3 bands) 15 m (VNIR : 3 bands)
30 m (SWIR: 6 bands)30 m (SWIR: 6 bands) 90 m (TIR: 5 bands) 90 m (TIR: 5 bands) Jensen, 2000Jensen, 2000

Panchromatic 3 x 3-in Image of Popular Bluff, MO Obtained Panchromatic 3 x 3-in Image of Popular Bluff, MO Obtained On February 15, 2000 at 5,000 ft AGL Using A Digital On February 15, 2000 at 5,000 ft AGL Using A Digital Array Panoramic Camera with 32,000 x 8,000 DetectorsArray Panoramic Camera with 32,000 x 8,000 Detectors
Courtesy of Image America, Inc.Courtesy of Image America, Inc.
Swath widthSwath width1.5 mi1.5 mi
Jensen, 2000Jensen, 2000