santos 2017 full-year results · santos 2017 full-year results 2 this presentation contains forward...
TRANSCRIPT
Santos 2017 Full-year results
21 February 2018
Disclaimer and important notice
Santos 2017 Full-Year Results 2
This presentation contains forward looking statements that are subject to risk factors associated with the oil and gas industry. It is believed that the expectations reflected in these statements are reasonable, but they may be affected by a range of variables which could cause actual results or trends to differ materially, including but not limited to: price fluctuations, actual demand, currency fluctuations, geotechnical factors, drilling and production results, gas commercialisation, development progress, operating results, engineering estimates, reserve estimates, loss of market, industry competition, environmental risks, physical risks, legislative, fiscal and regulatory developments, economic and financial markets conditions in various countries, approvals and cost estimates.
All references to dollars, cents or $ in this document are to United States currency, unless otherwise stated.
EBITDAX (earnings before interest, tax, depreciation, depletion, exploration, evaluation and impairment), EBIT (earnings before interest and tax), underlying profit and free cash flow (operating cash flows less investing cash flows net of acquisitions and disposals) are non-IFRS measures that are presented to provide an understanding of the performance of Santos’ operations. Underlying profit excludes the impacts of asset acquisitions, disposals and impairments, as well as items that are subject to significant variability from one period to the next, including the effects of fair value adjustments and fluctuations in exchange rates. The non-IFRS financial information is unaudited however the numbers have been extracted from the audited financial statements.
This presentation refers to estimates of petroleum reserves contained in Santos’ Annual Report released to the ASX on 21 February 2018 (Annual Reserves Statement). Santos confirms that it is not aware of any new information or data that materially affects the information included in the Annual Reserves Statement and that all the material assumptions and technical parameters underpinning the estimates in the Annual Reserves Statement continue to apply and have not materially changed.
The estimates of petroleum reserves contained in this presentation are as at 31 December 2017. Santos prepares its petroleum reserves estimates in accordance with the Petroleum Resources Management System (PRMS) sponsored by the Society of Petroleum Engineers (SPE). Unless otherwise stated, all references to petroleum reserves quantities in this presentation are Santos’ net share. Reference points for Santos’ petroleum reserves and production are defined points within Santos’ operations where normal exploration and production business ceases, and quantities of produced product are measured under defined conditions prior to custody transfer. Fuel, flare and vent consumed to the reference points are excluded. Petroleum reserves are aggregated by arithmetic summation by category and as a result, proved reserves may be a very conservative estimate due to the portfolio effects of arithmetic summation. Petroleum reserves are typically prepared by deterministic methods with support from probabilistic methods. Petroleum reserves replacement ratio is the ratio of the change in petroleum reserves (excluding production) divided by production. Organic reserves replacement ratio excludes net acquisitions and divestments.Conversion factors: 1PJ of sales gas and ethane equals 171,937 boe; 1 tonne of LPG equals 8.458 boe; 1 barrel of condensate equals 0.935 boe; 1 barrel of crude oil equals 1 boe.

Turnaround delivered ahead of plan
Santos now well-positioned to unlock significant shareholder value and capitalise on a clear strategy to Build and Grow the business
Santos 2017 Full-Year Results 3
Strengthened the balance sheet
Simplified the portfolio
Reduced costs and increased efficiencies
Advanced significant growth opportunities
Embedded a new disciplined operating model
Delivered a strong operating performance
Underlying NPAT
2017 Full-year highlights
Significant turnaround in business performance
Santos 2017 Full-Year Results 4
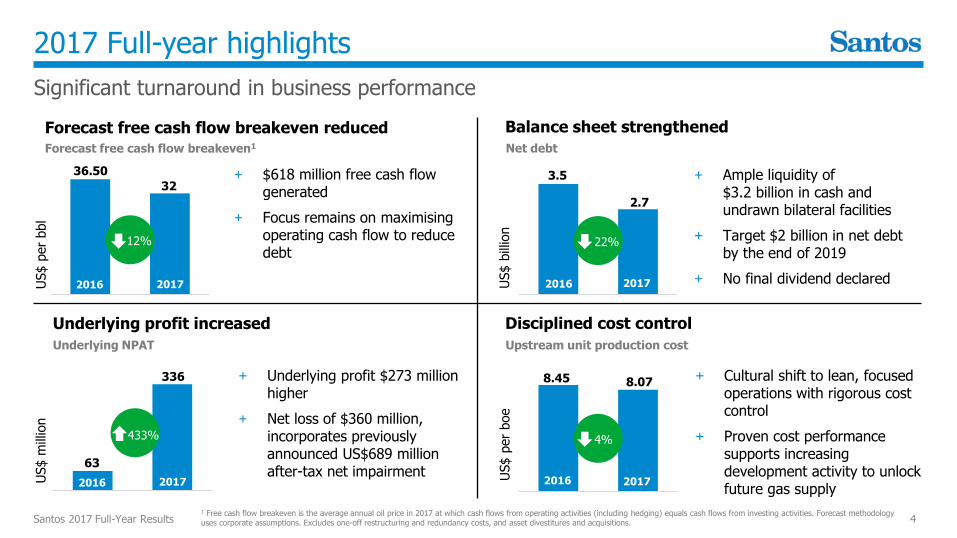
Forecast free cash flow breakeven reduced
36.50
32
US$ p
er
bbl
2016 2017
Disciplined cost control
US$ p
er
boe
8.45 8.07
Balance sheet strengthened
US$ b
illio
n
3.5
2.7
2016 2017
2016 2017
+ $618 million free cash flow generated
+ Focus remains on maximising operating cash flow to reduce debt
+ Cultural shift to lean, focused operations with rigorous cost control
+ Proven cost performance supports increasing development activity to unlock future gas supply
+ Ample liquidity of $3.2 billion in cash and undrawn bilateral facilities
+ Target $2 billion in net debt by the end of 2019
+ No final dividend declared
Underlying profit increased
63
336
US$ m
illio
n
2016 2017
+ Underlying profit $273 million higher
+ Net loss of $360 million, incorporates previously announced US$689 million after-tax net impairment
Forecast free cash flow breakeven1 Net debt
Upstream unit production cost
1 Free cash flow breakeven is the average annual oil price in 2017 at which cash flows from operating activities (including hedging) equals cash flows from investing activities. Forecast methodology uses corporate assumptions. Excludes one-off restructuring and redundancy costs, and asset divestitures and acquisitions.
12% 22%
4%433%

Strong free cash generation
$1.4 billion turnaround in free cash generation in two years
Santos 2017 Full-Year Results 5
Free cash flow1
US$ million
(739)
2016 2017
206
2015
618
+ 2018 forecast free cash flow breakeven ~$36/bbl2
+ includes all 2018 forecast capex
+ Every $10/bbl increment in oil price above free cash flow breakeven increases free cash flow by $250-300 million per annum
+ Priorities for cash allocation
+ Debt repayment
+ Fund exploration
+ Fund growth projects
+ Returns to shareholders
1 Operating cash flows less investing cash flows net of acquisitions and disposals. 2 Free cash flow breakeven is the average annual oil price in 2018 at which cash flows from operating activities (including hedging) equals cash flows from investing activities. Forecast methodology uses corporate assumptions. Excludes one-off restructuring and redundancy costs, and asset divestitures and acquisitions.

Build & Grow
Execute and bring on-line growth opportunities across the core portfolio
Santos 2017 Full-Year Results 6
PNG
+ Further debottlenecking of
existing PNG LNG plant
+ PNG LNG expansion
+ Western Area farm-in executed. JV alignment continues to strengthen
BUILD & GROW
NORTHERN AUSTRALIA
+ Barossa field
identified as lead candidate for Darwin LNG backfill. FEED targeted for 2Q 2018
+ Development study of
Petrel-Tern initiated
+ Crown-Lasseterwell positioned for backfill or expansion of existing infrastructure
COOPER BASIN
+ Expect to drill 70-80 wells in 2018 with 3 rigs to grow
production
+ Strong inventory build. >100 E&A opportunities identified
+ Accelerated exploration and appraisal focus
QUEENSLAND
+ Commercialise uncontracted Eastern Qld gas
+ Roma East sanctioned
+ Arcadia sanction targeted for 1H 2018
+ Aiming to ramp-up GLNG LNG sales to ~6 mtpa by the
end of 2019
NARRABRI
+ EIS submitted and approvals process underway
+ Introduced to coreportfolio

LOST TIME INJURY FREQUENCY RATEThree year rolling average (2012 – 2017)
Sustainability
Santos 2017 Full-Year Results 7
SAFETY & ENVIRONMENT
+ Increased focus on process safety and incidents with potential for significant harm
+ Continued focus on compliance to safety critical maintenance activities
+ Energy Solutions group evaluating and selecting new technologies to reduce emissions and increase gas supply
CLIMATE CHANGE & SUSTAINABILITY REPORTING
+ Consistently reported our greenhouse gas emissions and sustainability data since 2004
+ Inaugural Climate Change Report consistent with TCFD Guidelines published in February 2018
rate
per
mill
ion h
ours
work
ed
0.0
0.2
0.4
0.6
0.8
1.0
1.2
2012 2013 2014 2015 2016 2017
GOVERNANCE, SYSTEMS AND PROCESSES
+ Strong and streamlined governance structures and processes developed in 2017
+ Strengthened risk management processes
+ Increased focus on organisational capability development

LNG Marketing and Trading
Santos and ENN Ecological in discussions to establish an LNG trading joint venture
Santos 2017 Full-Year Results 8
+ Builds on the existing strategic relationship between Santos and ENN
+ The LNG trading joint venture will:
+ focus on the increasing LNG demand across growing Chinese and international markets
+ give both parties increased access to LNG markets
+ provide access to ENN’s Zhoushan import terminal in China
+ ENN is one of the largest natural gas distributors in China. ENN invests in and operates gas pipeline infrastructure, vehicle/ship refuelling stations, and the sales and distribution of pipeline gas and LNG
+ ENN to commission the Zhoushan import terminal (3 mtpa capacity) in 2H of 2018
+ Targeting definitive JV agreement Q2 2018
0
50
100
150
200
250
300
350
2015 2020 2025
Production Net Import (Pipe)
Net Import (LNG) Demand
Chinese gas demand
mtpa
Source: Wood Mackenzie
9% CAGR
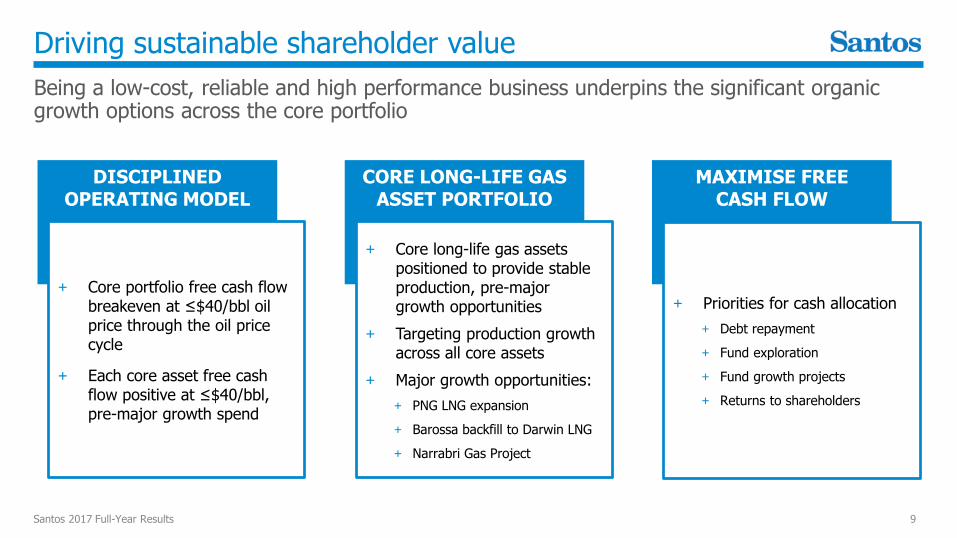
Driving sustainable shareholder value
Being a low-cost, reliable and high performance business underpins the significant organic growth options across the core portfolio
Santos 2017 Full-Year Results 9
DISCIPLINED OPERATING MODEL
CORE LONG-LIFE GAS ASSET PORTFOLIO
+ Core portfolio free cash flow breakeven at ≤$40/bbl oil price through the oil price cycle
+ Each core asset free cash flow positive at ≤$40/bbl, pre-major growth spend
MAXIMISE FREECASH FLOW
+ Priorities for cash allocation
+ Debt repayment
+ Fund exploration
+ Fund growth projects
+ Returns to shareholders
+ Core long-life gas assets positioned to provide stable production, pre-major growth opportunities
+ Targeting production growth across all core assets
+ Major growth opportunities:
+ PNG LNG expansion
+ Barossa backfill to Darwin LNG
+ Narrabri Gas Project

Finance & capital managementAnthony NeilsonCFO

Financial priorities
Santos 2017 Full-Year Results 11
Significant progress in 2017 on our financial priorities
REDUCING COSTS
+ Unit upstream production costs $8.07 per boe
+ $0.38/boe
INCREASING FREE CASH FLOW
+ Free cash flow $618 million
+ $412 million
+ excludes net cash from asset disposals and acquisitions of $96 million
REDUCING DEBT
+ Net debt$2.7 billion
+ $0.8 billion
+ Gross debt$4 billion
+ $1.6 billion
CAPITAL MANAGEMENT
+ EURO 1 billion Subordinated Notes redeemed and replaced by $800 million 10-year Reg-S bond
+ Annual interest cost savings of >$40 million per annum
+ $600 million ECA facility prepayment
2017 full-year compared to 2016 full-year outcomes
2017 Full-year financial snapshot
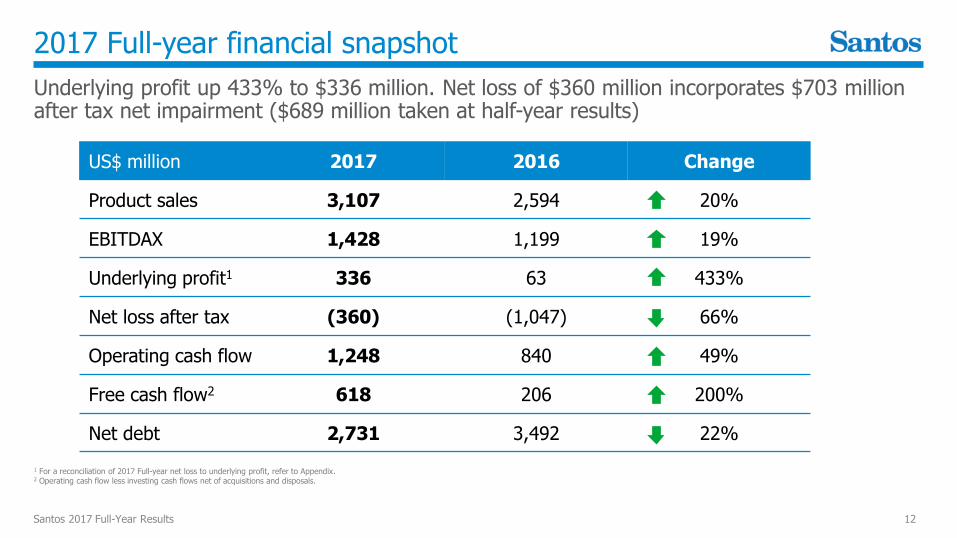
Underlying profit up 433% to $336 million. Net loss of $360 million incorporates $703 million after tax net impairment ($689 million taken at half-year results)
Santos 2017 Full-Year Results 12
1 For a reconciliation of 2017 Full-year net loss to underlying profit, refer to Appendix.2 Operating cash flow less investing cash flows net of acquisitions and disposals.
US$ million 2017 2016 Change
Product sales 3,107 2,594 20%
EBITDAX 1,428 1,199 19%
Underlying profit1 336 63 433%
Net loss after tax (360) (1,047) 66%
Operating cash flow 1,248 840 49%
Free cash flow2 618 206 200%
Net debt 2,731 3,492 22%

Strong free cash flow generation
Free cash flow up 200% to $618 million continues trend of improving free cash generation
Santos 2017 Full-Year Results 13
(1,550)
2016 2017
(634)
(739)
2016 2017
206
1%
Operating cash flow
811
2015 2016 2017
1,248
49%
840
2015
(630)2015
618
200%
US$ million
Investing cash flow1
US$ million
Free cash flow1
US$ million
1 Excludes acquisitions / divestments

Core assets Other assets
mmboe
+ Core asset production increased 4% to 51.8 mmboe, primarily due to the ramp-up of GLNG
+ Production from other assets decreased 35% to 7.7 mmboe primarily due to the sale of the Victorian, Mereenie and Stag assets
+ 2018 full-year guidance maintained at 55-60 mmboe
Production and sales volumes
Core asset production 4% higher. Core asset sales volumes 5% higher
Santos 2017 Full-Year Results 14
Production volume Sales volumemmboe
+ Core asset sales volumes 5% higher at 75.7 mmboe due to increased upstream production and third party purchases
+ Other assets 4 mmboe lower primarily due to asset sales
+ LNG sales volumes up 10% to a record 3.1 million tonnes due to strong performance from PNG LNG and the ramp-up of GLNG
+ 2018 full-year guidance maintained at 72-78 mmboe
2015 2016 2017
59.561.657.7
Own product Third party
2015 2016 2017
83.484.1
64.3
Sales revenue
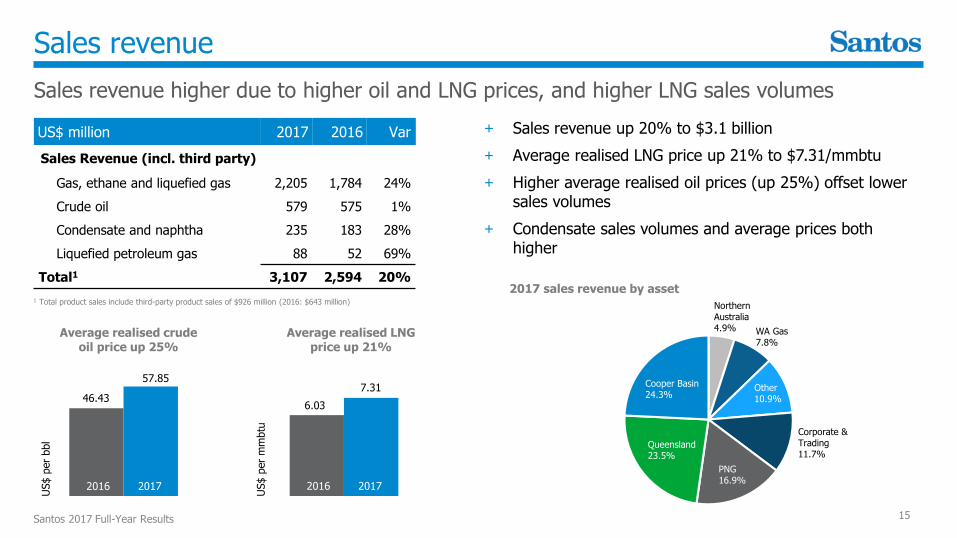
Sales revenue higher due to higher oil and LNG prices, and higher LNG sales volumes
Santos 2017 Full-Year Results 15
US$ million 2017 2016 Var
Sales Revenue (incl. third party)
Gas, ethane and liquefied gas 2,205 1,784 24%
Crude oil 579 575 1%
Condensate and naphtha 235 183 28%
Liquefied petroleum gas 88 52 69%
Total1 3,107 2,594 20%
Average realised crude oil price up 25%
Average realised LNG price up 21%
46.43
57.85
US$ p
er
bbl
US$ p
er
mm
btu
1 Total product sales include third-party product sales of $926 million (2016: $643 million)
2016 2017
6.03
7.31
2016 2017
+ Sales revenue up 20% to $3.1 billion
+ Average realised LNG price up 21% to $7.31/mmbtu
+ Higher average realised oil prices (up 25%) offset lower sales volumes
+ Condensate sales volumes and average prices both higher
2017 sales revenue by asset
Sales gas, ethane and LNG$2,205m
Oil$579m
WA Gas7.8%
Northern Australia4.9%
PNG16.9%
Other10.9%
Corporate & Trading11.7%
Queensland23.5%
Cooper Basin24.3%
Production costs
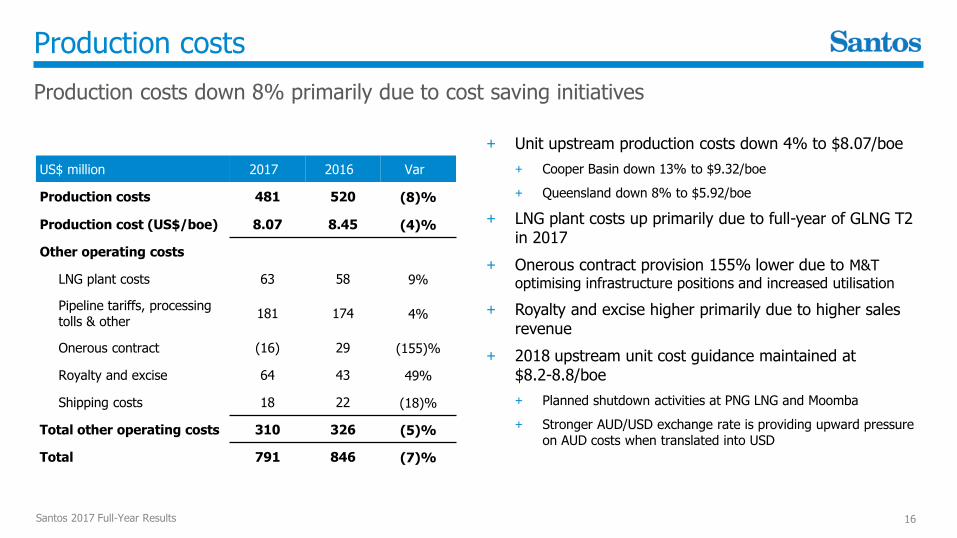
Production costs down 8% primarily due to cost saving initiatives
Santos 2017 Full-Year Results 16
US$ million 2017 2016 Var
Production costs 481 520 (8)%
Production cost (US$/boe) 8.07 8.45 (4)%
Other operating costs
LNG plant costs 63 58 9%
Pipeline tariffs, processing tolls & other
181 174 4%
Onerous contract (16) 29 (155)%
Royalty and excise 64 43 49%
Shipping costs 18 22 (18)%
Total other operating costs 310 326 (5)%
Total 791 846 (7)%
+ Unit upstream production costs down 4% to $8.07/boe
+ Cooper Basin down 13% to $9.32/boe
+ Queensland down 8% to $5.92/boe
+ LNG plant costs up primarily due to full-year of GLNG T2 in 2017
+ Onerous contract provision 155% lower due to M&T
optimising infrastructure positions and increased utilisation
+ Royalty and excise higher primarily due to higher sales revenue
+ 2018 upstream unit cost guidance maintained at$8.2-8.8/boe
+ Planned shutdown activities at PNG LNG and Moomba
+ Stronger AUD/USD exchange rate is providing upward pressure on AUD costs when translated into USD
Financial performance
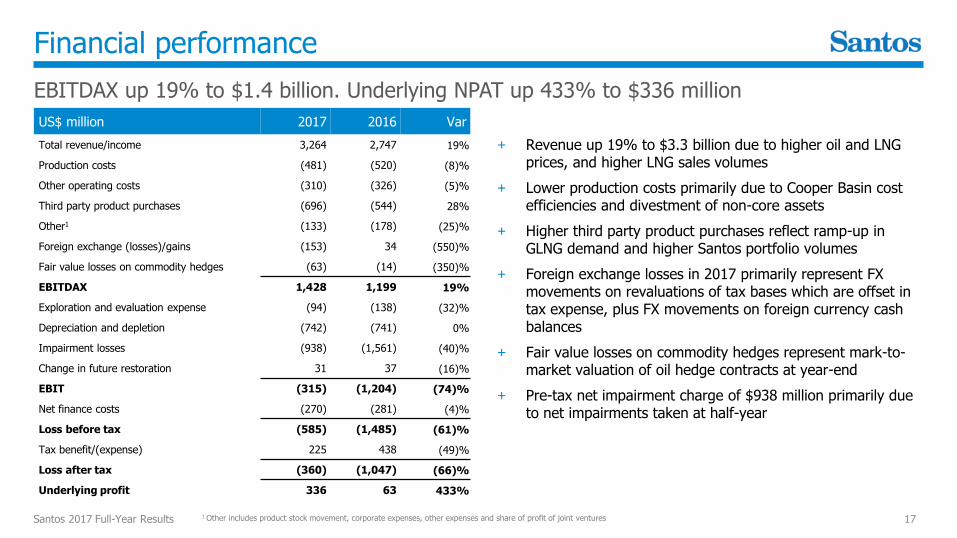
EBITDAX up 19% to $1.4 billion. Underlying NPAT up 433% to $336 million
Santos 2017 Full-Year Results 17
US$ million 2017 2016 Var
Total revenue/income 3,264 2,747 19%
Production costs (481) (520) (8)%
Other operating costs (310) (326) (5)%
Third party product purchases (696) (544) 28%
Other1 (133) (178) (25)%
Foreign exchange (losses)/gains (153) 34 (550)%
Fair value losses on commodity hedges (63) (14) (350)%
EBITDAX 1,428 1,199 19%
Exploration and evaluation expense (94) (138) (32)%
Depreciation and depletion (742) (741) 0%
Impairment losses (938) (1,561) (40)%
Change in future restoration 31 37 (16)%
EBIT (315) (1,204) (74)%
Net finance costs (270) (281) (4)%
Loss before tax (585) (1,485) (61)%
Tax benefit/(expense) 225 438 (49)%
Loss after tax (360) (1,047) (66)%
Underlying profit 336 63 433%
1 Other includes product stock movement, corporate expenses, other expenses and share of profit of joint ventures
+ Revenue up 19% to $3.3 billion due to higher oil and LNG prices, and higher LNG sales volumes
+ Lower production costs primarily due to Cooper Basin cost efficiencies and divestment of non-core assets
+ Higher third party product purchases reflect ramp-up in GLNG demand and higher Santos portfolio volumes
+ Foreign exchange losses in 2017 primarily represent FX movements on revaluations of tax bases which are offset in tax expense, plus FX movements on foreign currency cash balances
+ Fair value losses on commodity hedges represent mark-to-market valuation of oil hedge contracts at year-end
+ Pre-tax net impairment charge of $938 million primarily due to net impairments taken at half-year

Capital expenditure
Full-year capex $682 million. 2018 capex guidance maintained at $825-875 million
Santos 2017 Full-Year Results
18
2017 Full-year capital expenditure1
1 Capital expenditure incurred includes abandonment expenditure but excludes capitalised interest
+ Capital expenditure of $682 million
+ includes Muruk acquisition and exploration drilling costs (Exploration)
+ Barossa appraisal drilling (Northern Australia)
+ 2018 capital expenditure guidance maintained at$825-875 million
+ Cooper Basin 3-rig program drilling 70-80 wells
+ GLNG drilling ~250 wells
+ PNG LNG Angore pipeline and surface facilities
+ Northern Australia Bayu-Undan 3-well infill program and Barossa FEED
Capital expenditure1
US$ million
WA Gas$37m
Northern Australia$55m
PNG$18m
Other$81m
Corporate & Exploration$114m
Queensland$178m
Cooper Basin$199m
2015 2016 2017
1,288
625 682

Opening netdebt (31 Dec
2016)
Net cashfrom assetdisposals
andacquisitions
Operatingcash flow
Investingcash flow
SharePurchase
Plan
Other noncash
Closing netdebt (31 Dec
2017)
Net debt reduced to $2.7 billion
Target $2 billion in net debt by the end of 2019
Santos 2017 Full-Year Results 19
+ Net debt reduced to $2.7 billion1 through a combination of free cash flow, previously announced asset sales and proceeds from the Share Purchase Plan
+ Focus remains on using surplus cash flow for debt reduction
+ Gross debt reduced to $4 billion, down $1.6 billion
+ Annual interest cost savings of >$40 million per annum
+ S&P BBB- (stable) credit rating
+ Liquidity of $3.2 billion1
+ $1.2 billion in cash
+ $2 billion in undrawn bi-lateral bank debt facilities
Movement in net debt to 31 December 2017
$ million
630
(149)
102
2,731
(1,248)
(96)3,492
1 As at 31 December 2017

0
300
600
900
1,200
2018 2019 2020 2021 2022 2023 2024 2025 2026 2027
Long-term notes ECA supported loan facilities
PNG LNG project finance Reg-S Bond
Senior unsecured58%
PNG LNG project
finance (non-recourse)
42%
Drawn debt maturity profile
Euro hybrid redeemed and replaced with more efficient long-term debt funding.Early repayment of $600 million 2019 ECA supported loan facility occurred in 2017
Santos 2017 Full-Year Results 20
Breakdown of drawn debt facilities as at 31 December 20171
¹ Excludes finance leases and derivatives.
Drawn debt maturity profile as at 31 December 20171
219
972
209244
490
317289
253
124
$million
815
+ Weighted average term to maturity ~5 years
0
300
600
900
1,200
2018 2019 2020 2021 2022 2023 2024 2025 2026 2027
Long-term notes ECA supported loan facilities Reg-S Bond
64
808
60 62
277
68 70
18 -
$million
815
Drawn debt maturity profile excluding PNG LNG as at 31 December 20171

Summary
In 2018 the focus remains on reducing costs, increasing free cash flow, reducing debt and disciplined capital management
Santos 2017 Full-Year Results 21
REDUCING COSTS
+ Cost out continuing in 2018 for core and non-core assets
+ Lower cost base allows increase in activity to build and grow the business
INCREASING FREE CASH FLOW
+ Forecast 2018 group free cash flow breakeven expected to be ~$36/bbl oil price
+ Disciplined model, all core assets free cash flow breakeven ≤$40/bbl oil price
REDUCING DEBT
+ Target $2 billion in net debt by the end of 2019
+ Further gross debt reduction through free cash flow
CAPITAL MANAGEMENT
+ Capital management strategy in place and continues to target efficient debt funding
+ Prudent oil price hedging

Operations reviewKevin GallagherManaging Director & CEO

Northern Australia
Three significant multi-Tcf resource hubs well positioned for backfill or expansion of existing infrastructure
Santos 2017 Full-Year Results 23
+ Bonaparte Basin
+ Two-well appraisal campaign strengthened Barossa (Santos 25%)
as lead candidate for Darwin LNG backfill
+ Significant increase in resource size
+ Brownfield development leveraging existing infrastructure
+ FEED targeted for Q2 2018 and FID in late 2019
+ Development study of Petrel-Tern initiated (Santos 35-40%)
+ Browse Basin
+ Retention leases secured over Crown-Lasseter fields (Santos 30%
and operator); well positioned for backfill or expansion of existing infrastructure
+ Evaluating monetisation opportunities
+ Material exploration inventory
Bayu-Undan
Barossa
Caldita
Petrel
Tern
Icthys CPF
Wadeye gas plant
IcthysLNG
Prelude
Crown
Lasseter
Darwin LNG
Blacktip

Northern Australia
Strong Darwin LNG performance and successful Barossa appraisal campaign
Santos 2017 Full-Year Results 24
Asset KPIs 2017 2016
Production (mmboe) 4.0 4.2
Sales volume (mmboe) 4.0 4.2
Revenue (US$m) 153 145
Production cost (US$/boe) 18.95 17.58
EBITDAX (US$m) 87 86
Capex (US$m) 55 14
+ Darwin LNG continues to achieve excellent reliability and availability (Santos 11.5%)
+ 51 LNG cargoes shipped in 2017
+ 3.3 million tonnes of LNG produced
+ Bayu-Undan in-fill program expected to deliver first gas in Q4 2018
+ EBITDAX in-line with prior year
+ Capex higher due to successful Barossa two-well appraisal campaign
EBITDAX
US$ m
illio
n
86
2016 2017
87
1%
PNG
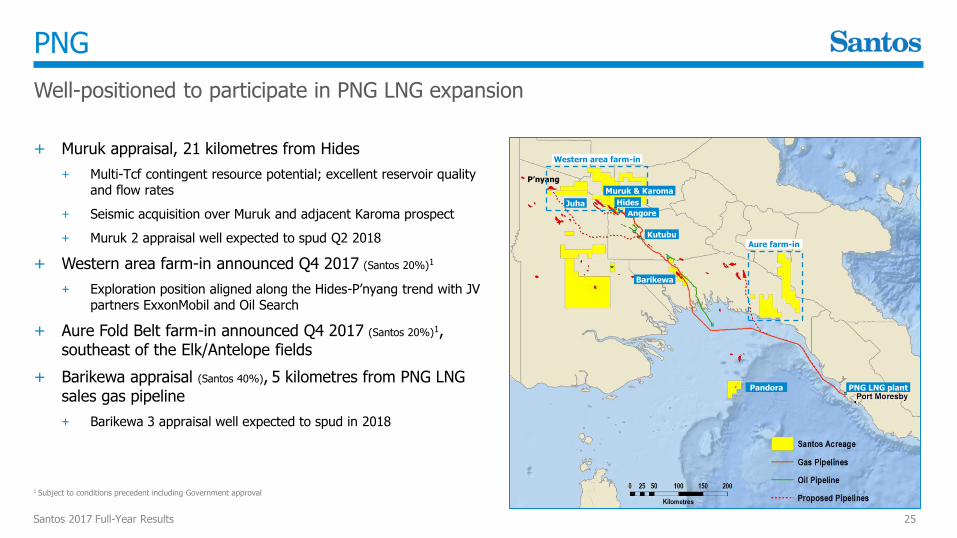
Well-positioned to participate in PNG LNG expansion
Santos 2017 Full-Year Results 25
+ Muruk appraisal, 21 kilometres from Hides
+ Multi-Tcf contingent resource potential; excellent reservoir quality and flow rates
+ Seismic acquisition over Muruk and adjacent Karoma prospect
+ Muruk 2 appraisal well expected to spud Q2 2018
+ Western area farm-in announced Q4 2017 (Santos 20%)1
+ Exploration position aligned along the Hides-P’nyang trend with JV partners ExxonMobil and Oil Search
+ Aure Fold Belt farm-in announced Q4 2017 (Santos 20%)1, southeast of the Elk/Antelope fields
+ Barikewa appraisal (Santos 40%), 5 kilometres from PNG LNG sales gas pipeline
+ Barikewa 3 appraisal well expected to spud in 2018
Hides
PNG LNG plantPandora
Barikewa
Angore
Muruk & Karoma
Juha
Kutubu
P’nyang
1 Subject to conditions precedent including Government approval
Western area farm-in
Aure farm-in

PNG
Record PNG LNG performance
Santos 2017 Full-Year Results 26
Asset KPIs 2017 2016
Production (mmboe) 12.6 12.2
Sales volume (mmboe) 12.0 11.8
Revenue (US$m) 532 444
Production cost (US$/boe) 4.37 4.59
EBITDAX (US$m) 430 350
Capex (US$m) 18 8
+ EBITDAX 23% higher due to higher LNG prices, strong operating performance and lower unit costs
+ 110 LNG cargoes shipped in 2017
+ PNG LNG maximum day rate of 8.9 mtpa achieved, 30% above nameplate capacity (Santos 13.5%)
+ Further debottlenecking opportunities
+ Continue to work with partners to align interests to support expansion opportunities
+ PNG LNG reserves upgrade due to continued strong Hides field performance, including an upgraded condensate forecast, and improved LNG plant performance
EBITDAX
US$ m
illio
n
350
2016 2017
430
23%
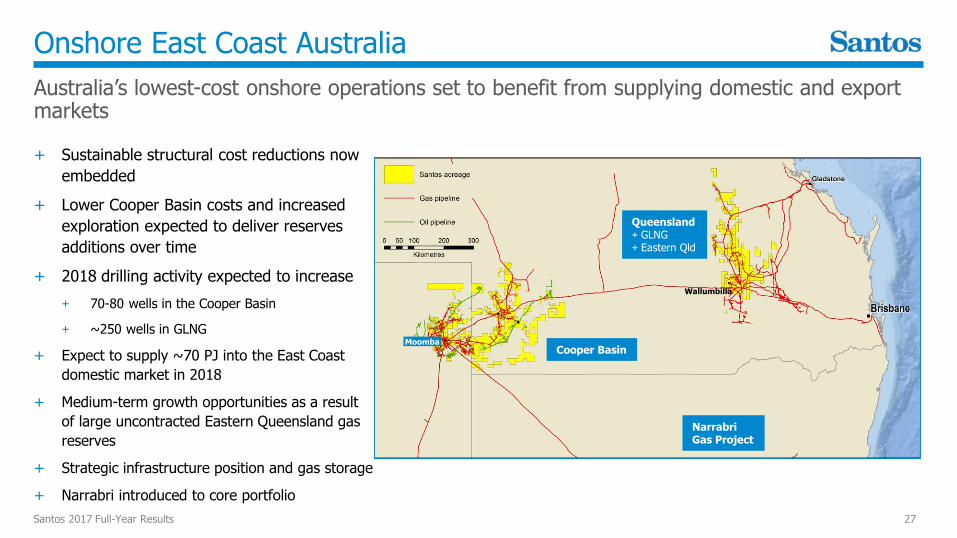
Onshore East Coast Australia
Australia’s lowest-cost onshore operations set to benefit from supplying domestic and export markets
Santos 2017 Full-Year Results 27
+ Sustainable structural cost reductions now
embedded
+ Lower Cooper Basin costs and increased
exploration expected to deliver reserves
additions over time
+ 2018 drilling activity expected to increase
+ 70-80 wells in the Cooper Basin
+ ~250 wells in GLNG
+ Expect to supply ~70 PJ into the East Coast
domestic market in 2018
+ Medium-term growth opportunities as a result
of large uncontracted Eastern Queensland gas
reserves
+ Strategic infrastructure position and gas storage
+ Narrabri introduced to core portfolio
Queensland+ GLNG+ Eastern Qld
Cooper Basin Moomba
Wallumbilla
NarrabriGas Project

Queensland1
Stronger asset performance due to ramp-up of GLNG and lower costs
Santos 2017 Full-Year Results 28
Asset KPIs 2017 2016
Production (mmboe) 11.5 9.5
Sales volume (mmboe) 22.7 19.2
Revenue (US$m) 764 540
Production cost (US$/boe) 5.92 6.44
EBITDAX (US$m) 329 191
Capex (US$m) 178 228
+ EBITDAX 72% higher due to increased upstream production, higher
third-party volumes, lower cost operations and higher LNG prices
+ Unit production costs down 8% to $5.92/boe
+ Lowest cost onshore operator in Queensland
+ Roma drill-complete-connect well costs down 44% to
$0.9 million
+ GLNG produced 5.2 million tonnes of LNG in 2017 with 89 cargoes
shipped
+ Roma 2B and 3A projects complete, Scotia CF1 project >70%
complete and ahead of schedule
+ Roma East development drilling commenced
+ Progressing Arcadia development toward sanction by end of
1H 2018
+ Agreements executed to evacuate uncontracted Eastern
Queensland gas
EBITDAX
US$ m
illio
n
191
2016 2017
329
72%
1 Queensland asset segment was previously called GLNG. The assets included in the segment are unchanged and include the GLNG Joint Venture plus Santos’ non-operated interests in Combabula, Ramyard, Spring Gully and Denison.

Cooper Basin
Transformed to low-cost, efficient drill-complete-connect operations
Santos 2017 Full-Year Results 29
Asset KPIs 2017 2016
Production (mmboe) 14.4 15.1
Sales volume (mmboe) 21.0 23.5
Revenue (US$m) 833 768
Production cost (US$/boe) 9.32 10.71
EBITDAX (US$m) 328 258
Capex (US$m) 199 173
+ EBITDAX 27% higher due to lower cost operations, improved productivity and higher oil prices
+ Improved drilling cycle times have led to embedded and sustainable cost reductions
+ Drill-stimulate-complete gas well costs down 33% to$2.8 million
+ Unit production costs down 13% to US$9.32/boe
+ Lower costs and renewed exploration focus expected to lead to reserves additions over time
+ 5 mmboe increase in 2P reserves before production in 2017
+ Significant progress in identifying new potential growth prospects
+ Moomba South renewed exploration and appraisal focus
EBITDAX
US$ m
illio
n
258
2016 2017
328
27%

Cooper Basin Growth – Moomba South
Renewed exploration and appraisal focus in underexplored areas beneath a mature field. Significant resource potential adjacent to Moomba Plant
Santos 2017 Full-Year Results 30
A A’
M212 PRODUCING ZONES
A
A’
MOOMBA
PLANT
LOWER PATCHAWARRA VC50 DEPTH STRUCTURE
POTENTIAL APPRAISALLOCATIONS
PATCHAWARRA
PENETRATIONS
ON
LA
PP
ING
PA
TC
HA
WA
RR
A P
LA
Y
M212
+ Thick gas-saturated Patchawarra sequence intersected but not developed in historical wells
+ Moomba 212 success in 2016 re-invigorates Moomba flank play in underexplored areas of the mature field
+ Ongoing appraisal success will enable maturation to reserves
+ Low execution costs are an enabler

Western Australia Gas
Low cost operations with capacity and reserves to meet short and long-term demand
Santos 2017 Full-Year Results 31
Asset KPIs 2017 2016
Production (mmboe) 9.2 8.9
Sales volume (mmboe) 9.4 8.8
Revenue (US$m) 262 184
Production cost (US$/boe) 5.82 5.11
EBITDAX (US$m) 201 206
Capex (US$m) 37 24
+ Higher production, sales volumes and revenues
+ Low-cost, high margin conventional domestic gas assets generating strong free cash flow
+ Positive market fundamentals
+ Supply deficit emerging from early 2020s
+ Expected that ~50% (1,000 PJ) of forecast market demand needs to be re-contracted during 2019-24
+ Santos has significant uncontracted 2P reserves
+ Signed two new gas sales agreements with Wesfarmers commencing in 2018 EBITDAX
US$ m
illio
n
206
2016 2017
201
2%

Other assets
Packaged and run separately for value as a standalone business. Portfolio to be continually optimised to realise value
Santos 2017 Full-Year Results 32
Asset KPIs 2017 2016
Production (mmboe) 7.7 11.8
Sales volume (mmboe) 7.7 11.7
Revenue (US$m) 346 411
Production cost (US$/boe) 15.91 14.06
EBITDAX (US$m) 223 246
Capex (US$m) 81 84
+ Strong performance from Asian assets
+ EBITDAX $177 million
+ Continued strong free cash generation from production of 6.1 mmboe
+ Cost reductions through operating efficiencies and moving to unmanned offshore operations in the Sampang PSC
+ 7 mmboe 2P reserves increase (>100% RRR)
+ Production and sales volumes from Australian non-core assets lower primarily due to the sale of the Victorian, Mereenie and Stag assets
EBITDAX
US$ m
illio
n
2016
2H16
2017
223
9%
246

2018 strategic priorities
Business focus aligned with the core strategy
Santos 2017 Full-Year Results 33
Focus on business improvement and operational efficiencies to further reduce costs and maximise operating cash flow
Disciplined allocation of free cash to repay debt and build production levels across core assets
Disciplined exploration and appraisal around core assets
Progress major growth opportunities in core assets
Strengthen and develop Santos’ high-performance culture
Appendix

mmboe
+ Improving trend of 2P organic reserve replacement
+ Developed 2P reserves increased to 57% of total 2P reserves (from 51% in 2016)
+ Reserve upgrades in PNG, Asia, Cooper Basin and WA Gas before 2017 production
Reserves
1P reserves increased by 44 mmboe before production (90% organic RRR)2P reserves increased by 19 mmboe before production (62% organic RRR)
Santos 2017 Full-Year Results 35
2P reserves
2017
2017
848
0
50
100
2015 2016 2017
0% Cooper Basin
Queensland
WA Gas
PNG
Northern Australia
Other
2P organic reserve replacement ratio (RRR)%
19%
62%

Significant items
Reconciliation of full-year net loss to underlying profit
Santos 2017 Full-Year Results 36
US$million 2017 2016
Net profit/(loss) after tax (360) (1,047)
Add/(deduct) significant items after tax
Impairment losses 703 1,101
Net gains on asset sales (59) (17)
Other items 52 26
Underlying profit 336 63

Liquidity and net debt as at 31 December 2017
$3.2 billion in cash and committed undrawn debt facilities
Santos 2017 Full-Year Results 37
Liquidity (US$million) 31 Dec 2017 31 Dec 2016
Cash 1,231 2,026
Undrawn bilateral bank debt facilities 2,020 2,313
Total liquidity 3,251 4,339
Debt (US$million)
Export credit agency supported loan facilities Senior, unsecured 1,057 1,734
US Private Placement Senior, unsecured 424 619
Reg-S bond Senior, unsecured 783 -
PNG LNG project finance Non-recourse, secured 1,616 1,749
Euro-denominated hybrid notes Subordinated - 1,049
Other Finance leases and derivatives 82 367
Total debt 3,962 5,518
Total net debt 2,731 3,492

2017 Full-year segment results summary
Santos 2017 Full-Year Results 38
2017 US$millionCooper Basin
QLD PNGNorthern Australia
WA GasOther Assets
Corporate explor’n &
eliminsTotal
Revenue 833 764 532 153 262 346 282 3,172
Production costs (134) (68) (55) (75) (54) (123) 28 (481)
Other operating costs
(88) (73) (46) - (20) (13) (70) (310)
Third party product purchases
(200) (275) (1) - - - (220) (696)
Inter-segmentpurchases
(1) (34) - - - - 35 -
Product stock movement
(58) 23 1 1 (4) (3) (5) (45)
Other income - 1 2 - 34 43 12 92
Other expenses (21) (4) (3) (3) (17) (26) (88) (162)
FX gains and losses
(3) (5) - - - (1) (144) (153)
Share of profit of joint ventures
- - - 11 - - - 11
EBITDAX 328 329 430 87 201 223 (170) 1,428

2016 Full-year segment results summary
Santos 2017 Full-Year Results 39
2016 US$million Cooper Basin QLD PNGNorthern Australia
WA Gas Other AssetsCorporate explor’n &
eliminsTotal
Revenue 768 540 444 145 184 411 135 2,627
Production costs (160) (61) (56) (73) (46) (166) 42 (520)
Other operating costs
(77) (74) (38) - (5) (16) (116) (326)
Third party product purchases
(201) (142) (1) - - (3) (197) (544)
Inter-segmentpurchases
(18) (75) - - - - 93 -
Product stock movement
(11) (12) - - 3 - (7) (27)
Other income 1 14 2 8 73 39 (17) 120
Other expenses (44) (8) (1) (4) (6) (16) (96) (175)
FX gains and losses
- 9 - - 3 (3) 25 34
Share of profit of joint ventures
- - - 10 - - - 10
EBITDAX 258 191 350 86 206 246 (138) 1,199

2018 Guidance
2018 guidance maintained
Santos 2017 Full-Year Results 40
2018 Guidance
Sales volumes 72-78 mmboe
Production 55-60 mmboe
Upstream production costs US$8.2-8.8/boe
DD&A US$725-775 million
Capital expenditure US$825-875 million
Capital expenditure guidance includes abandonment expenditure but excludes capitalised interest.
+ Production and sales guidance maintained
+ Upstream unit cost guidance maintained at $8.2-8.8/boe
+ Higher costs due to planned DLNG/Bayu-Undan shutdown
+ Lower production from PNG LNG and Moomba major shutdowns
+ Lower production from non-core assets
+ Stronger AUD/USD exchange rate is providing upward pressure on AUD costs when translated into USD
+ DD&A US$725-775 million
+ Capital expenditure guidance maintained

Impairment
Net impairment of $703 million after tax taken in 2017, primarily due to lower oil prices
Santos 2017 Full-Year Results 41
+ In determining the carrying value of its assets, Santos considers a range of asset and macro assumptions, including oil price, exchange rates, discount rates, production and costs
Brent US$ oil price assumptions
Dec 2017
2018 55
2019 60
2020 65
2021 70
2022 771
2023+ 791
1 US$70/bbl long-term (2017 real) from 2022
Previously announced impairments taken at 2017 half-year:
GLNG: net impairment of $867 million
+ as a result of the changes in assumptions, predominantly lower US$ oil prices
Cooper Basin: positive net write-back of $336 million
+ lower assumed costs and higher assumed development activity and production, supported by significant improvements in drill, stimulate and connect unit cost performance, partially offset by lower US$ oil prices
AAL: net impairment of $149 million
+ lower US$ oil prices
Impairments taken at 2017 full-year:
Other assets: net impairment of $14 million
$20
$30
$40
$50
$60
$70
$20 $30 $41 $48 $60 $70 $80
Re
ali
se
d P
rice
(U
S$
/b
bl)
Brent (US$/bbl)
$48.48
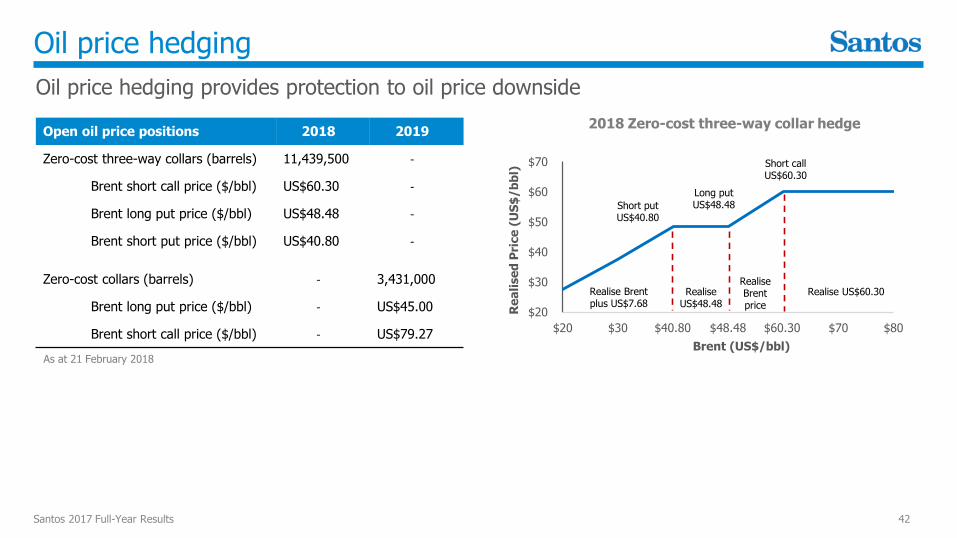
Oil price hedging
Oil price hedging provides protection to oil price downside
Santos 2017 Full-Year Results 42
Open oil price positions 2018 2019
Zero-cost three-way collars (barrels) 11,439,500 -
Brent short call price ($/bbl) US$60.30 -
Brent long put price ($/bbl) US$48.48 -
Brent short put price ($/bbl) US$40.80 -
Zero-cost collars (barrels) - 3,431,000
Brent long put price ($/bbl) - US$45.00
Brent short call price ($/bbl) - US$79.27
2018 Zero-cost three-way collar hedge
Realise Brent plus US$7.68
Realise US$48.48
Realise Brent price
Realise US$60.30
Short put US$40.80
Long put US$48.48
Short call US$60.30
$60.30$40.80
As at 21 February 2018