santander consumer usa holdings incs1.q4cdn.com/269973923/files/doc_downloads/4q17-earnings... ·...
TRANSCRIPT

01.31.2018
SANTANDER CONSUMER USA HOLDINGS INC.Fourth Quarter and Full Year 2017

2IMPORTANT INFORMATIONForward-Looking StatementsThis presentation contains forward-looking statements within the meaning of the Private Securities Litigation Reform Act of 1995. Any statements about ourexpectations, beliefs, plans, predictions, forecasts, objectives, assumptions, or future events or performance are not historical facts and may be forward-looking.These statements are often, but not always, made through the use of words or phrases such as anticipates, believes, can, could, may, predicts, potential, should,will, estimates, plans, projects, continuing, ongoing, expects, intends, and similar words or phrases. Although we believe that the expectations reflected in theseforward-looking statements are reasonable, these statements are not guarantees of future performance and involve risks and uncertainties that are subject tochange based on various important factors, some of which are beyond our control. For additional discussion of these risks, refer to the section entitled Risk Factorsand elsewhere in our Annual Report on Form 10-K and our Quarterly Reports on Form 10-Q filed by us with the U.S. Securities and Exchange Commission (SEC).Among the factors that could cause the forward-looking statements in this presentation and/or our financial performance to differ materially from that suggestedby the forward-looking statements are (a) the inherent limitations in internal controls over financial reporting; (b) our ability to remediate any material weaknessesin internal controls over financial reporting completely and in a timely manner; (c) continually changing federal, state, and local laws and regulations couldmaterially adversely affect our business; (d) adverse economic conditions in the United States and worldwide may negatively impact our results; (e) our businesscould suffer if our access to funding is reduced; (f) significant risks we face implementing our growth strategy, some of which are outside our control; (g)unexpected costs and delays in connection with exiting our personal lending business; (h) our agreement with Fiat Chrysler Automobiles US LLC may not result incurrently anticipated levels of growth and is subject to certain performance conditions that could result in termination of the agreement; (i) our business couldsuffer if we are unsuccessful in developing and maintaining relationships with automobile dealerships; (j) our financial condition, liquidity, and results of operationsdepend on the credit performance of our loans; (k) loss of our key management or other personnel, or an inability to attract such management and personnel; (l)certain regulations, including but not limited to oversight by the Office of the Comptroller of the Currency, the Consumer Financial Protection Bureau, theEuropean Central Bank, and the Federal Reserve, whose oversight and regulation may limit certain of our activities, including the timing and amount of dividendsand other limitations on our business; and (m) future changes in our relationship with Banco Santander which could adversely affect our operations. If one or moreof the factors affecting our forward-looking information and statements proves incorrect, our actual results, performance or achievements could differ materiallyfrom those expressed in, or implied by, forward-looking information and statements. Therefore, we caution the reader not to place undue reliance on any forward-looking information or statements. The effect of these factors is difficult to predict. Factors other than these also could adversely affect our results, and the readershould not consider these factors to be a complete set of all potential risks or uncertainties. Any forward-looking statements only speak as of the date of thisdocument, and we undertake no obligation to update any forward-looking information or statements, whether written or oral, to reflect any change, except asrequired by law. All forward-looking statements attributable to us are expressly qualified by these cautionary statements.
3
» Net income for the full year 2017 was $1.2 billion, or $3.30 per diluted common share. Net income, excludingthe impact of significant items including tax reform and other tax related items, legal reserves, and asettlement with the former CEO (“Adjusted1”) was $627 million, or $1.74 per diluted common share.
» The Federal Reserve Bank of Boston (“Federal Reserve”) terminated the 2014 Written Agreement with SC'smajority owner, Santander Holdings USA, Inc. (“SHUSA”), following its non-objection to SHUSA'sComprehensive Capital Analysis and Review submission. SHUSA and SC now operate within a normal capitalcycle and SC completed its first cash dividend payment to shareholders since 2014.
» SHUSA and Banco Santander (“Santander”) reaffirmed their commitment to SC by increasing their totalownership in SC to approximately 68.1%, following Santander's acquisition from SC's former CEO of 9.6% ofSC's outstanding shares, which it transferred to SHUSA.
» Launched flow program with Santander allowing SC to execute prime auto loan sales of $2.6 billion, andthrough Santander Bank N.A., increased FCA dealer receivables (“floorplan”) 14% YoY, to $2.0 billion.
» Leading auto loan ABS issuer with $7.9 billion in ABS offered and sold, including SC's inaugural leasesecuritization, Santander Retail Auto Lease Trust (“SRT”) and SC's first public DRIVE securitization.
» RIC gross charge-off ratio of 17.9%, up 60 basis points YoY, stabilizing compared to a 230 basis point increase from 2015 to 2016 and RIC net charge-off ratio of 8.9%, up 60 basis points YoY, compared to a 140 basis point increase from 2015 to 2016.
» ROA of 3.0% and Adjusted ROA of 1.6%, down from 2.0% in FY 2016.
FY 2017 HIGHLIGHTS
1 Please refer to the appendix for a reconciliation of these significant items to GAAP. Amounts excluding significant items are non-GAAP financial measures that management believes will assist users of SC's financial information by excluding items that management does not believe reflect SC's fundamental business performance or results of operations.

4
Max 3.2%
3.2%
Min -4.1%
Sep-07 Sep-08 Sep-09 Sep-10 Sep-11 Sep-12 Sep-13 Sep-14 Sep-15 Sep-16 Sep-17
17.8
18.5
9.0
Dec-07 Dec-08 Dec-09 Dec-10 Dec-11 Dec-12 Dec-13 Dec-14 Dec-15 Dec-16 Dec-17
ECONOMIC INDICATORSU.S. Auto Sales1
Units in Millions
1 Bloomberg2 University of Michigan3 U.S. Bureau of Labor Statistics
Consumer Confidence2
Index Q1 1966=100
U.S. GDP1
%U.S. Unemployment Rate3
%
ORI
GIN
ATIO
NS
CRED
IT
95.9
Max 99.1
Min 55.3
Dec-07 Dec-08 Dec-09 Dec-10 Dec-11 Dec-12 Dec-13 Dec-14 Dec-15 Dec-16 Dec-17
Max 10.0%
Min: 4.1%
4.1%
Dec-07 Dec-08 Dec-09 Dec-10 Dec-11 Dec-12 Dec-13 Dec-14 Dec-15 Dec-16 Dec-17
5
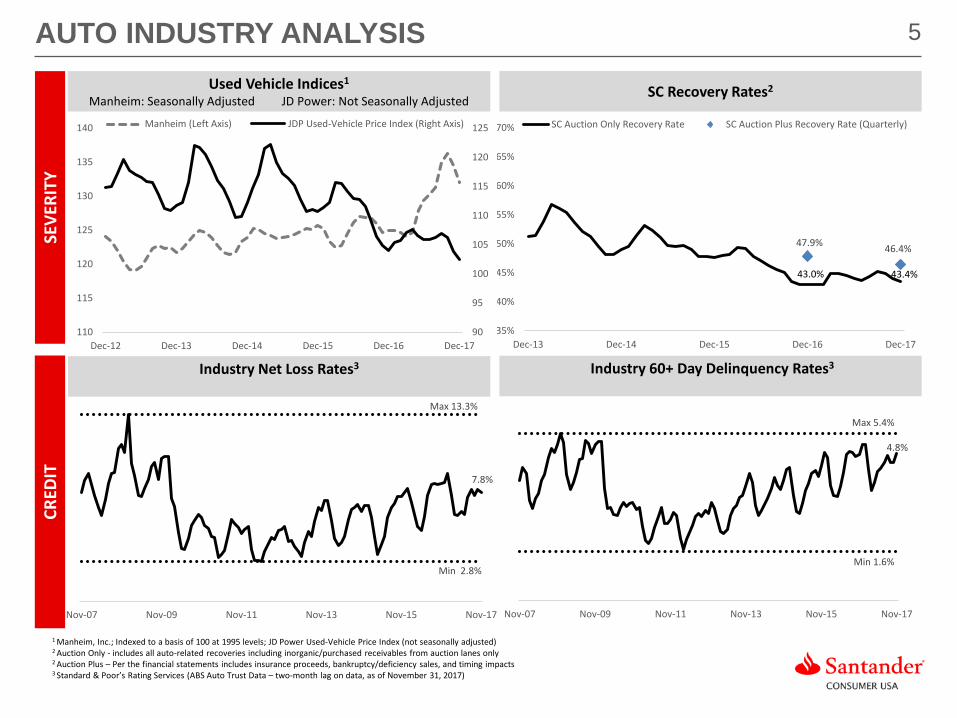
43.0% 43.4%
47.9% 46.4%
35%
40%
45%
50%
55%
60%
65%
70%
Dec-13 Dec-14 Dec-15 Dec-16 Dec-17
SC Auction Only Recovery Rate SC Auction Plus Recovery Rate (Quarterly)
90
95
100
105
110
115
120
125
110
115
120
125
130
135
140
Dec-12 Dec-13 Dec-14 Dec-15 Dec-16 Dec-17
Manheim (Left Axis) JDP Used-Vehicle Price Index (Right Axis)
7.8%
Max 13.3%
Min 2.8%
Nov-07 Nov-09 Nov-11 Nov-13 Nov-15 Nov-17
Subprime
4.8%
Max 5.4%
Min 1.6%
Nov-07 Nov-09 Nov-11 Nov-13 Nov-15 Nov-17
Subprime
AUTO INDUSTRY ANALYSISUsed Vehicle Indices1
Manheim: Seasonally Adjusted JD Power: Not Seasonally AdjustedSC Recovery Rates2
Industry Net Loss Rates3
SEVE
RITY
CRED
IT
Industry 60+ Day Delinquency Rates3
1 Manheim, Inc.; Indexed to a basis of 100 at 1995 levels; JD Power Used-Vehicle Price Index (not seasonally adjusted)2 Auction Only - includes all auto-related recoveries including inorganic/purchased receivables from auction lanes only2 Auction Plus – Per the financial statements includes insurance proceeds, bankruptcy/deficiency sales, and timing impacts 3 Standard & Poor’s Rating Services (ABS Auto Trust Data – two-month lag on data, as of November 31, 2017)

6DISCIPLINED LOAN UNDERWRITING CONTINUES IN 4Q17
1 Approximate FICO score2 Includes some capital lease originations
YoY auto origination decreases driven by disciplined underwriting in a competitive market
$ in millions Q4 2016 Q4 2017 2016 2017 Quarterly YoY FYoFYTotal Core Retail Auto 2,010$ 1,469$ 8,702$ 7,470$ (27%) (14%)
Chrysler Capital Loans (<640)1 768 741 3,829 3,372 (4%) (12%)Chrysler Capital Loans (≥640)1 775 804 4,202 3,341 4% (20%)
Total Chrysler Capital Retail 1,543 1,545 8,031 6,713 0% (16%)Total Leases2 973 1,299 5,159 5,997 34% 16%Total Auto Originations 4,526 4,313 21,892 20,180 (5%) (8%)
Total Personal Lending 571 529 1,556 1,477 (7%) (5%)Total Originations 5,097$ 4,842$ 23,441$ 21,658$ (5%) (8%)
Asset Sales 1,381 - 4,563 2,979 N/A (35%)Serviced for Others Portfolio 11,945 8,643 11,945 8,643 (28%) (28%)Average Managed Assets 52,039 48,972 52,731 50,111 (6%) (5%)
% VarianceQuarterly Originations Full Year Originations
Balances Balances
7
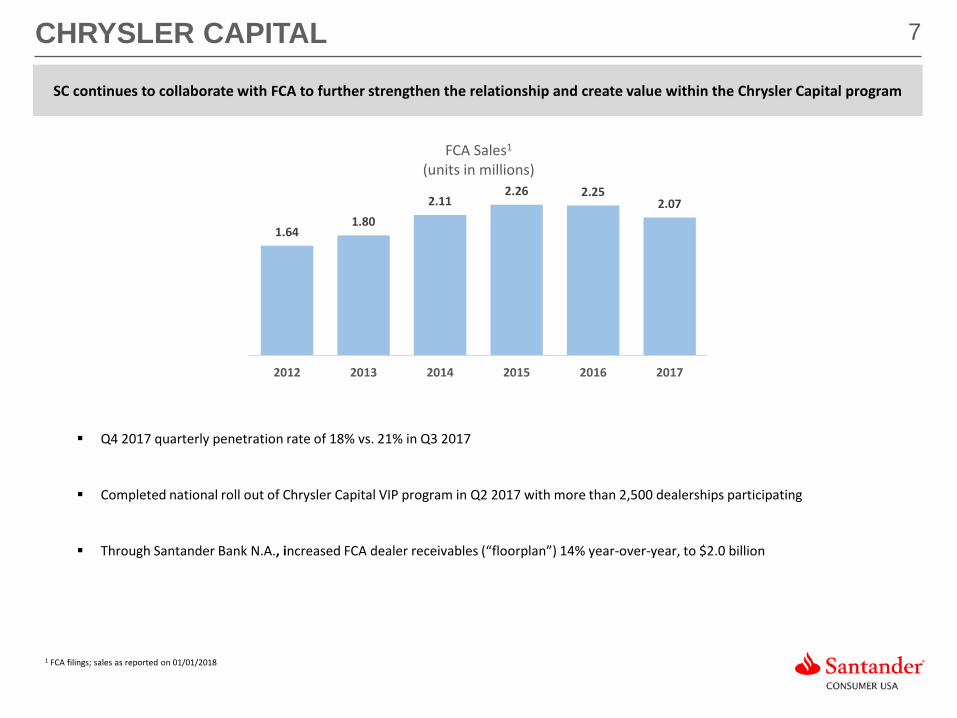
Q4 2017 quarterly penetration rate of 18% vs. 21% in Q3 2017
Completed national roll out of Chrysler Capital VIP program in Q2 2017 with more than 2,500 dealerships participating
Through Santander Bank N.A., increased FCA dealer receivables (“floorplan”) 14% year-over-year, to $2.0 billion
CHRYSLER CAPITAL
1 FCA filings; sales as reported on 01/01/2018
SC continues to collaborate with FCA to further strengthen the relationship and create value within the Chrysler Capital program
1.641.80
2.112.26 2.25
2.07
2012 2013 2014 2015 2016 2017
FCA Sales1
(units in millions)

8
Flow Programs 477 931 566 1,347
CCART 904
Other sales 135
Santander flow program totaling $2.6 billion in 2017
Recent trend in total balance related to lower prime originations and timing of asset sales to Santander
Growth in SFO remains dependent upon Chrysler Capital penetration, FCA prime originations and timing of sales in the Santander flow program
SERVICED FOR OTHERS (SFO) PLATFORM
Composition at 12/31/2017
RIC 88%
Leases 4%
RV/Marine 8%
Total 100%
Serviced for Others Balances (End of Period)
*Sales with retained servicing during period, also include non-Santander sales.
$11,945 $11,015
$9,881 $9,957
$8,643
4Q16 1Q17 2Q17 3Q17 4Q17
$ in Millions

9
» Net income for the fourth quarter of 2017 was $580 million, or $1.61 per diluted common share. Adjusted net income totaled $98 million, or $0.27 per diluted common share
» Total auto originations of $4.6 billion, down 6%, YoY
» Core retail auto originations of $1.5 billion, down 27% YoY
» Chrysler Capital loan originations of $1.5 billion, flat YoY
» Chrysler Capital lease originations of $1.3 billion, up 31% YoY
» Net finance and other interest income of $1.0 billion, down 11% YoY
» Return on average assets (“ROA”) of 6.0% and Adjusted ROA of 1.0%, up from 0.6% in Q4 2016
» CET1 ratio of 16.3%
» $2.2 billion in ABS offered and sold, including SDART, DRIVE and inaugural lease ABS transaction (SRT)
» In January 2018, SC partnered with Santander InnoVentures, a corporate venture fund, to become a lending choice on AutoFi's online finance platform to streamline and simplify the car buying process for consumers, while providing dealers a robust digital sales channel
Q4 2017 HIGHLIGHTS AND SUBSEQUENT EVENT
*Adjusted net income and ROA are non-GAAP financial measures. For a reconciliation of non-GAAP financial measures to GAAP, see accompanying Appendix.

10Q4 2017 FINANCIAL RESULTS
December 31, 2017 September 30, 2017 December 31, 2016 QoQ YoY Interest on finance receivables and loans 1,129,181$ 1,185,059$ 1,222,468$ (5%) (8%)Net leased vehicle income 112,491 118,351 122,791 (5%) (8%)Other finance and interest income 4,470 6,385 3,695 (30%) 21%Interest expense 236,600 250,674 216,980 (6%) 9%Net finance and other interest income 1,009,542$ 1,059,121$ 1,131,974$ (5%) (11%)Provision for credit losses 562,346 536,447 685,711 5% (18%)Profit sharing 7,235 5,945 12,176 22% (41%)Total other income (37,716) 58,947 (47,996) (164%) (21%)Total operating expenses 426,040 297,903 295,905 43% 44%Income before tax (23,795)$ 277,773$ 90,186$ (109%) (126%)Income tax expense (603,911) 78,385 28,911 N/A N/ANet income 580,116$ 199,388$ 61,275$ 191% 847%Diluted EPS ($) 1.61$ 0.55$ 0.17$ 193% 848%
Average total assets 38,992,937$ 39,496,278$ 38,513,454$ (1%) 1%Average managed assets 48,971,677$ 49,998,111$ 52,038,692$ (2%) (6%)
% VarianceThree Months Ended
(Unaudited, Dollars in Thousands, except per share)

11CREDIT QUALITY: VINTAGE LOSS PERFORMANCE
2016 vintage continues to outperform the 2015 vintage on a gross and net loss basis
*Retained originations only
0%
3%
5%
8%
10%
13%
0 1 2 3 4 5 6 7 8 9 10 11 12 13 14 15 16 17 18 19 20 21 22 23 24Cu
mul
ativ
e N
et L
oss R
ate
Months on Book
Total Annual Vintage Cumulative Net Loss Rate
2014 2015 2016
0%
5%
10%
15%
20%
25%
0 1 2 3 4 5 6 7 8 9 10 11 12 13 14 15 16 17 18 19 20 21 22 23 24
Cum
ulat
ive
Gros
s Los
s Rat
e
Months on Book
Total Annual Vintage Cumulative Gross Loss Rate
2014 2015 2016

12DELINQUENCY AND LOSS
YoY delinquency increased for each delinquency bucket primarily driven by a lower portfolio balance
YoY gross charge-off ratio increased 20 basis points
YoY net charge-off ratio increased 40 basis points
10.0%
7.3%
9.3% 9.2%10.3%
5.1%
3.8%4.7% 5.1% 5.4%
0.0%
2.0%
4.0%
6.0%
8.0%
10.0%
12.0%
Q4 2016 Q1 2017 Q2 2017 Q3 2017 Q4 2017
Delinquency: Individually Acquired Retail Installment Contracts, Held for Investment
31-60
61+
19.0% 18.1%
16.4%
18.0%19.2%
9.9% 8.8%7.5%
9.1%10.3%
47.9%51.1%
53.9%
49.3%46.4%
45.0%
50.0%
55.0%
60.0%
65.0%
70.0%
75.0%
0.0%
5.0%
10.0%
15.0%
20.0%
25.0%
Q4 2016 Q1 2017 Q2 2017 Q3 2017 Q4 2017
Credit: Individually Acquired Retail Installment Contracts,Held for Investment
Gross Charge-off Ratio
Net Charge-off Ratio
Recovery Rate(as % ofrecordedinvestment)
13
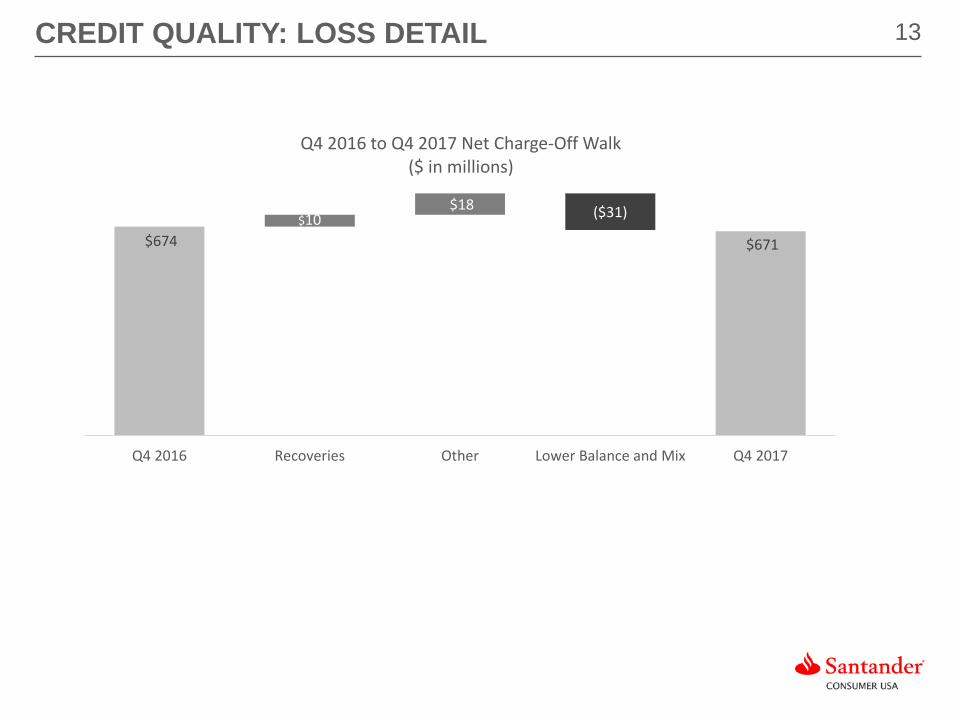
$674 $671 $10
$18 ($31)
Q4 2016 Recoveries Other Lower Balance and Mix Q4 2017
Q4 2016 to Q4 2017 Net Charge-Off Walk($ in millions)
CREDIT QUALITY: LOSS DETAIL

14
$3,381
$3,270
$103
$80 ($90)
($204)
$3,100$3,150$3,200$3,250$3,300$3,350$3,400$3,450$3,500$3,550$3,600
Q3 2017 NewVolume
TDRMigration
PerformanceAdjustment
Liquidations& Other
Q4 2017
Q3 2017 to Q4 2017 ALLL Reserve Walk($ in millions)
PROVISION AND RESERVES
1 TDR migration – the allowance for assets classified as TDRs or “troubled debt restructuring” takes into consideration expected lifetime losses, typically requiring additional coverage2 Explanation of quarter over quarter variance are estimates
QoQ allowance decreased $111 million
New volume and TDR migration1 were offset by performance adjustment and liquidations and other
QoQ outstanding TDR balance relatively flat
Allowance to loans ratio decreased 20 bps to 12.6% QoQ
Provision for credit losses decreased $124 million YoY
$686
$635$521 $536 $562
12.6% 12.7% 12.6%12.8%
12.6%
12.0
12.5
13.0
13.5
14.0
$0$100$200$300$400$500$600$700$800
Q4 2016 Q1 2017 Q2 2017 Q3 2017 Q4 2017
Provision Expense and Allowance Ratio($ in millions)
Provision for credit losses Allowance Ratio

15
$52,039 $51,230 $50,436 $49,998 $48,972
$296 $305$282 $298
$269
2.3% 2.4% 2.2% 2.4%
3.5%
0.0%
2.0%
4.0%
6.0%
8.0%
10.0%
$2
$10,002
$20,002
$30,002
$40,002
$50,002
$60,002
Q4 2016 Q1 2017 Q2 2017 Q3 2017 Q4 2017
AverageManaged Assets($ millions)Total Expenses($ millions)
Expense Ratio
EXPENSE MANAGEMENT
Operating expenses totaled $426 million, an increase of 44% versus the same quarter last year
Adjusted operating expenses decreased $27 million, down 9% year-over-year
$426
*Adjusted operating expense is a non-GAAP financial measure. For a reconciliation of non-GAAP financial measures to GAAP, see accompanying Appendix.
2.2%Adjusted Expense Ratio

16
4.3 4.1
5.3 5.8
Q3 2017 Q4 2017Unused Used
8.37.6
Q3 2017 Q4 2017
$17.5 billion in commitments from 12 lenders1
59% unused capacity on revolving lines at Q4 2017
FUNDING AND LIQUIDITYTotal funding of $40.3 billion at the end Q4 2017, down 5% from $42.3 billion at the end of Q3 2017
Asset-Backed Securities($ Billions)
Financings($ Billions)
Banco Santander & Subsidiaries($ Billions)
Asset Sales($ Billions)
Offered and sold $2.2 billion in asset-backed securities (ABS) Launched inaugural lease securitization (SRT)
$7.8 billion in total commitments 52% unused revolving capacity at Q4 2017
No asset sales in Q4 – expect to complete a sale during Q1 2018
Amortizing Revolving
9.6 9.9
Santander & Subsidiaries($ Billions)
1.5
Q3 2017 Q4 2017
15.0 15.0
Q3 2017 Q4 2017
3.0 3.0
2.81.8
2.13.0
Q3 2017 Q4 2017
Term
Revolving
Contingent
7.87.9
1 Does not include repo facilities

17CONSISTENT CAPITAL GENERATION
1 Net tax benefit due to re-measurement of all deferred tax assets (DTAs) and deferred tax liabilities (DTLs) at a federal tax rate of 21% (as compared to 35%).2 Common Equity Tier 1 (CET1) Capital Ratio is a non-GAAP financial measure that begins with stockholders’ equity and then adjusts for AOCI, goodwill/intangibles, DTAs, cash flow hedges and
other regulatory exclusions over risk-weighted assets. See appendix for further details.3 Tangible common equity to tangible assets is a non-GAAP financial measure defined as the ratio of Total equity, excluding Goodwill and intangible assets, to Total assets, excluding Goodwill
and intangible assets
1 2
SC has exhibited a strong ability to generate earnings and capital, while growing assets.
Tangible Assets $38,432 $38,956 $39,401 $38,660 $39,319
Tangible Common Equity $5,132 $5,313 $5,572 $5,780 $6,377
$ in millions
The Company has declared a cash dividend of $0.05 per share, to be paid February 22, 2018 to shareholders of record as of the close of business on February 12, 2018
CET1 impacted by net tax benefit due to re-measurement of all deferred tax assets (DTAs) and deferred tax liabilities (DTLs) at a federal tax rate of 21% (as compared to 35%). See accompanying appendix for additional details.
13.4% 13.8% 14.3%15.0%
16.3%
13.4% 13.6% 14.1%14.9%
16.2%
Q4 2016 Q1 2017 Q2 2017 Q3 2017 Q4 2017
CET1 TCE/TA

APPENDIX

19SANTANDER CONSUMER USA HOLDINGS INC.
1 As of December 31, 2017
• Santander Consumer USA Holdings Inc. (NYSE:SC) (“SC”) is approximately 68.1%1 owned by Santander Holdings USA, Inc.(“SHUSA”), a wholly-owned subsidiary of Banco Santander, S.A. (NYSE:SAN)
▪ SC is a full-service, consumer finance company focused on vehicle finance, third-party servicing and providing superior customer service
• Historically focused on nonprime markets; established presence in prime and lease
▪ Approximately 5,100 full-time, 40 part-time and 1,500 vendor-based employees across multiple locations in the U.S. and the Caribbean
▪ Our strategy is to leverage our scalable technology, data and risk infrastructure to underwrite, originate and service profitable assets while treating employees, dealers, and customers in a simple, personal and fair manner
▪ Compliance and responsible practices focus
▪ Strengthening our relationship with FCA and improving dealer experience
▪ Continuous optimization of the mix of assets retained vs. assets sold and serviced for others
▪ Retain core and Chrysler nonprime and lease assets, sell Chrysler prime assets via Santander flow agreement
▪ Efficient funding through key third-party relationships, secondary markets and Santander
Overview
Strategy

20COMPANY ORGANIZATION
Other Subsidiaries
100% Ownership
Santander Holdings USA, Inc.(“SHUSA’)
~68.1% Ownership
Santander Consumer USA Holdings Inc.(“SC”)
Santander Bank, N.A.Other Subsidiaries
Banco Santander, S.A. Spain
*Ownership percentages are approximates as of December 31, 2017
31.9% Ownership
Public Shareholders

21
2% 2% 2% 2% 2%11% 12% 12% 10% 10%
15% 18% 17% 14% 14%
24%25% 24%
23% 24%
15% 13% 13%13% 13%
32% 30% 33% 38% 36%
4Q16 1Q17 2Q17 3Q17 4Q17
Originations by Credit (RIC only)($ in millions)
>640
600-640
540-599
<540
No FICO
Commercial
ORIGINATIONS EXHIBIT DISCIPLINED UNDERWRITING
1 Loans to commercial borrowers; no FICO score obtained
Originations < 640 were down $486 million YoY
Stable mix
Recent pickup in new vehicles, reflected in higher average loan balance in dollars
Average loan balance in dollars $21,488 $20,193 $20,816 $21,825 $22,013
$2,406
$4,055 $3,328 $3,014$3,787$3,553
53% 47% 48% 55% 53%
47% 53% 52% 45% 47%
4Q16 1Q17 2Q17 3Q17 4Q17
New/Used Originations (RIC only)($ in millions)
Used
New
$4,055 $3,328 $3,014$3,787$3,553
$1,920

22HELD FOR INVESTMENT CREDIT TRENDS
Retail Installment Contracts1
1Held for investment; excludes assets held for sale
3.1%
12.2
%
22.1
%
31.4
%
17.4
%
13.8
%
2.8%
12.0
%
22.3
%
31.7
%
17.4
%
13.8
%
2.5%
11.9
%
22.4
%
31.9
%
17.3
%
14.0
%
2.4%
11.6
%
22.4
%
32.4
%
17.5
%
13.7
%
2.5%
11.2
%
21.8
%
32.0
%
17.4
%
15.1
%
Commercial Unknown <540 540-599 600-639 >=640
Q4 2016 Q1 2017 Q2 2017 Q3 2017 Q4 2017

23Q4 2017 EXCLUDING PERSONAL LENDING DETAIL
Quarterly Financial Details (Excluding Personal Lending)
TotalPersonal Lending
Excluding Personal Lending
TotalPersonal Lending
Excluding Personal Lending
TotalPersonal Lending
Excluding Personal Lending
Interest on finance receivables and loans $ 1,129,181 $ 83,080 $ 1,046,101 $ 1,185,059 $ 83,475 $ 1,101,584 $ 1,222,468 $ 80,292 $ 1,142,176
Net leased vehicle income 112,491 - 112,491 118,351 - 118,351 122,791 - 122,791
Other finance and interest income 4,470 - 4,470 6,385 - 6,385 3,695 - 3,695
Interest expense 236,600 13,998 222,602 250,674 12,015 238,659 216,980 10,721 206,259
Net finance and other interest income $ 1,009,542 $ 69,082 $ 940,460 $ 1,059,121 $ 71,460 $ 987,661 $ 1,131,974 $ 69,571 $ 1,062,403
Provision for credit losses 562,347 415 561,932 536,447 564 535,883 685,711 - 685,711
Profit sharing 7,235 877 6,358 5,945 (143) 6,088 12,176 2,957 9,219
Investment Gains (losses), net (137,926) (136,393) (1,533) (52,592) (83,700) 31,108 (168,344) (145,730) (22,614)
Servicing fee income 26,031 - 26,031 28,673 - 28,673 32,205 - 32,205
Fees, commissions and other 74,179 45,830 28,349 82,866 47,380 35,486 88,143 48,527 39,616
Total other income $ (37,716) $ (90,563) $ 52,847 $ 58,947 $ (36,320) $ 95,267 $ (47,996) $ (97,203) $ 49,207
Average gross individually acquired retail installment contracts $ 27,098,976 - $ 28,144,133 - $ 28,604,117 -
Average gross personal loans - $ 1,392,529 - $ 1,367,445 - $ 1,405,187
Average gross operating leases $ 11,088,361 - $ 10,710,941 - $ 9,586,090 -
As of and for the Three Months Ended (Unaudited, Dollars in Thousands)
December 31, 2017 September 30, 2017 December 31, 2016
*The $136 million of investment losses related personal lending, comprised of $114 million in customer default activity and $23 million increase in market discount, consistent with typical seasonal patterns.

24FY 2017 EXCLUDING PERSONAL LENDING DETAIL
As ReportedPersonal Lending
Excluding Personal Lending
Interest on finance receivables and loans $ 4,755,678 $ 347,873 $ 4,407,805
Net leased vehicle income 489,944 - 489,944
Other finance and interest income 19,885 - 19,885
Interest expense 947,734 50,320 897,414
Net finance and other interest income 4,317,773 297,553 4,020,220
Provision for credit losses 2,254,361 10,691 2,243,670
Profit sharing 29,568 635 28,933
Investment gains (losses), net (366,439) (374,360) 7,921
Servicing fee income 118,341 - 118,341
Fees, commissions and other 349,204 203,502 145,702
Total other income $ 101,106 $ (170,858) $ 271,964
Average gross individually acquired RICs $ 27,926,229 -
Average gross personal loans - $ 1,419,417
Average gross operating leases $ 10,456,121 -
For the Year Ended($ in Thousands)
December 31, 2017

25CONSOLIDATED BALANCE SHEETS(Unaudited, dollars in thousands) December 31, 2017 December 31, 2016
AssetsCash and cash equivalents $ 527,805 $ 160,180 Finance receivables held for sale, net 2,210,421 2,123,415Finance receivables held for investment, net 22,427,769 23,481,001Restricted cash 2,553,902 2,757,299Accrued interest receivable 326,640 373,274Leased vehicles, net 10,160,327 8,564,628Furniture and equipment, net 69,609 67,509Federal, state and other income taxes receivable 95,060 87,352Related party taxes receivable 467 1,087Goodwill 74,056 74,056Intangible assets, net 29,734 32,623Due from affiliates 33,270 31,270Other assets 913,244 785,410Total assets $ 39,422,304 $ 38,539,104
Liabilities and Equity Liabilities: Notes payable — credit facilities $ 4,848,316 $ 6,739,817 Notes payable — secured structured financings 22,557,895 21,608,889 Notes payable — related party 3,754,223 2,975,000 Accrued interest payable 38,529 33,346 Accounts payable and accrued expenses 429,531 379,021 Deferred tax liabilities, net 897,121 1,278,064 Due to affiliates 82,382 50,620 Other liabilities 333,806 235,728 Total liabilities $ 32,941,803 $ 33,300,485
Equity:Common stock, $0.01 par value 3,605 3,589Additional paid-in capital 1,681,558 1,657,611Accumulated other comprehensive income (loss), net 44,262 28,259 Retained earnings 4,751,076 3,549,160Total stockholders’ equity $ 6,480,501 $ 5,238,619 Total liabilities and equity $ 39,422,304 $ 38,539,104

26CONSOLIDATED FY INCOME STATEMENTS
December 31, December 31,2017 2016
Interest on finance receivables and loans $ 4,755,678 $ 5,026,790 Leased vehicle income 1,788,457 1,487,671Other finance and interest income 19,885 15,135Total finance and other interest income 6,564,020 6,529,596Interest expense 947,734 807,484Leased vehicle expense 1,298,513 995,459Net finance and other interest income 4,317,773 4,726,653Provision for credit losses 2,254,361 2,468,200Net finance and other interest income after provision for credit losses 2,063,412 2,258,453Profit sharing 29,568 47,816Net finance and other interest income after provision for credit losses and profit sharing 2,033,844 2,210,637
Investment gains (losses), net (366,439) (444,759)Servicing fee income 118,341 156,134Fees, commissions, and other 349,204 382,171Total other income 101,106 93,546
Compensation expense 581,017 498,224Repossession expense 275,704 293,355Other operating costs 454,715 351,893Total operating expenses 1,311,436 1,143,472Income before income taxes 823,514 1,160,711Income tax expense (364,092) 394,245Net income $ 1,187,606 $ 766,466
Net income per common share (basic) $ 3.30 $ 2.14 Net income per common share (diluted) $ 3.30 $ 2.13 Dividends declared per common share $ 0.03 - Weighted average common shares (basic) 359,613,714 358,280,814 Weighted average common shares (diluted) 360,292,330 359,078,337
For the Year Ended
(Unaudited, dollars in thousands, except per share amounts)
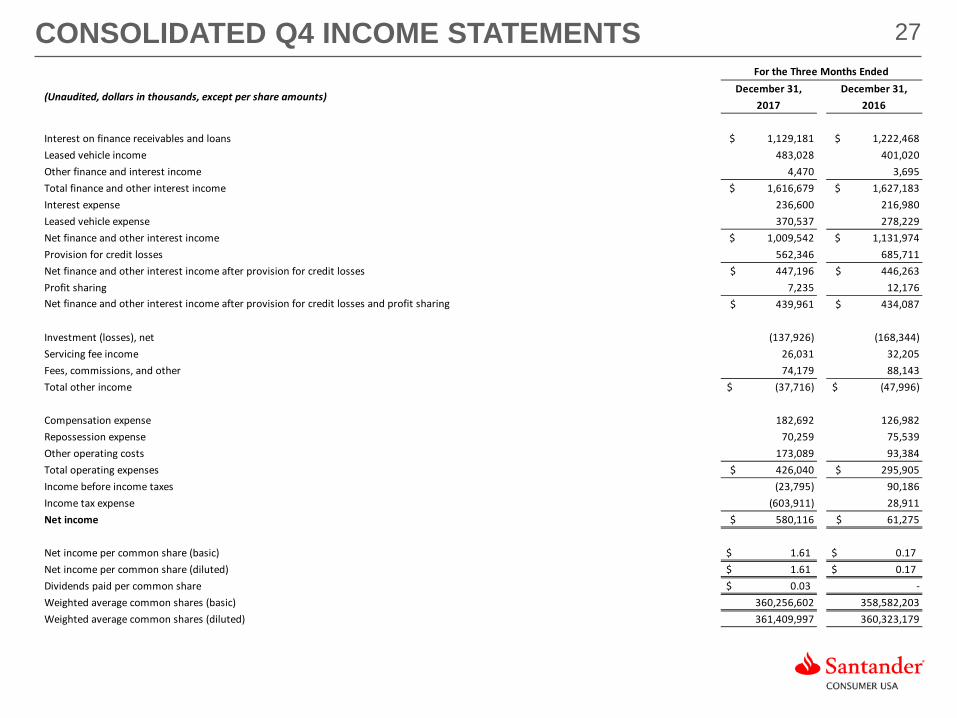
27CONSOLIDATED Q4 INCOME STATEMENTS December 31, December 31,
2017 2016
Interest on finance receivables and loans $ 1,129,181 $ 1,222,468 Leased vehicle income 483,028 401,020Other finance and interest income 4,470 3,695Total finance and other interest income $ 1,616,679 $ 1,627,183 Interest expense 236,600 216,980Leased vehicle expense 370,537 278,229Net finance and other interest income $ 1,009,542 $ 1,131,974 Provision for credit losses 562,346 685,711Net finance and other interest income after provision for credit losses $ 447,196 $ 446,263 Profit sharing 7,235 12,176Net finance and other interest income after provision for credit losses and profit sharing $ 439,961 $ 434,087
Investment (losses), net (137,926) (168,344)Servicing fee income 26,031 32,205Fees, commissions, and other 74,179 88,143Total other income $ (37,716) $ (47,996)
Compensation expense 182,692 126,982Repossession expense 70,259 75,539Other operating costs 173,089 93,384Total operating expenses $ 426,040 $ 295,905 Income before income taxes (23,795) 90,186Income tax expense (603,911) 28,911Net income $ 580,116 $ 61,275
Net income per common share (basic) $ 1.61 $ 0.17 Net income per common share (diluted) $ 1.61 $ 0.17 Dividends paid per common share $ 0.03 -Weighted average common shares (basic) 360,256,602 358,582,203 Weighted average common shares (diluted) 361,409,997 360,323,179
For the Three Months Ended
(Unaudited, dollars in thousands, except per share amounts)
28RECONCILIATION OF NON-GAAP MEASURES
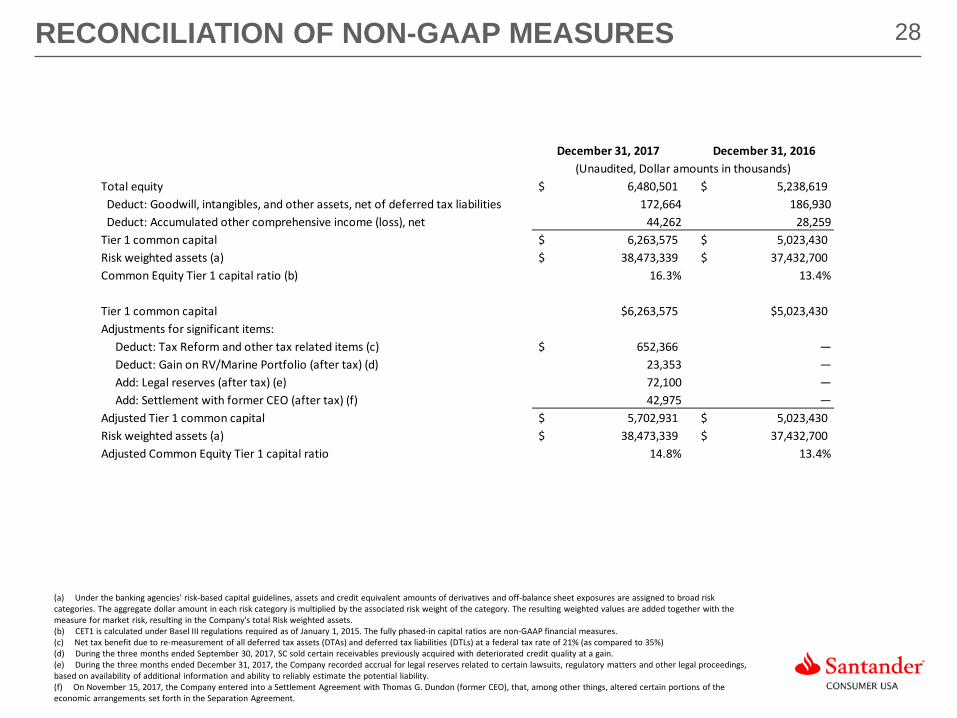
(a) Under the banking agencies' risk-based capital guidelines, assets and credit equivalent amounts of derivatives and off-balance sheet exposures are assigned to broad risk categories. The aggregate dollar amount in each risk category is multiplied by the associated risk weight of the category. The resulting weighted values are added together with the measure for market risk, resulting in the Company's total Risk weighted assets.(b) CET1 is calculated under Basel III regulations required as of January 1, 2015. The fully phased-in capital ratios are non-GAAP financial measures.(c) Net tax benefit due to re-measurement of all deferred tax assets (DTAs) and deferred tax liabilities (DTLs) at a federal tax rate of 21% (as compared to 35%)(d) During the three months ended September 30, 2017, SC sold certain receivables previously acquired with deteriorated credit quality at a gain.(e) During the three months ended December 31, 2017, the Company recorded accrual for legal reserves related to certain lawsuits, regulatory matters and other legal proceedings, based on availability of additional information and ability to reliably estimate the potential liability.(f) On November 15, 2017, the Company entered into a Settlement Agreement with Thomas G. Dundon (former CEO), that, among other things, altered certain portions of the economic arrangements set forth in the Separation Agreement.
December 31, 2017 December 31, 2016
Total equity 6,480,501$ 5,238,619$ Deduct: Goodwill, intangibles, and other assets, net of deferred tax liabilities 172,664 186,930 Deduct: Accumulated other comprehensive income (loss), net 44,262 28,259Tier 1 common capital 6,263,575$ 5,023,430$ Risk weighted assets (a) 38,473,339$ 37,432,700$ Common Equity Tier 1 capital ratio (b) 16.3% 13.4%
Tier 1 common capital $6,263,575 $5,023,430Adjustments for significant items: Deduct: Tax Reform and other tax related items (c) 652,366$ — Deduct: Gain on RV/Marine Portfolio (after tax) (d) 23,353 — Add: Legal reserves (after tax) (e) 72,100 — Add: Settlement with former CEO (after tax) (f) 42,975 —Adjusted Tier 1 common capital 5,702,931$ 5,023,430$ Risk weighted assets (a) 38,473,339$ 37,432,700$ Adjusted Common Equity Tier 1 capital ratio 14.8% 13.4%
(Unaudited, Dollar amounts in thousands)

29RECONCILIATION OF NON-GAAP MEASURES
GAAP Operating Expenses $426,040 $1,311,436 Deduct: Legal Reserves $91,000 $91,000 Deduct: Settlement with former CEO $66,115 $66,115Adjusted Operating Expenses, excluding significant items $268,925 $1,154,321
GAAP Pre-Tax (Loss)/Income (23,795) 823,514 Add: Legal Reserves $91,000 $91,000 Add: Settlement with former CEO $66,115 $66,115 Deduct: Gain on RV/Marine Portfolio — $35,927Adjusted Pre-Tax Income, excluding significant items $133,320 $944,702
GAAP Net Income $580,116 $1,187,606Adjustments for significant items: Deduct: Tax Reform and other tax related items (a) 596,705 652,366 Deduct: Gain on RV/Marine Portfolio (after tax) — $23,353 Add: Legal reserves (after tax) $72,100 $72,100 Add: Settlement with former CEO (after tax) $42,975 $42,975Adjusted Net Income, excluding significant items $98,486 $626,962
GAAP Diluted Earnings per common share (b) $1.61 $3.30Adjusted Diluted Earnings per common share, excluding significant items (b) $0.27 $1.74
Adjusted Selected RatiosGAAP Return on Average Assets (b) 6.00% 3.00%Adjusted Return on Average Assets, excluding significant items (b) 1.00% 1.60%Average Assets $38,992,937 $39,163,887
GAAP Return on Average Equity (b) 38.50% 21.00%Adjusted Return on Average Equity, excluding significant items (b) 6.70% 11.10%Average adjusted Equity excluding significant items $5,901,536 $5,628,906
GAAP Expense Ratio (c) 3.50% 2.60%Adjusted Expense Ratio, excluding significant items (c) 2.20% 2.30%Average Managed Assets $48,971,677 $50,110,765
Three Months Ended December 31, 2017
For the Year Ended December 31, 2017
(Unaudited, Dollar amounts in thousands)
(a) In addition to the tax adjustments noted under footnote c under Table 8, during the three months ended December 31, 2017, the Company changed the classification of earnings from its subsidiary, Santander Consumer International Puerto Rico, LLC, and no longer intends to permanently reinvest the earnings outside of the United States. As a result of this change, the Company recognized $55.7 million of additional income tax expense during the three months ended December 31, 2017 to record the applicable U.S. deferred income tax liability.(b) These ratios correspond with the GAAP Net Income and Adjusted, Net Income (excluding significant items) shown above, divided by Average Assets, Average Equity and Weighted average number of common shares outstanding(c) These ratios correspond with the GAAP Operating Expenses and Adjusted, Operating Expenses (excluding significant items) shown above, divided by Average Managed Assets.