sangam dairy project yedukondalu
TRANSCRIPT

An Opinion survey of Consumer Satisfaction On Products Of Sangam Dairy
(A study on Guntur District Milk Products Co-Operative Union Limited)
A project report submitted in practical fulfillment of the requirements for the award of the degree of
MASTER OF BUSINESS ADMINISTRATIONBy
YEDUKONDALA RANGA RAO A M.B.A
Roll No:Y10BU93060
SIDDHARTHA INSTITUTE OF P.G STUDIES (Affiliated to achraya Nagarjuna University)
Year 2009-2011
1

Project Report Certificate
CERTIFICATE
This is to certify that Mr. YEDUKONDALA RANGA RAO .A has done
Project work titled “Consumer Satisfaction to words Sangam Dairy”
products under company guidance from 21-05-2010 to 20-07-2010.
He is proven to hard working and innovative during this period.
Regards
For SANGAM DAIRY PRODUCTS
Marketing Manager
SIDDHARTH INSTITUTE OF P.G STUDIES2
GUNTUR DISTRICT MILK PRODUCTS
CO-OPERATIVE UNION LIMITEDVADLAMUDI, GUNTUR

(Approved by AICTE New Delhi, Affiliated to Acharya Nagarjuna University)Siddhrath Nagar, Kantepudi (V), Sattenapalli (M), Guntur Dist – 522438.
Ph: 08641 – 237863, 64,66 Fax : 08641 – 237865
CERTIFICATE
This is the project work entitled Consumer Satisfaction in Sangam Dairy
Products which is submitted by YEDUKONDALA RANGA RAO .A in partial
fulfillment of award of Master of Business Administration of Acharya
Nagarjuna University, Guntur during the academic year 2009-2011 is work out
by him under my guidance.
Head of the Department Project Guide
A.Maruthi Vara Prasad. G.Anjaneya Prasad
Professor Asst.professor, M.B.A.,M.H.R.M.
3

DECLARATION
I here by declare that the project report entiled consumer satisfaction on Sangam
Dairy products is an original and submitted by me for award of degree of
MASTER OF BUSINESS Administration for Academic Year 2009-2011 it was
submitted else where for award of degree (or) diploma of any other institute (or)
university.
YEDUKONDALA RANGA RAO .A
4
ACKNOWLEDGEMENT
I wish to express my sincere thank to our P.G. Department Business administration
faculty members, Siddhartha Institute of P.G. Service for providing me and opportunity for
pursuing my project work in “An Opinion survey of Consumer satisfaction on Products of
Sangam Dairy” Vadlamudi.
I am deeply indebted to our college principal Prof. A.MARUTHI VARA PRASAD
for his valuable encouragement.
I wish to express my sincere thank our H.O.D. A.MARUTHI VARA PRASAD.
I am express my sincere thanks to marketing manage Mr. P.P. MISHRI for giving
me this opportunity and providing me the facilities to work on this project.
I would like to express my thanks to my faculty members for their valuable guidance.
I would like to express my esteemed gratitude to all who have been directly (or)
indirectly involved in making this project a grand success.
YEDUKONDALA RANGA RAO .A
CONTENTS
5

CHAPTERS PARTICULARS
I Introduction
II Objectives of the study / Survey
Significance of the study
Methodology adopted
III Industry profile and company profile
IV Data Analysis
V Findings and
Suggestions
VI Appendix
Questionnaire
Bibliography
6
INTRODUCTION
INTRODUCTION
7

A satisfied consumer is the best advertisement” is so trite, and so simple and old-
fashioned that its truth and value in creating more consumers is more than not overlooked in
the maze of new techniques and academics of modern business.
Consumer satisfaction depends on a products perceived performance in delivering
value relative to a buyer’s expectations. If the product performances falls short of the
consumers expectations. The buyer is dissatisfied. T performance matches expectations the
buyer is satisfied .if performance exceeds expectations the buyer is delighted. Out standing
marketing company’s go out of their way to keep their consumers satisfaction .satisfied make
repeat purchase, and they tell others their experiences with the product. The key to match
consumer expectations with company performance
Before becoming a consumer the person had certain wants and need, and a desire to
satisfy these. Satisfaction of a want or need is always anticipated before purchase, and the
intending buyer experiences, in imagination, many emotional satisfactions which the buyer
hopes to enjoy, after purchase .this application of benefits(satisfaction) before purchase
applies to plan purchase of major items such as houses, cars,, air- conditioners, and also to
so- called impulse’’ purchases. the only difference is the time interval between the
recognition of a want or need and its satisfaction. In every case, satisfaction of a recognized
need(want) its anticipated before purchase, and is the reason for the purchase.
All business firms have realized that marketing is a crore element of management
philosophy and the key to its success lies in focusing more and more on the consumer. Thus
8

the challenge before the marketer is to ensure that they satisfy every consumer. Adam smith
in his, the wealth of nations, had said ‘Consumption is the sole end and purpose of all
production and the interests of the product ought to be attend to, only so far as it maybe
necessary for promoting those of the consumer.
Whether the buyer is satisfied after the purchase depends on the offer’s performance
in relation to the buyer’s exceptions. in general:
Satisfaction is a person’s felling of pleasure of disappointment resulting from
comparing a product’s perceived performance(or outcome)in relation to his or her
exception’’.
Clearly satisfaction is a function of perceived performance and exceptions. If the
performance falls short of expectations, the consumer is dissatisfied. If the performance
matches the expectations, the consumer is satisfied. If the performance exceeds expectations,
the consumer is highly satisfied or delighted.
Many companies is a function are aiming for high satisfaction because consumers who
are just satisfied still find it easy to switch when a better offer comes along. High
satisfaction or delight creates an emotional affinity with the brand, not just a rational
performance.
9

Satisfaction is a person’s feelings of a pleasure or disappointment resulting from
comparing a product’s perceived performance (or outcome .in relations to his or her
expectations).
As this definition makes clear, satisfaction is a function of perceived performance and
expectations. If the performance falls short of expectations, the consumers is dissatisfied. if
the performance matches the expectations, the consumer is satisfied. If the performance
exceeds expectations, the consumer is highly satisfied or delighted.
The offering will be successful if it delivers value’ and satisfaction to target buyer.
The buyer chooses between different offering on the basics of which is perceived to deliver
the most value. Value can be seen as primarily a combination of quality, service and price
(Qsp) called the consumer valued triad. Value increases with quality and service and
decreases with price.
More specifically we can define value as a. ratio between what the consumer gets and
what he gives. The consumer gets benefits and assumes costs. The benefits include
functional benefits and emotional benefits. The costs include monetary costs time costs, and
psychic costs.
10

CONSUMER NEEDS
Understanding consumer needs and wants is not always simple. Some consumer
have needs of which they are not fully conscious. Or they cannot articulate these needs. Or
they use words that require some interpretation. What does it mean when the consumer asks
for an inexpensive car, a ‘powerful’ lawn mower a fast lathe, an ‘attractive’ bathing suit, or a
restful hotel?
Consider the consumer who says he wants an inexpensive car. The marketer must
probe further. We can distinguish among five types of needs.
1. Stated needs (the consumer wants an inexpensive car)
2. Real needs (the consumer wants a car whose operating cost, not its initial price is low).
3. Unstated needs (the consumer expects good service from dealer).
4. Delight needs (the ustomer would like the dealer to include a gift PF Au. s road atlas).
5. Secret needs (the customer wants to be seen by friends as a savvy consumer
CONSUMER VALUE
Consumer delivered value is the difference between total consumer value and total
consumer cost. Total consumer value is bundle of benefits consumers expects from a given
product service. total consumer cost is the bundle of costs consumer expect to incur in
evaluating, obtaining, using and disposing of the product of service.
11
The case for increasing the consumer retention rate is captured in’ the concept of
consumer life time value. It describes the present value of the stream of future profits
expected over the consumer’s lifetime purchases. The company must subtract from the
expected revenues the expected costs of attracting, selling and servicing that consumer.
Various estimates have been made for different products and service.
Customization
Today consumer is looking out for value for money. The challenge before the market
is to identify what value would appeal and convince the consumer, marketers are trying to
enhance the concept of value through unique delivery methods. They have realized that
products service characteristics, consumer’s aspirations and perceptions and the
availability of competing alternatives can be used enhance consumer value.
But the focus and challenge before every firm is to rebuild itself around its consumer.
It should be able to perceive, interpret, serve and satisfy the consumer with the type of
products and services he / she desire and arm itself was to gain a competitive
consumeriation.
CONSUMERIATION WILL HELP FIRM IN
12
Providing the quality of service to match the consumer requirement
Help to focus on consumers’ needs so as to value and offer benefits to the
consumer.
To identify new consumers, new market segments and new applications for
existing products.
Work towards total consumer satisfaction and maximum consumer delight.
Working Towards Enhancing Consumer Satisfaction
In the existing business environment – markets are turbulent and consumer needs fast
changing, companies should out for ways to add value for their consumer by offering
products or services just the way they went it. When the consumer has to choose from a
large and bewildering number of options, features, pricing structures and delivering methods,
offering a unique product to every individual consumer will go a long way in adding value to
the consumer decision making process.
Consumer satisfaction is a continuous process which does not begin for end with a
purchase. It covered the entire ‘ownership experience from selecting a product, to purchase,
through aftercare to repeat purchase. Clearly there are three phases in the consumer
satisfaction process, namely
13

Pre Sales: during this stage the consumer’s expectations are developed through the various
information sources like advertising work of mouth and so on.
During Sales: when the consumer is engaged in experiencing on how to deal with enquiries
and sell product.
Thus consumer’s expectations are their experience will together determine the level of
satisfaction. These expectations are inclusive of :
Pre-Sale period
Availability of clear, useful information on:
The product or service
Its quality aspect
Its core benefits or advantages
Its price
Its availability or sales outlet
How to obtain it
During Sales Period
Opportunity to inspect the products
Provision of an attractive sales environment
14

Courteous and attentive service
Reasonable and reliable delivery
Enhancing quality of goods or services
Prompt redressed incase of compliant receipt
The After Sales Period
If required necessary support or advice be provided
Prompt replacement or refund it necessary
A smooth and straight forward complaint procedure
Efficient and effective consumer follow-up process
Efficient repair and maintenance service
Why Consumer Satisfaction is so significant?
Consumer satisfaction plays a vital role in increasing the company’s goodwill, sales
volume and profit .it is very important to every profit making, non-profit making,
government and other private organizations.
Some important factors for the significance of consumer’s satisfaction:
Consumer satisfaction is significant in the fulfillment of anticipated benefits for the
organization.
It is necessary to recognize, first that a consumer’s friends are commonly in the same
social, income, vocational interest and age group.
15

It is an essential factor in, increasing the sales volume of an organization.
Consumer satisfaction ensures reputed purchases.
Ensuring Consumer Satisfaction
To ensure consumer satisfaction the manufacture must be able to control what buyers
say about his products.
By marketing research a manufacturer designs and implements according to the needs
and wants of the consumer. So, marketing research plays an important tool in
ensuring consumer satisfaction.
After sales services, on sales service, pre sales and service ensures consumer
satisfaction.
By fulfillment the promises made in advertisements and effectiveness of sales man increase
consumer satisfaction.
Some Cautions in measuring Consumer Satisfaction:
When consumers rate their satisfaction with an element of the company’s
performance say, delivery, the company needs to recognize the consumers vary in how they
define good delivery. It could mean early delivery, on time delivery, order completeness, and
so an. Yet if the company had to spell out every element in detail, consumer would face a
huge questionnaire. The company must also realize that two consumers can report being
“highly satisfied” for different reasons. One many easily satisfied most of the time and the
other might be hard to please but what pleased on this occasion,
16

Companies should also note that managers and sales people can manipulate their
ratings on consumer satisfaction. They can be especially nice to consumer just before the
survey.
They can also try to exclude unhappy consumers from the Survey. Another danger is
that if consumers know that the company will go out of its way to please consumers, some
consumers may express high dissatisfaction in order to receive more concessions.
Delivering consumer value and satisfaction :
Value chain is a tool for identifying ways to create more consumer value. Every firm
is a collection of activities that are performed to design, produce, market deliver and support
its product. The firms task is to examine its costs and performance in each value creating
activity and to look for ways to improve it. The firm should estimate its competitors costs
and performances as 'bench marks' against which to compare its own costs and
performances. To the extent that it can perform certain activities better than its competitors,
It can achieve a competative advantage.
Consumer Service Process :-
All the activities involved in making it easy for consumers to reach the right parties
within the company and receive quick and satisfactory service, answers and resolution of
problems.
17

Value - delivery Network :-
To be Successful the firm also needs to look for competative advantages beyond its
own operations, into the value chains of its suppliers, distributors to create a superior value
delivery net work.
1. They bear the major responsibility for correctly identifying the consumers needs and
requirements.
2. They must communicate consumer Expectations correctly to product designers.
3. They must make sure that the consumers orders are filled correctly and on time.
4. They must check that consumers have received proper instructions, training and technical
assistance in the use of the product.
5. They must gather consumer ideas for product and service improvements and convey them
to the appropriate company departments. When marketers do all this, they are making
their specific contributions to TQM and consumer satisfaction.
The Marketer must complain like consumer complains, When the product or the
service is not right. Marketing must be the consumers watchdog or guardian, and must
constantly hold up the standard of “giving the consumer the best solution”.
Computing the Cost of Lost Consumers:
Today’s Companies must pay close attention to their consumer Defection rate and
take steps to reduce it. These are 4 steps to this process.
18

1. The Company must define and measure its retention rate. For a magazine, the renewal
rate is good measure of retention.
2. The company must distinguish the cause of consumer retention and identify those that
can be managed better. Not much can be done about consumers who leave the region
or go out of business. but much can be done about consumer’s who leave because of
poor service, shoddy product, high prices and so on.
3. The Company needs to estimate how much profit is loses when it losses consumers.
In the case of an individual consumer, the lost profit is equal to the consumer’ life.
4. The company needs to figure out how much it would cost to reduce the defection rate.
As long as the cost is less than the lost profit, the company should spend that amount
to reduce defection rate.
Adding Financial Benefits
Two financial benefits that companies can offer are frequency marketing programs and club
marketing programs. Frequency marketing programmes is designed to provide rewards to
consumers who buy frequently and / or in substantial amounts.
Implementing Total Quality Management:
Quality:
Quality is the totality of features and characteristics of a product of service that
the bear on its ability to satisfy sated or implied need”.
19
As we have seen, towards Executives view the task of improving product and
service quality as their top priority. Most consumers will go longer accept or tolerate average
quality performance. If companies want to say in the race, let alone be profitable, they have
no choice but to adopt total quality management (trm).
“Total Quality management is an organization wide approach to continuously
improving the quality of all the organizations process, products, and services”. Marketing
managers have to responsibilities in a Quality-centered company. First, they must participate
in a formulating strategies and policies designed to help the company through total Quality
Excellence.
Second they must deliver marketing Quality alongside product quality. Each marketing
activity, marketing research, sales training, advertising, consumer service and so on must be
performed to high standards. Markets play several roles in helping their company define and
deliver high Quality goods and services to target consumers.
Measuring Satisfaction:
Although the Consumer- centered firm of company seeks to crate high consumer
satisfaction that is not its main goal. If the company increases consumer satisfaction by
lowering its price on increases its service’s the result may be lower profits.
20

The company might be able to increase it’s profitability be means other than the
increased satisfaction. Also , the company has many stakeholders, including employers,
dealers suppliers and stockholders. Spending more to increase consumer satisfaction might
divert funds from increasing the satisfaction of the other partners. Ultimately, the company
must operate on the philosophy that it is trying to deliver a high level of consumer
satisfaction subject to delivering acceptable levels of satisfaction to other stakeholders, given
its total resources.
When Consumer rate their satisfaction with an element of the company’s performance-
say delivery, the company needs to recognize that consumer vary in how to define good
delivery. It could mean early delivery, on time delivery, order completeness and so on yet if
company had to spell out of every element. In detail consumers would face a huge survey
questionnaire.
Tools for Tracking and Measuring Consumer Satisfaction:
There are various ways of measuring consumer satisfaction. each has its own
importance. One cannot just stick to a particular concept and say this is the accurate way of
measuring consumer satisfaction.
Complaint and Suggestion system:
A Consumer-centered organization makes it easy for the consumer to register
suggestions and complaints. Some consumer-centered companies, which are in FMGG line –
21

P&G, whirlpool, establish hot lines with toll free numbers. Certain companies are using
websites and e-mails for quick prompt response from the consumer and in turn there is a two
way communication.
Consumer Satisfaction Surveys:
Studies show that although consumers are dissatisfied with one out of every
purchase, less than 5% will complain, most consumers will buy less or switch suppliers.
Responsive companies measure consumer satisfaction directly by conducting periodic
surveys. While collecting data, it is also useful to ask additional questions to measure the
likelihood or willingness the product or service to others.
Ghost Shopping:
Companies can hire people to pose as potential buyers to report the strong and weak
points experienced in buying the company’s and competitor’s products. These mystery
shoppers can even test how the company’s sales personnel handle various situations.
Managers themselves should leave their offices from time to time and study the
competitor sales. They can visit competitors and can study the way the competitors receive
the handle the various situations. A variant of this is for managers to phone their own
company with situations and complains to see how the calls are handled.
22

Cost Consumer Analysis:
Companies should contact consumers who have stopped buying or who have switched
to another supplier to learn why this happened. Not only is it important to conduct exit
interview when consumer first stop buying. It is also necessary to monitor the consumer loss
rate.
The primary activities represent the sequence of bringing materials into the business,
converting them into the final, shipping out final products, marketing them and serving them.
The support activities are the procurement, technology development, human resource
management and firm’s infrastructure these are handled by certain specialized departments.
The firm’s infrastructure covers the costs of general management, planning finance,
accounting, legal and government affairs that are borne by all the primary and support
activities.
The firm’s talk is to examine its costs and performance in each value creating activity
and to look for ways to improve it. The firm should estimate its competitor’s costs and
performance as bench marks against which to compare its own costs and performance. It
should go further and study the best of class parties of the world’s best companies.
23
Delivery Consumer Value and Satisfaction:-
In a hyper competitive economy, with increasingly rational buyers, a company can
win by creating & delivering superior’s value. This involves the following five capabilities.
Understanding Consumer Value
Creating Consumer Value
Delivering Consumer Value
Capturing Consumer Value; and
Sustaining Consumer Value.
Companies to succeed in attaining these capabilities need to use the concepts Value
Chain and Value Delivery Network.
Value chains:
Michael of Harvard proposed the vale chain as a tool for indentifying ways to create
more consumer value.
Every firm is a synthesis of activities that are performed to design, produce, market,
delivery and support its product. The value chain identifies 9 strategically relevant activities
that create value and cost in a specific business. These 9 values creating activities consists of
5 primary activities and 4 support activities.
The primary activities represent the sequence of brining materials into the business,
converting them into the final products, shipping out final products, marketing them and
serving them.
The support activities are the procurement, technology development, human resource
management and firm’s infrastructure. These are handled by certain specialized departments.
24
The firm’s infrastructures. Covers the costs of general management, planning, finance,
accounting, legal and government affairs that are borne by all the primary and support
activities.
The firm’s task is to examine the costs and performance in each value creating
activities and to look for ways to improve it. The firm should estimate its competitors costs
and performance as bench marks against which to compare its own costs and performance. It
should go further and study the best of class practices of the world’s best companies.
25

ABOUT THE SURVEY
1) OBJECTIVES OF THE STUDY / SURVEY
2) SIGNIFICANCE OF THE SURVEY
3) METHODOLOGY ADOPTED
26

Objectives of the study :-
The following are the objectives set for the present study.
1. To present the genesis and growth of Dairy industry in India and the growth of Dairy
industries in A.P.
2. To identify consumer’s motivating factors that influence the choice of a particular brand
of dairy products, in this case the products of Sangam Dairy.
3. To analyse the channels of distribution of dairy products of Sangam Dairy and those of
its competitors.
4. To Analyse Consumer’s opinion regarding quality, price and packaging of Sangam Dairy
products.
5. To analyse the satisfaction level of consumers with regard to products of Sangam Dairy.
6. To suggest ways to increase the Dairy’s consumers in the near feature.
7. To determine the awareness levels of consumers, with respect to the other mill products
of Sangam dairy.
Significance of the Study :
27

It is very important for an organization to seek feed back from its consumers and
retailers to know the effectivity of their marketing strategies.
Marketing Research is the tool which is used to obtain retailers opinions regarding an
organization’s product and services, their satisfaction level.
So, by Marketing Research, Marketers analyze consumer’s satisfaction level to wards
their product's and design and implement their marketing strategies which are compatible to
consumer's expectations.
Basing on this premise, this survey has been carried out, so that the company can be
provided with a relatively correct picture as to what the consumers perceive about the milk
and the bi products of milk from Sangam Dairy.
Therefore, studies of such types are necessary for an organization to implement their
marketing strategies effectively and efficiently in order to increase their market share.
Methodology of the Study :
28

Research design :-
The Research design for the study of marketing research on dairy products is as follows :
Source of Information :-
a) Primary Data b) Secondary Data
Primary Data:-
Primary Sources for my survey include consumers, buyers, middlemen, salesmen and
others.
Secondary Data :-
Some times Company files or marketing research reports and other reports contain the
desired information. Thus Secondary data sources in other words, are reports not of items of
informarion gathered specially to obtain objectives of the research project being planned, but
rather of material assumed for other purposes.
Data Collection for the study :-
29

For the present study, data was obtained from internal sources and external sources.
Internal sources include collection of data from company records such as sales reports and
other information sources. Data collected from external sources include primary data and
secondary data. Secondary data was collected from published literature available on the
subject matter and for obtaining primary data a queationnaire was designed, developed and
administered.
Sampling:-
In Sampling Survey Model the instrument used was Questionnaire. This was
administered to daily consumers of dairy, products. A sample size of 100 was considered for
the study Sample was taken in Guntur and Tenali towns.
The sample also covered persons having different Educational Qualifications and
respondents in different age groups. The sample also covered Government Employees and
Self - Employed and people employed in Private Organizations.
Limitations of the Study :
1. The study is geographically limited only to Guntur and Tenali towns.
2. The sample size of 100 may or may not present the accurate picture.
3. There is no compulsion on the part of organization to accept my suggestions.
4. Though the research is purely Acadamic, a sincere effort has been made to make the
findings useful to company also.
30

1. Industry profile
2. Company profile
INDUSTRY PROFILE
GENESIS AND GROWTH OF DAIRY INDUSTRY IN INDIA
31

Co-operative dairying in India is over 50 years old of the total milk produced in
India, about two third is buffalo milk and a still larger proportion of buffalo milk is in
the processed stage. The milk processing Industry gained momentum and
respectability in the 80’s but still it can only be considered as growing one. The milk
sector is the second largest contributor to the agricultural economy in terms of
produce. In 1990-91 the co-operative collected nearly ten million liters and marketed
eight million liters of liquid milk per day.
Of the total milk production in India, about 45% us used fluid consumption rest
is converted into products such as ghee 33%, Dahi 8%.
Animal husbandry was considered an activity for the rural areas, where as dairy
development was only in the cities. For the farmers, projects such as the key, village
scheme and the intensive cattle development programmers were very useful. These
aimed at improving milk yields through better management of the cattle and eventual
upgrading of the breads, But, these projects by themselves never paid much attention
either to be marketing of the additional milk that was supposed to be produced, or to
its processing.
Indian dairying is marked by high seasoned of milk production. This is caused
by the breeding cycle, as well as loading protection most crop residue is fed to
animals, the availability of which were from season to season.
32

There is, therefore the flux season, when milk animals produce nearly double
quantity of milk than they do in the lean season. This at time ponds in animal gluts.
Dairy development meant setting up modest sized (10,0000 to 25,000 liter /
day) liquid milk processing plants in cites with population of half a million or more.
Even if the plants in cities with population of half a million or more. Even if the plants
had functioned to their full capacity which they did not public dairies could have had
only about 10-15 percent share of the market? This meant that the urban provate milk
trade could continue unchecked. The link between the rural produced and the urban
procession public as well as private remained the middleman. Though India has 23%
of total animal wealth of the world, the milk production is only 6.5%. This miserable
situation is due to lower productivity of the Indian milk animals. The estimated
demand for milk us 64.40 million tones by 2000 A.D. the agricultural sector
contributes 46% of national income. The dairy industry contributes 10% of
agricultural income so, around 5% of the national income is contributed by this dairy
industry.
Dairy Development in India, 1950-70 Creation of NDDB:
In 1964, the then Prime Minister of India, the late Lal Bahadur Shastri
visited Anand. From his observations and discussions, with farmers over there the
33

Prime Minister could infer that the Karia farmer had no special advantage agro-
climatically or in the quality of his cattle. He concluded that because the farmers
owned the dairy, and because their elected representatives managed the village
societies and the district union, and because the y had the good sense to employ
competent professionals to manage their dairy factories, the Amul dairy was sensitive
to their needs and was responsive to their demands. Their access to a metropolition
market – Bombay for milk, and good national marketing in the case of dairy products,
where their greatest assets. These were the reasons why AMUL was such a great
success.
The prime minister also wanted to know why, when Amul was doing so well,
the other dairies run by the central and State Governments were not successful. He
desired “Anand” be replicated throughout India. He said in a letter addressed to the
state Chief Minister, we envisage a large programme of co-operative dairies during
the fourth plan and this will, no doubt be based on the Anand model. If we can
transplant the spirit of Anand in many other places, it will also result in rapidly
transforming the socio-economic conditions of the rural areas. He decided that the
Government of India would create a body, whose job would be replicate “Anand”.
The National Dairy Development Board (DDB) was the created in 1965.
Initially, the concerned officials objected the Anand pattern and were not
prepared to make five-year Plan funds available for replicating "Anand" in their states.
34

For some years, NDDB tried unsuccessfully to convince one state after another to
agree to make these funds available. It became obvious that if the NDDB was to carry
out the objectives for which it was established, it must have its own programme and
funds to replicate the Anand pattern. It was thus that operation Flood was evolved.
OPERATION FLOOD PROGRAMME IN INDIA
The objective of operation Flood was to replicate Anand. Nothing else. The
State Government could use their own funds to develop dairying in whichever way
they choose, but the additional funds available under Operation Flood were only to be
used for replicating Anand.
Operation Flood the largest development programme undertake in the world and
was initiated closely on the heels of Green Revolution in country, against the back drop
of huge surplus of milk production in the highly developed milk producing countries in
the west and dwindling per capita milk availability at home. According to the
agreement signed by World Food Programme (WEP) and Government of India, the
WEP will arrange to supply 1,26,000 metric tonnes of butter oil, which the corporation
will handle on behalf of the Government, Utilization of these commodities would
generate funds estimated at Rs. 954 millions during the project period. These funds are to
be invested in the plan of operations agreed by WEP and Government.
35

By 1968, NDDB had formulated the first phase of operation flood, which aimed
to capture for public dairies a "commanding share" of the milk market in the four
metropolitian cities of Bombay, Delhi, Calcutta and Madras. It also aimd at speeding up
the dairy development by increasing milk production and procurement in rural areas
which supply milk to these four cities.
In order to achieve the desired objectives of the project the following order of
implementation was adopted.
1. Quick expansion of urban handling capacities by expanding the dairies in
Delhi. Bombay, Calcutta and Madras and by setting up new liquid milk plants.
So that the total capacity of the organized sector would be increased from 1
million liters per day in the pre-project to 2.57 million liters a day in the four
major cities.
2. Supply of WEP commodities - skimmed milk powder and butter oil for
production of recombined milk to help to speed up full utilization of the expanded
capacities.
3. Selling up of rural milk-producer owned co-operative organizations, to
produce, process and market milk on one hand and to market technical inputs for
milk production on the order.
36
4. Implementation of milk production enhancement programms with the long-term
objectives of achieving self-sufficiency in milk.
5. Establishment of rural feeder balancing dairies to coup existing milk available
to replace combined milk produced by use of WEP.
6. Development of the basic transportation and storage to facilitate regional and
seasonal balancing of milk supply and demand.
7. Development of the basic transportation and storage of facilitate regional and
seasonal balancing of milk supply and demand.
CURRENT DAIRYING SCENE IN INDIA
The dairy industry in India made rapid progress, particularly during the last two
decades. Today, India occupies first position in milk production in the world,
surpassing the US. The credit, not doubt, goes to Operation Flood, which has played a
key role in the development of Dairying. India is a milk-consuming nation. This,
couples with our large population, ensured steady increase in demand for milk.
The employment potential of Indian dairy sector is substantial. This sector
provides additional income and generates job opportunities for 80 million fanner
families. More than 70 per cent of marginal farmers and landless laborers maintain
dairy animals to supplement their incomes.
37

In India, there are 10.1 million farmers who are members of 77,000 village dairy
co-operative societies, each of which is affiliated to one of 170 district and regional
co-operative unions which is turn are part of a state co-operative marketing federation.
These are 22 of these federations, which offer dairy and other products in the market
successfully while competing among themselves. At present, dairy farms are owned by
individuals, investors and multinationals.
The cooperative sector has contributed significantly for the success of white
revolution in India. There are more than 97,000 milk co-operative societies in 264
districts. This sector grows at me rate of 6.5% per annum.
ADVANTAGES OF INDIAN INDUSTRY
In terms of total bovine population, India occupies the first position in world,
with 176.7 million cattle and buffaloes. (World's total bovine population is 1,420
million.) A large bovine population, strong procurement infrastructure, presence of
highly skilled manpower, cheaper labour, and a large number of processing and allied
facilities are some of the advantages that the Indian dairy business has.
EXPORT POTENTIAL
India is not fully utilising its export potential in respect of dairy products. The cost
of milk production in India is the lowest. And the dairy industry is not getting any
38

subsidy. There is an urgent need to pay special attention to quality of India has to
compete with other countries. At present, the country is exporting malted milk foods,
ghee, butter and cheese to countries like Bangladesh. UAE, Nepal, Sri Lanka, Oman and
Bahrain. Of course, world milk prices are subject to dramatic fluctuations. Export
earnings from the live stock sector and related products rose to Rs.19,250 million m 1996-97
from Rs.7,920 million in 1988-89.
DISAPPOINTING FACTS
Milk availability in India is still low at 212 grams/day per person. Of course, the
per capita availability of milk in the rural areas is barely 121 grams/day as compared
to 400 grams/day in urban areas.
Animal productivity remains low, as tire national average is only 1.5 liters/day.
Productivity of Indian cattle is 10 percent of the productivity of cattle in Israel and 30
percent of the level achieved by the developed countries. Unless milk productivity is
raised, it is difficult to compare with Europe. America and Oceania.
What is more, only 10 percent of the milk produced are in the organised sector,
leaving the remaining portion in the hands of milkmen thus providing chances for
adluteration and exploitation. Also, our cattle and buffaloes are slow maturing, slow
irregular cycling behaviour, produce fewer calves in their life-time, and suffer from
physical and physiological anomalies in reproduction.
39

There is a serious shortage of conventional feeds for feeding livestock. Both
quantitatively, there exists a wide gap in demand and availability of fodder resources in
India. During the last two decades there has been no change in the cultivated area devoted
to fodder. It still stands at 4.4 percent of the total cropped area. It is estimated that 10 to 15
per cent increases can be recorded in the existing milk production through adequate
feeding of bovine population. In order to solve feed shortage problem, we have to rely
on cheap alternative feed to growing calve '
STEPS TAKEN SO FAR
The problem of low productivity of animals can be solved by ensuring
availability of feed and fodder. Concrete efforts are needed to improve the productivity of
fodder crops, develop grazing land, promote agro-foresty
systems like silvipasture, and research on low-cost feed terns. Extensive
research has been carried out to Find out the utility of items like apple pom ace,
ground nut hulls, mesta cake, neem cake, salseed meal, soya pulp, rice bran and
brewery waste.'
On June 9, 1992, the government of India issued an order under Section 3 of
the Essential Commodities Act, 1955. According to this order, known as Milk
and Milk Products Order (MMPO) 1992, milk does not have to mean just cow or
40

buffalo milk, it could also be goat milk or even a mixture of the three. The
various objectives of MMPO include.
* Facilitating supply or availability of milk by balancing uneven supplies in
different regions.
* Maintenance and increase of milk production and supplies and ensuring
equitable distribution.
* Establishment of proper standards and norms for control in handling milk
and milk products.
* Establishment, promotion or registration of any industry related to milk or
milk products.
* Such other objectives incidental to the effective implementation of the
MMPO
The milk unions are urging the government to either ban OGL im ports of
skimmed milk power (SMP) or impose duty on the same. They argue that prices
of imported powder should be at par. With those of the domestic products.
The price of skimmed milk powder is coming down under pressure from
imports. It is said that levying of minimum import duty of 35 percent of SMP
41

would provide a level playing field to the producers. (India gets about 5,000 tonnes
of imported milk powder annually.)
LATEST DEVFLOPMENT IN THE DAIRY SECTOR
Formation of new dairy co-operatives in Operation Flood areas to bring 3.5 million
members under the co-operative fold in addition to the 9 million members now
being served by dairy co-operatives.
Providing vocational opportunities and fostering entrepreneurship among dairy-
science student trainees to equip them with knowledge and experience so that they
may take up dairying as a profession.
TOP MOST PRIORITY
In the livestock sector, productivity hold the key. The major thrust should be on
genetic up-gradation to improve productivity and production. Of course, priority should
be given to infrastructure development, feed management and better health care
services.
DAIRY INDUSTRY IN ANDHRA PRADESH
42
The programme of dairy industry was initially maintained with commendable
help of the United Nations International Children’s Emergency Fund and freedom
from hunger campaign of U.K. These organizations contributed a lot in the
establishment of dairy units Andhra Pradesh during the period 1967-1969.
The milk producers have been faced with a lot of problems in the process of
production and marketing of milk namely improper transport facilities, poor
technology and absence of organized system of processing marketing and piecing. It
was at this context that government of A.P. has viewed to constitute a dairy
development co-operation to safe guard the interest of milk producers and ensuring
adequate supply of fresh milk at a reasonable price to the urban consumers. As a result
the APDDC came into existence on 2nd April, 1974.
CO-OPERATIVE FEDERATION :
To implement operation flood – II programme through active involvement of
producers in organizing milk production, procurement processing and marketing on
“three –tier” co-operative structure as per the national policy of Government of India,
Andhra Pradesh Dairy Development Co-operative federation was constituted in
October 1981. The three-tier system includes primary village level dairy, co-operative
society’s co-operative union at district milk shed level and a state level federation.
43

For dairy development programme in Andhra Pradesh, the Indian co-operation
offered financial assistance of 78.51 crores with 30% of grand and 70% on loan basis.
Sixteen districts but of 23 districts in the state were identified by the NDDB for
implementation of Operation Flood –II programme.
With the implementation of operation flood – II programme in Andhra Pradesh
dairy development has gained momentum providing a trust to eradicate the poverty,
unemployment in rural areas, and brought greater awakening and confidence among
producers to manage their own affairs through dairy co-operative of Anand Pattern.
The dairy development in A.P., is presented in the following table.
STATEMENT SHOWING DAIRY DEVELOPMENT IN A.P.
1. Milk product factories 6
2. District dairies 10
3. Milk chilling centers 48
4. Milk Collection centers 14,000
5. Village milk producers 5,200
Co-operative societies
6. Milk collection routes 267
7. Village connected for collection of milk 10,000
8. Cattle feed plants 6
9. Women members in unions 5,000
44

(Source : Andhra Pradesh year Book)
In a country like India where a large population is dependent on agriculture for
livelihood, the dairy industry assumes special importance. India has emerged as the
largest milk producing country in the World with and annual production of 80 million
tones. The country’s milk production is growing at an annual rate of 4.4 percent and
its share in world milk production is likely to reach 15.2 per cent by 2004. Indian milk
production is not only economical but highly energy efficient.
The operation Flood launched in 1970 could raise the per capita milk
consumption from 112 grams in 19970-71 to 235 grams in 1998-99, the world average
being 285 grams. But a large population in the country still doesn’t get the required
quantity of milk (500 grams of milk per day). In the rural areas, it is only 121 grams a
day.
The major milk producing states are Uttar Pradesh (18.3 per cent), Punjab (1.2
per cent), Rajasthan (7.8 per cent), Madhya Pradesh (7.6 per cent), Maharashtra (7.4
percent), Gujarat (7 percent), Andhra Pradesh (6.3 percent) and Haryana (5.8 percent),
These states account for about 70 percent of the total milk production.
45

LIQUID MILK MARKETING IN URBAN AREAS
Million liters per day
Year Through
Sangam Dairy
Through Other
Dairies
Total
1970 – 71 0.91 0.05 1.00
1975 – 76 1.33 0.81 2.14
1980 – 81 2.18 0.16 2.34
1985 – 86 3.00 3.00 6.00
1990 – 91 3.00 3.19 6.19
1995 – 96 3.50 5.00 8.50
2000 – 03 6.50 8.00 14.50
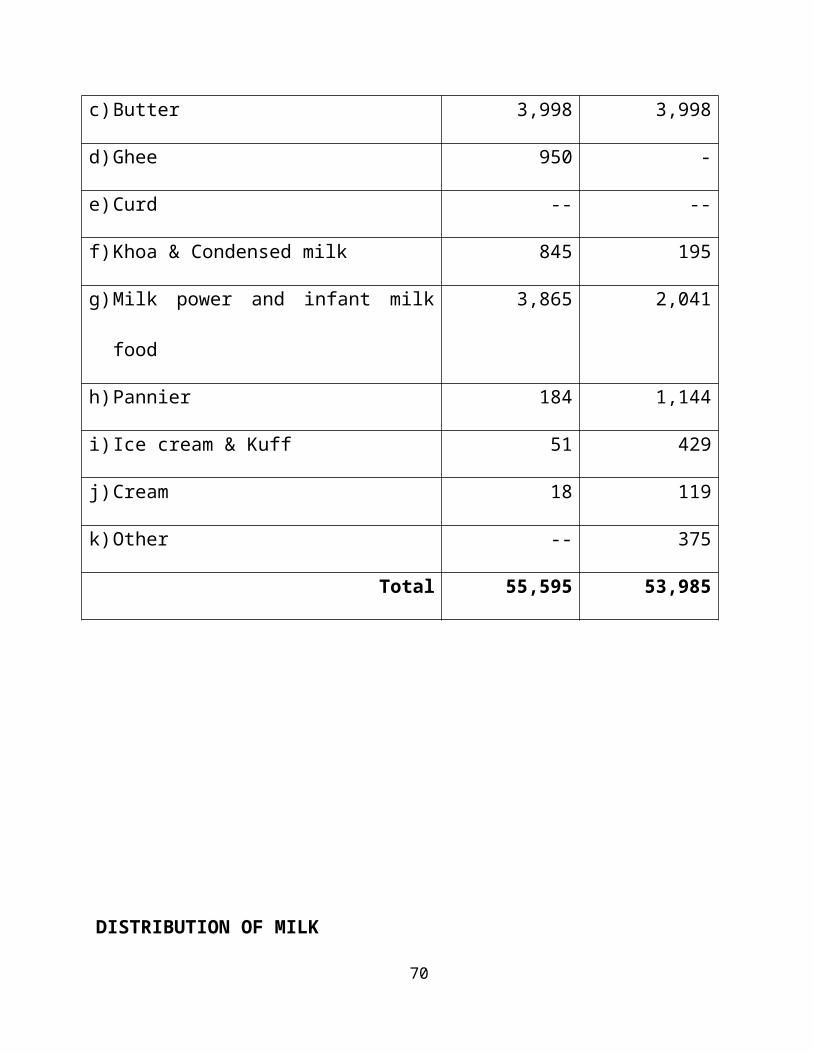
CONSUMPTION OF MILK AND MILK PRODUCTS IN INDIA, 1999
46

MILK
(In Liters)
Milk Products
(In Tones)
a) Light Milk 26,084 26,084
b) Butter Milk /Separated Milk Butter 19,600 19,600
c) Butter 3,998 3,998
d) Ghee 950 -
e) Curd -- --
f) Khoa & Condensed milk 845 195
g) Milk power and infant milk food 3,865 2,041
h) Pannier 184 1,144
i) Ice cream & Kuff 51 429
j) Cream 18 119
k) Other -- 375
Total 55,595 53,985
DISTRIBUTION OF MILK
Use of Delhi Calcutta Mumbai Chennai Hyderaba Bangalore
47
Liquid Milk dMilk Consumption
45.19 63.82 15.58 30.47 30.47 30.72
Consumption in Tea
31.67 24.77 37.31 42.40 42.40 44.57
Converted of Curd
19.68 2.95 10.93 27.59 24.26 23.44
Converted to Channel pannier
0.34 2.19 0.17 0.17 0.50 0.05
Other uses (Sweets, Ghee)
2.00 5.27 2.00 2.00 1.90 1.47
DEMAND FOR MILK
With the anticipated growth of purchasing power in urban areas, the demand for
milk is estimated to rise substantially according to one estimate, it is likely to be 97.7
million tones by 2002 Ad as against 35.01 million tones in 1982. The information
regarding the population, its economic demand and nutritional demand is given in the
following table.
Market estimate (Figures in million tones)
Produce 1996 1997 1998 1999 2000 2001 2002
48

r
Milk powder
12055 11250 11850 13505 15400 16700 18400
Instant milk powder
28524 28200 25500 25970 25451 25234 25334
Butter 17000 20400 24480 29370 35250 38525 40340
Cheese 17100 21375 26710 33399 41748 47487 48434
By seeing the above tables we can know that the bulk of milk consumption in
confined to the higher income groups. Today the consumer repay is chasing many
more processed food even in rural areas / this trend is likely to favour packaged milk
and milk products that offer multiple benefits to convenience / hygienic and good
value for the money spend on them. So change in the product mix is emerging the
rural market is expected to grow much faster than the urban market in terms of market
shows uncertain milk products. The role of television in developing rural market is
significant. The rural folks are now purchasing more placed milk products making
efforts to make them a horn.
COMPANY PROFILE
GENESIS AND GROWTH OF SANGAM DAIRY
49
Under operation flood – I program, Guntur District was to develop dairy
activities a pattern keeping in view the three-tire system of village dairy co-operative
society at village level managed by the elected representatives of Milk products, a co-
operative union at district level was to be managed by the representatives of village
dairy co-operative society and co-operative federation at state level an apex body.
The Guntur District Milk, Producers Aided Co-operative union limited was
registered under Andhra Pradesh Co-operative union limited was registered under
Andhra Pradesh Co-operative society act 1964 with register No. 836 DD dated
23.02.1987 with 81 affiliated milk producers co-operative societies and 125 milk
collection centers functioning in the area of Guntur District supply milk dairy.
The board of the management of the union comprises 12 elected boards of
directors from village dairy co-operative societies, 5 ex official board of directors
from Andhra Pradesh Dairy Development Co-operative federation register of co-
operative societies, representative of financial agencies and the chief executive of the
union. The management of the dairy was handled over to the Guntur District Milk
producers’ co-operative union limited by the Andhra Pradesh Dairy Development
Corporation on 30.08.1978.
Farmers Contribution :
50

Milk producers of Krishna, Guntur and west Godavari districts have generally donated
for the purchase of 34, 46 acers of land at a cost of Rs.105 lakhs before initiation of
this project during 1993-94, Further 53 acres of land was purchased for the location of
technical inputs and staff quarters, the Andhra Pattern advocated on integrated
approache to Dairy Development under co-operative sector by providing remunerates
price and creating assure market to the farmers produces themselves. The producers
have got to say in determining the price of the commodity the produce. This is really a
fantastic approach and boom on the farmers. The new out look in anand pattern is to
provide is to provide incentive (input) to the farmers to reduce the reproduction cost
and education the rural milk produces in clean milk production maintain the good
cattle by practices of breeding feeding and management through farmers inductions
programme is also pert parcel of Anand Pattern.
The anand pattern
The anand pattern an integrated approache to dairy development under the co-
operative secor by providing remunerative prices creating assure markets for the
producers and also safe-guards their interests by providing necessary technical inputs
for rapid progress of dairy industry in this pattern, the real involvement of producers is
seen when the village dairy co-operative as well as the district unions aremanaged by
producers themselves. The producers have a say in dertermine the price of thee
commodity.
51

The new outlook in anand pattern is to provide incentives (inputs) to farmers to
reduce costs facilities milk production enhancements and educate the rural milk
producers in quality milk productin and maintaining large stock by improved breeding
and feeding of the village diary co-operative societies will also be increased in this
patter.
Artifical inputs and Milk enhancement programmer.
The various technical inputs offerd to milk producers in a phased manner for
milk production enhancement are classified as follows.
1. Artificial insemination services :
The dairy is having a sperm production center at its unit premises and maintains 20
Murrah bulls for semen production purposes. The dairy is producing 50,000 does of
Murray seman every year and 140 artificial insemination centers are run at socieiteis
with the help of society workers. These workers are given training in veterinary first
aid and artificial insemination. The dairy has also initiated action programmes to
strengthen semen bank to produce 1,00,000 does of Murrah semen every year from
1993 onwards. The union at their center provides frist aid equipment medicines liquid
nitrogen containers etc., in addition to paying incentives to the artificial insemination
(A.I) done Rs.3 and Rs.5 for each confirmed pregnancy is paid. These incentive
schernes are introduced to created interest in artificial insemination among workers.
52

2. Animal Health / Disease control :
TMI 1983 the dairy has provided weelkly visits of veterinary doctors to all
societies to treat sick-animals free of cost. In addition to these programmes the
dairy has provided emergency veterinary services with a nominal charge of Rs.15
per case treated. Veterinary first aid and artificial insemination at village level is
implemented through society workers by imparting 45 days training these trained
workers attend to first aid an insemination work at village level hence there union
provides medicines and semen free of cost.
The dairy provides emergency veterinary servicing facilities from 7 places in
District by keeping doctors and transportation at these places these docots attend to
emergency cases with in the radius of so ken with in 2-3 hours on receipt of
emergdncy calls. For all these emergency visits the charge is Rs.15. During the
first visit and Rs.10 then onwards including the cost of medicine.
3. Regular veterinary facilities .
53

The regular veterinary facilities are functioning since 16-7-1990 this verterniary
duty convences 54 societies and unions which have provided A.I. quality frozen
semen. The main aim of veterinary facility is to also societies.
4. Fodder Development Programme
Under fodder development programme the union raised perennial crops in nearly
15 acres its campus for distribution to the milk producers free of cost. Every year
the union supplies different varieties of fodder seeds like MP chan 85.59.3.
Haryana chan P.C.23 and P.C. 9 low pea to the milk producers at 30% subsidy.
The union also distributes leguminous fooder seeds likes pillpesara and sun hamp
to the tune of about 150 – 175 million tones as end crop to milk produces in low
tying areas on subsidized rates.
5. Fodder and Seed Multiplication programme:-
The union has taken up the seed multiplication programme for the past 5 years and
supplies good variety seeds apart from encouraging seed multiplication for the benefit
of milk producers excess stock is supplied to other milk unions with in the state and
those out side also. They are known in a position to supply fodder seeds at a cheaper
price to the milk producers by avoiding purchase from external agencies. Different
varieties like MP Chari 136 are supplied under seed multiplication.
6. Silvipasture Scheme :
54

The union also taken up schemes like silvipasture and decentralized nursery schemes
over the past 3 years and has supplied about 11 lakh samplings of different tree
species like casuarinas, euclyputs, babul, sea same etc., during the year 1988 – 89
under D.C.N. scheme under the kisan van scheme, this union has taken up tree
growing in fields from 1986 -87 onwards by giving 1,000 as full subsidy per acre
those who are growing threes like subabul, Casuarina, Eucalyptus, Babul, gruit trees
and raising fooder crops also in between the trees under the central government
scheme.
7. Enrichment of Paddy straw with Urea :-
The dairy has also taken up scheme for enrichment of paddy straw with urea
treatment. For this purpose societies and milk producers have already been identified.
Under this scheme the dairy will be providing necessary infrastructure required for
this program of cost of producers.
8. Cattel Feed :-
The cattle feed plant with an installed capacity of 100 MT /day was constructed by the
NDDB award on a turn key basis. Under operation foold programem cattle feed is
produced by semi-automatic pre-weighing machines with a provision to separate and
remove uneven unwanted and harmful particuals from the raw materials, these plant
have been producing cattle feed 1982 along with rabbit and fish seeds. There are about
40 members workers uncluding supervision staffs working in the plant.
55

9. Distribution of material mixture on subsidy basis
The dairy is distributing mineral mixture to the milk producers at 50% subsidy basis at
present may sell the mixture at the rate of RS.6 per kg. for this purpose Rs.1 lakh has
been allotted in 1990 – 91 union budgets.
The management has initianed action in manufacturing this mineral mixture
from January 1991.
10. Cattle Insurance :
As a discretionary input, union has under taken milk cattle insurance on a massive
scale. They insure the milk cattle at a concessional premium rate of which 1/3 borne
by union 1/3 by society and the rest by the cattle owners.
11. Cross Breed Heifer subsidy scheme :
To encourage cow milk production it has been decided to distribute 1,000 cross
breed heifers to milk producers at subsidized rates for this purpose Rs.5,00,000 has
been allotted as subsidy for these, 1,000 cross breed heifers 50 villages have been
identified by the doctors where veterinary hospitals and dairy union artificial
insemination centers are available.
12. A septic Milk Packaging Station :
56

The city of project was Rs.2.4 crores out of which the component for civil works was
Rs.50 lakhs. In addition there are four packaging machine supplied by Hindustan
packaging company ltd., under a lease arrangement. The commercial packaging of
milk in “tera pack” started from 09-04-06 the installed capacity is one lakh liters per
day and the shelf life of the product is 15 days.
13. Present Existing capacities
1. Milk handling capacity per day : 2.5 lakh liter
2. Milk powder capacity per day : 20 Metric tones
3. Table butter (4 packing machines) : 8 metric tones
4. Ghee : 10 Metric tones
5. Storage capacities of butter in deep fridge : 700 Metric tones
6. Boiler sections : 2 Oil fired boiler
: 2 Coal fired boilers
7. Refrigeration Capacity : 350 Metric tones
8. Milk chilling centers : 50,000 Liters per day
: Narasaraopet, Gurajala
9. Cattle Food Plant : 100 MTS / day
10.Aseptic packaging station : 1 lakh /day
Milk sales in 1987 – 2010 (day wise in liters)
57
Year Day wise
1987 41,915
1988 42,618
1989 39,715
1991 40,825
1992 42,118
1993 44,018
1994 45,917
1995 55,397
1996 57,390
1997 56,280
1998 48,431
1999 58,316
2000 70,367
2001 85,463
2002 77,615
2003 1,13,333
2004 1,34,760
2005 1,52,635
2006 1,68,856
2007 1,68,940
2008 1,69,024
58

2009 1,69,108
2010 1,69,192
SANGAM DAIRY CENTER WISE SALES PARTICULARS
CENTERS MILK (LITERS MONTHLY)
Guntur 10,59,195
24 hours H/p Guntur 58,650
Tenali 1,87,915
Mangalagiri 1,02,550
Pedanandhipadu 5,690
Gurajala 210
Bapatla 17,550
Ponnur 5,120
Chebrolu 1,960
Chilakaluripet 1,05,720
Narasaropet 44,880
Vijayawada 44,780
Amaravathi 18,810
SP canteen 2,320
Vignan college 27,060
Tadikonda 1,080
Nagarjuna sagar 30,750
59

Repalle 8,110
Milk BI products sales particulars (Month)
Lassi 7,50,000 liters
Special flavored Milk 1,45,000 liters
Doodh peda (25 gms) 36,000 kgs
Doodh Peda (250 gms) 75,000 kgs
Skin Milk powder 30,000 kgs
Ghee 3,500 kgs
Ghee (loose) 1,000 kgs
V.P.T. Butter 8,25,650 kg
White butter 1,08,000 kg
Financial position :
The union has started its operations independently from 1/8/78 onwards. The
project was executed by the NDDB on turnkey basis. The term loan leased by rest
while IDC and assets were handled over to the Guntur union.
Share capital :
60

Initial authorized share capital is Rs.500 lakhs enhanced to 1,000 lakhs from
1/2/01 the union is paid up share capital as a 31/03/00 is Rs.167 lakhs and share
suspense in Rs.140 lakhs.
Long Term finance :
The NDDB has provided financial assistance under operation flood programme
I / II / III for capital projects union. Totally an amount of Rs.1422.55 lakhs was
released by NDDB towards loan and grant. Out of this loan portion was 995.49 lakhs.
Loan Repayment :
NDDB loan installments are being paid regularly in time and no dues are cut
standing the entire loan drawn under of amounting to Rs.279.16 lakhs has been repaid
to the NDDB. Amount Rs.11.32 lakhs repaid under II as principal. No principal
repayment was made under of III the following are the details of repayment of NDDB
since inception.
Working capital loan :
NDDB has provided working capital loan unto 31/03/92 from 1/4/92, the
NDDB has with drawn this facility to the union. From 1992-93 onwards the union is
availing working capital limit with AP state Co-operative bank through GDDC Bank.
The present limit with co-operative central bank Rs.500 lakhs (a) 19.5% interest per
annum. The out standing balance as on 1/5/97 is nil.
61

Borrowing form Primary societies / Centers :-
The union is also accepting deposits from milk societies / centers at the rate of
12.5% pa till now it is to the extent of Rs.192 lakhs.
Turnover / Profit / Loss
The turnover of the union was Rs.4.09 crores 1978-79 and it has gone up to
Rs.67 crores in 1994-95 and it is 63 crores (provisional) in 1996-97. A statement
showing the profit and loss position of the union is appended. The union has earned
profit for all the year since inceptions expect 1985-86 and 1993-94. The loss is
Rs.46.85 lakhs after providing Rs.52 lakhs depreciation. The loss during the year was
due to higher milk purchase price fixed by the government of Andhra Pradesh.
The loss in 1993-94 is Rs.64.35 lakhs after providing Rs.84 lakhs depreciation.
The loss incurred is due to heavy milk procurmetn and glut in the market for the milk
products during 1993-94 the loss incurred in these two years wiped-off in the
succeeding years. Theres in o accumulated loss in fact the union has paid an amount
of Rs.103 lakhs forward price difference (a) 20 paise per kg milk to the producers for
the milk supplied by them during 1994-95 and an amount of Rs.172 lakhs towards
price difference (a) paise per kg.
Aseptic packaging station : Sangam Dairy – Vadlamudi
Aseptic milk or sterilized long shelf life milk is a unique way of milk
preservation, where the milk is packed life. The essential feature of this pack is to
62

provide milk packed as grocery item, with case and convenience requirement and
store it for usage as and when it is preservation technology, which offers effective
convenience pack to the consumer.
Aseptic milk packaging station was established initially during the 1986 with an
estimated cost of Rs.2.5 crores. The station equipped to pack milk in packs within
packs with 15 days shelf life earlier have been replace with machinery to pack milk
with 3 months shelf life. The existing capacity is 50,000 Lt / day.
The major towns covering the distribution activities are :
1. Guntur
2. Tenali
3. Mangalagiri
4. Narasaropet
63

5. Chilakaluirpet
6. Macherla
7. Amaravathi
8. Ponnur
9. Bapatla
SALES AND DISTRIBUTION
For an purpose of distribution, sale of milk and by products produced by
Sangam Dairy, there is a special sales section, the chart of that section as follows:
SALES ORGANIZATION STRUCTURE
General Manager
Sales Manager
Office Superintendent Assistant Sales Manager
Senior Assistant Milk Distribution Supervisior
Junior Assistant Sales Supervision
64

Board of Directors :
Board of Directors is all in the maters of the company. The managing director is
authorized by the best and makes him responsible for decision making on immediate
as well as long range policies.
1. K. Rajan Babu - Chairman
2. K.Koteswra Rao - Director
3. K. Jithendra - Director
4. M. Ramakoteswra rao - Director
5. K. Lakshmaiah - Director
6. N. Venkata Krishna Prasad - Director
7. D. Sambi Reddy - Director
8. Y.Nageswara Rao - Director
9. A. Rambabu - Director
10.B. Subba Rao - Director
11.P. Ranga Rao - Director
12.G. Dhanunjaya Rao - Director
13.K. Swarajya Lakshmi - Director
FUTURE GOALS OF DAIRY
* To enhance the present procurement to 4.0 lakh liters / day in next 5 years.
65

* To enhance liquid milk market to 8 lakh liters / day in next 5 years.
* To enhance business turn over to 250 crores by 2005.
* To bring all the societies in the district under electronic milk testing.
* Increasing milk productions enhancement activities including cross breeding
cows and up gradation of buffaloes.
* Up hold co-operative principles and be model co-operative for others.
AWARDS
Sangam Dairy was awarded excellence and the chairman of the organization
was awarded ‘Udyog Ratna’ on 24.04.1997 by the institute of economic studies, New
Delhi.
66

Council for business of economic studies, New Delhi presented “Gold star”
award and excellent award on 27-08-1998. ‘Mulakanuru Viswantha Reddy’ award
was given to Sangam Dairy for the year 1998 by the Co-operative development
foundation, Hyderabad on 16-11-1998. For 1999-2000 the dairy was graded ‘A’ in
audition which is the High in audit rating. The Sangam Dairy was awarded by ISO
9000 certification on May 2003.
COMMISSION PARTICULARS
Commission of appointment sales dealers take 0.15 per liter of milk and by products
they take commission as follows :
S.No. Product Commission
1. Lassi (200 ml) 0.40
2. SFM Bottles (200 ml) 1.00
67

3. Doodh Peda (a) 25 gms 0.15
(b) % kg 1.50
4. SMP 1 kg pack 2.00
½ kg pack 1.00
20 kg pack 40.00
25 kg pack 50.00
5. Ghee (loose) 1kg 4.00
½ kg 1.50
15 kg tin 30.00
6. Cooking butter 1 kg 2.00
7. Cow ghee ½ kg 1.00
8. Yellow ghee 15 kg tin 0.50
9. Tetra pack 500 gms 4.00
SALES TERMS OF QUANTITY AND REVENUE IN PRESENT
Product Quantity Amount
Table Butter 1326.30 kgs 1,00,948.60
White butter 433.50 kgs 33,856.35
Ghee 21,122,46 kgs 16,87,783.67
Skim Milk powder 21,577,05 kgs 15,22,701.55
68

Doodh peda 8,943,65 kgs 6,26,055.50
Shanthi Milk 2,09,361 kgs 6,28,083.00
Butter Milk 9,24,639 packets 13,86,283.50
GUNTUR DISTRICT MILK PRODUCERS MUTUALLY AIDED CO-
OPERATIVE UNION LTD.,
SANGAM DAIRY; VADLAMUDI
FINANCIAL POSITION
MARCH 2000 Rs. In lakhs
69
Fixed assets 1,827
Share capital 845
Reserves 118
Subsidy and contribution 449
Net worth 1,412
70

ORGANIZATION CHART
Board of directors
71
Manager (Plant)
Quality Control
Dairy Manager (Raw Milk & Processing)
Dairy Manager
Manager Sales
Personal & Labour Welfare Officer
Asst. Dairy Engineer
Asst. Quality Manager
Asst. Dairy Manager
Asst. Sales Manager
Junior Engineer
Milk Proc. Officer
Senior Veterinary Officer
Artificial Insemination Officer
Cattle feed Plant Manager
Electrical Civil Mechanical
Asst. Accounts Officer (Costing)
Asst. Accounts Officer (Costing)
Asst. Accounts Officer (Costing)

ORGANIZATION STRUCTURE OF MARKETING DEPARTMENT
General manager
Sales manger
Office Superintendent Assistant sales Manager
Senior Assistant Milk Distribution Supervision
Junior Assistant Sales Supervision
Plant Worker
72

MILK PROCUREMENT RATES / ITS (according to the rates)
Processing Milk :
Fat 1 Liter 2 Liters 5 Liters
6.0 – 6.2 20 40 100
6.3 – 6.5 23 46 115
6.6 – 6.8 24 48 120
6.9 – 7.1 25 50 125
7.2 – 7.4 26 52 130
7.5 – 7.7 27 54 135
7.8 – 8.0 28 56 140
8.1 – 8.3 29 58 145
8.4 – 8.6 30 60 150
8.7 – 8.9 31 62 155
9.0 – 9.2 32 64 160
9.6 – 9.8 33 66 165
9.9 – 10.0 34 68 170
73

Sales and Distribution :
For the purpose of distribution and sales of milk and produced by
74
General Manager
Sales Manager
Office Superintendent Assistant sales Manager
Senior Assistant Milk Distribution Supervision
Junior Assistant Sales Supervision
Plant Worker

PHYSICAL FLOW OF MILK IN SANGAM DAIRY
75
Producer
Village level co-operative societies
Procurement Transport
Sangam Dairy
Transport vehicles (Distribution)
Commission Agent
Consumer

Data analysis
76

Table – 1
Statement showing “Which Milk Would you use?”
Sr. No. Milk usage Percentage
1. Dairy milk packet 90
2. Milk vender 10
1 Dairy milk packet90%
2 Milk vender10%
Percentage
The above table depicts that 90% of the respondents are using dairy packet milk, Where as
10% of the respondents are using milk vender.
77

Table – 2
Statement showing “What are the rasons to purchase from milk vender ?”
Sr. No. Purchase From Milk
Vender
Percentage
1. Taste 62
2. Fresh 20
3. Credit Facilty 11
4. All 7
Figure - 2
1 Taste62%
2 Fresh20%
3 Credit Facilty11% 4 All
7%
Percentage
The above table depicts 62% of the respondents are using milk Vender Where as
Taste, 20% of the respondents are using this Fresh, 11% of the respondents are using
Credit Facility, 7% of the respondents are using Above All.
78

Table – 3
Statement showing “When would you purchase Sangam milk?”
Sr. No. Time of purchase Percentage
1. Morning 68
2. Evening 4
3. Both times 28
The above table depicts that 68% of the respondents are consuming in the morning,
where as 4 % of the respondents are consuming in the evening and 28% of the
respondents are consuming both times.
79
Table – 4
Statement showing “Which dairy milk packet would you use ?”
Sr. No. Dairy Packet Milk Percentage
1. Sangam 62
2. Thirumala 20
3. Reliance 4
4. Heritage 11
5. Others 3
The above table depicts 62% of the respondents are using sangam dairy milk, Where
as 20% of the respondents are using thirumala, 4% of the respondents are using
Reliance, 11% of the respondents are using Heritage, 3% of the respondents are using
Others.
Table – 5
80

Statement showing “What are the reasons to use Sangam Dairy milk?”
Sr. No. Sangam Dairy milk Percentage
1. Taste 20
2. Freshnes 45
3. Quality 35
Percentage
1 Taste2 Freshnes3 Quality
The above table depicts that 35% of the respondents are consuming Quality of
sangam milk daily, where as 45% of the respondents are consuming Freshnes of
sangam milk daily,20 % of the respondents are consuming Taste
Table – 6
81

Statement showing “From how much quanty of milk do you consume daily Sangam
Dairy milk?”
Sr. No. Quantity consumed Percentage
1. 200 ml 5
2. 500 ml 40
3. 1 – 2 lt 45
4. More than 2 it 10
Figure – 4
The above table depicts that 45% of the respondents are consuming 1-2lt of
sangam milk daily, where as 40% of the respondents are consuming 500 ml of
sangam milk daily,10 % of the respondents are consuming more than 2lt of sangam
milk daily, of 5% of the respondents are consuming 200ml.
Table – 7
82

Statement showing “From how many years you are purchasing Sangam Dairy milk?”
Sr. No. Usage Percentage
1. < 1 year 13
2. 1 – 2 years 27
3. 2 – 5 years 26
4. > 5 years 34
The above table depicts that 34% of the respondents are using sangam milk from
more than 5 years, where as 13% of the respondents are using from less than one
year, 27%of the respondents are using from 1-2 years, 26 % of the respondents are
using from 2-5 years.
83

Table – 8
Statement showing “Which variety of milk do you prefer more?”
Sr. No. Variety Percentage
1. Toned milk 70
2. Cream milk 30
The above table depicts that 70% of the respondents are consuming toned milk
where as 30 % of the respondents are using cream milk.
Table – 9
84

Statement showing “WHAT DO YOU KNOW SNGAM DAIRY OTHER PRODUCTS?”
Sr. No. Variety Percentage
1. Ghee 25
2. Flavored milk 33
3 Butter milk 22
4 Milk powder, butter 5
5 Basundi, Doodhpeda 10
6 Mineral water 5
1 Ghee 25%
2 Flavored milk33%
3 Butter milk22%
4 Milk powder, butter5%
5 Basundi, Doodhpeda10%
6 Mineral water5%
Percentage
The above table depicts that 33% of the respondents are using flavored milk from
more than 25% of the respondents are using the Ghee,22%of the respondents are
using butter milk.
Table – 10
85

Statement showing “Which brand Ghee would you use?”
Sr. No. Ghee Brands Percentage of users
1. Durga 35
2. Sangam 35
3. Madhura 18
4. Nandine 12
1 Durga35%
2 Sangam35%
3 Madhura18%
4 Nandine12%
Percentage of users
The above pie chart depicts that 35% of the respondents using Sangam Ghee,and
35% of the respondents for Durga Ghee, 18 %of the respondents for Madhura
Ghee,12% of the respondents for using Nandine Ghee.
Table – 11
Statement showing “What are the reasons to use of other brand Ghee?”
86

Sr. No. Resons Percentage of users
1. Good taste 32
2. Low cost 8
3. Both 4
73%
18%
9%
Percentage of users 1 Good taste 2 Low cost 3 Both
The above pie chart depicts that 73% of the respondents using milk for Good taste,
where as 18% of the respondents for Low cost, 9%of the respondents for Both.
Table – 12
Statement showing “Would you use Vijay Sangam Mineral Water?”
87

Sr. No. Reply Percentage of users
1. Yes 60
2. No 40
1 Yes60%
2 No40%
Percentage of users
The above pie chart depicts that 60% of the respondents using Vijay Sangam Mineral
Water, where as 40% of the respondents for using Vijay SangamMineral Water
Table – 13
Statement showing “How would you use Sangam Milk?”
88

Sr. No. Milk Products Percentage of users
1. Curd 32
2. Butter Milk 8
3. Ghee 4
4. Tea / Coffee 41
5. All 15
The above pie chart depicts that 32% of the respondents using milk for curd, where as
8% of the respondents for butter milk, 4 %of the respondents for ghee,41% of the
respondents for tea/coffee, 15 % of the respondents for all purpose.
Table – 14
Statement showing “What kind of problems would you face after purchasing milk?”
89

Sr. No. Problem Percentage of users
1. Spoilage 60
2. Leakage 33
3. Others 7
The above table depicts 60% of the respondents are facing spoilage problem, where as
33% of the respondents are facing Leakage problem, 7% of the respondents are facing
Other problems.
Table – 15
Statement showing “How frequent would you face these problems?”
90

28%
72%
Percentage of users 1 Frequently 2 Rarely
The above table depicts 72% of the respondents are facing the Frequently problems
and 28% of respondents are facing the Rarely problems.
Table – 16
Statement showing “What kind of problems would you face after purchasing milk?”
91
Sr. No. Face The Probelms Percentage of users
1. Frequently 28
2. Rarely 72

Sr. No. Timely supply Percentage of users
1. Excellent 40
2. Good 38
3. Average 12
4. Bad 10
The above table depicts 40% of the respondents are telling Excellent, Where as 38% of
the respondents are telling Good, 12% of the respondents are telling average, 10% of the
respondents are telling Bad.
1.
Table – 17
Statement showing “DO you purchase unbranded milk also?”
Sr. No. Purchase Percentage of users
92

1. Yes 15
2. No 85
15%
85%
Percentage of users 1 Yes 2 No
The above table depicts 85% of the respondents are purchasing branded milk, Where as
15% of the respondents are telling purchasing unbranded milk.
Table – 18
Statement showing “Why would you purchase unbranded milk?”
Sr. No. Reason Percentage of users
1. Taste 40
93
2. Fresh 28
3. Timely Supply 22
4. Quality 10
40%
28%
22%
10%
Percentage of users 1 Taste 2 Fresh 3 Timely Supply 4 Quality
The above table depicts 40% of the respondents are telling unbranded milk are testily
Where as 28% of the respondents are telling fresh, 22% of the respondents are telling timely
supply, 10% of the respondents are telling quality.
Table – 19
Statement showing “What kind of sangam advertisements do you come across
frequently?”
94

Sr. No. Advertisements Percentage of users
1. Wall painting 22
2. T.V Advertisements 42
3. Hording 25
4. Others 11
22%
42%
25%
11%
Percentage of users 1 Wall painting 2 T.V Advertisements3 Hording 4 Others
The above table depicts 42% of the respondents are T.V.advertisements, Where as
22% of the respondents are wall painting, 25% of the respondents are Hordings, 11%
of the respondents are others.
95

FINDINGS & suggestions
FINDINGS
96

The management of “The Guntur District Milk Producers Co-Operative Union
Ltd”. Has been workin sincerely and achieving the goals of the organization
successfully.
90% of the consumers are purchasing dairy packet milk daily.
62% of the respondents are using Sangam dairy milk more than 5 years.
34% of the Sangam Dairy consumers are purchasing milk from more than 5
years.
Most of the Sangam dairy consumers are consuming 1- 2 lt of milk that is 45%,
where as 40% of the consumers are consuming 500 ml daily.
Toned milk has the largest market share of the total quantity consumed daily
that is 70%; where as share of whole milk is 30%.
Out of the total respondents 68% of them are purchasing milk in the morning.
The major use of Sangam milk is for curd that is 32% of the respondents, where
as 15% of the respondents are using all purposes.
60% of the consumes are facing spoilage problems, where as 33% of the
consumers are facing leakage problem, 7% of the consumers are facing other
problems.
40% of the consumers are telling supply is excellent, where are 38% of the
consumers are telling good, 12% of the consumers are telling average, 10% of
the consumers are telling bad.
97

In the sangam dairy85% of the responds are purchasing branded milk and 15%
of the people using unbranded milk.
In the society using milk vender 62% the cause is taste, 20% of people Fresh,
11% of people credit fecility.
In the society common using unbranded milk 40% of people says taste, 28% of
the people fresh, 22% timely supply.
More than the people to known the sangam products T.V. ads, wall painting,
Hordings.
SUGGESTIONS :-
98

During survey it was found that some of the consumer are using un branded
milk also proper attention as to be paid towards them so as to make them use
Sangam milk only.
Advertising should be increased to upgrade the image of Sangam dairy in the
change environment where private dairy are coming up.
Spoiled milk should be replaced without dairying.
Sales promotion committee has to implement new market strategies to compete
with competitors and to explained the market.
99

APPENDIXQUESTIONNAIREBIBLIOGRAPHY
A STUDY ON CONSUMER SATISFACTION TOWARDS THE
MILK OF SANGAM DAIRY
100

SURVEY QUESTIONNAIRE
1. Which milk would you use ?
a) Dairy packet milk b) Milk vender
2. What are the reasons to purchase from milk vender ?
a) Taste b) Fresh
c) Credit facility d) All
3. When do you purchase of milk?
a) Morning b) Evening c) Both times
4. Which dairy milk packet would you use ?
a) Sangam b) Thirumala
c) Reliance d) Heritage e) Others
5. What are the reasons to use of Sangam dairy milk?
a) Taste b) Freshness c) Quality
6. How much quantity of milk do you consume daily?
a) 200 ml b) 500 ml c) 1 – 2lt
d) More than 2 lt
7. From how many years you are purchasing Sangam dairy milk?
a) 0- 1 years b) 1 – 2 years c) 2 – 5 years
d) More than 5 years
101
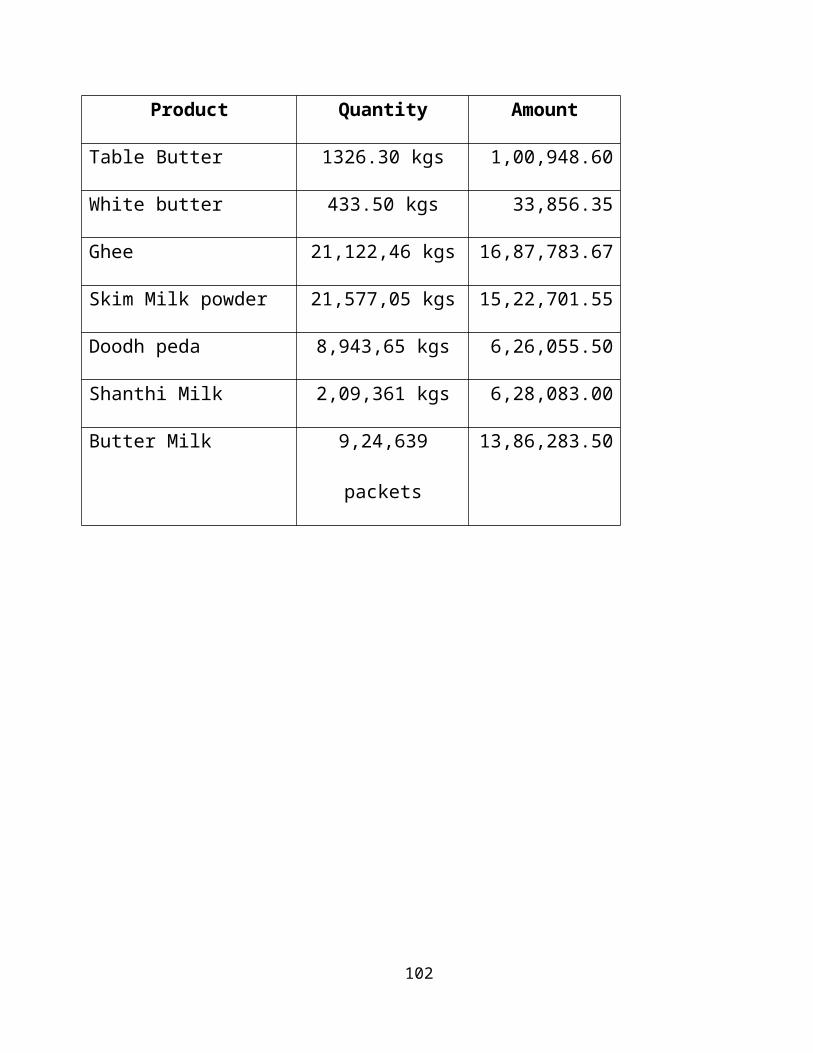
8. Which type of milk do you prefer more ?
a) Toned milk b) Whole milk
9. What do you know Sangam dairy other products ?
a) Ghee b) Flavored milk c) Butter milk and curd
d) Milk powder, Butter e)Basundhi, Doodhpeda f) Mineral water
g) All
10.Which brand ghee would you use ?
a) Durga b) Sangam c) Madhura
d) Nandini
11.What are the reasons to use of other brands ghee?
a) Good taste b) Low cost c) Both
12. Would you use Vijaya Sangam mineral water?
a) Yes b) No
13. How would you use of Sangam Dairy milk?
a) Curd b) Butter milk c) Ghee d) Tea / Coffee
e) All
14. What kind of problems would you face after purchasing milk?
a) Spoilage b) Leakage c) Others
102

15. How frequent would you face these problems ?
a) Frequently b) Rarely
16. How is the timely supply of milk ?
a) Excellent b) Good c) Average
d) Bad
17. Do you purchase unbranded milk also?
a) Yes b) No
18. Why would you purchase unbranded milk?
a) Taste b) Fresh c) Timely supply
d) Quality e) All
19. What kind of Sangam advertisements do you come across frequently?
a) Wall painting b) T.V. Advertisements c) Hordings
b) Others
20.Findings and Suggestions ………………………..
BIBLIOGRAPHY
103

1. Marketing Management – Philip Kotler – 9th edition – Prentice hall.
2. Marketing Research – Harper W.Boyal, Jr. West hall, Stanly F- Stach – 7th
edition – AITBS
Websites:-
www.sangam dairy.com
www.google.com
www.yahoo.com
Journels:-
The Hindu
Deccan chronical
Indian Times
104