sandwich composite, syntactic foam core ... a debris hazard and adds weight without contributing...
TRANSCRIPT
SANDWICH COMPOSITE, SYNTACTIC FOAM CORE BASED,APPLICATION FOR SPACE STRUCTURES
Andrew J. Hodge, Dr. Raj K. Kaul, William M. McMahon
ED34 NASA/Marshall Space Flight CenterHuntsville, AL 35812
Dr. Thomas Reinarts
United Space Alliance MS USK-841
Cape Canaveral, FL 32920-4304
ABSTRACT
The current Solid Rocket Booster (SRB) launch vehicle has several metal based
components that require a Thermal Protective System (TPS) be applied to the exterior
surface to ensure its structural integrity and to protect the interior hardware from
aerodynamic heating. TPS materials have distinct disadvantages associated with their
use. One disadvantage to the application of TPS is that it can act as a debris source to the
Space Shuttle Orbiter during flight and it also adds weight to the system without directly
contributing any structural strength. One of the specific areas examined under this
program was to replace a metal/TPS system with polymer based composites. A polymer
matrix based sandwich composite was developed which had both structural and insulative
properties to meet the high aerodynamic structural and heating load survival
requirements. The SRB Nose Cap was selected as a candidate for this application. The
sandwich system being qualified for this application is a carbon/epoxy outer and inner
skin with a high strength-low thermal conductivity syntactic foam core.
KEY WORDS: Composites, High Temperature Mechanical Testing, Aerothermal Testing
1. INTRODUCTION
The current Space Shuttle Solid Rocket Booster (SRB) Nose Cap is a non-recovered,
Thermal Protection System (TPS) coated, metallic structure. United Technologies USBI
and Marshall Space Flight Center (MSFC) initiated a Shuttle Upgrades Project to develop
a composite nose cap as a replacement article for the SRB. Composite materials offer a
strength-to-weight advantage over metallic structures. Additionally, the TPS, which can
* "l'his paper is decl_'ed a ,.ua"kcfthe US Covernrrent and isnct Subject to copyright prct trctioninthcUnited St at es
https://ntrs.nasa.gov/search.jsp?R=20000033857 2018-06-04T08:02:57+00:00Z

be a debris hazard and adds weight without contributing strength, can be eliminated
because of the thermal capabilities of a composite sandwich structure.
The CNC design is composed of a sandwich construction. Two facesheets of Hexcel's
AGP370-8H/3501-6 (AS4/3501-6) graphite/epoxy encapsulate a core of 3M SC350G
syntactic foam. An aluminum mesh covers the outer skin for lightning protection. A
significant amount of mechanical and thermal property testing was performed on the
material used in the SRB Composite Nose Cap (CNC). The testing performed was based
on requirements set by the MSFC Materials, Processes, and Manufacturing Department,and the Structures, Mechanics, and Thermal Department, and USBI. The testing
performed at MSFC provided A-basis allowables for stress analyses. Thermal testing
provided accurate properties for modeling and aerothermal test verification.
2. MECHANICAL PROPERTY TESTING
Mechanical testing was performed on three lots of AS4/3501-6 and SC350G for material
characterization. Allowables were generated from the test results per the Material
Characterization Test Plan'. Testing was performed on the graphite/epoxy lamina, bare
core, and the complete sandwich. The lamina level test specimens were moisture
conditioned to simulate potential moisture absorption due to environmental exposure at
Kennedy Space Center. Heating ramp rates were also controlled to better simulate the
heating rate of the SRB CNC during ascent. The sandwich test specimens were tested
with more gradual heating rates and longer hold times to insure thermal equilibrium.
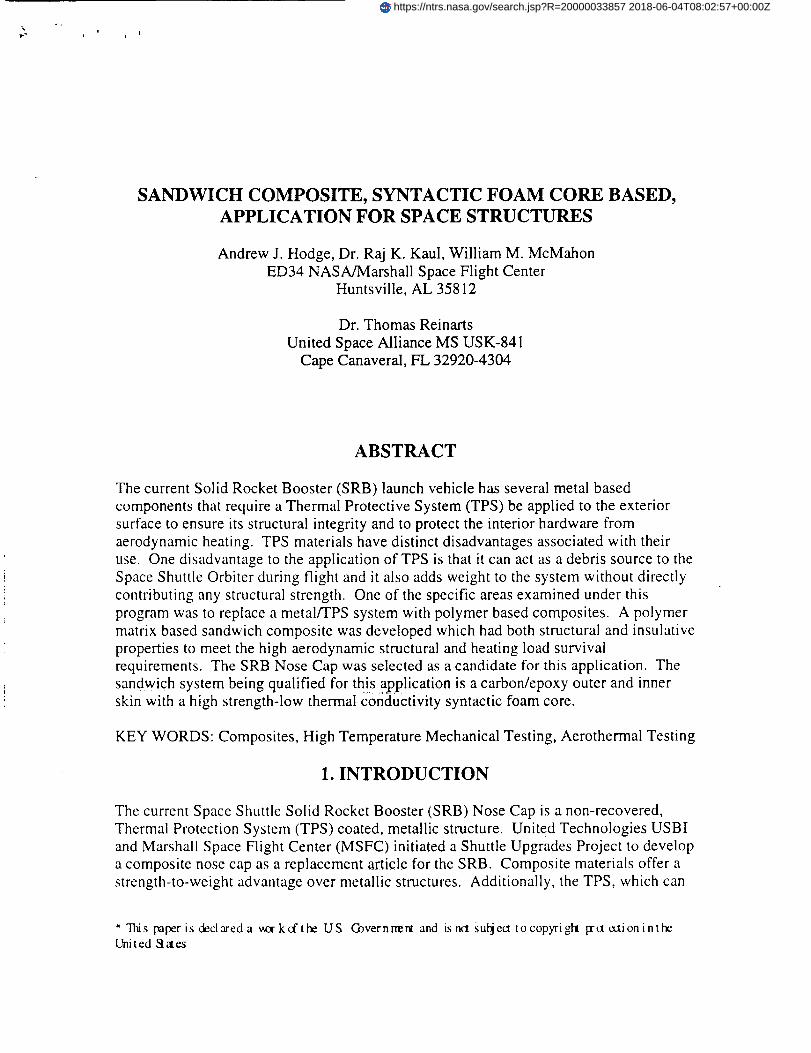
2.1 Test Specimen Conditioning Hypalon is currently qualified for use as a moisture
barrier on SRB insulation. Hypalon was initially to be used as a moisture barrier on the
SRB CNC. As a verification of the effectiveness of Hypalon as a moisture barrier, a
series of moisture conditioning tests were performed on the AS4/3501-6 material. The
test series moisture conditioned three sets of samples: coated graphite/epoxy, bare
graphite/epoxy, and Hypalon film. The specimens were conditioned at 71°C (160 ° F)and
93% RH. Using the rule of mixtures the weight gain of the Hypalon film was subtracted
from the weight gain of the Hypalon coated specimens. This yielded the estimated
weight gain of the composite underneath the Hypalon. The bare and coated composite
specimens exhibited similar weight gains (Figure 1). Thus, Hypalon was determined to
be ineffective as a moisture barrier on low absorptivity materials such as graphite/epoxy.
Due to the ineffectiveness of Hypalon as a moisture barrier, material properties were
developed in the "wet" state. MIL-HDBK-17 and ASTM D 5229 recommend that a
specimen be moisture conditioned to an equilibrium state before it is considered
"saturated". Equilibrium is defined by the above standards as a change in weight less
than 0.01% in a 7 day period (24 hours if diffusivity is known). There are no standard
moisture conditioning methods. Data generated on 3501-6 in the MIL-HDBK-17 was
conditioned for 30 days at 60 ° C(140° F)95% RH. Hercules generated wet properties on
AS4/3501-6 by boiling in water for 24 hours. Fiberite immersed AS4/934 in 74 ° C
( 165 ° F) water for 7 days. Based on the data generated on the nose cap material, none of
these methods provided sufficient time to reach equilibrium.

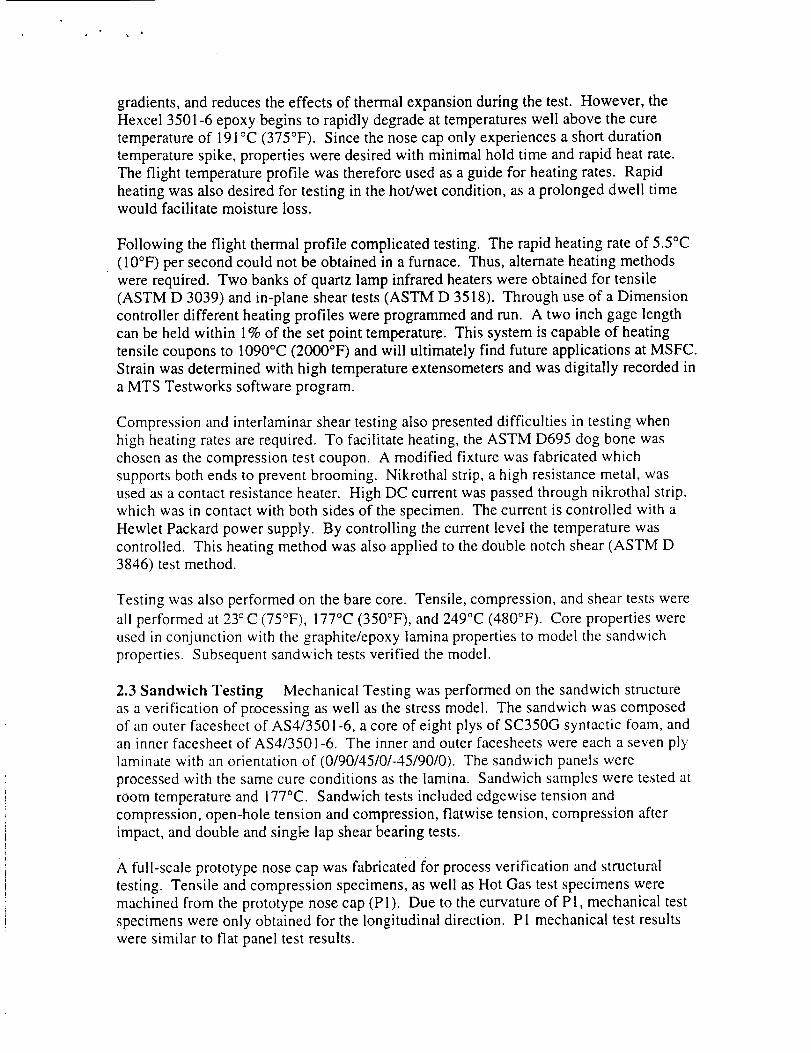
In additionto weightgain,theglasstransitiontemperatureof themoisturizedspecimenswasalsoevaluated.Unconditioned"ambient"sampleshadTg valuesof 197° C (386° F)
and 193°C (380 ° F) obtained from DMA and DSC thermal analysis equipment.
Specimens were conditioned at 49 ° C (120 ° F), 71 ° C (160 ° F), and 82 ° C (180 ° F) at 93%
RH. The Tg and weight gains of the specimens were evaluated at regular intervals.
Conditioning at 82° C indicated a substantial drop in Tg during the first week of
conditioning. The Tg began to plateau after the second week of conditioning (Figure 2).
The Tg versus percent weight gain is plotted in Figure 3.
The absorption of water into a graphite/epoxy material follows Fick's second law. The
moisture equilibrium content is primarily dependent on percent relative humidity. A
change in temperature increases the diffusivity of the material, but has little effect on the
equilibrium. 2 Thus, an increase in temperature at constant humidity level only decreases
the time required to reach equilibrium. The diffusivity was calculated at both 49 ° C and
71 ° C for 93% RH. Using the Arhenius relationship diffusivity was estimated for 82 ° C
(I 80° F) and 29 ° C (85 ° F). Now moisture gain due to six months exposure at 29 ° C and
93% RH (simulated beach exposure) could be estimated. The corresponding time
required at 82 ° C to reach the same moisture level was approximated (Figure 4).
Assuming two sided diffusion on a 7 ply laminate, six month exposure at 29 ° C 93% RH
yields a 0.7% weight gain. One-sided absorption yields 0.3% weight gain. To obtain a
0.7% weight gain at 82" C a six-ply laminate requires 5 days. Eight and t_n ply laminates
require conditioning for 9 and 14 days respectively. A ten day soak should result in
moisture levels of 0.9%, 0.75%, and 0.6% weight gain for 6, 8, and 10 ply laminates
respectively. This is above the expected moisture gain in a seven-ply laminate on the
beach when exposed to one-sided absorption. Thus, a 10-day soak of the test specimens
at 8-'2° C ( 180 ° F) 93% RH should conservatively represent a six-month beach exposure.
Subsequent conditioning at 82 ° C93% RH indicated the estimated weight gains were
reasonably accurate.
2.2 Lamina Level Testing Four lamina level tests were identified to establish the
mechanical properties of the SRB CNC. Tensile tests determined the ultimate tensile
stress, modulus, and Poisson's ratio. In-plane shear tests determined the in-plane shear
stress and shear modulus. Compression tests determined the compressive stress andmodulus. While, double notch shear tests determined interlaminar shear stress.
Properties were obtained at 23 ° C(75°F), 116°C (240°F), 177°C (350°F), 249°C (480°F),
and 316°C (600°F). Residual properties at 177°C were also obtained after a 316°C cycle.
The 316°C properties are representative of the maximum temperature the outer skin of
the nose cap will experience during flight. The 177°C properties (post 316°C cycle) are
representative of the maximum load case of the nose cap during ejection and parachute
deployment. These lamina mechanical properties will be used in the stress model of the
sandwich structure. Additional tests were performed on sandwich samples as averification of the model.
Elevated temperature testing on graphite/epoxy materials is typically performed with a
moderate heating rate and a minimum hold of five minutes once the test specimen
reaches test temperature. This hold verifies temperature equilibrium, reduces thermal
gradients,andreducestheeffectsof thermalexpansionduring thetest. However,theHexcel3501-6epoxybeginsto rapidlydegradeat temperatureswell abovethecuretemperatureof 191°C(375°F). Sincethenosecaponly experiencesashortdurationtemperaturespike,propertiesweredesiredwith minimalhold time andrapidheatrate.Theflight temperatureprofile wasthereforeusedasa guidefor heatingrates. Rapidheatingwasalsodesiredfor testingin thehot/wetcondition,asaprolongeddwell timewould facilitate moistureloss.
Following theflight thermalprofile complicatedtesting. The rapidheatingrateof 5.5°C(10°F)persecondcouldnotbeobtainedin afurnace.Thus,alternateheatingmethodswererequired. Two banksof quartzlampinfraredheaterswereobtainedfor tensile(ASTM D 3039)andin-planesheartests(ASTM D 3518). Throughuseof aDimensioncontrollerdifferentheatingprofiles wereprogrammedandrun. A two inch gagelengthcanbeheldwithin 1%of the setpoint temperature.This systemiscapableof heatingtensilecouponsto 1090°C(2000°F)andwill ultimately find futureapplicationsatMSFC.Strainwasdeterminedwith high temperatureextensometersandwasdigitally recordedinaMTS Testworkssoftwareprogram.
Compressionandinterlaminarsheartestingalsopresenteddifficulties in testingwhenhighheatingratesarerequired.To facilitateheating,theASTM D695dog bonewaschosenasthecompressiontestcoupon. A modified fixture wasfabricatedwhichsupportsbothendsto preventbrooming. Nikrothal strip,a high resistancemetal,wasusedasacontactresistanceheater. High DC currentwaspassedthroughnikrothal strip.whichwasin contactwith both sidesof thespecimen.Thecurrentis controlledwith aHewletPackardpowersupply. By controlling thecurrentlevel thetemperaturewascontrolled. This heatingmethodwasalsoappliedto thedoublenotchshear(ASTM D3846)testmethod.
Testingwasalsoperformedon thebarecore. Tensile,compression,andsheartestswereall performedat 23°C (75°F), 177°C(350°F),and249°C(480°F). Corepropertieswereusedin conjunctionwith thegraphite/epoxylaminapropertiesto modelthesandwichproperties.Subsequentsandwichtestsverified themodel.
2.3Sandwich Testing MechanicalTestingwasperformedon thesandwichstructureasa verificationof processingaswell asthestressmodel. The sandwichwascomposedof anouterfacesheetof AS4/350!-6, a coreof eightplysof SC350Gsyntacticfoam,andan inner facesheetof AS4/3501-6. Theinnerandouterfacesheetswereeachasevenplylaminatewith anorientationof (0/90/45/0#45/90/0).Thesandwichpanelswereprocessedwith thesamecureconditionsasthelamina. Sandwichsamplesweretestedatroomtemperatureand 177°C. Sandwichtestsincludededgewisetensionandcompression,open-holetensionandcompression,flatwisetension,compressionafterimpact,anddoubleandsinglelap shearbearingtests.
A full-scaleprototypenosecapwasfabricatedfor processverification andstructuraltesting. Tensileandcompressionspecimens,aswell asHot Gastestspecimensweremachinedfrom theprototypenosecap(PI). Due to thecurvatureof Pl, mechanicaltestspecimenswereonly obtainedfor the longitudinaldirection. P1 mechanicaltestresultsweresimilar to flat paneltestresults.

3. THERMAL CHARACTERIZATION
The thermal characterization of the materials used in the sandwich is subdivided into
three interrelated categories: thermal property testing, aerothermal testing, and
computational modeling. The measured properties are used in the modeling. Theaerothermal testing simulates design loads and evaluates the resilience of the sandwich
panels under these loads. Three of the aerothermal panels used interstitial thermocouples
and an IR measured surface temperature to calibrate the computational model.
3.1 Thermal Property Testing Thermal conductivity, specific heat, and density were
measured for the graphite/epoxy, the syntactic core, pure epoxy, and the sandwich
configuration. Emissivity and absorptivity were measured for the sandwich configuration
only. The conductivity was measured by comparative rod analysis (per ASTM E 1225).
The specific heat was measured by adiabatic calorimetry. And the density was measured
by the gravimetric method 3. These data were taken for three lots of materials, with two
samples per lot. Specific heats were measured over a range of -18 ° C (0 ° F)to 260°C
(500 ° F), thermal conductivities from - 18 ° C (0 ° F) to 371 ° C (700 ° F), and densities at
ambient temperatures. Emissivity was measured per ASTM E 408, Method A, and the
absorptance per ASTM E 903-96. Radiation property data were measured for each panel
prior to aerothermal testing, and were taken at ambient temperature. All thermal property
data are summarized in Figures 5 and 6.
3.2 Thermal Modeling The model includes six layers, as shown in Figure 7. The
outermost layer is pure epoxy. Moving inward, the next layer is a pure epoxy-aluminum
mesh combination, followed by seven plies of graphite/epoxy, eight layers of syntactic
core, another seven plies of graphite-epoxy, and a thin layer of pure epoxy. Although
paint on the outer surface is in the design, it was not included in thermal modeling.
Model calibration was performed on a l-D transient computational thermal model. The
time-dependent measured IR surface temperature from a calibration panel was imposed
as a thermal boundary condition on the I-D model. In addition, backside radiant and
convective cooling are taken into account.
The interstitial thermocouples on the calibration panels are located in the following
locations: ( I ) underneath the outermost graphite/epoxy ply, (2) at the interface of the
outer graphite-epoxy laminate and the syntactic core, (3) at the center of the core, (4) at
the interface of the core and the inner graphite-epoxy laminate, and (5) just inside of the
outermost graphite-epoxy ply. These locations are also shown in Figure 7. The exact
locations of each thermocouple, as well as layer thicknesses, were determined via an
analysis of X-rays of the panel at various through-thickness locations. Examples of the
comparison of measured with predicted temperatures are given in Figure 8. The
agreement is generally with _+ 11 ° C (20 ° F), indicating a successful calibration. The
modeling techniques were then extended into a 3-D model of the nose cap, including the
pilot and drogue parachutes.
3.3 Aerothermal Testing Aerothermal testing, apart from the calibration testing
previously mentioned, can be separated into the following categories: delamination and

generalresponse,paintcoatingcompatibility,capabilitytests,combinedenvironments,beachexposure,andcurvedpaneltesting. Thedelaminationandgeneralresponsetestingis self-explanatory,andusedunpaintedpanels.Capabilitytestswererununtil extensivedelaminationoccurred.Paint compatibilitytestsexaminedtheadherenceof thepainttothepanels.Combinedenvironmentpanelswereexposedto asimulatedlightning strikebeforeaerothermaltesting. This testingincludedbothpaintedandunpaintedpanels.Beachexposurepanelswereplacedat thebeachat KennedySpaceCenterfor six months.ControlpanelsweremaintainedatMarshallSpaceFlight Centerfor six months. Thistestingincludedbothpaintedandunpaintedpanels.All of thesepanelswereflat 30.48cm x 48.26cm (12"x19") panels. Curvedpanelswerecutsof thesphericalshellshapeofthebeanieor theconicalshellshapeof the lowerpartof thenosecap,with ashadowof30.48cm x 48.26cm. Thesepanelsweretestedbare. In general,theenvironmentusedwasasimulationof thedesignflight environment(thestagnationpoint),withmodificationsdependingon theneedsof thetest. Panelsweretestedwetanddry, andthreelotsof materialswereused.
4. TEST RESULTS
All of the lamina level tests were performed within 8 hours of conditioning at 82°C
(180°F) 93% RH. The samples were weighed prior to testing to verify adequate weight
gains due to moisture absorption. The samples were heated as discussed above and load
was applied as the sample reached the desired temperature. The moisture had little effect
on the samples tested at room temperature. However, the shear and compression samples
tested at elevated temperatures demonstrated a reduction in stress. The samples that
followed the flight thermal profile (heated to 316°C and cooled to 177°C) demonstrated
an increase in strength compared to samples tested at 177°C. This increase in strength
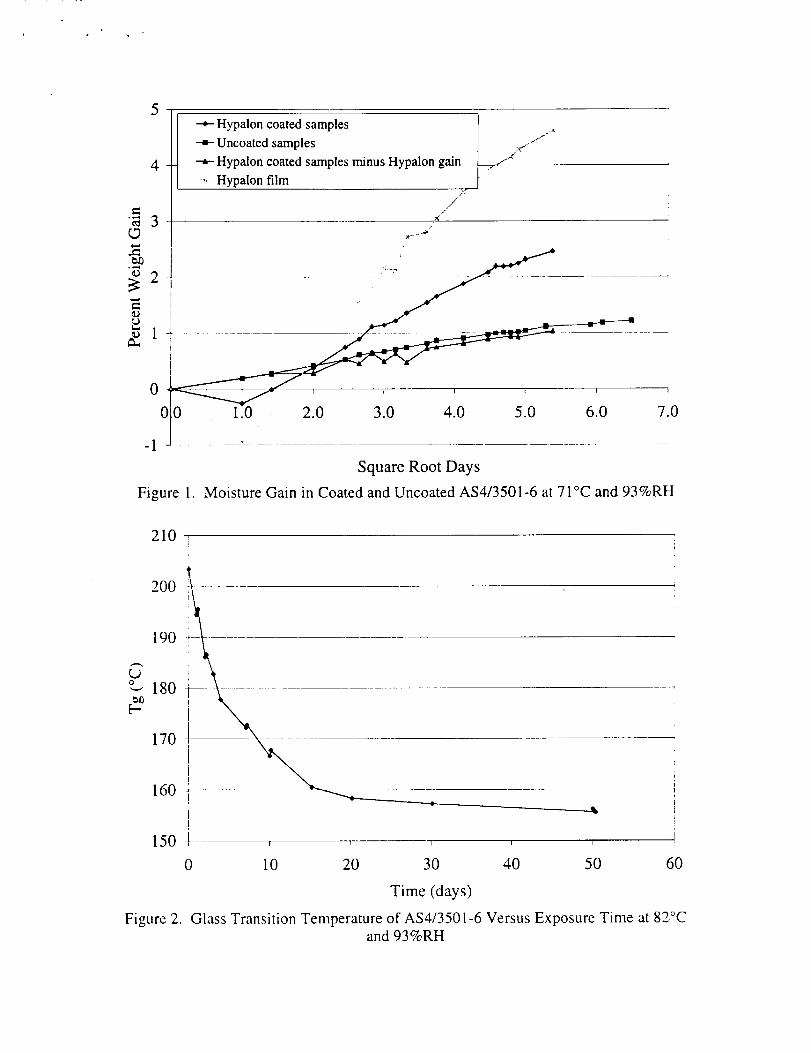
was attributed to moisture loss in the specimen during the brief temperature spike. Table
1 summarizes the test results. The flight profile samples are represented with an asterisk
( 177°C *).
Core material and sandwich samples were not moisture conditioned. The sandwich tests
were performed to verify modeling and fabrication and not used to develop allowables.
Sandwich tests performed on flat panels and the prototype nose cap correlated well. As
expected edgewise compression strength demonstrated a large decrease in strength at
177°C. Compression tests performed on material after aerothermal testing and after
beach exposure exhibited the same strength as the control panels. Compression after
impact was performed after impacts of 0, 14, 27, and 41 Joules (0, 10, 20, 30 ft-lbs). The
residual compressive strength appears to plateau after 27 J of impact energy. The coreand sandwich test results are also available in Table 1.
All of the aerothermal panels passed the acceptance criteria, except the bare beach
exposure and associated control panels. These panels delaminated on the outermost ply
prematurely for lots 1 and 3. The beach exposure and control panels tested the same for
all three lots, indicating that the cause of the failures was either material or process
related and not due to the beach exposure. The cause of the premature delamination has
not been identified at this point.

Aerothermaltestingwith thermocouplesincorporatedwithin thetestspecimenwassuccessfullydemonstrated.Therewasgoodagreementbetweenthemeasuredandpredictedtemperatureson theaerothermalcalibrationpanels(Figure8). Thethermalmodelcalibrationwassuccessful,andthemajorityof theaerothermaltestingwassuccessful,lendingto thefeasibility of thedesign.
5. CONCLUSIONS
Material characterization for the composite nose cap was successfully completed.
Advances in test capabilities were made at MSFC. Aerothermal tests were successfully
performed with embedded thermocouples. These tests showed that the AS4/3501-6
material could meet the design requirements after brief exposure to high temperature.
Mechanical property tests were performed following the temperature-time profile of the
nose cap. The diffusivity of the AS4/3501-6 was determined so moisture gain at a given
temperature and humidity could accurately be predicted. A conservative moisture
conditioning procedure was performed so that the test specimens were adequately "wet".
By following the temperature-time profile of the nose cap more representative test data
were obtained. Upon completion of the test program, A-basis allowables were generated
for stress modeling. Subsequent laminate level tests on the sandwich material providedadditional data for model verification.
6. References
1. Composite Nose Cap Material Characterization Test Plan, 10PLN-0140, MSFC-PEC
Operations, June 1999.
2. MIL-HDBK-17-1E Chapter 6.3
3. T.R. Barnett and H.S. Starrett, Thermal Conductivity, Specific Heat, and Density
Evaluation of the Composite Nose Cap Materials, Report SRI-ENG-99-039-9655-I-F,
Southern Research Institute, Birmingham, Alabama, October 1999.
--*-Hypalon coated samples _'|/-'/'r_ ..
Uncoated samples "/
4 --.-Hypalon coated samples minus Hypalon gain
.... Hypalon film
...i
- i ' I"- I t I t
7.0
Square Root Days
Figure 1. Moisture Gain in Coated and Uncoated AS4/3501-6 at 71°C and 93%RH
210 i
2O0
190
O180
170
160 *
150 4- , , , ,
Figure 2.
0 10 20 30 40 50 60
Time (days)
Glass Transition Temperature of AS4/3501-6 Versus Exposure Time at 82°Cand 93%RH

210
L_0
[-.
20O
190
180
170
160
150
0
Figure 3.
1.6-
0.2 0.4 0.6 0.8 1 1.2 1.4
Percent Weight Gain
Glass Transition Temperature Versus Percent Weight Gain of AS4/3501-6
0
Figure 4.
...... ..............
J
---a=- Boiling water
160F 93%
+ 120F 93%
...... M(180,t) 6 ply
...... M(180,t) 8 ply _"_"
..... M(180.tJ I0 ply
-- M(85,t) 7 ply 2-sided absorption
-- M(85,t) 7 ply l-sided absorption
2 4 6 8 10 12 14 16
Square Root Days
Moisture Absorption of AS4/3601-6 at 93% RH and Various Temperatures

2.5
,-, 2
1.5
0.5
0
Epoxy
Epoxy/aluminum mesh
Core
Sandwich
-5O 0 50 100 150 200 250 300
Temperature (C)
Specific Heat of CNC Component MaterialsFigure 5.
0.08
Figure 6.
-50 50 150 250 350 450
Temperature (C)
Thermal Conductivity of CNC Component Materials.
Graphite/Epoxy [--_ Core
-_- Epoxy
Epoxy/aluminum mesh '
Sandwich i

Epoxy/aluminum Epoxy
E
• Thermocouple locations
Figure 7. Thermocouple locations on Aerothermal Calibration Panel
40O
350
300
_ 250v8)
200m
t,
_ 150I,-
1 oo
5o
IR Measu rem ent of Surface Temperature_Calculated Temperature at Location of Outermost Thermocouple_Outermost Interstitial Thermocouple Measurements
_Calculated Backside Surface Tern perature-- Measured Backside Surface Tern peratu re
o 50 1C_ 150 200 250 300 350
Time (s)
400
Figure 8. Measured and Predicted Temperatures on AerothermaI Calibration Panel
• °
Lamina Level Tests (AS4/3501-6)Orientatior
WarpFill
WarpFill
45
45
Propert 7Tensile Stress (MPa)
Tensile Stress (MPa)
Tensile Modulus (GPa)
Tensile Modulus (GPa)
In-Plane Shear (MPa)
Shear Modulus (MPa)
Warp Poisson's ratioFill Poisson's ratio
* Flight ProfileLamina Level Tests (AS4/3501-6)Orientation
WarpFill
WarpFill
Warp
PropertyCompr. Stress (MPa)
Compr. Stress (MPa)
Compr. Modulus (GPa)
Compr. Modulus (GPa)Interlaminar Shear (MPa)
Core Tests (SC350G)Orientation
X
X
Z
ZX
PropertyTensile Stress (MPa)
Tensile Modulus (MPa)
Flatwise Compr. (MPa)Shear Punch (MPa)
Sandwich Tensile Tests
Orientation Propert,y0 Tensile Load (kN/m)
45 Tensile Load (kN'/m)
z Flatwise Tension (MPa)
0 Open-Hole (NASA 1092) (kN/m)
i • °
iSandwlch Compression Tests
Ortentation ............ Property
0 Compr. Load (kN/m)
45 Comp.r. Load (kN/m)0 Post IHGF Comp (kN/m)
0 Post beach Comp (kN/m)
0 Open-Hole (0.25" hole) (kN/m)
Double La ? Shear (Bearing)
Orientation Property'0 Ultimate Bearing (kN)
45 Ultimate Bearing (kN)
Compression after Impact
Orientation Property0 Load (kN) 0 J
0 Load (kN) 14 J
0 Load (kN) 27 J
0 Load (kN) 41 J
75°F 240°F
Average I Average769.2 762.4
721.2 709.0
67.6 59.1
66.6 54.3
91.7 53.8
5037 3223
0.06
0.07
350°F * 550°F 350°F 480°F
Average Average Average Average647.7 516.0 693.0 514.6
552.8 395.2 582.1 494.4
49.7 34.7 50.8 37.9
43.7 29.4 49.6 45.7
21.7 5.5 12.2 6.4
780 331 425 304
75°F 240°F 350°F * 600°F
Average Average Average Average571.3 268.5 156.1 28.7
567.3 281.9 156.8 29.7
59.7 53.9 36.2 12.1
60.3 55.2 31.5 12.6
48.5 27.6 11.0 1.3
75 °F 350°F 480°F
Average Average Average25 17 8
3 2 1
68 41 13
31 20 5
Prototype 175°F 350°F 75°F 350°F
Average Average Average Average2995 2696 2901 1925
2004 1639
14.9 6.2
3789 3894
75°F 350°F
Average Average2970 1820
2603 1484
2597 1679
2966 1576
1858 1168
75°F 350°F
Average Average29.0 16.1
28.6 15.6
75°F 350°F
Average Average305 142185 129
147 105
143 II0
Prototype 175°F 350°F
Average Average
. 2656 1827
480°F
Average9.3
9.3
350°F 480°F
Average Average86.3 35.6
80.1 39.4
44.6 20.9
42.0 19.7
6.6 2.3
Table 1. Mechanical Property Test Results