sandag regional electric vehicle charging program · level 2 dcfc opportunity: california ev...
TRANSCRIPT

Transportation Committee Item 6 | May 17, 2019 1
SANDAG Regional Electric Vehicle Charging Program
Transportation Committee Item 6 | May 17, 2019
2
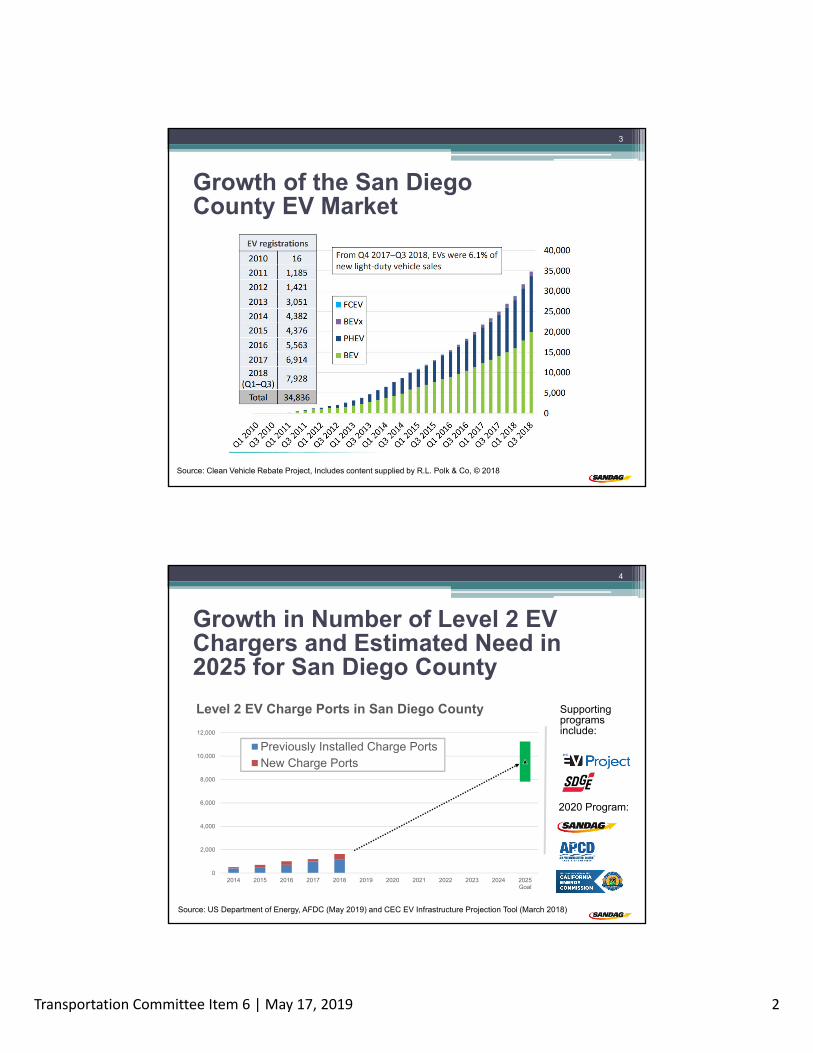
The Challenge: Regional EV adoption is outpacing infrastructure investment. The San Diego region has a 2025 projected gap of thousands of public chargers.
Transportation Committee Item 6 | May 17, 2019 2
Growth of the San Diego County EV Market
Source: Clean Vehicle Rebate Project, Includes content supplied by R.L. Polk & Co, © 2018
3
4
0
2,000
4,000
6,000
8,000
10,000
12,000
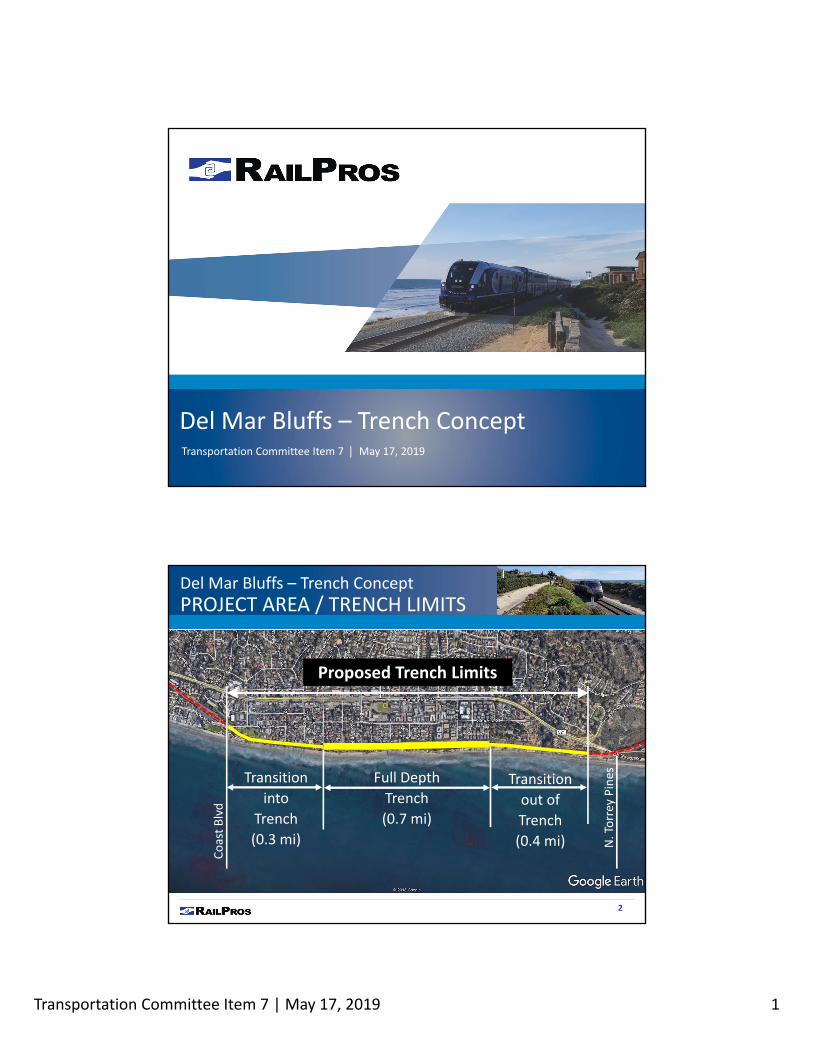
2014 2015 2016 2017 2018 2019 2020 2021 2022 2023 2024 2025Goal
Level 2 EV Charge Ports in San Diego County
Previously Installed Charge PortsNew Charge Ports
Source: US Department of Energy, AFDC (May 2019) and CEC EV Infrastructure Projection Tool (March 2018)
Growth in Number of Level 2 EV Chargers and Estimated Need in 2025 for San Diego County
Supporting programs include:
2020 Program:

Transportation Committee Item 6 | May 17, 2019 3
Growth in Number of DC Fast Chargers and Estimated Need in 2025 for San Diego County
5
Source: US Department of Energy, AFDC (May 2019) and CEC EV Infrastructure Projection Tool (March 2018)
2020 Program:
Supporting programs include:
0
500
1,000
1,500
2,000
2,500
3,000
2014 2015 2016 2017 2018 2019 2020 2021 2022 2023 2024 2025Goal
DCFC EV Charge Ports in San Diego County
Previously Installed Charge PortsNew Charge Ports
SANDAG Charging Program
2015 Regional Plan Actions
• Establish incentive program for EV chargers• Commit $30 million from 2020-2050• Support future Regional Plan development• Reduce GHG emissions from passenger vehicles
Caltrans SB1 Planning Grant
• $600,000 grant over 2018-2020• Phase 1 – best practices and program
coordination (2018)• Phase 2 – design program framework (2019)• Phase 3 – program build out (2019-2020)
6
sandag.org/EVChargingProgram

Transportation Committee Item 6 | May 17, 2019 4
Source: Plugshare (May 2019)
Public Chargers in the Region
7
Level 2DCFC
Opportunity: CaliforniaEV Infrastructure Project
• CALeVIP is a mechanism to provide targeted EV charging infrastructure incentives in California▫ Regional EV infrastructure investment▫ Expert program implementation and administration at
a reduced cost▫ Projects are designed to be responsive to regional and
customer needs▫ Assures full implementation and reporting through
online application and tools
8

Transportation Committee Item 6 | May 17, 2019 5
9
Estimated Partner Budgets and Scope
• Implement 2015 Regional Plan and SCS• Level 2 Chargers• Budget est. $1 million/year
until 2050
• Implement County Climate Action Plan • Level 2 Chargers• Budget est. $500,000/year
up until 2030
• Implement Executive Order B-48-18 targets for EV chargers• Level 2 and DC Fast Chargers• Budget est. ranges from $10-23 million total allocation
Next Steps
• Board consideration May 24
• CEC selections this summer
• Seek additional partnership opportunities with SDG&E, Electrify America, EVgo and other charging providers
• Return at the end of 2019 with updates and/or partner agreements
10

Transportation Committee Item 6 | May 17, 2019 6
Recommendation
The Transportation Committee is asked torecommend that the Board of Directors adoptResolution No. 2019-17, establishing theframework and agreement for a joint electricvehicle charging incentive program with theCalifornia Energy Commission, County AirPollution Control District, and Center forSustainable Energy.
11
Transportation Committee Item 7 | May 17, 2019 1
Del Mar Bluffs – Trench ConceptTransportation Committee Item 7 | May 17, 2019
Del Mar Bluffs – Trench Concept
PROJECT AREA / TRENCH LIMITS
Coast Blvd
N.Torrey PinesTransition
into
Trench
(0.3 mi)
Transition
out of
Trench
(0.4 mi)
Full Depth
Trench
(0.7 mi)
Proposed Trench Limits
2

Transportation Committee Item 7 | May 17, 2019 2
3
Del Mar Bluffs – Trench Concept
TYPICAL SECTION
(Beach)
Toe protection
Bluff revegetation
Trench Section
Width = 55’
Depth = 26’ (max)Protective railing
4
Del Mar Bluffs – Trench Concept
BLUFF PROTECTION & WALK PATH
(Beach)
Bluff revegetation
Recreational Path
Drain outlet
Drop Inlet
Drain ditch
intercept

Transportation Committee Item 7 | May 17, 2019 3
Del Mar Bluffs – Trench Concept
POTENTIAL PED XING POINTS
Safe overcrossings are possible with a trench alternative
5
6
Del Mar Bluffs – Trench Concept
TYPICAL BRIDGE / ADA ACCESS
ADA ramp from bridge to beach
ADA ramp from street to bridge
Pedestrian bridge
(Beach)
End of street

Transportation Committee Item 7 | May 17, 2019 4
7
Del Mar Bluffs – Trench Concept
TYPICAL LINEAR PARK SECTION
Potential linear park,
up to 200 feet without ventilation
8
Del Mar Bluffs – Trench Concept
LINEAR PARK RENDERING
BEFORE…
Transportation Committee Item 7 | May 17, 2019 5
9
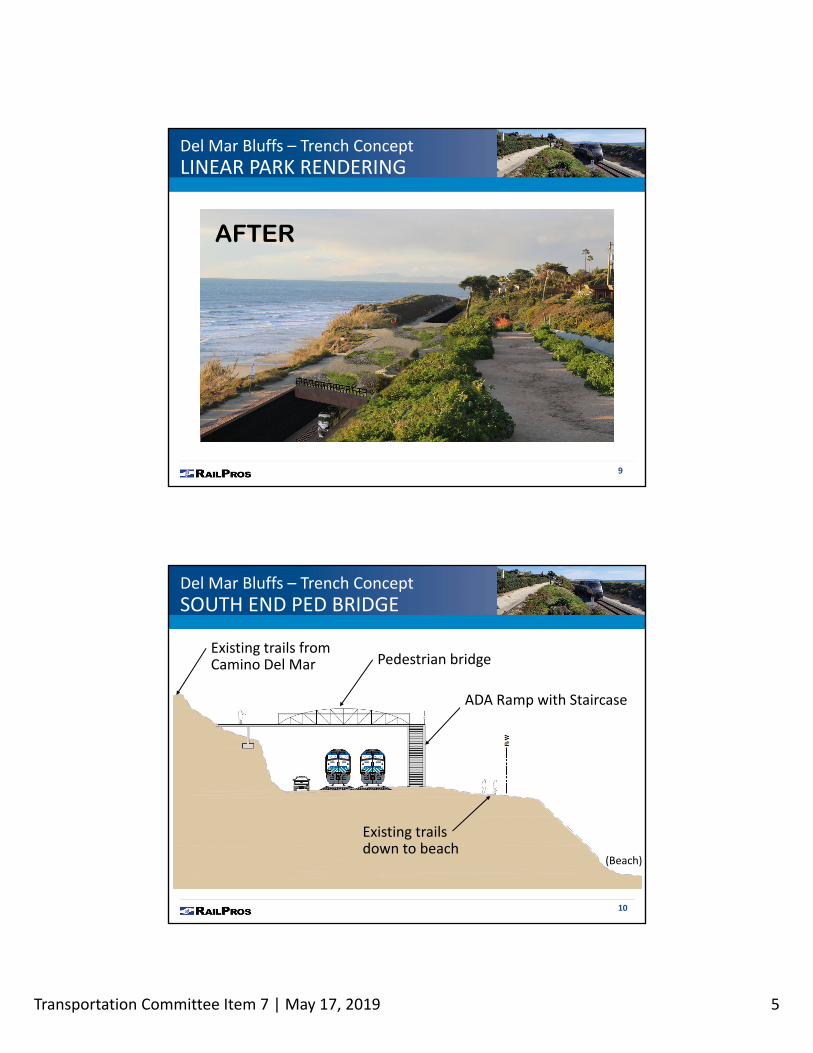
Del Mar Bluffs – Trench Concept
LINEAR PARK RENDERING
AFTER
10
Del Mar Bluffs – Trench Concept
SOUTH END PED BRIDGE
Existing trails down to beach
Existing trails from Camino Del Mar Pedestrian bridge
ADA Ramp with Staircase
(Beach)

Transportation Committee Item 7 | May 17, 2019 6
11
Del Mar Bluffs – Trench Concept
CONSTRUCTION PHASING
How do we build it?
12
Del Mar Bluffs – Trench Concept
CONSTRUCTION PHASING
PHASE 1Install permanent east wall soldier piling
Permanent wall

Transportation Committee Item 7 | May 17, 2019 7
13
Del Mar Bluffs – Trench Concept
CONSTRUCTION PHASING
PHASE 2Construct new shoofly* track and transfer operations to shoofly
ShooflyPermanent wall
*NOTE: A shoofly track is a temporary track to keep trains running during
construction.
14
Del Mar Bluffs – Trench Concept
CONSTRUCTION PHASING
PHASE 3Install permanent west wall and temporary wall. Construct new MT1 Track and transfer operations to new MT1
Permanent wall
Permanent wall
Temporary wall

Transportation Committee Item 7 | May 17, 2019 8
15
Del Mar Bluffs – Trench Concept
CONSTRUCTION PHASING
Remove temporary shoring wall, excavate to final grade, and set new MT2 Track
PHASE 4
16
Del Mar Bluffs – Trench Concept
COST ESTIMATE
Project cost escalated through 2025:
Cost will vary depending on inclusion and extent of various features such as:
• Linear park
• Pedestrian access bridges
• Beach access points
$300 million to $400 million

Transportation Committee Item 7 | May 17, 2019 9
17
Del Mar Bluffs – Trench Concept
SUMMARY
Trench Concept Summary
• 1.3 miles of trench from Coast Blvd to N. Torrey Pines Bridge (0.7 miles at full depth)
• 55’ wide trench with double track and maintenance access
• Bluff slope revegetation and toe stabilization
• New storm drain conveyance system
• Safe community access along bluffs and to beach
Del Mar Bluffs – Trench Concept
QUESTIONS?
18

Transportation Committee Item 8 | May 17, 2019 1
2018 Commute Behavior SurveyTransportation Committee Item 8 | May 17, 2019
Background Information
• Stated preference surveyconducted every four years
• Survey used for TDMprogramming, planning, andtransportation modeling
• Survey topics‒ Commuter travel profiles‒ Transportation preferences‒ Commuter benefits‒ Shared mobility use‒ Park & Rides‒ Technology
2

Transportation Committee Item 8 | May 17, 2019 2
3
Methodology
4,337 commuters in study area
• 68% San Diego residents• 32% Western Riverside residents
Mixed-Method approach
• Data collection via phone and online• English and Spanish
Overall margin of error is ± 1.6%
4

Transportation Committee Item 8 | May 17, 2019 3
Commute Behavior
5
Primary Commute Mode
*About half indicated that they use a pooled service like UberPOOL or Lyft’s Shared service
0.1%
0.5%
0.6%
0.7%
0.8%
0.9%
1.4%
5.1%
6.0%
83.9%
Prefer not to answer
Other Mode
On-Demand Rideshare*
Vanpool
Walk
Motorcycle
Bike
Carpool
Public Transit
Drive alone
% Respondents That Commute Outside Home
6

Transportation Committee Item 8 | May 17, 2019 4
Telework
7
Work from home12%
Commute outside home
88%
Intraregional Commuter Travel
8
97% of commuters who live in San Diego County work in San Diego County
56% of commuters who live in Western Riverside County work in Western Riverside County

Transportation Committee Item 8 | May 17, 2019 5
Interregional Commuter Travel
9
San DiegoCommuter
29 minutes
72 minutesWestern Riverside to San Diego
Commuter
16 miles
52 miles
Interregional Commuter Travel
10
Drive Alone
All Other Modes
84% 16%
77% 23%
San DiegoCommuter
Western Riverside to San Diego
Commuter

Transportation Committee Item 8 | May 17, 2019 6
Reason for Choosing Commute Mode
11
Convenience
Time/Work Schedule
Fastest Option
Cost/Cheaper
Convenience
Avoid Traffic
Drive Alone All Other Modes
Alternative Transportation
12

Transportation Committee Item 8 | May 17, 2019 7
Ranked Interest in Alternative Transportation Modes
13
9%
10%
23%
26%
32%
Prefer not to answer
Bike/Walk
Carpool/Vanpool
On-Demand Rideshare
Public Transit
% Commuters that Drive Alone
Interest in Alternative Transportation
Primary Factors that Influence Travel Choice
• Competitive travel time
• Supportive infrastructure
• Easy and convenient accessto and from transit
• Monetary incentives
• Guaranteed ride home in caseof an emergency
14

Transportation Committee Item 8 | May 17, 2019 8
Commuter Benefits
15
Employer Benefits Offered
16
8%
9%
10%
11%
14%
18%
29%
82%
84%
80%
77%
76%
75%
65%
10%
7%
9%
13%
10%
8%
7%
Guaranteed ride home
Employer-provided shuttles
Cash or incentives for not drivingalone to work
Pre-tax benefits
Free or discounted transit passes
Priority parking for carpools orvanpools
On-site facilities for employees thatwalk or bike (showers, lockers)
Yes, employer offers No, not offered Don't know

Transportation Committee Item 8 | May 17, 2019 9
Parking Costs at Work
17
Parking is not free11%
Parking is free at work88%
Prefer not to answer1%
Transportation Information
18

Transportation Committee Item 8 | May 17, 2019 10
Smart Phone Use
19
97%
100% 100%
98%
95%
92%
99% 99% 99%
97%
94%
88%
16 to 24 25 to 34 35 to 44 45 to 54 55 to 64 65 and older% R
espo
nden
ts T
hat C
omm
ute
Out
side
Hom
e
Commuters that Reside in San Diego County
Commuters that Reside in Western Riverside County
Popular Transportation Uses of Smart Phone
27%
44%
51%
71%
90%
97%
Purchase a transit pass or pay fare
Request motorist aid assistance
Check transit schedules or options
Request a ride from an on-demandrideshare service
Check traffic conditions
Get driving directions
% Respondents Who Commute Outside Home and Use Smart Phone
20

Transportation Committee Item 8 | May 17, 2019 11
Interest in Mobility as a Service (MaaS)
Prefer not to answer>1%
Not interested14%
Somewhat interested44%
Very interested41%
21
Key Takeaways
• Convenience and a competitivetravel times are main factors incommute choices
• Improve reliability and speed ofservice to help make alternativetravel options more attractive
• Employer-led initiatives (parking andincentives) critical in encouragingalternative options
• Continue to explore partnershipswith technology partners andopportunities for mobility hub pilots
22
Transportation Committee Item 9 | May 17, 2019 1
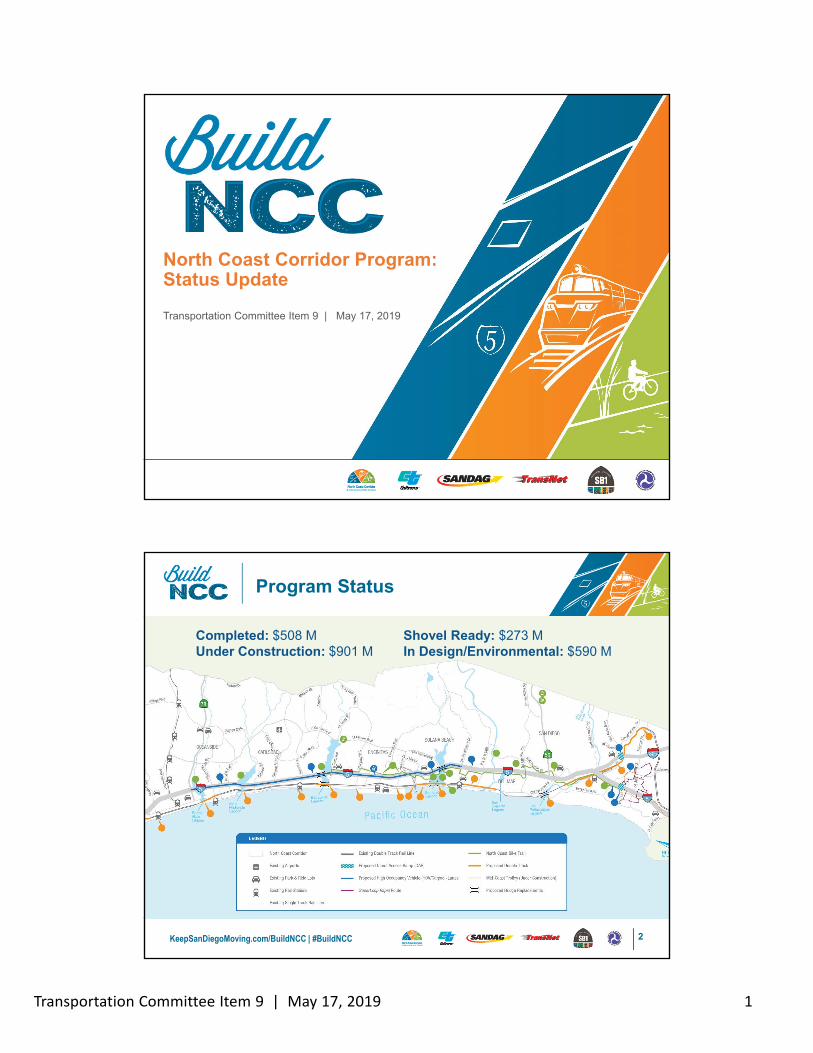
North Coast Corridor Program: Status Update
Transportation Committee Item 9 | May 17, 2019
KeepSanDiegoMoving.com/BuildNCC | #BuildNCC
Program Status
2
Completed: $508 MUnder Construction: $901 M
Shovel Ready: $273 MIn Design/Environmental: $590 M

Transportation Committee Item 9 | May 17, 2019 2
KeepSanDiegoMoving.com/BuildNCC | #BuildNCC
Phase 1 ‒ Corridor Segments
3
KeepSanDiegoMoving.com/BuildNCC | #BuildNCC
Phase 1 ‒ Corridor Segments
4
Total: $870 M
SEGMENTCONSTRUCTION
CAPITAL AND SUPPORT (M)
% COMPLETE MARCH 19
ORIGINAL ENDTARGET
COMPLETION
San Elijo Highway Bridge & Community Enhancements
$257 59% October 2020 May 2021
San Elijo Lagoon Double Track & Chesterfield Crossing Improvements
$70.1 94% February 2019 May 2019
San Elijo Lagoon Restoration $117.3 54% February 2021 July 2020
Coastal Rail Trail $6.8 73% February 2019 May 2019
Manchester Ave. –Palomar Airport Rd. Express Lanes
$305 10% August 2021 August 2021
Palomar Airport Rd. –SR 78 Express Lanes
$113 Future GMP Late 2022 Late 2021
Batiquitos Lagoon Double Track$81*
*Not included in total below
Future GMP 2020 TBD

Transportation Committee Item 9 | May 17, 2019 3
KeepSanDiegoMoving.com/BuildNCC | #BuildNCC 5
RIBBON CUTTING
San Elijo Lagoon Double Track, Chesterfield Drive Improvements, and Coastal Rail Trail Projects
5
KeepSanDiegoMoving.com/BuildNCC | #BuildNCC 6
COMPLETED PROJECT
San Elijo Lagoon Double Track Project6
Transportation Committee Item 9 | May 17, 2019 4
KeepSanDiegoMoving.com/BuildNCC | #BuildNCC7
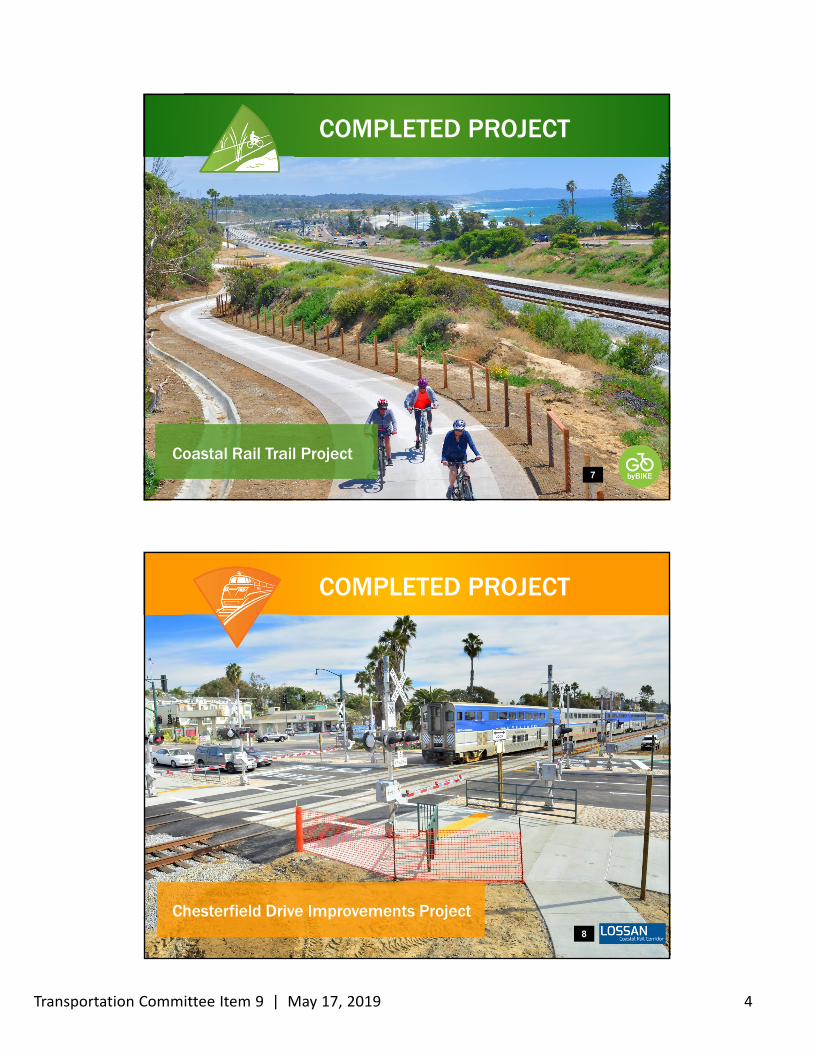
Coastal Rail Trail Project
COMPLETED PROJECT
KeepSanDiegoMoving.com/BuildNCC | #BuildNCC 8
COMPLETED PROJECT
Chesterfield Drive Improvements Project8

Transportation Committee Item 9 | May 17, 2019 5
KeepSanDiegoMoving.com/BuildNCC | #BuildNCC 9
San Elijo Lagoon RestorationPre-Construction
BEFORE
KeepSanDiegoMoving.com/BuildNCC | #BuildNCC 10
BEFORE
San Elijo Lagoon RestorationPre-Construction

Transportation Committee Item 9 | May 17, 2019 6
KeepSanDiegoMoving.com/BuildNCC | #BuildNCC 11
Construction ProgressStatus: San Elijo Lagoon Major Dredging Complete
AFTER
KeepSanDiegoMoving.com/BuildNCC | #BuildNCC 12
AFTER
Construction ProgressStatus: San Elijo Lagoon Major Dredging Complete

Transportation Committee Item 9 | May 17, 2019 7
KeepSanDiegoMoving.com/BuildNCC | #BuildNCC 13
Construction ProgressSan Elijo Lagoon Highway Bridge Outside Widening
KeepSanDiegoMoving.com/BuildNCC | #BuildNCC 14
Construction ProgressI-5 Express Lane Construction through Encinitas and Carlsbad Continues

Transportation Committee Item 9 | May 17, 2019 8
KeepSanDiegoMoving.com/BuildNCC | #BuildNCC 15
Paving and Traffic Switch Ramp Work
San Elijo Lagoon Highway Bridge Project Health
Progress: $201.5 M Current Budget$121.8 M Expended
Contingency: $9.8 M Base$2.7 M Remaining
Schedule: October 2020 BaseMay 2021 Current Target
59% Work Complete
52% Time
KeepSanDiegoMoving.com/BuildNCC | #BuildNCC
San Elijo Lagoon Double Track Project Health
16
Progress:$54.4 M Current Budget$50.5 M Expended
Contingency:$1.2 M Base$0.9 M Remaining
94% Work Complete
98% Time
Schedule: June 2019 BaseMay 2019 Target

Transportation Committee Item 9 | May 17, 2019 9
KeepSanDiegoMoving.com/BuildNCC | #BuildNCC 17
San Elijo Lagoon Restoration Project Health
Progress: $99.7 M Current Budget $56.1 M Expended
Contingency: $5.0 M Base$8.5 ‐ 10 M Remaining
Schedule: February 2021 BaseJuly 2020 Target
54% WorkComplete
40% Time
KeepSanDiegoMoving.com/BuildNCC | #BuildNCC 18
Coastal Rail Trail Project Health
Progress: $5.4 M Current Budget$3.7 M Expended
Contingency: $0.3 M Base$50,000 Remaining
Schedule: February 2019 BaseMay 2019 Target
73% WorkComplete
134% Time

Transportation Committee Item 9 | May 17, 2019 10
KeepSanDiegoMoving.com/BuildNCC | #BuildNCC 19
Progress: $243.2 M Current Budget$24.5 M Expended
Contingency: $12.8 M Base$12.8 M Remaining
Schedule: August 2021 BaseAugust 2021 Target
I-5 Express Lanes Project HealthManchester Avenue to Palomar Airport Road
10% WorkComplete
6% Time
KeepSanDiegoMoving.com/BuildNCC | #BuildNCC
Risks and Opportunities
20
Risks
OpportunitiesType Topic Status
Cost & Schedule San Elijo Lagoon Restoration Project Ahead of Schedule
Cost & Schedule Advance STIP Funds for Express Lanes between Palomar Airport Road and SR 78 from FY 2022/2023 to 2019/2020
Ongoing
Program Accelerate Deployment of Express Lanes Congestion Pricing Ongoing
Cost & ScheduleAdvance SHOPP Funds for I-5 Operational Improvements at Palomar Airport Road
Ongoing
Cost & Schedule Advance Regional Funds for I-5 Operational Improvements atI-5/SR 78
Ongoing
Type Topic Status
Cost & Schedule Construct Remaining I-5 Bridge Foundations at the San Elijo Lagoon Ongoing
CostConstruction Escalation for Express Lanes between Palomar Airport Road and SR 78
Ongoing

Transportation Committee Item 9 | May 17, 2019 11
KeepSanDiegoMoving.com/BuildNCC | #BuildNCC 21
Remaining 2019 Milestones
Complete south side of Santa Fe Drive/Encinitas Boulevard bike and pedestrian improvements
Shift northbound I-5 traffic to new outside bridge
Complete all dredging operations and begin planting in the San Elijo Lagoon
Shift southbound I-5 traffic to new outside bridge
Complete paving of the I-5 median in Encinitas and Carlsbad
June 2019
September 2019
October 2019
December 2019
December 2019
KeepSanDiegoMoving.com/BuildNCC | #BuildNCC 22
55 Miles Per Hour Speed Reduction
55

Transportation Committee Item 9 | May 17, 2019 12
KeepSanDiegoMoving.com/BuildNCC | #BuildNCC 23

Transportation Committee Item 10 | May 17, 2019 1
2019 Capital Grant Receipts Revenue Bonds:Review of Draft Documents
Transportation Committee Item 10 | May 17, 2019
2019 Bond Financing Team
San Diego Association of Governments Kim Kawada, Chief Deputy Executive Director Andre Douzdjian, Finance Director Jose Nuncio, TransNet Department Director Jim Linthicum, Director of Mobility Management John Kirk, General Counsel Ray Major, Chief Economist and Data, Analytics, Modeling Director
Financial Advisors, Public Financial Management Peter Shellenberger, Managing Director Darren Hodge, Director
Bond Counsel, Norton Rose Fulbright US LLP Victor Hsu, Partner Russ Trice, Partner
Disclosure Counsel, Orrick, Herrington & Sutcliffe, LLP Devin Brennan, Partner Mary Collins, Partner
Senior Underwriter, Wells Fargo Nancy Feldman, Managing Director Julie Burger, Director
2

Transportation Committee Item 10 | May 17, 2019 2
2019 Bond Issuance Presentation
1. Why we need to issue these bonds
2. Credit rating
3. Potential size and structure
4. Various draft bond documents that will be reviewed
5. Calendar of events
3
Project Schedule
4
Project Schedule
2016 2017 2018 2019 2020 2021
RELOCATE UTILITIES
BUILD SUPPORTING INFRASTRUCTURE
CONSTRUCT VIADUCTS AND BRIDGES
BUILD STATIONS
INSTALL TRACK AND POWER
TESTING START-
UP
The Project is currently 57% complete with high-risk components such as utility relocation and most land acquisition finished
Pre-revenue testing is expected to begin in June 2021
The Project is expected to be open for service by November 2021
Transportation Committee Item 10 | May 17, 2019 3
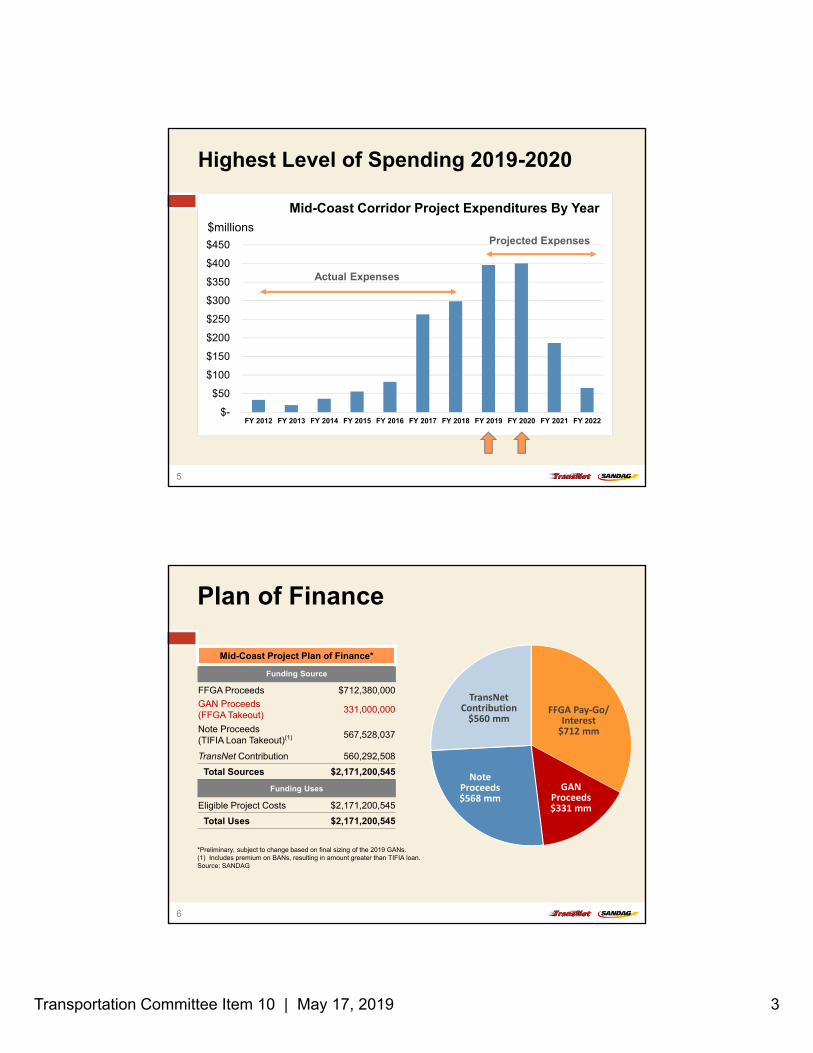
Highest Level of Spending 2019-2020
$-
$50
$100
$150
$200
$250
$300
$350
$400
$450
FY 2012 FY 2013 FY 2014 FY 2015 FY 2016 FY 2017 FY 2018 FY 2019 FY 2020 FY 2021 FY 2022
$millions
Actual Expenses
Projected Expenses
Mid-Coast Corridor Project Expenditures By Year
5
6
Mid-Coast Project Plan of Finance*
Funding Source
FFGA Proceeds $712,380,000
GAN Proceeds (FFGA Takeout)
331,000,000
Note Proceeds (TIFIA Loan Takeout)(1) 567,528,037
TransNet Contribution 560,292,508
Total Sources $2,171,200,545
Funding Uses
Eligible Project Costs $2,171,200,545
Total Uses $2,171,200,545
FFGA Pay‐Go/ Interest$712 mm
GAN Proceeds$331 mm
Note Proceeds $568 mm
TransNet Contribution$560 mm
*Preliminary, subject to change based on final sizing of the 2019 GANs. (1) Includes premium on BANs, resulting in amount greater than TIFIA loan.Source: SANDAG
Plan of Finance

Transportation Committee Item 10 | May 17, 2019 4
Credit Rating Agency Reviews
Currently no ratings on these Bonds
Anticipated ratings A-BBB Category
7
Potential Size and Structure
8
Par Amount: $327.7 million 2019A Serial Bonds: $206.3 million 2019B Super Sinker: $125.0 million
Project Fund Target: approx. $331.0 million
Tax Status: Tax-exempt
Interest: Semi-annual fixed-rate
Reserve Fund: Maximum Annual Interest
Capitalized Interest: Through FFY2020 (Nov. 15, 2019 and May 15, 2020 payments)
Maturity 2019A Serial Bonds: Nov. 15, 2023 - 2026 2019B Super Sinker: Nov. 15, 2027
Call Feature 2019A Serial Bonds: 12-months prior to maturity 2019B Super Sinker: Any interest payment date from Redemption Account monies
Structure Overview*
Preliminary, Subject to Change

Transportation Committee Item 10 | May 17, 2019 5
2019 Bond Documents for Review
The Resolution authorizes issuance of the 2019 Bonds and approves the following documents:
Official Statement
Trust Indenture
Bond Purchase Agreement
Continuing Disclosure Agreement
99
Next Steps
May 16, 2019 – Rating Agency Presentation
May 17, 2019 – Transportation Committee Bonds Overview
May 17, 2019 – Board of Directors Bonds Overview
June 7, 2019 – Transportation Committee review of Bond documents and recommend Board approval
June 14, 2019 – Board of Directors review and approval of Bond documents
Week of June 17, 2019 – Post Official Statement
Weeks of July 1-19, 2019 – Marketing of Bonds
Week of July 22, 2019 – Pricing
Week of August 5, 2019 – Closing
10