sand98–8246 unlimited release · these properties were compared to those of apo-bmi under similar...
TRANSCRIPT
SANDIA REPORT
.
SAND98–8246Unlimited ReleasePrinted October 1998
TEPlC - A New High TemperatureStructural Foam
L. L. Whinnery, S. H. Goods, M. L. Tootle, and C. L.
Prepared bySandia Nationall LaboratoriesAlbuquerque, New Mexico 87185 and Liverrnore, California 94550
Sandia is a muitiprogram laboratory operated by Sandia Corporation,a Lockheed Ma)rtin Company, f@rthe United States Department ofEnergy under Contract DE-AC04-94AL85000.
Approved for public release; further dissemination unlimited.
El%ndia National laboratories
Neuschwanger
sF~9rJOQ(&81 )
—
Issued by Sandia National Laboratories, operated fur the United States Depart-ment of Energy by Sandia Corporation.
NOTICE: This report was prepared as an account of work sponsored by anagency of the United States Government. Neither the United States Govern-ment, nor any agency thereof, nor any of their employees, nor any of theircontractors, subcontractors, or their employees, make any warranty, express orimplied, or assume any legal liability or responsibility for the accuracy,completeness, or usefulness of any information, apparatus, product, or processdisclosed, or represent that its use would not infringe privately owned rights.Reference herein to any specific commercial product, process, or service bytrade name, trademark, manufacturer, or otherwise, does not necessarilyconstitute or imply its endorsement, recommendation, or favoring by the UnitedStates Government, any agency thereof, or any of their contractors orsubcontractors. The views and opinions expressed herein do not necessarilystate or reflect those of the United States Government, any agency thereof, orany of their contractors.
Printed in the United States of America. This report has been reproduceddirectly from the best available copy.
Available to DOE and DOE contractors hornOffice of Scientific and Technical InformationP.O. BOX62Oak Ridge, TN 37831
Prices available from (615) 576-8401, FTS 626-8401
Available to the public fromNational Technical Information ServiceU.S. Department of Commerce5285 Port Royal RdSpringfield, VA 22161
NTIS price codesPrinted copy: A03Microfiche copy: AO1
SAND98-8246Unlimited Release
Printed October 1998
TEPIC - A NEW HIGH TEMPERATURE STRUCTURAL FOAM
L. L. WhinneryMaterials Processing Department
S. H. Goods and M. L. TootleMaterials Reliability Department
SandiaNational LaboratoriesP. O. BOX 969
Livermore, CA 94551-0969
C. L. NeuschwangerHewlett Packard
1501 Page Mill Road, MS 5L-CPalo Alto, CA 94304-1126
ABSTRACT
The formulation, processing characteristics, microstructure and mechanical properties of anew structural foam, suitable for use at service temperatures up to 200°C, are reported. In
each of these respects, the foam is compared to an existing material, called APO-BMI thatis currently in use. When these two foams are directly compared, the new foam, calledTEPIC, is found to be superior in its mechanical performance.
TEPIC is formulated from a non-carcinogenic isocyanate, a di-functional epoxide, andglass microballoons. Our approach was to combine chemistries known to form thermallystable products. The principal polymerization products are an oxizolidinone produced bythe reaction of the isocyanate with the epoxide and isocyanurate rings formed by thetrimerization of the isocyanate. Processing has been examined and large-scale productionis discussed in detail. Compared to APO-BMI processing, TEPIC processing is facile andeconomical.
The structure of the foam resembles a traditional rigid polyurethane foam rather than that ofthe APO-BMI. That is, the foam is comprised of a continuous resin phase rather thanweakly bonded glass microballoons. At a density of 0.42 g/cm3 or greater, maximum poresize in TEPIC was less than 2 mm, as required for the application.
-3-
In regard to specific mechanical properties, quasi-static uniaxial testing indicates that thecrush strength of TEPIC at both ambient temperature and 200°C substantially exceeds theminimum requirements (6.9 MPa). The tensile strength is greater than that of the APO-BMI material it is intended to replace (APO-BMI). Energy absorption, measured fromimpact testing, is equivalent to the foam that is currently deployed.
-4-
ACKNOWLEDGMENT
The authors would like to thank Craig Henderson for the initial TEPIC formulation andhelpful suggestions. We are grateful to George McEachen from Allied Signal FM&T forsupplying all of the APO-BMI material. We would also like to thank Pat Keifer, John Tan,Winalee Carter, John Hachman, Eunizelle Balbin, and Jeff Chames for technical assistanceand analytical support.
-5-
I. Introduction
II. ExperimentalProcessingMechanical Testing
TABLE OF CONTENTS
III. Results and DiscussionProcessing and Structure of Syntactic FoamsMechanical Properties of FoamsComparison of TEPIC Properties to APO-BMIImpact Properties of TEPIC/APO-BMIStrain Rate Effects on Mechanical Properties of TEPIC
Iv. Conclusions
v. References
9911
131319232526
31
32
-6-
FIGURES
1. Specimen geometries used in this study2. Schematic illustration of the calculation of toughness or
energy absorption3. APO-BMl chemistry4. SEM image of fracture surface of APO-BMI foam5. Oxizolidinone formation6. Isocyanurate formation7. SEM image of TEPIC8. A 20 kg billet of TEPIC and a partially machined part9. Tensile behavior of TEPIC10 Compression behavior of TEPIC11, Compression of the tension and compression
behavior of TEPIC12 Compression stress-strain curve for TEPIC at 200”C13, Comparison of tensile behavior TEPIC and
APO-BMI at 25°C14. Comparison of compression behavior TEPIC and
APO-BMI at 25°C15. Comparison of the compression behavior of TEPIC
and APO-BMI at 200°C16. Comparison of the impact behavior of TEPIC and
APO-BMI at 25°C17. Summary of energy absorption characteristics for TEPIC
and APO-BMI at 25°C18. Stress-strain curve for TEPIC tested at 8.3 x 10⁵see-l in
displacement control19. Stress-strain curve for TEPIC tested at 8.3 x 10⁻³see-l in
displacement control20. Stress-strain curve for TEPIC at 2.0 X10²see-’ under
impact conditions21. Moduli derived from all compression tests22. Average moduli at each strain rate23. Average strength at each strain rate
1112
141516161719202122
2223
24
24
25
26
27
28
28
293030
-7-
TEPIC - A NEW HIGH TEMPERATURE STRUCTURAL FOAM
L INTRODUCTION
Polymeric foams provide structural support in critical locations in a number of nuclearweapons. When service temperatures approaching 200°C are required, only a very limitedselection of foams is available. For these high temperature applications (after 1977), athree-phase syntactic foam called Kerimid 601 has been used. 1’2’3Kerimid 601 consists ofa mixture of methylene dianaline (MDA), bismaleimide (BMI) (together forming the resinphase), glass microballoons (GMB) and air. The foam essentially consists of the hollowspheres “glued” together by the resin phase, a bismaleimide. Air is present in the voidsbetween the microballoons and comprises the third phase. When it was discovered thatMDA was carcinogenic, replacement foams were sought.
Some time ago, ASFM&T chose APO-BMI as the three-phase syntactic foam to replaceKerimid601. APO Cure is the diamine reagent that reacts with maleic anhydride to formthe BMI linkages. Both carbon microballoons and glass microballoons have been used inAPO-BMI formulations.4’5’b’7’8Structurally, APO-BMI is quite similar to Kerimid 601.The processing of these APO-BMI foams is moderately complicated and expensive. Theresulting foams are also very brittle, particularly in tension, making machining andhandling difficult.
While the properties of ABO-BMI are adequate for the designed application, thecombination of the processing difficulties, less than optimum mechanical properties andfrangibility concerns have driven a new search for a more mechanically robust and easierhandling high temperature structural foam. The absolute requirements for this replacementmaterial remain the same as those for APO-BMI and consist of
I. Minimum compression failure strength of 6.9 MPa (1000 psi) over the temperaturerange of 25°C to 200°C
II. Maximum density of 0.6 g/cm3III. Maximum void size of 2 mm
Obviously, the constituents were required to be non-carcinogenic. It was desired for thenew foam to be less brittle than APO-BMI, and be processible and scaleable to large parts.Further, changes in the design of specific structural supports required that the replacementfoam be considerably more machinable than APO-BMI.
-8-
Our approach was to combine chemistries known to form thermally stable products. Wealso wanted the structure to resemble a traditional rigid polyurethane foam rather than theAPO-BMI structure since a continuous resin phase is known to have superior mechanicalproperties and machineablity characteristics. The principal constituents are anoxizolidinone produced by the reaction of an isocyanate with an epoxide and isocyanuraterings formed by the trimerization of an isocyanate.9 Air is mechanically incorporated intothe liquid constituents during mixing and GMB are added to increase the modulus andadjust the density. The high temperature structural foam we developed is called TEPIC (theEpoxy PolyIsoCyanurate).
Since mechanical properties were identified as one of the main requirements for thereplacement foam, uniaxial tension, compression, and impact properties of TEPIC foamswere investigated in detail. Specifically for TEPIC, strength and ductility in both tensionand compression were measured under quasi-static test conditions at both room temperatureand 200°C. These properties were compared to those of APO-BMI under similar testconditions. The response of both materials to high rate impact were also assessed. Strainrate effects on compressive strength and modulus were also characterized for TEPIC overseven orders of magnitude in strain rate.
II. EXPERIMENTAL
The reactants used in processing TEPIC are listed in Table 1. The specific quantities listedyield a free rise density of 0.42 g/cm3. These chemicals were used as supplied withoutfurther purification.
Table 1. Chemicals, amounts, and producers used in preparation of TEPIC foams.
Chemical Amount Chemical ProducerEpon 826 5911 g Dow Chemicals—
DC193 739 g Dow Chemicals—PAPI-2094 11084 g Dow Chemicals
GMB 32/4500 2217 g 3MTMR-3 51 g Air Products—
Processing
TEPIC foam was processed in a manner similar to traditional rigid polyurethane foams.Each of the reactants was added sequentially, with hand stirring using a metal spatula.First, the epoxy resin (Epon 826) and surfactant (DC193) were combined in a 80 litercontainer (for the quantities listed in Table 1). Next, the isocyanate (PAPI-2094) wasstirred into the mixture, followed by the ffler (GMB). The GMB can be difilcult to fullyincorporate into the liquid mix. To aid in its dispersion, the liquid reactants and the GMBwere thoroughly mixed with a 4-inch Corm blade for 3-5 minutes. Periodically, the sides
-9-
of the container were scraped with a spatula to help further disperse the GMB. The catalyst(TMR-3) was added last and mixing continued on the Corm blade for 1 minute.
This mixture was poured into a mold and allowed to rise and gel over the next 2 hours atroom temperature. The mold was then cured in an oven at 130°C overnight. Because thefoam requires strength above ambient, an additional curing step was used to increase theTg. To this end, the foam was removed from the mold and heated with a gradual ramp, to200”C over 28 hours. The foam was then held for 5 hours before slowly being cooled toroom temperature.
The processing conditions described above and the formulation listed in Table 1 yields afoam having a density of 0.42 g/cm3 and a maximum void size of 2 mm as required by theapplication. Attempts to achieve lower densities by varying either the ratio of reactants orprocessing variables resulted in unsatisfactory foam structures and processingcharacteristics. For example, reducing the density (by additions of water) resulted in thecollapse of the foam during gellation and rise. Other attempts to reduce density byincreasing the proportion of GMB, yielded a slurry that trapped large air pockets duringmixing. The resulting foam had pores substantially greater the 2 mm allowed for theapplication.
The processing steps for making TEPIC foam parts are summarized below:1. Add DC193 to Epon 826 – hand stir2. Add PAPI-2094 – hand stir3. Add GMB – hand stir4. Mix thoroughly with Corm blade5. Add TMR-3 - mix 60 to 90 sec with Corm blade6. Pour into mold7. Let stand at ambient temperature for at least 2 hours8. Cure mold in 130”C oven overnight9. Unmold foam10. Post-cure to 200”C with the following temperature profile
65°C oven for 5-hours.ramp to 150”C over 8-hours and hold for 5-hoursramp to 180”C over 5-hours and hold for 5-hoursramp to 200°C over 5-hours and hold for 5-hoursslow cool to 65°C in 5-hours and hold for 5-hours
Observations on TEPIC processingPrior to adding the catalyst, the mixture is stable at room temperature for several hours, butwould form a crust if left overnight. This crust is probably due to the isocyanate reactingwith moisture in the air. Storing in a nitrogen atmosphere may increase the shelf life of thismixture.
The time interval between Steps 5 and 6 should be less than 2 minutes. If the mix is nottransferred into the mold fast enough, it will start to gel in the mixing container.
-1o-
During the post-cure cycle, Step 10, the actual ramp rate will vary depending on thecharacteristic part dimension. Parts with thicker dimensions will require slower ramp ratesin order to avoid charring. For example, the ramp rate called out in Step 10 was optimizedfor a part with a maximum thickness of 10 cm.
Mechanical Testing
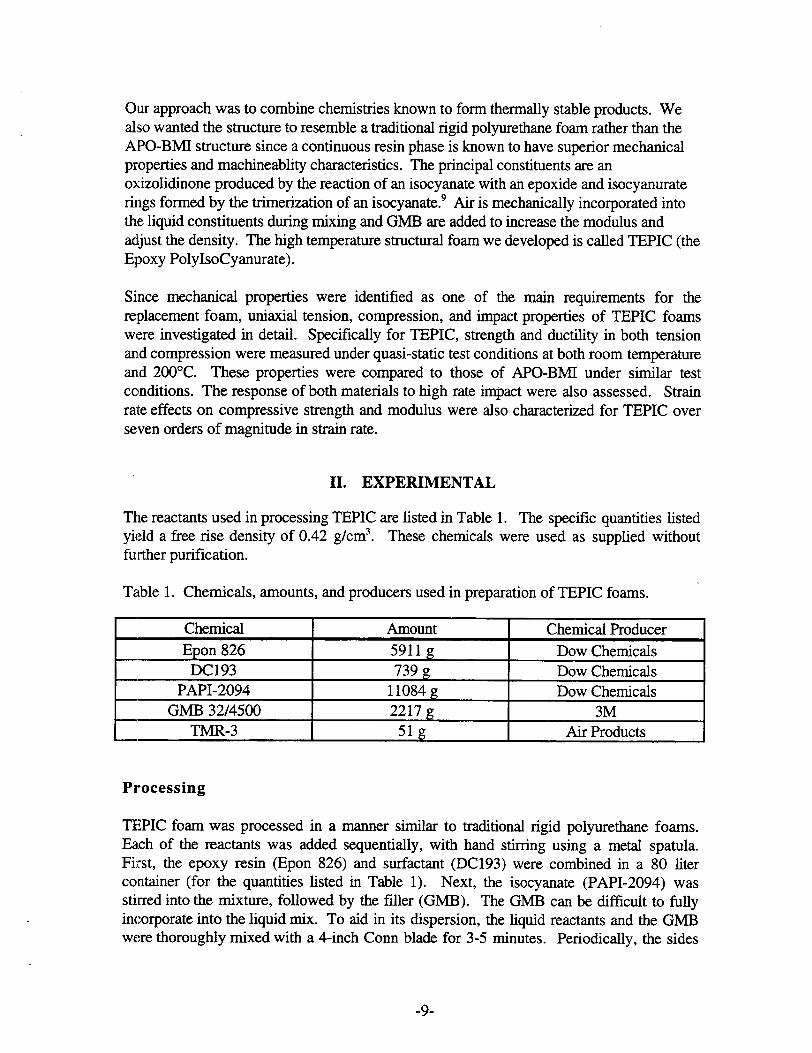
Uniaxial tension and compression properties of TEPIC were evaluated. All specimens formechanical testing were machined from a single block of TEPIC having a density of0.42 g/cm3. The cylindrical axis of the samples were parallel to the rise direction of thefoam. Tension properties were evaluated only at room temperature. The tensionspecimens had a gage length of 25.4 mm and a reduced gage diameter of 19.0 mm andwere bonded to steel pull studs. The reduced gage section insured that failure occurredwithin the specimen between the attachment points of the extensometer and not at thebcmdline between the foam and the pull studs. Compression tests were performed at roomtemperature and 200”C on freestanding right cylinders. For these tests, test specimensmeasured 28.7 mm (1.13 in) in diameter and 50.8 mm (2.0 in) in length. All tension andcompression specimens were instrumented with a mechanically attached extensometer fordisplacement measurement. Compression and tension specimens are shown in Figure 1.
Figure 1. Specimen geometries used in this study. (a) Tension specimen had a 25.4 mmgage length with a 19.0 mm reduced gage diameter. Steel pull studs werebonded to the specimen ends for mounting in the test frame. (b) Compressionand impact specimens were simple free standing right cylinders 50.8 mm longand 28.7 mm in diameter.
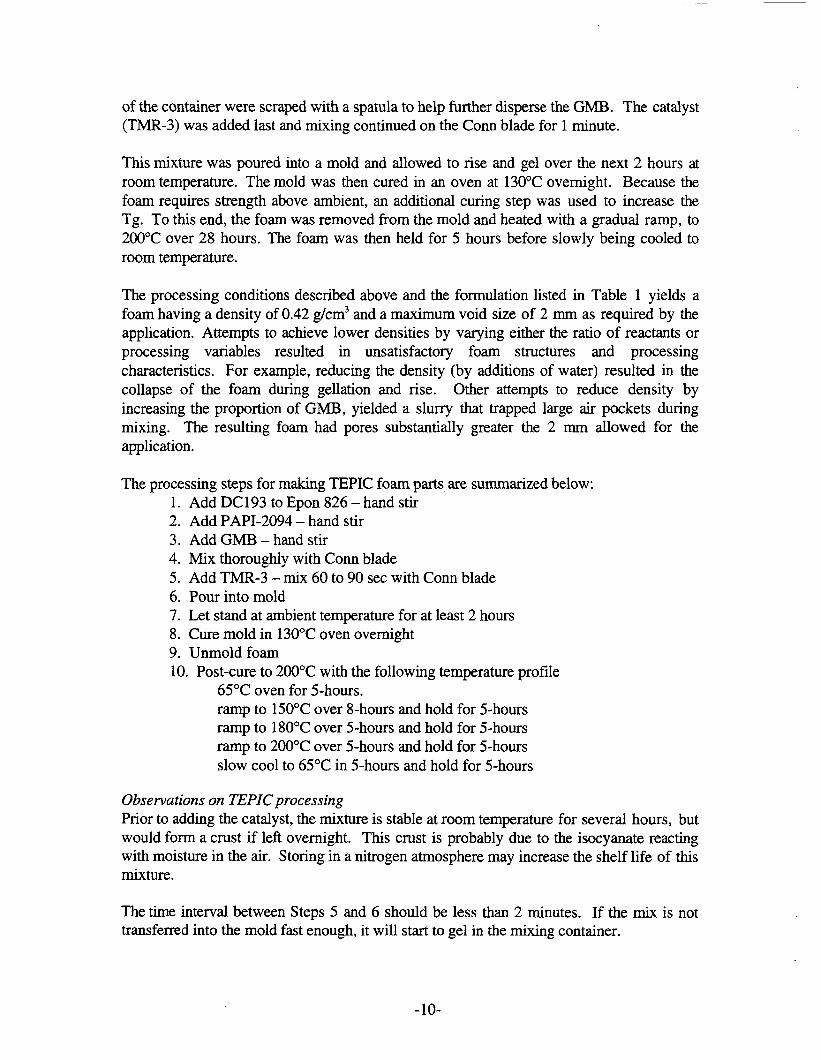
For tensile testing, modulus (E), ultimate tensile strength (UTS) and energyabsorptionhnit volume (toughness) were determined. The latter parameter was calculatedas the area under the stress-strain curve (see Figure 2). For compression testing,
-11-
modulus, crush strength (aC,,) and toughness were determined. These tension andcompression properties were compared to those of APO-BMI,
ENERGY ABSORPTION
orTOUGHNEss
Area =energy/volume
Strain
Figure 2. Schematic illustration of the calculation of toughness or energy absorptionfrom either a tension or compression stress-strain curve. The energyabsorption is the area under the curve either to the point of failure or to somepre-determined strain value.
The influence of strain rate on modulus and strength of TEPIC was also evaluated at 25°Cfor specimens tested in compression. For these tests, specimens had the same geometryas those for compression described above, except for the specimens tested at the higheststrain rate. For those tests, the specimens were smaller cylinders, measuring 12.7 mm(0.5 in) in both diameter and height.
In order to span the strain rate range of interest, it was necessary to use three differenttesting instruments. Where possible testing conditions were overlapped so that anysystematic differences resulting from the use of the different instruments could beascertained. Tests at strain rates between 8.3 x 10⁻⁶and 8.3 x 10⁻³see-*were performedon an MTS servomechanical test frame. This instrument is most suited for testsperformed at these “quasi-static” strain rates. Higher rate tests, performed at strain ratesup to 8.3 x 10-] see-l, were run on an MTS servohydraulic test frame. This representedthe upper end limitation on strain rate due to both actuator velocity and data acquisitionrate. Both of these instruments were operated in “stroke” control mode. In this mode, a
-12-
constant displacement rate is imposed on test specimens. All specimens wereinstrumented with a mechanically attached extensometer for displacement measurement.During each test, load and specimen displacement are monitored and recorded. Stress-strain curves are subsequently generated from these load-displacement data.
The highest strain rate tests were performed on a Dynatup drop weight impact tester. Thetest frame can be operated in either gravity mode or with pneumatic assist. A high speeddata acquisition system, which records the output of an instrumented tup (load cell), has 1ms resolution and can acquire a complete loading (impact) event in as little as 4 ms.Mechanically attached extensometers cannot be used with this instrument. Rather,crosshead position is measured and recorded during the impact event. This data is thenused to compute the strain imposed on a specimen. Tests on TEPIC were performed ingravity mode. Incident velocity of the crosshead corresponded to a strain rate of 200see”]. While these are not true constant displacement rate tests, as are the ones describedabove, analysis of the data revealed that the decrease in velocity during the impact eventwas less than 5% of the incident value. This same instrument was used to directlycompare the impact characteristics of APO-BMI to those of TEPIC.
III. RESULTS AND DISCUSSION
Processing and Structure of Syntactic Foams
APO-BMIWe note that the APO-BMI used in this study was manufactured atASFM&T. We include the following description of the processing forcompleteness.
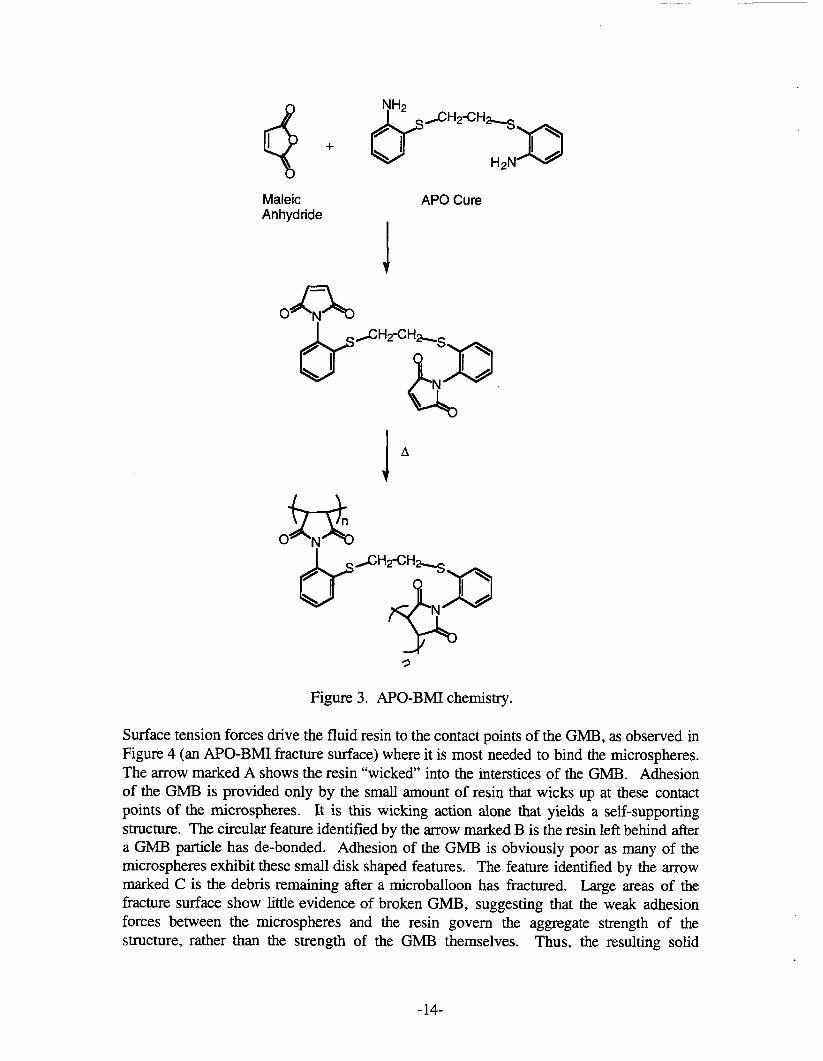
The starting materials and chemistry for APO-BMI are shown in Figure 3. In APO-BMlprocessing, the reactants (maleic anhydride and APO Cure) are solid powders that areblended with the GMB. This mixture is then poured into a cylindrical mold that can becompacted. The mold is then heated while applying pressure. The heat melts the powderreactants, allowing them to intermix and react. A critical feature of APO-BMI resin is itsbroad processing window.4 This results from a large temperature difference between themelting point of the reactants and the initial polymerization temperature. This temperaturedifferential allows the resin to flow as a fluid prior to polymerizing.
-13-
Maleic APO CureAnhydride
I
&—
ON
JA
&“H2’H;xl%
Figure 3. APO-BMI chemistry.
Surface tension forces drive the fluid resin to the contact points of the GMB, as observed inFigure 4 (an APO-BMI fracture surface) where it is most needed to bind the microsphere.The arrow marked A shows the resin “wicked” into the interstices of the GMB. Adhesionof the GMB is provided only by the small amount of resin that wicks up at these contactpoints of the microsphere. It is this wicking action alone that yields a self-supportingstructure. The circular feature identified by the arrow marked B is the resin left behind aftera Gh4B particle has de-bonded. Adhesion of the GMB is obviously poor as many of themicrosphere exhibit these small disk shaped features. The feature identified by the arrowmarked C is the debris remaining after a rnicroballoon has fractured. Large areas of thefracture surface show little evidence of broken GMB, suggesting that the weak adhesionforces between the rnicrospheres and the resin govern the aggregate strength of thestructure, rather than the strength of the GMB themselves. Thus, the resulting solid
-14-
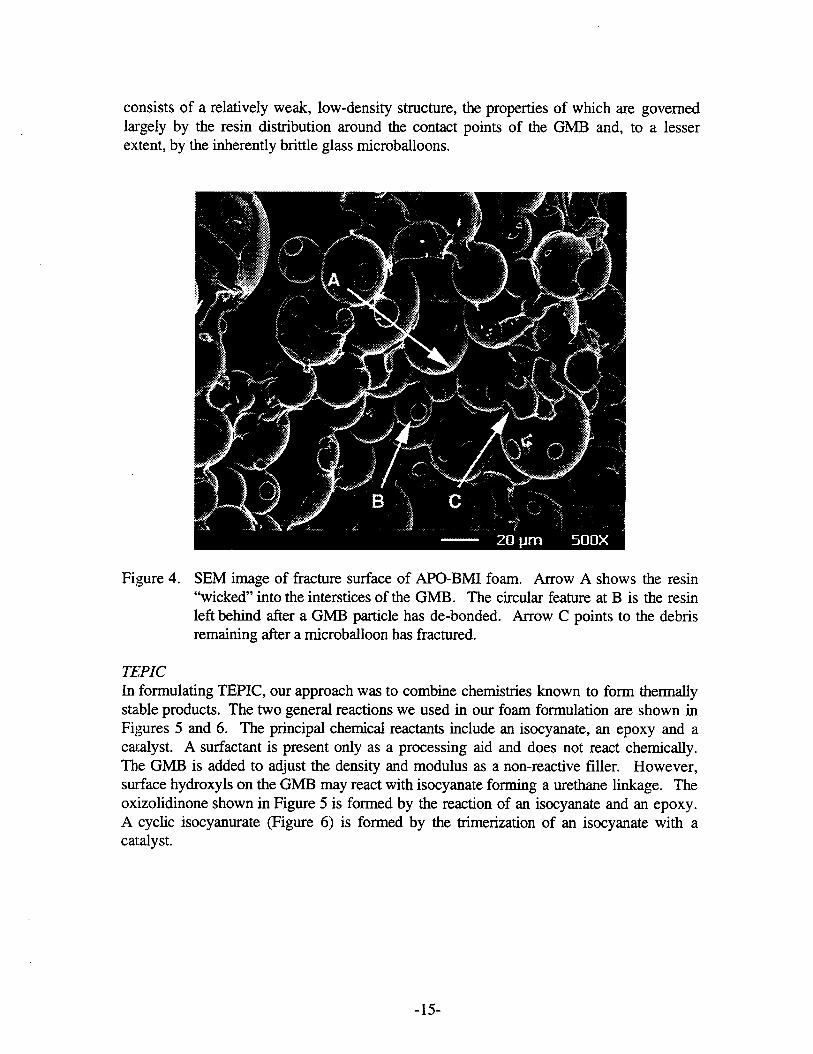
consists of a relatively weak, low-density structure, the properties of which are governedlargely by the resin distribution around the contact points of the GMB and, to a lesserextent, by the inherently brittle glass microballoons.
Figure 4. SEM image of fracture surface of APO-BMI foam. Arrow A shows the resin“wicked” into the interstices of the GMB. The circuhr feature at B is the resinleft behind after a GMB particle has de-bonded. Arrow C points to the debrisremaining after a microballoon has fractured.
TEPICIn formulating TEPIC, our approach was to combine chemistries known to form thermallystable products. The two general reactions we used in our foam formulation are shown inFigures 5 and 6. T’heprincipal chemical reactants include an isocyanate, an epoxy and acatalyst. A surfactant is present only as a processing aid and does not react chemically.The GMB is added to adjust the density and modulus as a non-reactive filler. However,surface hydroxyls on the GMB may react with isocyanate forming a urethane linkage. Theoxizolidinone shown in Figure 5 is formed by the reaction of an isocyanate and an epoxy.A cyclic isocyanurate (Figure 6) is formed by the trimerization of an isocyanate with acatalyst.
-15-
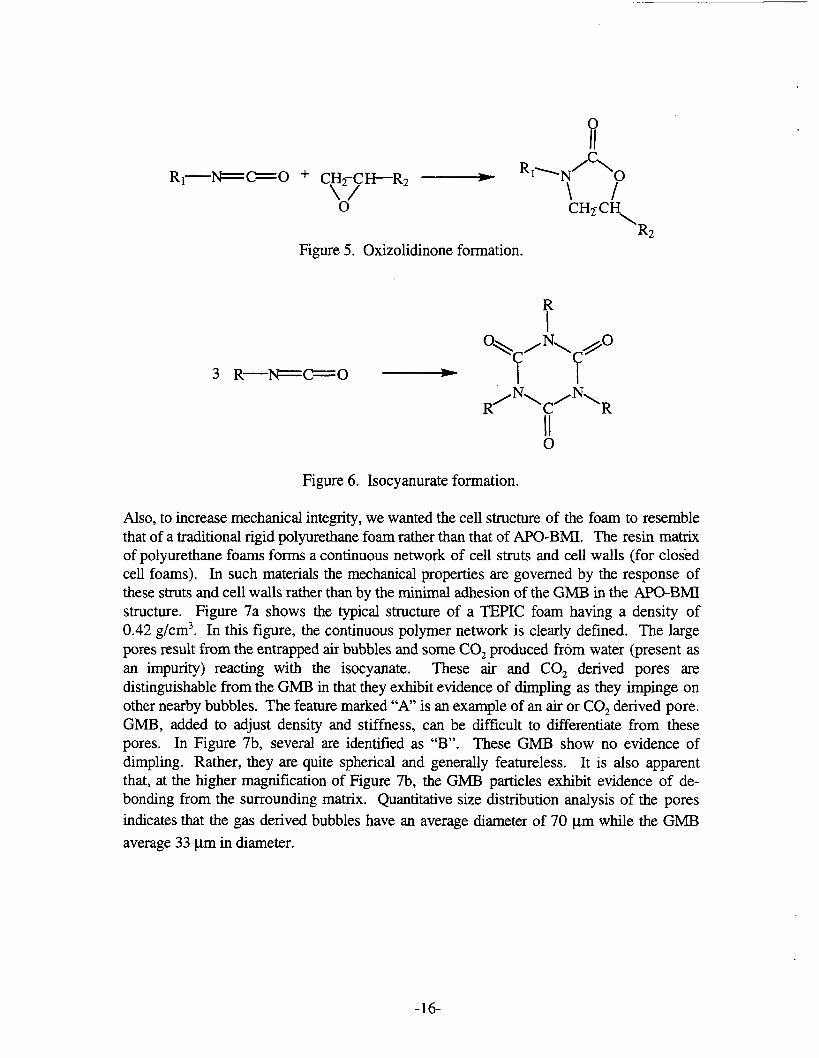
Figure 5. Oxizolidinone formation.
R
3 R—FGO ~ ‘Y’”’f<o
R/*\c/”\R
IIo
Figure 6. Isocyanurate formation.
Also, to increase mechanical integrity, we wanted the cell structure of the foam to resemblethat of a traditional rigid polyurethane foam rather than that of APO-BMI. The resin matrixof polyurethane foams forms a continuous network of cell struts and cell walls (for closedcell foams). In such materials the mechanical properties are governed by the response ofthese struts and cell walls rather than by the minimal adhesion of the GMB in the APO-BMIstructure. Figure 7a shows the typical structure of a TEPIC foam having a density of0.42 g/cm3. In this figure, the continuous polymer network is clearly defined. The largepores result from the entrapped air bubbles and some COZproduced from water (present asan impurity) reacting with the isocyanate. These air and C02 derived pores aredistinguishable from the GMB in that they exhibit evidence of dimpling as they impinge onother nearby bubbles. The feature marked “A” is an example of an air or C02 derived pore.GMB, added to adjust density and stiffness, can be difficult to differentiate from thesepores. In Figure 7b, several are identified as “B”. These GMB show no evidence ofdimpling. Rather, they are quite spherical and generally featureless. It is also apparentthat, at the higher magnification of Figure 7b, the GMB particles exhibit evidence of de-bonding from the surrounding matrix. Quantitative size distribution analysis of the poresindicates that the gas derived bubbles have an average diameter of 70 ym while the GMB
average 33 pm in diameter.
-16-
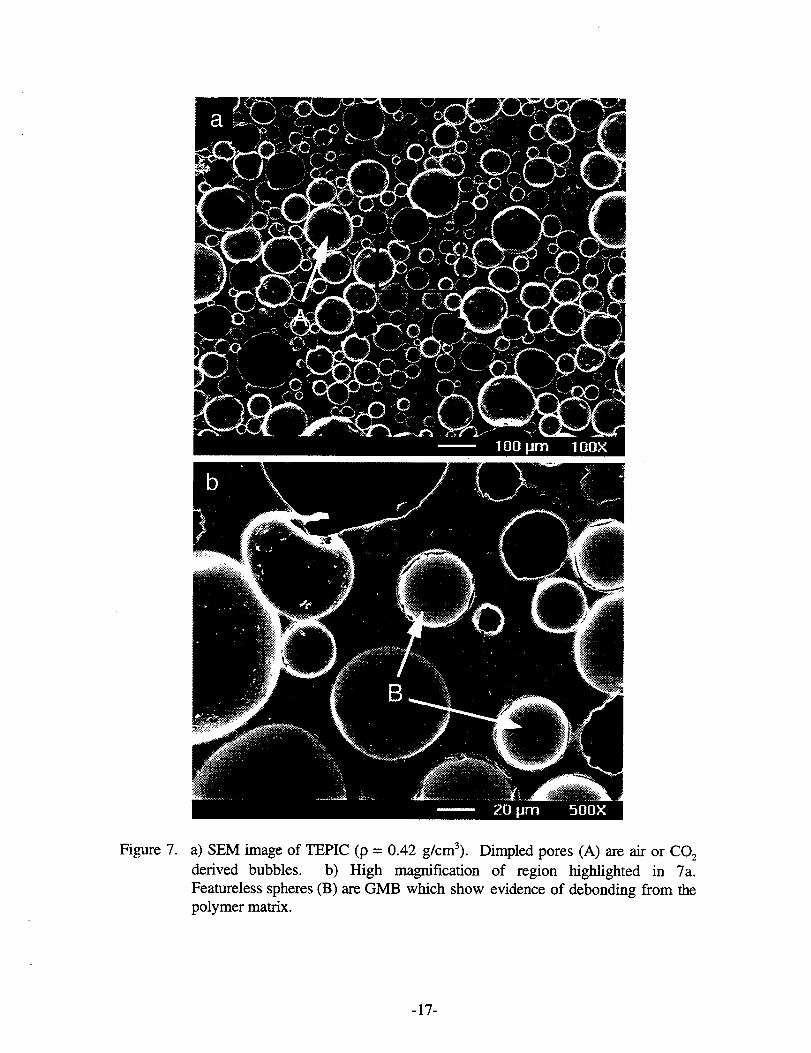
Figlure 7. a) SEM image of TEPIC (p = 0.42 g/cm3). Dimpled pores (A) are airderived bubbles. b) High magnification of region highlightedFeatureless spheres (B) are GMB which show evidence of debonding fipolymer matrix.
orin
ron
co,7a.
n the
-17-
During the development of TEPIC many wwiables were examined and optimized. Much ofour efforts were directed at minimizing void size by changing processing parameters andformulation ratios. As shown in Figure 7, the macrostmcture of TEPIC more closelyresembles a polyurethane blown foam than the APO-BMI syntactic foams (Figure 4).Initial formulations were viscous and trapped large air bubbles upon mixing, resulting invoids larger than 2 mm. The concentration, size, and density of GMB in the formulationwere varied in an attempt to decrease the starting viscosity of the mix. Only a decrease inloading fraction of GMB had a favorable impact on the viscosity. The relativeconcentrations of surfactant, isocyanate, and epoxy were also probed, but no benefit wasobserved over the initial formulation. Different fillers were also examined. Unfortunately,only higher density foams were obtained.
The gel and rise times were shorter than optimal. Initial catalyst levels made the mixturestart to expand within a minute after removal from the mixing blade. This short processingtime resulted in a few, larger pores. Two obvious variables to examine were the catalystlevel and specie. Decreasing the amount of catalyst should slow the gel (and rise) reactionso that the viscosity would increase slowly. By suppressing early gellation, the amount ofmechanically trapped air was expected to be reduced, yielding a more uniform distributionof pore sizes. Several experiments were performed in order to determine the minimumconcentration of TMR-3 and still have acceptable processing characteristics. The finalcatalyst level, indicated in Table 1, was high enough to give a uniform product and lowenough to allow mixing and transfer before substantial expansion and gellation occurred.With regard to the selection of catalyst, TMR-3 is common in the reaction injection molding(RIM) industry and is already the slowest trimerization catalyst commercially available.
One final issue with respect to the effect of catalyst on processing, is the sequence in whichit is added to the mix. In order to delay gellation as long as possible, we add it last afterincorporation of the isocyanurate. This is contrary to conventional polyurethane foamprocessing, where the catalyst is added before the isocyanurate.
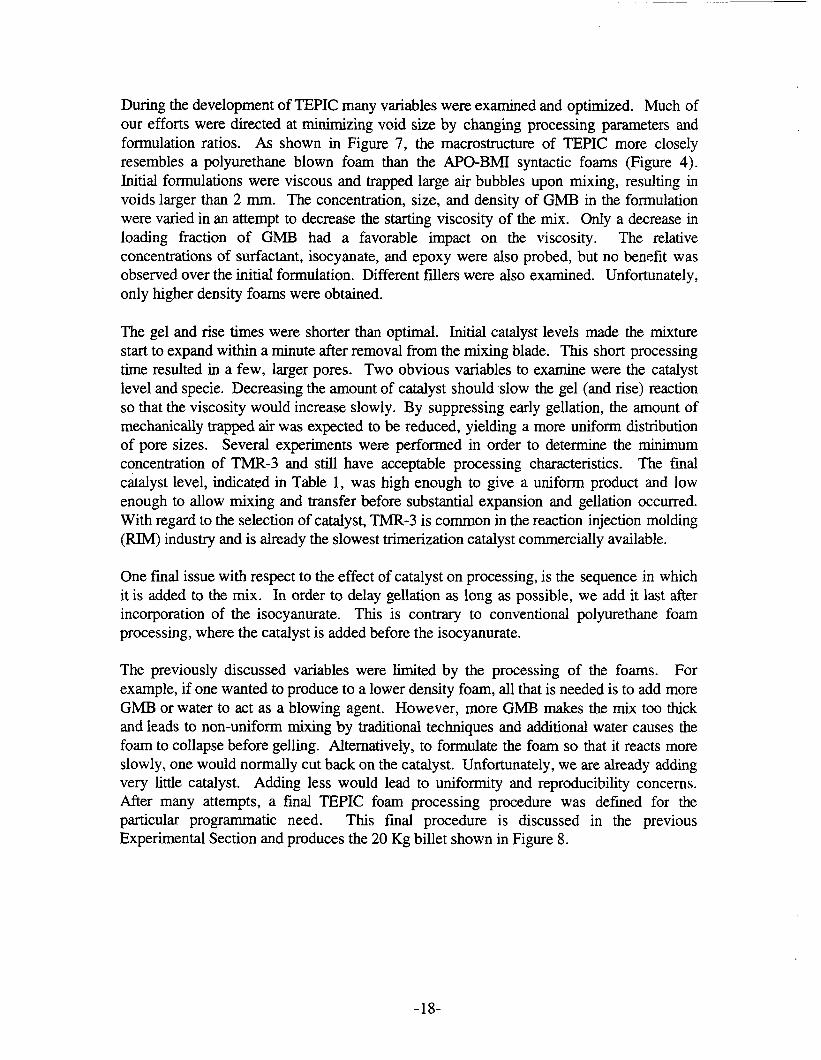
The previously discussed variables were limited by the processing of the foams. Forexample, if one wanted to produce to a lower density foam, all that is needed is to add moreGMB or water to act as a blowing agent. However, more GMB makes the mix too thickand leads to non-uniform mixing by traditional techniques and additional water causes thefoam to collapse before gelling. Alternatively, to formulate the foam so that it reacts moreslowly, one would normally cut back on the catalyst. Unfortunately, we are already addingvery little catalyst. Adding less would lead to uniformity and reproducibility concerns.Ailer many attempts, a final TEPIC foam processing procedure was defined for theparticular programmatic need. This final procedure is discussed in the previousExperimental Section and produces the 20 Kg billet shown in Figure 8.
-18-
Figure 8. A 20 kg billet of TEPIC and a partially machined part.
Although water is not explicitly added to the TEPIC foam formulation, we believe thatresidual water, present in the GM13, polyol and surfactant, contribute significantly to theexpansion of the foam during processing. The remaining foam expansion results fromthermal expansion of entrapped air whipped into the resin during mixing.
Mechanical Properties of Foams
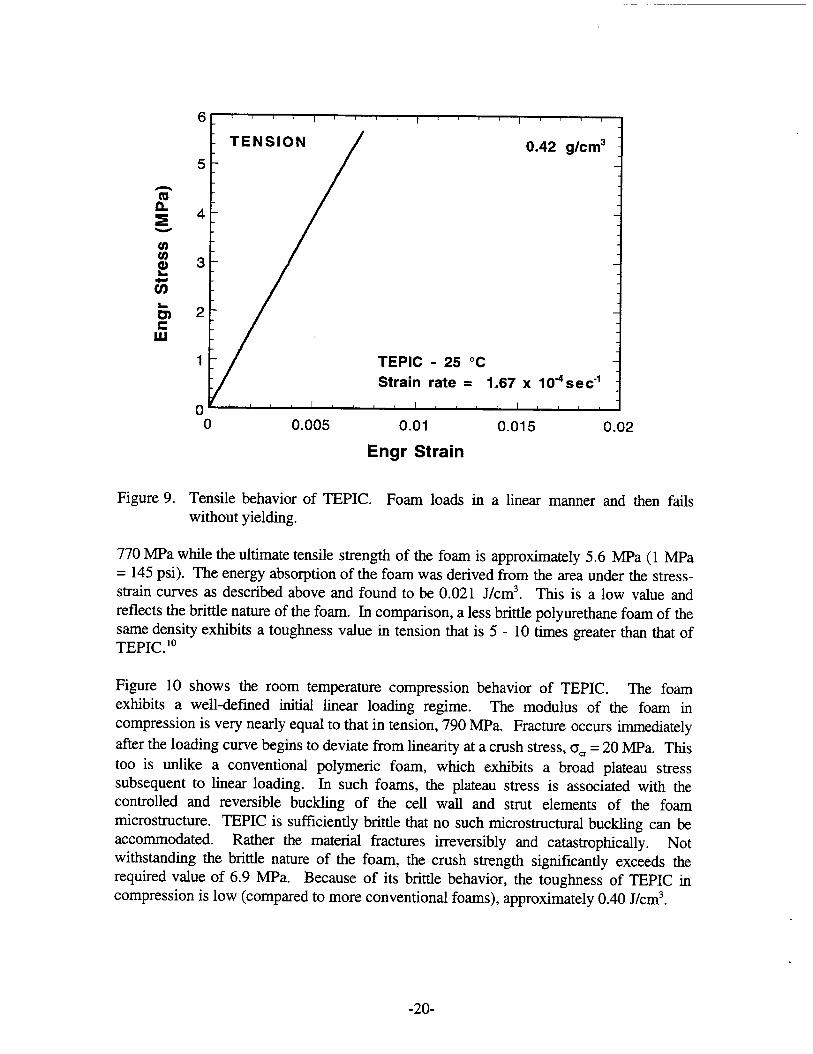
Quasi-static tensionicompression results for TEPIC, 25°CAll specimens tested under quasi-static conditions had a density of 0.42 g/cm3. Figure 9shows the room temperature tensile behavior of TEPIC. While there is no specificperformance requirement for the foam in tension, it is useful to characterize its tensilebehavior, since failure invariably occurs due to the initiation and propagation of cracks inregions of local tension. Further, tensile strength bears directly on the machinability andhandling characteristics of the foam. The foam behaves in a completely brittle manner intension, exhibiting no plastic deformation at all up to the point of fracture. The modulus(defined as the slope of the linear loading portion of the stress strain curve) isapproximately
-19-
6 - , I I I I I
0.42 g/cm35 -
4 -
3 -
2 “
1 - TEPIC - 25 ‘C
Strain rate = 1.67 x 10⁴sec-’
oI I
o 0.005 0.01 0.015 0.02
Engr Strain
Tensile behavior of TEPIC. Foam loads in a linear manner and then failswithout yielding.
770 MPa while the ultimate tensile strength of the foam is approximately 5.6 MPa (1 MPa= 145 psi). The energy absorption of the foam was derived from the area under the stress-strain curves as described above and found to be 0.021 J/cm3. This is a low value andreflects the brittle nature of the foam. In comparison, a less brittle polyurethane foam of thesame density exhibits a toughness value in tension that is 5- 10 times greater than that ofTEPIC. ]O
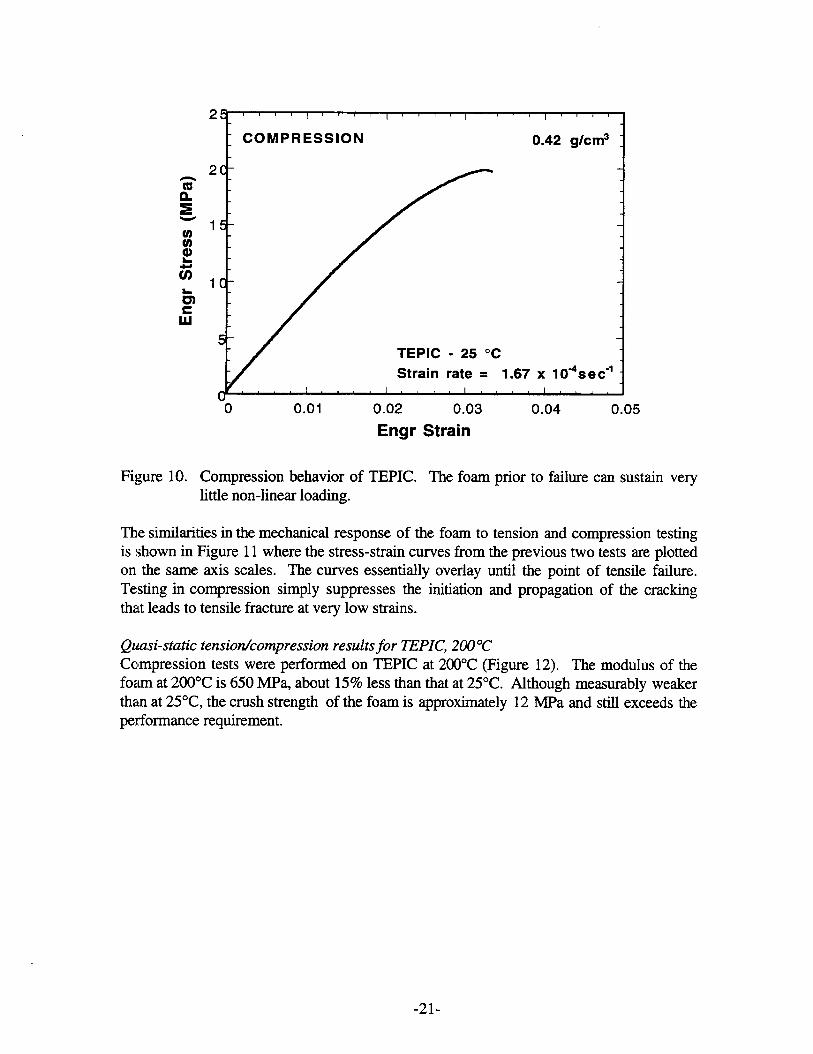
Figure 10 shows the room temperature compression behavior of TEPIC. The foamexhibits a well-defined initial linear loading regime. The modulus of the foam incompression is very nearly equal to that in tension, 790 MPa. Fracture occurs immediately
after the loading curve begins to deviate from linearity at a crush stress, O. = 20 MPa. Thistoo is unlike a conventional polymeric foam, which exhibits a broad plateau stresssubsequent to linear loading. In such foams, the plateau stress is associated with thecontrolled and reversible buckling of the cell wall and strut elements of the foammicrostructure. TEPIC is sui%cient.lybrittle that no such microstructural buckling can beaccommodated. Rather the material fkictures irreversibly and catastrophically. Notwithstanding the brittle nature of the foam, the crush strength significantly exceeds therequired value of 6.9 MPa. Because of its brittle behavior, the toughness of TEPIC incompression is low (compared to more conventional foams), approximately 0.40 J/cm3.
-20-
COMPRESSION 0.42 g/cm3
2C “
15 -
10 -
5 -
Strain rate = 1.67 x 10⁴sec-’ -
-o 0.01 0.02 0.03 0.04 0.05
Engr Strain
Figure 10. Compression behavior of TEPIC. The foam prior to failure can sustain veryMtle non-linear loading.
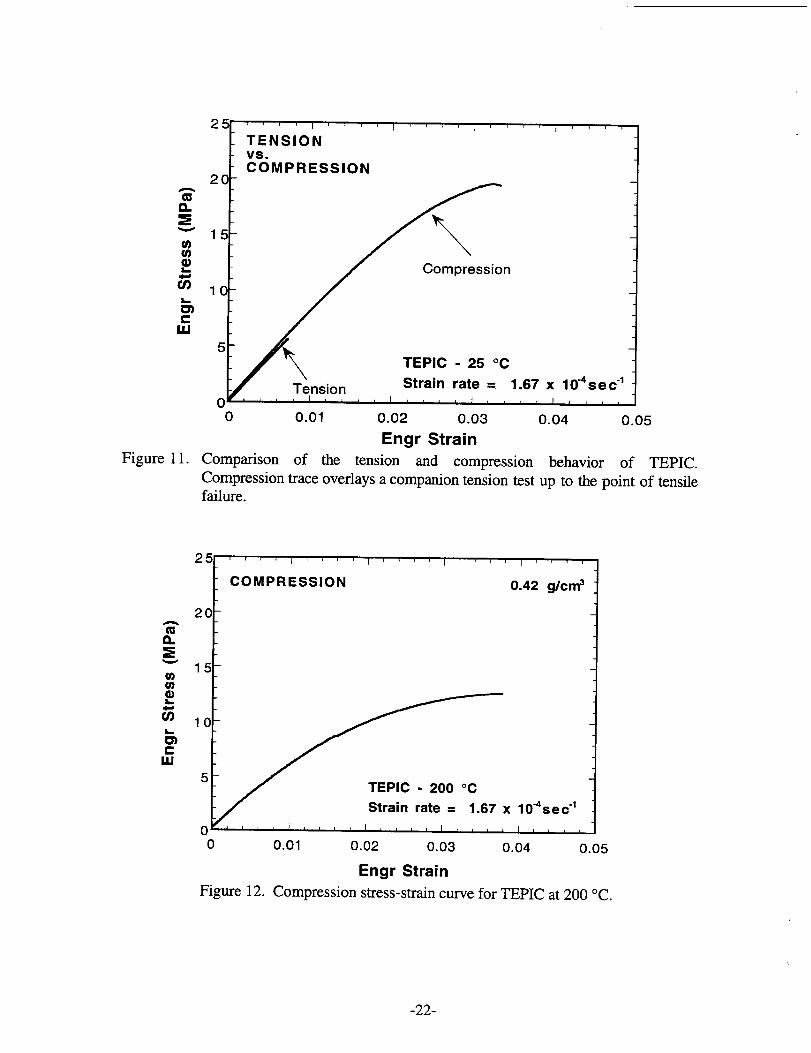
The similarities in the mechanical response of the foam to tension and compression testingis shown in Figure 11 where the stress-strain curves from the previous two tests are plottedon the same axis scales. The curves essentially overlay until the point of tensile failure.Testing in compression simply suppresses the initiation and propagation of the crackingthat leads to tensile fracture at very low strains.
Quasi-static tensionfcompression results for TEPIC, 200”CCompression tests were performed on TEPIC at 200”C (Figure 12). The modulus of thefoam at 200”C is 650 MP& about 15% less than that at 25”C. Although measurably weakerthan at 25”C, the crush strength of the foam is approximately 12 MPa and still exceeds theperformance requirement.
-21-
2 I I I ITENSION ivs. -1
COMPRESSION20 “
15 -
10 -
5-
Strain rate = 1.67 x 10⁴sec-’ -00 0.01 0.02 0.03 0.04 0.05
Engr StrainFigure 11. Comparison of the tension and compression behavior of TEPIC.
Compression trace overlays a companion tension test up to the point of tensilefailure.
COMPRESSION 0.42 g/cm3
1
20 -
15 -
10 - 1
5 -
0 I 1
TEPIC - 200 “C
Strain rate = 1.67 x 10⁴sec-’ /
‘o 0.01 0.02 0.03 0.04 0.05
Engr StrainFigure 12. Compression stress-strain curve for TEPIC at 200 ‘C.
-22-
Comparison of TEPIC Properties to APO-BMI
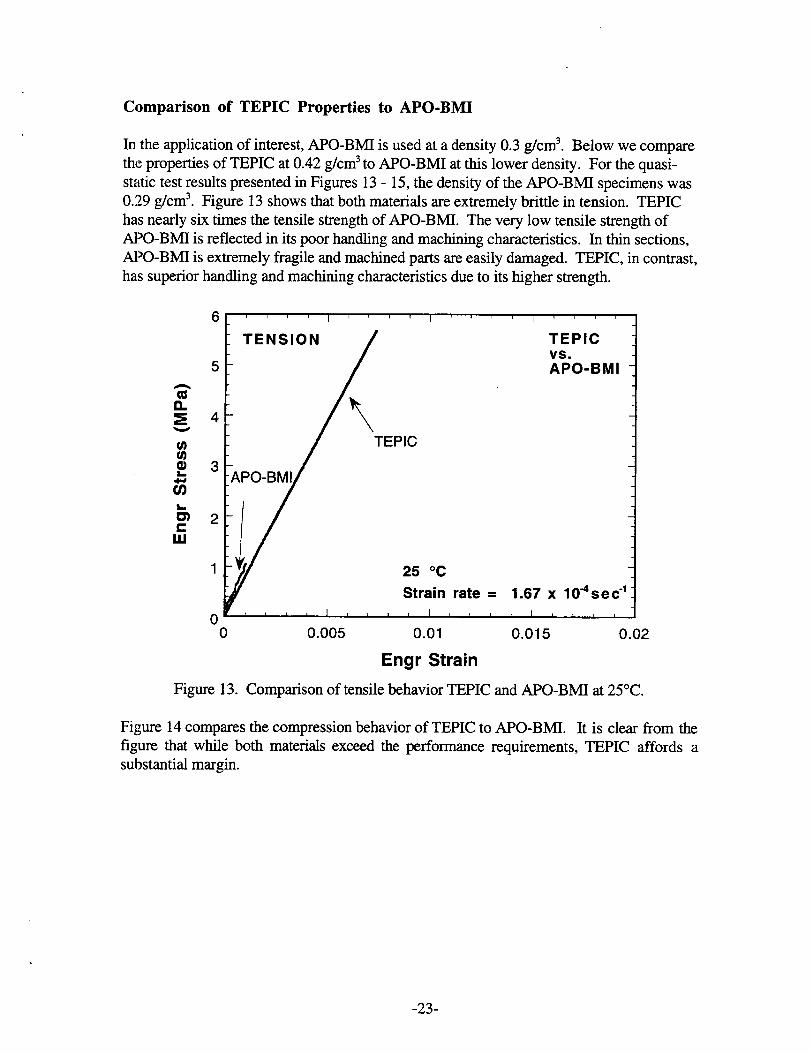
In the application of interest, APO-BMI is used at a density 0.3 g/cm3. Below we comparethe properties of TEPIC at 0.42 g/cm3to APO-BMI at this lower density. For the quasi-static test results presented in Figures 13- 15, the density of the APO-BMI specimens was0.29 g/cm3. Figure 13 shows that both materials are extremely brittle in tension. TEPIChas nearly six times the tensile strength of APO-BMI. The very low tensile strength ofAPO-BMI is reflected in its poor handling and machining characteristics. In thin sections,APO-BMI is extremely fragile and machined parts are easily darnaged. TEPIC, in contrast,has superior handling and machining characteristics due to its higher strength.
61 I I I ,J
5 - APO-BMI :
4 :
3 -‘APO-BMI
2
1
1.67 x 10⁴sec-’.
()-o 0.005 0.01 0.015 0.02
Engr Strain
Figure 13. Comparison of tensile behavior TEPIC and APO-BMI at 25”C.
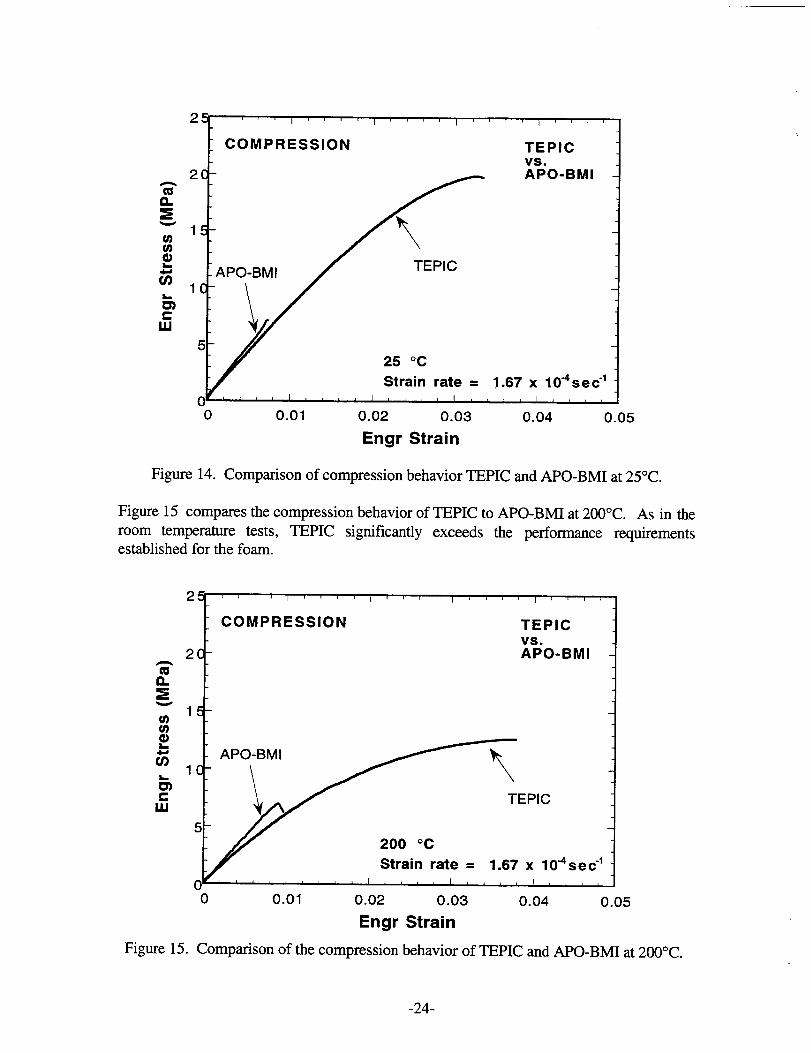
Figure 14 compares the compression behavior of TEPIC to APO-BMI. It is clear from thefigure that while both materials exceed the performance requirements, TEPIC affords asubstantial margin.
-23-
2 I I I IJ
COMPRESSION
2C -
15 -
- APO-BMI1
525 “C
Strain rate =
TEPICvs.APO-BMI
1.67 x 10⁴sec-’ -
or ‘ I I I I 1
0 0.01 0.02 0.03 0.04 0.05
Engr Strain
Figure 14. Comparison of compression behavior TEPIC and APO-BMI at 25°C.
Figure 15 compares the compression behavior of TEPIC to APO-BMI at 200”C. As in theroom temperature tests, TEPIC significantly exceeds the performance requirementsestablished for the foam.
25 I I I i
COMPRESSION TEPICvs.
2C - APO-BMIg
~
u) 15 :tna)
$1
b
z
5
Strain rate = 1.67 x 10⁴sec-’ -
00 0.01 0.02 0.03 0.04 0.05
Engr Strain
Figure 15. Comparison of the compression behavior of TEPIC and APO-BMI at 200”C.
-24-
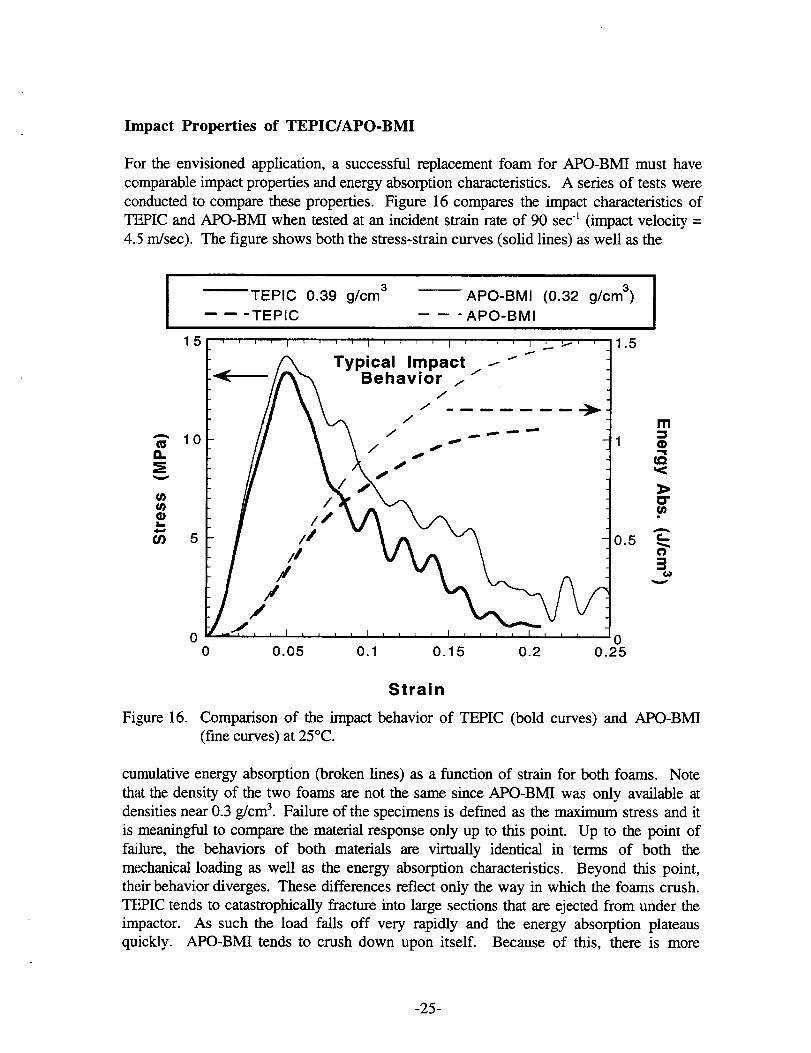
Impact Properties of TEPIC/APO-BMI
For the envisioned application, a successful replacement foam for APO-BMI must havecomparable impact properties and energy absorption characteristics. A series of tests wereconducted to compare these properties. Figure 16 compares the impact characteristics ofTEPIC and APO-BMI when tested at an incident strain rate of 90 see-l (impact velocity =4.,5m/see). The figure shows both the stress-strain curves (solid lines) as well as the
TEPIC 0.39 g/cm3 APO-BMI (0.32 g/cm3)
-- ‘TEPIC – – ‘APO-BMI
15~ I I I >_- J1.5
o0 0.05 0.1 0.15 0.2 0.2-5
Strain
Figure 16. Comparison of the impact behavior of TEPIC (bold curves) and APO-BMI(fine curves) at 25”C.
cumulative energy absorption (broken lines) as a function of strain for both foams. Notet.ht the density of the two foams are not the same since APO-BMI was only available atdensities near 0.3 g/cm3. Failure of the specimens is defined as the maximum stress and itis meaningful to compare the material response only up to this point. Up to the point offailure, the behaviors of both materials are virtually identical in terms of both themechanical loading as well as the energy absorption characteristics. Beyond this point,their behavior diverges. These differences reflect only the way in which the foams crush.TEPIC tends to catastrophically fracture into large sections that are ejected from under theimpactor. As such the load falls off very rapidly and the energy absorption plateausquickly. APO-BMI tends to crush down upon itself. Because of this, there is more
w
-25-
residual material beneath the impactor, and the load tends to fall off more gradually.Neither material, however, has any significant physical integrity beyond the peak stress andcan no longer be considered structural.
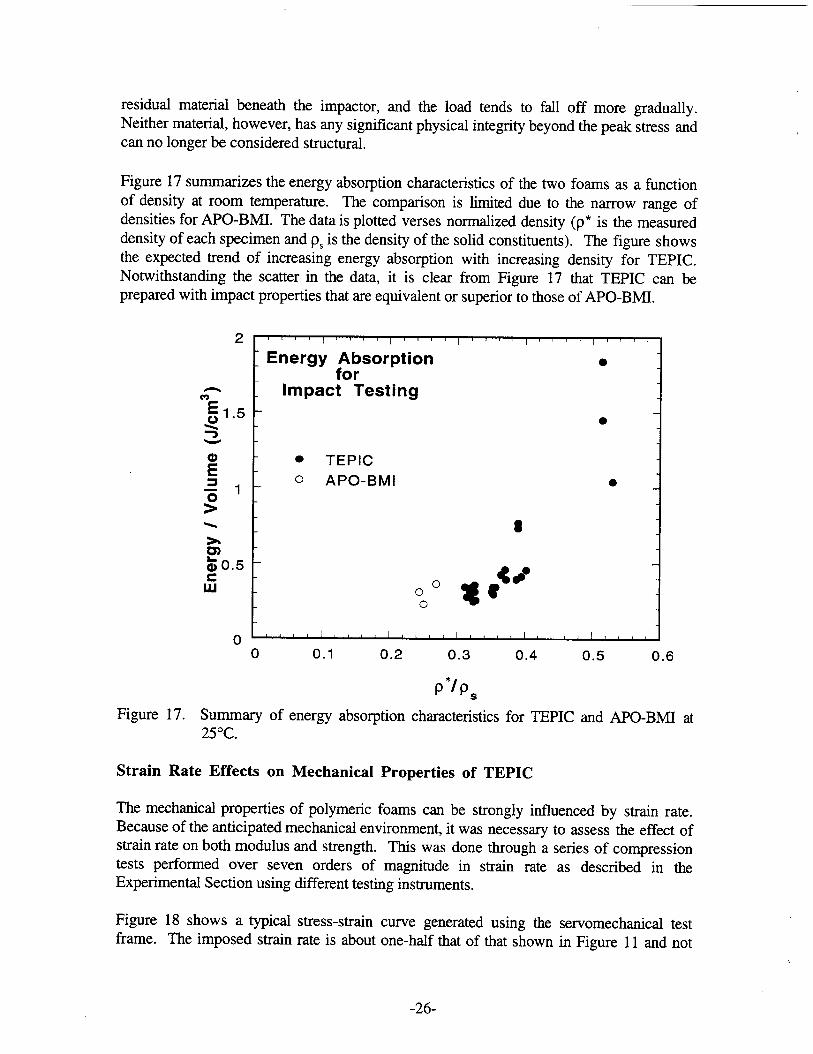
Figure 17 summarizes the energy absorption characteristics of the two foams as a functionof density at room temperature. The comparison is limited due to the narrow range ofdensities for APO-BMI. The data is plotted verses normalized density (p* is the measureddensity of each specimen and p, is the density of the solid constituents). The figure showsthe expected trend of increasing energy absorption with increasing density for TEPIC.Notwithstanding the scatter in the data, it is clear from Figure 17 that TEPIC can beprepared with impact properties that are equivalent or superior to those of APO-BMI.
2
n
%1.57
o
I I I I I
Energy ~::sorption ●
Impact Testing
●
● TEPIC
o APO-BMI ●
8
0 wo0
%8
[ 1 I I I
o 0.1 0.2 0.3 0.4 0.5 0.6
p“lp~
Figure 17. Surnrnary of energy absorption characteristics for TEPIC and APO-BMI at25”C.
Strain Rate Effects on Mechanical Properties of TEPIC
The mechanical properties of polymeric foams can be strongly influenced by strain rate.Because of the anticipated mechanical environment, it was necessary to assess the effect ofstrain rate on both modulus and strength. This was done through a series of compressiontests performed over seven orders of magnitude in strain rate as described in theExperimental Section using different testing instruments.
Figure 18 shows a typical stress-strain curve generated using the servomechanical testframe. The imposed strain rate is about one-half that of that shown in Figure 11 and not
-26-
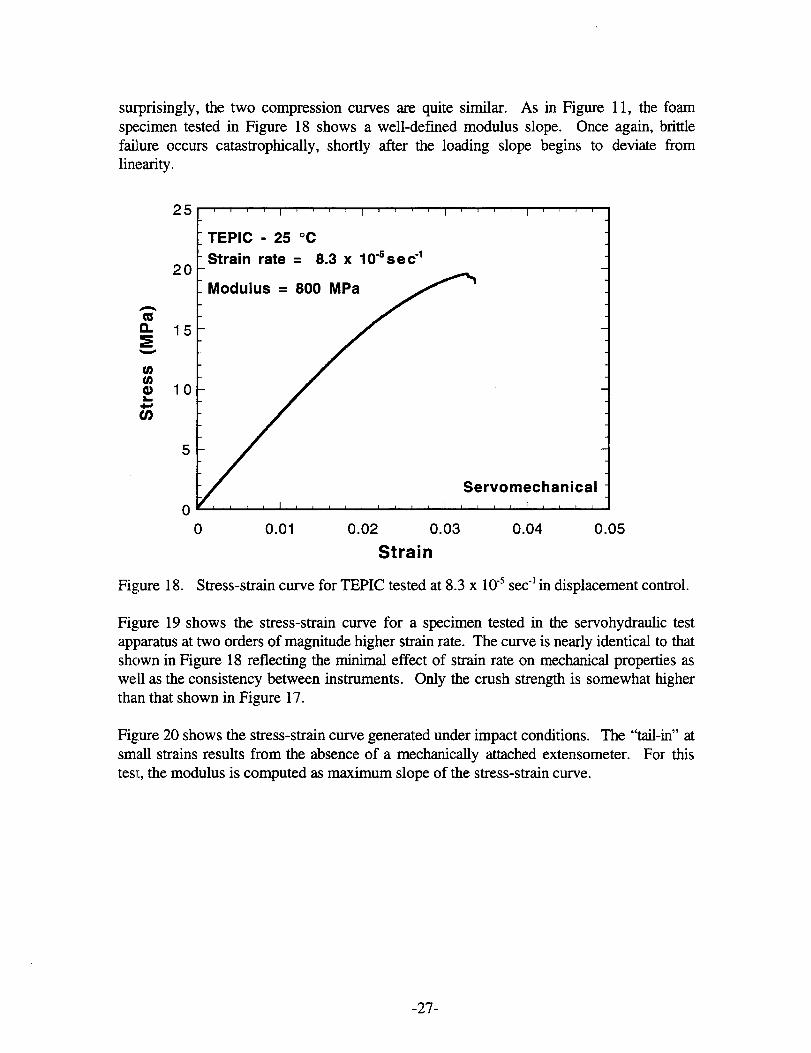
surprisingly, the two compression curves are quite similar. As in Figure 11, the foamspecimen tested in Figure 18 shows a well-defined modulus slope. Once again, brittlefailure occurs catastrophically, shortly after the loading slope begins to deviate fromlinearity.
25 I I I 1
: TEPIC - 25 “C
__ - Strain rate = 8.3 x 10⁵ se c-’20
EModulus = 800
-1
a
5 -
Servomechanical -
0
Figure 18.
0 0.01 0.02 0.03 0.04 0.05
Strain
Stress-strain curve for TEPIC tested at 8.3 x 10⁻⁵see-lin displacement control.
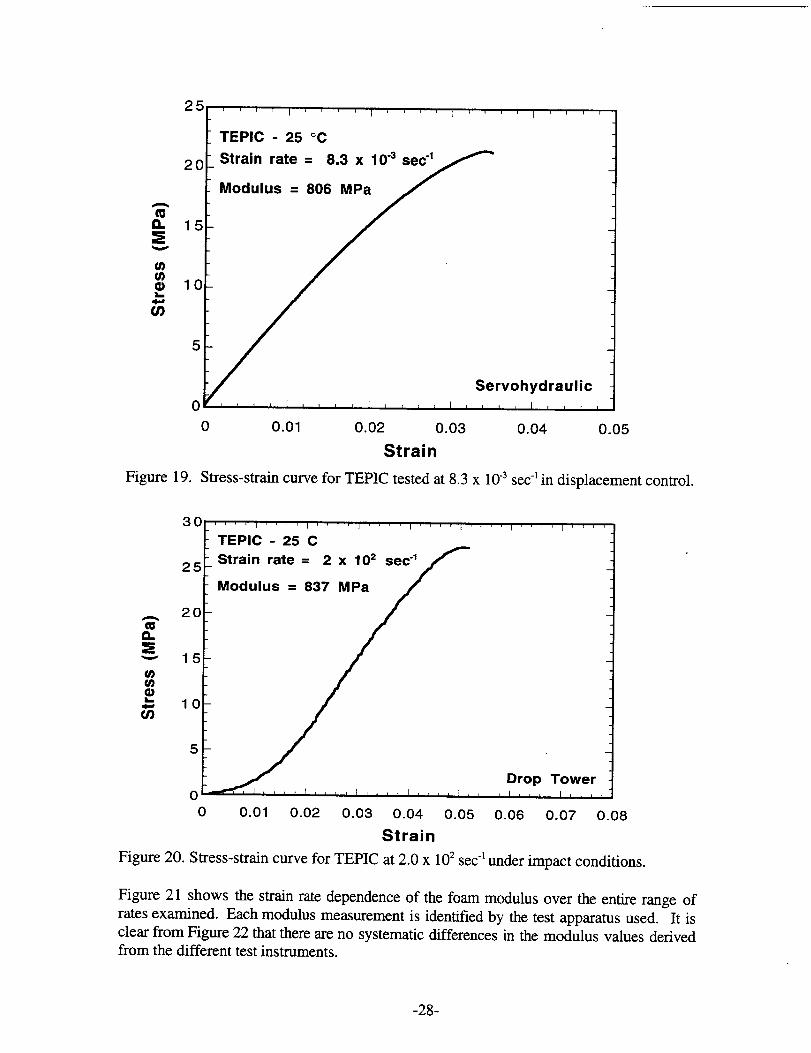
Figure 19 shows the stress-strain curve for a specimen tested in the servohydraulic testapparatus at two orders of magnitude higher strain rate. The curve is nearly identical to thatshc~wnin Figure 18 reflecting the minimal effect of strain rate on mechanical properties aswell as the consistency between instruments. Only the crush strength is somewhat higherthan that shown in Figure 17.
Figure 20 shows the stress-strain curve generated under impact conditions. The “tail-in” atsmall strains results from the absence of a mechanically attached extensometer. For thistest, the modulus is computed as maximum slope of the stress-strain curve.
-27-
25- , I I I I
. TEPIC - 25 “C
20 - Strain rate = 8.3 x 10³ see-’
. Modulus = 806 MPa
15 -
10 -
5 -
0
0 0.01 0.02 0.03 0.04 0.05
Strain
Figure 19. Stress-strain curve for TEPIC tested at 8.3 x 10⁻³see-*in displacement control.
30 I I I I I I 1
- TEPIC - 25 C
25 : Strain rate = 2 x 10² see-l
Modulus = 837 MPa
20 -
15 -
10 -T
1-
5 -
Drop Towero I I I I I
o 0.01 0.02 0.03 0.04 0.05 0.06 0.07 0.08
StrainFigure 20. Stress-strain curve for TEPIC at 2.0x 10²see-lunder impact conditions.
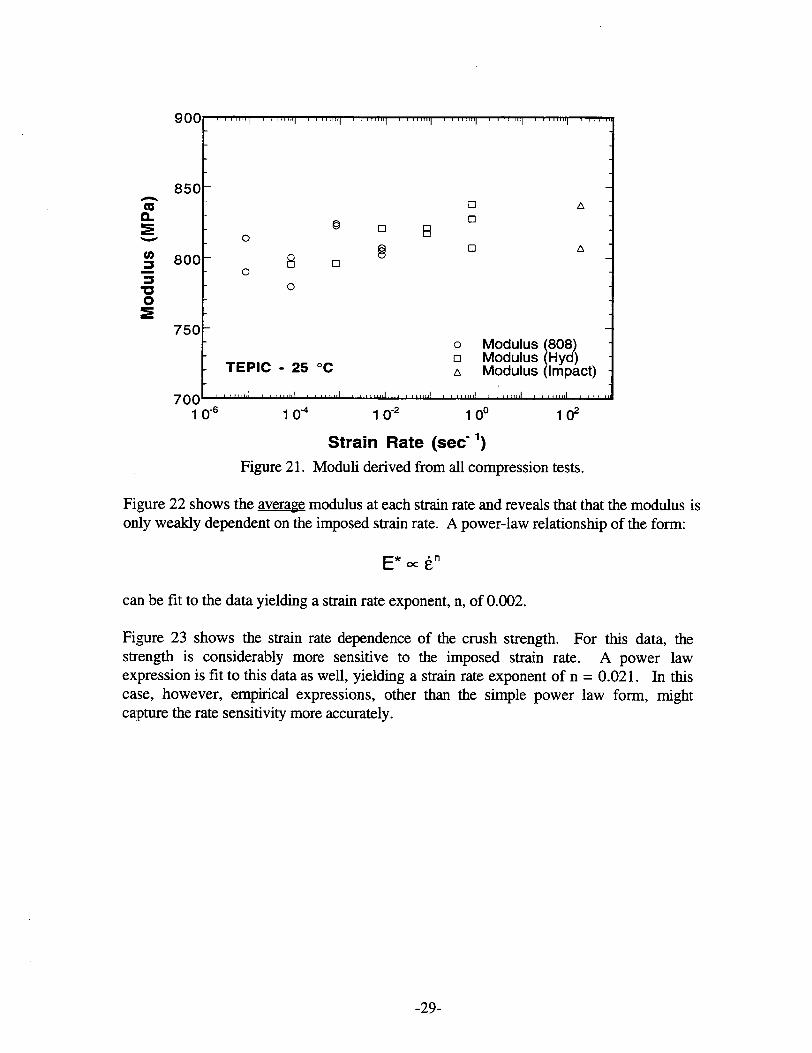
Figure 21 shows the strain rate dependence of the foam modulus over the entire range ofrates examined. Each modulus measurement is identified by the test apparatus used. It isclear from Figure 22 that there are no systematic differences in the modulus values derivedfrom the different test instruments.
-28-
t
850I ❑
-1
L
e ❑o Rn
808❑ A
800 -0
0
750 -0 Modulus 808)•1
TEPIC - 25 ‘C [Modulus Hyd)A Modulus (Impact)
7001 I I I I I I I u
, 0-6 104 , “-2 , “o102
Strain Rate (see-’)
Figure 21. Moduli derived from all compression tests.
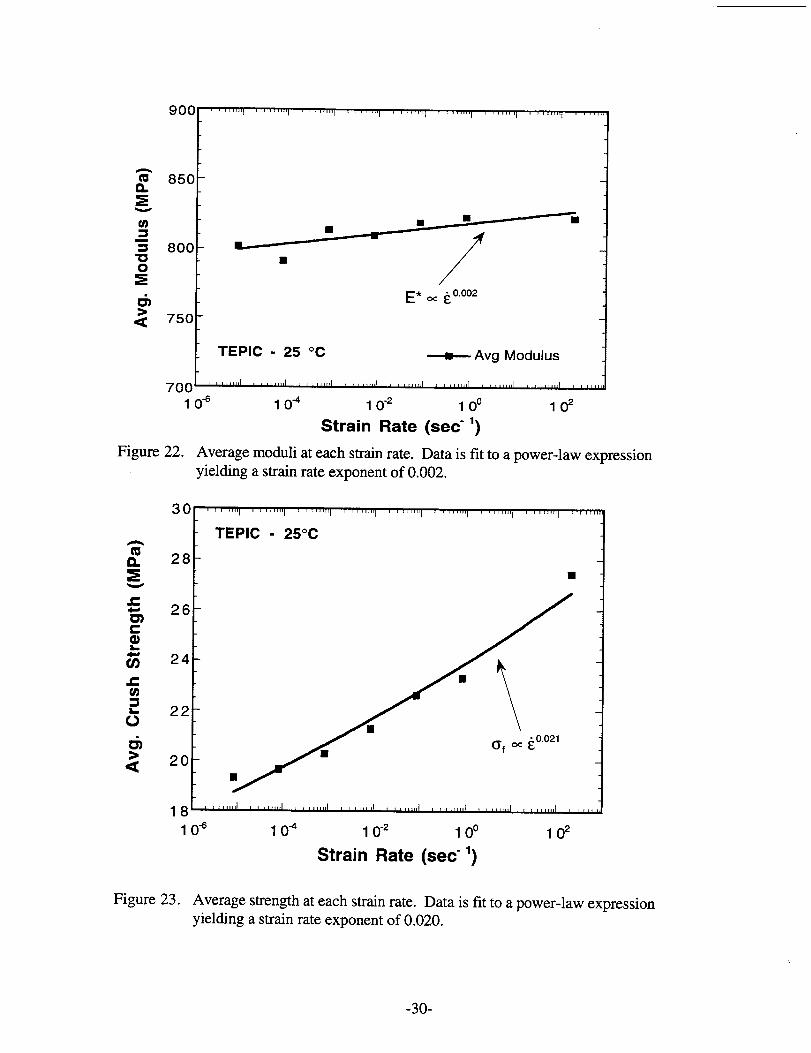
Figure 22 shows the average modulus at each strain rate and reveals that that the modulus isonly weakly dependent on the imposed strain rate. A power-law relationship of the form:
can be fit to the data yielding a strain rate exponent, n, of 0.002.
Figure 23 shows the strain rate dependence of the crush strength. For this data, thestrength is considerably more sensitive to the imposed strain rate. A power lawexpression is fit to this data as well, yielding a strain rate exponent of n = 0.021. In thiscase, however, empirical expressions, other than the simple power law form, mightcapture the rate sensitivity more accurately.
-29-
■■ 9
■
■ 7E, ~ &0.002
TEPIC - 25 ‘C ~ Avg Modulus
700’I I I I I I I I 4
, “-6104 , “-2
10° 102
Strain Rate (see- ‘)
Figure 22. Average moduli at each strain rate. Data is fit to a power-law expression.
yielding a strain rate exponent of 0.002.
30 I I I [ I I I I m
TEPIC - 25°C
28 -■
26 -
24 -
22 “
20-■
18~ ‘ “’’’”iI I I I I I I d
10+ 104 , 0-2 10° let’Strain Rate (see-’)
Figure 23. Average strength at each strain rate. Data is fit to a power-law expressionyielding a strain rate exponent of 0.020.
-30-
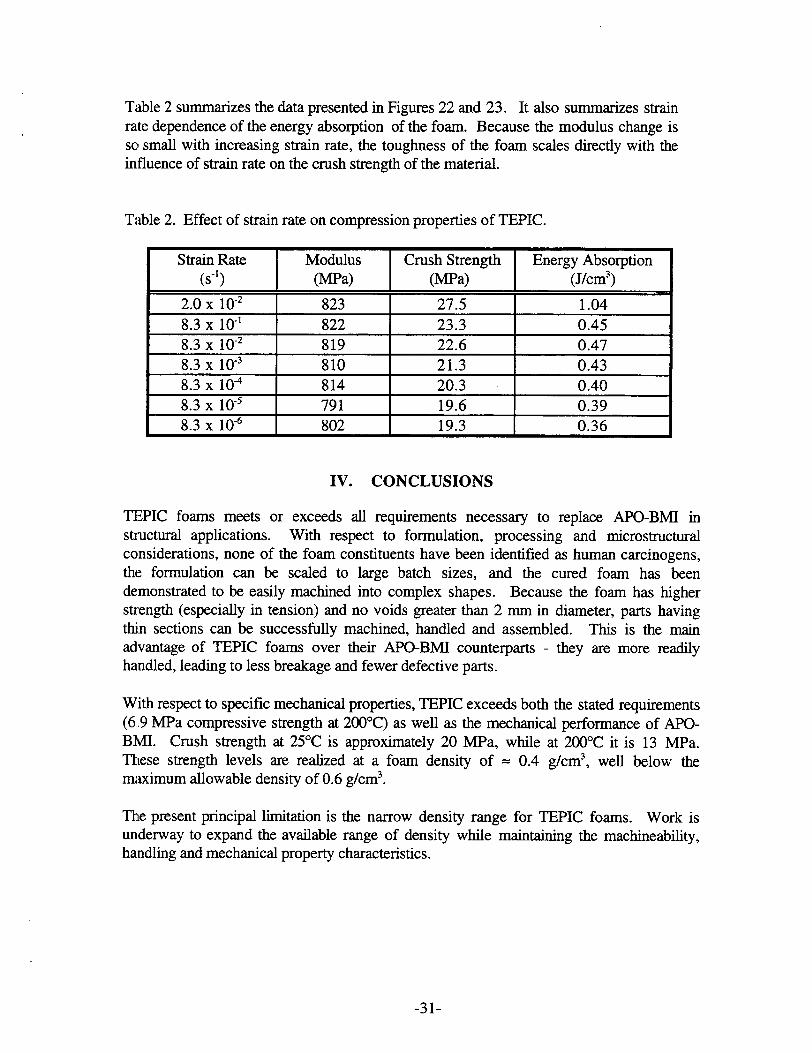
Table 2 summarizes the data presented in Figures 22 and 23. It also summarizes strainrate dependence of the energy absorption of the foam. Because the modulus change isso small with increasing strain rate, the toughness of the foam scales directly with theinfluence of strain rate on the crush strength of the material.
Table 2. Effect of strain rate on compression properties of TEPIC.
Strain Rate Modulus Crush Strength Energy Absorption(s-’) (MPa) (MPa) (J/cm3)
2.0 x 10⁻² 823 27.5 1.048.3 X 10-* 822 23.3 0.458.3 X 10-2 819 22.6 0.478.3 X 10-3 810 21.3 0.438.3 X 10-4 814 20.3 0.408.3 X 105 791 19.6 0.398.3 X 10-6 802 19.3 0.36
IV. CONCLUSIONS
TEPIC foams meets or exceeds al requirements necessary to replace APO-BMI instructural applications. With respect to formulation, processing and rnicrostructuralconsiderations, none of the foam constituents have been identified as human carcinogens,the formulation can be scaled to large batch sizes, and the cured foam has beendemonstrated to be easily machined into complex shapes. Because the foam has higherstrength (especially in tension) and no voids greater than 2 mm in diameter, parts havingthin sections can be successfully machined, handled and assembled. This is the mainadvantage of TEPIC foams over their APO-BMI counterparts - they are more readilyhandled, leading to less breakage and fewer defective parts.
With respect to specific mechanical properties, TEPIC exceeds both the stated requirements(6,9 MPa compressive strength at 200”C) as well as the mechanical performance of APO-BMI. Crush strength at 25°C is approximately 20 MPa, while at 200”C it is 13 MPa.These strength levels are realized at a foam density of = 0.4 g/cm3, well below themaximum allowable density of 0.6 g/cm3.
The present principal limitation is the narrow density range for TEPIC foams. Work isunderway to expand the available range of density while maintaining the machinability,handling and mechanical property characteristics.
-31-
REFERENCES
1. D. R. Jtieson, Find Repoti, Allied Signd-Kasas City Division, BDX-6l3-l48O,1977.
2. D. R. Jamieson, Topical Report, Allied Signal-Kansas City Division, BDX-613-1854,1977.
3. A. Young, Topical Report, Allied Signal-Kansas City Division, BDX-613-1886,1977.
4. D. A. Spieker, Final Report, Kansas City Division, KCP-613-4848, 1992.5. D. R. Jarnieson, Final Report, Allied Signal-Kansas City Division, BDX-613-2713,
1983.6. D. R. Jamieson, Final Report, Allied Signal-Kansas City Division, BID-A032, 1980.7. D. R. Jamieson, Topical Report, Allied Signal-Kansas City Division, BDX-613-3476,
1986.8. D. J. Wolfe, Final Report, Allied Signal-Kansas City Division, BID-A656, 1980.9. G. Oertel, Polyurethane Handbook, 2ndEdition, Hanser Publishers, New York,
1994.10. S. H. Goods, C. L. Neuschwanger, C. Henderson and D. M. Skala, J. Appl. Polymer
Sci., 68:1045, 1998
-32-
DISTRIBUTION:
5
4
2
2
1
1
111111111
Hewlett-Packard CompanyAttn: Cari Neuschwanger1501 Page Mill Road, MS 5L-Cpalo Alto, CA 94304-1126
Allied Signal, Inc.Federal Manufacturing & Technologies Division (FM&T)Attn: George McEachen
Dave Spieker,DlMB32C43E.Grotheer,D/MB32C43Patricia Wilson
P. O. Box 419159Kansas City, MO 64141-6159
Los Alamos National LziboratoriesAttn: J. E. Coons, MS C930
C. G. Sandoval, MS F602P. O. BOX1663LOSAkiIllOS,NM 87545
Lawrence Livermore National LaboratoryAttn: J. D. LeMay, L-092
G. B. Ba.hzs, L-092P. O. Box 808Livermore, CA 94550
Martin Energy SystemsOak Ridge National LaboratoryAttn: Lisa ThompsonP. O. BOX2008Oak Ridge, TN 37831-6285
Atomic Wapons EstablishmentAttn: Norman R. GodfreyAldermastonReading, BerksEngland RG74PRUNITED KINGDOM
MS0367 R. S. Saunders, 1815MS0367 P. B. Rand, 1815MS0443 M. K. Neilsen, 9117MS0834 A. M. Kraynik,9112MS0834 M. L. Hobbs, 9112MS0925 R. L. Myers, 1472MS0958 C. J. Adkins, 1472MS0958 J. A. Emerson, 1472MS0958 M. W. Donnelly, 1472
-33-
11111311111111011
[101
1
1
311
2
MS0958MS0961MS1407MS1407MS1407MS9021MS9036MS9036MS9042MS9042MS9102MS9403MS9403MS9403MS9405MS9405MS9405MS9405MS9405MS9405
MS9405MS9042MS9042MS9042MS9043MS9161MS9161MS9402MS9405
MS9420MS9133MS9409MS9409MS9430MS9430
MS9018MS0899MS9021
MS9021
T. R. Guess, 1472J. A. Sayre, 1403J. H. Aubert, 1815R. J. Salzbrenner, 1805T. A. Ulibarri, 1811W. Carter,8815D. Neustel, 2254M. Hinkley, 2254D. Handrock, 8742W. Y. Lu, 8746M. Perra, 8402M. I. Baskes, 8712M. L. Tootle, 8712S. H. Goods, 8712C. Henderson, 8230D. Skala, 8230J. M. Hruby, 8230L. Domeier, 8230L. Whirmery, 8230P. Kiefer, 8230
T. M. Dyer, 8700Attn E-R Chen, 8742
G. J. Thomas, 8715W. A. Kawahara, 8746J. C. F. Wang, 8713K. L. Wilson, 8716S. M. Foiles, 8717C. M. Hartwig, 8701P. N. Nielan, 8743
L. A. West, 8200Attn: B. Affeldt, 8210
C. Oien, 8260G. Kubiak, 8250A. J. West, 8240L. N. Tallerico, 8204
Central Technical Files, 8940-2Technical Library, 4916Technical Communications Department, 8815/Technical Library, MS0899, 4916Technical Communications Department, 8815 for DOE/OSTI
-34-