san jose sustainability cee22x final presentation
TRANSCRIPT
San Jose GHG Inventory Model
Elizabeth Bernal & Emmanuel Assa
Agenda
● Project Overview
● San Jose’s Sustainability Goals
● Review of AECOM Report
● Review of Other Cities’ GHG Inventories
● Discussion and Takeaways for San Jose
● Our Model: a summary
● Our Plan Going Forward: The Next Two Quarters
● Questions?

Project Overview
● Collaboration between Stanford and San Jose● Work together to create a model of city GHG emissions that will benefit San
Jose for years to come and serve as a model for other cities● Goal: Create an GHG emissions dashboard for the city to better visualize city
emissions and inform policy choices.● Our first steps:
○ Reviewing San Jose’s sustainability goals○ Study of San Jose and benchmark cities’ current progress○ Designing a model base for data collection

San Jose Sustainability Goals
San José has a vision for both a smart city and a green city
● San José Green Vision → Environmental Sustainability Plan (ESP)● Smart City Vision● USA Sustainable Cities Initiative - UN Sustainable Development Goals
We see our project contributing to these initiatives by helping track and model emissions to inform policy within the city. Specifically, to aid the city in creating a new ESP in the beginning of 2017.

Previous Work: AECOM 2014 Report
Goals of the Report: ● Inventory of San Jose GHG emissions in 2014● Visualize consumption via graphs and charts
Methodology● Breaks down data by source: Transportation, Buildings, Potable Water, Wastewater
Treatment, and Solid Waste
Data Sources● Report collects data from PG&E, various city departments, and larger government
entities (e.g. the Association of Bay Area Governments)

Sectorization of Emissions
1. Energy type--electricity and natural gas2. Mobile sources
a. On-road vehiclesb. Off-road vehicles and equipment
3. Wastewater treatment4. Solid Waste5. Potable Water (negligible)
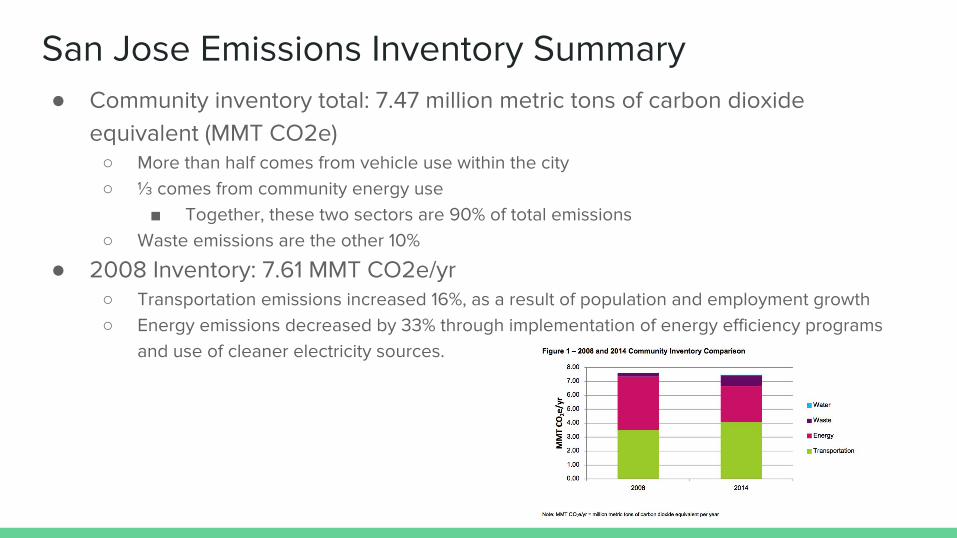
San Jose Emissions Inventory Summary● Community inventory total: 7.47 million metric tons of carbon dioxide
equivalent (MMT CO2e)○ More than half comes from vehicle use within the city○ ⅓ comes from community energy use
■ Together, these two sectors are 90% of total emissions○ Waste emissions are the other 10%
● 2008 Inventory: 7.61 MMT CO2e/yr○ Transportation emissions increased 16%, as a result of population and employment growth○ Energy emissions decreased by 33% through implementation of energy efficiency programs
and use of cleaner electricity sources.

AECOM Key Findings
1. GHG emissions have decreased by approximately 2% community-wide since 2008.
2. This level indicates that the city has been able to accommodate residential and employment growth more efficiently.
3. Fewer emissions have been generated per unit of growth.4. Based on this progress, the city is on track to meet its own and the State’s
GHG emission reduction target for 20205. Transportation a potential focus point for future policy
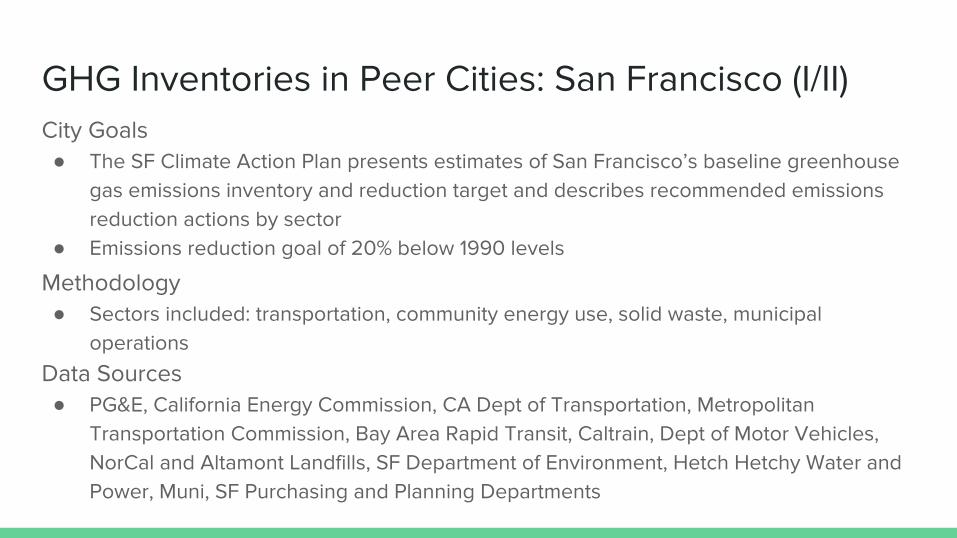
GHG Inventories in Peer Cities: San Francisco (I/II)City Goals● The SF Climate Action Plan presents estimates of San Francisco’s baseline greenhouse
gas emissions inventory and reduction target and describes recommended emissions reduction actions by sector
● Emissions reduction goal of 20% below 1990 levels
Methodology● Sectors included: transportation, community energy use, solid waste, municipal
operations
Data Sources● PG&E, California Energy Commission, CA Dept of Transportation, Metropolitan
Transportation Commission, Bay Area Rapid Transit, Caltrain, Dept of Motor Vehicles, NorCal and Altamont Landfills, SF Department of Environment, Hetch Hetchy Water and Power, Muni, SF Purchasing and Planning Departments

GHG Inventories in Peer Cities: San Francisco (II/II)
Strengths
● Extrapolates existing data effectively to fill holes left by unavailable data.
● Comprehensive and vast use of data sources from both the public and private sector
● Able to disaggregate data according to consumption based sectors
Weaknesses
● For our project, some of the methods necessary to estimate data will not be available.

GHG Inventories in Peer Cities: Los Angeles (I/II)City Goals● Reduce L.A.’s greenhouse gas emissions by 45% by 2025, 60% by 2035, and 80% by
2045 using the 1990 baseline.● pLAn presents a vision for long-term outcomes over next two decades in 14 key aspects
of environment, economy, and measures of social equity.
Methodology● Sectors included: energy (residential, commercial, industrial, other), transportation
(on-road, railways, harbor craft, off-road), and waste (solid and water waste)
Data Sources● Los Angeles Bureau of Sanitation Climate inventory with AECOM
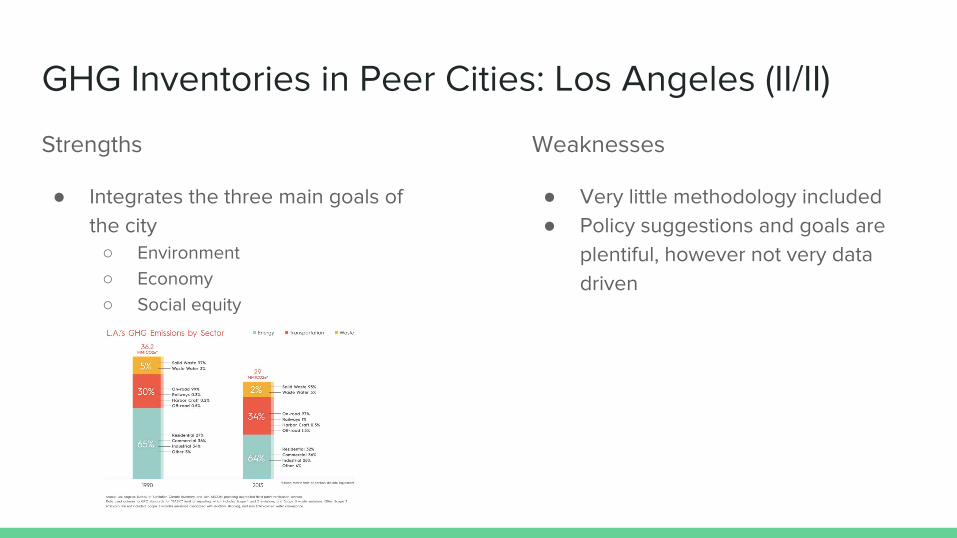
GHG Inventories in Peer Cities: Los Angeles (II/II)
Strengths
● Integrates the three main goals of the city
○ Environment○ Economy ○ Social equity
Weaknesses
● Very little methodology included● Policy suggestions and goals are
plentiful, however not very data driven

GHG Inventories in Peer Cities: New York (I/II)City Goals● Main goal is “80x50,” an overall goal of reducing New York’s energy consumption by
80% of 2005 levels by 2050
Methodology● Two initial sub-inventories: city-wide (includes everything) and government (only includes
public emissions)● Divided emissions into stationary, transportation, and waste sources● Also broke down data by fuel/energy type (electricity, natural gas, etc.)
Data Sources● Prominent sources include New York MTA, ConEdison, National Grid, Department of
Sanitation, the Port Authority, NY Dept. of Environmental Protection

GHG Inventories in Peer Cities: New York (II/II)
Strengths● Sector and fuel source breakdown● Tracking over time component● Detailed and data-driven
Weaknesses● Current policies mostly limited to
public buildings

GHG Inventories in Peer Cities: Boston (I/II)
City Goals● Long term: “80x50” goal of reducing emissions by 80% of 2005 levels by 2050● Short-term: “25x20” goal of reducing emissions by 25% of 2005 levels by 2020
Methodology● Divided emissions into Residential, Commercial/Industrial, and Transportation sectors● Also divide by fuel/energy type (electricity, natural gas, methane, etc.)● Often estimated using proportions when direct data was not available
Data Sources● Private companies like NStar and National Grid, state data from EIA of U.S. Census
adjusted by Boston’s relative size, and direct data from city departments and Massachusetts Bay Transportation Authority (MBTA)

GHG Inventories in Peer Cities: Boston (II/II)
Strengths● Results traced over time● Provides detailed methodology for
calculations /estimates
Weaknesses● A large amount of data is estimated● Lack of detail due to lack of
substantial data

Comparison of Emission Reduction GoalsCity Most Recent
Inventory and YearFirst Emissions Reduction Target
Second Emissions Reduction Target
Third Emissions Reduction Target
San Jose 2008: 7.62 MMT CO2e/yr
Reduce to 1990 level by 2020, 15% below 2008
Through 2040, retain 2020 level
80% below 1990 levels by 2050
San Francisco 2002: 9.8 MMT CO2e/yr
20% of 1990 level by 2012
80% below 1990 levels by 2050
--
Los Angeles 1990: 36.2 MMT CO2e/yr
45% of 1990 level by 2025
60% of 1990 level by 2035
80% of 1990 level by 2050
Boston 2013: 6.1 MMT CO2e/yr (18% lower than 2005)
25% of 2005 levels by 2020
80% of 2005 levels by 2050
--
New York 2014: 49.1 MMT CO2e/yr
80% of 2005 levels by 2050
-- --

Takeaways for San Jose
● Goal Reflection○ San Jose’s goals are on-track with its size and growth○ With the addition of specific benchmarks, San Jose is well-positioned for a sustainable future○ AECOM emissions inventory uses comprehensive, clear, and concise methodology
● Potential improvements○ Closer alignment with UN Sustainability goals, as this is an opportunity to stand out
internationally○ Make sub-goals specific to the needs and visions of each department.○ More alignment with other city goals such as affordable housing, public transportation, high
density housing and growth, etc.

Our Proposed Model: Overview
● Taking the best and pushing it one step further● Adjusted breakdown sectors: consumption focus
○ Residential, Commercial/industrial, and public consumption
● Data Gathering○ Re-tracing AECOM’s steps, with additional specificity○ Putting data into visualization-friendly spreadsheet
● Adding an extra dimension: Geospatial view○ By overlaying a map of San Jose with our data, we can further break down emissions○ Ability to isolate zones for policy efforts


Our Proposed Model: Key Qualities
● Visual○ Our model will convey the results of our inventory in a colorful and visually appealing way○ It will allow the City to communicate more effectively both across departments and with the
community
● Interactive○ People will be able to easily adjust the model in order to visualize effects that policy changes
would have on city emissions
● Geospatial○ By breaking down San Jose into different zones, we can isolate specific areas for improvement
(e.g. Residential or commercial area-specific policy decisions)
Looking Ahead: Plan for the Next Quarters
● Winter Quarter○ Continue Collecting data○ Use methodologies gathered to create the model
■ Use GIS to create a dashboard that will model emissions by location and sector in the city.■ Hopefully create a feature where inputs can be changed to estimate how specific
reductions driven by policy and planning will impact emissions level.
● Spring Quarter○ Finalize the model.○ Use it to inform sustainability goals and future policy decisions.

Questions?