san francisco residential dec 2010 dec 2012
DESCRIPTION
TRANSCRIPT
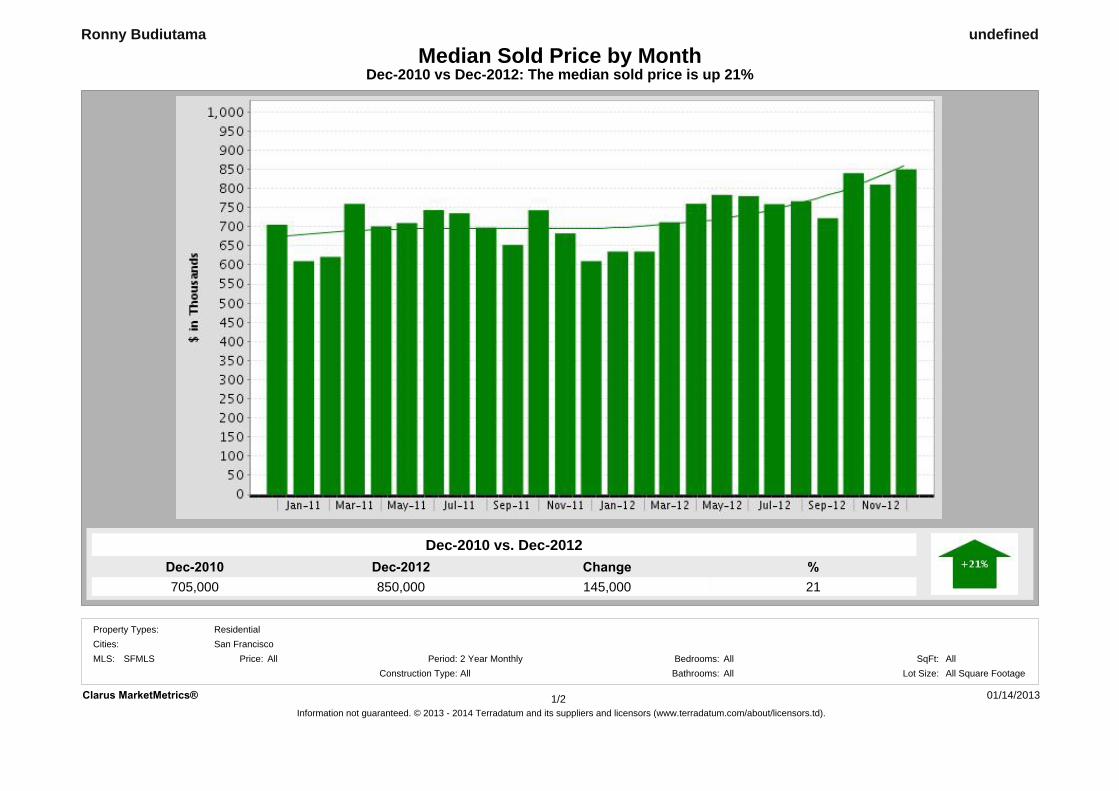
Dec-2012850,000
Dec-2010705,000
%21
Change145,000
Dec-2010 vs Dec-2012: The median sold price is up 21%Median Sold Price by Month
undefined
Dec-2010 vs. Dec-2012
Ronny Budiutama
Clarus MarketMetrics® 01/14/2013Information not guaranteed. © 2013 - 2014 Terradatum and its suppliers and licensors (www.terradatum.com/about/licensors.td).
1/2
MLS: SFMLS Bedrooms:AllAll
Construction Type:All2 Year Monthly SqFt:
Bathrooms: Lot Size:All All Square FootagePeriod:All
Cities:Property Types: Residential
San FranciscoPrice:
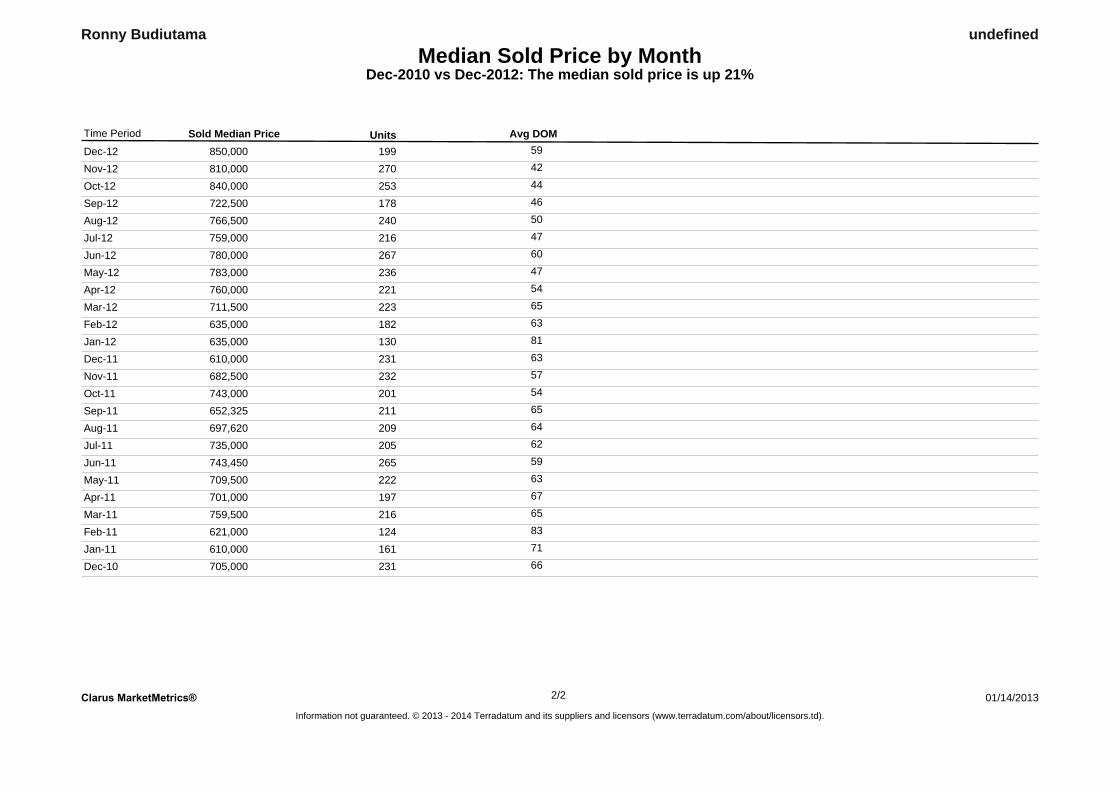
Median Sold Price by MonthDec-2010 vs Dec-2012: The median sold price is up 21%
undefinedRonny Budiutama
Sold Median Price Units Avg DOMTime Period
Dec-12 850,000 199 59
Nov-12 810,000 270 42
Oct-12 840,000 253 44
Sep-12 722,500 178 46
Aug-12 766,500 240 50
Jul-12 759,000 216 47
Jun-12 780,000 267 60
May-12 783,000 236 47
Apr-12 760,000 221 54
Mar-12 711,500 223 65
Feb-12 635,000 182 63
Jan-12 635,000 130 81
Dec-11 610,000 231 63
Nov-11 682,500 232 57
Oct-11 743,000 201 54
Sep-11 652,325 211 65
Aug-11 697,620 209 64
Jul-11 735,000 205 62
Jun-11 743,450 265 59
May-11 709,500 222 63
Apr-11 701,000 197 67
Mar-11 759,500 216 65
Feb-11 621,000 124 83
Jan-11 610,000 161 71
Dec-10 705,000 231 66
Clarus MarketMetrics® 01/14/2013Information not guaranteed. © 2013 - 2014 Terradatum and its suppliers and licensors (www.terradatum.com/about/licensors.td).
22/
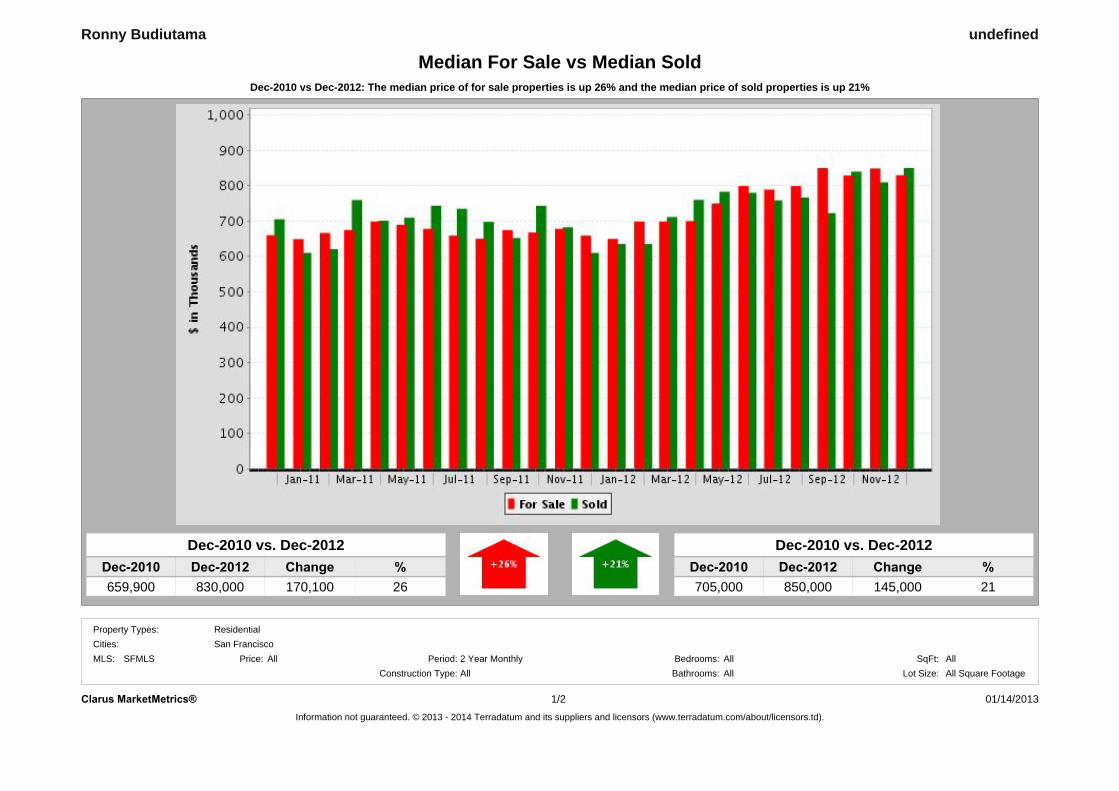
Dec-2010 vs Dec-2012: The median price of for sale properties is up 26% and the median price of sold properties is up 21%
undefined
Dec-2010 vs. Dec-2012
659,900 26
Ronny Budiutama
830,000Dec-2012
Median For Sale vs Median Sold
ChangeDec-2010 %170,100
Dec-2010 Dec-2012 %705,000 21
Dec-2010 vs. Dec-2012
850,000Change145,000
Clarus MarketMetrics® 01/14/2013Information not guaranteed. © 2013 - 2014 Terradatum and its suppliers and licensors (www.terradatum.com/about/licensors.td).
1/2
MLS: SFMLS Bedrooms:AllAll
Construction Type:All2 Year Monthly SqFt:
Bathrooms: Lot Size:All All Square FootagePeriod:All
Cities:Property Types: Residential
San FranciscoPrice:
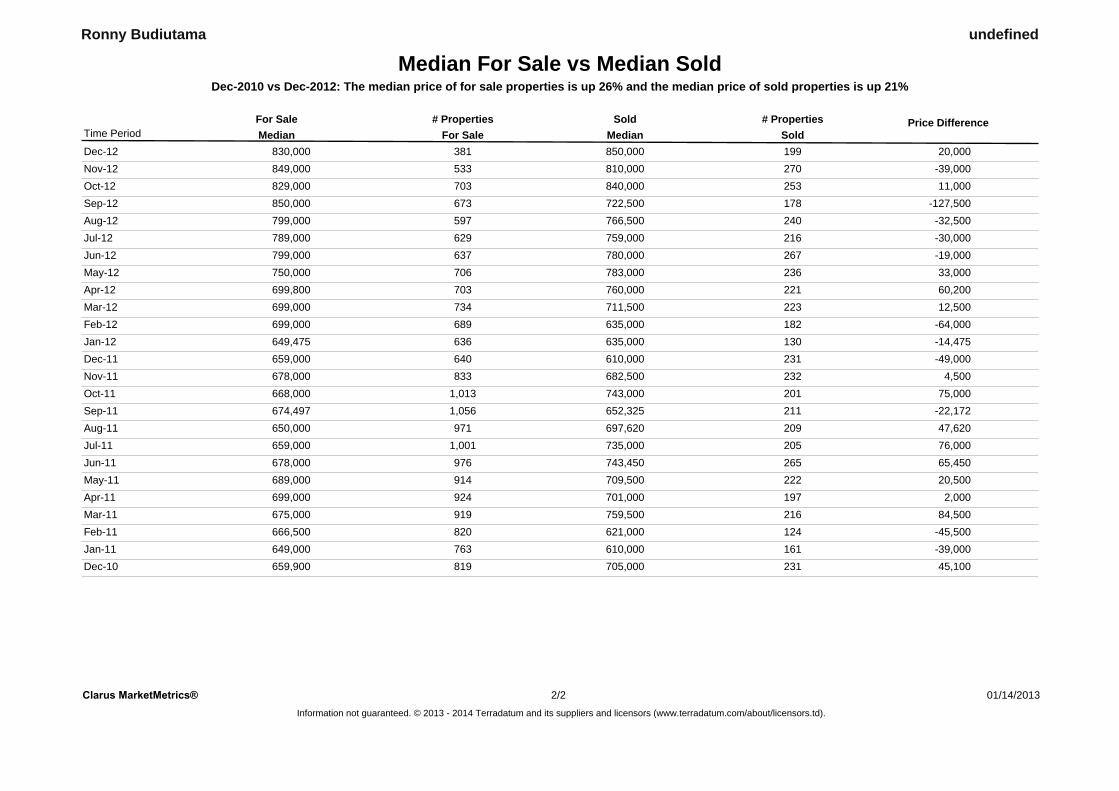
Median For Sale vs Median SoldDec-2010 vs Dec-2012: The median price of for sale properties is up 26% and the median price of sold properties is up 21%
undefinedRonny Budiutama
For SaleMedian SoldMedianFor Sale # Properties # PropertiesSold Price Difference
Time Period
Dec-12 381 199830,000 850,000 20,000Nov-12 533 270849,000 810,000 -39,000Oct-12 703 253829,000 840,000 11,000Sep-12 673 178850,000 722,500 -127,500Aug-12 597 240799,000 766,500 -32,500Jul-12 629 216789,000 759,000 -30,000Jun-12 637 267799,000 780,000 -19,000May-12 706 236750,000 783,000 33,000Apr-12 703 221699,800 760,000 60,200Mar-12 734 223699,000 711,500 12,500Feb-12 689 182699,000 635,000 -64,000Jan-12 636 130649,475 635,000 -14,475Dec-11 640 231659,000 610,000 -49,000Nov-11 833 232678,000 682,500 4,500Oct-11 1,013 201668,000 743,000 75,000Sep-11 1,056 211674,497 652,325 -22,172Aug-11 971 209650,000 697,620 47,620Jul-11 1,001 205659,000 735,000 76,000Jun-11 976 265678,000 743,450 65,450May-11 914 222689,000 709,500 20,500Apr-11 924 197699,000 701,000 2,000Mar-11 919 216675,000 759,500 84,500Feb-11 820 124666,500 621,000 -45,500Jan-11 763 161649,000 610,000 -39,000Dec-10 819 231659,900 705,000 45,100
Clarus MarketMetrics®Information not guaranteed. © 2013 - 2014 Terradatum and its suppliers and licensors (www.terradatum.com/about/licensors.td).
01/14/201322/
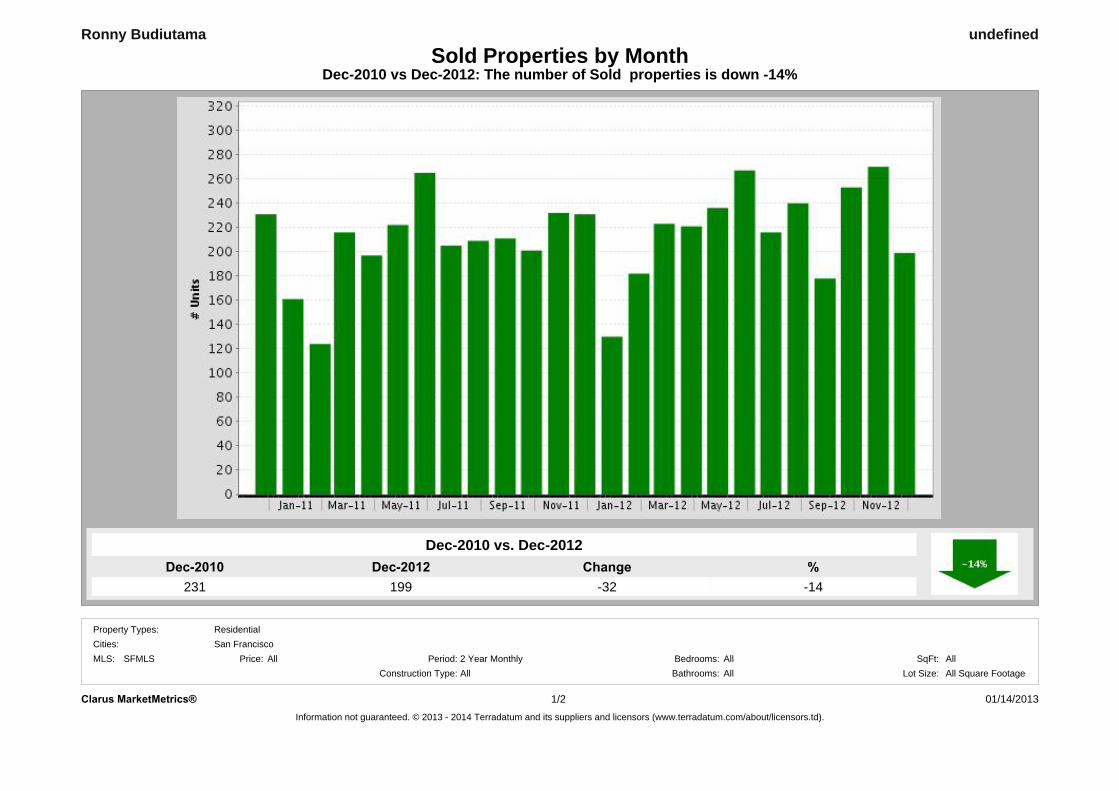
Dec-2012199
Dec-2010231
%-14
Change-32
Dec-2010 vs Dec-2012: The number of Sold properties is down -14%Sold Properties by Month
undefined
Dec-2010 vs. Dec-2012
Ronny Budiutama
Clarus MarketMetrics® 01/14/2013Information not guaranteed. © 2013 - 2014 Terradatum and its suppliers and licensors (www.terradatum.com/about/licensors.td).
1/2
MLS: SFMLS Bedrooms:AllAll
Construction Type:All2 Year Monthly SqFt:
Bathrooms: Lot Size:All All Square FootagePeriod:All
Cities:Property Types: Residential
San FranciscoPrice:
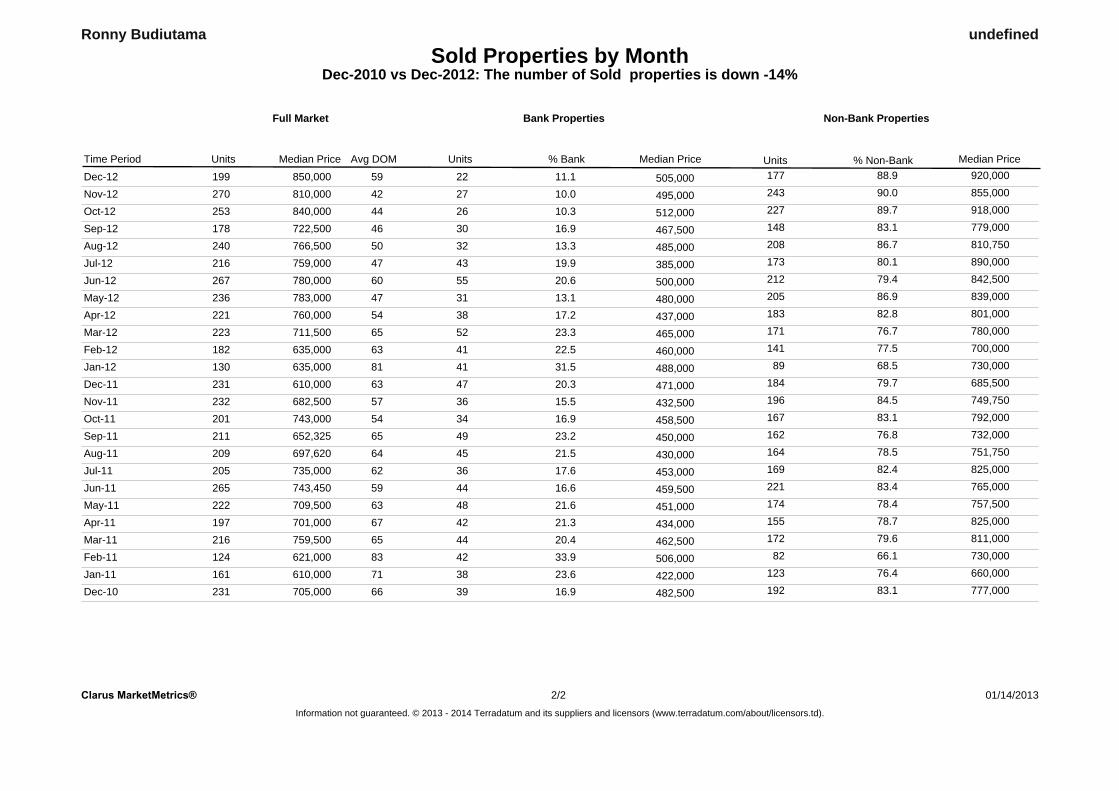
Sold Properties by MonthDec-2010 vs Dec-2012: The number of Sold properties is down -14%
undefinedRonny Budiutama
Time Period
Full Market
Units Median Price Avg DOM
Bank Properties
Units % Bank Median Price
Non-Bank Properties
Units % Non-Bank Median Price
Dec-12 850,000199 59 22 11.1 505,000 177 88.9 920,000
Nov-12 810,000270 42 27 10.0 495,000 243 90.0 855,000
Oct-12 840,000253 44 26 10.3 512,000 227 89.7 918,000
Sep-12 722,500178 46 30 16.9 467,500 148 83.1 779,000
Aug-12 766,500240 50 32 13.3 485,000 208 86.7 810,750
Jul-12 759,000216 47 43 19.9 385,000 173 80.1 890,000
Jun-12 780,000267 60 55 20.6 500,000 212 79.4 842,500
May-12 783,000236 47 31 13.1 480,000 205 86.9 839,000
Apr-12 760,000221 54 38 17.2 437,000 183 82.8 801,000
Mar-12 711,500223 65 52 23.3 465,000 171 76.7 780,000
Feb-12 635,000182 63 41 22.5 460,000 141 77.5 700,000
Jan-12 635,000130 81 41 31.5 488,000 89 68.5 730,000
Dec-11 610,000231 63 47 20.3 471,000 184 79.7 685,500
Nov-11 682,500232 57 36 15.5 432,500 196 84.5 749,750
Oct-11 743,000201 54 34 16.9 458,500 167 83.1 792,000
Sep-11 652,325211 65 49 23.2 450,000 162 76.8 732,000
Aug-11 697,620209 64 45 21.5 430,000 164 78.5 751,750
Jul-11 735,000205 62 36 17.6 453,000 169 82.4 825,000
Jun-11 743,450265 59 44 16.6 459,500 221 83.4 765,000
May-11 709,500222 63 48 21.6 451,000 174 78.4 757,500
Apr-11 701,000197 67 42 21.3 434,000 155 78.7 825,000
Mar-11 759,500216 65 44 20.4 462,500 172 79.6 811,000
Feb-11 621,000124 83 42 33.9 506,000 82 66.1 730,000
Jan-11 610,000161 71 38 23.6 422,000 123 76.4 660,000
Dec-10 705,000231 66 39 16.9 482,500 192 83.1 777,000
Clarus MarketMetrics® 01/14/2013Information not guaranteed. © 2013 - 2014 Terradatum and its suppliers and licensors (www.terradatum.com/about/licensors.td).
22/
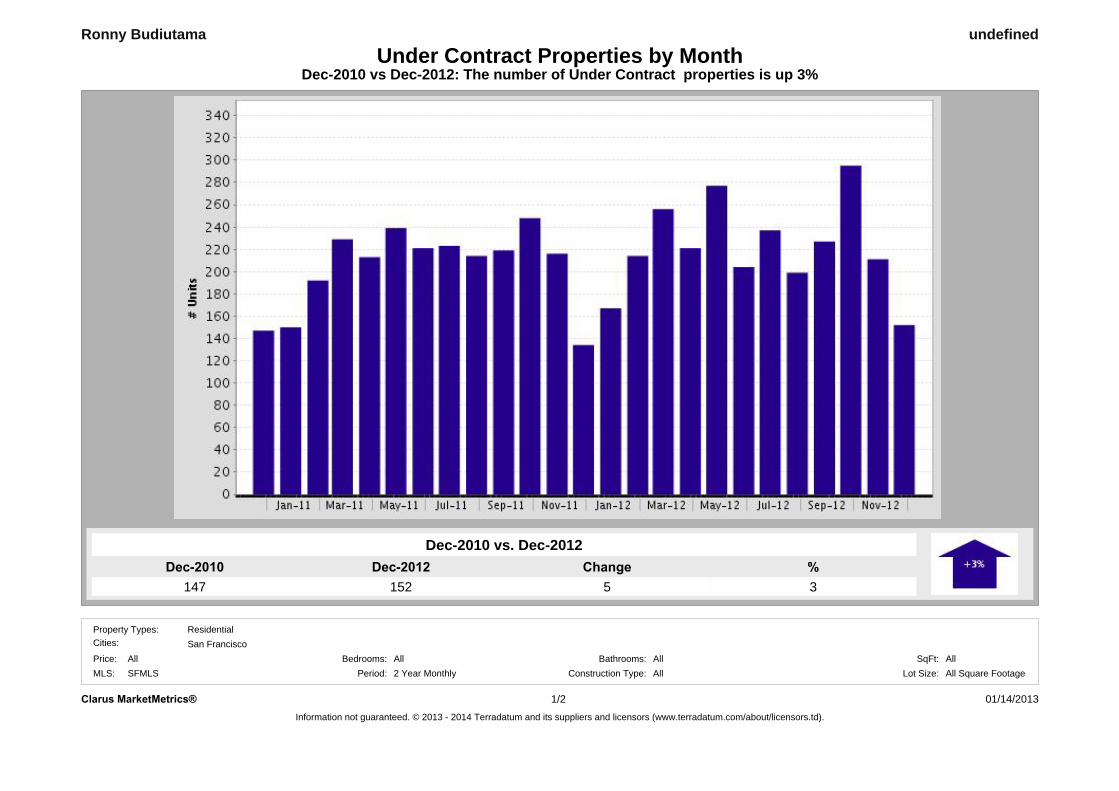
Dec-2012152
Dec-2010147
%3
Change5
Dec-2010 vs Dec-2012: The number of Under Contract properties is up 3%Under Contract Properties by Month
undefined
Dec-2010 vs. Dec-2012
Ronny Budiutama
Clarus MarketMetrics® 01/14/2013Information not guaranteed. © 2013 - 2014 Terradatum and its suppliers and licensors (www.terradatum.com/about/licensors.td).
1/2
AllBathrooms: SqFt:All
Residential
All Square FootageConstruction Type: Lot Size:SFMLS
San Francisco
Period: 2 Year MonthlyPrice:MLS:
All AllAll
Property Types:
Bedrooms:
Cities:
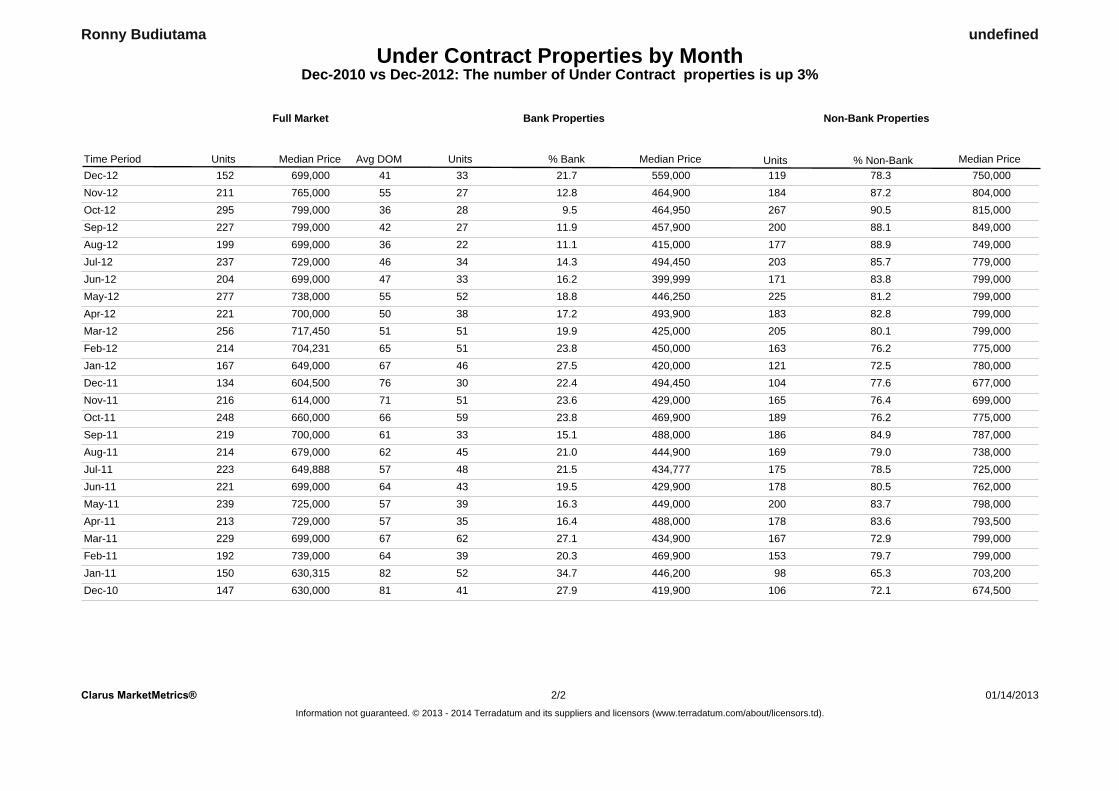
Under Contract Properties by MonthDec-2010 vs Dec-2012: The number of Under Contract properties is up 3%
undefinedRonny Budiutama
Median Price UnitsUnits Median Price% Non-Bank
Full Market
% BankAvg DOMMedian Price
Bank Properties
Units
Non-Bank Properties
Time PeriodDec-12 699,000152 41 750,00078.3119559,00021.733Nov-12 765,000211 55 804,00087.2184464,90012.827Oct-12 799,000295 36 815,00090.5267464,9509.528Sep-12 799,000227 42 849,00088.1200457,90011.927Aug-12 699,000199 36 749,00088.9177415,00011.122Jul-12 729,000237 46 779,00085.7203494,45014.334Jun-12 699,000204 47 799,00083.8171399,99916.233May-12 738,000277 55 799,00081.2225446,25018.852Apr-12 700,000221 50 799,00082.8183493,90017.238Mar-12 717,450256 51 799,00080.1205425,00019.951Feb-12 704,231214 65 775,00076.2163450,00023.851Jan-12 649,000167 67 780,00072.5121420,00027.546Dec-11 604,500134 76 677,00077.6104494,45022.430Nov-11 614,000216 71 699,00076.4165429,00023.651Oct-11 660,000248 66 775,00076.2189469,90023.859Sep-11 700,000219 61 787,00084.9186488,00015.133Aug-11 679,000214 62 738,00079.0169444,90021.045Jul-11 649,888223 57 725,00078.5175434,77721.548Jun-11 699,000221 64 762,00080.5178429,90019.543May-11 725,000239 57 798,00083.7200449,00016.339Apr-11 729,000213 57 793,50083.6178488,00016.435Mar-11 699,000229 67 799,00072.9167434,90027.162Feb-11 739,000192 64 799,00079.7153469,90020.339Jan-11 630,315150 82 703,20065.398446,20034.752Dec-10 630,000147 81 674,50072.1106419,90027.941
Clarus MarketMetrics® 01/14/2013Information not guaranteed. © 2013 - 2014 Terradatum and its suppliers and licensors (www.terradatum.com/about/licensors.td).
22/
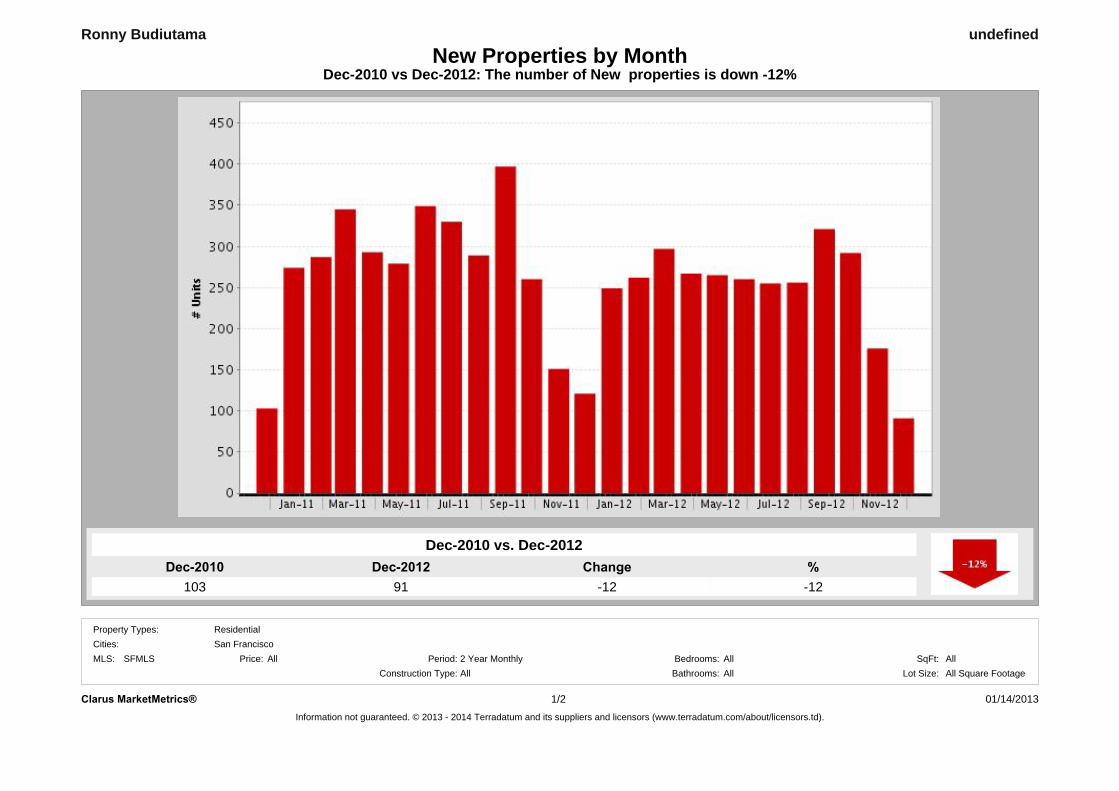
Dec-201291
Dec-2010103
%-12
Change-12
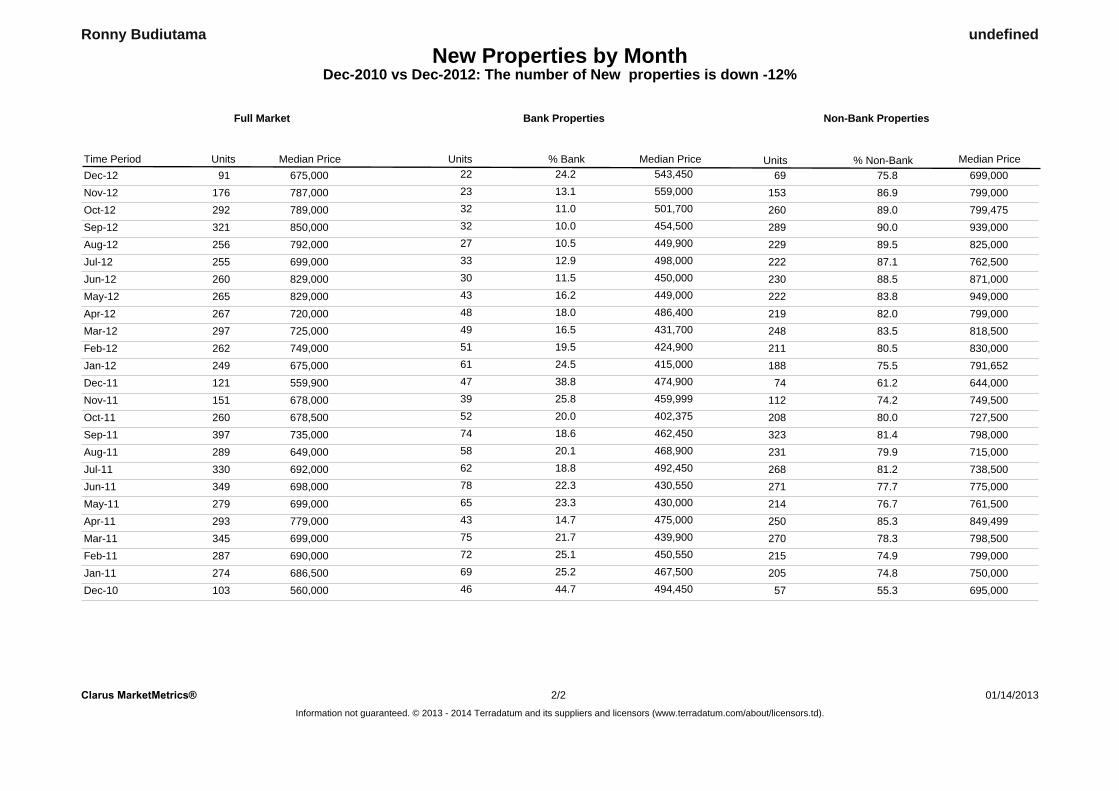
Dec-2010 vs Dec-2012: The number of New properties is down -12%New Properties by Month
undefined
Dec-2010 vs. Dec-2012
Ronny Budiutama
Clarus MarketMetrics® 01/14/2013Information not guaranteed. © 2013 - 2014 Terradatum and its suppliers and licensors (www.terradatum.com/about/licensors.td).
1/2
MLS: SFMLS Bedrooms:AllAll
Construction Type:All2 Year Monthly SqFt:
Bathrooms: Lot Size:All All Square FootagePeriod:All
Cities:Property Types: Residential
San FranciscoPrice:
New Properties by MonthDec-2010 vs Dec-2012: The number of New properties is down -12%
undefinedRonny Budiutama
Median Price UnitsUnits Median Price% Non-Bank
Full Market
% BankMedian Price
Bank Properties
Units
Non-Bank Properties
Time PeriodDec-12 675,00091 22 24.2 543,450 69 75.8 699,000Nov-12 787,000176 23 13.1 559,000 153 86.9 799,000Oct-12 789,000292 32 11.0 501,700 260 89.0 799,475Sep-12 850,000321 32 10.0 454,500 289 90.0 939,000Aug-12 792,000256 27 10.5 449,900 229 89.5 825,000Jul-12 699,000255 33 12.9 498,000 222 87.1 762,500Jun-12 829,000260 30 11.5 450,000 230 88.5 871,000May-12 829,000265 43 16.2 449,000 222 83.8 949,000Apr-12 720,000267 48 18.0 486,400 219 82.0 799,000Mar-12 725,000297 49 16.5 431,700 248 83.5 818,500Feb-12 749,000262 51 19.5 424,900 211 80.5 830,000Jan-12 675,000249 61 24.5 415,000 188 75.5 791,652Dec-11 559,900121 47 38.8 474,900 74 61.2 644,000Nov-11 678,000151 39 25.8 459,999 112 74.2 749,500Oct-11 678,500260 52 20.0 402,375 208 80.0 727,500Sep-11 735,000397 74 18.6 462,450 323 81.4 798,000Aug-11 649,000289 58 20.1 468,900 231 79.9 715,000Jul-11 692,000330 62 18.8 492,450 268 81.2 738,500Jun-11 698,000349 78 22.3 430,550 271 77.7 775,000May-11 699,000279 65 23.3 430,000 214 76.7 761,500Apr-11 779,000293 43 14.7 475,000 250 85.3 849,499Mar-11 699,000345 75 21.7 439,900 270 78.3 798,500Feb-11 690,000287 72 25.1 450,550 215 74.9 799,000Jan-11 686,500274 69 25.2 467,500 205 74.8 750,000Dec-10 560,000103 46 44.7 494,450 57 55.3 695,000
Clarus MarketMetrics® 01/14/2013Information not guaranteed. © 2013 - 2014 Terradatum and its suppliers and licensors (www.terradatum.com/about/licensors.td).
22/
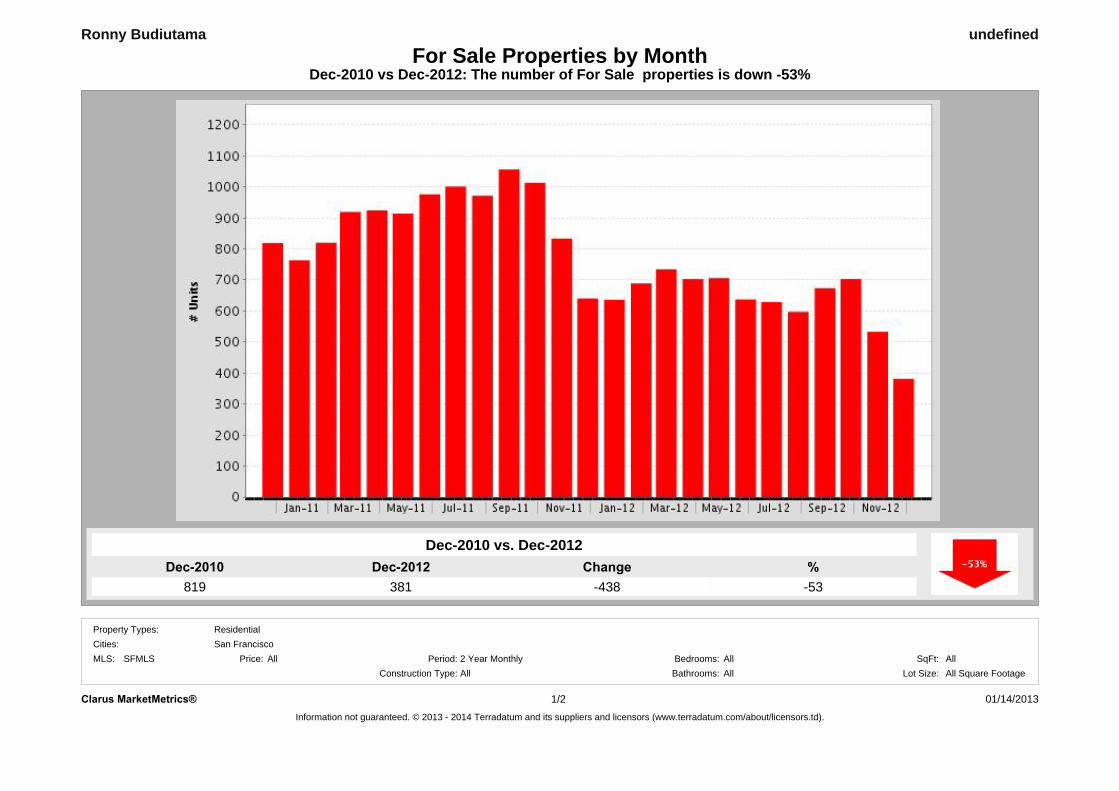
Dec-2012381
Dec-2010819
%-53
Change-438
Dec-2010 vs Dec-2012: The number of For Sale properties is down -53%For Sale Properties by Month
undefined
Dec-2010 vs. Dec-2012
Ronny Budiutama
Clarus MarketMetrics® 01/14/2013Information not guaranteed. © 2013 - 2014 Terradatum and its suppliers and licensors (www.terradatum.com/about/licensors.td).
1/2
MLS: SFMLS Bedrooms:AllAll
Construction Type:All2 Year Monthly SqFt:
Bathrooms: Lot Size:All All Square FootagePeriod:All
Cities:Property Types: Residential
San FranciscoPrice:

For Sale Properties by MonthDec-2010 vs Dec-2012: The number of For Sale properties is down -53%
undefinedRonny Budiutama
Median Price UnitsUnits Median Price% Non-Bank
Full Market
% BankAvg DOMMedian Price
Bank Properties
Units
Non-Bank Properties
Time Period
Dec-12 830,000381 71 60 15.7 559,450 321 84.3 900,000Nov-12 849,000533 61 68 12.8 502,195 465 87.2 900,000Oct-12 829,000703 55 82 11.7 485,000 621 88.3 899,000Sep-12 850,000673 54 84 12.5 459,950 589 87.5 949,000Aug-12 799,000597 60 83 13.9 450,000 514 86.1 877,000Jul-12 789,000629 63 102 16.2 479,450 527 83.8 889,000Jun-12 799,000637 65 116 18.2 450,000 521 81.8 925,000May-12 750,000706 69 156 22.1 454,750 550 77.9 899,000Apr-12 699,800703 70 162 23.0 466,944 541 77.0 825,000Mar-12 699,000734 70 177 24.1 449,500 557 75.9 799,000Feb-12 699,000689 80 194 28.2 450,000 495 71.8 799,000Jan-12 649,475636 91 201 31.6 450,000 435 68.4 775,000Dec-11 659,000640 108 191 29.8 470,000 449 70.2 749,000Nov-11 678,000833 94 216 25.9 457,000 617 74.1 750,000Oct-11 668,0001,013 81 259 25.6 455,000 754 74.4 749,000Sep-11 674,4971,056 75 263 24.9 467,900 793 75.1 759,000Aug-11 650,000971 80 257 26.5 459,000 714 73.5 749,000Jul-11 659,0001,001 76 268 26.8 449,900 733 73.2 759,000Jun-11 678,000976 77 265 27.2 435,000 711 72.8 786,000May-11 689,000914 77 233 25.5 448,888 681 74.5 799,000Apr-11 699,000924 74 223 24.1 449,950 701 75.9 799,000Mar-11 675,000919 74 258 28.1 448,944 661 71.9 795,000Feb-11 666,500820 80 238 29.0 454,600 582 71.0 796,225Jan-11 649,000763 94 234 30.7 449,925 529 69.3 775,000Dec-10 659,900819 104 231 28.2 435,000 588 71.8 779,000
Clarus MarketMetrics® 01/14/2013Information not guaranteed. © 2013 - 2014 Terradatum and its suppliers and licensors (www.terradatum.com/about/licensors.td).
22/
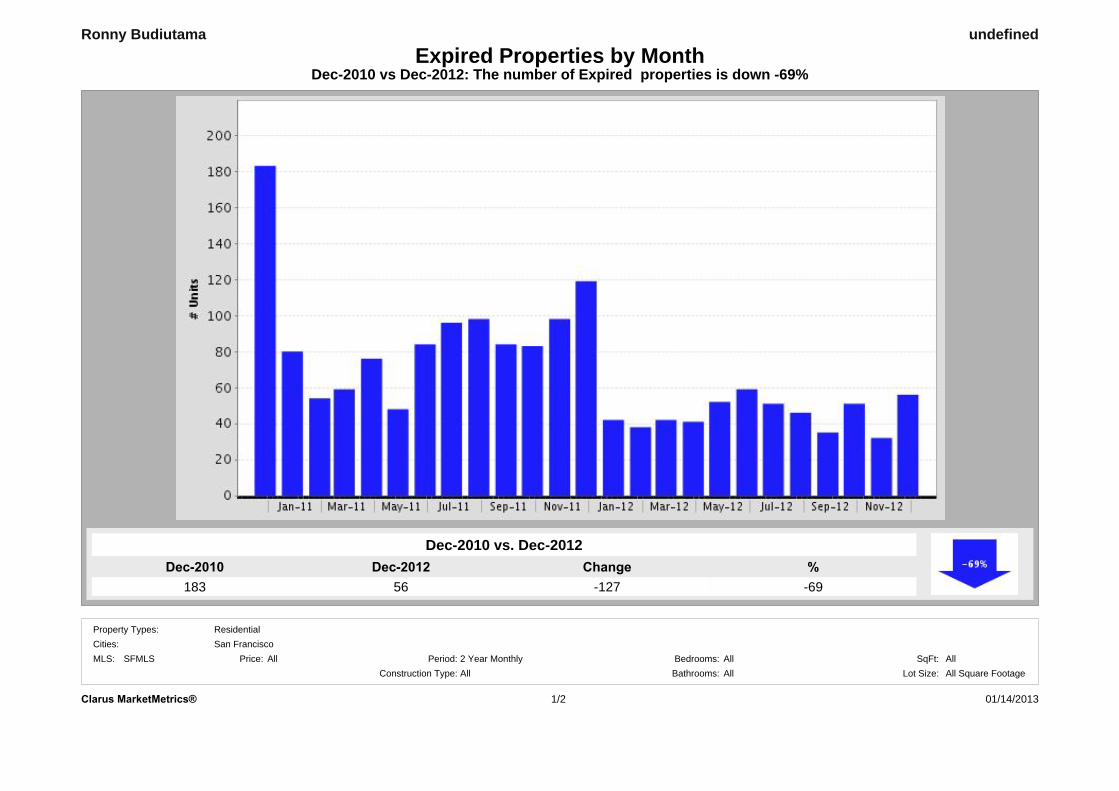
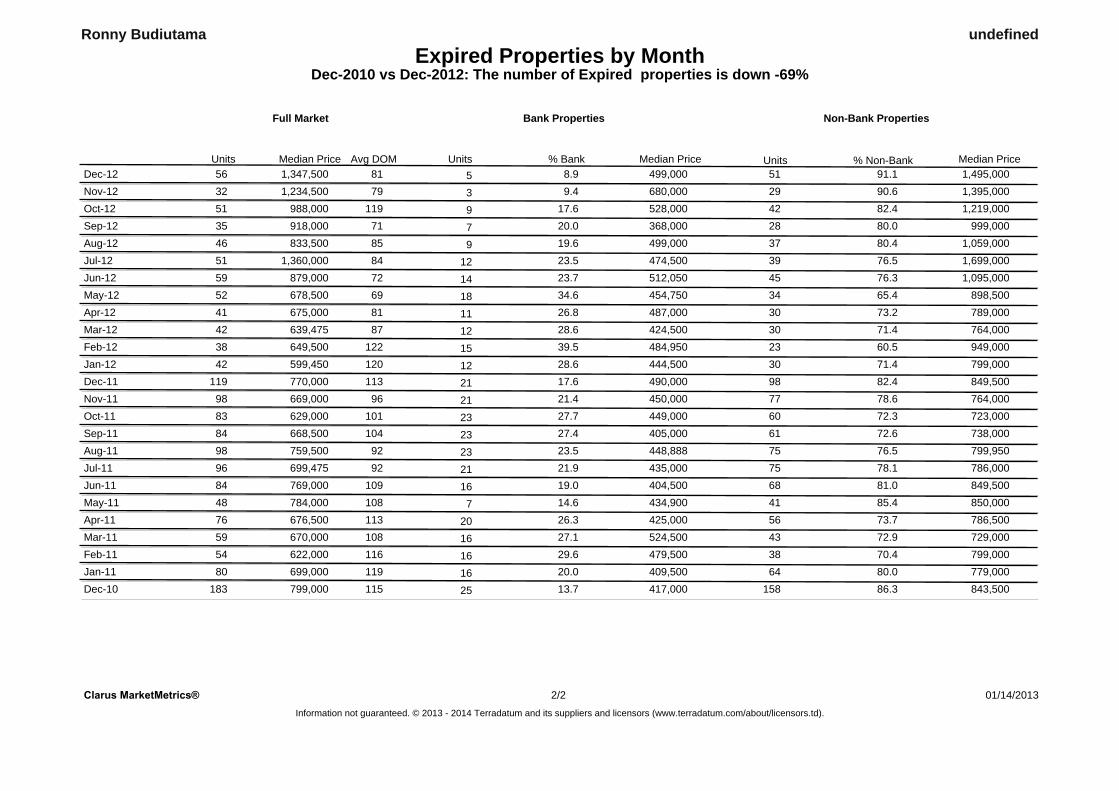
Dec-201256
Dec-2010183
%-69
Change-127
Dec-2010 vs Dec-2012: The number of Expired properties is down -69%Expired Properties by Month
undefined
Dec-2010 vs. Dec-2012
Ronny Budiutama
01/14/2013Clarus MarketMetrics® 1/2
MLS: SFMLS Bedrooms:AllAll
Construction Type:All2 Year Monthly SqFt:
Bathrooms: Lot Size:All All Square FootagePeriod:All
Cities:Property Types: Residential
San FranciscoPrice:
Expired Properties by MonthDec-2010 vs Dec-2012: The number of Expired properties is down -69%
undefinedRonny Budiutama
Median Price Units% BankAvg DOMUnits Median Price
Bank Properties
Units
Non-Bank Properties
% Non-Bank Median Price
Full Market
Dec-12 1,347,50056 81 5 8.9 499,000 51 91.1 1,495,000Nov-12 1,234,50032 79 3 9.4 680,000 29 90.6 1,395,000Oct-12 988,00051 119 9 17.6 528,000 42 82.4 1,219,000Sep-12 918,00035 71 7 20.0 368,000 28 80.0 999,000Aug-12 833,50046 85 9 19.6 499,000 37 80.4 1,059,000Jul-12 1,360,00051 84 12 23.5 474,500 39 76.5 1,699,000Jun-12 879,00059 72 14 23.7 512,050 45 76.3 1,095,000May-12 678,50052 69 18 34.6 454,750 34 65.4 898,500Apr-12 675,00041 81 11 26.8 487,000 30 73.2 789,000Mar-12 639,47542 87 12 28.6 424,500 30 71.4 764,000Feb-12 649,50038 122 15 39.5 484,950 23 60.5 949,000Jan-12 599,45042 120 12 28.6 444,500 30 71.4 799,000Dec-11 770,000119 113 21 17.6 490,000 98 82.4 849,500Nov-11 669,00098 96 21 21.4 450,000 77 78.6 764,000Oct-11 629,00083 101 23 27.7 449,000 60 72.3 723,000Sep-11 668,50084 104 23 27.4 405,000 61 72.6 738,000Aug-11 759,50098 92 23 23.5 448,888 75 76.5 799,950Jul-11 699,47596 92 21 21.9 435,000 75 78.1 786,000Jun-11 769,00084 109 16 19.0 404,500 68 81.0 849,500May-11 784,00048 108 7 14.6 434,900 41 85.4 850,000Apr-11 676,50076 113 20 26.3 425,000 56 73.7 786,500Mar-11 670,00059 108 16 27.1 524,500 43 72.9 729,000Feb-11 622,00054 116 16 29.6 479,500 38 70.4 799,000Jan-11 699,00080 119 16 20.0 409,500 64 80.0 779,000Dec-10 799,000183 115 25 13.7 417,000 158 86.3 843,500
Clarus MarketMetrics® 01/14/2013Information not guaranteed. © 2013 - 2014 Terradatum and its suppliers and licensors (www.terradatum.com/about/licensors.td).
22/
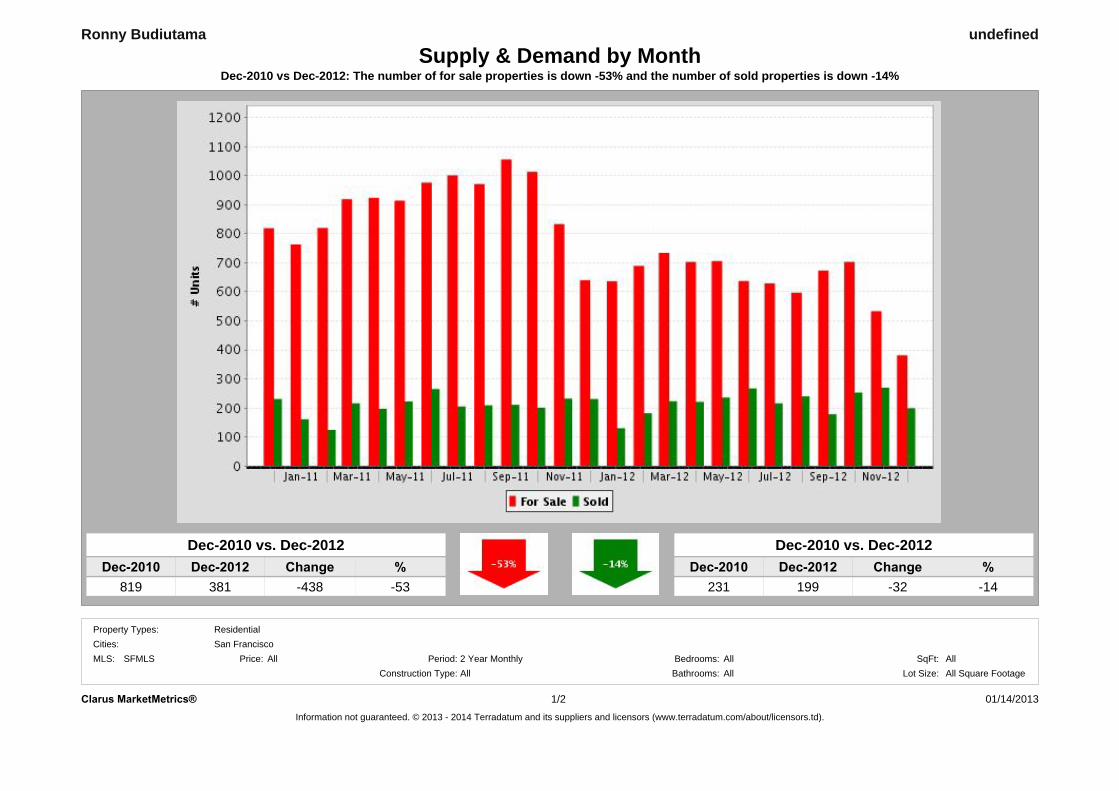
Dec-2010 vs Dec-2012: The number of for sale properties is down -53% and the number of sold properties is down -14%
undefined
Dec-2010 vs. Dec-2012
819 -53
Ronny Budiutama
381Dec-2012
Supply & Demand by Month
ChangeDec-2010 %-438
Dec-2010 Dec-2012 %231 -14
Dec-2010 vs. Dec-2012
199Change
-32
Clarus MarketMetrics® 01/14/2013Information not guaranteed. © 2013 - 2014 Terradatum and its suppliers and licensors (www.terradatum.com/about/licensors.td).
1/2
MLS: SFMLS Bedrooms:AllAll
Construction Type:All2 Year Monthly SqFt:
Bathrooms: Lot Size:All All Square FootagePeriod:All
Cities:Property Types: Residential
San FranciscoPrice:

Supply & Demand by MonthDec-2010 vs Dec-2012: The number of for sale properties is down -53% and the number of sold properties is down -14%
Ronny Budiutama undefined
For Sale Sold# Properties
Avg DOM Avg DOM# Properties
Time Period
Dec-12 71 59381 199Nov-12 61 42533 270Oct-12 55 44703 253Sep-12 54 46673 178Aug-12 60 50597 240Jul-12 63 47629 216Jun-12 65 60637 267May-12 69 47706 236Apr-12 70 54703 221Mar-12 70 65734 223Feb-12 80 63689 182Jan-12 91 81636 130Dec-11 108 63640 231Nov-11 94 57833 232Oct-11 81 541,013 201Sep-11 75 651,056 211Aug-11 80 64971 209Jul-11 76 621,001 205Jun-11 77 59976 265May-11 77 63914 222Apr-11 74 67924 197Mar-11 74 65919 216Feb-11 80 83820 124Jan-11 94 71763 161Dec-10 104 66819 231
Clarus MarketMetrics® 01/14/2013Information not guaranteed. © 2013 - 2014 Terradatum and its suppliers and licensors (www.terradatum.com/about/licensors.td).
22/
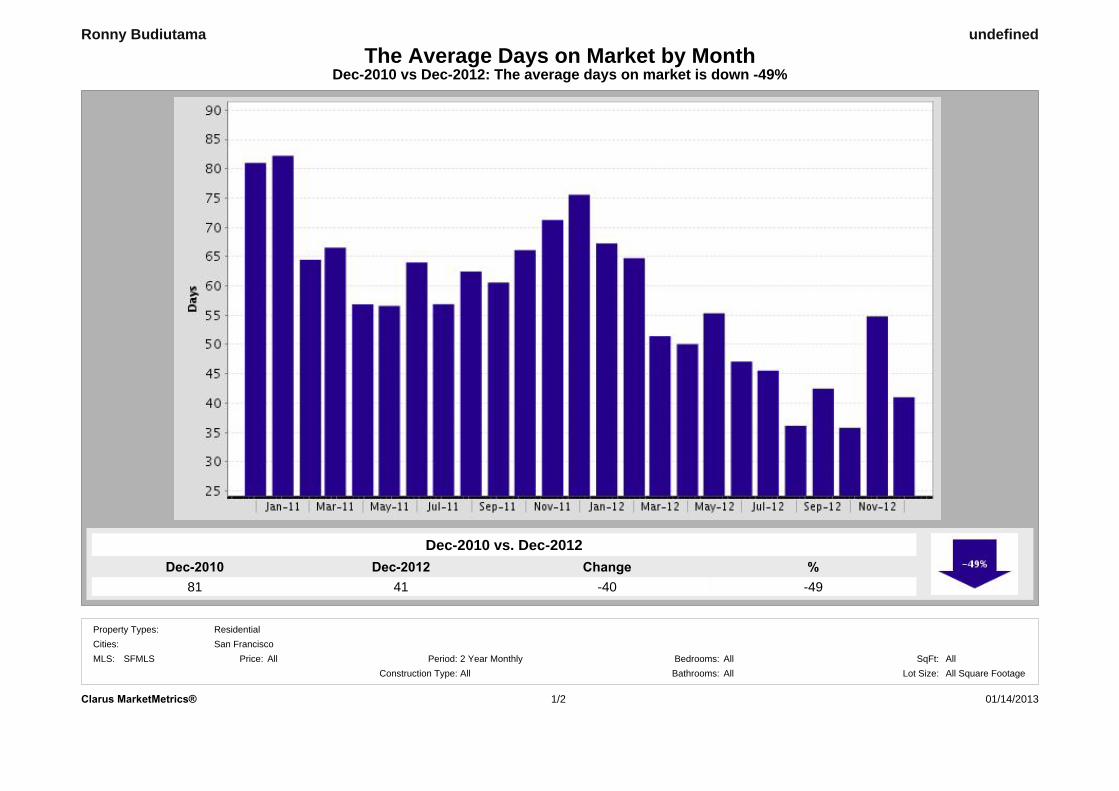
Dec-201241
Dec-201081
%-49
Change-40
Dec-2010 vs Dec-2012: The average days on market is down -49%The Average Days on Market by Month
undefined
Dec-2010 vs. Dec-2012
Ronny Budiutama
San FranciscoAll 2 Year Monthly
Cities:Period:Price:
Property Types: Residential
01/14/20131/2Clarus MarketMetrics®
All Square FootageBedrooms: All AllSqFt:
All Lot Size:Bathrooms:AllConstruction Type:MLS: SFMLS
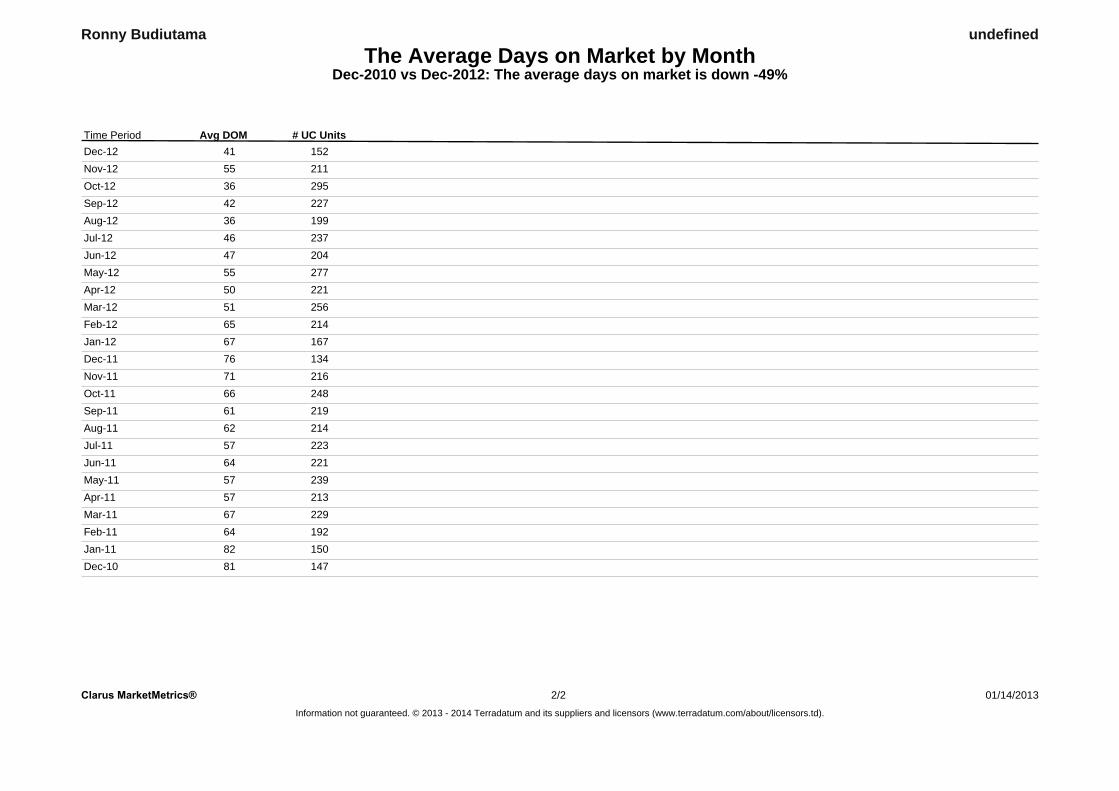
The Average Days on Market by MonthDec-2010 vs Dec-2012: The average days on market is down -49%
undefinedRonny Budiutama
# UC UnitsAvg DOMTime PeriodDec-12 15241Nov-12 21155Oct-12 29536Sep-12 22742Aug-12 19936Jul-12 23746Jun-12 20447May-12 27755Apr-12 22150Mar-12 25651Feb-12 21465Jan-12 16767Dec-11 13476Nov-11 21671Oct-11 24866Sep-11 21961Aug-11 21462Jul-11 22357Jun-11 22164May-11 23957Apr-11 21357Mar-11 22967Feb-11 19264Jan-11 15082Dec-10 14781
Clarus MarketMetrics® 2/2 01/14/2013Information not guaranteed. © 2013 - 2014 Terradatum and its suppliers and licensors (www.terradatum.com/about/licensors.td).
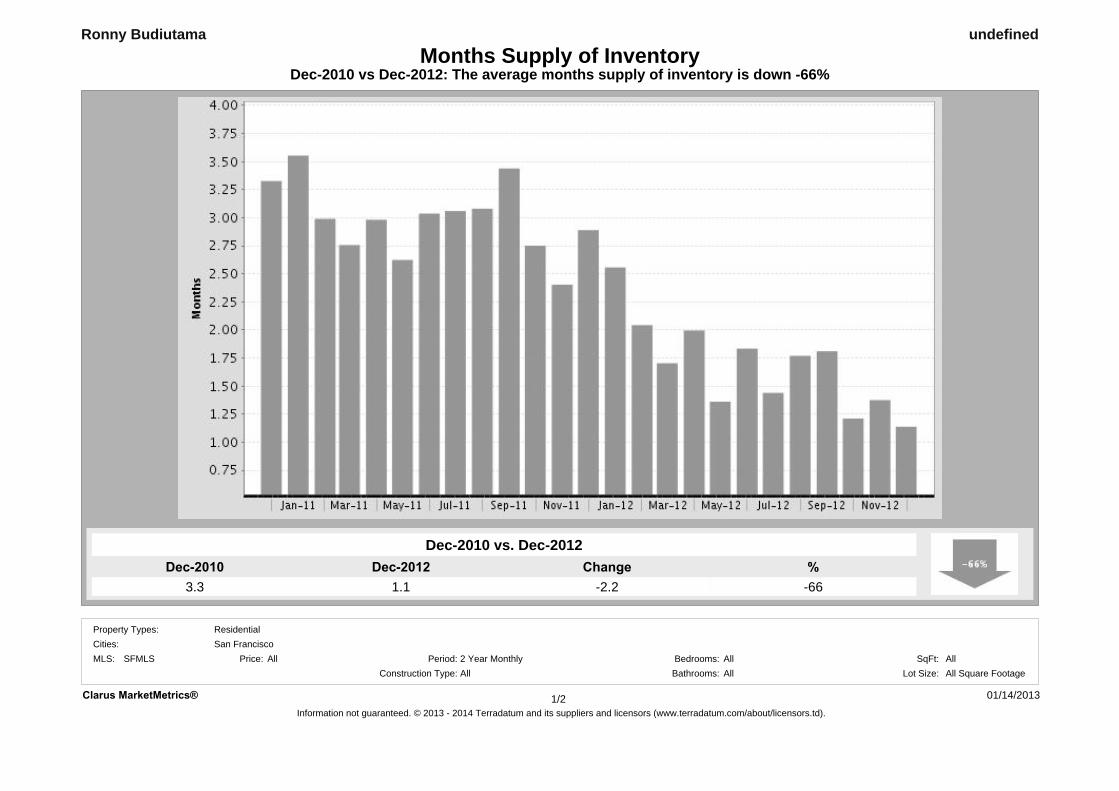
Dec-2010 vs Dec-2012: The average months supply of inventory is down -66%
undefined
Dec-2010 vs. Dec-2012
3.3 -66
Ronny Budiutama
1.1Dec-2012
Months Supply of Inventory
ChangeDec-2010 %-2.2
Clarus MarketMetrics® 01/14/2013Information not guaranteed. © 2013 - 2014 Terradatum and its suppliers and licensors (www.terradatum.com/about/licensors.td).
1/2
MLS: SFMLS Bedrooms:AllAll
Construction Type:All2 Year Monthly SqFt:
Bathrooms: Lot Size:All All Square FootagePeriod:All
Cities:Property Types: Residential
San FranciscoPrice:

Months Supply of InventoryDec-2010 vs Dec-2012: The average months supply of inventory is down -66%
Ronny Budiutama undefined
During MonthLast Day of Month MSI# Units For Sale # UC Units
UC Avg DOMTime Period
Dec-12 152 41173 1.1Nov-12 211 55290 1.4Oct-12 295 36357 1.2Sep-12 227 42411 1.8Aug-12 199 36352 1.8Jul-12 237 46341 1.4Jun-12 204 47374 1.8May-12 277 55377 1.4Apr-12 221 50441 2.0Mar-12 256 51436 1.7Feb-12 214 65437 2.0Jan-12 167 67427 2.6Dec-11 134 76387 2.9Nov-11 216 71519 2.4Oct-11 248 66682 2.8Sep-11 219 61753 3.4Aug-11 214 62659 3.1Jul-11 223 57682 3.1Jun-11 221 64671 3.0May-11 239 57627 2.6Apr-11 213 57635 3.0Mar-11 229 67631 2.8Feb-11 192 64574 3.0Jan-11 150 82533 3.6Dec-10 147 81489 3.3
Clarus MarketMetrics® 01/14/2013Information not guaranteed. © 2013 - 2014 Terradatum and its suppliers and licensors (www.terradatum.com/about/licensors.td).
22/