san francisco juvenile probation department · san francisco juvenile probation department ... our...
TRANSCRIPT

San Francisco Juvenile Probation Department
2015 Statistical Report1/1/15 to 12/31/15
Allen A. NanceChief Probation Officer
Created byJose Luis Perla
IT DirectorInformation Technology Unit
375 Woodside AvenueSan Francisco, CA 94127
(415) [email protected]
1/31/2016

City and County of San Francisco
Juvenile Probation Department
Allen A. Nance 375 WOODSIDE AVENUE
CHIEF PROBATION OFFICER SAN FRANCISCO, CA. 94127 (415) 753-7558 office (415) 753-7557 fax
April 18, 2016
Dear Colleagues and Friends:
It is with great pleasure that I announce the release of the 2015 San Francisco Juvenile Probation Department
(SFJPD) Annual Statistical Report. This report provides insight and key data describing juvenile justice practice in
San Francisco. While we have experienced a slight uptick in property offenses, again this year our downward trend
in juvenile arrests and court referrals is reflected in our numbers for 2015.
Our juvenile justice system and its practitioners continue to expand our knowledge and understanding of evidence-
based practices designed to reduce recidivism. The use of assessment tools to drive critical decisions has enhanced
our capacity to develop case plans and community supervision strategies that target criminogenic risk factors and
strengthen our ability to work more effectively with youths and family members. For as much as we value the
technical knowledge and research relevant to our practice, we also know that collaborative strategies and effective
partnerships matter. Our efforts to keep low risk youth out of the juvenile justice system is bolstered and supported
by community based alternatives and agency partnerships.
While we continue to have a positive impact on the lives of youths and their families, there is still much work to be
done to better understand and address disproportionate minority contact within our system. Collectively, we must
remain committed to a common resolve to turn the tide of the disparate impact our system has on minority youths
and families. It is my hope that the data contained in this report will help focus our efforts and clarify our
understanding of the San Francisco juvenile justice system, and will ultimately guide the work of the Juvenile
Probation Department to improve and enhance the communities we serve.
Sincerely,
Allen A. Nance
Chief Juvenile Probation Officer

Table of Contents Statistical Reports Five-Year Statistical Summary All Juvenile Hall Bookings ............................................1 Five-Year Statistical Summary Petition Outcome............................................................2
Juvenile Probation Referrals Unduplicated Count of Juvenile Probation Referrals by Gender, Race/Ethnic Origin, and Age ............................................................................................3 Unduplicated Count of Juvenile Probation Referrals by Geographical Residence of Youth – San Francisco Zip Code ................................................................4 Unduplicated Count of Juvenile Probation Referrals by Geographical Residence of Youth – Map of Supervisorial Districts Boundaries...................................5 Unduplicated Count of Juvenile Probation Referrals by Geographical Residence of Youth – Map of San Francisco Zip Code Boundaries ................................6 Duplicated Count of Juvenile Probation Referrals by Gender, Race/Ethnic Origin, and Age at Referral ..........................................................................7 Duplicated Count of Juvenile Probation Referrals for Criminal Offenses .......................8
Juvenile Hall Bookings (Detentions) Unduplicated Count of Juvenile Hall Bookings for Criminal Offenses by Gender, Race/Ethnic Origin, and Age ............................................................................................9 Unduplicated Count of Juvenile Hall Bookings for Criminal Offenses by Geographical Residence of Youth – Map of Supervisorial Districts Boundaries ................................10 Unduplicated Count of Juvenile Hall Bookings for Criminal Offenses by Geographical Residence of Youth – Map of San Francisco Zip Code Boundaries..............................11 Unduplicated Count of Juvenile Hall Bookings for Criminal Offenses – Five-Year Comparison by Geographical Residence of Youth ....................................12
i

Unduplicated Count of Juvenile Hall Bookings– Analysis of the Prior Arrests for Criminal Offenses of Youth Admitted to Detention (Line Chart) ...............13 Duplicated Count of Juvenile Hall Bookings for Criminal Offenses By Year 2004 – 2015 (Line Chart) .................................................................................14 Duplicated Count of Juvenile Hall Bookings by Most to Least Serious Detention Reasons using Department of Justice Summary Code...................................15 Duplicated Count of Juvenile Hall Bookings for Criminal Offenses By Referral Source..........................................................................................................16 Duplicated Count of Juvenile Hall Bookings for Criminal Offenses By FBI Part I and Part II Crimes ....................................................................................17 Duplicated Count of Juvenile Hall Bookings for Criminal Offenses By Gender, Crime Type and Offense Degree Level.......................................................18 Duplicated Count of Juvenile Hall Bookings for Criminal Offenses By Race/Ethnic Origin, Crime Type and Offense Degree Level....................................19
Petitions Filed Duplicated Count of Petitions Filed by Most to Least Serious Petition Reasons using Department of Justice Summary Code ......................................20 Duplicated Count of Petitions Filed for Criminal Offenses By Gender, Crime Type and Offense Degree Level.......................................................21 Duplicated Count of Petitions Filed for Criminal Offenses By Race/Ethnic Origin, Crime Type and Offense Degree Level....................................22
ii
Petitions Sustained Duplicated Count of Petitions Sustained by Most to Least Serious Petition Sustained using Department of Justice Summary Code....................................23 Duplicated Count of Petitions Sustained for Criminal Offenses By Gender, Crime Type and Offense Degree Level.......................................................24 Duplicated Count of Petitions Sustained for Criminal Offenses By Race/Ethnic Origin, Crime Type and Offense Degree Level....................................25
Graphics
2015 Juvenile Hall Average Daily Population ...............................................................26 2015 Juvenile Hall Average Length of Stay...................................................................27 2015 Juvenile Court Processing of Law Violation Cases...............................................28
Juvenile Justice System Terms
Juvenile Justice Terms ....................................................................................................29
Appendix Profile of Girls ............................................................................................................ 1-10 Probation Violations ................................................................................................... 1-05 Profile of Domestic Violence Offenders 2014-2015 .................................................. 1-09 Property Crimes 2005-2015........................................................................................ 1-10
iii

1
San Francisco Juvenile Probation DepartmentAll Juvenile Hall Bookings
Statistical Summary 2011-2015
2011-2015Year Year Year Year Year Percent2011 2012 2013 2014 2015 Change
All Referrals* 2,196 1,871 1,594 1,392 1,204 -45.2%Petitions Filed 1,009 823 757 622 490 -51.4% % Petitions Filed 45.9% 44.0% 47.5% 44.7% 40.7%
Referrals resulting in a bookingAll Juvenile Hall Bookings 1,146 937 856 746 704 -38.57%Average Length of Stay 27 24 27 31 26 -3.70%Average Daily Population 89 74 74 70 56 -37.08%% of Referrals Detained 52.2% 50.1% 53.7% 53.6% 58.5%
*Includes Court Orders, Violation of Probation, Home Detention Failures, Warrants, Transfers from other Counties,Citations, Certifications from Adult Court, Placement Failures, Log Cabin Medical plus all criminal offenses.
2015 Referrals Count %Bookings 704 58.47%Citations 381 31.64%Other 119 9.88%
Total All Referrals 1,204 100.00%
Other Referrals Count %602 WI Petition Filed 4 3.36%777 WI Petition Filed 75 63.03%DJJ Interstate Compact 2 1.68%Transfer In From Other County 38 31.93%
Total 119 100.00%
Terms and DefinitionsJuvenile Probation Referrals - All cases referred to the probation department for purposes of screening. These referrals may or may not result in a booking or petition for adjudication of wardship.Juvenile Hall Referrals - All cases referred to Juvenile Hall for booking purposes. A youth may or may not be booked into juvenile hall depending on their score on the DRI (Detention Risk Instrument) or other exclusions.Juvenile Hall Bookings - All youth booked into Juvenile Hall.

2
San Francisco Juvenile Probation DepartmentStatistical Summary
2011-2015
2011-2015Year Year Year Year Year Percent2011 2012 2013 2014 2015 Change
All Referrals* 2,196 1,871 1,594 1,392 1,204 -45.2%Petitions Filed 1,009 823 757 622 490 -51.4% % Petitions Filed 45.9% 44.0% 47.5% 44.7% 40.7%
OutcomeLog Cabin Ranch School 24 33 23 17 30 25.00%Department of Juvenile Justice (DJJ) 1 4 4 4 1 0.00%Ward Probation 352 217 210 167 148 -57.95%Non-Ward Probation (725a WI) 30 30 39 26 11 -63.33%Out-of-home Placement 137 99 93 122 74 -45.99%Informal Probation (654 WI) 132 105 70 66 33 -75.00%Remand to Adult Court (707) 6 0 2 0 0 0.00%Transfer Out to Another County 136 120 142 107 80 -41.18%Petition Sustained 640 550 456 318 369 -42.34%Petition Dismissed 257 181 176 129 127 -50.58%
*Includes Court Orders, Violation of Probation, Home Detention Failures, Warrants, Transfers from other Counties,Citations, Certifications from Adult Court, Placement Failures, Log Cabin Medical plus all criminal offenses.
The total number of outcome (court dispositions) will not agree with the number of petitions and referrals sincesome petitions filed in 2015 will be decided in 2016 and mulitple petitions are combined with one final outcome only.Not all referrals resulted in a petition filed.
Terms and DefinitionsJuvenile Probation Referrals - All cases referred to the probation department for purposes of screening. These referrals may or may not result in a booking or petition for adjudication of wardship.Juvenile Hall Referrals - All cases referred to Juvenile Hall for booking purposes. A youth may or may not be booked into juvenile hall depending on their score on the DRI (Detention Risk Instrument) or other exclusions.Juvenile Hall Bookings - All youth booked into Juvenile Hall.Petition - A formal statement by the District Attorney's Office alleging that the juvenile is delinquent for committingspecified offense.Petition Sustained - Charges are found true.
Court Disposition (Outcome)The court has a number of “dispositional” alternatives. They can dismiss the case, transfer to jurisdictionof residence, make the youth a ward of the court, place him/her on informal probation or non-ward probation. More stringent alternatives could be a commitment to out of home placement,Log Cabin Ranch or the Department of Juvenile Justice (DJJ).

3
Calendar Year 2015San Francisco Juvenile Probation Department
Unduplicated Count of Juvenile Probation ReferralsN=779
Gender Count %FEMALE 204 26.19%MALE 575 73.81%
Total 779 100.00%
Race/Ethnic Origin Count %AFRICAN AMERICAN 412 52.89%ASIAN INDIAN 1 0.13%CHINESE 12 1.54%FILIPINO 17 2.18%HISPANIC 215 27.60%OTHER 15 1.93%OTHER ASIAN 8 1.03%PACIFIC ISLANDER 3 0.39%SAMOAN 23 2.95%VIETNAMESE 3 0.39%WHITE 70 8.99%
Total 779 100.00%
Age on 1/1/16 Count %Under 10 0 0.00%
11 7 0.90%12 8 1.03%13 25 3.21%14 55 7.06%15 98 12.58%16 151 19.38%17 222 28.50%18 173 22.21%
Over 18 40 5.13%Total 779 100.00%

4
Calendar Year 2015San Francisco Juvenile Probation Department
Unduplicated Count of Juvenile Probation ReferralsN=779
Zip Code Count %94102 Tenderloin/Western Addition 13 1.67%94103 South of Market 30 3.85%94105 Rincon Hill 0 0.00%94107 Potrero Hill 32 4.11%94108 Chinatown 1 0.13%94109 Russian Hill/Polk Gulch 15 1.93%94110 Inner Mission 65 8.34%94111 Telegraph Hill/Waterfront 0 0.00%94112 Ingleside/Excelsior 51 6.55%94114 Castro/Eureka Valley 1 0.13%94115 Western Addition 47 6.03%94116 Parkside 14 1.80%94117 Haight Ashbury/L Western Addition 13 1.67%94118 Inner Richmond 7 0.90%94121 Outer Richmond 12 1.54%94122 Sunset 3 0.39%94123 Marina/Cow Hollow 1 0.13%94124 Bayview/Hunters Point 131 16.82%94127 Miraloma/Sunnyside 7 0.90%94130 Treasure Island 24 3.08%94131 Twin Peaks/Glen Park 7 0.90%94132 Lake Merced 21 2.70%94133 North Beach 15 1.93%94134 Visitacion Valley/Portola 63 8.09%
Non‐San Francisco and Unavailable 1 206 26.44%Total 779 100.00%
1 Non‐San Francisco and Unavailable Count %OAKLAND 45 21.84%DALY CITY 22 10.68%RICHMOND 12 5.83%HAYWARD 11 5.34%VALLEJO 10 4.85%ANTIOCH 8 3.88%SOUTH SAN FRANCISCO 6 2.91%OTHER CITIES 2 92 44.66%
Total 206 100.00%2Account for 48 cities with a minimum count of 1, maximumcount of 5, and average of 1.9

5
San Francisco Juvenile Probation Department 2015 Unduplicated Count of Juvenile Probation Referrals
By Geographical Residence of Youth Supervisorial District Boundaries
N=7791
1San Francisco = 573 (73.56%) Non-San Francisco = 206 (26.44%)

6
San Francisco Juvenile Probation Department 2015 Unduplicated Count of Juvenile Probation Referrals
By Geographical Residence of Youth San Francisco Zip Code Boundaries
N=7791
1San Francisco = 573 (73.56%) Non-San Francisco = 206 (26.44%)

7
Calendar Year 2015San Francisco Juvenile Probation Department
Duplicated Count of Juvenile Probation ReferralsN=1,204
Gender Count %FEMALE 305 25.33%MALE 899 74.67%
Total 1,204 100.00%
Race/Ethnic Origin Count %AFRICAN AMERICAN 679 56.40%ASIAN INDIAN 1 0.08%CHINESE 15 1.25%FILIPINO 20 1.66%HISPANIC 313 26.00%OTHER 23 1.91%OTHER ASIAN 9 0.75%PACIFIC ISLANDER 3 0.25%SAMOAN 44 3.65%VIETNAMESE 4 0.33%WHITE 93 7.72%
Total 1,204 100.00%
Age at Referral Count %Under 11 1 0.08%
11 10 0.83%12 29 2.41%13 47 3.90%14 123 10.22%15 201 16.69%16 310 25.75%17 375 31.15%18 94 7.81%
Over 18 14 1.16%Total 1,204 100.00%

8
San Francisco Juvenile Probation DepartmentDuplicated Count of Juvenile Probation Referrals -Criminal Offenses
2003-2015
Year Referrals03 2,19104 2,11305 2,17906 2,90007 2,35608 2,62809 2,36410 1,94511 1,57312 1,87113 1,09514 91615 752
Gender 2003 2004 2005 2006 2007 2008 2009 2010 2011 2012 2013 2014 2015Male 1,537 1,452 1,593 2,075 1,646 1,892 1,671 1,378 1,134 1,357 789 699 561Female 654 661 586 825 710 736 693 567 439 514 306 217 191
Total 2,191 2,113 2,179 2,900 2,356 2,628 2,364 1,945 1,573 1,871 1,095 916 752
0
500
1,000
1,500
2,000
2,500
3,000
3,500
03 04 05 06 07 08 09 10 11 12 13 14 15

9
Calendar Year 2015San Francisco Juvenile Probation DepartmentUnduplicated Count of Juvenile Hall Bookings
Criminal OffensesN=310
Gender Count %FEMALE 67 21.61%MALE 243 78.39%
Total 310 100.00%
Race/Ethnic Origin Count %AFRICAN AMERICAN 187 60.32%CHINESE 6 1.94%FILIPINO 5 1.61%HISPANIC 69 22.26%OTHER 3 0.97%PACIFIC ISLANDER 2 0.65%SAMOAN 15 4.84%VIETNAMESE 3 0.97%WHITE 20 6.45%
Total 310 100.00%
Age on 1/1/16 Count %11 1 0.32%12 3 0.97%13 11 3.55%14 18 5.81%15 41 13.23%16 60 19.35%17 108 34.84%18 64 20.65%
Over 18 4 1.29%Total 310 100.00%
10
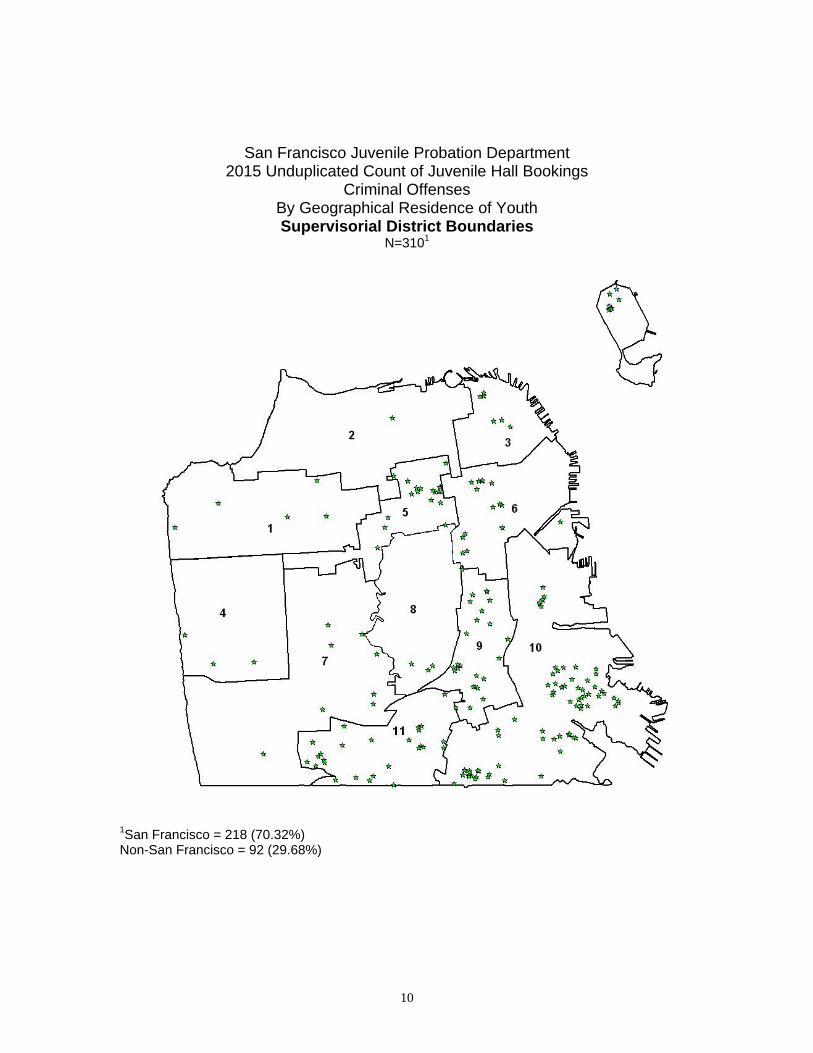
San Francisco Juvenile Probation Department 2015 Unduplicated Count of Juvenile Hall Bookings
Criminal Offenses By Geographical Residence of Youth Supervisorial District Boundaries
N=3101
1San Francisco = 218 (70.32%) Non-San Francisco = 92 (29.68%)

11
San Francisco Juvenile Probation Department 2015 Unduplicated Count of Juvenile Hall Bookings
Criminal Offenses By Geographical Residence of Youth
Zip Code Boundaries N=3101
1San Francisco = 218 (70.32%) Non-San Francisco = 92 (29.68%)
12
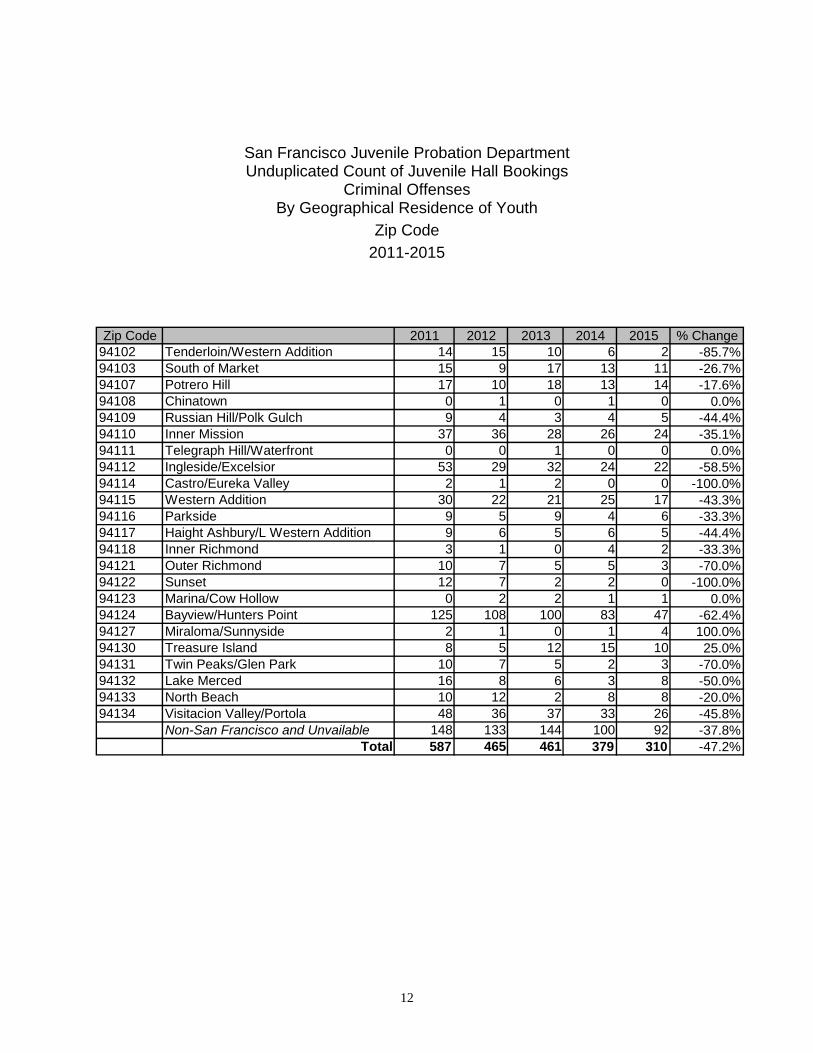
San Francisco Juvenile Probation Department Unduplicated Count of Juvenile Hall Bookings
Criminal Offenses By Geographical Residence of Youth
Zip Code 2011-2015
Zip Code 2011 2012 2013 2014 2015 % Change94102 Tenderloin/Western Addition 14 15 10 6 2 -85.7%94103 South of Market 15 9 17 13 11 -26.7%94107 Potrero Hill 17 10 18 13 14 -17.6%94108 Chinatown 0 1 0 1 0 0.0%94109 Russian Hill/Polk Gulch 9 4 3 4 5 -44.4%94110 Inner Mission 37 36 28 26 24 -35.1%94111 Telegraph Hill/Waterfront 0 0 1 0 0 0.0%94112 Ingleside/Excelsior 53 29 32 24 22 -58.5%94114 Castro/Eureka Valley 2 1 2 0 0 -100.0%94115 Western Addition 30 22 21 25 17 -43.3%94116 Parkside 9 5 9 4 6 -33.3%94117 Haight Ashbury/L Western Addition 9 6 5 6 5 -44.4%94118 Inner Richmond 3 1 0 4 2 -33.3%94121 Outer Richmond 10 7 5 5 3 -70.0%94122 Sunset 12 7 2 2 0 -100.0%94123 Marina/Cow Hollow 0 2 2 1 1 0.0%94124 Bayview/Hunters Point 125 108 100 83 47 -62.4%94127 Miraloma/Sunnyside 2 1 0 1 4 100.0%94130 Treasure Island 8 5 12 15 10 25.0%94131 Twin Peaks/Glen Park 10 7 5 2 3 -70.0%94132 Lake Merced 16 8 6 3 8 -50.0%94133 North Beach 10 12 2 8 8 -20.0%94134 Visitacion Valley/Portola 48 36 37 33 26 -45.8%
Non-San Francisco and Unvailable 148 133 144 100 92 -37.8%Total 587 465 461 379 310 -47.2%

13
San Francisco Juvenile Probation DepartmentUnduplicated Count of Juvenile Hall Bookings
Analysis of the Prior Bookings during 2015 For Criminal Offenses of Youth Admitted to Juvenile Hall in Calendar Year 2015
N=3102015Prior
Bookings Total0 2531 472 7
More than 3 3Total 310
Total
Number of Prior Bookings for Criminal Offenses during 20152015
Bookedone time 253 81.61%more than 1 57 18.39% Recidivist Rate
Total 310 100.00%
0
50
100
150
200
250
300
0 1 2 More than 3

14
San Francisco Juvenile Probation DepartmentDuplicated Count of Juvenile Hall Bookings -Criminal Offenses
2004-2015
Year Bookings04 1,10005 1,14406 1,37007 1,25208 1,28909 1,02510 84611 73612 57213 56314 46115 380
Gender 2004 2005 2006 2007 2008 2009 2010 2011 2012 2013 2014 2015Male 817 907 1,023 944 986 781 667 568 447 441 382 307Female 283 237 347 308 303 244 179 168 125 122 79 73
Total 1,100 1,144 1,370 1,252 1,289 1,025 846 736 572 563 461 380
0
200
400
600
800
1,000
1,200
1,400
1,600
04 05 06 07 08 09 10 11 12 13 14 15

15
City and County of San FranciscoJuvenile Probation Department
2015 Duplicated Count of Juvenile Hall Bookings –Sorted Most to Least SeriousCriminal Offense Using Department of Justice Summary Codes
Black White Hispanic Asian OtherDetention Reason Male Female Male Female Male Female Male Female Male Female Total %Willful Homicide 1 0 1 0 4 1 0 0 0 0 7 1.84Forcible Rape 0 1 0 0 0 0 0 0 0 0 1 0.26Robbery 65 23 4 0 9 5 5 0 10 1 122 32.11Assault* 22 9 1 2 12 5 3 0 3 2 59 15.53Kidnapping 1 0 0 0 1 0 0 0 0 0 2 0.53Burglary 27 0 0 0 4 0 1 0 2 0 34 8.95Theft 11 0 0 0 0 0 0 1 0 0 12 3.16Motor Vehicle Theft 11 1 1 0 2 2 0 0 0 0 17 4.47Narcotics 0 0 0 0 9 0 0 0 0 0 9 2.37Marijuana –Felony 2 0 0 0 3 0 1 0 0 0 6 1.58Dangerous Drugs 0 0 1 0 1 0 0 0 1 0 3 0.79Child Molest 0 0 0 0 1 0 0 0 0 0 1 0.26Weapons –Felony 19 0 1 0 5 0 1 0 4 0 30 7.89Hit and Run –Felony 1 0 0 0 0 0 0 0 0 0 1 0.26Arson 2 1 0 0 0 0 0 0 0 0 3 0.79Other Felonies 4 0 1 0 2 0 1 0 1 0 9 2.37Assault Battery 7 6 2 0 7 1 2 0 2 0 27 7.11Petty Theft 8 0 1 1 1 0 0 0 0 0 11 2.89Defrauding Innkeeper 1 1 0 0 0 0 0 0 0 0 2 0.53Prostitution 0 0 0 3 0 0 0 0 0 0 3 0.79Weapons –Misdemeanor 4 2 0 0 0 0 0 0 0 0 6 1.58Joy Riding 0 0 1 0 1 0 0 0 0 0 2 0.53Gambling 1 0 0 0 0 0 0 0 0 0 1 0.26Other Misdemeanors 0 0 0 1 2 1 0 0 0 0 4 1.05Escape 1 0 0 0 0 0 0 0 0 0 1 0.26Miscellaneous Traffic 0 0 0 0 1 0 0 0 0 0 1 0.26Other Drugs –Misdemeanor 1 0 0 0 1 0 0 0 0 0 2 0.53Burglary –Misdemeanor 0 3 0 0 1 0 0 0 0 0 4 1.05
Total 189 47 14 7 67 15 14 1 23 3 380 100.00% 49.74 12.37 3.68 1.84 17.63 3.95 3.68 0.26 6.05 0.79 100.00
*Includes 1 attempted murder.

16
Calendar Year 2015
Referral SourceDuplicated Count of Juvenile Hall Bookings
Criminal OffensesN=380
Law Enforcement ReferralsLocal Number PercentSan Francisco Police 343 90.26%BART PD 2 0.53%Out-of-County Police DepartmentsStateCalifornia Highway Patrol 1 0.26%FederalFederal Park Police 4 1.05%
Total out-of county police departments 5Total Law Enforcement 348 91.58%
Court Referrals Number PercentAlameda 1 0.26%Contra Costa 6 1.58%Fresno 1 0.26%Los Angeles 0 0.00%Merced 1 0.26%Sacramento 1 0.26%San Diego 0 0.00%San Joaquin 0 0.00%San Mateo 11 2.89%Santa Clara 0 0.00%Solano 1 0.26%Sonoma 0 0.00%Stanislaus 3 0.79%Tulare 0 0.00%
Total Court 25 6.58%Department/Agency Referrals Number PercentProbation Officer 5 1.32%
Total Department/Agency 5 1.32%Total Referrals - All Sources 380 100.00%

17
City and County of San FranciscoJuvenile Probation Department
Duplicated Count of Juvenile Hall BookingsCriminal Offenses
2011 2012 2013 2014 2015 Total %Part I CrimesMurder & Non-Negligent Manslaughter Willful Homicide 4 2 4 4 7 21 1.1% Manslaughter Not Vehicle 0 1 0 0 0 1 0.1% Manslaughter Vehicle 0 0 0 0 0 0 0.0%Negligent Manslaughter 0 0 0 0 0 0 0.0%Rape 1 3 7 1 1 13 0.7%Robbery 245 195 206 160 122 928 49.2%Aggravated Assault Assault 131 113 82 101 59 486 25.8% Kidnapping 9 3 1 5 2 20 1.1%Arson 11 3 1 0 3 18 1.0%Burglary 69 44 33 30 38 214 11.4%Auto Boosting (Larceny) 0 0 0 0 0 0 0.0%Larceny/Theft Theft 25 33 46 15 12 131 6.9%Motor Vehicle Theft 11 10 9 6 17 53 2.8%
Total Part I Crimes 506 407 389 322 261 1,885 100.0%Part II CrimesOther Assaults Sexual Battery 9 3 1 2 0 15 1.8% Assault Battery 43 22 35 23 27 150 18.1%Forgery and Counterfeiting Forgery, Checks, Access Cards 0 0 0 0 0 0 0.0%Fraud and Worthless Checks Bookmaking 0 0 0 0 0 0 0.0% Defrauding Innkeeper 2 0 1 1 2 6 0.7%Embezzlement 0 0 0 0 0 0 0.0%Receiving Stolen Property* 12 11 10 2 2 37 4.5%Vandalism 15 12 8 8 1 44 5.3%Weapons Offenses 57 51 41 43 36 228 27.6%Prostitution and Commercialized Vice Prostitution 16 10 11 0 3 40 4.8%Sex Offenses (Except Rape and Prostitution) 14 8 5 2 1 30 3.6%Drug Abuse Violations Narcotics 21 19 28 17 9 94 11.4% Marijuana 7 6 12 10 6 41 5.0% Dangerous Drugs 2 2 3 2 3 12 1.5%Gambling 0 0 0 0 1 1 0.1%Offense Against Family and Children 0 0 0 0 0 0 0.0%Driving Under the Influence 2 1 0 0 0 3 0.4%Malicious Mischief 0 0 0 0 0 0 0.0%Liquor Laws 0 0 0 0 0 0 0.0%Drunkenness 1 1 1 0 0 3 0.4%Desorderly Conduct 0 0 1 0 0 1 0.1%Curfew and Loitering Laws 0 0 0 0 0 0 0.0%All Other Offenses (Except Traffic) 29 19 17 29 28 122 14.8%
Total Part II Crimes 230 165 174 139 119 827 100.0%Total Part I and Part II Crimes 736 572 563 461 380 2,712*Summary Code includes it with the Theft category

18
Calendar Year 2015 Duplicated Count of Juvenile Hall Bookings
Criminal Offenses
N=380
Crime Type TotalGender Felony Misdemeanor Total % %
Female Crime TypeDrug Crimes 0 0 0 0.0%Person Crimes 49 7 56 76.7%Property Crimes 5 5 10 13.7%Public Order Crimes 0 7 7 9.6%
Total 54 19 73 100.0% 19.2%
Male Drug Crimes 18 2 20 6.5%Person Crimes 144 20 164 53.4%Property Crimes 65 14 79 25.7%Public Order Crimes 35 9 44 14.3%
Total 262 45 307 100.0% 80.8%
Total 316 64 380 100.0%
Offense Degree Level

19
Calendar Year 2015 Duplicated Count of Juvenile Hall Bookings
Criminal Offenses
N=380
Crime Type TotalRace/Ethnic Origin Crime Type Felony Misdemeanor Total % %
African American Drug 2 1 3 1.3%Person 122 13 135 57.2%Property 56 13 69 29.2%Public Order 21 8 29 12.3%
Total 201 35 236 100.0% 62.1%
Asian Drug 1 0 1 6.7%Person 9 2 11 73.3%Property 2 0 2 13.3%Public Order 1 0 1 6.7%
Total 13 2 15 100.0% 3.9%
Hispanic Drug 13 1 14 17.1%Person 38 8 46 56.1%Property 9 3 12 14.6%Public Order 6 4 10 12.2%
Total 66 16 82 100.0% 21.6%
Other Drug 1 0 1 3.8%Person 16 2 18 69.2%Property 2 0 2 7.7%Public Order 5 0 5 19.2%
Total 24 2 26 100.0% 6.8%
White Drug 1 0 1 4.8%Person 8 2 10 47.6%Property 1 3 4 19.0%Public Order 2 4 6 28.6%
Total 12 9 21 100.0% 5.5%Grand Total 316 64 380 100.0%

20
City and County of San FranciscoJuvenile Probation Department
2015 Duplicated Count of Petitions Filed –Sorted Most to Least SeriousCriminal Offense Using Department of Justice Summary Codes
Black White Hispanic Asian OtherPetition Reason Male Female Male Female Male Female Male Female Male Female Total %Willful Homicide 0 0 0 0 2 0 0 0 0 0 2 0.53Forcible Rape 0 0 0 0 1 0 0 0 0 0 1 0.27Robbery 55 22 5 0 8 2 1 0 10 1 104 27.59Assault 22 14 1 1 10 3 3 0 4 1 59 15.65Kidnapping 2 0 0 0 1 0 0 0 0 0 3 0.80Burglary 27 1 2 0 7 0 1 0 1 0 39 10.34Theft 12 1 0 0 3 0 0 1 1 0 18 4.77Motor Vehicle Theft 5 1 1 0 4 1 0 0 0 0 12 3.18Narcotics 1 0 0 0 10 0 0 0 0 0 11 2.92Marijuana –Felony 3 0 1 0 3 0 1 0 1 0 9 2.39Weapons –Felony 12 2 2 0 6 0 2 0 1 0 25 6.63Hit and Run 1 0 0 0 0 0 0 0 0 0 1 0.27Arson 1 0 0 0 0 0 0 0 0 0 1 0.27Other Felonies 5 0 0 0 2 0 1 0 0 0 8 2.12Assault Battery 9 6 0 0 5 0 1 0 0 1 22 5.84Petty Theft 7 7 1 0 3 2 0 0 1 0 21 5.57Defrauding Innkeeper 3 1 0 0 1 0 0 0 0 0 5 1.33Checks, Access Cards 1 0 0 0 0 0 0 0 0 0 1 0.27Marijuana –Misdemeanor 0 0 0 0 0 0 0 0 1 0 1 0.27Vandalism 1 1 0 0 1 0 1 0 0 0 4 1.06Weapons –Misdemeanor 1 2 1 0 1 0 0 0 0 0 5 1.33Driving Under the Influence 0 0 0 0 1 1 0 0 0 0 2 0.53Hit and Run -Misdemeanor 0 0 0 0 1 0 0 0 0 0 1 0.27Joy Riding 1 0 1 0 1 0 0 0 0 0 3 0.80Other Misdemeanors 1 0 0 2 3 1 0 0 0 0 7 1.86Burglary Tools 1 0 0 0 0 0 0 0 0 0 1 0.27Other drugs –Misdemeanor 1 0 0 0 0 0 0 0 0 0 1 0.27Burglary –Misdemeanor 2 4 0 1 2 0 0 1 0 0 10 2.65
Total 174 62 15 4 76 10 11 2 20 3 377 100.00% 46.15 16.45 3.98 1.06 20.16 2.65 2.92 0.53 5.31 0.80 100.00

21
Calendar Year 2015 Duplicated Count of Petitions Filed
Criminal Offenses
N=377
Crime Type TotalGender Felony Misdemeanor Total % %
Female Crime TypeDrug Crimes 0 0 0 0.0%Person Crimes 44 7 51 63.0%Property Crimes 5 17 22 27.2%Public Order Crimes 2 6 8 9.9%
Total 51 30 81 100.0% 21.5%
Male Drug Crimes 20 2 22 7.4%Person Crimes 125 15 140 47.3%Property Crimes 66 28 94 31.8%Public Order Crimes 31 9 40 13.5%
Total 242 54 296 100.0% 78.5%
Total 293 84 377 100.0%
Offense Degree Level

22
Calendar Year 2015 Duplicated Count of Petitions Filed
Criminal Offenses
N=377
Crime Type TotalRace/Ethnic Origin Crime Type Felony Misdemeanor Total % %
African American Drug 4 1 5 2.1%Person 115 15 130 55.1%Property 49 28 77 32.6%Public Order 19 5 24 10.2%
Total 187 49 236 100.0% 62.6%
Asian Drug 1 0 1 7.7%Person 4 1 5 38.5%Property 2 2 4 30.8%Public Order 3 0 3 23.1%
Total 10 3 13 100.0% 3.4%
Hispanic Drug 13 0 13 15.1%Person 27 5 32 37.2%Property 15 11 26 30.2%Public Order 8 7 15 17.4%
Total 63 23 86 100.0% 22.8%
Other Drug 1 1 2 8.7%Person 16 1 17 73.9%Property 2 1 3 13.0%Public Order 1 0 1 4.3%
Total 20 3 23 100.0% 6.1%
White Drug 1 0 1 5.3%Person 7 0 7 36.8%Property 3 3 6 31.6%Public Order 2 3 5 26.3%
Total 13 6 19 100.0% 5.0%Grand Total 293 84 377 100.0%

23
City and County of San FranciscoJuvenile Probation Department
2015 Duplicated Count of Petitions Sustained –Sorted Most to Least SeriousCriminal Offense Using Department of Justice Summary Codes
Black White Hispanic Asian OtherPetition Sustained Male Female Male Female Male Female Male Female Male Female Total %Willful Homicide 0 0 0 0 1 0 0 0 0 0 1 0.36Robbery 29 7 4 0 5 1 1 0 9 1 57 20.65Assault 15 6 0 0 2 4 0 0 1 1 29 10.51Kidnapping 1 0 0 0 0 0 0 0 0 0 1 0.36Burglary 12 0 1 0 1 0 0 0 0 0 14 5.07Theft 10 1 0 0 2 0 0 1 0 0 14 5.07Motor Vehicle Theft 1 1 0 0 3 0 0 0 0 0 5 1.81Narcotics 0 0 0 0 2 0 0 0 0 0 2 0.72Dangerous Drugs 0 0 0 0 1 0 0 0 0 0 1 0.36Child Molest –Felony 0 0 0 0 1 0 0 0 0 0 1 0.36Weapons –Felony 9 1 1 0 5 0 0 0 1 0 17 6.16Hit and Run –Felony 1 0 0 0 0 0 0 0 0 0 1 0.36Other Felonies 1 0 0 0 0 0 0 0 0 0 1 0.36Assault Battery 17 12 0 1 7 0 2 0 1 1 41 14.86Petty Theft 10 8 1 0 4 2 0 0 2 0 27 9.78Defrauding Innkeeper 5 2 0 0 0 0 1 0 0 0 8 2.90Checks, Access Cards 1 0 0 0 0 0 0 0 0 0 1 0.36Marijuana –Misdemeanor 2 0 0 0 1 0 0 0 1 0 4 1.45Vandalism 1 0 0 0 2 0 1 0 0 0 4 1.45Weapons –Misdemeanor 1 3 2 0 2 0 0 0 0 0 8 2.90Driving Under the Influence 0 0 0 0 1 1 0 0 0 0 2 0.72Hit and Run - Misdemeanor 0 0 1 0 0 0 0 0 0 0 1 0.36Joy Riding 3 0 1 0 1 0 0 0 0 0 5 1.81Other Misdemeanors 0 1 0 1 3 1 1 0 0 0 7 2.54Burglary Tools 1 0 0 0 0 0 0 0 0 0 1 0.36Other drugs –Misdemeanor 1 0 0 0 2 0 0 0 0 0 3 1.09Burglary –Misdemeanor 10 3 0 1 4 0 0 1 1 0 20 7.25
Total 131 45 11 3 50 9 6 2 16 3 276 100.00% 47.46 16.30 3.99 1.09 18.12 3.26 2.17 0.72 5.80 1.09 100.00

24
Calendar Year 2015 Duplicated Count of Petitions Sustained
Criminal Offenses
N=276
Crime Type TotalGender Felony Misdemeanor Total % %
Female Crime TypeDrug Crimes 0 0 0 0.0%Person Crimes 20 14 34 54.8%Property Crimes 3 17 20 32.3%Public Order Crimes 1 7 8 12.9%
Total 24 38 62 100.0% 22.5%
Male Drug Crimes 2 8 10 4.7%Person Crimes 69 27 96 44.9%Property Crimes 31 49 80 37.4%Public Order Crimes 17 11 28 13.1%
Total 119 95 214 100.0% 77.5%
Total 143 133 276 100.0%
Offense Degree Level

25
Calendar Year 2015 Duplicated Count of Petitions Sustained
Criminal Offenses
N=276
Crime Type TotalRace/Ethnic Origin Crime Type Felony Misdemeanor Total % %
African American Drug 0 3 3 1.7%Person 58 29 87 49.4%Property 26 43 69 39.2%Public Order 11 6 17 9.7%
Total 95 81 176 100.0% 63.8%
Asian Drug 0 0 0 0.0%Person 1 2 3 37.5%Property 1 3 4 50.0%Public Order 0 1 1 12.5%
Total 2 6 8 100.0% 2.9%
Hispanic Drug 2 4 6 10.2%Person 14 7 21 35.6%Property 6 13 19 32.2%Public Order 5 8 13 22.0%
Total 27 32 59 100.0% 21.4%
Other Drug 0 1 1 5.3%Person 12 2 14 73.7%Property 0 3 3 15.8%Public Order 1 0 1 5.3%
Total 13 6 19 100.0% 6.9%
White Drug 0 0 0 0.0%Person 4 1 5 35.7%Property 1 4 5 35.7%Public Order 1 3 4 28.6%
Total 6 8 14 100.0% 5.1%Grand Total 143 133 276 100.0%

26
San Francisco Juvenile Probation DepartmentCalendar Year 2015
Juvenile Hall Daily PopulationAverage 56
0
20
40
60
80
100
120
140
160
1/1/
2015
1/15
/201
5
1/29
/201
5
2/12
/201
5
2/26
/201
5
3/12
/201
5
3/26
/201
5
4/9/
2015
4/23
/201
5
5/7/
2015
5/21
/201
5
6/4/
2015
6/18
/201
5
7/2/
2015
7/16
/201
5
7/30
/201
5
8/13
/201
5
8/27
/201
5
9/10
/201
5
9/24
/201
5
10/8
/201
5
10/2
2/20
15
11/5
/201
5
11/1
9/20
15
12/3
/201
5
12/1
7/20
15
12/3
1/20
15
Rated Capacity 150
AverageMale 48Female 9

27
San Francisco Juvenile Probation DepartmentCalendar Year 2015
Juvenile Hall Monthly Average Length of StayN=704
Average 26 days
0
5
10
15
20
25
30
35
40
45
50
1 2 3 4 5 6 7 8 9 10 11 12
Month
Day
s

28
Log Cabin Ranch 15 3.98%
San Francisco Juvenile Court Processing of Law Violation Cases Referrals for Criminal Offenses –Calendar Year 2015
Out of Home Placement 46 12.20%
Non-Ward Probation (725a WI) 11 2.92%
Ward Probation 88 23.34%
Department Juvenile Justice* 1 0.27%
Transferred Out of County 62 16.45%
Informal Probation (654 WI) 27 7.16%
Dispositions* Petition Filed 377 50.13%
No Petition Filed 375 49.87%
Referrals 752
Juvenile Hall Bookings 380 50.53%
Petition Dismissed 40 10.61%
Remand Adult Court* 0 0.00%
Non- Juvenile Hall Bookings 372 49.47%
Note: 19 (5.04%) charges on other petitions were Combined and only one disposition resulted. Waiting Adjudication/Disposition: 68 (18.04%)
*Includes Petition Outcomes dated as of 1/31/2016 and it will not match the outcomes of page 2 (all referrals outcome).Does not include violation of probation and criminal offense petitions filed prior to 2015.

San Francisco Juvenile Justice System Terms: Arrest: The taking of a minor into custody by the police, when the police believe that the minor has committed a violation of a criminal law. A minor may also be taken into custody by the police for an alleged probation violation or pursuant to a warrant issued by a court. While the use of the term arrest is commonplace, technically minors are not arrested; they are detained or taken into temporary custody by the police. Case: The opening of a file by any agency for a minor who is being processed by that agency because the minor is alleged to have committed an act that violated a criminal law or an act that is illegal only for minors. Citation: The issuance of a written document to a minor by the police, informing the minor of an offense that the minor is alleged to have committed and ordering the minor to appear before a probation officer on a certain date and time. The minor will not be kept in the custody of the police after the citation is issued. Detention (secure): When a minor is placed in secure custody at Juvenile Hall and is remains overnight (technically, is arrested on one day and remains in JH at 6 a.m. the next). Home Detention (non- secure): When a minor is released to her or his home, rather than put into secure detention, but with strict conditions placed on the minor by the Juvenile Court or the Juvenile Probation Department. Dismissal: When formal charges against a minor, contained in a petition to the Juvenile Court, are dismissed and therefore the minor is not brought under the formal jurisdiction of the Court. Disposition: A decision by the Juvenile Court with respect to what placement/supervision a minor who is made a ward of the Court will receive. A minor placed under the formal supervision of the Court is made "a ward of the Court." Law violation: A charge that a minor has committed an act that would be a criminal act if committed by an adult. Booking: The process of admitting a person to Juvenile Hall. Referral: The Juvenile Probation Department counts as a referral all separate instances when a minor is cited or brought to the JPD. It uses the term contact interchangeably with referral and indicates that each contact represents a "unit of work" for the Department. Referrals include contacts beyond those related to arrests, citations, bookings, or cases. Petition: A formal statement by the District Attorney’s Office alleging that the juvenile is delinquent for committing specified offense. Petition Sustained: Charges are found true. Most serious charge: Of all the charges on the petition, the charge ranked most serious by the California Department of Justice hierarchy, which carries the most jail time.
29

APPENDIX

2015 Profile of Girls

1
San Francisco Juvenile Probation Department Profile of Girls
Unduplicated Count of Juvenile Hall Bookings by Geographical Residence of Youth Criminal Offenses
Zip Code Description Count %94102 Tenderloin/Western Addition 1 1.49%94103 South of Market 6 8.96%94107 Potrero Hill 3 4.48%94109 Russian Hill/Polk Gulch 1 1.49%94110 Inner Mission 0 0.00%94111 Telegraph Hill/Waterfront 0 0.00%94112 Ingleside/Excelsior 5 7.46%94115 Western Addition 2 2.99%94116 Parkside 1 1.49%94117 Haight Ashbury/L Western Addition 2 2.99%94121 Outer Richmond 0 0.00%94124 Bayview/Hunters Point 13 19.40%94127 Miraloma/Sunnyside 1 1.49%94130 Treasure Island 3 4.48%94132 Lake Merced 0 0.00%94133 North Beach 2 2.99%94134 Visitacion Valley/Portola 8 11.94%
Non‐San Francisco 1 19 28.36%Total 67 100.00%
1 Non‐San Francisco Count %Oakland 5 26.32%Daly City 3 15.79%Richmond 2 10.53%Hayward 2 10.53%Fairfield 1 5.26%Fremont 1 5.26%Mill Valley 1 5.26%Napa 1 5.26%Stockton 1 5.26%Union City 1 5.26%Vancouver 1 5.26%
Total 19 100.00%

2
San Francisco Juvenile Probation DepartmentProfile of Girls
Unduplicated Count of Juvenile Hall Bookings Analysis of the Prior Bookings during 2015 For Criminal Offenses
of Youth Admitted to Juvenile Hall in Calendar Year 2015N=67
2015Prior
Bookings Total0 621 42 1
Total 67
Total
2015 Number of Prior Bookings for Criminal Offenses during 2015Booked one time 62 92.54%more than 1 5 7.46% Recidivist Rate
Total 67 100.00%
0
10
20
30
40
50
60
70
0 1 2

3
Calendar Year 2015San Francisco Juvenile Probation Department
Profile of GirlsUnduplicated Count of Juvenile Hall Bookings
Criminal OffensesN=67
Race/Ethnic Origin Count %AFRICAN AMERICAN 43 64.18%FLIPINO 1 1.49%HISPANIC 13 19.40%PACIFIC ISLANDER 1 1.49%SAMOAN 2 2.99%WHITE 7 10.45%
Total 67 100.00%
Age on 1/1/16 Count %11 1 1.49%12 0 0.00%13 3 4.48%14 15 22.39%15 13 19.40%16 17 25.37%17 18 26.87%18 0 0.00%
Over 18 0 0.00%Total 67 100.00%

4
Calendar Year 2015Profile of Girls
Referral SourceDuplicated Count of Juvenile Hall Bookings
Criminal OffensesN=73
Law Enforcement ReferralsLocal Number PercentSan Francisco Police 63BART PD 1
Total 64 87.67%Out-of-County Police DepartmentsPolice Department 0
Total 0 0.00%StateCalifornia Highway Patrol 0California State Police 0
Total 0 0.00%FederalFederal Park Police 0
Total 0 0.00%Total Law Enforcement 64 87.67%
Court Referrals Number PercentContra Costa 1Fresno 1San Mateo 4Stanislaus 2Sonoma 0
Total Court 8 10.96%Department/Agency Referrals Number PercentProbation Officer 1
Total Department/Agency 1 1.37%Total Referrals - All Sources 73 100.00%

5
Profile of Girls2015
Criminal Offense Using Department of Justice Summary Codes
Detention Reason African American White Hispanic Asian Other Total %Willful Homicide 0 0 1 0 0 1 1.37Forcible Rape 1 0 0 0 0 1 1.37Robbery 23 0 5 0 1 29 39.73Assault 9 2 5 0 2 18 24.66Theft 0 0 0 1 0 1 1.37Motor Vehicle Theft 1 0 2 0 0 3 4.11Arson 1 0 0 0 0 1 1.37Assault Battery 6 0 1 0 0 7 9.59Petty Theft 0 1 0 0 0 1 1.37Defrauding Innkeeper 1 0 0 0 0 1 1.37Prostitution 0 3 0 0 0 3 4.11Weapons -Misdemeanor 2 0 0 0 0 2 2.74Other Misdemeanors 0 1 1 0 0 2 2.74Burglary -Misdemeanor 3 0 0 0 0 3 4.11
Total 47 7 15 1 3 73 100.00
Top 6 Criminal Offenses
Robbery 29 46.03%Assault 18 28.57%Assault Battery 7 11.11%Motor Vehicle Theft 3 4.76%Prostitution 3 4.76%Burglary - Misdemeanor 3 4.76%
Total 63 100.00%
Top 6 Criminal Offenses
0
5
10
15
20
25
30
35
Robbery Assault Assault Battery Motor Vehicle Theft Prostitution Burglary -Misdemeanor

6
Profile of Girls Duplicated Count of Juvenile Hall Bookings
Criminal Offenses N=73
Crime Type TotalRace/Ethnic Origin Crime Type Felony Misdemeanor Total % %
African American Drug 0 0 0 0.0%Person 33 6 39 83.0%Property 2 4 6 12.8%Public Order 0 2 2 4.3%
Total 35 12 47 100.0% 64.4%
Asian Drug 0 0 0 0.0%Person 0 0 0 0.0%Property 1 0 1 0.0%Public Order 0 0 0 0.0%
Total 1 0 1 0.0% 1.4%
Hispanic Drug 0 0 0 0.0%Person 11 1 12 85.7%Property 2 0 2 14.3%Public Order 0 1 0 0.0%
Total 13 2 14 100.0% 19.2%
Other Drug 0 0 0 0.0%Person 3 0 3 100.0%Property 0 0 0 0.0%Public Order 0 0 0 0.0%
Total 3 0 3 100.0% 4.1%
White Drug 0 0 0 0.0%Person 2 0 2 28.6%Property 0 1 1 14.3%Public Order 0 4 4 57.1%
Total 2 5 7 100.0% 9.6%Grand Total 54 19 73 98.6%
Offense Degree Level
Felony74%
Misdemeanor26%

7
Profile of Girls Duplicated Count of Juvenile Hall Bookings
Criminal Offenses N=73
Length Of Stay (Days) Count %
1 4 5.48%2 6 8.22%3 7 9.59%4 4 5.48%5 3 4.11%6 1 1.37%7 1 1.37%8 4 5.48%9 3 4.11%
10 2 2.74%11 3 4.11%12 5 6.85%13 1 1.37%14 3 4.11%15 2 2.74%16 1 1.37%17 2 2.74%19 1 1.37%20 3 4.11%23 1 1.37%24 2 2.74%26 1 1.37%27 1 1.37%28 1 1.37%29 1 1.37%
30‐40 days 4 5.48%Over 40 days 6 8.22%
Total 73 100.00%Average Length of Stay 18 days

8
Calendar Year 2015San Francisco Juvenile Probation Department
Profile of GirlsUnduplicated Count of Juvenile Hall Bookings (All Referrals)
N=1061
Race/Ethnic Origin Count %AFRICAN AMERICAN 65 61.32%FILIPINO 3 2.83%HISPANIC 26 24.53%PACIFIC ISLANDER 1 0.94%SAMOAN 3 2.83%WHITE 8 7.55%
Total 106 100.00%
Age on 1/1/16 Count %11 1 0.94%12 0 0.00%13 3 2.83%14 16 15.09%15 26 24.53%16 24 22.64%17 31 29.25%18 5 4.72%
Over 18 0 0.00%Total 106 100.00%
1 Includes Court Orders, Violation of Probation, Home Detention Failures, Warrants, Transfersfrom other counties, Placement Failures plus all criminal offenses
9
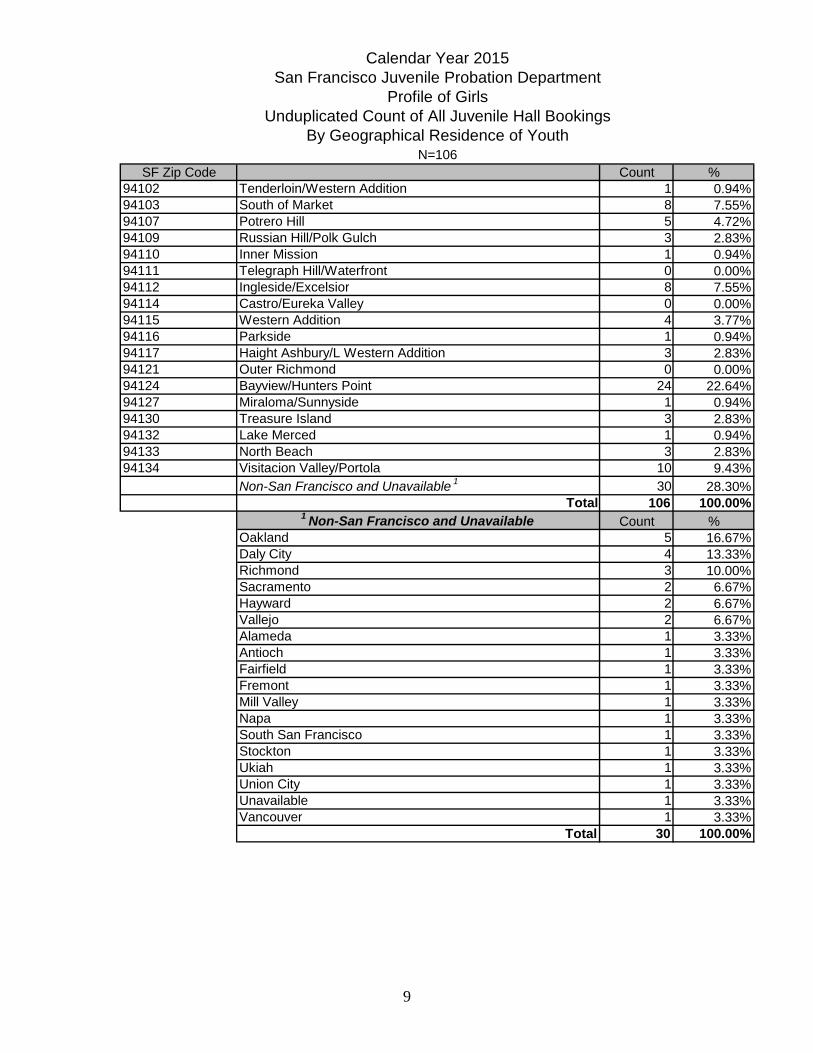
Calendar Year 2015San Francisco Juvenile Probation Department
Profile of GirlsUnduplicated Count of All Juvenile Hall Bookings
By Geographical Residence of YouthN=106
SF Zip Code Count %94102 Tenderloin/Western Addition 1 0.94%94103 South of Market 8 7.55%94107 Potrero Hill 5 4.72%94109 Russian Hill/Polk Gulch 3 2.83%94110 Inner Mission 1 0.94%94111 Telegraph Hill/Waterfront 0 0.00%94112 Ingleside/Excelsior 8 7.55%94114 Castro/Eureka Valley 0 0.00%94115 Western Addition 4 3.77%94116 Parkside 1 0.94%94117 Haight Ashbury/L Western Addition 3 2.83%94121 Outer Richmond 0 0.00%94124 Bayview/Hunters Point 24 22.64%94127 Miraloma/Sunnyside 1 0.94%94130 Treasure Island 3 2.83%94132 Lake Merced 1 0.94%94133 North Beach 3 2.83%94134 Visitacion Valley/Portola 10 9.43%
Non-San Francisco and Unavailable 1 30 28.30%Total 106 100.00%
1 Non-San Francisco and Unavailable Count %Oakland 5 16.67%Daly City 4 13.33%Richmond 3 10.00%Sacramento 2 6.67%Hayward 2 6.67%Vallejo 2 6.67%Alameda 1 3.33%Antioch 1 3.33%Fairfield 1 3.33%Fremont 1 3.33%Mill Valley 1 3.33%Napa 1 3.33%South San Francisco 1 3.33%Stockton 1 3.33%Ukiah 1 3.33%Union City 1 3.33%Unavailable 1 3.33%Vancouver 1 3.33%
Total 30 100.00%

10
San Francisco Juvenile Probation DepartmentCalendar Year 2015
Profile of GirlsDuplicated Count of All Juvenile Hall Bookings by Offense Degree Level
N=157
Offense Degree Offense Count %FELONY Arson 1 0.64%
Assault 18 11.46%Forcible Rape 1 0.64%Motor Vehicle Theft 3 1.91%Other Felony 1 0.64%Robbery 29 18.47%Theft 1 0.64%Willful Homicide 1 0.64%
Total 55 35.03%MISDEMEANOR Assault Battery 7 4.46%
Burglary 3 1.91%Change of Placement/Placement Failure 14 8.92%Other Misdemeanors 2 1.27%Other Theft 1 0.64%Petty Theft 1 0.64%Probation Violation 8 5.10%Prostitution 3Violation of Home Supervision 10 6.37%Weapons 2 1.27%
Total 51 32.48%OTHER Arrest Warrant 36 22.93%
Bench Warrant 4 2.55%Court Order 6 3.82%Warrant From Another County 5 3.18%
Total 51 32.48%
Grand Total 157 98.09% 100.00%

2015 Probation Violations

1
Calendar Year 2015San Francisco Juvenile Probation Department
Unduplicated Count of Probation Violation Petitions FiledN=88
Gender Count %FEMALE 14 15.91%MALE 74 84.09%
Total 88 100.00%
Race/Ethnic Origin Count %AFRICAN AMERICAN 51 57.95%FILIPINO 4 4.55%HISPANIC 23 26.14%OTHER 1 1.14%PACIFIC ISLANDER 1 1.14%SAMOAN 6 6.82%WHITE 2 2.27%
Total 88 100.00%
Age on 1/1/16 Count %13 0 0.00%14 2 2.27%15 4 4.55%16 17 19.32%17 20 22.73%18 30 34.09%
Over 18 15 17.05%Total 88 100.00%

2
Calendar Year 2015San Francisco Juvenile Probation Department
Unduplicated Count of Probation Violation Petitions FiledN=88
Zip Code Count %94102 Tenderloin/Western Addition 2 2.27%94103 South of Market 6 6.82%94105 Rincon Hill 0 0.00%94107 Potrero Hill 4 4.55%94108 Chinatown 0 0.00%94109 Russian Hill/Polk Gulch 4 4.55%94110 Inner Mission 12 13.64%94111 Telegraph Hill/Waterfront 0 0.00%94112 Ingleside/Excelsior 9 10.23%94114 Castro/Eureka Valley 0 0.00%94115 Western Addition 4 4.55%94116 Parkside 0 0.00%94117 Haight Ashbury/L Western Addition 0 0.00%94118 Inner Richmond 0 0.00%94121 Outer Richmond 1 1.14%94122 Sunset 0 0.00%94123 Marina/Cow Hollow 1 1.14%94124 Bayview/Hunters Point 18 20.45%94127 Miraloma/Sunnyside 0 0.00%94130 Treasure Island 4 4.55%94131 Twin Peaks/Glen Park 1 1.14%94132 Lake Merced 2 2.27%94133 North Beach 2 2.27%94134 Visitacion Valley/Portola 9 10.23%
Non‐San Francisco and Unavailable 1 9 10.23%Total 88 89.77%
1 Non‐San Francisco and Unavailable Count %American Canyon 1 11.11%Daly City 2 22.22%Lilburn 1 11.11%Oakley 1 11.11%Sacramento 1 11.11%South San Francisco 1 11.11%Vallejo 2 22.22%
Total 9 100.00%

3
San Francisco Juvenile Probation DepartmentUnduplicated Count of Petitions Filed For Probation Violation
Analysis of Prior Petitions Filed For Probation Violation Calendar Year 2015
N=88
PriorPetitions Total
0 681 172 3
Total 88
Total
Number of Prior Petitions for Probation Violation During 2015Prior Petitionsone 68 77.27%more than 1 20 22.73% Recidivist Rate
Total 88 100.00%
0
10
20
30
40
50
60
70
80
0 1 2

4
San Francisco Juvenile Probation Department
Duplicated Count of Petitions Filed For Probation Violation2004-2015
Year Petitions04 21505 22606 24707 21508 19909 17310 21911 16312 14213 11014 11015 112
Gender 2004 2005 2006 2007 2008 2009 2010 2011 2012 2013 2014 2015Male 164 183 202 178 146 146 176 132 125 93 90 90Female 51 43 45 37 53 27 43 31 17 17 20 22
Total 215 226 247 215 199 173 219 163 142 110 110 112
0
50
100
150
200
250
300
04 05 06 07 08 09 10 11 12 13 14 15
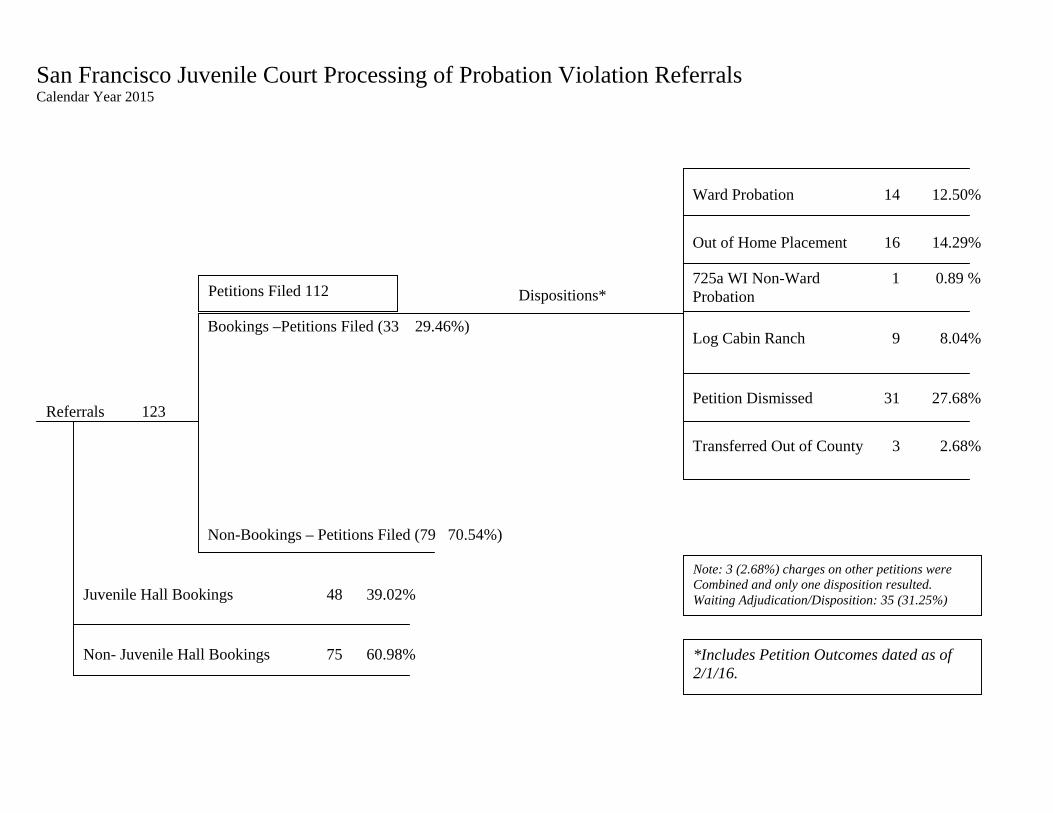
Log Cabin Ranch 9 8.04%
San Francisco Juvenile Court Processing of Probation Violation Referrals Calendar Year 2015
Out of Home Placement 16 14.29%
725a WI Non-Ward 1 0.89 % Probation
Ward Probation 14 12.50%
Transferred Out of County 3 2.68%
Dispositions*
Bookings –Petitions Filed (33 29.46%)
Non-Bookings – Petitions Filed (79 70.54%)
Referrals 123
Juvenile Hall Bookings 48 39.02%
Petition Dismissed 31 27.68%
Non- Juvenile Hall Bookings 75 60.98%
Note: 3 (2.68%) charges on other petitions were Combined and only one disposition resulted. Waiting Adjudication/Disposition: 35 (31.25%)
*Includes Petition Outcomes dated as of 2/1/16.
Petitions Filed 112
2014-2015 Profile of Domestic Violence Offenders

1
San Francisco Juvenile Probation DepartmentPetitions Filed for Domestic Violence Offenders in 2014 and 2015
Unduplicated Count*
Gender 2014 2015 % ChangeFemale 3 3 0.00%Male 14 8 ‐42.86%
Total 17 11 ‐35.29%
Race/Ethnic Origin 2014 2015 % ChangeAFRICAN AMERICAN 7 3 ‐57.14%CHINESE 1 1 0.00%FILIPINO 1 1 0.00%HISPANIC 6 3 ‐50.00%OTHER 0 1 100.00%WHITE 2 2 0.00%
Total 17 11 ‐35.29%
Age at First Petition 2014 2015 % Change12 1 0 ‐100.00%13 4 0 ‐100.00%14 1 0 ‐100.00%15 3 5 66.67%16 5 4 ‐20.00%17 3 2 ‐33.33%
Total 17 11 ‐35.29%
* A youth is only count once even though the youth might have more than
one petition filed in 2014 or 2015.
2014 2015 % ChangeOther Criminal Offenses Petitions Filed 411 297 ‐27.74%Domestic Violence Petitions 17 11 ‐35.29%
Total 428 308 ‐28.04%Percentage of Domestic Violence 3.97% 3.57%
Percentage of Other Criminal Petitions 96.03% 96.43%100.00% 100.00%

2
San Francisco Juvenile Probation Department Petitions Filed for Domestic Violence Offenders in 2014 and 2015
By Geographical Residence of Youth Unduplicated Count
Calendar Year 2015
Calendar Year 2014
ZipCode Count %94112 Ingleside/Excelsior 2 11.76%94115 Western Addition 2 11.76%94121 Outer Richmond 1 5.88%94124 Bayview/Hunters Point 6 35.29%94134 Visitacion Valley/Portola 1 5.88%
Non‐San Francisco 5 29.41%Total 17 100.00%
Non‐San Francisco Count %HAYWARD 1 20.00%OAKLAND 1 20.00%PACIFICA 1 20.00%RICHMOND 1 20.00%VANCOUVER 1 20.00%
Total 5 100.00%
ZipCode Count %94107 Potrero Hill 1 9.09%94112 Ingleside/Excelsior 4 36.36%94124 Bayview/Hunters Point 2 18.18%94127 Miraloma/Sunnyside 1 9.09%94130 Treasure Island 1 9.09%94133 North Beach 1 9.09%
Non‐San Francisco 1 9.09%Total 11 100.00%

3
San Francisco Juvenile Probation DepartmentDuplicated Count of Petitions Filed For Domestic Violence Offenders
2010-2015
Year Petitions10 2911 2212 2513 2414 2015 12
Gender 2010 2011 2012 2013 2014 2015 TotalMale 28 12 16 14 17 10 97Female 1 10 9 10 3 2 35
Total 29 22 25 24 20 12 132
0
5
10
15
20
25
30
35
10 11 12 13 14 15
4
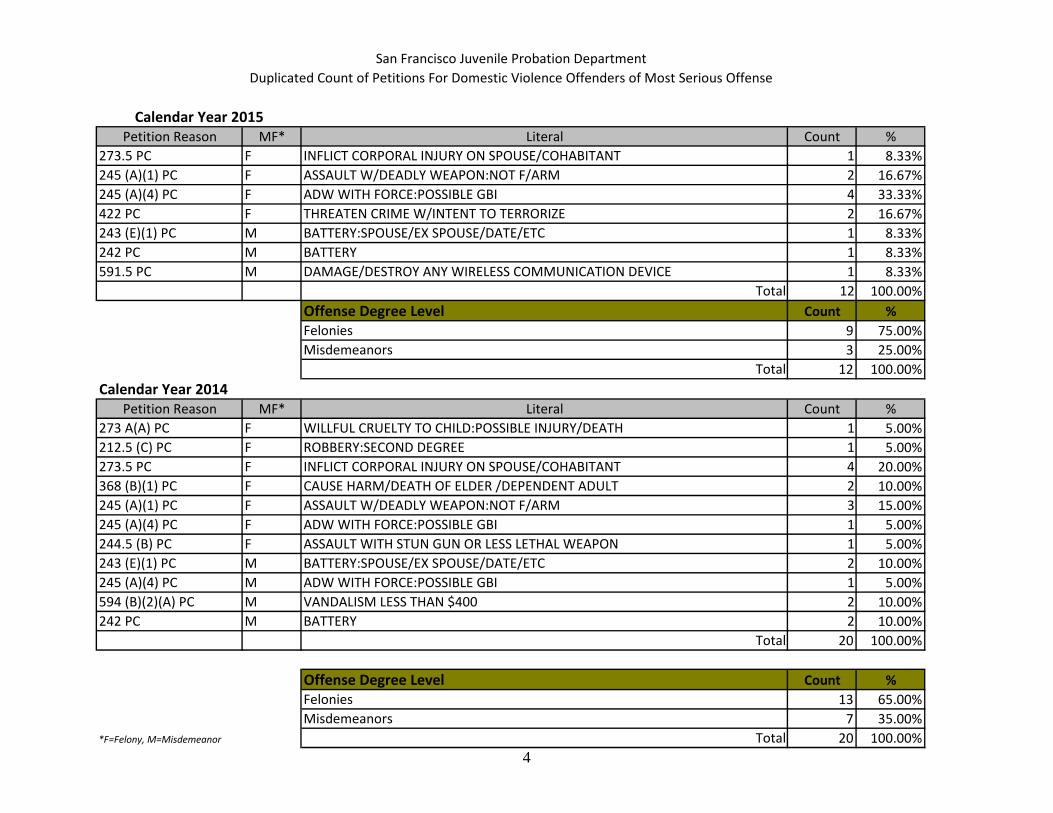
San Francisco Juvenile Probation DepartmentDuplicated Count of Petitions For Domestic Violence Offenders of Most Serious Offense
Calendar Year 2015Petition Reason MF* Literal Count %
273.5 PC F INFLICT CORPORAL INJURY ON SPOUSE/COHABITANT 1 8.33%245 (A)(1) PC F ASSAULT W/DEADLY WEAPON:NOT F/ARM 2 16.67%245 (A)(4) PC F ADW WITH FORCE:POSSIBLE GBI 4 33.33%422 PC F THREATEN CRIME W/INTENT TO TERRORIZE 2 16.67%243 (E)(1) PC M BATTERY:SPOUSE/EX SPOUSE/DATE/ETC 1 8.33%242 PC M BATTERY 1 8.33%591.5 PC M DAMAGE/DESTROY ANY WIRELESS COMMUNICATION DEVICE 1 8.33%
Total 12 100.00%Offense Degree Level Count %Felonies 9 75.00%Misdemeanors 3 25.00%
Total 12 100.00%Calendar Year 2014
Petition Reason MF* Literal Count %273 A(A) PC F WILLFUL CRUELTY TO CHILD:POSSIBLE INJURY/DEATH 1 5.00%212.5 (C) PC F ROBBERY:SECOND DEGREE 1 5.00%273.5 PC F INFLICT CORPORAL INJURY ON SPOUSE/COHABITANT 4 20.00%368 (B)(1) PC F CAUSE HARM/DEATH OF ELDER /DEPENDENT ADULT 2 10.00%245 (A)(1) PC F ASSAULT W/DEADLY WEAPON:NOT F/ARM 3 15.00%245 (A)(4) PC F ADW WITH FORCE:POSSIBLE GBI 1 5.00%244.5 (B) PC F ASSAULT WITH STUN GUN OR LESS LETHAL WEAPON 1 5.00%243 (E)(1) PC M BATTERY:SPOUSE/EX SPOUSE/DATE/ETC 2 10.00%245 (A)(4) PC M ADW WITH FORCE:POSSIBLE GBI 1 5.00%594 (B)(2)(A) PC M VANDALISM LESS THAN $400 2 10.00%242 PC M BATTERY 2 10.00%
Total 20 100.00%
Offense Degree Level Count %Felonies 13 65.00%Misdemeanors 7 35.00%
*F=Felony, M=Misdemeanor Total 20 100.00%
Felonies

5
San Francisco Juvenile Probation DepartmentDuplicated Count of Petitions Sustained For Domestic Violence Offenders
2010-2015
PetitionsYear Sustained10 811 712 913 914 715 6
Gender 2010 2011 2012 2013 2014 2015 TotalMale 7 5 6 6 7 5 36Female 1 2 3 3 0 1 10
Total 8 7 9 9 7 6 46
0
1
2
3
4
5
6
7
8
9
10
10 11 12 13 14 15
6
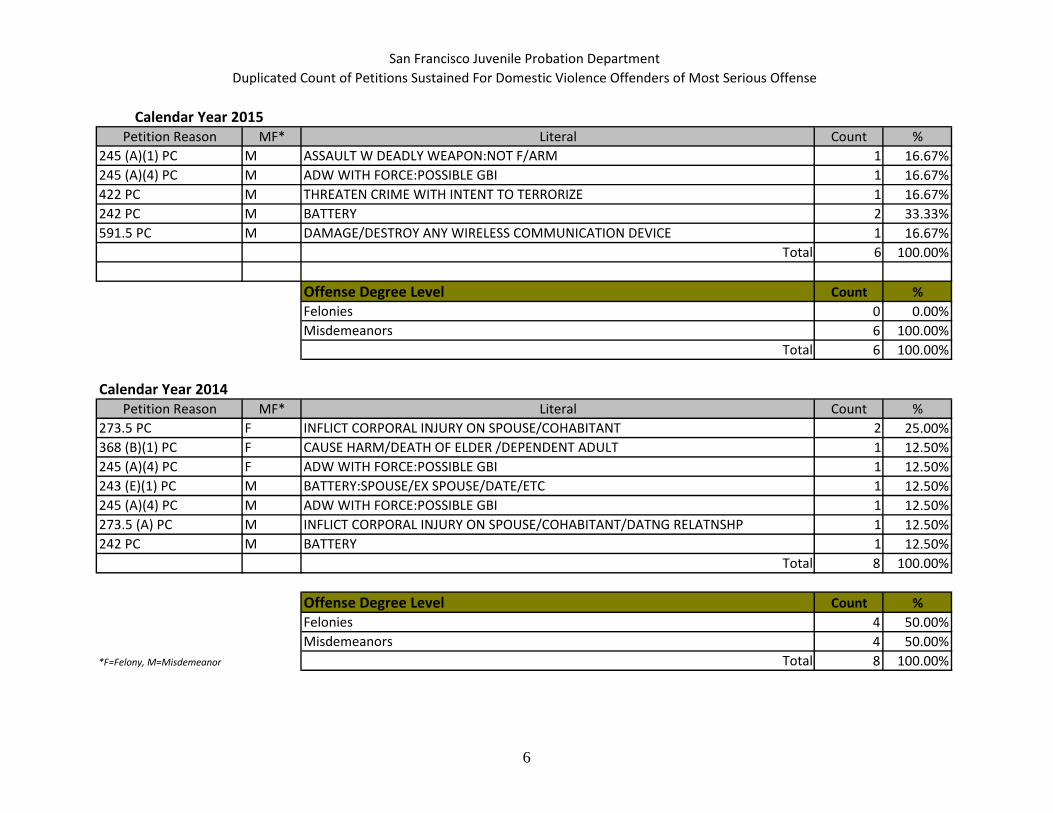
San Francisco Juvenile Probation DepartmentDuplicated Count of Petitions Sustained For Domestic Violence Offenders of Most Serious Offense
Calendar Year 2015Petition Reason MF* Literal Count %
245 (A)(1) PC M ASSAULT W DEADLY WEAPON:NOT F/ARM 1 16.67%245 (A)(4) PC M ADW WITH FORCE:POSSIBLE GBI 1 16.67%422 PC M THREATEN CRIME WITH INTENT TO TERRORIZE 1 16.67%242 PC M BATTERY 2 33.33%591.5 PC M DAMAGE/DESTROY ANY WIRELESS COMMUNICATION DEVICE 1 16.67%
Total 6 100.00%
Offense Degree Level Count %Felonies 0 0.00%Misdemeanors 6 100.00%
Total 6 100.00%
Calendar Year 2014Petition Reason MF* Literal Count %
273.5 PC F INFLICT CORPORAL INJURY ON SPOUSE/COHABITANT 2 25.00%368 (B)(1) PC F CAUSE HARM/DEATH OF ELDER /DEPENDENT ADULT 1 12.50%245 (A)(4) PC F ADW WITH FORCE:POSSIBLE GBI 1 12.50%243 (E)(1) PC M BATTERY:SPOUSE/EX SPOUSE/DATE/ETC 1 12.50%245 (A)(4) PC M ADW WITH FORCE:POSSIBLE GBI 1 12.50%273.5 (A) PC M INFLICT CORPORAL INJURY ON SPOUSE/COHABITANT/DATNG RELATNSHP 1 12.50%242 PC M BATTERY 1 12.50%
Total 8 100.00%
Offense Degree Level Count %Felonies 4 50.00%Misdemeanors 4 50.00%
*F=Felony, M=Misdemeanor Total 8 100.00%
Felonies

7
San Francisco Juvenile Probation DepartmentDuplicated Count of Court Dispositions of Petitions Filed for Domestic Violence Offenders
Calendar Year 2015Court Disposition Count %
COMBINED DISPOSITION 1 8.33%COMMIT TO OUT OF HOME PLACEMENT 1 8.33%COMMITTED TO JUVENILE HALL 1 8.33%HOME PROBATION ‐ MOTHER 1 8.33%HOME PROBATION ‐ PARENTS 1 8.33%PENDING ADJUDICATION 1 8.33%PETITION DISMISSED 2 16.67%
PETITION SUSPENDED IN FAVOR OF 654WI 3 25.00%TRANSFER TO ANOTHER COUNTY 1 8.33%
Total 12 100.00%
Calendar Year 2014Court Disposition Count %
725A PROBATION 1 5.00%COMMIT TO OUT OF HOME PLACEMENT 4 20.00%COMBINED DISPOSITION 1 5.00%HOME PROBATION ‐ MOTHER 2 10.00%PENDING ADJUDICATION 2 10.00%PETITION DISMISSED 5 25.00%
PETITION SUSPENDED IN FAVOR OF 654WI 4 20.00%TRANSFER TO ANOTHER COUNTY 1 5.00%
Total 20 100.00%
0 0.5 1 1.5 2 2.5 3 3.5
COMBINED DISPOSITION
COMMIT TO OUT OF HOMEPLACEMENT
COMMITTED TO JUVENILE HALL
HOME PROBATION - MOTHER
HOME PROBATION - PARENTS
PENDING ADJUDICATION
PETITION DISMISSED
PETITION SUSPENDED IN FAVOROF 654WI
TRANSFER TO ANOTHERCOUNTY
0 1 2 3 4 5 6
725A PROBATION
COMMIT TO OUT OF HOMEPLACEMENT
COMBINED DISPOSITION
HOME PROBATION - MOTHER
PENDING ADJUDICATION
PETITION DISMISSED
PETITION SUSPENDED IN FAVOROF 654WI
TRANSFER TO ANOTHERCOUNTY

8
San Francisco Juvenile Probation DepartmentActive Cases for Domestic Violence Offenders in February 2015 and 2016
Unduplicated Count
Gender February 12th February 12th2015 2016 % Change
Female 3 3 0.00%Male 12 6 ‐50.00%
Total 15 9 ‐40.00%
Race/Ethnic Origin February 12th February 12th2014 2015 % Change
AFRICAN AMERICAN 8 2 ‐75.00%FILIPINO 1 1 0.00%HISPANIC 3 5 66.67%OTHER 1 1 100.00%WHITE 2 0 ‐100.00%
Total 15 9 ‐40.00%
Age February 12th February 12th2014 2015 % Change
13 1 0 ‐100.00%14 3 1 ‐66.67%15 2 2 0.00%16 2 3 50.00%17 6 2 ‐66.67%18 1 1 100.00%
Total 15 9 ‐40.00%
February 12th February 12th2014 2015 % Change
Other Active Cases 674 533 ‐20.92%Domestic Violence Active Cases 15 9 ‐40.00%
Total Active Cases 689 542 ‐21.34%Percentage of Domestic Violence Active Cases 2.18% 1.66%
Percentage of Other Active Cases 97.82% 98.34%100.00% 100.00%

9
San Francisco Juvenile Probation Department Unduplicated Count of Domestic Violence Offenders from 2000-2015
By Geographical Residence of Youth N= 296

2005-2015 Property Crimes

1
San Francisco Juvenile Probation Department2005 -2015 Property Crime Arrests Resulting in a Juvenile Hall Booking
Unduplicated CountN=1,723
Gender Count %FEMALE 389 22.58%MALE 1,334 77.42%
Total 1,723 100.00%
Race/Ethnic Origin Count %AFRICAN AMERICAN 1,060 61.52%AMERICAN INDIAN 2 0.12%CAMBODIAN 2 0.12%CHINESE 55 3.19%FILIPINO 34 1.97%HISPANIC 372 21.59%JAPANESE 1 0.06%KOREAN 2 0.12%LAOTIAN 1 0.06%OTHER 23 1.33%OTHER ASIAN 11 0.64%PACIFIC ISLANDER 5 0.29%SAMOAN 57 3.31%VIETNAMESE 6 0.35%WHITE 92 5.34%
Total 1,723 100.00%
Age At First Arrest Count %11 8 0.46%12 42 2.44%13 116 6.73%14 243 14.10%15 346 20.08%16 453 26.29%17 496 28.79%18 14 0.81%
Over 18 5 0.29%Total 1,723 100.00%

2
San Francisco Juvenile Probation Department2005-2015 Property Crime Arrests Resulting in a Juvenile Hall Booking
Unduplicated Count by Geographical Residence of YouthN=1,723
Zip Code Count %94102 Tenderloin/Western Addition 41 2.38%94103 South of Market 47 2.73%94105 Rincon Hill 0 0.00%94107 Potrero Hill 48 2.79%94108 Chinatown 4 0.23%94109 Russian Hill/Polk Gulch 26 1.51%94110 Inner Mission 104 6.04%94111 Telegraph Hill/Waterfront 1 0.06%94112 Ingleside/Excelsior 127 7.37%94114 Castro/Eureka Valley 4 0.23%94115 Western Addition 96 5.57%94116 Parkside 26 1.51%94117 Haight Ashbury/L Western Addition 35 2.03%94118 Inner Richmond 11 0.64%94121 Outer Richmond 12 0.70%94122 Sunset 18 1.04%94123 Marina/Cow Hollow 1 0.06%94124 Bayview/Hunters Point 338 19.62%94127 Miraloma/Sunnyside 7 0.41%94130 Treasure Island 28 1.63%94131 Twin Peaks/Glen Park 19 1.10%94132 Lake Merced 45 2.61%94133 North Beach 20 1.16%94134 Visitacion Valley/Portola 135 7.84%
Non‐San Francisco and Unavailable 1 530 30.76%Total 1,723 100.00%
1 Non‐San Francisco and Unavailable Count %OAKLAND 120 22.64%DALY CITY 44 8.30%RICHMOND 36 6.79%VALLEJO 23 4.34%HAYWARD 22 4.15%ANTIOCH 22 4.15%SOUTH SAN FRANCISCO 16 3.02%OTHER CITIES 2 247 46.60%
Total 530 100.00%2Account for 95 cities with a minimum count of 1, maximumcount of 15, and average of 2.6

3
San Francisco Juvenile Probation Department 2005 – 2015 Property Crime Arrests Resulting in a Juvenile Hall Booking
Unduplicated Count by Geographical Residence of Youth N=1,723
San Francisco 1,193 (69.24%) Non-San Francisco 530 (30.76%)

4
San Francisco Juvenile Probation DepartmentProperty Crimes Arrests resulting in a Juvenile Hall Booking
Duplicated Count selecting the most serious Offense by Contact Number
Year Female Male Total %2005 40 219 259 11.20%2006 72 271 343 14.83%2007 51 208 259 11.20%2008 76 206 282 12.19%2009 53 173 226 9.77% Female 21.88%2010 47 151 198 8.56% Male 78.12%2011 43 146 189 8.17%2012 48 132 180 7.78%2013 39 109 148 6.40%2014 21 92 113 4.89%2015 16 100 116 5.02%Total 506 1,807 2,313 100.00%
0
50
100
150
200
250
300
350
400
2005 2006 2007 2008 2009 2010 2011 2012 2013 2014 2015
Male
Female

5
San Francisco Juvenile Probation DepartmentProperty Crime Arrests resulting in a Juvenile Hall Booking
2005 ‐2015Duplicated Count by Referral Source
Referral Source Count %ADULT CT SF 1 0.04%BART PD 4 0.17%CAL STATE POL 2 0.09%CHP 16 0.69%FED PARK POLICE 6 0.26%JCT ALAMEDA 41 1.77%JCT COLUSA 1 0.04%JCT CON COSTA 21 0.91%JCT FRESNO 2 0.09%JCT LOS ANGELES 2 0.09%JCT MARIN 7 0.30%JCT MENDOCINO 1 0.04%JCT MERCED 1 0.04%JCT NEVADA 1 0.04%JCT S BERNARDINO 4 0.17%JCT SACRAMENTO 3 0.13%JCT SAN DIEGO 2 0.09%JCT SAN JOAQUIN 6 0.26%JCT SAN MATEO 128 5.53%JCT SANTA CLARA 6 0.26%JCT SOLANO 13 0.56%JCT SONOMA 5 0.22%JCT STANISLAUS 4 0.17%JCT TULARE 4 0.17%PD ALAMEDA 2 0.09%PD SAN MATEO 2 0.09%PROBATION OFFICER 45 1.95%SFPD 1,983 85.73%
Total 2,313 100.00%

6
San Francisco Juvenile Probation DepartmentProperty Crime Arrests Resulting in a Juvenile Hall Booking
Duplicated Count Selecting the Most Serious Offense by Contact Number
Offense Count %ARSON 37 1.60%BURGLARY 680 29.40%DEFRAUD 32 1.38%EMBEZZLEMENT 2 0.09%FORGERY 8 0.35%GRAND THEFT 324 14.01%HIT And RUN 14 0.61%PETTY THEFT 158 6.83%RECEIVE/ETC KNOWN STOLEN PROPERTY 527 22.78%SHOPLIFTING 6 0.26%THEFT 20 0.86%TRESPASSING 59 2.55%VANDALISM 121 5.23%VEHICLE THEFT 325 14.05%
Total 2,313 100.00%
Top Six Property Crime OffensesOffense Count %
BURGLARY 680 29.40%RECEIVE/ETC KNOWN STOLEN PROPERTY 527 22.78%VEHICLE THEFT 325 14.05%GRAND THEFT 324 14.01%PETTY THEFT 158 6.83%VANDALISM 121 5.23%OTHER PROPERTY CRIME OFFENSES 178 7.70%
Total 2,313 100.00%
0 100 200 300 400 500 600 700 800
BURGLARY
RECEIVE/ETC KNOWN STOLEN PROPERTY
VEHICLE THEFT
GRAND THEFT
PETTY THEFT
VANDALISM
OTHER PROPERTY CRIME OFFENSES

7
San Francisco Juvenile Probation DepartmentProperty Crime Arrests resulting in a Juvenile Hall Booking
Duplicated Count Selecting the most Serious Offense by Contact Number
Top Six Property Crime Offenses 2005 2006 2007 2008 2009 2010 2011 2012 2013 2014 2015BURGLARY 60 106 79 88 61 57 68 51 31 45 34GRAND THEFT 27 46 39 36 38 20 21 38 37 9 13PETTY THEFT 11 23 13 31 13 14 21 7 13 7 5RECEIVE/ETC KNOWN STOLEN PROPERTY 57 63 54 58 67 52 33 54 44 28 17VANDALISM 21 12 15 10 11 15 14 8 5 9 1VEHICLE THEFT 65 72 41 34 19 24 14 13 12 6 25
TOTAL 241 322 241 257 209 182 171 171 142 104 95
0
20
40
60
80
100
120
2005 2006 2007 2008 2009 2010 2011 2012 2013 2014 2015
BURGLARY
GRAND THEFT
PETTY THEFT
RECEIVE/ETC KNOWN STOLENPROPERTYVANDALISM
VEHICLE THEFT
Burglary
Vehicle Theft
Receive Stolen Property
Grand Theft
Petty Theft
Vandalism
8
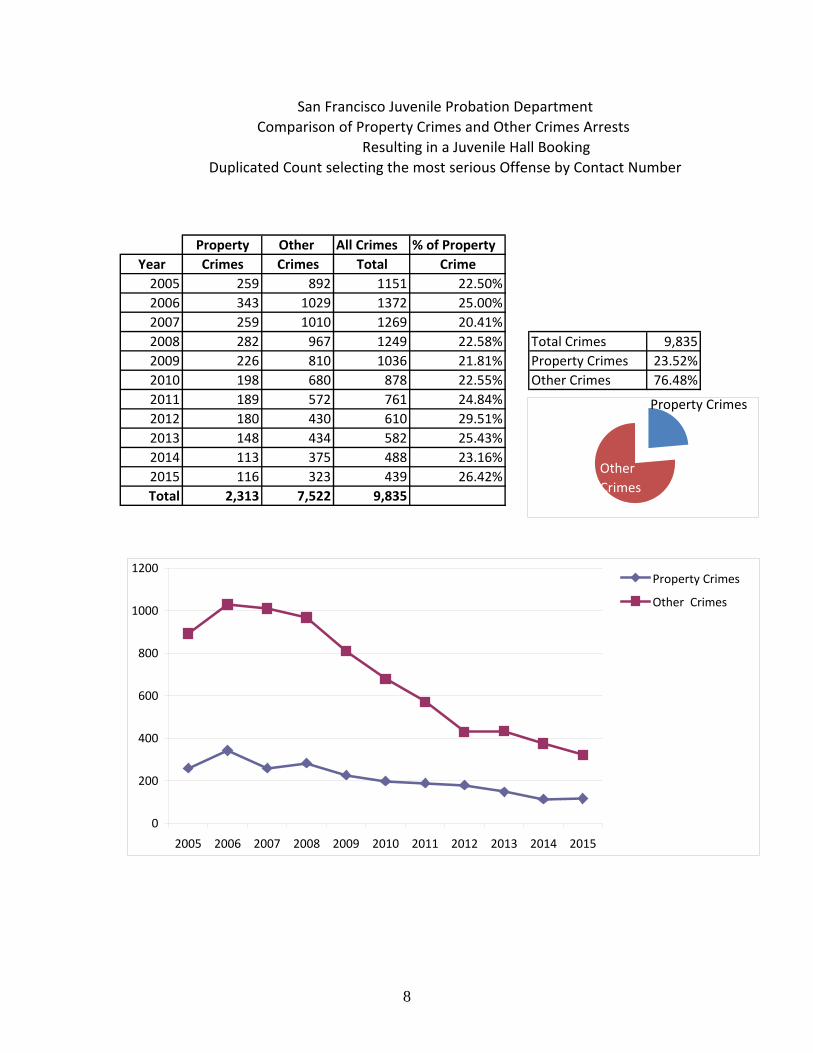
San Francisco Juvenile Probation DepartmentComparison of Property Crimes and Other Crimes Arrests
Resulting in a Juvenile Hall BookingDuplicated Count selecting the most serious Offense by Contact Number
Property Other All Crimes % of PropertyYear Crimes Crimes Total Crime2005 259 892 1151 22.50%2006 343 1029 1372 25.00%2007 259 1010 1269 20.41%2008 282 967 1249 22.58% Total Crimes 9,8352009 226 810 1036 21.81% Property Crimes 23.52%2010 198 680 878 22.55% Other Crimes 76.48%2011 189 572 761 24.84%2012 180 430 610 29.51%2013 148 434 582 25.43%2014 113 375 488 23.16%2015 116 323 439 26.42%Total 2,313 7,522 9,835
0
200
400
600
800
1000
1200
2005 2006 2007 2008 2009 2010 2011 2012 2013 2014 2015
Property Crimes
Other Crimes
Other Crimes
Property Crimes

9
San Francisco Juvenile Probation Department2005 ‐ 2015 Arrests by Crime Type Resulting in a Juvenile Hall Booking
Duplicated Count Selecting the Most Serious Offense by Contact Number
Crime Type Count %Drug Crimes 1,125 11.44%Person Crimes 4,456 45.31%Property Crimes 2,313 23.52%Public Order Crimes 1,941 19.74%
Total 9,835 100.00%
Drug Crimes
Person Crimes
Property Crimes
Public Order CrimesProperty
Public Order
Drugs
Person
Drug Crimes
Person Crimes
Property Crimes
Public Order Crimes
Person
Drug
Property
PublicOrder

10
San Francisco Juvenile Probation Department 2005 – 2015 Property Crime Location
N=1,410