san diego geographic information source · · 2013-03-29certain provisions of laws, regulations,...
TRANSCRIPT
SAN DIEGO GEOGRAPHIC
INFORMATION SOURCE
AUDIT REPORT
For the Year Ended
June 30, 2012

SAN DIEGO GEOGRAPHIC INFORMATION SOURCE
Table of Contents
For the Year Ended June 30, 2012
FINANCIAL SECTION
Independent Auditorsʹ Report .................................................................................................................................................. 1
Management’s Discussion and Analysis .............................................................................................................................. 3 Statement of Net Assets .......................................................................................................................................................... 8 Statement of Revenues, Expenses, and Changes in Net Assets ........................................................................................ 9 Statement of Cash Flows ...................................................................................................................................................... 10 Notes to Financial Statements ............................................................................................................................................. 11
OTHER INDEPENDENT AUDITORS’ REPORTS
Independent Auditors’ Report on Internal Control over Financial Reporting and on Compliance and Other
Matters Based on an Audit of Financial Statements Performed in Accordance with
Government Auditing Standards ........................................................................................................................................ 18

Christy White, CPA
John Dominguez, CPA, CFE
Heather Daud
Michael Ash, CPA
Erin Sacco Pineda, CPA
1
INDEPENDENT AUDITORS’ REPORT
Governance Board
San Diego Geographic Information Source
San Diego, California
We have audited the accompanying financial statements of the San Diego Geographic
Information Source (the “Agency”), a Joint Powers Agency formed by the City and County
of San Diego, as of and for the fiscal year ended June 30, 2012, which collectively comprise
the Agency’s basic financial statements as listed in the table of contents. These financial
statements are the responsibility of the Agency’s management. Our responsibility is to
express an opinion on these financial statements based on our audit. The prior year
summarized comparative information has been derived from the Agency’s June 30, 2011
financial statements, and in our report dated February 7, 2012, we expressed an unqualified
opinion on the Agency’s basic financial statements.
We conducted our audit in accordance with auditing standards generally accepted in the
United States of America and the standards applicable to financial audits contained in
Government Auditing Standards, issued by the Comptroller General of the United States.
Those standards require that we plan and perform the audit to obtain reasonable assurance
about whether the financial statements are free of material misstatement. An audit includes
examining, on a test basis, evidence supporting the amounts and disclosures in the financial
statements. An audit also includes assessing the accounting principles used and significant
estimates made by management, as well as evaluating the overall financial statement
presentation. We believe that our audit provides a reasonable basis for our opinion.
In our opinion, the financial statements referred to above present fairly, in all material
respects, the financial position of the Agency as of June 30, 2012, and the changes in its net
assets and its cash flows for the year then ended in conformity with accounting principles
generally accepted in the United States of America.
Accounting principles generally accepted in the United State of America require that the
management’s discussion and analysis on pages 3 through 7 be presented to supplement the
basic financial statements. Such information, although not part of the basic financial
statements, is required by the Governmental Accounting Standards Board who considers it
to be an essential part of financial reporting for placing the basic financial statements in
appropriate operational, economic, or historical context.

2
We have applied certain limited procedures to the required supplementary information in accordance with
auditing standards generally accepted in the United States of America, which consisted of inquiries of management
about the methods of preparing the information and comparing the information for consistency with
management’s responses to our inquiries, the basic financial statements, and other knowledge we obtained during
our audit of the basic financial statements. We do not express an opinion or provide any assurance on the
information because the limited procedures do not provide us with sufficient evidence to express an opinion or
provide any assurance.
In accordance with Government Auditing Standards, we have also issued our report dated February 4, 2013, on our
consideration of the Agency’s internal control over financial reporting and on our tests of its compliance with
certain provisions of laws, regulations, contracts, and grant agreements and other matters. The purpose of that
report is to describe the scope of our testing of internal control over financial reporting and compliance and the
results of that testing, and not to provide an opinion on internal control over financial reporting or on compliance.
That report is an integral part of an audit performed in accordance with Government Auditing Standards and should
be considered in assessing the results of our audit.
San Diego, California
February 4, 2013

MANAGEMENT’S DISCUSSION AND
ANALYSIS

SAN DIEGO GEOGRAPHIC INFORMATION SOURCE
3
Management’s Discussion and Analysis (Unaudited)
For the Year Ended June 30, 2012
As management of the San Diego Geographic Information Source (SanGIS) Joint Powers Agency (JPA), we offer the
readers of SanGIS this narrative and analysis of the SanGIS financial activities for the fiscal year ended June 30,
2012.
OVERVIEW OF THE FINANCIAL STATEMENTS
This discussion and analysis is intended to serve as an introduction to SanGIS’s basic financial statements. The
basic financial statements include:
1) Statement of Net Assets
2) Statement of Revenues, Expenses, and Changes in Net Assets
3) Statement of Cash Flows
4) Notes to the Financial Statements
The financial statements are designed to provide the readers with a broad overview of SanGIS’s government and
managed finances. These finances are predominantly sourced from the City of San Diego and the County of San
Diego. Historically, some of SanGIS’s business functions operated like a private sector business operation until the
California Attorney General opined on the nature of GIS data and public records access, thus SanGIS was advised
to discontinue that sale of digital records. As a result, revenues are now limited to monies received from the
SanGIS JPA grantors and limited to third party contracts for services rendered by SanGIS.
THE FINANCIAL STATEMENTS
The Statement of Net Assets presents information on all SanGIS’s assets and liabilities, with the difference
between the two reported as net assets. Over time, increases or decreases in net assets may serve as a
useful indicator of whether the financial position of SanGIS is improving or deteriorating.
The Statement of Revenues, Expenses, and Changes in Net Assets presents information showing changes in
SanGIS’s net assets during the most recent fiscal year. All changes in net assets are reported when the
underlying event giving rise to the change occurs, regardless of the timing of the related cash flows. This
statement reflects the results for SanGIS operations for the fiscal year identified and can be used to
determine SanGIS’s credit worthiness and its ability to successfully cover all of its costs through revenue
received from its JPA grantors. Revenues continue to be predominantly sourced from the JPA grantors and
have remained constant, allowing a contingency reserve to be accrued by reducing overhead costs. As
inferred above, fiscal year costs were reduced by outsourcing services and staffing without causing a
reduction in service levels.
SAN DIEGO GEOGRAPHIC INFORMATION SOURCE
Management’s Discussion and Analysis (Unaudited), continued
For the Year Ended June 30, 2012
4
THE FINANCIAL STATEMENTS (continued)
The Statement of Cash Flows presents information about SanGIS’s cash receipts and cash payments during
the most recent fiscal year. This statement reports cash receipts, cash payments, and net changes in cash
resulting from operations and/or investing in financing activities. The financial and legal conditions that
first were presented in 2006 are still present in this fiscal year. This situation is where the California
Attorney General opined that GIS data is a public record and cannot be charged for beyond what the limits
of the California public records act allows.
NOTES TO THE BASIC FINANCIAL STATEMENTS
The notes provide additional information that is essential to a full understanding of the data provided in the
financial statements. The notes to the financial statements are found on pages 11‐17 of this report.
OTHER INFORMATION
In addition to the basic financial statements and accompanying notes, the “Independent Auditor’s Report on
Internal Control Over Financial Reporting and on Compliance and Other Matters Based on an Audit of Financial
Statements Performed in Accordance with Government Auditing Standards” can be found on page 18 of this
report.

SAN DIEGO GEOGRAPHIC INFORMATION SOURCE
Management’s Discussion and Analysis (Unaudited), continued
For the Year Ended June 30, 2012
5
THE AGENCY AS A WHOLE
Financial Highlights of the Past Year
Revenues decreased by $45,382 over prior year to a total of $1,304,211. Total revenues exceed expenses by
$80,435.
Total assets decreased by $41,444 to $459,454, while total liabilities decreased by $121,879 to $139,094.
Total net assets increased by $80,435 to $320,360 as of June 30, 2012.
Net Assets
The Agency’s assets exceeded liabilities by $320,360 for the fiscal year ended June 30, 2012. The unrestricted
portion of Net Assets represents resources that are available to finance SanGIS’s services and obligations to JPA
member agencies and its creditors. However, this sum is not profit. Since SanGIS does not generate a significant
portion of its own revenue, this sum and trend is indicative of SanGIS management’s efforts to continually seek
improvement, savings, and efficiencies in the organization. For example, this year has a $80,435 increase in net
assets total over the last year. Our analysis below focuses on the net assets and changes in net assets (next page) of
the Agency.
Net Assets
Dollar Percent
Increase Increase
2012 2011 (Decrease) (Decrease)
ASSETS
Current and other assets 449,454$ 479,443$ (29,989)$ ‐6%
Capital assets 10,000 21,455 (11,455) ‐53%
Total Assets 459,454 500,898 (41,444) ‐8%
LIABILITIES
Current and other liabilities 112,566 227,224 (114,658) ‐50%
Non current liabilities 26,528 33,749 (7,221) ‐21%
Total Liabilities 139,094 260,973 (121,879) ‐47%
NET ASSETS
Invested in capital assets 10,000 21,455 (11,455) ‐53%
Unrestricted 310,360 218,470 91,890 42%
Total Net Assets 320,360$ 239,925$ 80,435$ 34%

SAN DIEGO GEOGRAPHIC INFORMATION SOURCE
Management’s Discussion and Analysis (Unaudited), continued
For the Year Ended June 30, 2012
6
THE AGENCY AS A WHOLE (continued)
Changes in Net Assets
The results of this year’s operations for the Agency as a whole are reported in the Statement of Revenues, Expenses,
and Changes in Net Assets on page 9. The table below takes the information from the Statement, and rearranges
them slightly, so you can see our total revenues, expenses, and special items for the year.
Changes in Net Assets
Dollar Percent
Increase Increase
2012 2011 (Decrease) (Decrease)
Operating revenues:
City 603,176$ 611,702$ (8,526)$ ‐1%
County 603,176 611,702 (8,526) ‐1%
Product sales 32,349 46,475 (14,126) ‐30%
Other revenues 62,914 75,588 (12,674) ‐17%
Non‐operating revenues:
Interest revenue 2,596 4,126 (1,530) ‐37%
Total operating and non‐operating
revenues 1,304,211 1,349,593 (45,382) ‐3%
Expenses:
General administrative 943,334 929,475 13,859 1%
Technical services 269,640 324,018 (54,378) ‐17%
Depreciation expense 10,802 4,883 5,919 121%
Total expenses 1,223,776 1,258,376 (34,600) ‐3%
Change in net assets 80,435 91,217 (10,782) ‐12%
Beginning net assets 239,925 148,708 91,217 61%
Ending net assets 320,360$ 239,925$ 80,435$ 34%

SAN DIEGO GEOGRAPHIC INFORMATION SOURCE
Management’s Discussion and Analysis (Unaudited), continued
For the Year Ended June 30, 2012
7
CAPITAL ASSETS
At June 30, 2012, as shown in the table below, the Agency had $10,000 invested in capital assets. This amount
represents a decrease of $11,455, or approximately 53% from last year.
Dollar Percent
Increase Increase
2012 2011 (Decrease) (Decrease)
Equipment 182,328$ 492,509$ (310,181)$ ‐63%
Less accumulated depreciation 172,328 471,054 (298,726) ‐63%
Total capital assets, net 10,000$ 21,455$ (11,455)$ ‐53%
June 30,
CONTACTING THE AGENCY’S FINANCIAL MANAGEMENT
This financial report will provide a general overview of SanGIS’s finances for all those with an interest in the
Agency’s finances. Questions concerning any of the information provided in this report, or request for additional
information, should be addressed to either of the following offices:
Office of Audits and Advisory Services
County of San Diego
5530 Overland Ave, Suite 330
San Diego, CA 92123
SanGIS Management Committee
San Diego Geographic Information Source
5510 Overland Ave, Suite 230
San Diego, CA 92123

FINANCIAL SECTION

SAN DIEGO GEOGRAPHIC INFORMATION SOURCE
The notes to the financial statements are an integral part of this statement.
8
Statement of Net Assets
June 30, 2012 (with summarized financial information at June 30, 2011)
2012 2011
ASSETS
Current:
Cash and cash equivalents 419,168$ 457,157$
Accounts receivable 5,332 7,208
Interest receivable 495 850
Prepaid expenses 24,459 14,228
Total current assets 449,454 479,443
Noncurrent:
Capital assets ‐ net of accumulated depreciation 10,000 21,455
Total Assets 459,454 500,898
LIABILITIES
Current:
Accounts payable and accrued expenses 54,666 111,002
Due to County of San Diego 57,900 116,222
Total current liabilities 112,566 227,224
Noncurrent:
Compensated absences, due in more than one year 26,528 33,749
Total Liabilities 139,094 260,973
NET ASSETS
Invested in capital assets 10,000 21,455
Unrestricted 310,360 218,470
Total Net Assets 320,360$ 239,925$

SAN DIEGO GEOGRAPHIC INFORMATION SOURCE
The notes to the financial statements are an integral part of this statement.
9
Statement of Revenues, Expenses, and Changes in Net Assets
For the Year Ended June 30, 2012 (with summarized financial information at June 30, 2011)
2012 2011
OPERATING REVENUES
City 603,176$ 611,702$
County 603,176 611,702
Product sales 32,349 46,475
Other revenues 62,914 75,588
Total operating revenues 1,301,615 1,345,467
OPERATING EXPENSES
General administrative 943,334 929,475
Technical services 269,640 324,018
Depreciation expense 10,802 4,883
Total operating expenses 1,223,776 1,258,376
Operating income 77,839 87,091
NON‐OPERATING REVENUES
Interest revenue 2,596 4,126
Change in net assets 80,435 91,217
239,925 148,708
Net assets, June 30, 2012 320,360$ 239,925$
Year ended June 30,
Net assets, July 1, 2011

SAN DIEGO GEOGRAPHIC INFORMATION SOURCE
The notes to the financial statements are an integral part of this statement.
10
Statement of Cash Flows
For the Year Ended June 30, 2012 (with summarized financial information at June 30, 2011)
2012 2011
Cash Flows from Operating Activities:
Receipts from customers and users 1,303,491$ 1,338,259$
Payments to suppliers for goods and services (496,228) (287,575)
Payments to employees (848,856) (953,397)
Loss on disposal of equipment 653 ‐
Net cash provided by (used in) operating activities (40,940) 97,287
Cash Flows from Capital and Related Financing Activities:
Acquisition of capital assets ‐ (6,282)
Cash Flows from Investing Activities:
Interest received 2,951 4,365
Net increase (decrease) in cash and cash equivalents (37,989) 95,370
Cash and Cash Equivalents at beginning of fiscal year 457,157 361,787
Cash and Cash Equivalents at end of fiscal year 419,168$ 457,157$
Reconciliation of Operating Income to Net Cash
provided by (used in) Operating Activities:
Operating income 77,839$ 87,091$
Adjustments to reconcile operating income (loss) to net
cash provided by (used in) operating activities:
Depreciation expense 10,802 4,883
Loss on disposal of equipment 653 ‐
(Increase) decrease in accounts receivable 1,876 (7,208)
(Increase) decrease in prepaid expenses (10,231) (14,228)
Increase (decrease) in accounts payable and
accrued liabilities (56,336) (1,197)
Increase (decrease) in Due to County of San Diego (58,322) 15,089
Increase (decrease) in compensated absences (7,221) 12,857
Total adjustments (118,779) 10,196
Net cash provided by (used in) operating activities (40,940)$ 97,287$
Year Ended June 30,

SAN DIEGO GEOGRAPHIC INFORMATION SOURCE
11
Notes to Financial Statements
June 30, 2012
NOTE 1 – SIGNIFICANT ACCOUNTING POLICIES
A. Reporting Entity
The San Diego Geographic Information Source (the “Agency”), located in San Diego County, was created in
July 1997 by a Joint Powers Agreement between the City of San Diego (City) and the County of San Diego
(County) and commenced operations in September 1997. The Agency was created to assist member agencies
by providing and/or continuing the operations, maintenance, enhancement, and implementation of a
geographic information system. The computerized mapping system permits the City and the County to
provide compiled digital geographic data to themselves, other public agencies, and to the private sector.
Since neither the City nor the County appoint a voting majority of the Agency’s governing board, it is not
considered a component unit of the City or the County.
B. Basis of Presentation
The Agency operates as an Enterprise Fund. Enterprise fund financial statements are accounted for using the
“economic resources” measurement focus and the accrual basis of accounting. Under the accrual basis of
accounting, revues are recognized in the period in which they are earned while expenses are recognized in the
period in which liability is incurred. Accordingly, all assets and liabilities (whether current or noncurrent) are
included o the Statement of Net Assets. The Statement of Revenues, Expenses, and Changes in Net Assets
present increases (revenues) and decreases (expenses) in total net assets.
Operating revenues in the proprietary funds are those revenues that are generated from the primary operation
of the fund. All other revenues are reported as non‐operating revenues. Operating expenses are those
expenses that are essential to the primary operations of the fund. All other expenses are reported as non‐
operating expenses.
The Agency applies all applicable Governmental Accounting Standards Board (GASB) pronouncements as well
as any applicable pronouncements of the Financial Accounting Standards Board (FASB), the Accounting
Principles Board, or any Accounting Research Bulletins issued before November 30, 1989. The GASB
periodically updates its codification of the existing Governmental Accounting and Financial Reporting
Standards, which along with subsequent GASB pronouncements (Statements and Interpretations), constitutes
GAAP for governmental users.
When both restricted and unrestricted resources are available for use, it is the Agency’s policy to use restricted
resources first, then unrestricted resources as they are needed.

SAN DIEGO GEOGRAPHIC INFORMATION SOURCE
Notes to Financial Statements, continued
June 30, 2012
12
NOTE 1 – SIGNIFICANT ACCOUNTING POLICIES (continued)
C. Capital Assets
Capital assets are recorded at cost by the Agency. It is the policy of the Agency to capitalize all capital assets
with a cost of $5,000 or greater. Depreciation is computed on the straight‐line method over the estimated
useful lives of 4 to 10 years.
Servers/Workstations/Network Equipment 4 years
Printers 5 years
Furniture and fixtures 10 years
D. Long‐Term Obligations
Long‐term debt and other long‐term obligations are reported as liabilities in the Statement of Net Assets. Bond
premiums and discounts, deferred loss on refunding, and issuance costs, are deferred and amortized over the
life of the bonds. These items are reported as deferred charges and amortized over the term of the related debt.
E. Estimates
The preparation of financial statements in conformity with generally accepted in the United States of America
accounting principles requires management to make estimates and assumptions that affect the reported
amount of certain assets, liabilities and disclosures of contingent assets and liabilities at the date of the financial
statements, and the related reported amounts of revenues and expenditures during the reporting period, such
as depreciation expense and the net book value of capital assets. Accordingly, actual results could differ from
those estimates. Management believes that the estimates are reasonable.
F. Related Party Transactions
The Agency has entered into agreements with the City and County. Under the agreements, the City and
County provide auditor, treasurer, legal management, administrative and other necessary services until the
Board appoints others to fulfill those functions. The Agency reimburses the City and the County at intervals
based on the City’s and County’s accounting periods in an amount equal to the actual cost of salaries, and
fringe benefits (computed at the City’s and the County’s then prevailing rate) and other necessary expenses.
G. Cash and Cash Equivalents
Cash equivalents are defined as short‐term, highly liquid investments that are both readily convertible to known amounts of cash of so near their maturity that they present insignificant risk of changes in value because of changes in interest rates, and have an original maturity date of three months or less.

SAN DIEGO GEOGRAPHIC INFORMATION SOURCE
Notes to Financial Statements, continued
June 30, 2012
13
NOTE 1 – SIGNIFICANT ACCOUNTING POLICIES (continued)
H. Net Assets
In the government‐wide financial statements, net assets are classified in the following categories:
Invested in Capital Assets – This amount consists of capital net of accumulated depreciation.
Restricted Net Assets – This amount is restricted by external creditors, grantors, contributors, laws, or
regulations of other governments.
Unrestricted Net Assets – This amount is all net assets that do not meet the definition of “invested in capital
assets, net of related debt” or “restricted net assets”.
I. Budgetary Accounting
Budget Policies – An operating budget is adopted each fiscal year for the Agency by unanimous consent of its
members. Budgetary control is achieved at the appropriate level.
Reserve for Encumbrances – For purposes of a budgetary presentation in the financial statements, actual
expenditures are adjusted to include any encumbrances outstanding at fiscal year‐end. Outstanding
encumbrances at fiscal year‐end are fully reserved thereby assuring a continued expenditure authorization in
subsequent fiscal year. There was no encumbrance reserve at the end of the fiscal year.
SAN DIEGO GEOGRAPHIC INFORMATION SOURCE
Notes to Financial Statements, continued
June 30, 2012
14
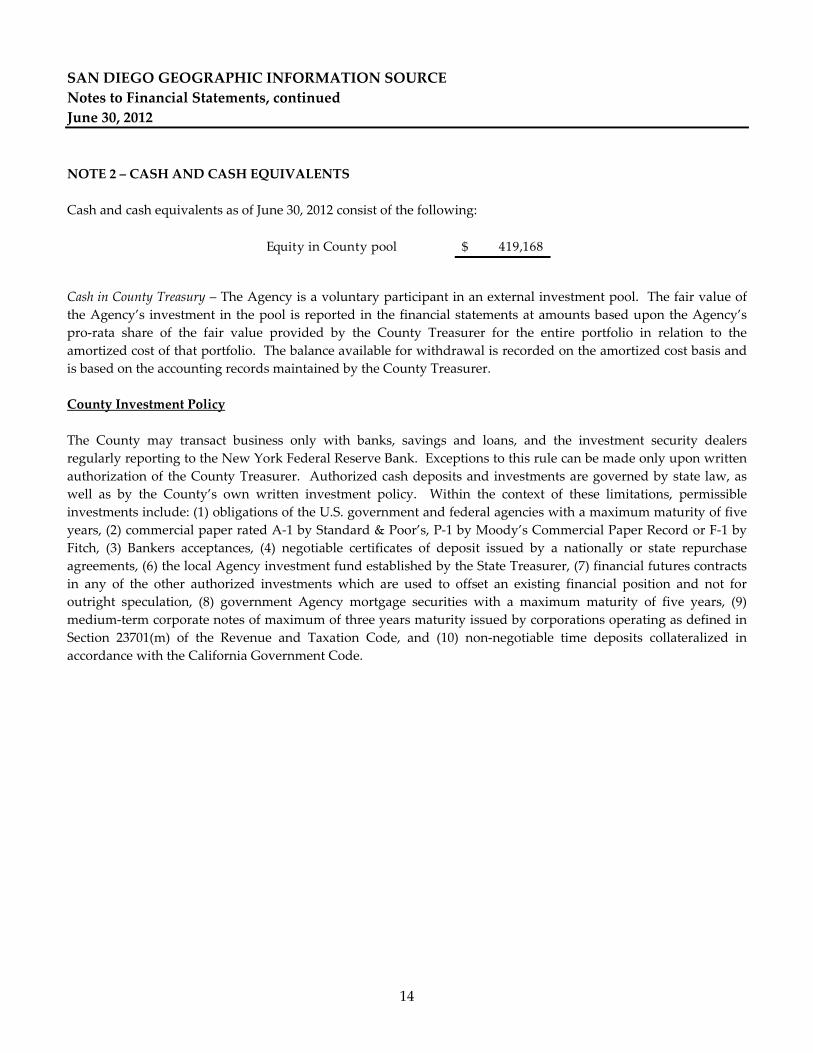
NOTE 2 – CASH AND CASH EQUIVALENTS
Cash and cash equivalents as of June 30, 2012 consist of the following:
Equity in County pool 419,168$
Cash in County Treasury – The Agency is a voluntary participant in an external investment pool. The fair value of
the Agency’s investment in the pool is reported in the financial statements at amounts based upon the Agency’s
pro‐rata share of the fair value provided by the County Treasurer for the entire portfolio in relation to the
amortized cost of that portfolio. The balance available for withdrawal is recorded on the amortized cost basis and
is based on the accounting records maintained by the County Treasurer.
County Investment Policy
The County may transact business only with banks, savings and loans, and the investment security dealers
regularly reporting to the New York Federal Reserve Bank. Exceptions to this rule can be made only upon written
authorization of the County Treasurer. Authorized cash deposits and investments are governed by state law, as
well as by the County’s own written investment policy. Within the context of these limitations, permissible
investments include: (1) obligations of the U.S. government and federal agencies with a maximum maturity of five
years, (2) commercial paper rated A‐1 by Standard & Poor’s, P‐1 by Moody’s Commercial Paper Record or F‐1 by
Fitch, (3) Bankers acceptances, (4) negotiable certificates of deposit issued by a nationally or state repurchase
agreements, (6) the local Agency investment fund established by the State Treasurer, (7) financial futures contracts
in any of the other authorized investments which are used to offset an existing financial position and not for
outright speculation, (8) government Agency mortgage securities with a maximum maturity of five years, (9)
medium‐term corporate notes of maximum of three years maturity issued by corporations operating as defined in
Section 23701(m) of the Revenue and Taxation Code, and (10) non‐negotiable time deposits collateralized in
accordance with the California Government Code.
SAN DIEGO GEOGRAPHIC INFORMATION SOURCE
Notes to Financial Statements, continued
June 30, 2012
15
NOTE 2 – CASH AND CASH EQUIVALENTS (continued)
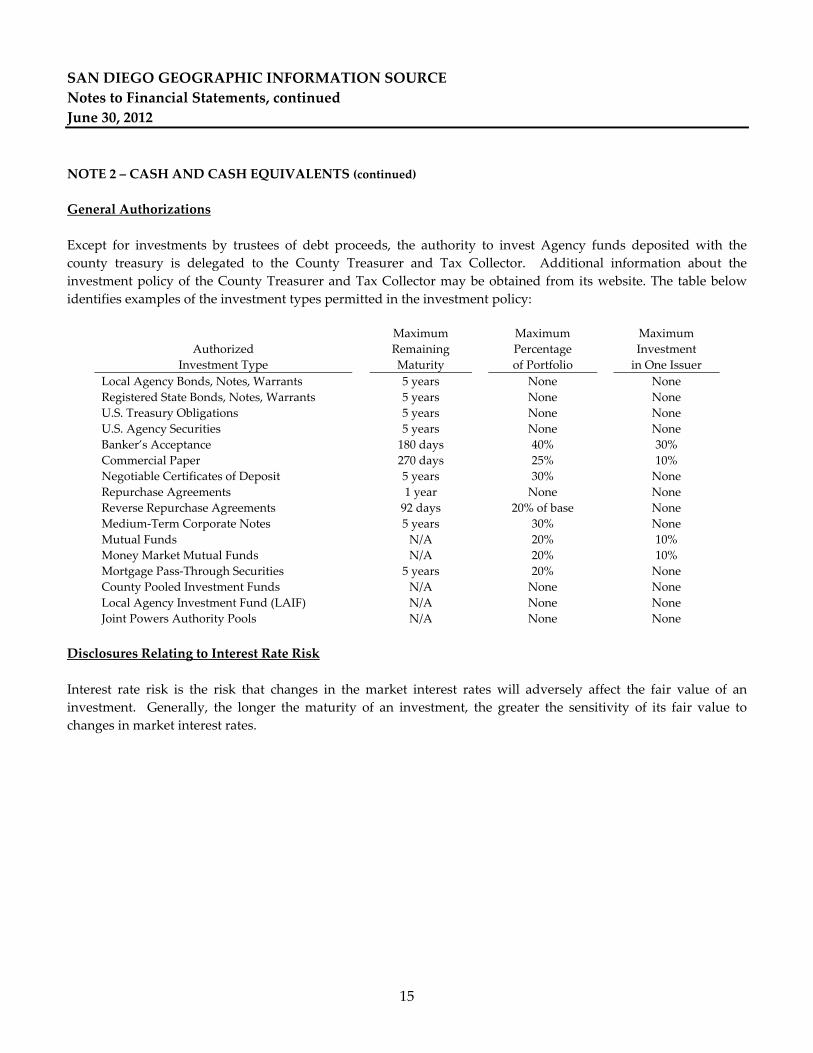
General Authorizations
Except for investments by trustees of debt proceeds, the authority to invest Agency funds deposited with the
county treasury is delegated to the County Treasurer and Tax Collector. Additional information about the
investment policy of the County Treasurer and Tax Collector may be obtained from its website. The table below
identifies examples of the investment types permitted in the investment policy:
Authorized
Investment Type
Maximum
Remaining
Maturity
Maximum
Percentage
of Portfolio
Maximum
Investment
in One Issuer
Local Agency Bonds, Notes, Warrants 5 years None None
Registered State Bonds, Notes, Warrants 5 years None None
U.S. Treasury Obligations 5 years None None
U.S. Agency Securities 5 years None None
Banker’s Acceptance 180 days 40% 30%
Commercial Paper 270 days 25% 10%
Negotiable Certificates of Deposit 5 years 30% None
Repurchase Agreements 1 year None None
Reverse Repurchase Agreements 92 days 20% of base None
Medium‐Term Corporate Notes 5 years 30% None
Mutual Funds N/A 20% 10%
Money Market Mutual Funds N/A 20% 10%
Mortgage Pass‐Through Securities 5 years 20% None
County Pooled Investment Funds N/A None None
Local Agency Investment Fund (LAIF) N/A None None
Joint Powers Authority Pools N/A None None
Disclosures Relating to Interest Rate Risk
Interest rate risk is the risk that changes in the market interest rates will adversely affect the fair value of an
investment. Generally, the longer the maturity of an investment, the greater the sensitivity of its fair value to
changes in market interest rates.

SAN DIEGO GEOGRAPHIC INFORMATION SOURCE
Notes to Financial Statements, continued
June 30, 2012
16
NOTE 2 – CASH AND CASH EQUIVALENTS (continued)
Information about the sensitivity of the fair values of the Agency’s investments to market interest rate fluctuations
is provided by the following tables that show the distribution of the Agency’s investments by maturity at June 30,
2012:
Investment 12 Months 13 to 24 25‐36 37‐48 49‐60 More than
Type Totals Or Less Months Months Months Months 60 Months
Equity in
County Pool 419,168$ 419,168$ ‐$ ‐$ ‐$ ‐$ ‐$
Total 419,168$ 419,168$ ‐$ ‐$ ‐$ ‐$ ‐$
Remaining Maturity (in Months)
Disclosures Relating to Credit Risk
Generally, credit risk is the risk that an issuer of an investment will not fulfill its obligation to the holder of the
investment. This is measured by the assignment of a rating by a nationally recognized statistical rating
organization. Presented below is the minimum rating required by (where applicable) the California Government
Code, the Agency’s investment policy, or debt agreements, and the actual rating as of each investment type as of
June 30, 2012:
Investment Legal From Not
Type Amount Rating Disclosure AAA AA A Rated
Equity in
County Pool 419,168$ N/A ‐$ 419,168$ ‐$ ‐$ ‐$
Ratings as of Fiscal Year End

SAN DIEGO GEOGRAPHIC INFORMATION SOURCE
Notes to Financial Statements, continued
June 30, 2012
17
NOTE 2 – CASH AND CASH EQUIVALENTS (continued)
Cash in Bank
Custodial credit risk is the risk that in the event of a bank failure, the Agency’s deposits may not be returned to it.
The Agency does not have a policy for custodial credit risk for deposits. The FDIC insures up to $250,000 per
depositor per insured bank. As of June 30, 2012, the Agency’s bank balance was not exposed to custodial credit risk
as there were no deposits over $250,000 at any one insured bank.
NOTE 3 – CAPITAL ASSETS AND DEPRECIATION
Capital asset activity for the year ended June 30, 2012, consists of the following:
Beginning Ending
Balance Balance
July 1, 2011 Additions Deletions June 30, 2012
Equipment 492,509$ ‐$ 310,181$ 182,328$
Total at historical cost 492,509 ‐ 310,181 182,328
Less accumulated depreciation:
Equipment 471,054 10,802 309,528 172,328
Total accumulated depreciation 471,054 10,802 309,528 172,328
Total capital assets, net 21,455$ (10,802)$ 653$ 10,000$
Depreciation expense was $10,802 for the fiscal year ended June 30, 2012.
NOTE 4 – LONG TERM DEBT Compensated Absences The Agency recognized the accumulated and vested unpaid employee vacation benefits as a liability, and it is recorded as compensated absences payable. The liability, at June 30, 2012, was $26,528.
OTHER INDEPENDENT AUDITORS’ REPORTS

Christy White, CPA
John Dominguez, CPA, CFE
Heather Daud
Michael Ash, CPA
Erin Sacco Pineda, CPA
18
INDEPENDENT AUDITORS’ REPORT ON INTERNAL CONTROL OVER FINANCIAL
REPORTING AND ON COMPLIANCE AND OTHER MATTERS BASED ON AN
AUDIT OF FINANCIAL STATEMENTS PERFORMED IN ACCORDANCE WITH
GOVERNMENT AUDITING STANDARDS
Board of Directors
San Diego Geographic Information Source
San Diego, California
We have audited the financial statements of San Diego Geographic Information Source
(Agency) a Joint Powers Agency formed by the City and County of San Diego, as of and for
the year ended June 30, 2012, and have issued our report thereon dated February 4, 2013.
We conducted our audit in accordance with auditing standards generally accepted in the
United States of America and the standards applicable to financial audits contained in
Government Auditing Standards, issued by the Comptroller General of the United States.
Internal Control Over Financial Reporting
Management of San Diego Geographic Information Source is responsible for establishing
and maintaining effective internal control over financial reporting. In planning and
performing our audit, we considered San Diego Geographic Information Source’s internal
control over financial reporting as a basis for designing our auditing procedures for the
purpose of expressing our opinion on the financial statements, but not for the purpose of
expressing an opinion on the effectiveness of San Diego Geographic Information Source’s
internal control over financial reporting. Accordingly, we do not express an opinion on the
effectiveness of the San Diego Geographic Information Source’s internal control over
financial reporting.
A deficiency in internal control exists when the design or operation of a control does not allow
management or employees, in the normal course of performing their assigned functions, to
prevent, or detect and correct misstatements on a timely basis. A material weakness is a
deficiency, or combination of deficiencies, in internal control such that there is a reasonable
possibility that a material misstatement of the entity’s financial statements will not be
prevented, or detected and corrected on a timely basis.
Our consideration of internal control over financial reporting was for the limited purpose
described in the first paragraph of this section and was not designed to identify all
deficiencies in internal control over financial reporting that might be deficiencies, significant
deficiencies or material weaknesses. We did not identify any deficiencies in internal control
over financial reporting that we consider to be material weaknesses, as defined above.
19
Compliance and Other Matters
As part of obtaining reasonable assurance about whether San Diego Geographic Information Source’s financial
statements are free of material misstatement, we performed tests of its compliance with certain provisions of laws,
regulations, contracts and grant agreements, noncompliance with which could have a direct and material effect on
the determination of financial statement amounts. However, providing an opinion on compliance with those
provisions was not an objective of our audit and, accordingly, we do not express such an opinion. The results of
our tests disclosed no instances of noncompliance or other matters that are required to be reported under
Government Auditing Standards.
This report is intended solely for the information and use of the Board, management, others within San Diego
Geographic Information Source, and the federal awarding agencies and pass‐through entities and is not intended to
be and should not be used by anyone other than these specified parties.
San Diego, California
February 4, 2013