samsonite international s.a....2019/09/18 · interim report 2019年中期報告samsonite...
TRANSCRIPT

INTERIM REPORT 2019 年中期報告
Samsonite International S.A. 新秀麗國際有限公司 Stock Code 股份代號 1910
# WE CARRY THE WORLD
Samso
nite In
ternatio
nal S.A
. 新秀
麗國
際有
限公
司
Interim
Rep
ort 2019 年
中期
報告
Samsonite International S.A.新秀麗國際有限公司
13-15 avenue de la Liberté, L-1931 Luxembourg
(Incorporated under the laws of Luxembourg with limited liability)
(根據盧森堡法律註冊成立的有限公司)
00_SAM005_IR19_Cover_AW.indd 1 10/9/2019 13:15

Since our listing in 2011, the Group has consistently pursued a
strategy to diversify its business across geographical markets,
brands, product categories and distribution channels. Through a
combination of steady organic growth and strategic acquisitions,
we have transformed the business from being dependent largely on
one brand, Samsonite, active primarily in travel goods sold mainly
through wholesale channels in the developed markets of the U.S.
and Europe to one that operates multiple brands across global
markets through all major channels.
自2011年上市以來,本集團一直實施跨地區市場、品牌、產品類別及
分銷渠道業務多元化的策略。通過穩健自然增長和策略性收購的互相
結合,我們實現業務轉型,不再過度倚賴新秀麗單一品牌主要透過美
國及歐洲發達市場的批發渠道銷售旅遊產品,轉向通過所有主要渠道
在全球市場經營多個品牌的企業。
# WE CARRY THE WORLD
Timothy Charles Parker
Chairman 主席
If there are any discrepancies between the Chinese translation and the
English version of this report and accounts, the English version shall prevail.
本報告及賬目之中文譯本與英文版本如有任何差異, 概以英文版本為準。
Published by Samsonite International S.A.
出版 新秀麗國際有限公司
Concept & Design by Yellow Creative (HK) Limited
設計
Production & Printing by Donnelley Financial Solutions Hong Kong Limited
印製 當納利財經服務香港有限公司
© Copyright Samsonite International S.A. 2019
© 新秀麗國際有限公司 2019年
All rights reserved
版權所有
No part of this publication may be reproduced, stored in a retrieval system,
or transmitted, in any form or by any means, electronic, mechanical,
photocopying, recording, or otherwise, without the prior written permission of
Samsonite International S.A.
未得新秀麗國際有限公司事先書面許可,不得以電子、機械、複印、錄製或任
何其他形式或方法,將本刊物的任何部分複製、儲存於檢索系統之內或傳送。
SAM005_IR.indb 2 9/9/2019 17:25
2 Corporate Information 公司資料
3 Corporate Profile and Company’s Strategy 公司簡介及策略
4 Disclaimer 免責聲明
5 Summary Financial Results 財務業績概要
8 Financial Highlights 財務摘要
10 Chairman’s Statement 主席報告
16 Chief Executive Officer’s Statement 行政總裁報告
22 Management Discussion and Analysis 管理層討論與分析
70 Independent Auditors’ Review Report 獨立核數師審閱報告
71 Consolidated Income Statements 綜合收益表
72 Consolidated Statements of Comprehensive Income 綜合全面收益表
73 Consolidated Statements of Financial Position 綜合財務狀況表
74 Consolidated Statements of Changes in Equity 綜合權益變動表
76 Consolidated Statements of Cash Flows 綜合現金流量表
77 Notes to the Consolidated Interim Financial Statements 綜合中期財務報表附註
115 Disclosure of Interests 權益披露
117 Corporate Governance and Other Information 企業管治及其他資料
CONTENTS目錄
1Samsonite International S.A. Interim Report 2019 新秀麗國際有限公司 2019年中期報告
01_SAM005_IR19_Cont,InF+CorpProfile_AW.indd 1 9/9/2019 18:20
CORPORATE INFORMATION公司資料Board of Directors
Executive Director Kyle Francis Gendreau Chief Executive Officer
Non-Executive Directors Timothy Charles Parker Chairman
Tom Korbas
Independent Non-Executive Directors Paul Kenneth Etchells Jerome Squire Griffith Keith Hamill Bruce Hardy McLain (Hardy) Ying Yeh
Audit Committee Paul Kenneth Etchells (Chairman) Keith Hamill Ying Yeh
Remuneration Committee Keith Hamill (Chairman) Paul Kenneth Etchells Bruce Hardy McLain (Hardy) Ying Yeh
Nomination Committee Timothy Charles Parker (Chairman) Paul Kenneth Etchells Ying Yeh
Chief Financial Officer Reza Taleghani
Joint Company Secretaries John Bayard Livingston Chow Yuk Yin Ivy
Authorized Representatives Kyle Francis Gendreau Chow Yuk Yin Ivy
Independent Auditors KPMG LLP
Joint Corporate Headquarters 13-15 avenue de la Liberté, L-1931 Luxembourg
575 West Street, Suite 110, Mansfield, MA 02048, USA
Registered Office in Luxembourg 13-15 avenue de la Liberté, L-1931 Luxembourg
Principal Place of Business in Hong Kong 25/F, Tower 2, The Gateway, Harbour City, 25 Canton Road, Tsimshatsui, Kowloon, Hong Kong
Share Registrar in Hong Kong Computershare Hong Kong Investor Services Limited Shops 1712-1716, 17/F, Hopewell Centre, 183 Queen’s Road East Wan Chai, Hong Kong
Share Registrar in Luxembourg Intertrust (Luxembourg) S.à r.l. 6, rue Eugéne Ruppert L-2453 Luxembourg
Website www.samsonite.com
Director of Investor Relations William Yue
Place of Share Listing and Stock Code The Stock Exchange of Hong Kong Limited: 1910
董事會
執行董事 Kyle Francis Gendreau 行政總裁
非執行董事 Timothy Charles Parker 主席
Tom Korbas
獨立非執行董事 Paul Kenneth Etchells Jerome Squire Griffith Keith Hamill Bruce Hardy McLain (Hardy) 葉鶯
審核委員會 Paul Kenneth Etchells(主席) Keith Hamill 葉鶯
薪酬委員會 Keith Hamill(主席) Paul Kenneth Etchells Bruce Hardy McLain (Hardy) 葉鶯
提名委員會 Timothy Charles Parker(主席) Paul Kenneth Etchells 葉鶯
財務總監 Reza Taleghani
聯席公司秘書 John Bayard Livingston 周玉燕
授權代表 Kyle Francis Gendreau 周玉燕
獨立核數師 KPMG LLP
聯合公司總部 13-15 avenue de la Liberté, L-1931 Luxembourg
575 West Street, Suite 110, Mansfield, MA 02048, USA
盧森堡註冊辦事處 13-15 avenue de la Liberté, L-1931 Luxembourg
香港主要營業地點 香港九龍尖沙咀 廣東道25號海港城 港威大廈2座25樓
香港股份登記處 香港中央證券登記有限公司 香港灣仔皇后大道東183號 合和中心17樓1712-1716室
盧森堡股份登記處 Intertrust (Luxembourg) S.à r.l. 6, rue Eugéne Ruppert L-2453 Luxembourg
網址 www.samsonite.com
投資者關係總監 虞瑋麟
股份上市地點及股份代號 香港聯合交易所有限公司:1910
2
SAM005_IR.indb 2 9/9/2019 17:25

本公司的策略本公司旨在透過可持續收益及盈利增長以及產生自由現金流量以提升股東價值。為達到此目標,本公司已採納以下主要策略:
• 於旅遊及非旅遊產品類別部署多個不同品牌以涵蓋更廣泛的價格點。在非旅遊產品類別中,我們將更著力於開發背包及吸引女性消費者的產品。
• 透過提升本公司直接面向消費者電子商貿的銷售淨額及「針對性」地擴充實體零售業務,增加直接面向消費者渠道佔銷售淨額的比重。
• 維持本公司於營銷方面所作出的重點投資,以支援Tumi的持續全球擴展,同時繼續提升新秀麗、American Tourister及其他品牌的知名度及顧客流量。
• 憑藉本公司的地區管理架構、採購及分銷專長以及營銷動力,將其品牌拓展至新市場,並加深滲透現有渠道。
• 繼續投資於研究與開發,開發更輕巧及更堅固的新物料、先進的製造技術、具吸引力的新設計,以及為消費者帶來實際效益的創新功能。
• 繼續將本公司發展為具備多品牌、多產品類別及多分銷渠道的多元化行李箱包及配件企業。
新秀麗國際有限公司(「本公司」,連同其綜合附屬公司統稱為「本集團」)是全球最大的旅行箱公司,擁有逾 100 年悠久歷史。本集團主要在全球從事設計、製造、採購及分銷行李箱、商務包及電腦包、女士手袋、戶外包及休閒包、旅遊配件以及個人電子設備纖薄保護殼,旗下經營的品牌主要包括新秀麗 ®、Tumi®、American Tourister®、Speck®、High Sierra®、Gregory®、Lipault®、Kamiliant®、Hartmann®及eBags®品牌以及其他自有及獲授權的品牌。
The Company’s StrategyThe Company aims to increase shareholder value through sustainable revenue and earnings growth and free cash flow generation. In order to achieve this objective, the Company has adopted the following principal strategies:
• Deploy multiple brands to operate at wider price points in both the travel and non-travel product categories. Within the non-travel product categories, greater emphasis will be placed on backpacks and products that appeal to female consumers.
• Increase the proportion of net sales from the direct-to-consumer channel by growing the Company’s direct-to-consumer e-commerce net sales and through ’targeted’ expansion of its bricks-and-mortar retail presence.
• Sustain the Company’s focused investment in marketing to support the continued global expansion of Tumi, while continuing to drive visibility and traffic for Samsonite, American Tourister and other brands.
• Leverage the Company’s regional management structure, sourcing and distribution expertise and marketing engine to extend its brands into new markets and penetrate deeper into existing channels.
• Continue to invest in research and development to develop lighter and stronger new materials, advanced manufacturing processes, exciting new designs, as well as innovative functionalities that deliver real benefits to consumers.
• Continue to develop the Company into a well-diversified, multi-brand, multi-category and multi-channel luggage, bag and accessories business.
CORPORATE PROFILE公司簡介
Samsonite International S.A. (the “Company”), together with its consolidated subsidiaries (the “Group”), is the world’s largest travel luggage company, with a heritage dating back over 100 years. The Group is principally engaged in the design, manufacture, sourcing and distribution of luggage, business and computer bags, women’s bags, outdoor and casual bags, travel accessories and slim protective cases for personal electronic devices throughout the world, primarily under the Samsonite®, Tumi®, American Tourister®, Speck®, High Sierra®, Gregory®, Lipault®, Kamiliant®, Hartmann® and eBags® brand names as well as other owned and licensed brand names.
3Samsonite International S.A. Interim Report 2019 新秀麗國際有限公司 2019年中期報告
SAM005_IR.indb 3 9/9/2019 17:25

Non-IFRS MeasuresThe Company has presented certain non-IFRS(1) measures in the financial highlights section, Chairman’s Statement, Chief Executive Officer’s Statement and Management Discussion and Analysis sections below because each of these measures provides additional information that management believes is useful in gaining a more complete understanding of the Group’s operational performance and of the trends impacting its business to securities analysts, investors and other interested parties. These non-IFRS financial measures, as calculated herein, may not be comparable to similarly named measures used by other companies, and should not be considered comparable to IFRS measures. Non-IFRS measures have limitations as an analytical tool and should not be considered in isolation from, or as a substitute for, an analysis of the Group’s financial results as reported under IFRS.
Forward-Looking StatementsThis document contains forward-looking statements. Forward-looking statements reflect the Group’s current views with respect to future events and performance. These statements may discuss, among other things, the Group’s net sales, operating profit, Adjusted Net Income, Adjusted EBITDA(2), Adjusted EBITDA margin, cash flow, liquidity and capital resources, impairments, growth, strategies, plans, achievements, distributions, organizational structure, future store openings, market opportunities and general market and industry conditions. The Group generally identifies forward-looking statements by words such as “expect”, “seek”, “believe”, “plan”, “intend”, “estimate”, “project”, “anticipate”, “may”, “will”, “would” and “could” or similar words or statements. Forward-looking statements are based on beliefs and assumptions made by management using currently available information. These statements are only predictions and are not guarantees of future performance, actions or events. Forward-looking statements are subject to risks and uncertainties. If one or more of these risks or uncertainties materialize, or if management’s underlying beliefs and assumptions prove to be incorrect, actual results may differ materially from those contemplated by a forward-looking statement. Forward-looking statements speak only as of the date on which they are made. The Company’s shareholders, potential investors and other interested parties should not place undue reliance on these forward-looking statements. The Group expressly disclaims any obligation to update or revise any forward-looking statement, whether as a result of new information, future events or otherwise, except as required by applicable securities laws and regulations.
RoundingCertain numbers presented in this document have been rounded up or down. There may therefore be discrepancies between the actual totals of the individual amounts in the tables and the totals shown, between the numbers in the tables and the numbers given in the corresponding analyses in the text of this document and between numbers in this document and other publicly available documents. All percentages and key figures were calculated using the underlying data in whole US Dollars.
非 IFRS財務計量工具本公司於下文「財務摘要」一節、「主席報告」、「行政總裁報告」及「管理層討論與分析」等節呈列若干非 IFRS(1)財務計量工具,因上述各財務計量工具提供更多資料,管理層相信有利於證券分析員、投資者及其他相關利益團體更全面了解本集團的經營表現及影響其業務的趨勢。本文所計算的此等非 IFRS財務計量工具未必可與其他公司所使用類似命名的計量工具進行比較,且不應被視為可與 IFRS財務計量工具比較的計量工具。非 IFRS財務計量工具作為一項分析工具有其局限性,不應被視為獨立於或代替本集團根據 IFRS所呈報的財務業績的分析。
前瞻性陳述本文件包含前瞻性陳述。前瞻性陳述反映本集團目前對未來事件及表現的觀點。該等陳述可能會探討(其中包括)本集團銷售淨額、經營溢利、經調整淨收入、經調整EBITDA(2)、經調整EBITDA利潤率、現金流量、流動資金及資本資源、減值、增長、策略、計劃、表現、分派、組織架構、未來開業店舖、市場機遇以及整體市場及行業狀況。本集團一般以「預期」、「尋求」、「相信」、「計劃」、「擬」、「估計」、「預測」、「預計」、「可能」、「將」、「會」及「或許」等詞彙或類似詞彙或陳述識別前瞻性陳述。前瞻性陳述是基於管理層使用現有可用資料作出的看法及假設。該等陳述僅屬預測,並非未來表現、行動或事件的保證。前瞻性陳述受限於風險及不確定因素。倘發生一項或以上風險或不確定因素,或倘管理層的基本觀點及假設被證明為不正確,實際結果可能會與前瞻性陳述所預期者有重大差異。前瞻性陳述僅提述截至其作出當日的情況。本公司股東、有意投資者及其他相關利益團體不應過分依賴該等前瞻性陳述。本集團明確表示,除適用證券法例及法規所規定者外,其概無任何責任因新增資訊、未來事件或其他因素而更新或修訂任何前瞻性陳述。
約整本文件中若干數據已向上或向下約整。因此,表格中個別金額的實際總數與所示總數之間、本文件表格中的數據與相應分析部分中所提供的數據之間以及本文件中的數據與其他公開文件中的數據之間可能存在差異。所有百分比及主要數據是使用整數美元的基礎數據計算得出。
DISCLAIMER免責聲明
Notes(1) International Financial Reporting Standards as issued by the International Accounting Standards Board.(2) Earnings before interest, taxes, depreciation and amortization.
註釋(1) 國際會計準則理事會頒佈的《國際財務報告準則》。(2) 未計利息、稅項、折舊及攤銷前的盈利。
4
SAM005_IR.indb 4 9/9/2019 17:25

The Board of Directors of Samsonite International S.A. (the “Company”), together with its consolidated subsidiaries (the “Group”), is pleased to present the unaudited consolidated interim financial statements of the Group as of June 30, 2019 and for the six month period then ended, together with comparative figures for the six months ended June 30, 2018.
On January 1, 2019, the Group adopted IFRS 16, Leases (“IFRS 16”) (see note 3(b) Changes in Accounting Policies in the Notes to the Consolidated Interim Financial Statements). The Group has applied IFRS 16 using the modified retrospective approach and therefore the comparative information for the six months ended June 30, 2018 on the consolidated income statement and in the “as reported” column in the summary financial results table below has not been restated and continues to be reported under International Accounting Standards (“IAS”) 17, Leases (“IAS 17”) and IFRS Interpretations Committee (“IFRIC”) 4, Determining whether an Arrangement Contains a Lease (“IFRIC 4”). The Group has included with respect to the six months ended June 30, 2018 an “as adjusted for IFRS 16” column in the summary financial results table below to present its financial performance for the six months ended June 30, 2018 on a comparable basis. Such amounts reflect management’s best estimate based on its evaluation of the impact and are non-IFRS measures (see bridges in the Management Discussion and Analysis – Adjusted EBITDA and the Management Discussion and Analysis – Adjusted Net Income sections below).
新秀麗國際有限公司(「本公司」,連同其綜合附屬公司統稱為「本集團」)董事會欣然呈列本集團於2019年6月30日以及截至該日止六個月期間之未經審計綜合中期財務報表連同截至2018年6月30日止六個月之比較數字。
本集團於 2019年 1月 1日採納 IFRS第 16號租賃(「IFRS第16號」)(見「綜合中期財務報表附註」所載附註3(b) 「會計政策的變動」)。本集團在採納 IFRS第16號時應用經修訂追溯法,故未重列綜合收益表及下文財務業績概要表「按呈報基準」一欄內截至2018年6月30日止六個月的比較數字,並繼續根據《國際會計準則》(「IAS」)第17號租賃(「IAS第17號」)及《IFRS詮釋委員會》(「IFRIC」)第4號釐定安排是否包含租賃(「IFRIC第4號」)呈報。本集團已於下文財務業績概要表增加截至2018年6月30日止六個月「就 IFRS第16號作出調整」一欄以按可比較基準呈列截至2018年6月30日止六個月的財務表現。該等金額反映管理層對有關影響的評估所得出的最佳估計,為非 IFRS財務計量工具(見下文「管理層討論與分析 — 經調整EBITDA」及「管理層討論與分析 — 經調整淨收入」兩節所載的對賬)。
SUMMARY FINANCIAL RESULTS財務業績概要
5Samsonite International S.A. Interim Report 2019 新秀麗國際有限公司 2019年中期報告
SAM005_IR.indb 5 9/9/2019 17:25
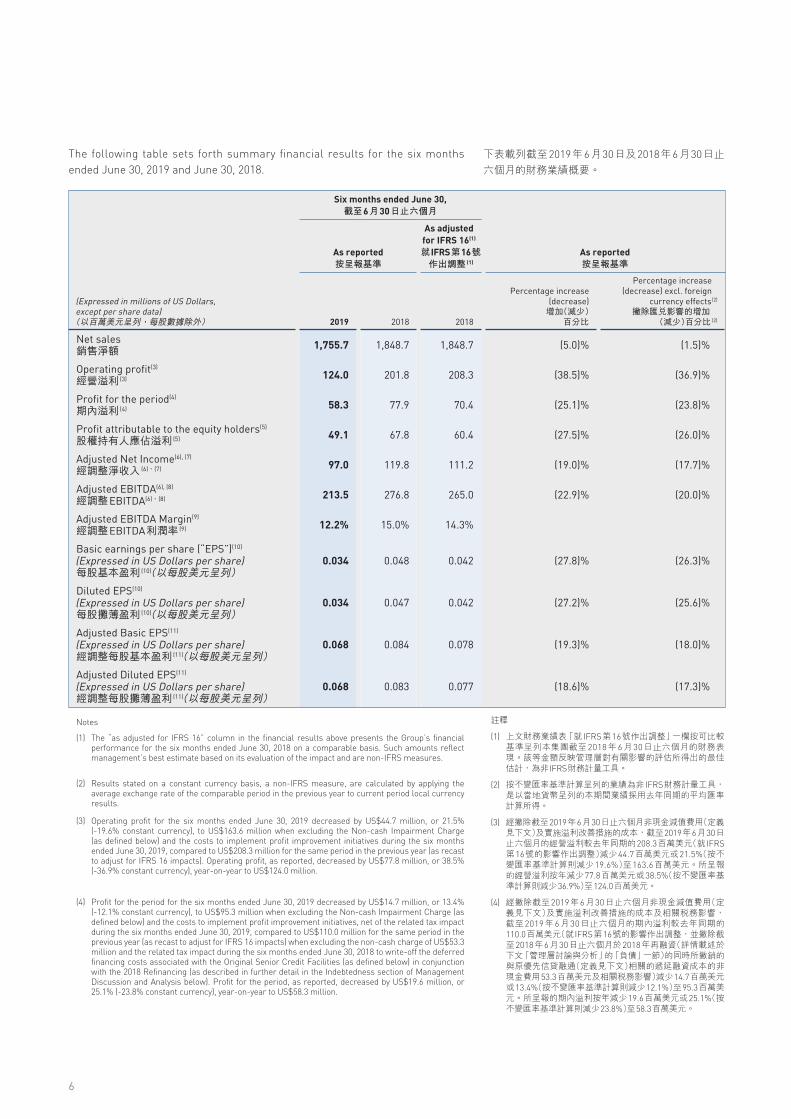
The following table sets forth summary financial results for the six months ended June 30, 2019 and June 30, 2018.
Six months ended June 30, 截至6月30日止六個月
As reported按呈報基準
As adjusted for IFRS 16(1)
就IFRS第16號 作出調整 (1)
As reported按呈報基準
(Expressed in millions of US Dollars, except per share data)
(以百萬美元呈列,每股數據除外) 2019 2018 2018
Percentage increase (decrease)
增加(減少) 百分比
Percentage increase (decrease) excl. foreign
currency effects(2)
撇除匯兌影響的增加(減少)百分比 (2)
Net sales銷售淨額 1,755.7 1,848.7 1,848.7 (5.0)% (1.5)%
Operating profit(3)
經營溢利 (3) 124.0 201.8 208.3 (38.5)% (36.9)%
Profit for the period(4)
期內溢利 (4) 58.3 77.9 70.4 (25.1)% (23.8)%
Profit attributable to the equity holders(5)
股權持有人應佔溢利 (5) 49.1 67.8 60.4 (27.5)% (26.0)%
Adjusted Net Income(6), (7)
經調整淨收入 (6)、(7) 97.0 119.8 111.2 (19.0)% (17.7)%
Adjusted EBITDA(6), (8)
經調整EBITDA(6)、(8) 213.5 276.8 265.0 (22.9)% (20.0)%
Adjusted EBITDA Margin(9)
經調整EBITDA利潤率 (9) 12.2% 15.0% 14.3%
Basic earnings per share (“EPS”)(10) (Expressed in US Dollars per share)每股基本盈利 (10)(以每股美元呈列)
0.034 0.048 0.042 (27.8)% (26.3)%
Diluted EPS(10) (Expressed in US Dollars per share)每股攤薄盈利 (10)(以每股美元呈列)
0.034 0.047 0.042 (27.2)% (25.6)%
Adjusted Basic EPS(11) (Expressed in US Dollars per share)經調整每股基本盈利 (11)(以每股美元呈列)
0.068 0.084 0.078 (19.3)% (18.0)%
Adjusted Diluted EPS(11) (Expressed in US Dollars per share)經調整每股攤薄盈利 (11)(以每股美元呈列)
0.068 0.083 0.077 (18.6)% (17.3)%
Notes
(1) The “as adjusted for IFRS 16” column in the financial results above presents the Group’s financial performance for the six months ended June 30, 2018 on a comparable basis. Such amounts reflect management’s best estimate based on its evaluation of the impact and are non-IFRS measures.
(2) Results stated on a constant currency basis, a non-IFRS measure, are calculated by applying the average exchange rate of the comparable period in the previous year to current period local currency results.
(3) Operating profit for the six months ended June 30, 2019 decreased by US$44.7 million, or 21.5% (-19.6% constant currency), to US$163.6 million when excluding the Non-cash Impairment Charge (as defined below) and the costs to implement profit improvement initiatives during the six months ended June 30, 2019, compared to US$208.3 million for the same period in the previous year (as recast to adjust for IFRS 16 impacts). Operating profit, as reported, decreased by US$77.8 million, or 38.5% (-36.9% constant currency), year-on-year to US$124.0 million.
(4) Profit for the period for the six months ended June 30, 2019 decreased by US$14.7 million, or 13.4% (-12.1% constant currency), to US$95.3 million when excluding the Non-cash Impairment Charge (as defined below) and the costs to implement profit improvement initiatives, net of the related tax impact during the six months ended June 30, 2019, compared to US$110.0 million for the same period in the previous year (as recast to adjust for IFRS 16 impacts) when excluding the non-cash charge of US$53.3 million and the related tax impact during the six months ended June 30, 2018 to write-off the deferred financing costs associated with the Original Senior Credit Facilities (as defined below) in conjunction with the 2018 Refinancing (as described in further detail in the Indebtedness section of Management Discussion and Analysis below). Profit for the period, as reported, decreased by US$19.6 million, or 25.1% (-23.8% constant currency), year-on-year to US$58.3 million.
下表載列截至2019年6月30日及2018年6月30日止六個月的財務業績概要。
註釋
(1) 上文財務業績表「就 IFRS第16號作出調整」一欄按可比較基準呈列本集團截至2018年6月30日止六個月的財務表現。該等金額反映管理層對有關影響的評估所得出的最佳估計,為非 IFRS財務計量工具。
(2) 按不變匯率基準計算呈列的業績為非 IFRS財務計量工具,是以當地貨幣呈列的本期間業績採用去年同期的平均匯率計算所得。
(3) 經撇除截至2019年6月30日止六個月非現金減值費用(定義見下文)及實施溢利改善措施的成本,截至2019年6月30日止六個月的經營溢利較去年同期的208.3百萬美元(就 IFRS第16號的影響作出調整)減少44.7百萬美元或21.5%(按不變匯率基準計算則減少19.6%)至163.6百萬美元。所呈報的經營溢利按年減少77.8百萬美元或38.5%(按不變匯率基準計算則減少36.9%)至124.0百萬美元。
(4) 經撇除截至2019年6月30日止六個月非現金減值費用(定義見下文)及實施溢利改善措施的成本及相關稅務影響,截至2019年6月30日止六個月的期內溢利較去年同期的110.0百萬美元(就 IFRS第16號的影響作出調整,並撇除截至2018年6月30日止六個月於2018年再融資(詳情載述於下文「管理層討論與分析」的「負債」一節)的同時所撇銷的與原優先信貸融通(定義見下文)相關的遞延融資成本的非現金費用53.3百萬美元及相關稅務影響)減少14.7百萬美元或13.4%(按不變匯率基準計算則減少12.1%)至95.3百萬美元。所呈報的期內溢利按年減少19.6百萬美元或25.1%(按不變匯率基準計算則減少23.8%)至58.3百萬美元。
6
SAM005_IR.indb 6 9/9/2019 17:25

(5) 經撇除截至2019年6月30日止六個月的非現金減值費用(定義見下文)及實施溢利改善措施的成本及相關稅務影響,截至2019年6月30日止六個月的股權持有人應佔溢利較截至2018年6月30日止六個月的99.9百萬美元(就 IFRS第16號的影響作出調整,並撇除截至2018年6月30日止六個月於2018年再融資(詳情載述於下文「管理層討論與分析」的「負債」一節)的同時所撇銷的與原優先信貸融通(定義見下文)相關的遞延融資成本的非現金費用53.3百萬美元及相關稅務影響)減少13.8百萬美元或13.9%(按不變匯率基準計算則減少12.4%)至86.1百萬美元。所呈報的股權持有人應佔溢利較去年同期減少18.7百萬美元或27.5%(按不變匯率基準計算則減少26.0%)至49.1百萬美元。
(6) 截至 2019年 6月 30日止六個月的經調整淨收入及經調整EBITDA(定義見下文)的所呈報的業績與截至2018年6月30日止六個月的「就 IFRS第16號作出調整」業績比較得出的按年變動為︰
• 經調整淨收入減少 12.8%(按不變匯率基準計算則減少11.3%);及
• 經調整EBITDA(定義見下文)減少19.4%(按不變匯率基準計算則減少16.4%)。
(7) 經調整淨收入為非 IFRS財務計量工具,其撇除影響本集團的呈報期內溢利的多項成本、費用及貸項以及若干其他非現金費用(連同其各自的稅務影響)的影響,本集團相信其有助證券分析員、投資者及其他相關利益團體更全面了解本集團的相關財務表現。有關本集團期內溢利與經調整淨收入的對賬,請參閱「管理層討論與分析 — 經調整淨收入」。
(8) 未計利息、稅項、折舊及攤銷前的經調整盈利(「經調整EBITDA」)為非 IFRS財務計量工具,其撇除多項成本、費用及貸項以及若干其他非現金費用的影響。由於2019年1月1日本集團採納 IFRS第16號,因此經調整EBITDA計入租賃利息及攤銷開支(見「綜合中期財務報表附註」所載附註3(b)「會計政策的變動」)。將 IFRS第16號的租賃利息及攤銷開支計入經調整EBITDA,令此非 IFRS財務計量工具與過往期間所披露的經調整EBITDA更具可比較性。本集團相信該等財務計量工具會提供更多資訊,有利於更全面了解其經營表現及其業務的相關趨勢。有關本集團期內溢利與經調整EBITDA的對賬,請參閱「管理層討論與分析 — 經調整EBITDA」。
(9) 經調整EBITDA利潤率為非 IFRS財務計量工具,以經調整EBITDA除以銷售淨額計算所得。
(10) 每股基本盈利由截至2018年6月30日止六個月的0.048美元減少27.8%至截至2019年6月30日止六個月的0.034美元。每股攤薄盈利由截至2018年6月30日止六個月的0.047美元減少27.2%至截至2019年6月30日止六個月的0.034美元。經撇除截至2019年6月30日止六個月的非現金減值費用(定義見下文)及實施溢利改善措施的成本及相關稅務影響,截至2019年6月30日止六個月的經調整每股基本盈利較去年同期的0.070美元減少14.2%至0.060美元。撇除上述相同費用及成本,截至2019年6月30日止六個月的經調整每股攤薄盈利較去年同期的0.069美元減少13.4%至0.060美元。截至2018年6月30日止六個月的經調整每股基本盈利及經調整每股攤薄盈利已就 IFRS第16號的影響作出調整,撇除於2018年再融資(詳情載述於下文「管理層討論與分析」的「負債」一節)的同時所撇銷的與原優先信貸融通(定義見下文)相關的遞延融資成本的非現金費用53.3百萬美元及相關稅務影響。
(11) 經調整每股基本盈利及經調整每股攤薄盈利兩項均為 非 IFRS財務計量工具,是以經調整淨收入分別除以每股基本盈利及每股攤薄盈利計算所用的加權平均股份數目計算所得。
(5) Profit attributable to the equity holders for the six months ended June 30, 2019 decreased by US$13.8 million, or 13.9% (-12.4% constant currency), to US$86.1 million when excluding the Non-cash Impairment Charge (as defined below) and the costs to implement profit improvement initiatives, net of the related tax impact during the six months ended June 30, 2019, compared to US$99.9 million for the six months ended June 30, 2018 (as recast to adjust for IFRS 16 impacts) when excluding the non-cash charge of US$53.3 million and the related tax impact during the six months ended June 30, 2018 to write-off the deferred financing costs associated with the Original Senior Credit Facilities (as defined below) in conjunction with the 2018 Refinancing (as described in further detail in the Indebtedness section of Management Discussion and Analysis below). Profit attributable to the equity holders, as reported, decreased by US$18.7 million, or 27.5% (-26.0% constant currency), from the same period in the previous year to US$49.1 million.
(6) When comparing the reported results for Adjusted Net Income and Adjusted EBITDA (as defined below) for the six months ended June 30, 2019 against the “as adjusted for IFRS 16” results for the six months ended June 30, 2018, the year-on-year changes were:
• Adjusted Net Income decreased by 12.8% (-11.3% constant currency); and
• Adjusted EBITDA (as defined below) decreased by 19.4% (-16.4% constant currency).
(7) Adjusted Net Income, a non-IFRS measure, eliminates the effect of a number of costs, charges and credits and certain other non-cash charges, along with their respective tax effects, that impact the Group’s reported profit for the period, which the Group believes helps to give securities analysts, investors and other interested parties a better understanding of the Group’s underlying financial performance. See “Management Discussion and Analysis – Adjusted Net Income” for a reconciliation from the Group’s profit for the period to Adjusted Net Income.
(8) Adjusted earnings before interest, taxes, depreciation and amortization (“Adjusted EBITDA”), a non-IFRS measure, eliminates the effect of a number of costs, charges and credits and certain other non-cash charges. Adjusted EBITDA includes the lease interest and amortization expense as a result of the Group’s adoption of IFRS 16 on January 1, 2019 (see further discussion in note 3(b) Changes in Accounting Policies in the Notes to the Consolidated Interim Financial Statements). The inclusion of IFRS 16 lease interest and amortization expense in Adjusted EBITDA allows the non-IFRS measure to be more comparable with the previous period’s Adjusted EBITDA disclosure. The Group believes these measures provide additional information that is useful in gaining a more complete understanding of its operational performance and of the underlying trends of its business. See “Management Discussion and Analysis – Adjusted EBITDA” for a reconciliation from the Group’s profit for the period to Adjusted EBITDA.
(9) Adjusted EBITDA margin, a non-IFRS measure, is calculated by dividing Adjusted EBITDA by net sales.
(10) Basic earnings per share (“Basic EPS”) decreased by 27.8% to US$0.034 for the six months ended June 30, 2019 from US$0.048 for the six months ended June 30, 2018. Diluted earnings per share (“Diluted EPS”) decreased by 27.2% to US$0.034 for the six months ended June 30, 2019 from US$0.047 for the six months ended June 30, 2018. Basic EPS, as adjusted, decreased by 14.2% to US$0.060 for the six months ended June 30, 2019 when excluding the Non-cash Impairment Charge (as defined below) and the costs to implement profit improvement initiatives, net of the related tax impact during the six months ended June 30, 2019, compared to US$0.070 for the same period in the previous year. Diluted EPS, as adjusted, decreased by 13.4% to US$0.060 for the six months ended June 30, 2019 when excluding the same charges and costs as noted above, compared to US$0.069 for the same period in the previous year. Basic EPS, as adjusted, and Diluted EPS, as adjusted, for the six months ended June 30, 2018 have been recast to adjust for IFRS 16 impacts and exclude the non-cash charge of US$53.3 million and the related tax impact to write-off the deferred financing costs associated with the Original Senior Credit Facilities (as defined below) in conjunction with the 2018 Refinancing (as described in further detail in the Indebtedness section of Management Discussion and Analysis below).
(11) Adjusted Basic EPS and Adjusted Diluted EPS, both non-IFRS measures, are calculated by dividing Adjusted Net Income by the weighted average number of shares used in the Basic EPS and Diluted EPS calculations, respectively.
7Samsonite International S.A. Interim Report 2019 新秀麗國際有限公司 2019年中期報告
SAM005_IR.indb 7 9/9/2019 17:26

• Net sales for the six months ended June 30, 2019 decreased by US$27.8 million, or 1.5%, on a constant currency basis compared to the six months ended June 30, 2018. US Dollar reported net sales were US$1,755.7 million for the six months ended June 30, 2019, reflecting a decrease of US$93.0 million, or 5.0% compared to the corresponding period in the previous year. The net sales decline was due to headwinds faced by the business in the United States, China’s business-to-business channel, South Korea and Chile, as well as due to unfavorable foreign currency impacts. Excluding the effects of these headwinds, the Group’s constant currency net sales increased by US$34.6 million, or 3.5%, for the six months ended June 30, 2019 compared to the same period in the previous year, and US Dollar reported net sales decreased by US$19.5 million, or 2.0%, for the six months ended June 30, 2019 compared to the same period in the previous year.
• The Group spent US$103.1 million on marketing during the six months ended June 30, 2019 compared to US$114.3 million for the six months ended June 30, 2018, a decrease of US$11.3 million, or 9.8% (-6.8% constant currency). As a percentage of net sales, marketing expenses decreased by 30 basis points to 5.9% for the six months ended June 30, 2019 from 6.2% for the six months ended June 30, 2018.
• Based on an evaluation of loss-making stores in the six months ended June 30, 2019 and the anticipated closure of some of these stores, the Group recognized a non-cash impairment charge totaling US$29.7 million for the first half of 2019, comprised of the write-off of US$21.0 million of lease right-of-use assets associated with such stores that were recently recognized with the adoption of IFRS 16 and a US$8.7 million impairment for property, plant and equipment of such stores (the “Non-cash Impairment Charge”).
• Operating profit for the six months ended June 30, 2019 decreased by US$44.7 million, or 21.5% (-19.6% constant currency), to US$163.6 million when excluding the Non-cash Impairment Charge and the costs to implement profit improvement initiatives during the six months ended June 30, 2019, compared to US$208.3 million for the same period in the previous year (as recast to adjust for IFRS 16 impacts)(1). Operating profit, as reported, decreased by US$77.8 million, or 38.5% (-36.9% constant currency), year-on-year to US$124.0 million.
• Profit for the period for the six months ended June 30, 2019 decreased by US$14.7 million, or 13.4% (-12.1% constant currency), to US$95.3 million when excluding the Non-cash Impairment Charge and the costs to implement profit improvement initiatives, net of the related tax impact during the six months ended June 30, 2019, compared to US$110.0 million for the same period in the previous year (as recast to adjust for IFRS 16 impacts)(1) when excluding the non-cash charge of US$53.3 million and the related tax impact during the six months ended June 30, 2018 to write-off the deferred financing costs associated with the Original Senior Credit Facilities (as defined below) in conjunction with the 2018 Refinancing (as described in further detail in the Indebtedness section of Management Discussion and Analysis below). Profit for the period, as reported, decreased by US$19.6 million, or 25.1% (-23.8% constant currency), year-on-year to US$58.3 million.
• 截至2019年6月30日止六個月的銷售淨額較截至2018年6月30日止六個月的減少27.8百萬美元或1.5%(按不變匯率基準計算)。截至2019年6月30日止六個月的以美元呈報的銷售淨額為1,755.7百萬美元,較去年同期減少93.0百萬美元或5.0%,是由於美國、中國企業對企業渠道、南韓及智利的業務受市場不景氣影響以及外匯的不利影響所致。撇除該等不利因素影響,本集團截至2019年6月30日止六個月按不變匯率基準計算的銷售淨額較去年同期上升34.6百萬美元或3.5%,而截至2019年6月30日止六個月的以美元呈報的銷售淨額則較去年同期減少19.5百萬美元或2.0%。
• 本集團在營銷方面的開支由截至2018年6月30日止六個月的114.3百萬美元減少11.3百萬美元或9.8%(按不變匯率基準計算則減少6.8%)至截至2019年6月30日止六個月的103.1百萬美元。截至2019年6月30日止六個月的營銷開支佔銷售淨額百分比由截至2018年6月30日止六個月的6.2%減少30個基點至5.9%。
• 基於評估截至2019年6月30日止六個月錄得虧損的店舖及預計關閉部分該等店舖,本集團確認2019年上半年的非現金減值費用共計29.7百萬美元,包括撇銷有關該等店舖的租賃使用權資產21.0百萬美元(因採用IFRS第16號而於近期確認)及該等店舖的物業、廠房及設備減值8.7百萬美元(「非現金減值費用」)。
• 經撇除截至2019年6月30日止六個月的非現金減值費用及實施溢利改善措施的成本,截至2019年6月30日止六個月的經營溢利較去年同期的208.3百萬美元(就 IFRS第16號的影響作出調整)(1)減少44.7百萬美元或21.5%(按不變匯率基準計算則減少19.6%)至163.6百萬美元。所呈報的經營溢利按年減少77.8百萬美元或38.5%(按不變匯率基準計算則減少36.9%)至124.0百萬美元。
• 經撇除截至2019年6月30日止六個月的非現金減值費用及實施溢利改善措施的成本及相關稅務影響,截至2019年6月30日止六個月的期內溢利較去年同期的110.0百萬美元(就IFRS第16號的影響作出調整 (1),並撇除截至2018年6月30日止六個月於2018年再融資(詳情載述於下文「管理層討論與分析」的「負債」一節)的同時撇銷與原優先信貸融通(定義見下文)相關的遞延融資成本的非現金費用53.3百萬美元及相關稅務影響)減少14.7百萬美元或13.4%(按不變匯率基準計算則減少12.1%)至95.3百萬美元。所呈報的期內溢利按年減少19.6百萬美元或25.1%(按不變匯率基準計算則減少23.8%)至58.3百萬美元。
FINANCIAL HIGHLIGHTS財務摘要
million百萬美元
US$1,755.7Net Sales 銷售淨額
million 百萬美元
US$124.0Operating Profit 經營溢利
million百萬美元
US$213.5Adjusted EBITDA 經調整EBITDA
8
SAM005_IR.indb 8 9/9/2019 17:26

• Profit attributable to the equity holders for the six months ended June 30, 2019 decreased by US$13.8 million, or 13.9% (-12.4% constant currency), to US$86.1 million when excluding the Non-cash Impairment Charge and the costs to implement profit improvement initiatives, net of the related tax impact during the six months ended June 30, 2019, compared to US$99.9 million for the six months ended June 30, 2018 (as recast to adjust for IFRS 16 impacts)(1) when excluding the non-cash charge of US$53.3 million and the related tax impact during the six months ended June 30, 2018 to write-off the deferred financing costs associated with the Original Senior Credit Facilities (as defined below) in conjunction with the 2018 Refinancing (as described in further detail in the Indebtedness section of Management Discussion and Analysis below). Profit attributable to the equity holders, as reported, decreased by US$18.7 million, or 27.5% (-26.0% constant currency), from the same period in the previous year to US$49.1 million.
• Adjusted Net Income, a non-IFRS measure, decreased by US$14.2 million, or 12.8% (-11.3% constant currency), to US$97.0 million for the six months ended June 30, 2019 compared to US$111.2 million for the same period in the previous year (as recast to adjust for IFRS 16 impacts)(1). Reported Adjusted Net Income for the six months ended June 30, 2018 was US$119.8 million.
• Adjusted EBITDA, a non-IFRS measure, decreased by US$51.5 million, or 19.4% (-16.4% constant currency), to US$213.5 million for the six months ended June 30, 2019 compared to US$265.0 million for the same period in the previous year (as recast to adjust for IFRS 16 impacts)(1). Reported Adjusted EBITDA for the six months ended June 30, 2018 was US$276.8 million.
• Adjusted EBITDA margin, a non-IFRS measure, was 12.2% for the six months ended June 30, 2019 compared to 14.3% for the six months ended June 30, 2018 (as recast to adjust for IFRS 16 impacts)(1). This decrease was primarily due to the effect of investments in the DTC distribution channel, particularly in connection with bricks-and-mortar retail stores that were opened in 2017 and 2018. Reported Adjusted EBITDA margin for the six months ended June 30, 2018 was 15.0%.
• The Group generated US$192.6 million of cash from operating activities during the six months ended June 30, 2019 compared to US$56.2 million for the same period in the previous year. Excluding the impacts from IFRS 16, operating cash flow more than doubled to US$113.0 million for the first half of 2019 compared to the first half of 2018. As of June 30, 2019, the Group had cash and cash equivalents of US$489.3 million and outstanding financial debt of US$1,922.1 million (excluding deferred financing costs of US$14.9 million), putting the Group in a net debt position of US$1,432.8 million compared to US$1,588.3 million as of June 30, 2018 and US$1,508.2 million as of December 31, 2018.
• On March 13, 2019, the Company’s Board of Directors recommended that a cash distribution in the amount of US$125.0 million be made to the Company’s shareholders, a 13.6% increase from the US$110.0 million distribution paid in 2018. The shareholders approved this distribution on June 6, 2019 at the Company’s Annual General Meeting and the distribution was paid on July 16, 2019.
The Company has presented certain non-IFRS measures in the financial highlights section above because each of these measures provides additional information that management believes is useful in gaining a more complete understanding of the Group’s operational performance and of the trends impacting its business to securities analysts, investors and other interested parties. These non-IFRS financial measures, as calculated herein, may not be comparable to similarly named measures used by other companies, and should not be considered comparable to IFRS measures. Non-IFRS measures have limitations as an analytical tool and should not be considered in isolation from, or as a substitute for, an analysis of the Group’s financial results as reported under IFRS.
• 經撇除截至2019年6月30日止六個月的非現金減值費用及實施溢利改善措施的成本及相關稅務影響,截至2019年6月30日止六個月的股權持有人應佔溢利較去年同期的99.9百萬美元(就IFRS第16號的影響作出調整)(1),並撇除截至2018年6月30日止六個月於2018年再融資(詳情載述於下文「管理層討論與分析」的「負債」一節)的同時撇銷與原優先信貸融通(定義見下文)相關的遞延融資成本的非現金費用53.3百萬美元及相關稅務影響)減少13.8百萬美元或13.9%(按不變匯率基準計算則減少12.4%)至86.1百萬美元。所呈報的股權持有人應佔溢利較去年同期減少18.7百萬美元或27.5%(按不變匯率基準計算則減少26.0%)至49.1百萬美元。
• 經調整淨收入(一項非 IFRS財務計量工具)由去年同期的111.2百萬美元(就IFRS第16號的影響作出調整)(1)減少14.2百萬美元或12.8%(按不變匯率基準計算則減少11.3%)至截至2019年6月30日止六個月的97.0百萬美元。截至2018年6月30日止六個月所呈報的經調整淨收入為119.8百萬美元。
• 經調整EBITDA(一項非 IFRS財務計量工具)較去年同期的265.0百萬美元(就 IFRS第16號的影響作出調整)(1)減少51.5百萬美元或19.4%(按不變匯率基準計算則減少16.4%)至截至2019年6月30日止六個月的213.5百萬美元。截至2018年6月30日止六個月所呈報的經調整EBITDA為276.8百萬 美元。
• 經調整EBITDA利潤率(一項非 IFRS財務計量工具)截至2019年6月30日止六個月為12.2%,而截至2018年6月30日止六個月則為14.3%(就 IFRS第16號的影響作出調整)(1)。此減幅主要因投資於DTC分銷渠道(尤其是2017年及2018年增設實體零售店)的影響所致。截至2018年6月30日止六個月所呈報的經調整EBITDA利潤率為15.0%。
• 本集團截至2019年6月30日止六個月自經營活動產生現金192.6百萬美元,而去年同期則為56.2百萬美元。撇除 IFRS第16號的影響,2019年上半年的經營現金流量達113.0百萬美元,為2018年上半年的兩倍有多。於2019年6月30日,本集團的現金及現金等價物為489.3百萬美元,未償還金融債務為1,922.1百萬美元(撇除遞延融資成本14.9百萬美元),故本集團的淨債務為1,432.8百萬美元,而2018年6月30日及2018年12月31日則分別為1,588.3百萬美元及1,508.2百萬美元。
• 於2019年3月13日,本公司董事會建議向本公司股東作出125.0百萬美元的現金分派,較2018年派付的110.0百萬美元分派增長13.6%。股東於2019年6月6日舉行的本公司股東週年大會上批准此項分派,而有關分派已於2019年7月16日派付。
本公司於上文「財務摘要」一節呈列若干非IFRS財務計量工具,因上述各財務計量工具提供更多資訊,管理層相信其有利於證券分析員、投資者及其他相關利益團體更全面了解本集團的經營表現及影響其業務的趨勢。本文所計算的此等非IFRS財務計量工具未必可與其他公司所使用類似命名的計量工具進行比較,且不應被視為可與IFRS財務計量工具比較的計量工具。非IFRS財務計量工具作為一項分析工具有其局限性,不應被視為獨立於或代替本集團根據IFRS所呈報的財務業績的分析。
Note(1) See bridge included with Management Discussion and Analysis.
註釋(1) 見「管理層討論與分析」所載的對賬。
9Samsonite International S.A. Interim Report 2019 新秀麗國際有限公司 2019年中期報告
SAM005_IR.indb 9 9/9/2019 17:26

CHAIRMAN’S STATEMENT主席報告
Our performance in the first half of 2019 has been impacted by some of the most challenging trading conditions since the Company’s listing in 2011. While navigating through these challenges, we remain focused on executing our plan to position Samsonite for long-term growth and profitability, and are encouraged by the progress to date. The management team took swift action to tighten expense and working capital controls, and we have already begun to see a positive impact on our profitability in the second quarter of 2019.
自本公司2011年上市以來,2019年上半年的營商環境最具挑戰,我們的表現因此受到影響。我們在應對挑戰的同時,繼續專注執行新秀麗長期發展及盈利計劃,迄今取得良好進展。我們的管理團隊迅速採取行動,加強對開支及營運資金的管控,該等行動於2019年第二季度開始對盈利能力產生正面影響。
Timothy Charles ParkerChairman 主席
Our performance in the first half of 2019 has been impacted by some of the most challenging trading conditions since the Company’s listing in 2011. While navigating through these challenges, we remain focused on executing our plan to position Samsonite for long-term growth and profitability, and are encouraged by the progress to date.
Four of our key markets were impacted by macro-economic and geopolitical headwinds. Our performance in the United States (“U.S.”) has been hampered by increased tariffs and reduced foreign tourist traffic. China’s business-to-business (“B2B”) orders remained soft as we de-emphasized this channel, but the rest of our China business has seen an improvement in the second quarter. The South Korean market remained in the doldrums due to the ongoing diplomatic situation, and our Chilean business is going through a fairly lackluster patch due to reduced cross-border shopping by Argentinian tourists. As a result, the Group’s net sales for the six months ended June 30, 2019 decreased by 1.5%(1) year-on-year. However, excluding the four challenged markets mentioned above, the Group’s net sales grew by 3.5%(1) in the first half of 2019. Meanwhile, the Group was also affected by the strengthening of the US Dollar, which had an unfavorable foreign currency translation impact on reported net sales of approximately US$65.2 million year-on-year, resulting in a 5.0% decrease in US Dollar reported net sales to US$1,755.7 million.
自本公司2011年上市以來,2019年上半年的營商環境最具挑戰,我們的表現因此受到影響。我們在應對挑戰的同時,繼續專注執行新秀麗長期發展及盈利計劃,迄今取得良好進展。
我們四個主要市場受宏觀經濟及地緣政治負面因素影響。我們於美國的表現受到加徵關稅及外國遊客流量減少的負面影響。雖然中國的企業對企業(「B2B」)訂單隨著我們減少對該渠道的投入而繼續疲弱,但我們中國其餘的業務在第二季度好轉。韓國市場因外交形勢仍處於低迷狀態,而我們的智利業務因阿根廷遊客減少跨境購物而表現欠佳。因此,截至2019年6月30日止六個月,本集團的銷售淨額按年下降1.5%(1)。然而,撇除上述四個受到考驗的市場,本集團 2019年上半年的銷售淨額增長3.5%(1)。此外,美元走強對本集團所呈報的銷售淨額約65.2百萬美元產生不利外匯影響,導致以美元呈報的銷售淨額按年減少5.0%至1,755.7百萬美元。
10
SAM005_IR.indb 10 9/9/2019 17:26

The Group’s global reach and scale, along with its diversified portfolio of leading brands, allows us to continue growing in many important markets while navigating challenging trading conditions in others. As a result, all our regions delivered constant currency net sales growth in the first half of 2019 except North America.
本集團的全球業務範圍和規模,以及多元化的領先品牌組合,使我們能夠在許多重要市場繼續發展,同時在其他營商環境具挑戰性的市場中前行。因此,2019年上半年除北美洲外,我們所有地區銷售淨額按不變匯率基準計算均有所增長。
The decline in net sales, along with increased expenses related to the expansion in bricks-and-mortar retail in 2017 and 2018, put pressure on the Group’s profitability. The management team took swift action to tighten expense and working capital controls, and we have already begun to see a positive impact on our profitability in the second quarter of 2019, with the decline in the Group’s Adjusted EBITDA(2) and Adjusted EBITDA margin(3) significantly diminishing in the second quarter compared to the first quarter of 2019. The Group’s second quarter 2019 Adjusted EBITDA decreased by 13.0%(4) while its Adjusted EBITDA margin decreased by 150 basis points(4) compared to the same period in 2018 (as recast to adjust for IFRS 16 impacts)(4). This was a creditable improvement following the 27.6%(4) decrease in Adjusted EBITDA and the 300 basis point(4) reduction in Adjusted EBITDA margin recorded in the first quarter of 2019, and we expect our profit improvement initiatives will position the business to deliver improved results going into the remainder of 2019 and into 2020. Overall, for the six months ended June 30, 2019, the Group’s Adjusted EBITDA decreased by 19.4%(4), (5) and its Adjusted EBITDA margin was 12.2%, down by 210 basis points(4), (5) compared to 14.3%(4) for the same period last year (as recast to adjust for IFRS 16 impacts)(4). I would refer you to Kyle’s report for a detailed discussion of our actions and initiatives to enhance our profitability going forward.
At this juncture, I think it’s useful to reiterate Samsonite’s strategy and competitive advantages, and set these in the context of the current challenging market conditions.
Since our listing in 2011, the Group has consistently pursued a strategy to diversify its business across geographical markets, brands, product categories and distribution channels. The goal is not just to build a bigger business, but a more resilient one whereby we are not reliant on any single market, brand, channel of distribution, or product category. Through a combination of steady organic growth and strategic acquisitions, we have transformed the business from being dependent largely on one brand, Samsonite, active primarily in travel goods sold mainly through wholesale channels in the developed markets of the U.S. and Europe to one that operates multiple brands across global markets through all major channels.
Today, the Group’s global reach and scale, along with its diversified portfolio of leading brands, allows us to continue growing in many important markets while navigating challenging trading conditions in others. For the six months ended June 30, 2019, the Group achieved solid constant currency net sales gains in important markets such as Japan (+4.8%(1)), India (+9.2%(1)), Germany (+6.8%(1)), Russia (+21.4%(1)) and Mexico (+4.7%(1)). As a result, all our regions delivered constant currency net sales growth in the first half of 2019 except North America (-5.7%(1)): Asia (+0.2%(1); +4.6%(1) excluding B2B net sales in China and net sales in South Korea), Europe (+1.9%(1)) and Latin America (+3.4%(1); +11.9%(1) excluding Chile).
銷售淨額減少以及於2017年及2018年擴張實體零售的相關開支增加對本集團的盈利能力帶來了壓力。我們的管理團隊迅速採取行動,加強對開支及營運資金的管控,該等行動於2019年第二季度開始對盈利能力產生正面影響:本集團經調整EBITDA(2)及經調整EBITDA利潤率 (3)於2019年第二季度的跌幅較第一季度顯著收窄。本集團2019年第二季度的經調整EBITDA減少13.0%(4),而經調整EBITDA利潤率較2018年同期下降150個基點 (4)(就 IFRS第16號的影響作出調整)(4),較2019年第一季度經調整EBITDA減少27.6%(4)及經調整EBITDA利潤率下降300個基點 (4)
顯著好轉,我們預期溢利改善措施將有助提高2019年下半年和2020年的業績。整體而言,截至2019年6月30日止六個月,本集團的經調整EBITDA減少19.4%(4)、(5),經調整EBITDA利潤率為12.2%,較去年同期的14.3%(4)下降210個基點 (4)、(5)(就 IFRS第16號的影響作出調整)(4)。有關我們提高未來盈利能力的行動及措施的詳細討論,閣下可參閱Kyle的報告。
當下,我認為有需要重申新秀麗的策略及競爭優勢,以及如何將之發揮在目前充滿挑戰的市場環境中。
自2011年上市以來,本集團一直實施跨地區市場、品牌、產品類別及分銷渠道業務多元化的策略。我們的目標不僅是擴張業務,還要令業務更具抗逆力,使我們不再倚賴任何單一市場、品牌、分銷渠道或產品類別。通過穩健自然增長和策略性收購的互相結合,我們實現業務轉型,不再過度倚賴新秀麗單一品牌主要透過美國及歐洲發達市場的批發渠道銷售旅遊產品,轉向通過所有主要渠道在全球市場經營多個品牌的企業。
本集團今天的全球業務範圍和規模,以及多元化的領先品牌組合,使我們能夠在許多重要市場繼續發展,同時在其他營商環境具挑戰性的市場中前行。截至2019年6月30日止六個月,按不變匯率基準計算,本集團在日本(增長4.8%(1))、印度(增長9.2%(1))、德國(增長6.8%(1))、俄羅斯(增長21.4%(1))及墨西哥(增長 4.7%(1))等重要市場實現穩健的銷售淨額增長。因此,2019年上半年除北美洲(減少5.7%(1))外,我們所有地區銷售淨額按不變匯率基準計算均有所增長:亞洲(增長0.2%(1),撇除中國B2B銷售淨額及韓國銷售淨額則增長4.6%(1))、歐洲(增長1.9%(1))及拉丁美洲(增長3.4%(1),撇除智利則增長11.9%(1))。
11Samsonite International S.A. Interim Report 2019 新秀麗國際有限公司 2019年中期報告
SAM005_IR.indb 11 9/9/2019 17:26

Tumi continued to achieve solid net sales gains in the first half in Asia, Europe and Latin America. We will continue to invest in driving the brand’s international expansion. The Samsonite brand has come to be the leader in travel goods through its relentless attention on quality, innovation and design. With exciting new product launches on the way, we are intent on driving an improvement in the brand’s performance.
Tumi在上半年於亞洲、歐洲及拉丁美洲實現穩健的銷售淨額增長。我們將繼續投資推動該品牌的國際擴張。新秀麗品牌通過對質量、創新及設計的不懈關注,成為旅遊商品的領導者。未來透過推出更多令人興奮的新產品,我們致力提高該品牌的表現。
Turning to our brands, Tumi continued to achieve solid net sales gains in the first half as we leveraged our global reach to successfully expand the brand’s presence in Asia (net sales up 11.9%(1)), Europe (+20.4%(1)) and Latin America (+178.2%(1)). As a result, the Tumi brand’s net sales grew by 4.8%(1) in the first half, notwithstanding a 2.9%(1) net sales decline in the brand’s core North American market due to the Group’s successful efforts to identify and stop sales to customers with higher trans-shipping risk in the U.S. and reduced tourist traffic into the U.S. Excluding North America, the Tumi brand recorded a 14.9%(1) increase in net sales during the first half of 2019, underscoring the brand’s substantial long-term growth potential. We will continue to invest in driving the brand’s international expansion.
The Samsonite brand has deep historical roots, and has come to be the leader in travel goods in almost every significant world market through its relentless attention on quality, innovation and design. We have maintained our investment in R&D, focusing particularly on new materials and technologies, with a view to keep bringing to market innovative products that offer tangible benefits to consumers. Net sales of the Samsonite brand decreased by 2.4%(1) during the first half of 2019, but with a number of successful new product launches already and more exciting new product launches on the way, we are intent on driving an improvement in the brand’s performance.
Net sales of the American Tourister brand decreased by 0.8%(1) year-on-year, a respectable showing considering the brand enjoyed a very strong first half in 2018 with net sales growth of 24.2%(1) year-on-year.
To drive our brands’ long-term success requires sustained investment, particularly in marketing. Our global scale allows us to make consistent and substantial investment in marketing to drive growth. This also gives the Group the flexibility to pull back temporarily and protect its profitability when faced with short-term challenges. As a percentage of sales, marketing spend decreased by 30 basis points to 5.9% for the first half of 2019 from 6.2% for the same period in 2018 (advertising spend in the first half of 2018 was higher due to the timing of the American Tourister global marketing campaign). As Kyle notes in his report, we will be moderating slightly our marketing spend in the second half of 2019 to help mitigate the headwinds the business is currently facing. However, it is our intention to bring marketing investment as a percentage of net sales back to target levels as trading conditions return to normal.
談及我們的品牌,Tumi在上半年實現穩健的銷售淨額增長,原因是我們憑藉全球規模成功擴充該品牌在亞洲(銷售淨額增長 11.9%(1))、歐洲(增長20.4%(1))及拉丁美洲(增長178.2%(1))的業務。因此,儘管由於本集團於美國成功識別並終止向高風險平行出口商客戶銷售,以及前往美國的遊客流量減少,導致Tumi品牌的核心北美洲市場銷售淨額減少2.9%(1),但上半年該品牌銷售淨額仍然增長4.8%(1)。撇除美國,Tumi品牌於2019年上半年的銷售淨額增長14.9%(1),展現出該品牌的巨大長期發展潛力。我們將繼續投資推動該品牌的國際擴張。
新秀麗品牌具有深厚的歷史根基,並通過對質量、創新及設計的不懈關注,幾乎於所有重要世界市場成為旅遊商品的領導者。我們持續投資於研究與開發,特別注重新物料及技術,以為市場帶來創新產品,為客戶創造切實利益。於2019年上半年,新秀麗品牌的銷售淨額減少2.4%(1),但透過成功推出新產品,以及未來更多令人興奮的新產品,我們致力提高該品牌的表現。
American Tourister品牌的銷售淨額按年減少0.8%(1),表現不錯,前提是考慮到該品牌在2018年上半年表現十分強勁,銷售淨額同比增長24.2%(1)。
推動我們品牌的長遠成功需要持續投資,特別是在營銷方面。全球規模使我們能夠在營銷方面進行持續而大規模的投資,以推動增長。這也使本集團可靈活地在面臨短期挑戰時暫時減低在這方面的投放以保護盈利能力。營銷開支佔銷售額百分比由 2018年上半年的 6.2%下降 30個基點至 2019年同期的5.9%(2018年上半年的廣告開支較高是由於American Tourister全球營銷活動)。正如Kyle在其報告中所述,我們將在2019年下半年略微減少營銷開支,幫助緩解目前業務面臨的壓力。然而,當營商環境恢復正常時,我們打算將營銷投資佔銷售淨額的百分比提高至目標水平。
12
SAM005_IR.indb 12 9/9/2019 17:26

Another key component of our strategy is to increase our investment in the direct-to-consumer channel (“DTC”). While we remain committed in expanding the Group’s DTC presence over the long term, we will push for faster growth in DTC e-commerce and pursue bricks-and-mortar retail expansion in a targeted, strategic manner.
我們策略的另一重要部分是增加直接面向消費者渠道的投資。雖然我們仍致力於長期擴充本集團的DTC業務,但我們將推動DTC電子商貿更快速增長並以針對性的策略方式推動實體零售擴張。
Our scale is also instrumental in allowing us to invest and build an extensive and efficient sourcing infrastructure, another important source of long-term competitive advantage. To sustain this edge, we are accelerating our efforts to diversify our supplier base into countries with more favorable production costs, thereby building greater flexibility and resilience into our supply chain, while ensuring we maintain product quality and environmental and social compliance standards. This is particularly important for us to mitigate the impact of higher tariffs on our U.S. business.
Another key component of our strategy is to increase our investment in the direct-to-consumer channel(6). One of the advantages of increasing our DTC presence is that we are better able to shape our product assortment and presentation, as well as to manage the environment and experience of customers shopping our products, thereby enhancing brand equity over the long term. While we remain committed in expanding the Group’s DTC presence over the long term, we will push for faster growth in DTC e-commerce and pursue bricks-and-mortar retail expansion in a targeted, strategic manner. This adjustment is motivated in part by the margin pressure arising from the increased expenses related to the expansion in bricks-and-mortar retail in 2017 and 2018. We addressed this pressure by moderating the pace of new retail store openings (we added 27 net new retail stores during the first half of 2019, compared to the 52 that were added during the first half of 2018 and the 32 in the second half of 2018), as well as conducting a comprehensive review of the Group’s retail store portfolio during the second quarter of 2019, evaluating the closure of unprofitable stores where we saw limited future potential and where we will attempt to negotiate acceptable exit terms.
The main impetus behind this adjustment has been the secular shift to online shopping by consumers worldwide. This shift is clearly reflected in our first half 2019 performance, which saw the Group’s DTC e-commerce net sales increase by 23.9%(1), excluding eBags (the eBags business is going through a period of adjustment as we phase out sales of certain lower margin third party brands to improve profitability), and we will continue to invest to expand our DTC e-commerce presence.
我們的規模亦有助於我們投資和建立廣泛高效的採購基礎建構,這是長期競爭優勢的另一重要來源。為保持優勢,我們正加大力度擴展供應商基礎至生產成本更具優勢的國家,致力使供應商組合更多元化,以提升供應鏈的靈活性及抗逆能力,同時確保維持產品質素及環境和社會合規標準。這對減輕加徵關稅對我們美國業務的影響尤為重要。
我們策略的另一重要部分是增加直接面向消費者渠道 (6)的投資,增加DTC業務的優勢之一是我們能夠更完善地塑造產品類別和展示,以及管理客戶購買產品時的環境及體驗,從而長期提升品牌價值。雖然本集團仍致力於長期擴充DTC業務,但我們將推動DTC電子商貿更快速增長並以針對性的策略方式推動實體零售擴張。此次調整的部分原因是2017年及 2018年實體零售擴張的費用增加所帶來的利潤率壓力。我們通過放慢開設新零售店的步伐減緩此種壓力(2019年上半年我們淨增設27家新零售店,而2018年上半年增設52家及2018年下半年增設32家),並於2019年第二季度對本集團的零售店組合進行全面審查,評估關閉我們認為未來潛力有限同時擬協商可接受退租條款的不盈利店舖。
此次調整的主要的推動力是全球消費者轉向於網上購物的長遠大趨勢。該轉變在我們2019年上半年的表現中明顯體現,撇除eBags(由於我們逐步淘汰若干低利潤率第三方品牌的銷售,以提高盈利能力,故eBags業務正處於調整期),本集團DTC電子商貿銷售淨額增加23.9%(1),我們將繼續投資擴張我們的DTC電子商貿業務。
13Samsonite International S.A. Interim Report 2019 新秀麗國際有限公司 2019年中期報告
SAM005_IR.indb 13 9/9/2019 17:26

主席Timothy Charles Parker2019年8月21日
One of our top priorities remains generating strong operating cash flow. Cash generated from operating activities more than doubled to US$113.0 million(7), with the increase largely attributable to improved working capital management. Net working capital efficiency(8) of 14.8% of net sales at June 30, 2019 saw a slight deterioration year-on-year (14.0% at June 30, 2018), but represented an improvement from March 31, 2019, when net working capital efficiency was 220 basis points higher year-on-year, and the management team will remain focused on returning it to target levels. Additionally, the slowdown in new store openings resulted in a US$15.1 million reduction in capital expenditures and consequently a US$17.4 million year-on-year decrease in cash used in investing activities during the first half of 2019. As a result, the Group had a net debt position of US$1,432.8 million(9) at June 30, 2019, US$155.6 million lower than the same date a year ago. With this improvement in the Group’s net debt position, the Group’s pro forma net leverage ratio(10) was steady at 2.60:1.00 for the first half of 2019 compared to 2.57:1.00 for the same period in 2018.
The near term outlook remains decidedly mixed. On the one hand, our sales have shown signs of stabilizing, decreasing by 0.7%(1) during the second quarter of 2019 compared to the 2.4%(1) decline recorded in the first quarter of 2019, driven by improvements in China and Latin America, along with continued growth in Europe and key Asian markets including Japan and India. During the second quarter of 2019, net sales in China increased by 5.1%(1) year-on-year, despite continued softness in the B2B market (excluding B2B, China recorded an 11.2%(1) growth in net sales), a significant improvement from the 8.3%(1) net sales decrease (+5.9%(1) excluding B2B) recorded during the first quarter of 2019. Latin America recorded strong second quarter 2019 net sales growth of 12.5%(1) compared to a decrease of 2.8%(1) during the first quarter of 2019.
On the other hand, recent events portend a more volatile second half, including an escalation in U.S.-China trade tensions, increased likelihood of a “no deal” Brexit and a deceleration in economic growth in a number of countries in Europe, and the recent events in Hong Kong, among others. It is more important than ever for our company to stay nimble and to be able to respond to changing conditions across markets globally. This implies a continued emphasis on our decentralized management structure. I take this opportunity to extend a warm welcome to Fabio Rugarli who rejoined the Group as President of Europe, and to thank our CEO Kyle, along with our corporate, regional and country management teams. They have led the worldwide Samsonite community, encompassing both our own people and our many business partners, in navigating the current headwinds, and I am confident that with the passion and focus of our community, and the resilience of our business, Samsonite is well positioned for long term growth and success.
Timothy Charles ParkerChairmanAugust 21, 2019
我們其中一項首要任務是維持強大的經營活動現金流量。經營活動所得現金達 113.0百萬美元 (7),為去年同期的兩倍,主要是由於營運資金管理改善所致。2019年6月30日,淨營運資金效益 (8)為銷售淨額的14.8%,較去年同期稍為遜色(2018年6月30日為14.0%),但較2019年3月31日淨營運資金效益按年上升220個基點則有所改善,管理團隊將繼續專注於改善至目標水平。此外,減慢開設新店導致資本支出減少15.1百萬美元,因此2019年上半年投資活動所用現金按年減少17.4百萬美元。因此,本集團於2019年6月30日的淨債務為1,432.8百萬美元 (9),較去年同日減少155.6百萬美元。隨著本集團淨債務狀況的改善,本集團2019年上半年的備考淨槓桿比率 (10)為2.60:1.00,與2018年同期的2.57:1.00相比維持平穩。
短期前景顯然喜憂參半。一方面,我們的銷售額顯示出穩定的跡象。在中國及拉丁美洲市場表現好轉、歐洲及主要亞洲市場(包括日本及印度)持續增長的推動下,銷售額於 2019年第二季度下降0.7%(1),而2019年第一季度跌幅為2.4%(1)。於2019年第二季度,儘管B2B市場持續疲弱,中國銷售淨額仍按年增長 5.1%(1)(撇除B2B,中國銷售淨額錄得11.2%(1)增長),較2019年第一季度銷售淨額下跌8.3%(1)(撇除B2B則增長5.9%(1))大幅改善。拉丁美洲於2019年第二季度的銷售淨額大幅增長12.5%(1),2019年第一季度則下跌2.8%(1)。
另一方面,近期事件(包括中美貿易緊張局勢升溫、英國「無協議」脫歐及歐洲若干國家經濟增長放緩的可能性增加以及香港近期狀況等)預示下半年將更加不穩定。本公司最為重要的是保持敏銳,能及時應對不斷變化的全球市況。這意味著我們將重點維持權力下放的管理架構。本人藉此機會熱烈歡迎Fabio Rugarli重新加入本集團擔任歐洲區總裁,並向行政總裁Kyle以及我們的企業、地區及國家管理團隊致謝。彼等領導全球新秀麗群體(包括我們本身的員工及眾多業務夥伴)於當前的不利局面下保持前行,本人相信憑藉我們群體的熱情及專注以及業務的韌性,新秀麗可實現長遠增長及成功。
14
SAM005_IR.indb 14 9/9/2019 17:26

Notes 註釋 (1) Results stated on a constant currency basis, a non-IFRS measure, are calculated by applying the average exchange rate of the comparable period in the previous year to
current period local currency results. 按不變匯率基準計算呈列的業績為非《國際財務報告準則》(「IFRS」)財務計量工具,是以當地貨幣呈列的本期間業績採用去年同期的平均匯率計算所得。(2) Adjusted earnings before interest, taxes, depreciation and amortization (“Adjusted EBITDA”), a non-IFRS measure, eliminates the effect of a number of costs, charges and credits and
certain other non-cash charges. Adjusted EBITDA includes the lease interest and amortization expense as a result of the Group’s adoption of IFRS 16, Leases (“IFRS 16”) on January 1, 2019. The inclusion of IFRS 16 lease interest and amortization expense in Adjusted EBITDA allows this non-IFRS measure to be more comparable with the previous period’s Adjusted EBITDA disclosure. The Group believes Adjusted EBITDA is useful in gaining a more complete understanding of its operational performance and the underlying trends of its business.
未計利息、稅項、折舊及攤銷前的經調整盈利(「經調整EBITDA」)為非 IFRS財務計量工具,其撇除多項成本、費用及貸項以及若干其他非現金費用的影響。由於本集團於2019年1月1日採納 IFRS第16號租賃(「IFRS第16號」),因此經調整EBITDA計入租賃利息及攤銷開支。將 IFRS第16號的租賃利息及攤銷開支計入經調整EBITDA,令此非IFRS財務計量工具與過往期間所披露的經調整EBITDA更具可比較性。本集團相信經調整EBITDA有利於更全面了解其經營表現及其業務的相關趨勢。
(3) Adjusted EBITDA margin, a non-IFRS measure, is calculated by dividing Adjusted EBITDA by net sales. 經調整EBITDA利潤率為非 IFRS財務計量工具,以經調整EBITDA除以銷售淨額計算所得。(4) The Group has applied IFRS 16 using the modified retrospective approach and therefore the comparative information for six months ended June 30, 2018 has not been restated
and continues to be reported under International Accounting Standards (“IAS”) 17, Leases (“IAS 17”) and IFRS Interpretations Committee (“IFRIC”) 4, Determining whether an Arrangement Contains a Lease (“IFRIC 4”). The Group has included with respect to the six months ended June 30, 2018 “as adjusted for IFRS 16” financial information to present its financial performance for the six months ended June 30, 2018 on a comparable basis. Such amounts reflect management’s best estimate on its evaluation of the impact and are non-IFRS measures. For further discussion regarding the Group’s adoption of IFRS 16 on January 1, 2019, see note 3(b) Changes in Accounting Policies and note 16 Leases in the Notes to the Consolidated Interim Financial Statements.
本集團以經修訂追溯法應用 IFRS第16號,因此並無重列截至2018年6月30日止六個月的比較數字,並繼續根據《國際會計準則》(「IAS」)第17號租賃(「IAS第17號」)及《IFRS詮釋委員會》(「IFRIC」)第4號釐定安排是否包含租賃(「IFRIC第4號」)呈報。本集團已增加截至2018年6月30日止六個月「就 IFRS第16號作出調整」的財務資料,按可比較基準呈列截至2018年6月30日止六個月的財務表現。該等金額反映管理層對有關影響的評估所得出的最佳估計,並且為非 IFRS財務計量工具。有關本集團於2019年1月1日採納 IFRS第16號的進一步討論,請見「綜合中期財務報表附註」所載附註3(b)「會計政策的變動」及附註16「租賃」。
(5) For the six months ended June 30, 2019, the Group’s• Adjusted EBITDA decreased by US$63.3 million, or 22.9%, to US$213.5 million; and• Adjusted EBITDA margin decreased by 280 basis points year-on-year to 12.2%.
截至2019年6月30日止六個月,本集團• 經調整EBITDA減少63.3百萬美元或22.9%至213.5百萬美元;及• 經調整EBITDA利潤率按年下降280個基點至12.2%。
(6) The direct-to-consumer (“DTC”) distribution channel comprises company-operated retail stores and direct-to-consumer e-commerce. 直接面向消費者(「DTC」)分銷渠道包括自營零售店及直接面向消費者電子商貿。(7) The Group generated US$192.6 million of cash from operating activities during the six months ended June 30, 2019 compared to US$56.2 million for the first half of 2018.
Excluding the impacts from IFRS 16, operating cash flow was US$113.0 million for the first half of 2019, reflecting a US$56.8 million increase from the first half of 2018. 截至2019年6月30日止六個月,本集團經營活動所得現金為192.6百萬美元,而2018年上半年則為56.2百萬美元。撇除 IFRS第16號的影響,2019年上半年的經營現金流量為113.0百萬美元,較2018年上半年增加56.8百萬美元。
(8) Net working capital efficiency is calculated as net working capital (the sum of inventories and trade and other receivables, net less accounts payable) divided by annualized net sales. 淨營運資金效益乃按淨營運資金(存貨以及應收賬款及其他應收款項的總和減去應付賬項)除以年度銷售淨額計算。(9) As of June 30, 2019, the Group had US$489.3 million of cash and cash equivalents and US$1,922.1 million of debt (excluding deferred financing costs of US$14.9 million),
resulting in a net debt position of US$1,432.8 million. 於2019年6月30日,本集團的現金及現金等價物為489.3百萬美元,債務為1,922.1百萬美元(撇除遞延融資成本14.9百萬美元),故淨債務為1,432.8百萬美元。(10) Pro forma total net leverage ratio is calculated as (total loans and borrowings less total unrestricted cash) / last twelve months Adjusted EBITDA. 備考總淨槓桿比率乃按(貸款及借款總額減不受限制現金總額)/過去十二個月經調整EBITDA計算。
15Samsonite International S.A. Interim Report 2019 新秀麗國際有限公司 2019年中期報告
SAM005_IR.indb 15 9/9/2019 17:26

CHIEF EXECUTIVE OFFICER’S STATEMENT行政總裁報告
We are encouraged by our progress in the first half of 2019 as we continued to execute on our strategy to reposition the business for long-term growth and profitability. During the second quarter of 2019, the Group’s overall net sales performance began to show signs of stabilizing, with improved performance in China and Latin America, along with continued growth in Europe, Japan and India.
2019年上半年,我們繼續實施重新定位業務的策略,以實現長期增長及盈利,進展令人鼓舞。於2019年第二季度,伴隨中國及拉丁美洲的表現好轉,歐洲、日本及印度實現持續增長,本集團的整體銷售淨額表現開始出現穩定跡象。
Kyle Francis Gendreau Chief Executive Officer 行政總裁
We are encouraged by our progress in the first half of 2019 as we continued to execute on our strategy to reposition the business for long term-growth and profitability. At the same time, we remain focused on navigating the macro-economic headwinds impacting our performance in certain markets, including the United States (“U.S.”), which was affected by increased tariffs on products sourced from China and lower foreign tourist traffic, China’s business-to-business (“B2B”) market, South Korea and Chile.
Excluding those four markets, the Group continued to achieve steady growth in Europe and key Asian markets including Japan and India. For the six months ended June 30, 2019, the Group achieved constant currency net sales gains in all regions except North America (-5.7%(1)): Asia (+0.2%(1); +4.6%(1) excluding B2B net sales in China and net sales in South Korea), Europe (+1.9%(1)) and Latin America (+3.4%(1); +11.9%(1) excluding Chile). Overall, the Group’s first half 2019 net sales decreased by 1.5%(1) year-on-year against a strong first half in 2018. Excluding the four challenged markets, the Group’s net sales grew by 3.5%(1) during the first six months of 2019.
2019年上半年,我們繼續實施重新定位業務的策略,以實現長期增長及盈利,進展令人鼓舞。同時,我們繼續專注應對影響我們若干市場(包括美國(受到對自中國進口的產品加徵關稅及外國遊客流量減少影響)、中國的企業對企業(「B2B」)市場、南韓及智利)表現的宏觀經濟不景氣局面。
撇除該等四個市場,本集團持續於歐洲及主要亞洲市場(包括日本及印度)實現穩定增長。截至 2019年 6月 30日止六個月,除北美洲(銷售淨額減少5.7%(1))外,本集團於其他所有地區按不變匯率基準計算的銷售淨額均實現增長:亞洲(增長0.2%(1);撇除中國的B2B銷售淨額及南韓的銷售淨額則增長 4.6%(1))、歐洲(增長 1.9%(1))及拉丁美洲(增長3.4%(1);撇除智利則增長11.9%(1))。整體而言,本集團於2019年上半年的銷售淨額按年減少1.5%(1),而2018年上半年表現強勁。撇除上述四個面對挑戰的市場,本集團的銷售淨額於2019年首六個月增長3.5%(1)。
16
SAM005_IR.indb 16 9/9/2019 17:26

During the second quarter of 2019, the Group’s overall net sales performance began to show signs of stabilizing, with improved performance in China and Latin America, along with continued growth in Europe, Japan and India. Even though B2B sales in China remained slow and the Group has been managing down the mix of sales from this channel, net sales in China increased by 5.1%(1) year-on-year (or +11.2%(1) excluding B2B), up from the 8.3%(1) net sales decrease (+5.9%(1) excluding B2B) recorded during the first quarter of 2019. Latin America had a strong second quarter, with net sales growth of 12.5%(1) compared to a decrease of 2.8%(1) in the first quarter of 2019. Overall, the Group’s net sales decreased by 0.7%(1) during the second quarter of 2019, an improvement compared to the 2.4%(1) decline recorded in the first quarter of 2019.
As we navigate the business through the current macro-economic headwinds, we are focused on managing our cost base to position Samsonite for future growth. The Group’s profitability was adversely affected by the combination of lower net sales and increased distribution expenses related to the expansion in bricks-and-mortar retail during 2017 and 2018, particularly in Europe. We responded with focused actions to tighten expense and working capital controls in the second half of 2018, and accelerated these initiatives during the first half of 2019, including making leadership changes in both Europe and South Korea. We saw the benefits of these ongoing efforts to enhance margins begin to emerge in the second quarter of 2019, and are pushing to accelerate our repositioning of the business for sustained growth and improved profitability going forward.
Beginning in the second half of 2018, we slowed the pace of new store openings, particularly in Europe, to moderate the growth in distribution expenses, and continued to do so in the first half of 2019. We also performed a comprehensive review of the Group’s retail store portfolio during the second quarter of 2019, evaluating the closure of unprofitable stores where we saw limited future potential and where we will attempt to negotiate acceptable exit terms, while continuing to focus on enhancing profitability across the rest of our store network. In Europe, the Group added 13 net new stores in the first half of 2019 versus 28 in the first half of 2018, and, under the leadership of our new regional president, reorganized the retail management team to enhance operational efficiency. On a consolidated basis, the Group added 27 net new company-operated retail stores during the first half of 2019, compared to the 84 added in 2018 (of which 52 were added during the first half of 2018 and 32 during the second half). The year-on-year increase in distribution expenses began to moderate as the pace of retail expansion slowed and profit improvement initiatives began to take effect.
The Group spent US$103.1 million on marketing during the six months ended June 30, 2019 compared to US$114.3 million for the same period in 2018, a decrease of 9.8%. As a percentage of net sales, marketing expenses decreased by 30 basis points to 5.9% for the first half of 2019 from 6.2% for the same period in 2018 (advertising spent in the first half of 2018 was higher due to the timing of the American Tourister global marketing campaign).
For the six months ended June 30, 2019, the Group’s reported operating profit and reported profit attributable to the equity holders were also negatively impacted by non-cash impairment charges of US$29.7 million(2) related to lease right-of-use assets(3) and store fixed assets associated with unprofitable retail locations, and also by costs of US$9.8 million related to the implementation of profit improvement initiatives. Excluding these charges, operating profit fell by 21.5% during the first half of 2019 compared to same period in the previous year
於 2019年第二季度,伴隨中國及拉丁美洲的表現好轉,歐洲、日本及印度實現持續增長,本集團的整體銷售淨額表現開始出現穩定跡象。儘管中國的B2B市場持續疲弱加上本集團減低該渠道於銷售的佔比,中國的銷售淨額仍按年增長5.1%(1)(撇除B2B則增長11.2%(1)),較2019年第一季度錄得銷售淨額減少8.3%(1)(撇除B2B則增長5.9%(1))好轉。拉丁美洲於第二季度銷售淨額強勁增長12.5%(1),而2019年第一季度則減少2.8%(1)。整體而言,本集團於2019年第二季度的銷售淨額按年減少0.7%(1),較2019年第一季度錄得銷售淨額減少2.4%(1)好轉。
在應對我們業務目前所面臨宏觀經濟不景氣挑戰的同時,我們專注管理成本,為新秀麗的未來發展打好基礎。本集團的盈利能力受到我們銷售淨額下降,以及於2017年及2018年擴張實體零售(尤其在歐洲)導致分銷開支增加的不利影響。為應對該問題,2018年下半年我們已專注於加強對開支及營運資金的管控,且於 2019年上半年加快實施該等措施,包括於歐洲及南韓更換領導層。上述改善利潤率的措施已於2019年第二季度初見成效,目前正推動加快業務的重新定位,實現持續增長及提高未來盈利能力。
我們於2018年下半年開始放慢開設新店的步伐(尤其是在歐洲)以減緩分銷開支的增長,並於2019年上半年繼續實行該措施。我們亦於2019年第二季度就本集團的零售店組合進行全面審查,評估關閉我們認為未來潛力有限同時擬協商可接受退租條款的不盈利店舖,並繼續專注於改善我們其餘店舖網絡的盈利能力。於2019年上半年,在我們新的地區總裁的帶領下,本集團在歐洲淨增設13家新店(2018年上半年為28家),並重組零售管理團隊以提高經營效率。綜合而言,本集團於2019年上半年淨增設27家新自營零售店,而2018年則增設84家(其中52家於2018年上半年增設,32家於下半年增設)。隨著零售擴張步伐減慢及改善溢利的措施開始生效,分銷開支按年增長開始放緩。
截至2019年6月30日止六個月,本集團的營銷開支為103.1百萬美元,較2018年同期的114.3百萬美元減少 9.8%。2019年上半年的營銷開支佔銷售淨額百分比由2018年同期的6.2%,減少30個基點至5.9%(2018年上半年廣告開支較高是由於American Tourister全球營銷活動時間所致)。
截至2019年6月30日止六個月,本集團所呈報的經營溢利及所呈報的股權持有人應佔溢利亦受到非現金減值費用29.7百萬美元 (2)(包含不盈利零售點的相關租賃使用權資產 (3)減值及店舖固定資產減值)以及實施改善溢利措施所產生的成本9.8百萬美元的不利影響。撇除該等費用,2019年上半年,本集團經營溢利較去年同期減少21.5%(就 IFRS第16號的影響
17Samsonite International S.A. Interim Report 2019 新秀麗國際有限公司 2019年中期報告
SAM005_IR.indb 17 9/9/2019 17:26

We remain focused on increasing our bricks-and-mortar retail profitability while continuing targeted retail expansion at a slower pace, maintaining tight control on non-advertising SG&A expenses, and continuing to improve net working capital efficiency by bringing inventory turnover days back in line with prior years.
我們繼續專注於包括提高實體零售的盈利能力,同時針對性地但以較慢的步伐繼續擴充零售,保持對非廣告的銷售和一般及管理 (SG&A)費用開支的嚴格管控,及通過調整存貨週轉日數至與往年相若,以繼續改善淨營運資金效益。
(as recast to adjust for IFRS 16 impacts)(4), (5). The Group’s profit attributable to the equity holders for the six months ended June 30, 2019 decreased by 13.9%(4), (6) year-on-year, excluding these non-cash charges in the first half of 2019 and the non-cash charge of US$53.3 million and the related tax impact related to the refinancing of the Group’s original senior credit facilities in the first half of 2018.
The Group’s Adjusted EBITDA(7) and Adjusted Net Income(8), two key performance indicators that eliminate the effect of such non-operational charges and credits to provide a clearer picture of underlying performance, both showed signs of improvement. Second quarter 2019 Adjusted EBITDA decreased by 13.0% compared to the same period in 2018 (as recast to adjust for IFRS 16 impacts)(4), a considerable improvement following the 27.6%(4) year-on-year decline recorded in the first quarter of 2019. As a result, the Group’s Adjusted EBITDA margin(9) decreased by 150 basis points(4) to 13.9% for the second quarter in 2019 versus 15.4% for the same period in 2018(4), a significant improvement compared to the 300 basis points(4) decline recorded in the first quarter. The Group expects its profit enhancement initiatives will continue to yield benefits going into the second half of 2019 and into 2020. Overall, the Group’s first half 2019 Adjusted EBITDA decreased by 19.4%(4) year-on-year, and its Adjusted EBITDA margin was 12.2% for the first half of 2019, a decline of 210 basis points(4) compared to the first half of 2018(4), (10).
For the six months ended June 30, 2019, the Group’s Adjusted Net Income decreased by US$14.2 million to US$97.0 million from US$111.2 million for the same period in 2018 (as recast to adjust for IFRS 16 impacts)(4), (10). This represents a decrease of 12.8%(4) year-on-year and an improvement compared to the 40.3%(4) year-on-year decline in Adjusted Net Income recorded for the first quarter of 2019.
Our disciplined approach to working capital management, cash flow generation and deleveraging the balance sheet has begun to deliver positive results.
作出調整)(4)、(5)。撇除2019年上半年該等非現金費用及2018年上半年本集團的原優先信貸融通再融資的非現金費用53.3百萬美元及相關稅務影響,本集團截至2019年6月30日止六個月的股權持有人應佔溢利按年減少13.9%(4)、(6)。
本集團的兩個主要表現指標經調整EBITDA(7)及經調整淨收入 (8)(撇除該等非經營費用及貸項的影響以更清晰地呈現相關表現)均出現好轉跡象。本集團2019年第二季度的經調整 EBITDA較 2018年同期減少13.0%(就 IFRS第16號的影響作出調整)(4),與2019年第一季度按年減少27.6%(4)相比好轉。因此,2019年第二季度本集團的經調整EBITDA利潤率 (9)較2018年同期 (4)的15.4%下降150個基點 (4)至13.9%,與第一季度下降300個基點 (4)相比好轉。本集團預期改善溢利的措施將於2019年下半年以及2020年繼續產生效益。整體而言,本集團2019年上半年的經調整EBITDA按年減少19.4%(4),經調整EBITDA利潤率為12.2%,較2018年上半年 (4)、(10)下降210個基點 (4)。
截至2019年6月30日止六個月,本集團的經調整淨收入由2018年同期的111.2百萬美元減少14.2百萬美元至97.0百萬美元(就 IFRS第16號的影響作出調整)(4)、(10),按年減少12.8%(4),惟與2019年第一季度經調整淨收入按年下跌40.3%(4)相比則有所改善。
我們以嚴謹的態度執行營運資金管理、產生現金流量及為資產負債表去除槓桿已初見成效。
2019年上半年,經營活動所得現金達 113.0百萬 美元 (11),為去年同期的兩倍,主要由於營運資金管理有所改善:存貨變動的現金流出減少52.9百萬美元(由2018年上半年的56.4百萬美元減至2019年上半年的3.5百萬美元),以及應付賬款及其他應付款項變動的現金流出減少22.2百萬美元(由2018年上半年的41.4百萬美元減至2019年上半年的19.2百萬
18
SAM005_IR.indb 18 9/9/2019 17:26

Our cost cutting and profit enhancing initiatives have begun to positively impact our results in the first half of this year, and we expect they will position the business to deliver improved results going into the remainder of 2019 and into 2020.
我們削減成本及增加盈利的措施於今年上半年開始對我們的業績產生有利影響,且預期將於2019年餘下年度及2020年帶動業績改善。
Cash generated from operating activities more than doubled to US$113.0 million(11) in the first half of 2019. The increase was primarily driven by improved working capital management, coming from a US$52.9 million reduction in cash outflows from changes in inventories (from US$56.4 million in the first half of 2018 to US$3.5 million in the first half of 2019), and a US$22.2 million reduction in cash outflows from changes in trade and other payables (from US$41.4 million in the first half of 2018 to US$19.2 million in the first half of 2019). Separately, cash used in investing activities in the first half of 2019 decreased by US$17.4 million year-on-year, driven by a US$15.1 million year-on-year decrease in capital expenditures (from US$41.1 million in the first half of 2018 to US$26.0 million in the first half of 2019) mainly due to fewer new store openings.
As a result, net debt was US$1,432.8 million as of June 30, 2019(12), US$155.6 million lower than the same date a year ago. With this improvement in the Group’s net debt position, the Group’s pro forma net leverage ratio(13) was steady at 2.60:1.00 for the first half of 2019 compared to 2.57:1.00 for the same period in 2018, notwithstanding the decline in Adjusted EBITDA year-on-year. Separately, at June 30, 2019, the Group had US$624.3 million in liquidity available on its revolving credit facility.
The Group’s net working capital balances at June 30, 2019 were more or less consistent with the levels at June 30, 2018. Net working capital efficiency(14) came in at 14.8% of net sales at June 30, 2019, 80 basis points higher than last year (14.0% at June 30, 2018) due to the decrease in net sales year-on-year. This was an improvement from March 31, 2019, when net working capital efficiency was 220 basis points higher year-on-year (16.7% at March 31, 2019 compared to 14.5% at March 31, 2018). The Group continues to focus on improving its net working capital efficiency and returning to target levels.
The global outlook remains uncertain as we enter the second half of 2019, with U.S.-China trade tensions rising, Brexit still unresolved, economic growth slowing in parts of the European Union, the recent events in Hong Kong, and a general increase in political volatility and economic uncertainty impacting consumer sentiment worldwide. Considering these ongoing challenges, we will continue to invest in the business to position ourselves for long-term growth while maintaining our focus on controlling costs, managing working capital, generating cash and strengthening the balance sheet.
In addition to the ongoing efforts to control distribution and general and administrative expenses, we will also focus on maintaining our gross margin, which decreased by 50 basis points year-on-year during the first half of 2019. The decline was due to additional U.S. tariffs on product sourced from China, sales mix, higher raw materials costs in Europe and increased sales promotions in certain markets. We will continue to expand and diversify our sourcing base and to renegotiate pricing with vendors to address the recent U.S. tariff increases while maintaining high quality standards.
We also intend to temporarily reduce advertising spend for the second half of 2019 to help offset the pressure on our profitability caused by current headwinds. We plan to execute this intended reduction in a targeted manner to ensure continued support for our growth initiatives, including the Tumi brand’s further international expansion, our DTC e-commerce growth strategy and planned new product introductions.
美元)。此外,主要由於開設新店數量減少導致資本開支按年減少15.1百萬美元(由2018年上半年的41.1百萬美元減至2019年上半年的26.0百萬美元),2019年上半年投資活動所用現金因而按年減少17.4百萬美元。
故此,於2019年6月30日的淨債務為1,432.8百萬美元 (12),較去年同期減少155.6百萬美元。由於本集團淨債務有所改善,儘管經調整EBITDA按年減少,但本集團 2019年上半年的備考淨槓桿比率 (13)
為2.60:1.00,與2018年同期的2.57:1.00相比維持平穩。此外,於2019年6月30日,本集團循環信貸融通可用流動資金為624.3百萬美元。
本集團2019年6月30日的淨營運資金結餘與2018年6月30日的水平基本一致。由於銷售淨額按年減少,於2019年6月30日,淨營運資金效益 (14)為銷售淨額的14.8%,較去年上升80個基點(2018年6月30日為14.0%)。此淨營運資金效益表現較2019年3月31日有所改善,當時淨營運資金效益按年上升220個基點(2019年3月31日為16.7%,而2018年3月31日為14.5%)。本集團將繼續專注於改善淨營運資金效益並回歸至目標水平。
踏入2019年下半年,伴隨中美貿易緊張、英國脫歐尚未解決、部分歐盟地區經濟增長放緩、香港近期狀況以及政治波動及經濟不明朗因素普遍增加,全球前景繼續不明朗,影響全球消費者情緒。鑑於該等當前的挑戰,我們將持續投資業務,為長期發展做好準備,同時繼續專注於控制成本、管理營運資金、產生現金並強化資產負債表。
除持續控制分銷和一般及行政開支外,我們亦將重點關注維持毛利率。2019年上半年毛利率按年減少50個基點,是由於美國對採購自中國的產品徵收額外關稅、銷售組合、歐洲原材料成本上升及於若干市場增加銷售推廣所致。我們會繼續擴張及豐富採購來源基礎,與供應商重新協商定價,一方面應對近期美國加徵關稅情況,同時維持高品質標準。
我們亦擬於2019年下半年暫時減少廣告開支,以緩解當前不利局面造成的盈利壓力。我們計劃針對性地執行擬定的削減開支措施,以確保繼續支持我們的增長計劃,包括Tumi品牌的進一步國際擴張、我們DTC電子商貿的增長策略及計劃推出的新產品。
19Samsonite International S.A. Interim Report 2019 新秀麗國際有限公司 2019年中期報告
SAM005_IR.indb 19 9/9/2019 17:26
行政總裁 Kyle Francis Gendreau 2019年8月21日
The Tumi brand continued to record solid net sales growth of 4.8%(1) in the first half of 2019, driven by sustained robust growth in Asia (+11.9%(1)) and Europe (+20.4%(1)). The Group will continue investing in expanding the brand’s presence in international markets.
In the first half of 2019, the Group’s DTC(15) e-commerce net sales increased by 23.9%(1), excluding eBags which was affected by the Group’s actions to improve profitability. Overall, DTC e-commerce net sales rose by 6.8%(1) for the six months ended June 30, 2019. We will continue to invest in our DTC e-commerce growth strategy and focus on improving the margins of the eBags business.
Exciting and innovative new products have always been a key driver of our business, and we will continue to make significant investments in product research and development as well as in marketing to drive our brands’ success globally. The Samsonite brand, in particular, has a long and illustrious history as the industry leader in innovation. We launched a number of exciting new products this year already and have a strong new product pipeline planned for the remainder of the year.
We remain focused on executing our cost cutting and profit enhancing initiatives, including increasing our bricks-and-mortar retail profitability while continuing targeted retail expansion at a slower pace, maintaining tight control on non-advertising SG&A expenses, and continuing to improve net working capital efficiency by bringing inventory turnover days back in line with prior years. These initiatives have begun to positively impact our results in the first half of this year, and we expect they will position the business to deliver improved results going into the remainder of 2019 and into 2020.
We published our 2018 Environmental, Social and Governance (“ESG”) Report in July, which outlines how we are managing our operations more efficiently, the work we are doing to introduce more recycled materials into our luggage, how we are seeking to understand our wider carbon footprint so we can begin making targeted interventions to minimize our impact on both people and the planet, as well as how we aim to positively impact our community through charitable programs and support for our people-focused culture. We will continue to weave ESG practices into the fabric of our business, and move steadily towards our goal to be the most sustainable luggage company in the world.
In closing, I would like to take this opportunity to extend a warm welcome to Fabio Rugarli who rejoined the Group as President of Europe in May, and to offer a personal thank you to our Chairman, Tim Parker, and to the Board. Their counsel and support, along with the contribution of our country, regional, brand and corporate teams as well as our business partners, have made Samsonite’s success possible, and I thank you for your dedication. We have a lot to accomplish, and I look forward to working closely with everyone to execute our plan to position Samsonite for long term growth and profitability.
Kyle Francis GendreauChief Executive OfficerAugust 21, 2019
2019年上半年,Tumi品牌銷售淨額持續穩健增長4.8%(1),受惠於亞洲(增長 11.9%(1))與歐洲(增長20.4%(1))的持續強勁增長。本集團將持續投資擴張該品牌於國際市場的業務。
2019年上半年,撇除受本集團提升盈利能力措施影響的eBags,本集團DTC(15)電子商貿銷售淨額增長23.9%(1)。總體而言,截至2019年6月30日止六個月,DTC電子商貿銷售淨額增長6.8%(1)。我們將繼續投資我們的DTC電子商貿增長策略及專注於提高eBags業務的利潤率。
具吸引力的創新新產品一直是企業的關鍵增長動力,我們將繼續對產品研發及營銷推廣進行大額投資,以推動我們品牌於全球的成功。新秀麗品牌作為行業創新領導者,歷史尤為悠久、輝煌。我們於今年推出了諸多具吸引力的新產品,並計劃於餘下年度推出一系列強勁的新產品。
我們繼續專注於削減成本及增加盈利的措施,包括提高實體零售的盈利能力,同時針對性地但以較慢的步伐繼續擴充零售,保持對非廣告的銷售和一般及管理 (SG&A)費用開支的嚴格管控,及通過調整存貨週轉日數至與往年相若,以繼續改善淨營運資金效益。該等措施於今年上半年開始對我們的業績產生有利影響,且預期將於2019年餘下年度及2020年帶動業績改善。
我們於7月刊發2018年環境、社會及管治報告,概述我們如何更有效地管理業務運營,我們為提高使用回收材料於行李箱所做的工作,我們如何致力了解我們更廣泛的碳足跡,讓我們開始實行針對性的措施,以盡量減少我們對人類及地球的影響,以及我們如何致力通過慈善項目造福社群,並支持以人為本的文化。我們會繼續將環境、社會及管治更緊密融入我們的業務,穩步實現我們成為全球最具可持續性發展能力的行李箱公司的目標。
最後,本人謹藉此機會熱切歡迎Fabio Rugarli於5月重新加入本集團擔任歐洲區總裁,並親自對Tim Parker主席以及董事會致以衷心感謝。他們的指導及支持,加上我們各國家、地區、品牌及企業團隊以及業務合作夥伴的貢獻促成了新秀麗的成功,本人謹此感謝各位的貢獻。我們還要實現許多目標,本人期待與各位一同踐行我們的計劃,實現新秀麗的長期發展及盈利。
20
SAM005_IR.indb 20 9/9/2019 17:26

Notes 註釋(1) Results stated on a constant currency basis, a non-IFRS measure, are calculated by applying the average exchange rate of the comparable period in the previous year to
current period local currency results. 按不變匯率基準計算呈列的業績為非《國際財務報告準則》(「IFRS」)財務計量工具,是以當地貨幣呈列的本期間業績採用去年同期的平均匯率計算所得。(2) Based on an evaluation of loss-making stores in the six months ended June 30, 2019 and the anticipated closure of some of these stores due to reduced traffic and under-
performance, the Group determined that the carrying amounts of certain lease right-of-use assets and certain property, plant and equipment as of June 30, 2019 exceeded their respective recoverable amounts. The Group recognized a non-cash impairment charge totaling US$29.7 million for the first half of 2019, recorded in the Group’s consolidated income statements in the line item “Impairment of property, plant and equipment and lease right-of-use assets”. This non-cash impairment charge comprised the write-off of US$21.0 million of lease right-of-use assets associated with such stores that were recently recognized with the adoption of IFRS 16 and US$8.7 million in impairment for property, plant and equipment of such stores (the “Non-cash Impairment Charge”).
基於評估截至2019年6月30日止六個月因顧客流量減少及業績不佳而錄得虧損的店舖及預計關閉部分該等店舖,本集團認為若干物業、廠房及設備和租賃使用權資產於2019年6月30日的賬面值超過各自的可收回金額。本集團確認2019年上半年的非現金減值費用共計29.7百萬美元,入賬至本集團綜合收益表「物業、廠房及設備和租賃使用權資產減值」項目一欄。非現金減值費用29.7百萬美元包括撇銷與該等店舖相關的租賃使用權資產21.0百萬美元(租賃使用權資產因採用 IFRS第16號而於近期確認)及該等店舖的物業、廠房及設備減值8.7百萬美元(「非現金減值費用」)。
(3) On January 1, 2019, the Group adopted IFRS 16, Leases (“IFRS 16”), which had a material impact on the Company’s financial statements. The adoption of IFRS 16 resulted in most of the Group’s leases being recognized on the consolidated statement of financial position. Under the new standard, an asset (the right-to-use the underlying asset) and a financial liability to make minimum contractual payments have been recognized. For further discussion regarding the Group’s adoption of IFRS 16, see note 3(b) Changes in Accounting Policies and note 16 Leases in the Notes to the Consolidated Interim Financial Statements.
本集團於2019年1月1日採納 IFRS第16號租賃(「IFRS第16號」),對本公司的財務報表有重大影響。採納 IFRS第16號令本集團的大部分租賃於綜合財務狀況表確認。根據新準則,資產(使用相關資產的權利)及支付最低合約款項的金融負債已獲確認。有關本集團採納 IFRS第16號的進一步討論,請見「綜合中期財務報表附註」所載附註3(b)「會計政策的變動」及附註16「租賃」。
(4) The Group has applied IFRS 16 using the modified retrospective approach and therefore the comparative information for six months ended June 30, 2018 has not been restated and continues to be reported under International Accounting Standards (“IAS”) 17, Leases (“IAS 17”) and IFRS Interpretations Committee (“IFRIC”) 4, Determining whether an Arrangement Contains a Lease (“IFRIC 4”). The Group has included with respect to the six months ended June 30, 2018 “as adjusted for IFRS 16” financial information to present its financial performance for the six months ended June 30, 2018 on a comparable basis. Such amounts reflect management’s best estimate on its evaluation of the impact and are non-IFRS measures. For further discussion regarding the Group’s adoption of IFRS 16, see note 3(b) Changes in Accounting Policies and note 16 Leases in the Notes to the Consolidated Interim Financial Statements.
本集團以經修訂追溯法應用 IFRS第16號,因此並無重列截至2018年6月30日止六個月的比較數字,並繼續根據《國際會計準則》(「IAS」)第17號租賃(「IAS第17號」)及《IFRS詮釋委員會》(「IFRIC」)第4號釐定安排是否包含租賃(「IFRIC第4號」)呈報。本集團已增加截至2018年6月30日止六個月「就 IFRS第16號作出調整」的財務資料,按可比較基準呈列截至2018年6月30日止六個月的財務表現。該等金額反映管理層對有關影響的評估所得出的最佳估計,並且為非 IFRS財務計量工具。有關本集團採納IFRS第16號的進一步討論,請見「綜合中期財務報表附註」所載附註3(b)「會計政策的變動」及附註16「租賃」。
(5) Operating profit for the six months ended June 30, 2019 decreased by US$44.7 million, or 21.5%, to US$163.6 million when excluding the Non-cash Impairment Charge and the costs to implement profit improvement initiatives during the six months ended June 30, 2019, compared to US$208.3 million for the same period in the previous year (as recast to adjust for IFRS 16 impacts)(4). Operating profit, as reported, decreased by US$77.8 million, or 38.5%, year-on-year to US$124.0 million.
經撇除截至2019年6月30日止六個月的非現金減值費用及實施溢利改善措施的成本,經營溢利由去年同期的208.3百萬美元減少44.7百萬美元或21.5%至截至2019年6月30日止六個月的163.6百萬美元(就 IFRS第16號的影響作出調整)(4)。所呈報的經營溢利按年減少77.8百萬美元或38.5%至124.0百萬美元。
(6) Profit attributable to the equity holders for the six months ended June 30, 2019 decreased by US$13.8 million, or 13.9%, to US$86.1 million when excluding the Non-cash Impairment Charge and the costs to implement profit improvement initiatives, net of the related tax impact during the six months ended June 30, 2019, compared to US$99.9 million for the six months ended June 30, 2018 (as recast to adjust for IFRS 16 impacts)(4) when excluding the non-cash charge of US$53.3 million and the related tax impact during the six months ended June 30, 2018 to write-off the deferred financing costs related to the refinancing of the Group’s original senior credit facilities in the first half of 2018. Profit attributable to the equity holders, as reported, decreased by US$18.7 million, or 27.5%, from the same period in the previous year to US$49.1 million.
經撇除截至2019年6月30日止六個月的非現金減值費用及實施溢利改善措施的成本及相關稅務影響,股權持有人應佔溢利由截至2018年6月30日止六個月的99.9百萬美元(撇除截至2018年6月30日止六個月於2018年上半年於再融資同時撇銷與本集團原優先信貸融通相關的遞延融資成本的非現金費用53.3百萬美元及相關稅務影響)減少13.8百萬美元或13.9%至截至2019年6月30日止六個月的86.1百萬美元(就 IFRS第16號的影響作出調整)(4)。所呈報的股權持有人應佔溢利較去年同期減少18.7百萬美元或27.5%至49.1百萬美元。
(7) Adjusted earnings before interest, taxes, depreciation and amortization (“Adjusted EBITDA”), a non-IFRS measure, eliminates the effect of a number of costs, charges and credits and certain other non-cash charges. Adjusted EBITDA includes the lease interest and amortization expense as a result of the Group’s adoption of IFRS 16. The inclusion of IFRS 16 lease interest and amortization expense in Adjusted EBITDA allows this non-IFRS measure to be more comparable with the previous period’s Adjusted EBITDA disclosure. The Group believes Adjusted EBITDA is useful in gaining a more complete understanding of its operational performance and the underlying trends of its business.
未計利息、稅項、折舊及攤銷前的經調整盈利(「經調整EBITDA」)為非 IFRS財務計量工具,其撇除多項成本、費用及貸項以及若干其他非現金費用的影響。由於本集團採納 IFRS第16號,因此經調整EBITDA計入租賃利息及攤銷開支。將 IFRS第16號的租賃利息及攤銷開支計入經調整EBITDA,令此非 IFRS財務計量工具與過往期間所披露的經調整EBITDA更具可比較性。本集團相信經調整EBITDA有利於更全面了解其經營表現及其業務的相關趨勢。
(8) Adjusted Net Income, a non-IFRS measure, eliminates the effect of a number of costs, charges and credits and certain other non-cash charges, along with their respective tax effects, that impact the Group’s reported profit for the period, which the Group believes helps to give securities analysts, investors and other interested parties a better understanding of the Group’s underlying financial performance.
經調整淨收入為非 IFRS財務計量工具,撇除影響本集團所呈報的期內溢利的多項成本、費用及貸項以及若干其他非現金費用(連同各自稅務影響)的影響,本集團相信其有助證券分析員、投資者及其他利益相關方更全面了解本集團的相關財務表現。
(9) Adjusted EBITDA margin, a non-IFRS measure, is calculated by dividing Adjusted EBITDA by net sales. 經調整EBITDA利潤率為非 IFRS財務計量工具,以經調整EBITDA除以銷售淨額計算所得。(10) For the six months ended June 30, 2019, the Group’s
• Adjusted Net Income decreased by US$22.7 million, or 19.0%, to US$97.0 million;• Adjusted EBITDA decreased by US$63.3 million, or 22.9%, to US$213.5 million; and• Adjusted EBITDA margin decreased by 280 basis points year-on-year to 12.2%.
截至2019年6月30日止六個月,本集團• 經調整淨收入減少22.7百萬美元或19.0%至97.0百萬美元;• 經調整EBITDA減少63.3百萬美元或22.9%至213.5百萬美元;及• 經調整EBITDA利潤率按年減少280個基點至12.2%。
(11) The Group generated US$192.6 million of cash from operating activities during the six months ended June 30, 2019 compared to US$56.2 million for the same period in the previous year. Excluding the impacts from IFRS 16, operating cash flow was US$113.0 million for the first half of 2019, reflecting a US$56.8 million increase from the first half of 2018.
截至2019年6月30日止六個月,本集團自經營活動產生的現金為192.6百萬美元,而去年同期則為56.2百萬美元。撇除 IFRS第16號的影響,2019年上半年的經營現金流量為113.0百萬美元,較2018年上半年增加56.8百萬美元。
(12) As of June 30, 2019, the Group had US$489.3 million of cash and cash equivalents and US$1,922.1 million of debt (excluding deferred financing costs of US$14.9 million), resulting in a net debt position of US$1,432.8 million.
於2019年6月30日,本集團的現金及現金等價物為489.3百萬美元,債務為1,922.1百萬美元(撇除遞延融資成本14.9百萬美元),故淨債務為1,432.8百萬美元。(13) Pro forma total net leverage ratio is calculated as (total loans and borrowings less total unrestricted cash) / last twelve months Adjusted EBITDA. 備考總淨槓桿比率乃按(貸款及借款總額減不受限制現金總額)/過去十二個月經調整EBITDA計算。(14) Net working capital efficiency is calculated as net working capital (the sum of inventories and trade and other receivables, net less accounts payable) divided by annualized net sales. 淨營運資金效益乃按淨營運資金(存貨以及應收賬款及其他應收款項的總和減去應付賬項)除以年度銷售淨額計算。(15) The direct-to-consumer (“DTC”) distribution channel comprises company-operated retail stores and direct-to-consumer e-commerce. 直接面向消費者(「DTC」)分銷渠道包括自營零售店及直接面向消費者電子商貿。
21Samsonite International S.A. Interim Report 2019 新秀麗國際有限公司 2019年中期報告
SAM005_IR.indb 21 9/9/2019 17:26

Samsonite International S.A. (the “Company”), together with its consolidated subsidiaries (the “Group”), is the world’s largest travel luggage company, with a heritage dating back over 100 years. The Group is principally engaged in the design, manufacture, sourcing and distribution of luggage, business and computer bags, women’s bags, outdoor and casual bags, travel accessories and slim protective cases for personal electronic devices throughout the world, primarily under the Samsonite®, Tumi®, American Tourister®, Speck®, High Sierra®, Gregory®, Lipault®, Kamiliant®, Hartmann® and eBags® brand names as well as other owned and licensed brand names.
The Group sells its products in over 100 countries through a variety of wholesale distribution channels, through its company-operated retail stores and through e-commerce. The Group sells its products in North America, Asia, Europe and Latin America.
Management discussion and analysis should be read in conjunction with the Group’s consolidated interim financial statements, which have been prepared in accordance with International Financial Reporting Standards (“IFRS”) as issued by the International Accounting Standards Board (the “IASB”).
The Company has presented certain non-IFRS measures within Management Discussion and Analysis because each of these measures provides additional information that management believes is useful in gaining a more complete understanding of the Group’s operational performance and of the trends impacting its business to securities analysts, investors and other interested parties. These non-IFRS financial measures, as calculated herein, may not be comparable to similarly named measures used by other companies, and should not be considered comparable to IFRS measures. Non-IFRS measures have limitations as an analytical tool and should not be considered in isolation from, or as a substitute for, an analysis of the Group’s financial results as reported under IFRS.
Net SalesNet sales decreased by US$93.0 million, or 5.0% (-1.5% constant currency), during the six months ended June 30, 2019 compared to the six months ended June 30, 2018. Unfavorable foreign currency conversion had a negative translation
新秀麗國際有限公司(「本公司」,連同其綜合附屬公司統稱為「本集團」)是全球最大的旅行箱公司,擁有逾100年悠久歷史。本集團主要在全球從事設計、製造、採購及分銷行李箱、商務包及電腦包、女士手袋、戶外包及休閒包、旅遊配件以及個人電子設備纖薄保護殼,旗下經營的品牌主要包括新秀麗 ®、Tumi ®、American Tourister ®、Speck ®、High Sierra®、Gregory®、Lipault®、Kamiliant®、Hartmann®及eBags®品牌以及其他自有及獲授權的品牌。
本集團透過各種批發分銷渠道、自營零售店及透過電子商貿在超過100個國家銷售產品。本集團於北美洲、亞洲、歐洲及拉丁美洲銷售其產品。
「管理層討論與分析」應與根據國際會計準則理事會(「IASB」)頒佈的《國際財務報告準則》(「IFRS」)編製的本集團綜合中期財務報表一併閱讀。
本公司於「管理層討論與分析」呈列若干非 IFRS財務計量工具,因上述各財務計量工具能夠提供更多資訊,管理層相信其有利於證券分析員、投資者及其他相關利益團體更全面了解本集團的經營表現及影響其業務的趨勢。本文所計算的此等非 IFRS財務計量工具未必可與其他公司所使用的類似命名的計量工具進行比較,且不應視為可與 IFRS財務計量工具比較。非 IFRS財務計量工具作為一項分析工具有局限性,不應視為獨立於或代替本集團根據 IFRS所呈報的財務業績的分析。
銷售淨額截至 2019年 6月 30日止六個月的銷售淨額較截至2018年6月30日止六個月減少93.0百萬美元或5.0%(按不變匯率基準計算則減少1.5%)。由於外匯換算
MANAGEMENT DISCUSSION AND ANALYSIS管理層討論與分析
22
05_SAM005_IR19_MD&A (1)_AW.indd 22 9/9/2019 17:35

Performance on a constant currency basis by region was as follows:按不變匯率基準計算,按地區劃分的表現如下:
North America 北美洲
Asia 亞洲
Net Sales by Region 按地區劃分的銷售淨額
的不利影響,截至2019年6月30日止六個月所呈報的銷售淨額較截至2018年6月30日止六個月減少約65.2百萬美元。
截至2019年6月30日止六個月,本集團的若干主要市場受到經濟負面因素影響。北美洲方面,美國市場持續受到中國出口至美國的產品關稅上升及到訪遊客人數下跌所影響。中國方面,本集團受到企業對企業(「B2B」)訂單按計劃減少的影響。此外,南韓因地緣政治的緊張局勢導致消費意欲疲弱,持續對本集團的表現產生負面影響。拉丁美洲方面,阿根廷當局放寬入口限制導致阿根廷遊客更多在國內消費,加上當地消費者消費意欲疲弱,令智利消費者人流持續減少,導致本集團於智利的業務持續受到影響。撇除美國、中國B2B、南韓及智利的影響,本集團截至2019年6月30日止六個月的銷售淨額按不變匯率基準計算較去年同期增長3.5%。
儘管這些市場持續不景氣,但本集團業務於2019年第二季度開始穩定。銷售淨額較去年同期減少36.8百萬美元或3.8%(按不變匯率基準計算則減少0.7%),但較2019年第一季度減少56.2百萬美元或6.3%(按不變匯率基準計算則減少2.4%)好轉。撇除美國、中國B2B、南韓及智利的影響,銷售淨額按不變匯率基準計算增長3.6%,而由於外匯換算的負面影響,所呈報的銷售淨額減少5.6百萬美元或1.1%。
下表載列截至2019年6月30日及2018年6月30日止六個月按地區劃分的銷售淨額明細,以絕對值及佔總銷售淨額百分比列賬。
-5.7%North America 北美洲
Europe 歐洲
Latin America 拉丁美洲
Six months ended June 30,截至6月30日止六個月
2019 vs 20182019年與2018年比較2019 2018
Net sales by region(1):按地區劃分的銷售淨額 (1):
US$ millions百萬美元
Percentage of net sales銷售淨額 百分比
US$ millions百萬美元
Percentage of net sales銷售淨額 百分比
Percentage increase
(decrease)增加(減少) 百分比
Percentage increase (decrease) excl. foreign
currency effects(2)
撇除匯兌影響的增加(減少)百分比 (2)
North America 北美洲 654.3 37.3% 695.0 37.6% (5.9)% (5.7)%
Asia 亞洲 643.6 36.7% 668.3 36.2% (3.7)% 0.2%
Europe 歐洲 371.3 21.1% 392.7 21.2% (5.4)% 1.9%
Latin America 拉丁美洲 84.7 4.8% 90.6 4.9% (6.5)% 3.4%
Corporate 企業 1.8 0.1% 2.1 0.1% (13.0)% (13.0)%
Net sales 銷售淨額 1,755.7 100.0% 1,848.7 100.0% (5.0)% (1.5)%
Notes 註釋(1) The geographic location of the Group’s net sales generally reflects the country/territory from which its products were sold and does not necessarily indicate the country/
territory in which its end consumers were actually located. 本集團銷售淨額的地域位置分佈一般反映出售產品的國家/地區,並不一定為終端消費者實際所在的國家/地區。(2) Results stated on a constant currency basis, a non-IFRS measure, are calculated by applying the average exchange rate of the comparable period in the previous year to
current period local currency results. 按不變匯率基準計算呈列的業績為非 IFRS財務計量工具,是以當地貨幣呈列的本期間業績採用去年同期的平均匯率計算所得。
impact on reported net sales of approximately US$65.2 million for the six months ended June 30, 2019 compared to the six months ended June 30, 2018.
During the six months ended June 30, 2019, the Group was challenged by economic headwinds in certain of its key markets. In North America, increased tariffs in the United States (“U.S.”) on products sourced from China and reduced tourist arrivals continued to impact the U.S. market. In China, the Group was impacted by a planned decrease in business-to-business (“B2B”) orders. Weakened consumer sentiment caused by geopolitical tensions in South Korea continued to negatively impact the Group’s performance. In Latin America, the Group’s business in Chile continued to be affected by a decrease in consumer traffic caused by Argentinian tourists purchasing more within their home country as the Argentinian government eased restrictions on imports, as well as by weak domestic consumer sentiment. Excluding the U.S., China B2B, South Korea and Chile, the Group’s net sales increased by 3.5% on a constant currency basis for the six months ended June 30, 2019 compared to the same period in the previous year.
The Group’s business began to stabilize during the second quarter of 2019 notwithstanding the continuing headwinds in these markets. Net sales decreased by US$36.8 million, or 3.8% (-0.7% constant currency), compared to the same period in the previous year, which improved from the US$56.2 million, or 6.3% (-2.4% constant currency) decrease, for the first quarter of 2019. Excluding the U.S., China B2B, South Korea and Chile, net sales increased on a constant currency basis by 3.6%, while reported net sales decreased by US$5.6 million, or 1.1%, due to negative foreign currency translation impacts.
The following table sets forth a breakdown of net sales by region for the six months ended June 30, 2019 and June 30, 2018, both in absolute terms and as a percentage of total net sales.
37%
37%
21%
5%
1H 2019
38%
36%
5%
21%
1H 2018
+0.2%Asia 亞洲
+1.9%Europe 歐洲
+3.4%Latin America 拉丁美洲
23Samsonite International S.A. Interim Report 2019 新秀麗國際有限公司 2019年中期報告
05_SAM005_IR19_MD&A (1)_AW.indd 23 9/9/2019 17:35
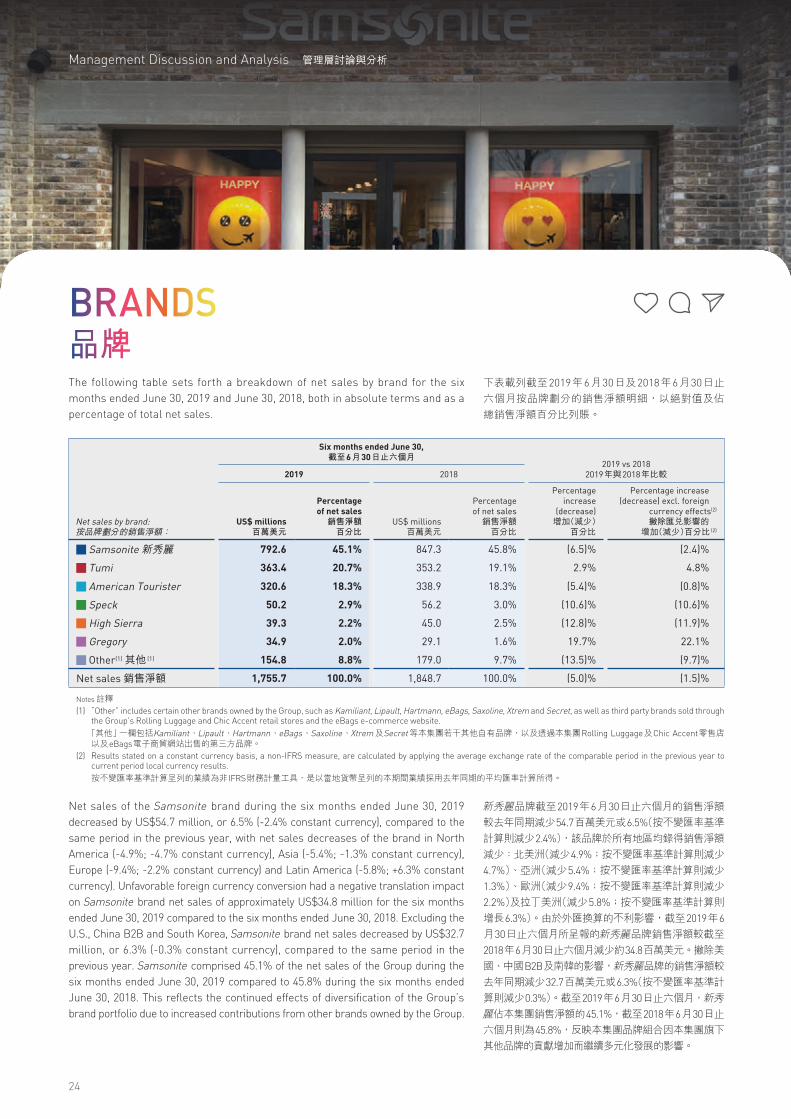
The following table sets forth a breakdown of net sales by brand for the six months ended June 30, 2019 and June 30, 2018, both in absolute terms and as a percentage of total net sales.
BRANDS品牌
Net sales of the Samsonite brand during the six months ended June 30, 2019 decreased by US$54.7 million, or 6.5% (-2.4% constant currency), compared to the same period in the previous year, with net sales decreases of the brand in North America (-4.9%; -4.7% constant currency), Asia (-5.4%; -1.3% constant currency), Europe (-9.4%; -2.2% constant currency) and Latin America (-5.8%; +6.3% constant currency). Unfavorable foreign currency conversion had a negative translation impact on Samsonite brand net sales of approximately US$34.8 million for the six months ended June 30, 2019 compared to the six months ended June 30, 2018. Excluding the U.S., China B2B and South Korea, Samsonite brand net sales decreased by US$32.7 million, or 6.3% (-0.3% constant currency), compared to the same period in the previous year. Samsonite comprised 45.1% of the net sales of the Group during the six months ended June 30, 2019 compared to 45.8% during the six months ended June 30, 2018. This reflects the continued effects of diversification of the Group’s brand portfolio due to increased contributions from other brands owned by the Group.
新秀麗品牌截至2019年6月30日止六個月的銷售淨額較去年同期減少54.7百萬美元或6.5%(按不變匯率基準計算則減少2.4%),該品牌於所有地區均錄得銷售淨額減少:北美洲(減少4.9%;按不變匯率基準計算則減少4.7%)、亞洲(減少5.4%;按不變匯率基準計算則減少1.3%)、歐洲(減少9.4%;按不變匯率基準計算則減少2.2%)及拉丁美洲(減少5.8%;按不變匯率基準計算則增長6.3%)。由於外匯換算的不利影響,截至2019年6月30日止六個月所呈報的新秀麗品牌銷售淨額較截至2018年6月30日止六個月減少約34.8百萬美元。撇除美國、中國B2B及南韓的影響,新秀麗品牌的銷售淨額較去年同期減少32.7百萬美元或6.3%(按不變匯率基準計算則減少0.3%)。截至2019年6月30日止六個月,新秀麗佔本集團銷售淨額的45.1%,截至2018年6月30日止六個月則為45.8%,反映本集團品牌組合因本集團旗下其他品牌的貢獻增加而繼續多元化發展的影響。
Six months ended June 30,截至6月30日止六個月
2019 vs 20182019年與2018年比較2019 2018
Net sales by brand:按品牌劃分的銷售淨額:
US$ millions百萬美元
Percentage of net sales銷售淨額 百分比
US$ millions百萬美元
Percentage of net sales
銷售淨額 百分比
Percentage increase
(decrease)增加(減少)
百分比
Percentage increase (decrease) excl. foreign
currency effects(2)
撇除匯兌影響的增加(減少)百分比 (2)
Samsonite 新秀麗 792.6 45.1% 847.3 45.8% (6.5)% (2.4)%
Tumi 363.4 20.7% 353.2 19.1% 2.9% 4.8%
American Tourister 320.6 18.3% 338.9 18.3% (5.4)% (0.8)%
Speck 50.2 2.9% 56.2 3.0% (10.6)% (10.6)%
High Sierra 39.3 2.2% 45.0 2.5% (12.8)% (11.9)%
Gregory 34.9 2.0% 29.1 1.6% 19.7% 22.1%
Other(1) 其他 (1) 154.8 8.8% 179.0 9.7% (13.5)% (9.7)%
Net sales 銷售淨額 1,755.7 100.0% 1,848.7 100.0% (5.0)% (1.5)%
Notes 註釋(1) “Other” includes certain other brands owned by the Group, such as Kamiliant, Lipault, Hartmann, eBags, Saxoline, Xtrem and Secret, as well as third party brands sold through
the Group’s Rolling Luggage and Chic Accent retail stores and the eBags e-commerce website. 「其他」一欄包括Kamiliant、Lipault、Hartmann、eBags、Saxoline、Xtrem及Secret等本集團若干其他自有品牌,以及透過本集團Rolling Luggage及Chic Accent零售店以及eBags電子商貿網站出售的第三方品牌。
(2) Results stated on a constant currency basis, a non-IFRS measure, are calculated by applying the average exchange rate of the comparable period in the previous year to current period local currency results.
按不變匯率基準計算呈列的業績為非 IFRS財務計量工具,是以當地貨幣呈列的本期間業績採用去年同期的平均匯率計算所得。
下表載列截至2019年6月30日及2018年6月30日止六個月按品牌劃分的銷售淨額明細,以絕對值及佔總銷售淨額百分比列賬。
24
Management Discussion and Analysis 管理層討論與分析
SAM005_IR.indb 24 9/9/2019 17:27

Net sales of the Tumi brand during the six months ended June 30, 2019 increased by US$10.2 million, or 2.9% (+4.8% constant currency), compared to the same period in the previous year. Net sales of the Tumi brand increased by 9.4% (+11.9% constant currency) in Asia, by 12.0% (+20.4% constant currency) in Europe and by 171.5% (+178.2% constant currency) in Latin America as the Group continues to further penetrate international markets. Net sales of the Tumi brand in North America decreased by 3.1% (-2.9% constant currency) due to the Group’s successful efforts to identify and stop sales to trans-shippers who were selling Tumi products to unauthorized distributors in Asia and from reduced tourist traffic in gateway cities. Excluding the effect of the Group’s effort to identify and stop US$2.7 million of sales to customers with higher trans-shipping risk in the U.S. during the six months ended June 30, 2018, Tumi brand net sales in North America decreased by 1.7% (-1.5% constant currency) during the six months ended June 30, 2019 compared to the same period in the previous year due to reduced tourist traffic into the U.S. Excluding North America, Tumi brand net sales increased by US$16.3 million, or 10.6% (+14.9% constant currency).
Net sales of the American Tourister brand decreased by US$18.3 million, or 5.4% (-0.8% constant currency), for the six months ended June 30, 2019 compared to the six months ended June 30, 2018. The year-on-year comparison is affected because the American Tourister brand had a very strong first half in 2018 with constant currency net sales growth of 24.2% year-on-year driven by the major global marketing campaign for the brand during 2018. Excluding the U.S., China B2B and South Korea, American Tourister brand net sales increased on a constant currency basis, but reported net sales decreased by US$1.9 million, or 0.8% (+4.7% constant currency), compared to the same period in the previous year. Net sales of the Speck brand decreased by US$6.0 million, or 10.6% (-10.6% constant currency), for the six months ended June 30, 2019 compared to the same period in the previous year due to retailers managing inventory levels in anticipation of a new device launch. Net sales of the Gregory brand increased by US$5.7 million, or 19.7% (+22.1% constant currency), compared to the same period in the previous year. Net sales of the High Sierra brand decreased by US$5.8 million, or 12.8% (-11.9% constant currency), year-on-year due to reduced replenishment orders and some shift in order timing by retailers in North America.
The decrease in net sales of other brands during the six months ended June 30, 2019 was primarily due to decreased sales of the Kamiliant, Saxoline and Secret brands. During the six months ended June 30, 2019, net sales of the Kamiliant brand, a value-conscious, entry-level brand, decreased by US$3.2 million, or 11.9% (-7.3% constant currency), compared to the same period in the previous year caused by the challenging market conditions and weak consumer sentiment in South Korea. During the six months ended June 30, 2019, net sales of the Saxoline brand decreased by US$2.1 million, or 17.6% (-9.1% constant currency) compared to the same period in the previous year due to decreased consumer traffic in Chile. During the six months ended June 30, 2019, net sales of the eBags brand decreased by US$0.6 million, or 3.0% (-3.0% constant currency), year-on-year.
Net Sales By Brand 按品牌劃分的銷售淨額
Tumi品牌截至2019年6月30日止六個月的銷售淨額較去年同期增加10.2百萬美元或2.9%(按不變匯率基準計算則增長4.8%)。由於本集團繼續拓展國際市場,Tumi品牌於亞洲、歐洲及拉丁美洲的銷售淨額分別增長9.4%、12.0%及171.5%,按不變匯率基準計算則分別增長11.9%、20.4%及178.2%。由於本集團成功識別並終止向平行出口商銷售(該等平行出口商向未經授權的亞洲分銷商銷售Tumi產品)及旅遊目的地城市遊客減少,Tumi品牌於北美洲的銷售淨額減少3.1%(按不變匯率基準計算則減少2.9%)。撇除截至2018年6月30日止六個月本集團於美國識別並終止向高風險平行出口商客戶的2.7百萬美元銷售額的影響,截至2019年6月30日止六個月,Tumi品牌於北美洲的銷售淨額較去年同期減少1.7%(按不變匯率基準計算則減少1.5%),是由於前往美國的遊客數目減少所致。撇除北美洲的影響,Tumi品牌的銷售淨額增長16.3百萬美元或10.6%(按不變匯率基準計算則增長14.9%)。
American Tourister品牌截至2019年6月30日止六個月的銷售淨額較截至2018年6月30日止六個月減少18.3百萬美元或5.4%(按不變匯率基準計算則減少0.8%),是由於受到2018年大型市場營銷活動的推動,American Tourister品牌於2018年上半年表現格外強勁,按不變匯率基準計算的銷售淨額按年增長24.2%。撇除美國、中國B2B及南韓的影響,American Tourister品牌的銷售淨額按不變匯率基準計算有所增長,但所呈報的銷售淨額較去年同期減少1.9百萬美元或0.8%(按不變匯率基準計算則增長4.7%)。由於零售商預期新款式個人電子設備即將推出而控制存貨水平,Speck品牌截至2019年6月30日止六個月的銷售淨額較去年同期減少6.0百萬美元或10.6%(按不變匯率基準計算則減少10.6%)。Gregory品牌的銷售淨額較去年同期增加5.7百萬美元或19.7%(按不變匯率基準計算則增長22.1%)。由於北美洲零售商減少補貨訂單以及部分訂單的時差,High Sierra品牌的銷售淨額按年減少5.8百萬美元或12.8%(按不變匯率基準計算則減少11.9%)。
其他品牌截至2019年6月30日止六個月的銷售淨額主要因Kamiliant、Saxoline及Secret品牌的銷售額下跌而減少。截至2019年6月30日止六個月,南韓市況充滿挑戰且消費意欲疲弱導致高性價比入門品牌Kamiliant品牌的銷售淨額較去年同期減少3.2百萬美元或11.9%(按不變匯率基準計算則減少7.3%)。截至2019年6月30日止六個月,由於智利消費者人流減少,Saxoline品牌的銷售淨額較去年同期減少2.1百萬美元或17.6%(按不變匯率基準計算則減少9.1%)。截至2019年6月30日止六個月,eBags品牌的銷售淨額按年減少0.6百萬美元或3.0%(按不變匯率基準計算則減少3.0%)。
Samsonite 新秀麗
Tumi
American Tourister
Speck
High Sierra
1H 2019
45%
21%
18%
3%
2%2%
9%
1H 2018
46%
19%
18%
3%
2%2%
10%
Gregory
Other 其他
25Samsonite International S.A. Interim Report 2019 新秀麗國際有限公司 2019年中期報告
SAM005_IR.indb 25 9/9/2019 17:27

PRODUCT CATEGORIES產品類別
The Group sells products in two principal product categories: travel and non-travel. The travel category is the Group’s largest category and has been its traditional strength. The following table sets forth a breakdown of net sales by product category for the six months ended June 30, 2019 and June 30, 2018, both in absolute terms and as a percentage of total net sales.
本集團銷售的產品來自兩個主要產品類別:旅遊及非旅遊。旅遊類別為本集團最大產品類別,屬其傳統強項。下表載列截至2019年6月30日及2018年6月30日止六個月按產品類別劃分的銷售淨額明細,以絕對值及佔總銷售淨額百分比列賬。
Travel 旅遊
Business 商務
Casual 休閒
Accessories 配件
Other 其他
Six months ended June 30,截至6月30日止六個月
2019 vs 20182019年與2018年比較2019 2018
Net sales by product category:按產品類別劃分的銷售淨額:
US$ millions百萬美元
Percentage of net sales銷售淨額 百分比
US$ millions百萬美元
Percentage of net sales
銷售淨額 百分比
Percentage increase
(decrease)增加(減少)
百分比
Percentage increase (decrease) excl. foreign
currency effects(2)
撇除匯兌影響的增加(減少)百分比 (2)
Travel 旅遊 1,051.1 59.9% 1,119.1 60.5% (6.1)% (2.5)%
Non-travel(1) 非旅遊(1) 704.7 40.1% 729.6 39.5% (3.4)% 0.0%
Net sales 銷售淨額 1,755.7 100.0% 1,848.7 100.0% (5.0)% (1.5)%
Notes 註釋(1) The non-travel category comprises business, casual, accessories and other products. 非旅遊類別包括商務產品、休閒產品、配件產品及其他產品。(2) Results stated on a constant currency basis, a non-IFRS measure, are calculated by applying the average exchange rate of the comparable period in the previous year to
current period local currency results. 按不變匯率基準計算呈列的業績為非 IFRS財務計量工具,是以當地貨幣呈列的本期間業績採用去年同期的平均匯率計算所得。
26
Management Discussion and Analysis 管理層討論與分析
SAM005_IR.indb 26 9/9/2019 17:27
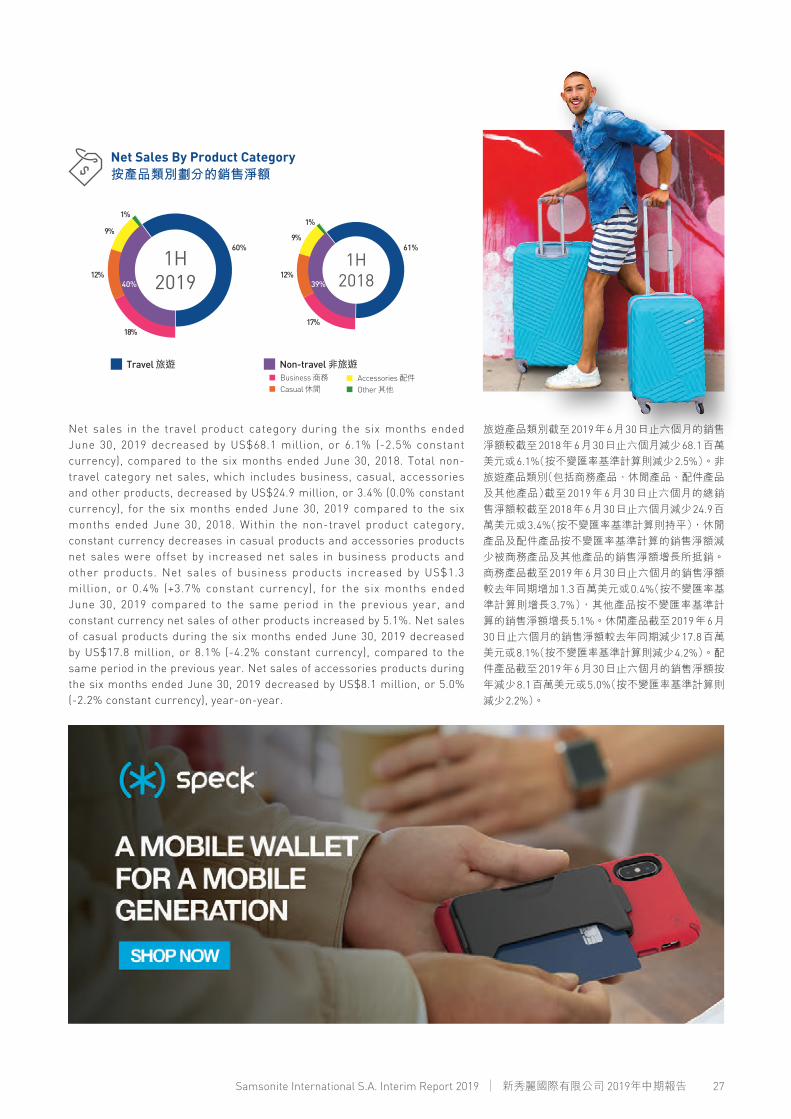
旅遊產品類別截至2019年6月30日止六個月的銷售淨額較截至2018年6月30日止六個月減少68.1百萬美元或6.1%(按不變匯率基準計算則減少2.5%)。非旅遊產品類別(包括商務產品、休閒產品、配件產品及其他產品)截至2019年6月30日止六個月的總銷售淨額較截至2018年6月30日止六個月減少24.9百萬美元或3.4%(按不變匯率基準計算則持平),休閒產品及配件產品按不變匯率基準計算的銷售淨額減少被商務產品及其他產品的銷售淨額增長所抵銷。商務產品截至2019年6月30日止六個月的銷售淨額較去年同期增加1.3百萬美元或0.4%(按不變匯率基準計算則增長3.7%),其他產品按不變匯率基準計算的銷售淨額增長5.1%。休閒產品截至2019年6月30日止六個月的銷售淨額較去年同期減少17.8百萬美元或8.1%(按不變匯率基準計算則減少4.2%)。配件產品截至2019年6月30日止六個月的銷售淨額按年減少8.1百萬美元或5.0%(按不變匯率基準計算則減少2.2%)。
Net sales in the travel product category during the six months ended June 30, 2019 decreased by US$68.1 million, or 6.1% (-2.5% constant currency), compared to the six months ended June 30, 2018. Total non-travel category net sales, which includes business, casual, accessories and other products, decreased by US$24.9 million, or 3.4% (0.0% constant currency), for the six months ended June 30, 2019 compared to the six months ended June 30, 2018. Within the non-travel product category, constant currency decreases in casual products and accessories products net sales were offset by increased net sales in business products and other products. Net sales of business products increased by US$1.3 million, or 0.4% (+3.7% constant currency), for the six months ended June 30, 2019 compared to the same period in the previous year, and constant currency net sales of other products increased by 5.1%. Net sales of casual products during the six months ended June 30, 2019 decreased by US$17.8 million, or 8.1% (-4.2% constant currency), compared to the same period in the previous year. Net sales of accessories products during the six months ended June 30, 2019 decreased by US$8.1 million, or 5.0% (-2.2% constant currency), year-on-year.
Net Sales By Product Category 按產品類別劃分的銷售淨額
1H 201839%
1%
9%
12%
17%
61%
40%
60%
1%
9%
12%
18%
1H 2019
Travel 旅遊 Non-travel 非旅遊 Business 商務 Casual 休閒
Accessories 配件 Other 其他
27Samsonite International S.A. Interim Report 2019 新秀麗國際有限公司 2019年中期報告
SAM005_IR.indb 27 9/9/2019 17:28

The Group sells products through two primary distribution channels: wholesale and direct-to-consumer (“DTC”). The following table sets forth a breakdown of net sales by distribution channel for the six months ended June 30, 2019 and June 30, 2018, both in absolute terms and as a percentage of total net sales.
Net sales in the wholesale channel decreased by US$96.9 million, or 7.9% (-4.4% constant currency), during the six months ended June 30, 2019 compared to the six months ended June 30, 2018, reflecting a negative foreign currency translation impact of US$43.3 million. The decrease in wholesale channel net sales was primarily due to decreases in North America, as uncertainty about the timing and outcome of U.S.-China trade negotiations resulted in greater caution among U.S. retailers, leading them to more closely manage inventory levels and to shift the timing of wholesale orders; in China due to a decline in B2B orders; and in South Korea as a result of continued challenging market conditions. Excluding these challenged markets, wholesale net sales decreased by US$60.1 million, or 8.3% (-0.6% constant currency), compared to the same period in the previous year.
本集團通過兩個主要分銷渠道銷售產品:批發及直接面向消費者(「DTC」)。下表載列截至2019年6月30日及2018年6月30日止六個月按分銷渠道劃分的銷售淨額明細,以絕對值及佔總銷售淨額百分比列賬。
截至2019年6月30日止六個月批發渠道的銷售淨額較截至2018年6月30日止六個月減少96.9百萬美元或7.9%(按不變匯率基準計算則減少4.4%),反映了外匯換算43.3百萬美元的不利影響。批發渠道的銷售淨額減少主要由於中美貿易談判的時間及結果存在不確定性,令美國零售商更趨謹慎,加強控制存貨水平,加上批發訂單的時差,導致北美洲的銷售減少;中國的B2B訂單減少;以及南韓市況持續欠佳所致。撇除該等不景氣市場的影響,批發銷售淨額較去年同期減少60.1百萬美元或8.3%(按不變匯率基準計算則減少0.6%)。
DISTRIBUTION CHANNELS分銷渠道
Six months ended June 30,截至6月30日止六個月
2019 vs 20182019年與2018年比較2019 2018
Net sales by distribution channel:按分銷渠道劃分的銷售淨額:
US$ millions百萬美元
Percentage of net sales銷售淨額 百分比
US$ millions百萬美元
Percentage of net sales
銷售淨額 百分比
Percentage increase
(decrease)增加(減少)
百分比
Percentage increase (decrease) excl. foreign
currency effects(3)
撇除匯兌影響的增加(減少)百分比 (3)
Wholesale 批發 1,129.1 64.3% 1,226.0 66.3% (7.9)% (4.4)%
DTC(1) 624.8 35.6% 620.6 33.6% 0.7% 4.2%
Other(2) 其他 (2) 1.8 0.1% 2.1 0.1% (13.0)% (13.0)%
Net sales 銷售淨額 1,755.7 100.0% 1,848.7 100.0% (5.0)% (1.5)%
Notes 註釋(1) DTC, or direct-to-consumer, includes bricks-and-mortar retail and e-commerce sites owned and operated by the Group. DTC(即直接面向消費者)包括本集團擁有及運營的實體零售和電子商貿網站。(2) “Other” primarily consists of licensing revenue. 「其他」一欄主要包括授權收入。(3) Results stated on a constant currency basis, a non-IFRS measure, are calculated by applying the average exchange rate of the comparable period in the previous year to
current period local currency results. 按不變匯率基準計算呈列的業績為非 IFRS財務計量工具,是以當地貨幣呈列的本期間業績採用去年同期的平均匯率計算所得。
28
Management Discussion and Analysis 管理層討論與分析
SAM005_IR.indb 28 9/9/2019 17:28
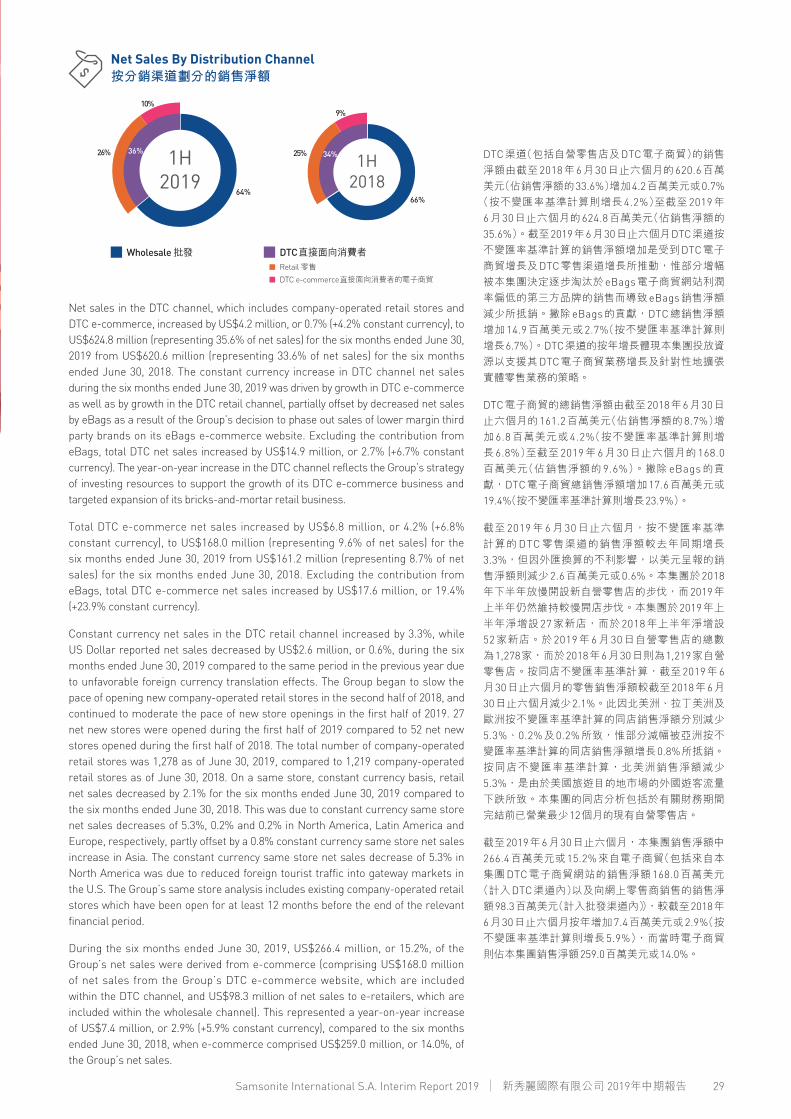
Net sales in the DTC channel, which includes company-operated retail stores and DTC e-commerce, increased by US$4.2 million, or 0.7% (+4.2% constant currency), to US$624.8 million (representing 35.6% of net sales) for the six months ended June 30, 2019 from US$620.6 million (representing 33.6% of net sales) for the six months ended June 30, 2018. The constant currency increase in DTC channel net sales during the six months ended June 30, 2019 was driven by growth in DTC e-commerce as well as by growth in the DTC retail channel, partially offset by decreased net sales by eBags as a result of the Group’s decision to phase out sales of lower margin third party brands on its eBags e-commerce website. Excluding the contribution from eBags, total DTC net sales increased by US$14.9 million, or 2.7% (+6.7% constant currency). The year-on-year increase in the DTC channel reflects the Group’s strategy of investing resources to support the growth of its DTC e-commerce business and targeted expansion of its bricks-and-mortar retail business.
Total DTC e-commerce net sales increased by US$6.8 million, or 4.2% (+6.8% constant currency), to US$168.0 million (representing 9.6% of net sales) for the six months ended June 30, 2019 from US$161.2 million (representing 8.7% of net sales) for the six months ended June 30, 2018. Excluding the contribution from eBags, total DTC e-commerce net sales increased by US$17.6 million, or 19.4% (+23.9% constant currency).
Constant currency net sales in the DTC retail channel increased by 3.3%, while US Dollar reported net sales decreased by US$2.6 million, or 0.6%, during the six months ended June 30, 2019 compared to the same period in the previous year due to unfavorable foreign currency translation effects. The Group began to slow the pace of opening new company-operated retail stores in the second half of 2018, and continued to moderate the pace of new store openings in the first half of 2019. 27 net new stores were opened during the first half of 2019 compared to 52 net new stores opened during the first half of 2018. The total number of company-operated retail stores was 1,278 as of June 30, 2019, compared to 1,219 company-operated retail stores as of June 30, 2018. On a same store, constant currency basis, retail net sales decreased by 2.1% for the six months ended June 30, 2019 compared to the six months ended June 30, 2018. This was due to constant currency same store net sales decreases of 5.3%, 0.2% and 0.2% in North America, Latin America and Europe, respectively, partly offset by a 0.8% constant currency same store net sales increase in Asia. The constant currency same store net sales decrease of 5.3% in North America was due to reduced foreign tourist traffic into gateway markets in the U.S. The Group’s same store analysis includes existing company-operated retail stores which have been open for at least 12 months before the end of the relevant financial period.
During the six months ended June 30, 2019, US$266.4 million, or 15.2%, of the Group’s net sales were derived from e-commerce (comprising US$168.0 million of net sales from the Group’s DTC e-commerce website, which are included within the DTC channel, and US$98.3 million of net sales to e-retailers, which are included within the wholesale channel). This represented a year-on-year increase of US$7.4 million, or 2.9% (+5.9% constant currency), compared to the six months ended June 30, 2018, when e-commerce comprised US$259.0 million, or 14.0%, of the Group’s net sales.
DTC渠道(包括自營零售店及DTC電子商貿)的銷售淨額由截至2018年6月30日止六個月的620.6百萬美元(佔銷售淨額的33.6%)增加4.2百萬美元或0.7%(按不變匯率基準計算則增長4.2%)至截至2019年6月30日止六個月的624.8百萬美元(佔銷售淨額的35.6%)。截至2019年6月30日止六個月DTC渠道按不變匯率基準計算的銷售淨額增加是受到DTC電子商貿增長及DTC零售渠道增長所推動,惟部分增幅被本集團決定逐步淘汰於eBags電子商貿網站利潤率偏低的第三方品牌的銷售而導致eBags銷售淨額減少所抵銷。撇除eBags的貢獻,DTC總銷售淨額增加14.9百萬美元或2.7%(按不變匯率基準計算則增長6.7%)。DTC渠道的按年增長體現本集團投放資源以支援其DTC電子商貿業務增長及針對性地擴張實體零售業務的策略。
DTC電子商貿的總銷售淨額由截至2018年6月30日止六個月的161.2百萬美元(佔銷售淨額的8.7%)增加 6.8百萬美元或 4.2%(按不變匯率基準計算則增長6.8%)至截至2019年6月30日止六個月的168.0百萬美元(佔銷售淨額的 9.6%)。撇除 eBags的貢獻,DTC電子商貿總銷售淨額增加17.6百萬美元或19.4%(按不變匯率基準計算則增長23.9%)。
截至 2019年 6月 30日止六個月,按不變匯率基準計算的DTC零售渠道的銷售淨額較去年同期增長3.3%,但因外匯換算的不利影響,以美元呈報的銷售淨額則減少2.6百萬美元或0.6%。本集團於2018年下半年放慢開設新自營零售店的步伐,而2019年上半年仍然維持較慢開店步伐。本集團於2019年上半年淨增設27家新店,而於2018年上半年淨增設52家新店。於 2019年 6月 30日自營零售店的總數為1,278家,而於2018年6月30日則為1,219家自營零售店。按同店不變匯率基準計算,截至2019年6月30日止六個月的零售銷售淨額較截至2018年6月30日止六個月減少2.1%。此因北美洲、拉丁美洲及歐洲按不變匯率基準計算的同店銷售淨額分別減少5.3%、0.2%及0.2%所致,惟部分減幅被亞洲按不變匯率基準計算的同店銷售淨額增長0.8%所抵銷。按同店不變匯率基準計算,北美洲銷售淨額減少5.3%,是由於美國旅遊目的地市場的外國遊客流量下跌所致。本集團的同店分析包括於有關財務期間完結前已營業最少12個月的現有自營零售店。
截至2019年6月30日止六個月,本集團銷售淨額中266.4百萬美元或15.2%來自電子商貿(包括來自本集團DTC電子商貿網站的銷售淨額168.0百萬美元(計入DTC渠道內)以及向網上零售商銷售的銷售淨額98.3百萬美元(計入批發渠道內)),較截至2018年6月30日止六個月按年增加7.4百萬美元或2.9%(按不變匯率基準計算則增長5.9%),而當時電子商貿則佔本集團銷售淨額259.0百萬美元或14.0%。
Net Sales By Distribution Channel 按分銷渠道劃分的銷售淨額
64%
10%
26% 1H 2019
36%
1H 2018
34%
9%
25%
66%
Wholesale 批發 DTC直接面向消費者 Retail 零售 DTC e-commerce直接面向消費者的電子商貿
29Samsonite International S.A. Interim Report 2019 新秀麗國際有限公司 2019年中期報告
SAM005_IR.indb 29 9/9/2019 17:28

BrandsFor the six months ended June 30, 2019, net sales of the Samsonite brand in North America decreased by US$13.6 million, or 4.9% (-4.7% constant currency), compared to the same period in the previous year. The decrease was caused by uncertainty about the timing and outcome of U.S.-China trade negotiations, which resulted in greater caution among U.S. retailers, leading them to more closely manage inventory levels and to a shift in the timing of wholesale orders. Lower retail sales in gateway markets in the U.S. generally driven by reduced foreign tourist traffic also contributed to the decrease. Net sales of the Tumi brand during the six months ended June 30, 2019 decreased by US$6.1 million, or 3.1% (-2.9% constant currency) due to the Group’s successful efforts to identify and stop sales to trans-shippers who were selling Tumi products to unauthorized distributors in Asia and from reduced tourist
品牌新秀麗品牌截至2019年6月30日止六個月的北美洲銷售淨額較去年同期減少13.6百萬美元或4.9%(按不變匯率基準計算則減少4.7%),是由於中美貿易談判的時間及結果存在不確定性,令美國零售商更趨謹慎,加強控制存貨水平及批發訂單的時差,亦由於美國旅遊目的地市場的零售銷售額因外國遊客流量下跌而減少所致。由於本集團成功識別並終止向平行出口商銷售(該等平行出口商向未經授權的亞洲分銷商銷售Tumi產品)以及旅遊目的地城市遊客流量減少,Tumi品牌截至2019年6月30日止六個月的銷售淨額減少6.1百萬美元或3.1%(按不變匯率基準計算則減少2.9%)。撇除截至2018年6月30日止
North America 北美洲The Group’s net sales in North America decreased by US$40.7 million, or 5.9% (-5.7% constant currency), for the six months ended June 30, 2019 compared to the six months ended June 30, 2018. Increased tariffs in the U.S. on products sourced from China and reduced tourist arrivals continued to impact the U.S. market. The Group estimates that consumer traffic in its U.S. gateway city stores declined by 15% to 20% in the first half of 2019 from the same period in the previous year.
本集團截至2019年6月30日止六個月在北美洲的銷售淨額較截至2018年6月30日止六個月減少40.7百萬美元或5.9%(按不變匯率基準計算則減少5.7%)。美國對來自中國的產品加徵關稅及到訪遊客人數減少持續影響美國市場。本集團估計2019年上半年美國旅遊目的地城市店舖的消費者人流較去年同期減少15%至20%。
US$695.0(1) Excluding foreign currency effects. 撇除匯兌影響。
-5.7%(1)
North America Net Sales (US$m)
北美洲銷售淨額(百萬美元)
US$654.320192018
REGIONS 地區
30
Management Discussion and Analysis 管理層討論與分析
SAM005_IR.indb 30 9/9/2019 17:28
traffic in gateway cities. Excluding the effect of the Group’s effort to identify and stop US$2.7 million of sales to customers with higher trans-shipping risk in the U.S. during the six months ended June 30, 2018, Tumi brand net sales decreased by US$3.4 million, or 1.7% (-1.5% constant currency), for the six months ended June 30, 2019 compared to the same period in the previous year.
Net sales of the American Tourister brand during the six months ended June 30, 2019 increased by US$1.0 million, or 2.3% (+2.5% constant currency), compared to the six months ended June 30, 2018. The first half of 2018 was particularly strong for the brand with constant currency net sales growth of 12.0% over the prior year. Net sales of the Speck brand for the six months ended June 30, 2019 decreased by US$6.0 million, or 10.6% (-10.6% constant currency), compared to the same period in the previous year as retailers managed inventory levels in anticipation of a new device launch. Net sales of the High Sierra brand for the six months ended June 30, 2019 decreased by US$4.4 million, or 12.3% (-12.2% constant currency), compared to the same period in the previous year due to retailers managing inventory levels.
Product CategoriesNet sales in the travel product category in North America decreased by US$20.5 million, or 5.1% (-4.9% constant currency), for the six months ended June 30, 2019 compared to the six months ended June 30, 2018. Total non-travel category net sales in North America decreased by US$20.2 million, or 6.9% (-6.8% constant currency), to US$271.6 million (representing 41.5% of North America’s net sales) for the six months ended June 30, 2019 from US$291.8 million (representing 42.0% of North America’s net sales) for the six months ended June 30, 2018. Net sales of business products during the six months ended June 30, 2019 decreased by US$4.8 million, or 4.0% (-3.9% constant currency), compared to the same period in the previous year. Net sales of casual products decreased by US$10.1 million, or 12.7% (-12.7% constant currency), year-on-year. Net sales of accessories products decreased by US$5.2 million, or 5.7% (-5.6% constant currency), year-on-year due to decreased sales of the Speck brand.
六個月本集團於美國識別並終止向高風險平行出口商客戶的2.7百萬美元銷售額的影響,截至2019年6月30日止六個月,Tumi品牌的銷售淨額較去年同期減少3.4百萬美元或1.7%(按不變匯率基準計算則減少1.5%)。
American Tourister品牌截至2019年6月30日止六個月的銷售淨額較截至2018年6月30日止六個月增加1.0百萬美元或2.3%(按不變匯率基準計算則增長2.5%)。該品牌於2018年上半年表現格外強勁(按不變匯率基準計算的銷售淨額較去年增長12.0%)。由於零售商預期新款式個人電子設備即將推出而控制存貨水平,Speck品牌截至2019年6月30日止六個月的銷售淨額較去年同期減少6.0百萬美元或10.6%(按不變匯率基準計算則減少10.6%)。由於零售商控制存貨水平,High Sierra品牌截至2019年6月30日止六個月的銷售淨額較去年同期減少4.4百萬美元或12.3%(按不變匯率基準計算則減少12.2%)。
產品類別旅遊產品類別截至2019年6月30日止六個月的北美洲銷售淨額較2018年6月30日止六個月減少20.5百萬美元或5.1%(按不變匯率基準計算則減少4.9%)。非旅遊產品類別的北美洲總銷售淨額由截至2018年6月30日止六個月的291.8百萬美元(佔北美洲銷售淨額的42.0%)減少20.2百萬美元或6.9%(按不變匯率基準計算則減少6.8%)至截至2019年6月30日止六個月的271.6百萬美元(佔北美洲銷售淨額的41.5%)。商務產品截至2019年6月30日止六個月的銷售淨額較去年同期減少4.8百萬美元或4.0%(按不變匯率基準計算則減少3.9%)。休閒產品的銷售淨額按年減少10.1百萬美元或12.7%(按不變匯率基準計算則減少12.7%)。由於Speck品牌銷量減少,配件產品的銷售淨額按年減少5.2百萬美元或5.7%(按不變匯率基準計算則減少5.6%)。
31Samsonite International S.A. Interim Report 2019 新秀麗國際有限公司 2019年中期報告
SAM005_IR.indb 31 9/9/2019 17:28

Distribution ChannelsNet sales in the wholesale channel in North America decreased by US$29.8 million, or 7.5% (-7.3% constant currency), for the six months ended June 30, 2019 compared to the six months ended June 30, 2018, as uncertainty about the timing and outcome of U.S.-China trade negotiations resulted in greater caution among U.S. retailers, leading them to more closely manage inventory levels and to shift the timing of wholesale orders.
Net sales in the DTC channel, which includes company-operated retail stores and DTC e-commerce, decreased by US$11.0 million, or 3.7% (-3.5% constant currency), year-on-year to US$286.4 million. The decrease in DTC channel net sales during the six months ended June 30, 2019 was primarily due to decreased net sales by eBags driven by the Group’s decision to phase out sales of certain lower margin third party brands on its eBags e-commerce website. Excluding the contribution from eBags, total DTC net sales decreased by US$0.2 million, or 0.1% (+0.1% constant currency).
Total DTC e-commerce net sales decreased by US$3.0 million, or 2.8% (-2.7% constant currency), to US$105.1 million during the six months ended June 30, 2019. This net sales decrease in DTC e-commerce was primarily the result of decreased net sales by eBags. Excluding the contribution from eBags, total DTC e-commerce net sales increased by US$7.7 million, or 20.5% (+20.6% constant currency).
Net sales in the DTC retail channel decreased by US$7.9 million, or 4.2% (-4.0% constant currency), during the six months ended June 30, 2019 compared to the same period in the previous year as gateway markets were negatively impacted by reduced foreign tourist traffic into the U.S. The Group estimates that consumer traffic in its U.S. gateway city stores declined by 15% to 20% in the first half of 2019 from the same period in the previous year. Five net new stores were opened during the first half of 2019. The total number of company-operated retail stores in North America was 340 as of June 30, 2019, compared to 328 company-operated retail stores as of June 30, 2018. On a same store, constant currency basis, retail net sales in North America decreased by 5.3% for the six months ended June 30, 2019 compared to the six months ended June 30, 2018 due to reduced foreign tourist traffic, particularly at the Group’s North America gateway stores. On a same store, constant currency basis, retail net sales at the Group’s gateway stores in North America decreased by 12.3% for the six months ended June 30, 2019 compared to the same period in the previous year. The Group’s same store analysis includes existing company-operated retail stores which have been open for at least 12 months before the end of the relevant financial period.
分銷渠道截至2019年6月30日止六個月,北美洲批發渠道的銷售淨額較截至2018年6月30日止六個月減少29.8百萬美元或7.5%(按不變匯率基準計算則減少7.3%),是由於中美貿易談判的時間及結果存在不確定性,令美國零售商更趨謹慎,加強控制存貨水平及批發訂單的時差。
DTC渠道(包括自營零售店及DTC電子商貿)的銷售淨額按年減少11.0百萬美元或3.7%(按不變匯率基準計算則減少3.5%)至286.4百萬美元。截至2019年6月30日止六個月DTC渠道銷售淨額減少主要因本集團決定逐步淘汰於eBags電子商貿網站利潤率偏低的若干第三方品牌的銷售而導致eBags銷售淨額減少。撇除eBags的貢獻,DTC總銷售淨額減少0.2百萬美元或0.1%(按不變匯率基準計算則增長0.1%)。
DTC電子商貿的總銷售淨額減少3.0百萬美元或2.8%(按不變匯率基準計算則減少2.7%)至截至2019年6月30日止六個月的105.1百萬美元,是主要由於eBags銷售淨額減少。撇除eBags的貢獻,DTC電子商貿總銷售淨額增加7.7百萬美元或20.5%(按不變匯率基準計算則增長20.6%)。
截至2019年6月30日止六個月,DTC零售渠道的銷售淨額較去年同期減少7.9百萬美元或4.2%(按不變匯率基準計算則減少4.0%),是由於訪美外國遊客流量減少對旅遊目的地市場造成負面影響。本集團估計2019年上半年美國旅遊目的地城市店舖的消費者人流較去年同期減少15%至20%。本集團於2019年上半年淨增設五家新自營零售店。北美洲於2019年6月30日自營零售店的總數為340家,而於2018年6月30日則為328家自營零售店。按同店不變匯率基準計算,截至2019年6月30日止六個月北美洲的零售銷售淨額較截至2018年6月30日止六個月減少5.3%,是由於外國遊客流量減少所致,尤其在本集團的北美洲旅遊目的地店舖。按同店不變匯率基準計算,截至2019年6月30日止六個月,本集團在北美洲的旅遊目的地店舖的零售銷售淨額較去年同期減少12.3%。本集團的同店分析包括於有關財務期間完結前已營業最少12個月的現有自營零售店。
32
Management Discussion and Analysis 管理層討論與分析
SAM005_IR.indb 32 9/9/2019 17:28

國家下表載列截至2019年6月30日及2018年6月30日止六個月按地域位置劃分的北美洲銷售淨額明細,以絕對值及佔地區總銷售淨額百分比列賬。
CountriesThe following table sets forth a breakdown of net sales in North America by geographic location for the six months ended June 30, 2019 and June 30, 2018, both in absolute terms and as a percentage of total regional net sales.
Six months ended June 30,截至6月30日止六個月
2019 vs 20182019年與2018年比較2019 2018
Net sales by geographic location(1): 按地域位置劃分的銷售淨額 (1):
US$ millions百萬美元
Percentage of net sales銷售淨額 百分比
US$ millions百萬美元
Percentage of net sales
銷售淨額 百分比
Percentage increase
(decrease)增加(減少)
百分比
Percentage increase (decrease) excl. foreign
currency effects(2)
撇除匯兌影響的增加(減少)百分比 (2)
United States 美國 624.8 95.5% 661.6 95.2% (5.6)% (5.6)%
Canada 加拿大 29.6 4.5% 33.4 4.8% (11.5)% (7.8)%
Net sales 銷售淨額 654.3 100.0% 695.0 100.0% (5.9)% (5.7)%
Notes 註釋(1) The geographic location of the Group’s net sales generally reflects the country from which its products were sold and does not necessarily indicate the country in which its end
consumers were actually located. 本集團銷售淨額的地域位置分佈一般反映出售產品的國家,並不一定為終端消費者實際所在的國家。(2) Results stated on a constant currency basis, a non-IFRS measure, are calculated by applying the average exchange rate of the comparable period in the previous year to
current period local currency results. 按不變匯率基準計算呈列的業績為非 IFRS財務計量工具,是以當地貨幣呈列的本期間業績採用去年同期的平均匯率計算所得。
For the six months ended June 30, 2019, net sales in the United States decreased by US$36.9 million, or 5.6%, year-on-year due to the factors noted above. Net sales in Canada decreased by 11.5% (-7.8% constant currency), year-on-year due to the non-recurrence in the first half of 2019 of certain B2B sales that were made during the corresponding period in the previous year.
由於上述原因,美國截至2019年6月30日止六個月的銷售淨額按年減少36.9百萬美元或5.6%。加拿大銷售淨額按年減少11.5%(按不變匯率基準計算則減少7.8%),是由於去年同期所進行的某些B2B銷售於2019年上半年不復再現所致。
33Samsonite International S.A. Interim Report 2019 新秀麗國際有限公司 2019年中期報告
SAM005_IR.indb 33 9/9/2019 17:28

BrandsFor the six months ended June 30, 2019, net sales of the Samsonite brand in Asia decreased by US$15.4 million, or 5.4% (-1.3% constant currency), compared to the same period in the previous year due primarily to the challenging trading conditions in South Korea. Net sales of the Tumi brand during the six months ended June 30, 2019 increased by US$10.2 million, or 9.4% (+11.9% constant currency), year-on-year due to the continued
Asia 亞洲The Group’s net sales in Asia increased on a constant currency basis, but reported net sales decreased by US$24.7 million, or 3.7% (+0.2% constant currency), for the six months ended June 30, 2019 compared to the six months ended June 30, 2018 due to unfavorable foreign currency translation impacts. The Group’s business in Asia was also impacted by a planned decrease in B2B orders in China and weak consumer sentiment in South Korea. Excluding B2B net sales in China and net sales in South Korea, the Group’s net sales for the Asia region increased by US$5.4 million, or 1.0% (+4.6% constant currency), year-on-year.
截至2019年6月30日止六個月,本集團按不變匯率基準計算的亞洲銷售淨額較截至2018年6月30日止六個月有所增加,但呈報的銷售淨額則減少24.7百萬美元或3.7%(按不變匯率基準計算則增長0.2%),是由於外匯換算的不利影響。本集團的亞洲業務亦受中國的B2B訂單按計劃減少及南韓消費意欲疲弱的影響。撇除中國的B2B銷售淨額及南韓的銷售淨額,本集團於亞洲地區的銷售淨額按年增加5.4百萬美元或1.0%(按不變匯率基準計算則增長4.6%)。
US$668.3(1) Excluding foreign currency effects. 撇除匯兌影響。
+0.2%(1)
Asia Net Sales (US$m)
亞洲銷售淨額(百萬美元)
US$643.620192018
品牌新秀麗品牌截至2019年6月30日止六個月的亞洲銷售淨額較去年同期減少15.4百萬美元或5.4%(按不變匯率基準計算則減少1.3%),主要因南韓市場環境欠佳所致。由於成功加強滲透亞洲各主要市場,Tumi品牌截至2019年6月30日止六個月的銷售淨額按年增加10.2百萬美元或9.4%(按不變匯率基準計算則增長11.9%)。American Tourister品牌截至2019年6月30日止六個月的銷售淨額較截至2018年6月30日止六個月減少15.5百萬美元或7.4%(按不變匯率基準計算則減少3.0%)。American Tourister品牌於 2018年上半年的銷售表現格外強勁,銷售淨額(按不變匯率基準計算)較 2017年上半年增長17.7%。Kamiliant品牌的銷售淨額按年減少3.3百萬美元或12.3%(按不變匯率基準計算則減少7.8%),主要因南韓地緣政治的緊張局勢所致。Gregory品牌於日本市場銷售強勁,帶動該品牌銷售淨額按年增加4.5百萬美元或28.7%(按不變匯率基準計算則增長31.4%)。
產品類別由於中國及南韓銷售額減少,亞洲旅遊產品類別截至 2019年 6月 30日止六個月的銷售淨額較去年同期減少22.2百萬美元或5.5%(按不變匯率基準計算則減少1.5%)。亞洲非旅遊類別按不變匯率基準計算的總銷售淨額有所增加,但呈報的銷售淨額由截至2018年6月30日止六個月的262.2百萬美元(佔亞洲銷售淨額的39.2%)減少2.5百萬美元或0.9%(按不變匯率基準計算則增長2.8%)至截至2019年6月30日止六個月的259.7百萬美元(佔亞洲銷售淨額的40.4%)。由Tumi品牌帶動的商務產品銷售淨額按年增加5.7百萬美元或4.0%(按不變匯率基準計算則增長7.5%)。休閒產品銷售淨額按年減少6.1百萬美元或6.7%(按不變匯率基準計算則減少2.5%),主要因中國及中東的銷售額減少所致。配件產品的銷售淨額按年減少1.8百萬美元或6.7%(按不變匯率基準計算則減少3.2%)。
34
Management Discussion and Analysis 管理層討論與分析
SAM005_IR.indb 34 9/9/2019 17:28

successful penetration of the brand throughout key markets in Asia. Net sales of the American Tourister brand during the six months ended June 30, 2019 decreased by US$15.5 million, or 7.4% (-3.0% constant currency), compared to the six months ended June 30, 2018. Sales of the American Tourister brand in the first half of 2018 were particularly strong, when constant currency net sales increased by 17.7% from the first half of 2017. Net sales of the Kamiliant brand decreased by US$3.3 million, or 12.3% (-7.8% constant currency) year-on-year, primarily caused by the geopolitical tensions in South Korea. Net sales of the Gregory brand increased by US$4.5 million, or 28.7% (+31.4% constant currency), year-on-year driven by strong sales of the brand in Japan.
Product CategoriesNet sales in the travel product category in Asia decreased by US$22.2 million, or 5.5% (-1.5% constant currency), for the six months ended June 30, 2019 compared to the same period in the previous year due to decreased sales in China and South Korea. Total non-travel category net sales in Asia increased on a constant currency basis, but reported net sales decreased by US$2.5 million, or 0.9% (+2.8% constant currency), to US$259.7 million (representing 40.4% of Asia’s net sales) for the six months ended June 30, 2019 from US$262.2 million (representing 39.2% of Asia’s net sales) for the six months ended June 30, 2018. Net sales of business products increased by US$5.7 million, or 4.0% (+7.5% constant currency), year-on-year driven by the Tumi brand. Net sales of casual products decreased by US$6.1 million, or 6.7% (-2.5% constant currency), year-on-year primarily as a result of decreased sales in China and the Middle East. Net sales of accessories products decreased by US$1.8 million, or 6.7% (-3.2% constant currency), year-on-year.
Distribution ChannelsNet sales in the wholesale channel in Asia decreased by US$39.3 million, or 7.5% (-3.5% constant currency), for the six months ended June 30, 2019 compared to the same period in the previous year, primarily due to decreased sales in China due to a decline in B2B orders and in South Korea as a result of continued challenging market conditions. Excluding B2B net sales in China and wholesale net sales in South Korea, the Group’s wholesale net sales for the Asia region increased by 0.5% on a constant currency basis.
Net sales in the DTC channel, which includes company-operated retail stores and DTC e-commerce, increased by US$14.6 million, or 10.4% (+13.9% constant currency), year-on-year. The increase in DTC net sales during the six months ended June 30, 2019 was driven by growth in DTC e-commerce as well as by net sales growth in the DTC retail channel. Total DTC e-commerce net sales increased by US$7.4 million, or 21.3% (+27.5% constant currency), to US$42.3 million for the six months ended June 30, 2019 from US$34.9 million for the six months ended June 30, 2018.
Net sales in the DTC retail channel during the six months ended June 30, 2019 increased by US$7.2 million, or 6.8% (+9.4% constant currency), compared to the same period in the previous year. The Group added 7 net new company-operated retail stores in Asia during the first half of 2019 compared to 9 net new stores during the first half of 2018. The total number of company-operated retail stores in Asia was 404 as of June 30, 2019, compared to 394 company-operated retail stores as of June 30, 2018. On a same store, constant currency basis, retail net sales in Asia increased by 0.8%. The Group’s same store analysis includes existing company-operated retail stores which have been open for at least 12 months before the end of the relevant financial period.
分銷渠道截至2019年6月30日止六個月,亞洲批發渠道的銷售淨額較去年同期減少39.3百萬美元或7.5%(按不變匯率基準計算則減少3.5%),主要因B2B訂單減少導致中國的銷售額減少,加上南韓市場環境持續欠佳所致。撇除中國的B2B銷售淨額及南韓批發銷售淨額,本集團亞洲地區的批發銷售淨額按不變匯率基準計算增長0.5%。
DTC渠道的銷售淨額(包括自營零售店及DTC電子商貿)按年增加14.6百萬美元或10.4%(按不變匯率基準計算則增長13.9%)。DTC截至2019年6月30日止六個月的銷售淨額增長是由DTC電子商貿增長及DTC零售渠道銷售淨額增長帶動。DTC電子商貿的總銷售淨額由截至2018年6月30日止六個月的34.9百萬美元增加7.4百萬美元或21.3%(按不變匯率基準計算則增長27.5%)至截至2019年6月30日止六個月的42.3百萬美元。
DTC零售渠道截至2019年6月30日止六個月的銷售淨額較去年同期增加7.2百萬美元或6.8%(按不變匯率基準計算則增長9.4%)。本集團於2019年上半年淨增設7家新自營零售店,而2018年上半年淨增設9家新自營零售店。於2019年6月30日亞洲的自營零售店的總數為404家,而於2018年6月30日則為394家。按同店不變匯率基準計算,亞洲零售店銷售淨額增長0.8%。本集團的同店分析包括於有關財務期間完結前已營業最少12個月的現有自營零售店。
35Samsonite International S.A. Interim Report 2019 新秀麗國際有限公司 2019年中期報告
SAM005_IR.indb 35 9/9/2019 17:28
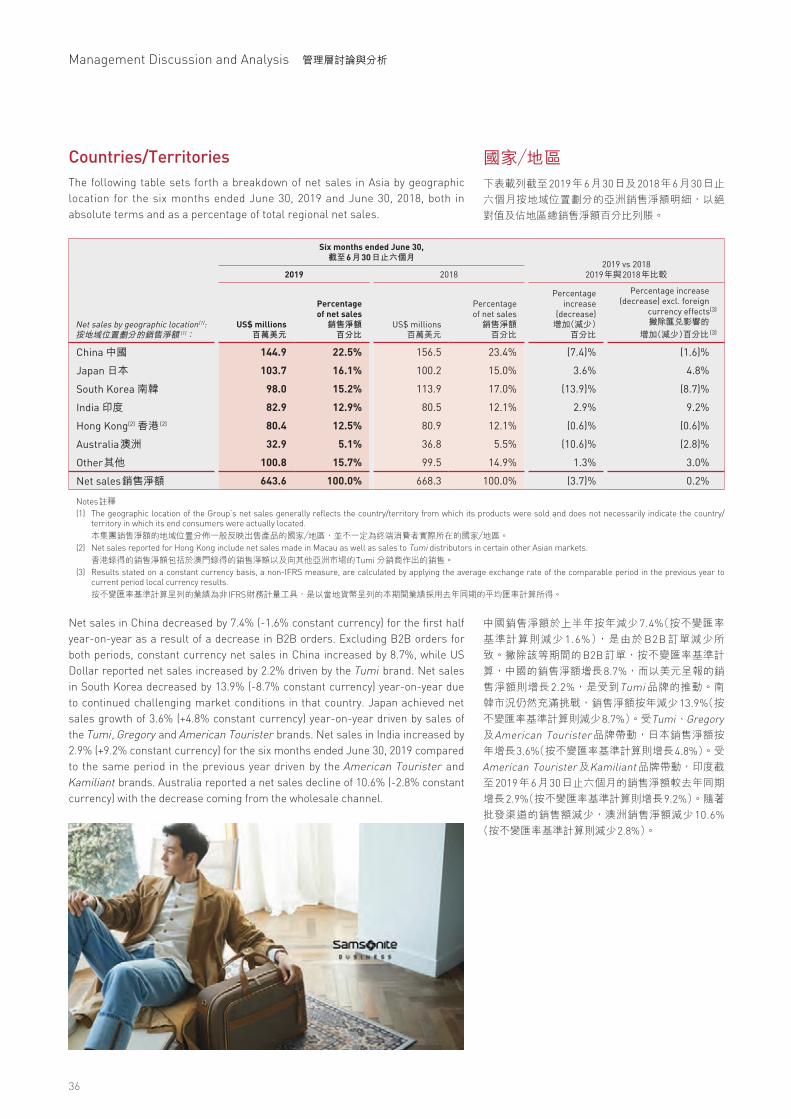
Countries/TerritoriesThe following table sets forth a breakdown of net sales in Asia by geographic location for the six months ended June 30, 2019 and June 30, 2018, both in absolute terms and as a percentage of total regional net sales.
Six months ended June 30,截至6月30日止六個月
2019 vs 20182019年與2018年比較2019 2018
Net sales by geographic location(1): 按地域位置劃分的銷售淨額 (1):
US$ millions百萬美元
Percentage of net sales銷售淨額 百分比
US$ millions百萬美元
Percentage of net sales
銷售淨額百分比
Percentage increase
(decrease)增加(減少)
百分比
Percentage increase (decrease) excl. foreign
currency effects(3)
撇除匯兌影響的增加(減少)百分比 (3)
China 中國 144.9 22.5% 156.5 23.4% (7.4)% (1.6)%
Japan 日本 103.7 16.1% 100.2 15.0% 3.6% 4.8%
South Korea 南韓 98.0 15.2% 113.9 17.0% (13.9)% (8.7)%
India 印度 82.9 12.9% 80.5 12.1% 2.9% 9.2%
Hong Kong(2) 香港 (2) 80.4 12.5% 80.9 12.1% (0.6)% (0.6)%
Australia澳洲 32.9 5.1% 36.8 5.5% (10.6)% (2.8)%
Other其他 100.8 15.7% 99.5 14.9% 1.3% 3.0%
Net sales銷售淨額 643.6 100.0% 668.3 100.0% (3.7)% 0.2%
Notes註釋(1) The geographic location of the Group’s net sales generally reflects the country/territory from which its products were sold and does not necessarily indicate the country/
territory in which its end consumers were actually located. 本集團銷售淨額的地域位置分佈一般反映出售產品的國家/地區,並不一定為終端消費者實際所在的國家/地區。(2) Net sales reported for Hong Kong include net sales made in Macau as well as sales to Tumi distributors in certain other Asian markets. 香港錄得的銷售淨額包括於澳門錄得的銷售淨額以及向其他亞洲市場的Tumi 分銷商作出的銷售。(3) Results stated on a constant currency basis, a non-IFRS measure, are calculated by applying the average exchange rate of the comparable period in the previous year to
current period local currency results. 按不變匯率基準計算呈列的業績為非 IFRS財務計量工具,是以當地貨幣呈列的本期間業績採用去年同期的平均匯率計算所得。
Net sales in China decreased by 7.4% (-1.6% constant currency) for the first half year-on-year as a result of a decrease in B2B orders. Excluding B2B orders for both periods, constant currency net sales in China increased by 8.7%, while US Dollar reported net sales increased by 2.2% driven by the Tumi brand. Net sales in South Korea decreased by 13.9% (-8.7% constant currency) year-on-year due to continued challenging market conditions in that country. Japan achieved net sales growth of 3.6% (+4.8% constant currency) year-on-year driven by sales of the Tumi, Gregory and American Tourister brands. Net sales in India increased by 2.9% (+9.2% constant currency) for the six months ended June 30, 2019 compared to the same period in the previous year driven by the American Tourister and Kamiliant brands. Australia reported a net sales decline of 10.6% (-2.8% constant currency) with the decrease coming from the wholesale channel.
國家/地區下表載列截至2019年6月30日及2018年6月30日止六個月按地域位置劃分的亞洲銷售淨額明細,以絕對值及佔地區總銷售淨額百分比列賬。
中國銷售淨額於上半年按年減少7.4%(按不變匯率基準計算則減少 1.6%),是由於B2B訂單減少所致。撇除該等期間的B2B訂單,按不變匯率基準計算,中國的銷售淨額增長8.7%,而以美元呈報的銷售淨額則增長2.2%,是受到Tumi品牌的推動。南韓市況仍然充滿挑戰,銷售淨額按年減少13.9%(按不變匯率基準計算則減少8.7%)。受Tumi、Gregory及American Tourister品牌帶動,日本銷售淨額按年增長3.6%(按不變匯率基準計算則增長4.8%)。受American Tourister及Kamiliant品牌帶動,印度截至2019年6月30日止六個月的銷售淨額較去年同期增長2.9%(按不變匯率基準計算則增長9.2%)。隨著批發渠道的銷售額減少,澳洲銷售淨額減少10.6%(按不變匯率基準計算則減少2.8%)。
36
Management Discussion and Analysis 管理層討論與分析
SAM005_IR.indb 36 9/9/2019 17:28

BrandsFor the six months ended June 30, 2019, net sales of the Samsonite brand in Europe decreased by US$23.6 million, or 9.4% (-2.2% constant currency), compared to the same period in the previous year. Net sales of the Tumi brand during the six months ended June 30, 2019 increased by US$5.3 million, or 12.0% (+20.4% constant currency), year-on-year. Net sales of the American Tourister brand during the six months ended June 30, 2019 increased on a constant currency basis, but reported net sales decreased by US$3.0 million, or 4.1% (+3.0% constant currency), compared to the six months ended June 30, 2018. The first half of 2018 was particularly strong for the American Tourister brand with constant currency net sales growth of 49.5% over the prior year.
Europe 歐洲Net sales in Europe increased on a constant currency basis, but reported net sales decreased by US$21.4 million, or 5.4% (+1.9% constant currency), for the six months ended June 30, 2019 compared to the same period in the previous year as US Dollar reported net sales were negatively impacted by foreign currency translation.
因以美元呈報的銷售淨額受外匯換算的負面影響,歐洲截至2019年6月30日止六個月按不變匯率基準計算的銷售淨額較去年同期有所增加,但呈報的銷售淨額則減少21.4百萬美元或5.4%(按不變匯率基準計算則增長1.9%)。
品牌截至2019年6月30日止六個月,新秀麗品牌於歐洲的銷售淨額較去年同期減少 23.6百萬美元或 9.4%(按不變匯率基準計算則減少2.2%)。Tumi品牌截至 2019年 6月 30日止六個月的銷售淨額按年增加5.3百萬美元或12.0%(按不變匯率基準計算則增長20.4%)。American Tourister品牌截至2019年6月30日止六個月按不變匯率基準計算的銷售淨額較截至2018年6月30日止六個月有所增加,但呈報的銷售淨額則減少3.0百萬美元或4.1%(按不變匯率基準計算則增長3.0%)。American Tourister品牌於2018年上半年表現格外強勁,銷售淨額(按不變匯率基準計算)較去年增長49.5%。
(1) Excluding foreign currency effects. 撇除匯兌影響。
+1.9%(1)
Europe Net Sales (US$m)
歐洲銷售淨額(百萬美元)
US$392.7US$371.32019
2018
37Samsonite International S.A. Interim Report 2019 新秀麗國際有限公司 2019年中期報告
SAM005_IR.indb 37 9/9/2019 17:28

Product CategoriesNet sales in the travel product category in Europe decreased by US$22.5 million, or 8.3% (-1.3% constant currency), for the six months ended June 30, 2019 compared to the six months ended June 30, 2018 due to decreased sales of the Samsonite brand, partially offset by increased sales of the Tumi and American Tourister brands. Total non-travel category net sales in Europe increased by US$1.1 million, or 0.9% (+9.1% constant currency), year-on-year to US$121.7 million (representing 32.8% of Europe’s net sales) for the six months ended June 30, 2019 from US$120.6 million (representing 30.7% of Europe’s net sales) for the same period in the previous year. Net sales of business products increased by US$0.1 million, or 0.2% (+8.6% constant currency), year-on-year driven by increased sales of the Tumi brand. Net sales of casual products increased by US$1.5 million, or 8.8% (+17.3% constant currency), year-on-year. Net sales of accessories products decreased by US$2.4 million, or 6.8% (+0.6% constant currency), year-on-year.
Distribution ChannelsNet sales in the wholesale channel in Europe decreased by US$22.1 million, or 8.9% (-2.1% constant currency), during the six months ended June 30, 2019 compared to the six months ended June 30, 2018 due to decreased sales of the Samsonite brand.
Net sales in the DTC channel, which includes company-operated retail stores and DTC e-commerce, increased by US$0.7 million, or 0.5% (+8.8% constant currency), year-on-year. The increase in DTC net sales during the six months ended June 30, 2019 was driven by growth in DTC e-commerce. Total DTC e-commerce net sales increased by US$1.8 million, or 10.5% (+18.8% constant currency), to US$19.1 million for the six months ended June 30, 2019 from US$17.2 million for the six months ended June 30, 2018.
Net sales in the DTC retail channel during the six months ended June 30, 2019 increased on a constant currency basis, but reported net sales decreased by US$1.1 million, or 0.9% (+7.4% constant currency), compared to the six months ended June 30, 2018. The Group began to slow the pace of opening new company-operated retail stores in Europe during the second half of 2018, and continued to moderate the pace of new store openings in the first half of 2019. There were 13 net new stores opened during the first half of 2019 compared to 28 net new stores opened during the first half of 2018. The total number of company-operated retail stores in Europe was 313 as of June 30, 2019, compared to 288 company-operated retail stores as of June 30, 2018. On a same store, constant currency basis, retail net sales decreased by 0.2%. The Group’s same store analysis includes existing company-operated retail stores which have been open for at least 12 months before the end of the relevant financial period.
產品類別旅遊產品類別截至2019年6月30日止六個月於歐洲的銷售淨額較截至2018年6月30日止六個月減少22.5百萬美元或8.3%(按不變匯率基準計算則減少1.3%),是由於新秀麗品牌銷售額減少所致,惟部分減幅被Tumi及American Tourister品牌銷售額增長所抵銷。非旅遊類別於歐洲的總銷售淨額由去年同期的120.6百萬美元(佔歐洲銷售淨額的30.7%)按年增加1.1百萬美元或0.9%(按不變匯率基準計算則增長9.1%)至截至2019年6月30日止六個月的121.7百萬美元(佔歐洲銷售淨額的32.8%)。受Tumi品牌銷售額增長帶動,商務產品的銷售淨額按年增加0.1 百萬美元或0.2%(按不變匯率基準計算則增長8.6%)。休閒產品銷售淨額按年增加1.5百萬美元或8.8%,(按不變匯率基準計算則增長17.3%)。配件產品的銷售淨額按年減少2.4百萬美元或6.8%(按不變匯率基準計算則增長0.6%)。
分銷渠道截至2019年6月30日止六個月,歐洲批發渠道的銷售淨額較2018年6月30日止六個月減少22.1百萬美元或8.9%(按不變匯率基準計算則減少2.1%),是由於新秀麗品牌銷售額減少所致。
DTC渠道的銷售淨額(包括自營零售店及DTC電子商貿)按年增加0.7百萬美元或0.5%(按不變匯率基準計算則增長8.8%)。DTC截至2019年6月30日止六個月的銷售淨額增長是受DTC電子商貿增長帶動。DTC電子商貿總銷售淨額由截至2018年6月30日止六個月的17.2百萬美元增加1.8百萬美元或10.5%(按不變匯率基準計算則增長18.8%)至截至2019年6月30日止六個月的19.1百萬美元。
DTC零售渠道截至2019年6月30日止六個月按不變匯率基準計算的銷售淨額較截至2018年6月30日止六個月有所增加,但呈報的銷售淨額則減少1.1百萬美元或0.9%(按不變匯率基準計算則增長7.4%)。本集團於2018年下半年放慢於歐洲開設新自營零售店的步伐,而2019年上半年仍然維持較慢開店步伐。本集團於2019年上半年淨增設13家新自營零售店,而2018年上半年淨增設28家新自營零售店。於2019年6月30日歐洲的自營零售店的總數為313家,而於2018年6月30日則為288家。按同店不變匯率基準計算,零售店銷售淨額減少0.2%。本集團的同店分析包括於有關財務期間完結前已營業最少12個月的現有自營零售店。
38
Management Discussion and Analysis 管理層討論與分析
SAM005_IR.indb 38 9/9/2019 17:28

CountriesThe following table sets forth a breakdown of net sales in Europe by geographic location for the six months ended June 30, 2019 and June 30, 2018, both in absolute terms and as a percentage of total regional net sales.
Six months ended June 30,截至6月30日止六個月
2019 vs 20182019年與2018年比較2019 2018
Net sales by geographic location(1) : 按地域位置劃分的銷售淨額 (1):
US$ millions百萬美元
Percentage of net sales銷售淨額 百分比
US$ millions百萬美元
Percentage of net sales
銷售淨額 百分比
Percentage increase
(decrease)增加(減少)
百分比
Percentage increase (decrease) excl. foreign
currency effects(4)
撇除匯兌影響的增加(減少)百分比 (4)
Belgium(2) 比利時 (2) 63.4 17.1 % 63.2 16.1 % 0.4 % 7.3 %
Germany 德國 56.0 15.1 % 56.0 14.3 % (0.1)% 6.8 %
Italy 意大利 39.0 10.5 % 43.4 11.0 % (10.2)% (4.0)%
France 法國 37.4 10.1 % 39.7 10.1 % (6.0)% 0.3 %
United Kingdom(3) 英國 (3) 35.4 9.5 % 38.8 9.9 % (8.9)% (3.6)%
Russia 俄羅斯 30.0 8.1 % 26.8 6.8 % 11.9 % 21.4 %
Spain 西班牙 28.9 7.8 % 30.3 7.7 % (4.6)% 2.0 %
Other 其他 81.3 21.9 % 94.5 24.1 % (13.9)% (4.5)%
Net sales 銷售淨額 371.3 100.0 % 392.7 100.0 % (5.4)% 1.9 %
Notes註釋(1) The geographic location of the Group’s net sales generally reflects the country from which its products were sold and does not necessarily indicate the country in which its end
consumers were actually located. 本集團銷售淨額的地域位置分佈一般反映出售產品的國家,並不一定為終端消費者實際所在的國家。(2) Net sales in Belgium were US$11.0 million and US$12.5 million for the six months ended June 30, 2019 and June 30, 2018, a decrease of US$1.5 million, or 12.0%,
respectively. Remaining sales consisted of direct shipments to distributors, customers and agents in other European countries, including e-commerce. 截至2019年6月30日及2018年6月30日止六個月,比利時的銷售淨額分別為11.0百萬美元及12.5百萬美元,減少1.5百萬美元或12.0%。餘下的銷售額包括直接發貨予歐洲其他國家的分銷商、客戶及代理商(包括電子商貿)。
(3) Net sales reported for the United Kingdom include net sales made in Ireland. 英國錄得的銷售淨額包括於愛爾蘭錄得的銷售淨額。(4) Results stated on a constant currency basis, a non-IFRS measure, are calculated by applying the average exchange rate of the comparable period in the previous year to
current period local currency results 按不變匯率基準計算呈列的業績為非 IFRS財務計量工具,是以當地貨幣呈列的本期間業績採用去年同期的平均匯率計算所得。
Constant currency net sales growth during the six months ended June 30, 2019 compared to the same period in the previous year was driven by constant currency net sales increases in Germany +6.8% and Spain +2.0%. The Group continued to experience year-on-year constant currency net sales growth in the emerging markets of Russia +21.4% and Turkey +26.1%. Net sales in Italy decreased by US$4.4 million, or 10.2% (-4.0% constant currency), due to challenging market conditions and negative consumer sentiment in that country. In the U.K., the net sales decrease of US$3.5 million, or 8.9% (-3.6% constant currency) was primarily due to the loss of a retail customer that filed for bankruptcy.
國家下表載列截至2019年6月30日及2018年6月30日止六個月按地域位置劃分的歐洲地區銷售淨額明細,以絕對值及佔地區總銷售淨額百分比列賬。
截至2019年6月30日止六個月按不變匯率基準計算的銷售淨額與去年同期相比有所增長,原因是受德國銷售淨額(按不變匯率基準計算增長6.8%)及西班牙銷售淨額(按不變匯率基準計算增長2.0%)增長所帶動。本集團於新興市場繼續錄得按年銷售淨額增長,包括俄羅斯(按不變匯率基準計算增長21.4%)及土耳其(按不變匯率基準計算增長26.1%)。意大利銷售淨額減少4.4百萬美元或10.2%(按不變匯率基準計算則減少4.0%),是由於該國家市場狀況不景氣且消費意欲疲弱所致。英國銷售淨額減少3.5百萬美元或8.9%(按不變匯率基準計算則減少3.6%),主要是由於失去一個零售客戶,該客戶已申請破產。
39Samsonite International S.A. Interim Report 2019 新秀麗國際有限公司 2019年中期報告
SAM005_IR.indb 39 9/9/2019 17:28

Latin America 拉丁美洲The Group’s net sales in Latin America increased on a constant currency basis, but reported net sales decreased by US$5.9 million, or 6.5% (+3.4% constant currency), for the six months ended June 30, 2019 compared to the six months ended June 30, 2018. The Group’s US Dollar reported net sales for Latin America were negatively impacted by unfavorable foreign currency translation effects due to the strengthening of the US Dollar against local currencies compared to the same period in the previous year.
本集團截至2019年6月30日止六個月在拉丁美洲按不變匯率基準計算的銷售淨額較截至2018年6月30日止六個月有所增長,但呈報的銷售淨額則減少5.9百萬美元或6.5%(按不變匯率基準計算則增長3.4%)。本集團於拉丁美洲以美元呈報的銷售淨額因美元兌當地貨幣較去年同期升值導致外匯換算出現不利影響而受到負面影響。
US$90.6(1) Excluding foreign currency effects. 撇除匯兌影響。
+3.4%(1)
Latin America Net Sales (US$m)
拉丁美洲銷售淨額(百萬美元)
US$84.720192018
BrandsFor the six months ended June 30, 2019, net sales of the Samsonite brand in Latin America increased on a constant currency basis, but reported net sales decreased by US$2.1 million, or 5.8% (+6.3% constant currency), compared to the same period in the previous year. Net sales of the American Tourister brand during the six months ended June 30, 2019 increased on a constant currency basis, but reported net sales decreased by US$0.8 million, or 7.1% (+2.3% constant currency), compared to the six months ended June 30, 2018. The first half of 2018 was particularly strong for American Tourister with constant currency net sales growth of 103.2% over the prior year. For the six months ended June 30, 2019, net sales of the Tumi brand in Latin America increased by US$1.4 million, or 171.5% (+178.2% constant currency), compared to the same period in the previous year. In Chile, net sales of the Saxoline brand and the
品牌截至2019年6月30日止六個月,新秀麗品牌於拉丁美洲按不變匯率基準計算的銷售淨額較去年同期有所增長,但呈報的銷售淨額則減少2.1百萬美元或5.8%(按不變匯率基準計算則增長6.3%)。American Tourister品牌截至2019年6月30日止六個月按不變匯率基準計算的銷售淨額較截至2018年6月30日止六個月有所增長,但呈報的銷售淨額則減少0.8百萬美元或7.1%(按不變匯率基準計算則增長2.3%)。American Tourister品牌於2018年上半年表現格外強勁,銷售淨額(按不變匯率基準計算)較去年增長103.2%。截至2019年6月30日止六個月,Tumi品牌於拉丁美洲的銷售淨額較去年同期增加1.4百萬美元或171.5%(按不變匯率基準計算則增長178.2%)。在智利,Saxoline品牌及Secret品牌的銷售淨額分別按年減少16.7%(按不變匯率基準計算則減少8.0%)及22.7%(按不變匯率基準計算則減少14.5%),是由於智利受到消費者人流減少及國內消費意欲疲弱的影響。
產品類別截至2019年6月30日止六個月,拉丁美洲旅遊及非旅遊產品類別的銷售淨額按不變匯率基準計算增加,按呈報基準計算則減少,是由於外匯的不利影響。旅遊產品類別截至2019年6月30日止六個月於拉丁美洲的銷售淨額較去年同期減少2.8百萬美元或7.5%(按不變匯率基準計算則增長3.4%)。非旅遊產品類別於拉丁美洲的總銷售淨額由截至2018年6月30日止六個月的52.9百萬美元(佔拉丁美洲銷售淨額的58.4%)減少3.1百萬美元或5.8%(按不變匯率基準計算則增長3.4%)至
40
Management Discussion and Analysis 管理層討論與分析
SAM005_IR.indb 40 9/9/2019 17:28

Secret brand decreased by 16.7% (-8.0% constant currency) and 22.7% (-14.5% constant currency), respectively, year-on-year as Chile has been challenged by a decrease in consumer traffic and weak domestic consumer sentiment.
Product CategoriesDuring the six months ended June 30, 2019, net sales of travel and non-travel product categories in Latin America increased on a constant currency basis, but decreased on an as reported basis due to negative foreign currency impacts. Net sales in the travel product category in Latin America decreased by US$2.8 million, or 7.5% (+3.4% constant currency), for the six months ended June 30, 2019 compared to the same period in the previous year. Total non-travel category net sales in Latin America decreased by US$3.1 million, or 5.8% (+3.4% constant currency), to US$49.8 million (representing 58.8% of Latin America’s net sales) for the six months ended June 30, 2019 from US$52.9 million (representing 58.4% of Latin America’s net sales) for the six months ended June 30, 2018. Net sales of business products increased by US$0.3 million, or 3.2% (+12.3% constant currency), compared to the same period in the previous year. Net sales of casual products decreased by US$3.2 million, or 9.2% (0.0% constant currency), year-on-year. Net sales of accessories products increased by US$1.4 million, or 16.9%, (+27.6% constant currency), year-on-year.
Distribution ChannelsNet sales in the wholesale channel in Latin America decreased by US$5.7 million, or 10.7% (-2.1% constant currency), for the six months ended June 30, 2019 compared to the six months ended June 30, 2018.
Net sales in the DTC channel, which includes company-operated retail stores and DTC e-commerce, decreased by US$0.2 million, or 0.5% (+11.3% constant currency), year-on-year. The constant currency increase in DTC net sales for the six months ended June 30, 2019 was primarily driven by growth in the DTC e-commerce channel. Net sales from DTC e-commerce sites in Argentina, Chile, Colombia and Mexico increased by US$0.6 million, or 62.5% (+112.8% constant currency), to US$1.5 million for the six months ended June 30, 2019 from US$0.9 million for the six months ended June 30, 2018.
Net sales in the DTC retail channel during the six months ended June 30, 2019 decreased by US$0.8 million, or 2.1% (+8.7% constant currency), compared to the six months ended June 30, 2018. The Group continued to moderate the pace of new store openings in the first half of 2019. Two net new stores were opened during the first half of 2019 compared to 11 new net stores opened during the first half of 2018. The total number of company-operated retail stores in Latin America was 221 as of June 30, 2019, compared to 209 company-operated retail stores as of June 30, 2018. On a same store, constant currency basis, retail net sales decreased by 0.2% due to a decrease in consumer traffic caused by Argentinian tourists purchasing more within their home country as the Argentinian government eased restrictions on imports along with weak domestic consumer sentiment. Excluding Chile, same store, constant currency net sales in Latin America increased by 4.1%.
截至2019年6月30日止六個月的49.8百萬美元(佔拉丁美洲銷售淨額的58.8%)。商務產品的銷售淨額較去年同期增加0.3百萬美元或3.2%(按不變匯率基準計算則增長12.3%)。休閒產品的銷售淨額按年減少3.2百萬美元或9.2%(按不變匯率基準計算則持平)。配件產品的銷售淨額按年增加1.4百萬美元或16.9%(按不變匯率基準計算則增長27.6%)。
分銷渠道截至2019年6月30日止六個月,拉丁美洲批發渠道的銷售淨額較截至2018年6月30日止六個月減少5.7百萬美元或10.7%(按不變匯率基準計算則減少2.1%)。
DTC渠道(包括自營零售店及DTC電子商貿)的銷售淨額按年減少0.2百萬美元或0.5%(按不變匯率基準計算則增長11.3%)。截至2019年6月30日止六個月按不變匯率基準計算的DTC銷售淨額增加主要由於DTC電子商貿增長所致。阿根廷、智利、哥倫比亞及墨西哥的DTC電子商貿網站的銷售淨額由截至2018年6月30日止六個月的0.9百萬美元增加0.6百萬美元或62.5%(按不變匯率基準計算則增長112.8%)至截至2019年6月30日止六個月的1.5百萬美元。
DTC零售渠道截至2019年6月30日止六個月的銷售淨額較截至2018年6月30日止六個月減少0.8百萬美元或2.1%(按不變匯率基準計算則增長8.7%)。本集團於2019年上半年繼續維持較慢開設新店步伐。本集團於2019年上半年淨增設兩家新零售店,而於2018年上半年淨增設11家新零售店。於2019年6月30日拉丁美洲的自營零售店的總數為221家,而於2018年6月30日則為209家。按同店不變匯率基準計算,零售銷售淨額減少0.2%,是由於阿根廷當局放寬入口限制導致阿根廷遊客更多在國內消費,加上本地消費者消費意欲疲弱,導致消費者人流減少所致。撇除智利,按不變匯率基準計算,拉丁美洲同店銷售淨額增長4.1%。
41Samsonite International S.A. Interim Report 2019 新秀麗國際有限公司 2019年中期報告
SAM005_IR.indb 41 9/9/2019 17:28

CountriesThe following table sets forth a breakdown of net sales in Latin America by geographic location for the six months ended June 30, 2019 and June 30, 2018, both in absolute terms and as a percentage of total regional net sales.
Six months ended June 30,截至6月30日止六個月
2019 vs 20182019年與2018年比較2019 2018
Net sales by geographic location(1) :按地域位置劃分的銷售淨額 (1):
US$ millions百萬美元
Percentage of net sales銷售淨額 百分比
US$ millions百萬美元
Percentage of net sales銷售淨額 百分比
Percentage increase
(decrease)增加(減少) 百分比
Percentage increase (decrease) excl. foreign
currency effects(4)
撇除匯兌影響的增加(減少)百分比 (4)
Chile 智利 33.3 39.4% 39.8 44.0% (16.3)% (7.5)%
Mexico 墨西哥 26.7 31.5% 25.8 28.5% 3.4% 4.7%
Brazil(2) 巴西 (2) 8.6 10.2% 9.2 10.1% (6.4)% 5.3%
Other(3) 其他 (3) 16.1 19.0% 15.8 17.4% 2.0% 27.7%
Net sales銷售淨額 84.7 100.0% 90.6 100.0% (6.5)% 3.4%
Notes 註釋(1) The geographic location of the Group’s net sales generally reflects the country from which its products were sold and does not necessarily indicate the country in which its end
consumers were actually located. 本集團銷售淨額的地域位置分佈一般反映出售產品的國家,並不一定為終端消費者實際所在的國家。(2) Excludes sales made to distributors in Brazil from outside of the country. 不包括對來自國外的巴西分銷商作出的銷售。(3) The net sales figure for the “Other” geographic location includes sales in Argentina, Colombia, Panama, Peru, Uruguay and sales to third party distributors outside of Brazil. 「其他」一欄地區的銷售淨額數據包括於阿根廷、哥倫比亞、巴拿馬、秘魯及烏拉圭作出的銷售以及向巴西以外的第三方分銷商作出的銷售。(4) Results stated on a constant currency basis, a non-IFRS measure, are calculated by applying the average exchange rate of the comparable period in the previous year to
current period local currency results. 按不變匯率基準計算呈列的業績為非 IFRS財務計量工具,是以當地貨幣呈列的本期間業績採用去年同期的平均匯率計算所得。
Net sales in Chile decreased by US$6.5 million, or 16.3% (-7.5% constant currency), during the six months ended June 30, 2019 compared to the same period in the previous year due to a decrease in consumer traffic caused by Argentinian tourists purchasing more within their home country as the Argentinian government eased restrictions on imports along with weak domestic consumer sentiment. Net sales during the second quarter of 2019 increased on a constant currency basis, but reported net sales decreased by US$0.6 million, or 5.3% (+4.5% constant currency), compared to the same period in the previous year, which improved from the US$5.9 million, or 21.0% (-12.6% constant currency) decrease, for the first quarter of 2019.
Net sales in Mexico increased by US$0.9 million, or 3.4% (+4.7% constant currency), year-on-year primarily attributable to increases in net sales of the Tumi brand resulting from the Group moving from a third-party distributor model to direct distribution of the brand, as well as an increase in Xtrem brand net sales. Net sales in Brazil decreased by US$0.6 million, or 6.4%, year-on-year, while constant currency net sales increased by 5.3% due to improvements in the retail channel. Net sales in Argentina, which is included in Other in the table above, increased by US$0.9 million, or 33.9% (+160.5% constant currency), for the six months ended June 30, 2019 compared to the same period in the previous year, due to the Argentinian government easing restrictions on imports, resulting in Argentinian consumers buying more products in their home country instead of traveling to neighboring countries like Chile. Excluding Chile, Latin America net sales increased by US$0.6 million, or 1.2% (+11.9% constant currency).
國家下表載列截至2019年6月30日及2018年6月30日止六個月按地域位置劃分的拉丁美洲銷售淨額明細,以絕對值及佔地區總銷售淨額百分比列賬。
智利截至2019年6月30日止六個月的銷售淨額較去年同期減少6.5百萬美元或16.3%(按不變匯率基準計算則減少7.5%),是由於阿根廷當局放寬入口限制導致阿根廷遊客更多在國內消費,加上當地消費者消費意欲疲弱,導致智利消費者人流減少所致。按不變匯率基準計算,2019年第二季度銷售淨額有所增加,但呈報的銷售淨額則較去年同期減少0.6百萬美元或5.3%(按不變匯率基準計算則增長4.5%),但較2019年第一季度減少5.9百萬美元或21.0%(按不變匯率基準計算則減少12.6%)好轉。
墨西哥的銷售淨額按年增加 0.9百萬美元或 3.4%(按不變匯率基準計算則增長 4.7%),主要由於本集團由第三方分銷商模式轉為直接分銷模式促使Tumi品牌的銷售淨額增加,以及Xtrem品牌的銷售淨額增加。巴西的銷售淨額按年減少0.6百萬美元或 6.4%,按不變匯率基準計算的銷售淨額則增加5.3%,是由於零售渠道表現改善所致。由於阿根廷政府放寬入口限制導致阿根廷消費者傾向於在本國購物而非前往智利等鄰國旅遊,阿根廷截至2019年6月30日止六個月的銷售淨額(已計入上表「其他」一欄)較去年同期增加0.9百萬美元或33.9%(按不變匯率基準計算則增長160.5%)。撇除智利,拉丁美洲銷售淨額增加0.6百萬美元或1.2%(按不變匯率基準計算則增長11.9%)。
42
Management Discussion and Analysis 管理層討論與分析
06_SAM005_IR19_MD&A (2)_AW.indd 42 9/9/2019 17:46

Cost of Sales and Gross ProfitCost of sales decreased by US$32.2 million, or 4.0%, to US$772.7 million (representing 44.0% of net sales) for the six months ended June 30, 2019 from US$804.9 million (representing 43.5% of net sales) for the six months ended June 30, 2018 due to the decrease in net sales.
Gross profit decreased by US$60.7 million, or 5.8%, to US$983.0 million for the six months ended June 30, 2019 from US$1,043.8 million for the six months ended June 30, 2018 due to lower sales and lower gross profit margin. Gross profit margin decreased to 56.0% for the six months ended June 30, 2019 from 56.5% for the same period in the previous year. Excluding the gross profit margin in North America where the Group was impacted by higher tariffs, the Group’s gross profit margin decreased by 10 basis points year-on-year. The decrease in gross profit margin was due to additional U.S. tariffs on product sourced from China, sales mix, higher raw materials costs in Europe and increased sales promotions in certain markets.
Distribution ExpensesDistribution expenses increased by US$2.1 million, or 0.3%, to US$600.5 million (representing 34.2% of net sales) for the six months ended June 30, 2019 from US$598.4 million (representing 32.4% of net sales) for the six months ended June 30, 2018. Distribution expenses increased primarily due to the effect of investments in the DTC distribution channel, particularly in connection with bricks-and-mortar retail stores that were opened in 2017 and 2018. Distribution expenses as a percentage of net sales increased for the same reasons along with the year-on-year decrease in net sales. The Group began slowing the pace of new store openings. In 2017, the Group added 127 net new company-operated retail stores, including 30 Tumi retail stores that were acquired in conjunction with the distributor buybacks in Asia. In 2018, the Group added 84 net new company-operated retail stores, with 52 stores added during the first half of 2018 and 32 stores added during the second half of 2018. For the six months ended June 30, 2019, the Group added 27 net new company-operated retail stores.
Marketing ExpensesThe Group spent US$103.1 million on marketing during the six months ended June 30, 2019 compared to US$114.3 million for the six months ended June 30, 2018, a decrease of US$11.3 million, or 9.8%. As a percentage of net sales, marketing expenses decreased by 30 basis points to 5.9% during the six months ended June 30, 2019 compared to 6.2% during the same period in the previous year. Marketing spend was higher during the first half of 2018 due to the timing of the American Tourister global advertising campaign. The Group intends to temporarily reduce advertising spend for the second half of 2019 to help offset the pressure on its profitability caused by current headwinds. The Group plans to execute this intended reduction in a targeted manner to ensure continued support for our growth initiatives, including the Tumi brand’s further international expansion, its DTC e-commerce growth strategy and planned new product introductions.
General and Administrative ExpensesGeneral and administrative expenses decreased by US$10.0 million, or 8.0%, to US$113.8 million (representing 6.5% of net sales) for the six months ended June 30, 2019 from US$123.8 million (representing 6.7% of net sales) for the six months ended June 30, 2018. General and administrative expenses as a percentage of net sales improved by 20 basis points notwithstanding the decline in net sales year-on-
銷售成本及毛利由於銷售淨額減少,截至2019年6月30日止六個月的銷售成本較截至2018年6月30日止六個月的804.9百萬美元(佔銷售淨額43.5%)減少32.2百萬美元或4.0%至772.7百萬美元(佔銷售淨額44.0%)。
毛利由截至2018年6月30日止六個月的1,043.8百萬美元減少60.7百萬美元或5.8%至截至2019年6月30日止六個月的983.0百萬美元,是由於銷售額及毛利率減少所致。毛利率則由去年同期的56.5%下降至截至2019年6月30日止六個月的56.0%。經撇除本集團受加徵關稅影響的北美洲毛利率,本集團毛利率按年下降10個基點。毛利率下降是因美國對中國商品加徵關稅、銷售組合、歐洲原材料成本上升及於若干市場增加銷售推廣所致。
分銷開支分銷開支由截至2018年6月30日止六個月的598.4百萬美元(佔銷售淨額 32.4%)增加 2.1百萬美元或0.3%至截至2019年6月30日止六個月的600.5百萬美元(佔銷售淨額34.2%)。分銷開支上升,主要因投資於DTC分銷渠道(尤其是2017年及2018年增設實體零售店)的影響所致。由於相同原因加上銷售淨額按年減少,分銷開支佔銷售淨額百分比上升。本集團開始減慢開設新店的步伐。於2017年,本集團淨增設127家新自營零售店,包括於亞洲回購分銷商時所收購的30家Tumi零售店。於2018年,本集團淨增設84家新自營零售店,其中52家在2018年上半年增設,32家在2018年下半年增設。截至2019年6月30日止六個月,本集團淨增設27家新自營零售店。
營銷開支本集團的營銷開支由截至 2018年 6月 30日止六個月的114.3百萬美元減少11.3百萬美元或9.8%至截至2019年6月30日止六個月的103.1百萬美元。截至2019年6月30日止六個月,營銷開支佔銷售淨額的比例較去年同期的6.2%減少30個基點至5.9%。2018年上半年的營銷支出較高是由於American Tourister全球營銷活動的時間安排所致。本集團於2019年下半年暫時減少廣告開支,以緩解當前不利局面造成的盈利壓力。本集團計劃針對性地執行擬定的削減開支措施,以確保繼續支持我們的增長計劃,包括Tumi品牌的進一步國際擴張、DTC電子商貿增長策略及計劃推出的新產品。
一般及行政開支一般及行政開支由截至2018年6月30日止六個月的123.8百萬美元(佔銷售淨額的6.7%)減少10.0百萬美元或8.0%至截至2019年6月30日止六個月的113.8百萬美元(佔銷售淨額的6.5%)。儘管銷售淨額按年下降,但一般及行政開支佔銷售淨額的百分比下降
43Samsonite International S.A. Interim Report 2019 新秀麗國際有限公司 2019年中期報告
SAM005_IR.indb 43 9/9/2019 17:28

year. The decrease was largely driven by a reduction in professional advisory fees related to the implementation of new accounting standards along with the Group maintaining tight control of its general and administrative costs.
Impairment of Property, Plant and Equipment and Lease Right-of-Use AssetsIn accordance with IAS 36, Impairment of Assets, the Group is required to evaluate its property, plant and equipment and lease right-of-use assets for potential impairment whenever events or changes in circumstance indicate that their carrying amount might not be recoverable. Based on an evaluation of loss-making stores in the six months ended June 30, 2019 and the anticipated closure of some of these stores due to reduced traffic and under-performance, the Group determined that the carrying amounts of certain property, plant and equipment and certain lease right-of-use assets as of June 30, 2019 exceeded their respective recoverable amounts. The Group recognized a non-cash impairment charge totaling US$29.7 million for the first half of 2019, recorded in the Group’s consolidated income statements in the line item “Impairment of property, plant and equipment and lease right-of-use assets”. The US$29.7 million non-cash impairment charge was comprised of the write-off of US$21.0 million of lease right-of-use assets associated with such stores that were recently recognized with the adoption of IFRS 16 and a US$8.7 million impairment for property, plant and equipment of such stores (the “Non-cash Impairment Charge”).
Other ExpensesThe Group recorded net other expenses of US$11.9 million and US$5.5 million for the six months ended June 30, 2019 and June 30, 2018, respectively. Net other expenses for the first half of 2019 included costs related to profit improvement initiatives totaling US$9.8 million, which management believes positions the business for stronger profitability in the second half of 2019 and into 2020. The Group estimates that these initiatives will generate approximately US$14.0 million of savings on an annualized basis. Approximately US$2.0 million of such savings were realized in the six months ended June 30, 2019, and approximately US$9.0 million of such savings are estimated for the full year ending December 31, 2019. Net other expenses for the first half of 2018 included acquisition-related costs of US$1.2 million associated with the continued integration of eBags.
Operating ProfitOperating profit for the six months ended June 30, 2019 decreased by US$44.7 million, or 21.5% (-19.6% constant currency), to US$163.6 million when excluding the Non-cash Impairment Charge and the costs to implement profit improvement initiatives during the six months ended June 30, 2019, compared to US$208.3 million for the same period in the previous year (as recast to adjust for IFRS 16 impacts). Operating profit, as reported, decreased by US$77.8 million, or 38.5% (-36.9% constant currency), year-on-year to US$124.0 million due to the factors discussed above.
Net Finance CostsNet finance costs were US$50.1 million for the six months ended June 30, 2019. For the six months ended June 30, 2018, net finance costs of US$93.2 million included a US$53.3 million write-off of deferred financing costs associated with the Original Senior Credit Facilities (as defined below) in conjunction with the 2018 Refinancing (described in the Indebtedness section below). Excluding the non-cash deferred financing costs write-off, net finance costs were US$56.7 million for the first half of 2018 (as recast to adjust for IFRS 16 impacts - see bridge in the Adjusted EBITDA section below).
20個基點,而開支減少主要由於與實施新會計準則相關的專業諮詢費用減少,加上本集團持續嚴格控制一般及行政成本所致。
物業、廠房及設備和租賃使用權資產減值根據 IAS第36號資產減值,在出現任何顯示可能無法收回賬面值的事件或情況出現變化時,本集團須評估其物業、廠房及設備和租賃使用權資產的潛在減值。基於評估截至2019年6月30日止六個月因顧客流量減少及業績不佳而錄得虧損的店舖及預計關閉部分該等店舖,本集團認為若干物業、廠房及設備和租賃使用權資產於2019年6月30日的賬面值超過各自的可收回金額。本集團確認2019年上半年的非現金減值費用共計29.7百萬美元,入賬至本集團綜合收益表「物業、廠房及設備和租賃使用權資產減值」項目一欄。非現金減值費用29.7百萬美元包括撇銷與該等店舖相關的租賃使用權資產21.0百萬美元(租賃使用權資產因採用 IFRS第16號而於近期確認)及該等店舖的物業、廠房及設備減值8.7百萬美元(「非現金減值費用」)。
其他開支截至2019年6月30日及2018年6月30日止六個月,本集團分別錄得其他開支淨額11.9百萬美元及5.5百萬美元。2019年上半年的其他開支淨額包括實施溢利改善措施的成本共計9.8百萬美元,管理層相信這會加強2019年下半年及2020年業務盈利能力。本集團預計該等措施每年將節省開支約14.0百萬美元,其中約2.0百萬美元於截至2019年6月30日止六個月實現,而約9.0百萬美元預計於截至2019年12月31日止全年實現。2018年上半年的其他開支淨額包括收購相關成本1.2百萬美元,該等收購相關成本與繼續整合eBags相關。
經營溢利經撇除截至2019年6月30日止六個月的非現金減值費用及實施溢利改善措施的成本,截至2019年6月30日止六個月經營溢利較去年同期的208.3百萬美元(就 IFRS第16號的影響作出調整)減少44.7百萬美元或21.5%(按不變匯率基準計算則減少19.6%)至163.6百萬美元。由於上述因素的影響,所呈報的經營溢利按年減少77.8百萬美元或38.5%(按不變匯率基準計算則減少36.9%)至124.0百萬美元。
財務費用淨額截至2019年6月30日止六個月的財務費用淨額為50.1百萬美元。截至2018年6月30日止六個月的財務費用淨額93.2百萬美元包括撇除於2018年再融資(詳情載於下文「負債」一節)的同時所撇銷的與原優先信貸融通(定義見下文)相關的遞延融資成本的非現金費用53.3百萬美元。撇除非現金遞延融資成本撇銷,2018年上半年的財務費用淨額為56.7百萬美元(就IFRS第16號的影響作出調整 — 見下文「經調整EBITDA」一節所載的對賬)。
44
Management Discussion and Analysis 管理層討論與分析
SAM005_IR.indb 44 9/9/2019 17:28

Net finance costs, as reported, decreased by US$43.1 million, or 46.2%, year-on-year to US$50.1 million due to the non-recurrence of the charge to write-off the deferred financing costs during the six months ended June 30, 2018. This decrease was partially offset by the recognition of interest expense attributable to the adoption of IFRS 16 on January 1, 2019 (see further discussion in note 3(b) Changes in Accounting Policies in the Notes to the Consolidated Interim Financial Statements). Interest expense associated with IFRS 16 amounted to US$15.4 million for the six months ended June 30, 2019.
The following table sets forth a breakdown of total finance costs for the six months ended June 30, 2019 and June 30, 2018.
所呈報的財務費用淨額按年減少43.1百萬美元或46.2%至50.1百萬美元,是由於截至2018年6月30日止六個月撇銷遞延融資成本的費用不復再現所致。該減幅部分被2019年1月1日採納IFRS第16號(見「綜合中期財務報表附註」所載附註3(b) 「會計政策的變動」的進一步討論)後確認的利息開支所抵銷。截至2019年6月30日止六個月,與IFRS第16號相關的利息開支為15.4百萬美元。
下表載列截至2019年6月30日及2018年6月30日止六個月的財務費用總額明細。
Six months ended June 30,截至6月30日止六個月
(Expressed in millions of US Dollars) (以百萬美元呈列) 2019 2018
Recognized in income or loss: 於收入或虧損中確認:
Interest income 利息收入 0.9 0.4
Total finance income 財務收入總額 0.9 0.4
Interest expense on loans and borrowings 貸款及借款的利息開支 (33.1) (33.4)
Amortization of deferred financing costs associated with Original Senior Credit Facilities(1)
與原優先信貸融通相關的遞延融資成本攤銷 (1)
– (3.3)
Amortization of deferred financing costs associated with New Senior Credit Facilities(1)
與新優先信貸融通相關的遞延融資成本攤銷 (1)
(1.5) (0.5)
Write-off of remaining deferred financing costs associated with Original Senior Credit Facilities(1)
撇銷與原優先信貸融通相關的餘下遞延融資成本 (1)
– (53.3)
Interest expense on lease liabilities(2) 租賃負債的利息開支 (2) (15.4) –
Change in fair value of put options 認沽期權公允價值變動 1.0 0.9
Net foreign exchange gain (loss) 外匯收益(虧損)淨額 0.1 (2.5)
Other finance costs 其他財務費用 (2.1) (1.5)
Total finance costs 財務費用總額 (51.0) (93.6)
Net finance costs recognized in profit or loss 於損益中確認的財務費用淨額 (50.1) (93.2)
Notes 註釋(1) On April 25, 2018, the Group refinanced its Senior Credit Facilities (described in the Indebtedness section below). 於2018年4月25日,本集團對其優先信貸融通進行再融資(詳情載述下文「負債」一節)。(2) On January 1, 2019, the Group adopted IFRS 16 and applied the modified retrospective approach. Comparative amounts for the six months ended June 30, 2018 have not been
restated (see further discussion in note 3(b) Changes in Accounting Policies in the Notes to the Consolidated Interim Financial Statements). 2019年1月1日,本集團採納 IFRS第16號,並應用經修訂追溯法。截至2018年6月30日止六個月的比較數字並無重列(見「綜合中期財務報表附註」所載附註3(b) 「會計政策的變動」的進一步討論)。
45Samsonite International S.A. Interim Report 2019 新秀麗國際有限公司 2019年中期報告
SAM005_IR.indb 45 9/9/2019 17:29

Profit before Income TaxProfit before income tax for the six months ended June 30, 2019 decreased by US$38.2 million, or 25.2% (-23.7% constant currency), to US$113.5 million when excluding the Non-cash Impairment Charge and the costs to implement profit improvement initiatives during the six months ended June 30, 2019, compared to US$151.7 million for the six months ended June 30, 2018 (as recast to adjust for IFRS 16 impacts) when excluding the non-cash charge of US$53.3 million during the six months ended June 30, 2018 to write-off the deferred financing costs associated with the Original Senior Credit Facilities (as defined below) in conjunction with the 2018 Refinancing (described in the Indebtedness section below). Profit before income tax, as reported, decreased by US$34.7 million, or 31.9% (-30.3% constant currency), year-on-year to US$73.9 million.
Income Tax ExpenseIncome tax expense decreased by US$15.1 million, or 49.3%, to US$15.6 million for the six months ended June 30, 2019 from US$30.7 million for the six months ended June 30, 2018.
The Group’s consolidated effective tax rate for operations was 21.1% and 28.3% for the six months ended June 30, 2019 and June 30, 2018, respectively. For interim reporting purposes, the Group applied the effective tax rate to profit before income tax for the interim period. The reported effective tax rate was calculated using a weighted average income tax rate from those jurisdictions in which the Group is subject to tax, adjusted for permanent book/tax differences, tax incentives, changes in tax reserves and changes in unrecognized deferred tax assets. The effective tax rate for each period was recognized based on management’s best estimate of the weighted average annual income tax rate expected for the full financial year applied to the pre-tax income for the period adjusted for certain discrete items for the period. The decrease in the Group’s effective tax rate during the first half of 2019 was mainly the result of changes in the profit mix between high and low tax jurisdictions, deferred tax benefit recognized on share-based compensation due to changes in the Company’s stock price within the period and a deferred tax benefit recognized due to changes in statutory tax rates in various taxing jurisdictions.
Profit for the PeriodProfit for the period for the six months ended June 30, 2019 decreased by US$19.6 million, or 25.1% (-23.8% constant currency), to US$58.3 million from US$77.9 million. Profit for the period for the six months ended June 30, 2019 decreased by US$22.2 million, or 18.9% (-17.6% constant currency), to US$95.3 million when excluding the Non-cash Impairment Charge and the costs to implement profit improvement initiatives, net of the related tax impact during the six months ended June 30, 2019, compared to US$117.5 million for the same period in the previous year when excluding the non-cash charge of US$53.3 million and the related tax impact during the six months ended June 30, 2018 to write-off the deferred financing costs associated with the Original Senior Credit Facilities (as defined below) in conjunction with the 2018 Refinancing (as described in further detail in the Indebtedness section below).
Profit attributable to the equity holders decreased by US$18.7 million, or 27.5% (-26.0% constant currency), year-on-year to US$49.1 million from US$67.8 million. Profit attributable to the equity holders for the six months ended June 30, 2019 decreased by US$21.3 million, or 19.8% (-18.5% constant currency), to US$86.1 million when excluding the Non-cash Impairment Charge and the costs to
除所得稅前溢利撇除截至2019年6月30日止六個月的非現金減值費用及實施溢利改善措施的成本,截至2019年6月30日止六個月的除所得稅前溢利由截至2018年6月30日止六個月的151.7百萬美元(就 IFRS第16號的影響作出調整,並撇除截至2018年6月30日止六個月於2018年再融資(詳情載述於「負債」一節)的同時所撇銷的與原優先信貸融通(定義見下文)相關的遞延融資成本的非現金費用53.3百萬美元)減少38.2百萬美元或25.2%(按不變匯率基準計算則減少23.7%)至113.5百萬美元。所呈報的除所得稅前溢利按年減少34.7百萬美元或31.9%(按不變匯率基準計算則減少30.3%)至73.9百萬美元。
所得稅開支所得稅開支由截至2018年6月30日止六個月的30.7百萬美元減少15.1百萬美元或49.3%至截至2019年6月30日止六個月的15.6百萬美元。
截至2019年6月30日及2018年6月30日止六個月,本集團業務的綜合實際稅率分別為21.1%及28.3%。就中期呈報而言,本集團計算中期期間除所得稅前溢利時應用實際稅率。所呈報的實際稅率按本集團應繳納稅項的司法權區之加權平均所得稅率計算,並就永久性賬面/稅務差異、稅項優惠、稅務儲備變動及未確認遞延稅項資產變動作出調整。各期間的實際稅率是基於管理層對預期整個財政年度的年度加權平均所得稅率的最佳估計,應用於期內除稅前收入並就期內若干個別項目作出調整而確認。本集團2019年上半年的實際稅率下降主要因高稅收司法權區與低稅收司法權區之間的溢利組合變動、因期內本公司股價變動就以股份支付的薪酬確認的遞延稅項抵免以及因各稅收司法權區的法定稅率變動確認的遞延稅項抵免所致。
期內溢利截至2019年6月30日止六個月的期內溢利由77.9百萬美元減少19.6百萬美元或25.1%(按不變匯率基準計算則減少23.8%)至58.3百萬美元。經撇除截至2019年6月30日止六個月的非現金減值費用及實施溢利改善措施的成本及相關稅務影響,截至2019年6月30日止六個月的期內溢利由去年同期的117.5百萬美元(撇除截至2018年6月30日止六個月於2018年再融資(詳情載述於下文「負債」一節)的同時所撇銷的與原優先信貸融通(定義見下文)相關的遞延融資成本的非現金費用53.3百萬美元及相關稅務影響)減少22.2百萬美元或18.9%(按不變匯率基準計算則減少17.6%)至95.3百萬美元。
股權持有人應佔溢利由67.8百萬美元按年減少18.7百萬美元或27.5%(按不變匯率基準計算則減少26.0%)至49.1百萬美元。經撇除截至2019年6月30日止六個月的非現金減值費用及實施溢利改善措施的成本及相關稅務影響,截至2019年6月30日止六個月的股權持有
46
Management Discussion and Analysis 管理層討論與分析
SAM005_IR.indb 46 9/9/2019 17:29
implement profit improvement initiatives, net of the related tax impact during the six months ended June 30, 2019, compared to US$107.4 million for the six months ended June 30, 2018 when excluding the non-cash charge of US$53.3 million and the related tax impact during the six months ended June 30, 2018 to write-off the deferred financing costs associated with the Original Senior Credit Facilities (as defined below) in conjunction with the 2018 Refinancing (as described in further detail in the Indebtedness section below).
Basic earnings per share (“Basic EPS”) decreased by 27.8% to US$0.034 for the six months ended June 30, 2019 from US$0.048 for the six months ended June 30, 2018. Diluted earnings per share (“Diluted EPS”) decreased by 27.2% to US$0.034 for the six months ended June 30, 2019 from US$0.047 for the six months ended June 30, 2018. The weighted average number of shares utilized in the Basic EPS calculation was 1,430,979,185 shares for the six months ended June 30, 2019 compared to 1,424,906,028 shares for the six months ended June 30, 2018. The weighted average number of shares outstanding utilized in the Diluted EPS calculation was 1,433,665,934 shares for the six months ended June 30, 2019 compared to 1,440,368,049 shares for the six months ended June 30, 2018.
Basic EPS, as adjusted, decreased by 20.2% to US$0.060 for the six months ended June 30, 2019 when excluding the Non-cash Impairment Charge and the costs to implement profit improvement initiatives, net of the related tax impact during the six months ended June 30, 2019, compared to US$0.075 for the same period in the previous year. Diluted EPS, as adjusted, decreased by 19.4% to US$0.060 for the six months ended June 30, 2019 when excluding the same charges and costs as noted above, compared to US$0.075 for the same period in the previous year. Basic EPS, as adjusted, and Diluted EPS, as adjusted, for the six months ended June 30, 2018 exclude the non-cash charge of US$53.3 million and the related tax impact to write-off the deferred financing costs associated with the Original Senior Credit Facilities (as defined below) in conjunction with the 2018 Refinancing (as described in further detail in the Indebtedness section below).
Profit for the Period with June 30, 2018 Recast for IFRS 16 ImpactsProfit for the period for the six months ended June 30, 2019 decreased by US$14.7 million, or 13.4% (-12.1% constant currency), to US$95.3 million when excluding the Non-cash Impairment Charge and the costs to implement profit improvement initiatives, net of the related tax impact during the six months ended June 30, 2019, compared to US$110.0 million for the same period in the previous year (as recast to adjust for IFRS 16 impacts) when excluding the non-cash charge of US$53.3 million and the related tax impact during the six months ended June 30, 2018 to write-off the deferred financing costs associated with the Original Senior Credit Facilities (as defined below) in conjunction with the 2018 Refinancing (as described in further detail in the Indebtedness section below).
人應佔溢利較截至2018年6月30日止六個月的107.4百萬美元(撇除截至2018年6月30日止六個月於2018年再融資(詳情載述於下文「負債」一節)的同時所撇銷的與原優先信貸融通(定義見下文)相關的遞延融資成本的非現金費用53.3百萬美元及相關稅務影響)減少21.3百萬美元或19.8%(按不變匯率基準計算則減少18.5%)至86.1百萬美元。
每股基本盈利由截至2018年6月30日止六個月的0.048美元減少27.8%至截至2019年6月30日止六個月的0.034美元。每股攤薄盈利由截至2018年6月30日止六個月的0.047美元減少27.2%至截至2019年6月30日止六個月的0.034美元。截至2019年6月30日止六個月,用於計算每股基本盈利的加權平均股數為1,430,979,185股股份,而截至2018年6月30日止六個月則為1,424,906,028股股份。截至2019年6月30日止六個月,用於計算每股攤薄盈利的發行在外加權平均股數為1,433,665,934股股份,而截至2018年6月30日止六個月則為1,440,368,049股股份。
經撇除截至2019年6月30日止六個月的非現金減值費用及實施溢利改善措施的成本及相關稅務影響,經調整每股基本盈利由去年同期的0.075美元減少20.2%至截至2019年6月30日止六個月的0.060美元。經撇除上述相同費用及成本,截至2019年6月30日止六個月的經調整每股攤薄盈利由去年同期的0.075美元減少19.4%至0.060美元。截至2018年6月30日止六個月的經調整每股基本盈利及經調整每股攤薄盈利撇除於2018年再融資(詳情載述於下文「負債」一節)的同時所撇銷的與原優先信貸融通(定義見下文)相關的遞延融資成本的非現金費用53.3百萬美元及相關稅務影響。
2018年6月30日期內溢利就 IFRS第16號的影響作出調整經撇除截至2019年6月30日止六個月的非現金減值費用及實施溢利改善措施的成本及相關稅務影響,截至2019年6月30日止六個月的期內溢利較去年同期的110.0百萬美元(就 IFRS第16號的影響作出調整,並撇除截至2018年6月30日止六個月於2018年再融資(詳情載述於下文「負債」一節)的同時撇銷與原優先信貸融通(定義見下文)相關的遞延融資成本的非現金費用53.3百萬美元及相關稅務影響)減少14.7百萬美元或13.4%(按不變匯率基準計算則減少12.1%)至95.3百萬美元。
47Samsonite International S.A. Interim Report 2019 新秀麗國際有限公司 2019年中期報告
SAM005_IR.indb 47 9/9/2019 17:29
Profit attributable to the equity holders for the six months ended June 30, 2019 decreased by US$13.8 million, or 13.9% (-12.4% constant currency), to US$86.1 million when excluding the Non-cash Impairment Charge and the costs to implement profit improvement initiatives, net of the related tax impact during the six months ended June 30, 2019, compared to US$99.9 million for the six months ended June 30, 2018 (as recast to adjust for IFRS 16 impacts) when excluding the non-cash charge of US$53.3 million and the related tax impact during the six months ended June 30, 2018 to write-off the deferred financing costs associated with the Original Senior Credit Facilities (as defined below) in conjunction with the 2018 Refinancing (as described in further detail in the Indebtedness section below).
Basic EPS, as adjusted, decreased by 14.2% to US$0.060 for the six months ended June 30, 2019 when excluding the Non-cash Impairment Charge and the costs to implement profit improvement initiatives, net of the related tax impact during the six months ended June 30, 2019, compared to US$0.070 for the same period in the previous year. Diluted EPS, as adjusted, decreased by 13.4% to US$0.060 for the six months ended June 30, 2019 when excluding the same charges and costs as noted above, compared to US$0.069 for the same period in the previous year. Basic EPS, as adjusted, and Diluted EPS, as adjusted, for the six months ended June 30, 2018 have been recast to adjust for IFRS 16 impacts and exclude the non-cash charge of US$53.3 million and the related tax impact to write-off the deferred financing costs associated with the Original Senior Credit Facilities (as defined below) in conjunction with the 2018 Refinancing (as described in further detail in the Indebtedness section below).
Adjusted EBITDAAdjusted earnings before interest, taxes, depreciation and amortization (“Adjusted EBITDA”), a non-IFRS measure, decreased by US$63.3 million, or 22.9% (-20.0% constant currency), to US$213.5 million for the six months ended June 30, 2019 from US$276.8 million for the same period in the previous year when including interest and amortization charges associated with the capitalization of leases under IFRS 16. Adjusted EBITDA margin decreased by 280 basis points to 12.2% from 15.0% due largely to the decrease in net sales and the effect of investments in the DTC distribution channel, particularly in connection with bricks-and-mortar retail stores that were opened in 2017 and 2018.
As the Group’s business began to stabilize during the second quarter of 2019, Adjusted EBITDA decreased by US$25.1 million, or 16.3% (-13.5% constant currency), compared to the same period in the previous year when including the interest and amortization charges associated with the capitalization of leases under IFRS 16. Adjusted EBITDA improved from the US$38.2 million, or 31.1% (-28.1% constant currency) decrease, for the first quarter of 2019. Adjusted EBITDA margin improved to 13.9% for the second quarter of 2019 from 10.2% for the first quarter of 2019. The profit improvement initiatives undertaken by management are expected to further improve the Group’s profitability in the second half of the year and beyond.
Adjusted EBITDA with June 30, 2018 Recast for IFRS 16 Impacts
Adjusted EBITDA decreased by US$51.5 million, or 19.4% (-16.4% constant currency), to US$213.5 million for the six months ended June 30, 2019 from US$265.0 million for the six months ended June 30, 2018 (as recast below to adjust for IFRS 16 impacts) when including the interest and amortization charges associated with the capitalization of leases under IFRS 16. Adjusted EBITDA margin (on the same basis) decreased by 210 basis points to 12.2% from 14.3% due to the same reasons noted above. See the reconciliation of profit for the period to Adjusted EBITDA below for the Group’s results excluding certain costs and charges and other non-cash charges that impacted reported profit for the period.
經撇除截至2019年6月30日止六個月的非現金減值費用及實施溢利改善措施的成本及相關稅務影響,截至2019年6月30日止六個月的股權持有人應佔溢利較2018年6月30日止六個月的99.9百萬美元(就IFRS第16號的影響作出調整,並撇除截至2018年6月30日止六個月於2018年再融資(詳情載述於下文「負債」一節)的同時撇銷與原優先信貸融通(定義見下文)相關的遞延融資成本的非現金費用53.3百萬美元及相關稅務影響)減少13.8百萬美元或13.9%(按不變匯率基準計算則減少12.4%)至86.1百萬美元。
經撇除截至2019年6月30日止六個月的非現金減值費用及實施溢利改善措施的成本及相關稅務影響,經調整每股基本盈利由去年同期的0.070美元減少14.2%至截至2019年6月30日止六個月的0.060美元。經撇除上述相同費用及成本,經調整每股攤薄盈利由去年同期的0.069美元減少13.4%至截至2019年6月30日止六個月的0.060美元。截至2018年6月30日止六個月的經調整每股基本盈利及經調整每股攤薄盈利已就IFRS第16號的影響作出調整,撇除於2018年再融資(詳情載述於下文「負債」一節)的同時所撇銷的與原優先信貸融通(定義見下文)相關的遞延融資成本的非現金費用53.3百萬美元及相關稅務影響。
經調整EBITDA倘計及根據 IFRS第16號進行的租賃資本化相關利息及攤銷費用,截至2019年6月30日止六個月的未計利息、稅項、折舊及攤銷前的經調整盈利(「經調整EBITDA」,一項非 IFRS財務計量工具)較去年同期的276.8百萬美元減少63.3百萬美元或22.9%(按不變匯率基準計算則減少20.0%)至213.5百萬美元。經調整EBITDA利潤率由15.0%下降280個基點至12.2%,主要因銷售淨額減少及投資於DTC分銷渠道(尤其是2017年及2018年增設實體零售店)的影響所致。
由於本集團業務於2019年第二季度開始穩定,倘計及根據 IFRS第16號進行的租賃資本化相關利息及攤銷費用,經調整EBITDA較去年同期減少25.1百萬美元或16.3%(按不變匯率基準計算則減少13.5%)。經調整EBITDA較2019年第一季度減少38.2百萬美元或31.1%(按不變匯率基準計算則減少28.1%)好轉。經調整EBITDA利潤率由2019年第一季度的10.2%上升至2019年第二季度的13.9%。預期管理層所實施的溢利改善措施將進一步提升本集團下半年及日後的盈利能力。
2018年6月30日經調整EBITDA就 IFRS第16號的影響作出調整倘計及根據 IFRS第16號進行的租賃資本化相關利息及攤銷費用,截至2019年6月30日止六個月的經調整EBITDA較截至2018年6月30日止六個月的265.0百萬美元(就 IFRS第16號的影響作出調整)減少51.5百萬美元或19.4%(按不變匯率基準計算則減少16.4%)至213.5百萬美元。經調整EBITDA利潤率(按相同基準)由14.3%下降210個基點至12.2%,因上述相同原因所致。有關本集團業績(當中經撇除可對呈報的期內溢利構成影響的若干成本及費用以及其他非現金費用),請參閱下文期內溢利與經調整EBITDA的對賬。
48
Management Discussion and Analysis 管理層討論與分析
SAM005_IR.indb 48 9/9/2019 17:29

As the Group’s business began to stabilize during the second quarter of 2019, Adjusted EBITDA decreased by US$19.2 million, or 13.0% (-10.1% constant currency), compared to the same period in the previous year (as recast to adjust for IFRS 16 impacts) when including the interest and amortization charges associated with the capitalization of leases under IFRS 16. Adjusted EBITDA (on the same basis) improved from the US$32.3 million, or 27.6% (-24.4% constant currency) decrease, for the first quarter of 2019.
The following table presents a bridge of the six months ended June 30, 2018 reported Adjusted EBITDA results to an adjusted EBITDA on a comparable basis, which reflects management’s best estimate based on its evaluation of the impact:
Six months ended June 30, 2018截至2018年6月30日止六個月
(Expressed in millions of US Dollars) (以百萬美元呈列)Reported所呈報
IFRS 16 Adjustments
IFRS第16號調整
As adjusted for IFRS 16
就 IFRS第16號 作出調整
Profit for the period 期內溢利 77.9 (7.4) 70.4
Plus (Minus): 加(減)︰
Income tax expense 所得稅開支 30.7 (2.7) 28.0
Finance costs, excluding interest expense on lease liabilities
財務費用 (不包括租賃負債的利息開支) 93.6 – 93.6
Interest expense on lease liabilities 租賃負債的利息開支 – 16.7 16.7
Finance income 財務收入 (0.4) – (0.4)
Depreciation 折舊 44.0 – 44.0
Amortization of lease right-of-use assets 租賃使用權資產攤銷 – 93.2 93.2
Amortization of intangible assets 無形資產攤銷 17.0 (1.6) 15.4
EBITDA EBITDA 262.8 98.1 360.9
Plus: 加︰
Share-based compensation expense 以股份支付的薪酬開支 8.6 – 8.6
Other adjustments 其他調整 5.5 – 5.5
Adjusted EBITDA, excluding lease interest and amortization
經調整EBITDA (不包括租賃利息及攤銷) 276.8 98.1 374.9
Amortization of lease right-of-use assets 租賃使用權資產攤銷 – (93.2) (93.2)
Interest expense on lease liabilities 租賃負債的利息開支 – (16.7) (16.7)
Adjusted EBITDA, including lease interest and amortization
經調整EBITDA (包括租賃利息及攤銷) 276.8 (11.8) 265.0
由於本集團業務於2019年第二季度開始穩定,倘計及根據 IFRS第16號進行的租賃資本化相關利息及攤銷費用,經調整EBITDA較去年同期(就 IFRS第16號的影響作出調整)減少19.2百萬美元或13.0%(按不變匯率基準計算則減少10.1%)。經調整EBITDA(按相同基準)較2019年第一季度減少32.3百萬美元或27.6%(按不變匯率基準計算則減少24.4%)好轉。
下表呈列截至2018年6月30日止六個月所呈報的經調整EBITDA業績與按比較基準經調整EBITDA(基於管理層對相關影響之評估所得出的最佳估計)之間的對賬︰
49Samsonite International S.A. Interim Report 2019 新秀麗國際有限公司 2019年中期報告
06_SAM005_IR19_MD&A (2)_AW.indd 49 9/9/2019 17:46
Management has updated its Adjusted EBITDA presentation due to the adoption of IFRS 16. The following table presents the reconciliation from the Group’s profit for the period to Adjusted EBITDA for the six months ended June 30, 2019 and June 30, 2018 (as adjusted for IFRS 16):
Six months ended June 30,截至6月30日止六個月
2019 2018
(Expressed in millions of US Dollars) (以百萬美元呈列)
As adjusted for IFRS 16
就 IFRS第16號 作出調整
Profit for the period 期內溢利 58.3 70.4
Plus (Minus): 加(減)︰
Income tax expense 所得稅開支 15.6 28.0
Finance costs(1) 財務費用 (1) 51.0 110.4
Finance income 財務收入 (0.9) (0.4)
Depreciation 折舊 40.1 44.0
Total amortization 攤銷總額 115.6 108.6
EBITDA EBITDA 279.7 360.9
Plus: 加︰
Share-based compensation expense 以股份支付的薪酬開支 7.0 8.6
Impairment of lease right-of-use assets 租賃使用權資產減值 21.0 –
Impairment of property, plant and equipment 物業、廠房及設備減值 8.7 –
Other adjustments(2) 其他調整 (2) 11.9 5.5
Adjusted EBITDA, excluding lease interest and amortization
經調整EBITDA(不包括租賃利息及攤銷)328.3 374.9
Amortization of lease right-of-use assets 租賃使用權資產攤銷 (99.5) (93.2)
Interest expense on lease liabilities 租賃負債的利息開支 (15.4) (16.7)
Adjusted EBITDA, including lease interest and amortization(3)
經調整EBITDA(包括租賃利息及攤銷)(3)
213.5 265.0
Adjusted EBITDA percentage change 經調整EBITDA百分比增減 (19.4)%
Adjusted EBITDA percentage change, constant currency basis
經調整EBITDA百分比增減,按不變匯率基準計算(16.4)%
Adjusted EBITDA margin 經調整EBITDA利潤率 12.2% 14.3%
採納 I F R S 第 1 6 號令管理層重新呈報經調整EBITDA。下表載列截至2019年6月30日及2018年6月30日止六個月本集團期內溢利與經調整EBITDA的對賬(就 IFRS第16號作出調整):
Notes 註釋(1) Includes the non-cash charge of US$53.3 million for the six months ended June 30, 2018 to write-off the deferred financing costs associated with the Original Senior Credit
Facilities (as defined below) in conjunction with the 2018 Refinancing (see Indebtedness section below for further discussion). 包括截至2018年6月30日止六個月於2018年再融資(見下文「負債」一節的進一步討論)的同時所撇銷的與原優先信貸融通(定義見下文)相關的遞延融資成本的非現金費用
53.3百萬美元。(2) Other adjustments primarily comprised ’Other expenses’ per the Consolidated Interim Income Statements. 其他調整主要包括綜合中期收益表中的「其他開支」。(3) Adjusted EBITDA, a non-IFRS measure, eliminates the effect of a number of costs, charges and credits and certain other non-cash charges. Adjusted EBITDA includes the
lease interest and amortization expense as a result of the Group’s adoption of IFRS 16 on January 1, 2019 (see further discussion in note 3(b) Changes in Accounting Policies in the Notes to the Consolidated Interim Financial Statements). The inclusion of IFRS 16 lease interest and amortization expense in Adjusted EBITDA allows the non-IFRS measure to be more comparable with the previous period’s Adjusted EBITDA disclosure.
經調整EBITDA為非 IFRS財務計量工具,其撇除多項成本、費用及貸項以及若干其他非現金費用的影響。由於2019年1月1日本集團採納 IFRS第16號,因此經調整EBITDA計入租賃利息及攤銷開支(見「綜合中期財務報表附註」所載附註3(b) 「會計政策的變動」的進一步討論)。將 IFRS第16號的租賃利息及攤銷開支計入經調整EBITDA,令此非 IFRS財務計量工具與過往期間所披露的經調整EBITDA更具可比較性。
50
Management Discussion and Analysis 管理層討論與分析
SAM005_IR.indb 50 9/9/2019 17:29

The following tables present reconciliations from profit (loss) for the period to Adjusted EBITDA on a regional basis for the six months ended June 30, 2019 and June 30, 2018 (as adjusted for IFRS 16):
Six months ended June 30, 2019截至2019年6月30日止六個月
(Expressed in millions of US Dollars) (以百萬美元呈列)
North America北美洲
Asia亞洲
Europe歐洲
Latin America拉丁美洲
Corporate企業
Total合計
Profit (loss) for the period 期內溢利(虧損) (14.1) 40.0 0.3 (5.4) 37.5 58.3
Plus (Minus): 加(減): Income tax expense (benefit) 所得稅開支(抵免) (5.6) 15.2 (2.2) (0.4) 8.6 15.6
Finance costs(1) 財務費用 (1) 8.5 3.5 4.3 1.6 33.1 51.0
Finance income 財務收入 (0.1) (0.3) (0.1) 0.0 (0.4) (0.9)
Depreciation 折舊 13.9 11.9 11.2 2.6 0.5 40.1
Total amortization 攤銷總額 40.8 37.5 28.7 7.7 0.8 115.6
EBITDA EBITDA 43.4 107.9 42.2 6.1 80.0 279.7
Plus (Minus): 加(減): Share-based compensation expense
以股份支付的薪酬 開支 2.8 0.9 0.2 0.0 3.1 7.0
Impairment of lease right-of-use assets
租賃使用權資產減值14.8 1.0 5.3 – – 21.0
Impairment of property, plant and equipment
物業、廠房及設備 減值 6.1 0.1 2.5 – – 8.7
Other adjustments(2) 其他調整 (2) 52.2 52.5 14.3 2.0 (109.0) 11.9
Adjusted EBITDA, excluding lease interest and amortization
經調整EBITDA (不包括租賃利息及 攤銷) 119.3 162.4 64.5 8.1 (26.0) 328.3
Amortization of lease right-of-use assets
租賃使用權資產攤銷(35.0) (29.9) (26.6) (7.7) (0.2) (99.5)
Interest expense on lease liabilities
租賃負債的利息開支(8.4) (2.1) (3.6) (1.2) (0.2) (15.4)
Adjusted EBITDA, including lease interest and amortization(3)
經調整EBITDA(包括 租賃利息及攤銷)(3)
75.9 130.4 34.3 (0.8) (26.3) 213.5
Adjusted EBITDA percentage change
經調整EBITDA百分比 增減 (24.5)% (6.2)% (30.5)% (116.4)% (8.0)% (19.4)%
Adjusted EBITDA percentage change, constant currency basis
經調整EBITDA百分比 增減,按不變匯率 基準計算 (24.3)% (2.6)% (25.7)% (107.8)% (8.0)% (16.4)%
Adjusted EBITDA margin 經調整EBITDA利潤率 11.6% 20.3% 9.2% (0.9)% nm 12.2%
Notes 註釋(1) Finance costs primarily include interest expense on loans and borrowings, interest expense on lease liabilities attributable to the adoption of IFRS 16 on January 1, 2019,
amortization of deferred financing costs, change in the fair value of put options and unrealized (gains) losses on foreign exchange that are presented on a net basis. See breakdown in note 18 to the Consolidated Interim Financial Statements.
財務費用主要包括按淨額基準呈列的貸款及借款的利息開支、於2019年1月1日採納 IFRS第16號產生的租賃負債的利息開支、遞延融資成本攤銷、認沽期權之公允價值變動及未變現外匯(收益)虧損。有關費用明細請參閱綜合中期財務報表附註18。
(2) Other adjustments primarily comprised ’Other expenses’ per the Consolidated Interim Income Statements. Regional results include intra-group royalty income/expense. 其他調整主要包括綜合中期收益表中的「其他開支」。地區業績包括集團內部的專利收入/開支。(3) Adjusted EBITDA, a non-IFRS measure, eliminates the effect of a number of costs, charges and credits and certain other non-cash charges. Adjusted EBITDA includes the
lease interest and amortization expense as a result of the Group’s adoption of IFRS 16 on January 1, 2019 (see further discussion in note 3(b) Changes in Accounting Policies in the Notes to the Consolidated Interim Financial Statements). The inclusion of IFRS 16 lease interest and amortization expense in Adjusted EBITDA allows the non-IFRS measure to be more comparable with the previous period’s Adjusted EBITDA disclosure.
經調整EBITDA為非 IFRS財務計量工具,其撇除多項成本、費用及貸項以及若干其他非現金費用的影響。由於2019年1月1日本集團採納 IFRS第16號,因此經調整EBITDA計入租賃利息及攤銷開支(見「綜合中期財務報表附註」所載附註3(b) 「會計政策的變動」的進一步討論)。將 IFRS第16號的租賃利息及攤銷開支計入經調整EBITDA,令此非 IFRS財務計量工具與過往期間所披露的經調整EBITDA更具可比較性。
nm Not meaningful. 無意義。
下表載列截至2019年6月30日及2018年6月30日止六個月(就 IFRS第16號作出調整)按地區基準呈列的期內溢利(虧損)與經調整EBITDA的對賬:
51Samsonite International S.A. Interim Report 2019 新秀麗國際有限公司 2019年中期報告
SAM005_IR.indb 51 9/9/2019 17:29

Six months ended June 30, 2018截至2018年6月30日止六個月
As adjusted for IFRS 16就 IFRS第16號作出調整
(Expressed in millions of US Dollars) (以百萬美元呈列)
North America
北美洲Asia亞洲
Europe歐洲
Latin America
拉丁美洲Corporate
企業Total合計
Profit (loss) for the period 期內溢利(虧損) 17.9 43.8 11.9 (1.9) (1.2) 70.4
Plus (Minus): 加(減): Income tax expense (benefit) 所得稅開支(抵免) 7.8 17.5 6.2 0.4 (4.0) 28.0
Finance costs(1) 財務費用 (1) 8.9 5.1 8.3 2.6 85.5 110.4
Finance income 財務收入 0.0 (0.3) (0.1) 0.0 0.0 (0.4)
Depreciation 折舊 15.8 12.1 12.4 3.0 0.6 44.0
Total amortization 攤銷總額 39.4 34.4 27.4 6.7 0.6 108.6
EBITDA EBITDA 89.8 112.7 66.1 10.8 81.5 360.9
Plus (Minus): 加(減): Share-based compensation expense
以股份支付的薪酬 開支 2.9 1.0 0.2 0.1 4.5 8.6
Other adjustments(2) 其他調整 (2) 50.2 54.9 12.5 2.3 (114.4) 5.5
Adjusted EBITDA, excluding lease interest and amortization
經調整EBITDA(不包 括租賃利息及攤銷) 142.9 168.6 78.8 13.2 (28.5) 374.9
Amortization of lease right-of-use assets
租賃使用權資產攤銷(33.7) (27.2) (25.0) (7.2) (0.1) (93.2)
Interest expense on lease liabilities
租賃負債的利息開支(8.7) (2.4) (4.4) (1.2) 0.0 (16.7)
Adjusted EBITDA, including lease interest and amortization(3)
經調整EBITDA(包括 租賃利息及攤銷)(3) 100.5 139.0 49.3 4.8 (28.6) 265.0
Adjusted EBITDA margin 經調整EBITDA利潤率 14.5% 20.8% 12.5% 5.3% nm 14.3%
Notes註釋(1) Finance costs primarily include interest expense on loans and borrowings, amortization of deferred financing costs including the non-cash charge of US$53.3 million to write-
off the deferred financing costs associated with the Original Senior Credit Facilities (as defined below) in conjunction with the 2018 Refinancing (see Indebtedness section below for further discussion), change in the fair value of put options and unrealized (gains) losses on foreign exchange that are presented on a net basis. See breakdown in note 18 to the Consolidated Interim Financial Statements.
財務費用主要包括按淨額基準呈列的貸款及借款的利息開支、遞延融資成本攤銷(包括於2018年再融資(見下文「負債」一節進一步討論)的同時所撇銷的與原優先信貸融通(定義見下文)相關的遞延融資成本的非現金費用53.3百萬美元)、認沽期權之公允價值變動及未變現外匯(收益)虧損。有關費用明細請參閱綜合中期財務報表附註18。
(2) Other adjustments primarily comprised ’Other expenses’ per the Consolidated Interim Income Statements. Regional results include intra-group royalty income/expense. 其他調整主要包括綜合中期收益表中的「其他開支」。地區業績包括集團內部的專利收入/開支。(3) Adjusted EBITDA, a non-IFRS measure, eliminates the effect of a number of costs, charges and credits and certain other non-cash charges. Adjusted EBITDA includes the
lease interest and amortization expense as a result of the Group’s adoption of IFRS 16 on January 1, 2019 (see further discussion in note 3(b) Changes in Accounting Policies in the Notes to the Consolidated Interim Financial Statements). The inclusion of IFRS 16 lease interest and amortization expense in Adjusted EBITDA allows the non-IFRS measure to be more comparable with the previous period’s Adjusted EBITDA disclosure.
經調整EBITDA為非 IFRS財務計量工具,其撇除多項成本、費用及貸項以及若干其他非現金費用的影響。由於2019年1月1日本集團採納 IFRS第16號,因此經調整EBITDA計入租賃利息及攤銷開支(見「綜合中期財務報表附註」所載附註3(b) 「會計政策的變動」的進一步討論)。將 IFRS第16號的租賃利息及攤銷開支計入經調整EBITDA,令此非 IFRS財務計量工具與過往期間所披露的經調整EBITDA更具可比較性。
nm Not meaningful. 無意義。
52
Management Discussion and Analysis 管理層討論與分析
SAM005_IR.indb 52 9/9/2019 17:29

The Group has presented EBITDA, Adjusted EBITDA (both including and excluding IFRS 16 lease interest and amortization) and Adjusted EBITDA margin because it believes that, when viewed with its results of operations as prepared in accordance with IFRS and with the reconciliation to profit for the period, these measures provide additional information that is useful in gaining a more complete understanding of its operational performance and of the trends impacting its business. EBITDA, Adjusted EBITDA (both including and excluding IFRS 16 lease interest and amortization) and Adjusted EBITDA margin are important metrics the Group uses to evaluate its operating performance and cash generation.
EBITDA, Adjusted EBITDA (both including and excluding IFRS 16 lease interest and amortization) and Adjusted EBITDA margin are non-IFRS financial measures and as calculated herein may not be comparable to similarly named measures used by other companies and should not be considered comparable to profit for the period in the Group’s Consolidated Interim Income Statements. These measures have limitations as an analytical tool and should not be considered in isolation from, or as a substitute for, an analysis of the Group’s results of operations as reported under IFRS.
Adjusted Net IncomeAdjusted Net Income, a non-IFRS measure, decreased by US$22.7 million, or 19.0% (-17.7% constant currency), to US$97.0 million for the six months ended June 30, 2019 from US$119.8 million for the same period in the previous year.
As the Group’s business began to stabilize during the second quarter of 2019, Adjusted Net Income increased by US$0.1 million, or 0.1% (+2.0% constant currency), compared to the same period in the previous year. Adjusted Net Income improved from the US$22.8 million, or 45.5% (-45.0% constant currency) decrease, for the first quarter of 2019. The profit improvement initiatives undertaken by management are expected to further improve the Group’s profitability in the second half of the year and beyond.
Adjusted Basic EPS and Adjusted Diluted EPS, non-IFRS measures, were US$0.068 and US$0.068, respectively, for the six months ended June 30, 2019, compared to the Adjusted Basic EPS and Adjusted Diluted EPS of US$0.084 and US$0.083, respectively, for the six months ended June 30, 2018. Adjusted Basic EPS and Adjusted Diluted EPS are calculated by dividing Adjusted Net Income by the weighted average number of shares used in the Basic EPS and Diluted EPS calculations, respectively.
Adjusted Net Income with June 30, 2018 Recast for IFRS 16 Impacts
Adjusted Net Income decreased by US$14.2 million, or 12.8% (-11.3% constant currency), to US$97.0 million for the six months ended June 30, 2019 from US$111.2 million for the six months ended June 30, 2018 (as recast below to adjust for IFRS 16 impacts). See the reconciliation of profit for the period to Adjusted Net Income below for the Group’s results excluding certain costs and charges and other non-cash charges that impacted reported profit for the period.
As the Group’s business began to stabilize during the second quarter of 2019, Adjusted Net Income increased by US$4.2 million, or 6.4% (+8.5% constant currency), compared to the same period in the previous year (as recast to adjust for IFRS 16 impacts). Adjusted Net Income (on the same basis) improved from the US$18.4 million, or 40.3% (-39.7% constant currency) decrease, for the first quarter of 2019.
本集團呈列EBITDA、經調整EBITDA(涵蓋計入及不計入 IFRS第16號租賃利息及攤銷的經調整EBITDA)及經調整EBITDA利潤率因其相信,當檢視其經營業績(根據 IFRS編製)及與期內溢利進行對賬時,該等計量工具會提供更多資訊,有利於更全面了解其經營表現及影響其業務的趨勢。EBITDA、經調整EBITDA(涵蓋計入及不計入 IFRS第16號租賃利息及攤銷的經調整EBITDA)及經調整EBITDA利潤率是本集團用於評估其經營表現及賺取現金能力的一項重要量度標準。
本文所計算的EBITDA、經調整EBITDA(涵蓋計入及不計入 IFRS第 16號租賃利息及攤銷的經調整EBITDA)及經調整EBITDA利潤率為非 IFRS財務計量工具,未必可與其他公司所使用類似命名的計量工具進行比較,且不應被視為可與本集團綜合中期收益表中期內溢利比較。該等計量工具作為分析工具有其局限性,不應被視為獨立於或代替本集團根據 IFRS所呈報的經營業績的分析。
經調整淨收入經調整淨收入(一項非 IFRS財務計量工具)由去年同期的119.8百萬美元減少22.7百萬美元或19.0%(按不變匯率基準計算則減少17.7%)至截至2019年6月30日止六個月的97.0百萬美元。
由於本集團業務於2019年第二季度開始穩定,經調整淨收入較去年同期增加0.1百萬美元或0.1%(按不變匯率基準計算則增加2.0%)。經調整淨收入較2019年第一季度減少22.8百萬美元或45.5%(按不變匯率基準計算則減少45.0%)好轉。預期管理層所實施的溢利改善措施將進一步提升本集團下半年及日後的盈利能力。
截至 2019年 6月 30日止六個月的經調整每股基本盈利及經調整每股攤薄盈利(兩項皆為非 IFRS財務計量工具)分別為0.068美元及0.068美元,而截至2018年6月30日止六個月則分別為0.084美元及0.083美元。經調整每股基本盈利及經調整每股攤薄盈利是以經調整凈收入分別除以每股基本盈利及每股攤薄盈利計算所用的加權平均股份數目計算得出。
2018年6月30日經調整淨收入就 IFRS第16號的影響作出調整經調整淨收入由截至2018年6月30日止六個月的111.2百萬美元(如下文所述就IFRS第16號的影響作出調整)減少14.2百萬美元或12.8%(按不變匯率基準計算則減少11.3%)至截至2019年6月30日止六個月的97.0百萬美元。有關本集團業績(當中已撇除可對呈報的期內溢利構成影響的若干成本及費用以及其他非現金費用),請參閱下文期內溢利與經調整淨收入的對賬。
由於本集團業務於2019年第二季度開始穩定,經調整淨收入較去年同期(就 IFRS第16號的影響作出調整)增加4.2百萬美元或6.4%(按不變匯率基準計算則增加8.5%)。經調整淨收入(按相同基準)較2019年第一季度減少18.4百萬美元或40.3%(按不變匯率基準計算則減少39.7%)好轉。
53Samsonite International S.A. Interim Report 2019 新秀麗國際有限公司 2019年中期報告
SAM005_IR.indb 53 9/9/2019 17:29
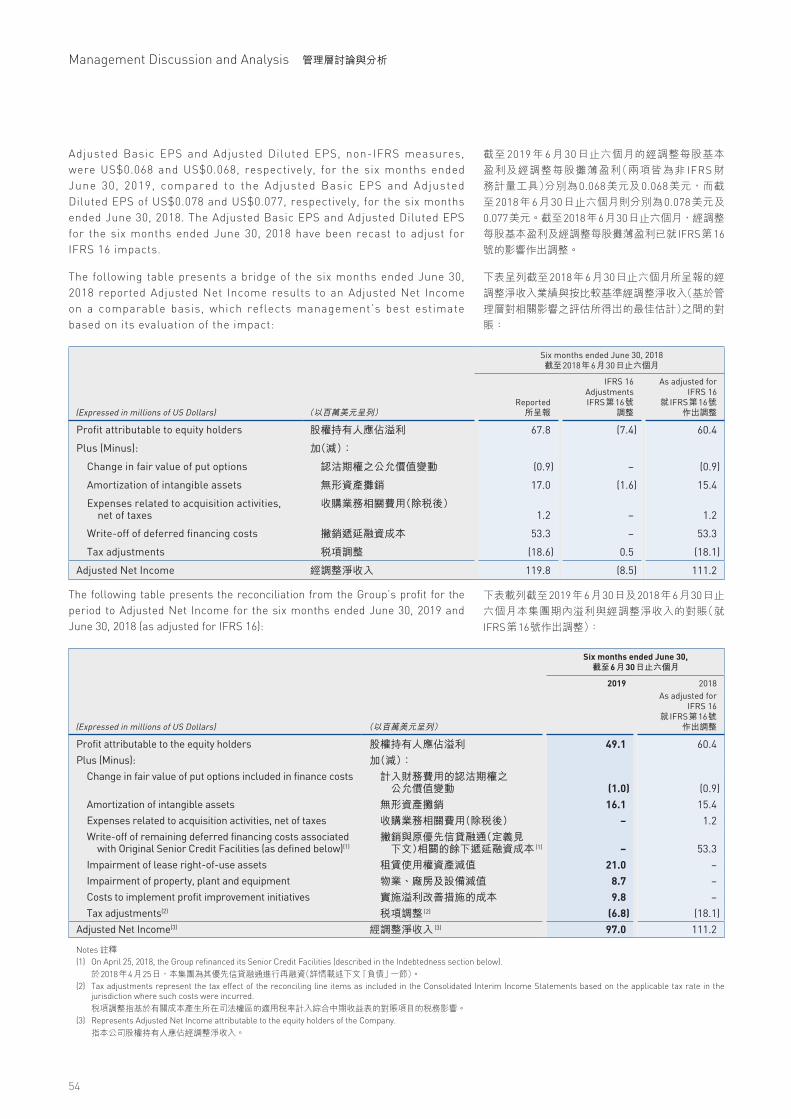
截至 2019年 6月 30日止六個月的經調整每股基本盈利及經調整每股攤薄盈利(兩項皆為非 IFRS財務計量工具)分別為0.068美元及0.068美元,而截至2018年6月30日止六個月則分別為0.078美元及0.077美元。截至2018年6月30日止六個月,經調整每股基本盈利及經調整每股攤薄盈利已就 IFRS第16號的影響作出調整。
下表呈列截至2018年6月30日止六個月所呈報的經調整淨收入業績與按比較基準經調整淨收入(基於管理層對相關影響之評估所得出的最佳估計)之間的對賬:
Adjusted Basic EPS and Adjusted Diluted EPS, non-IFRS measures, were US$0.068 and US$0.068, respectively, for the six months ended June 30, 2019, compared to the Adjusted Basic EPS and Adjusted Diluted EPS of US$0.078 and US$0.077, respectively, for the six months ended June 30, 2018. The Adjusted Basic EPS and Adjusted Diluted EPS for the six months ended June 30, 2018 have been recast to adjust for IFRS 16 impacts.
The following table presents a bridge of the six months ended June 30, 2018 reported Adjusted Net Income results to an Adjusted Net Income on a comparable basis, which reflects management’s best estimate based on its evaluation of the impact:
Six months ended June 30, 2018截至2018年6月30日止六個月
(Expressed in millions of US Dollars) (以百萬美元呈列)Reported
所呈報
IFRS 16 Adjustments IFRS第16號
調整
As adjusted for IFRS 16
就 IFRS第16號作出調整
Profit attributable to equity holders 股權持有人應佔溢利 67.8 (7.4) 60.4
Plus (Minus): 加(減):
Change in fair value of put options 認沽期權之公允價值變動 (0.9) – (0.9)
Amortization of intangible assets 無形資產攤銷 17.0 (1.6) 15.4
Expenses related to acquisition activities, net of taxes
收購業務相關費用(除稅後)1.2 – 1.2
Write-off of deferred financing costs 撇銷遞延融資成本 53.3 – 53.3
Tax adjustments 稅項調整 (18.6) 0.5 (18.1)
Adjusted Net Income 經調整淨收入 119.8 (8.5) 111.2
The following table presents the reconciliation from the Group’s profit for the period to Adjusted Net Income for the six months ended June 30, 2019 and June 30, 2018 (as adjusted for IFRS 16):
Six months ended June 30,截至6月30日止六個月
2019 2018
(Expressed in millions of US Dollars) (以百萬美元呈列)
As adjusted for IFRS 16
就 IFRS第16號 作出調整
Profit attributable to the equity holders 股權持有人應佔溢利 49.1 60.4Plus (Minus): 加(減): Change in fair value of put options included in finance costs 計入財務費用的認沽期權之
公允價值變動 (1.0) (0.9) Amortization of intangible assets 無形資產攤銷 16.1 15.4 Expenses related to acquisition activities, net of taxes 收購業務相關費用(除稅後) – 1.2 Write-off of remaining deferred financing costs associated with Original Senior Credit Facilities (as defined below)(1)
撇銷與原優先信貸融通(定義見 下文)相關的餘下遞延融資成本 (1) – 53.3
Impairment of lease right-of-use assets 租賃使用權資產減值 21.0 – Impairment of property, plant and equipment 物業、廠房及設備減值 8.7 – Costs to implement profit improvement initiatives 實施溢利改善措施的成本 9.8 – Tax adjustments(2) 稅項調整 (2) (6.8) (18.1)Adjusted Net Income(3) 經調整淨收入 (3) 97.0 111.2
下表載列截至2019年6月30日及2018年6月30日止六個月本集團期內溢利與經調整淨收入的對賬(就IFRS第16號作出調整):
Notes 註釋(1) On April 25, 2018, the Group refinanced its Senior Credit Facilities (described in the Indebtedness section below). 於2018年4月25日,本集團為其優先信貸融通進行再融資(詳情載述下文「負債」一節)。(2) Tax adjustments represent the tax effect of the reconciling line items as included in the Consolidated Interim Income Statements based on the applicable tax rate in the
jurisdiction where such costs were incurred. 稅項調整指基於有關成本產生所在司法權區的適用稅率計入綜合中期收益表的對賬項目的稅務影響。(3) Represents Adjusted Net Income attributable to the equity holders of the Company. 指本公司股權持有人應佔經調整淨收入。
54
Management Discussion and Analysis 管理層討論與分析
SAM005_IR.indb 54 9/9/2019 17:29

The Group has presented Adjusted Net Income, Adjusted Basic EPS and Adjusted Diluted EPS because it believes these measures help to give securities analysts, investors and other interested parties a better understanding of the Group’s underlying financial performance. By presenting Adjusted Net Income and the related Adjusted EPS calculations, the Group eliminates the effect of a number of costs, charges and credits and certain other non-cash charges, along with their respective tax effects, that impact reported profit for the period.
Adjusted Net Income, Adjusted Basic EPS and Adjusted Diluted EPS are non-IFRS financial measures, and as calculated herein may not be comparable to similarly named measures used by other companies and should not be considered comparable to profit for the period or EPS presented in the Group’s Consolidated Interim Income Statements. Adjusted Net Income and the related Adjusted EPS calculations have limitations as an analytical tool and should not be considered in isolation from, or as a substitute for, an analysis of the Group’s results of operations as reported under IFRS.
Liquidity and Capital ResourcesThe primary objectives of the Company’s capital management policies are to safeguard its ability to continue as a going concern, to provide returns for the Company’s shareholders, and to fund capital expenditures, normal operating expenses, working capital needs and the payment of obligations. The Group’s primary sources of liquidity are its cash flows from operating activities, invested cash, available lines of credit and, subject to shareholder approval, the Company’s ability to issue additional shares. The Company believes that its existing cash and estimated cash flows, along with current working capital, will be adequate to meet the operating and capital requirements of the Group for at least the next twelve months.
Net cash flows generated from operating activities amounted to US$192.6 million for the six months ended June 30, 2019 compared to US$56.2 million for the six months ended June 30, 2018. The increase in cash flows generated from operating activities was primarily attributable to classification changes following the adoption of IFRS 16 and a reduction of cash used for working capital. Excluding the impacts from IFRS 16, operating cash flow was US$113.0 million, reflecting a US$56.8 million increase from the same period in the previous year.
For the six months ended June 30, 2019, net cash flows used in investing activities were US$32.7 million and were primarily related to capital expenditures for property, plant and equipment. For the six months ended June 30, 2018, net cash flows used in investing activities were US$50.1 million and primarily related to capital expenditures for property, plant and equipment. The Group had capital expenditures of US$26.0 million during the six months ended June 30, 2019 compared to US$41.1 million during the first half of 2018. During the first half of 2019, the Group strategically added new retail locations, remodeled existing retail locations and made investments in machinery and equipment.
Net cash flows used in financing activities were US$98.4 million for the six months ended June 30, 2019 and were largely attributable to principal payments on lease liabilities of US$79.5 million (which were included in operating activities for the first half of 2018), payments of New Term Loan Facilities (as defined below) totaling US$14.2 million and dividend payments to non-controlling interests of US$9.1 million, partly offset by proceeds from other current loans and borrowings of US$4.2 million. Net cash flows generated from financing activities were US$45.0 million for the six months ended June 30, 2018 and were largely attributable to proceeds of US$1,922.9 million associated with the 2018 Refinancing (described in the Indebtedness section below) and proceeds from share option exercises of US$24.3 million, partially offset by cash flows used in financing activities of US$1,869.7 million to pay off the Original
本集團呈列經調整淨收入、經調整每股基本盈利及經調整每股攤薄盈利,因其相信此等計量工具有助證券分析員、投資者及其他相關利益團體更了解本集團的相關財務表現。呈列經調整淨收入及有關經調整每股基本盈利計算時,本集團撇除影響呈報的期內溢利的多項成本、費用及貸項以及若干其他非現金費用(連同其各自的稅務影響)的影響。
本文所計算的經調整淨收入、經調整每股基本盈利及經調整每股攤薄盈利為非 IFRS財務計量工具,未必可與其他公司所使用類似命名的計量工具進行比較,且不應被視為可與本集團綜合中期收益表呈列的期內溢利或每股盈利比較。經調整淨收入及有關經調整每股基本盈利計算作為一項分析工具有其局限性,不應被視為獨立於或代替本集團根據 IFRS所呈報的經營業績的分析。
流動資金及資本資源本公司資本管理政策主要目標為保持其繼續持續經營能力,為本公司股東帶來回報,並為資本開支、一般營運開支、營運資金需要及支付債務提供資金。本集團流動資金主要來源為經營活動之現金流量、投資現金、可用信貸額及本公司發行額外股份(惟須待股東批准後方可作實)的能力。本公司相信,其現有現金及估計現金流量,加上流動營運資金,將足以應付本集團未來最少十二個月的營運及資本需求。
截至2019年6月30日止六個月,經營活動所得現金流量淨額192.6百萬美元,而截至2018年6月30日止六個月則為56.2百萬美元。經營活動所得現金流量增加主要歸因於採用 IFRS第16號後分類發生變動及營運資金所用現金減少。撇除 IFRS第16號的影響,經營活動之現金流量為113.0百萬美元,較去年同期增加56.8百萬美元。
截至 2019年 6月 30日止六個月,投資活動所用現金流量淨額為32.7百萬美元,主要與物業、廠房及設備的資本開支有關。截至2018年6月30日止六個月,投資活動所用現金流量淨額為50.1百萬美元,主要與物業、廠房及設備的資本開支有關。本集團於截至2019年6月30日止六個月的資本開支為26.0百萬美元,而於2018年上半年則為41.1百萬美元。於2019年上半年,本集團策略性地增設新零售點、翻新現有零售點及投資於機器及設備。
截至 2019年 6月 30日止六個月,融資活動所用現金流量淨額為98.4百萬美元,主要由於租賃負債的本金付款79.5百萬美元(計入2018年上半年經營活動)、支付新定期貸款融通(定義見下文)合共14.2百萬美元及向非控股權益派付股息9.1百萬美元所致,部分被其他即期貸款及借款所得款項4.2百萬美元所抵銷。截至2018年6月30日止六個月,融資活動所得現金流量淨額為45.0百萬美元,主要由於與2018年再融資(於下文「負債」一節載述)相關的所得款項1,922.9百萬美元及行使購股權所得款項24.3百萬美元所致,部分被融資活動所用現金流量1,869.7百
55Samsonite International S.A. Interim Report 2019 新秀麗國際有限公司 2019年中期報告
SAM005_IR.indb 55 9/9/2019 17:29

Senior Credit Facilities (described in the Indebtedness section below) associated with the 2018 Refinancing and dividend payments to non-controlling interests of US$9.7 million. In conjunction with the Refinancing, the Group paid US$18.5 million in deferred financing costs that will be recognized over the term of the borrowings.
The Group had US$489.3 million in cash and cash equivalents as of June 30, 2019, compared to US$427.7 million as of December 31, 2018. No cash and cash equivalents were restricted as of June 30, 2019 and December 31, 2018. Cash and cash equivalents are generally denominated in the functional currency of the respective Group entity.
IndebtednessThe following table sets forth the carrying amount of the Group’s loans and borrowings as of June 30, 2019 and December 31, 2018:
(Expressed in millions of US Dollars) (以百萬美元呈列)June 30, 2019
2019年6月30日December 31, 2018
2018年12月31日
New Term Loan A Facility 新A定期貸款融通 807.3 817.7
New Term Loan B Facility 新B定期貸款融通 658.4 661.7
New Revolving Credit Facility 新循環信貸融通 22.7 22.9
Total Senior Credit Facilities 優先信貸融通總額 1,488.4 1,502.3
Senior Notes 優先票據 398.0 401.5
Other long-term debt 其他長期債務 2.1 2.3
Other lines of credit 其他信貸額 33.6 29.5
Capital lease obligations 資本租賃承擔 – 0.3
Total loans and borrowings 貸款及借款總額 1,922.1 1,935.8
Less deferred financing costs 減遞延融資成本 (14.9) (16.4)
Total loans and borrowings less deferred financing costs 貸款及借款總額減遞延融資成本 1,907.2 1,919.4
In 2018, the Group refinanced its Senior Credit Facilities through the issuance of €350.0 Million 3.500% Senior Notes due 2026 and by amending and restating its Senior Credit Facilities (the “2018 Refinancing”).
€350.0 Million 3.500% Senior Notes Due 2026
On April 25, 2018 (the “Issue Date”), Samsonite Finco S.à r.l., a wholly-owned, indirect subsidiary of the Company (the “Issuer”), issued €350.0 million aggregate principal amount of its 3.500% senior notes due 2026 (the “Senior Notes”). The Senior Notes were issued at par pursuant to an Indenture, dated April 25, 2018, among Samsonite Finco S.à r.l., the Company and certain of its direct or indirect wholly-owned subsidiaries (the “Indenture”).
On the Issue Date, the gross proceeds from the issuance of the Senior Notes were used, together with the gross proceeds from drawings under the New Senior Credit Facilities (as defined below) and existing cash on hand, to (i) refinance the Original Senior Credit Facilities (as defined below) and (ii) pay certain commissions, fees and expenses in connection thereto.
Maturity, Interest and Redemption
The Senior Notes will mature on May 15, 2026. Interest on the aggregate outstanding principal amount of the Senior Notes accrues at a fixed rate of 3.500% per annum, payable semi-annually in cash in arrears on May 15 and November 15 each year.
萬美元以償還2018年再融資相關的原優先信貸融通(於下文「負債」一節載述)及向非控股權益派付股息9.7百萬美元所抵銷。進行再融資的同時,本集團支付18.5百萬美元遞延融資成本,將於借款期內確認。
於2019年6月30日,本集團的現金及現金等價物為489.3百萬美元,而於2018年12月31日則為427.7百萬美元。於2019年6月30日及2018年12月31日,概無任何現金及現金等價物受到限制。現金及現金等價物一般以本集團實體各自的功能貨幣計值。
負債下表載列本集團於2019年6月30日及2018年12月31日的貸款及借款的賬面值:
2018年,本集團透過發行於2026年到期的350.0百萬歐元年利率3.500%之優先票據及修訂與重述的優先信貸融通為優先信貸融通再融資(「2018年再融資」)。
於2026年到期的350.0百萬歐元年利率3.500%之優先票據於2018年4月25日(「發行日」),本公司間接持有的全資附屬公司Samsonite Finco S.à r.l.(「發行人」)發行於2026年到期本金總額為350.0百萬歐元年利率3.500%之優先票據(「優先票據」)。優先票據是根據Samsonite Finco S.à r.l.、本公司及其若干直接或間接全資附屬公司於2018年4月25日訂立的契約(「契約」)按面值發行。
於發行日,發行優先票據的所得款項總額連同新優先信貸融通(定義見下文)下支取的所得款項總額及現有的手頭現金已用於 (i)為原優先信貸融通(定義見下文)進行再融資以及 (ii)支付與再融資相關的若干佣金、費用及開支。
到期日、利息及贖回優先票據將於2026年5月15日到期。優先票據的發行在外本金總額按固定年利率3.500%計息,每半年以現金支付一次,於每年5月15日及11月15日到期支付。
56
Management Discussion and Analysis 管理層討論與分析
SAM005_IR.indb 56 9/9/2019 17:29

At any time prior to May 15, 2021, the Issuer may redeem some or all of the Senior Notes at a price equal to 100% of the principal amount of the Senior Notes redeemed plus accrued and unpaid interest to (but excluding) the redemption date at a “make-whole” premium, which is the present value of all remaining scheduled interest payments to the redemption date using the discount rate (as specified in the Indenture) as of the redemption date plus 50 basis points.
On or after May 15, 2021, the Issuer may redeem all, or from time to time a part, of the Senior Notes at the following redemption prices (expressed as a percentage of the principal amount) plus accrued and unpaid interest and additional amounts, if any, to the applicable redemption date (subject to the right of holders of record on the relevant record date to receive interest due on the relevant interest payment date), if redeemed during the twelve-month period commencing on May 15 of the years set forth below:
Year年度 Redemption Price贖回價
2021年 101.750%
2022年 100.875%
2023 and thereafter 2023年及其後 100.000%
In addition, at any time prior to May 15, 2021, the Issuer may redeem up to 40% of the Senior Notes with the net proceeds of one or more specified equity offerings at a redemption price of 103.500% of the principal amount of the Senior Notes redeemed, plus accrued and unpaid interest and additional amounts, if any, to the date of redemption. Furthermore, in the event of certain events defined as constituting a change of control, the Issuer may be required to make an offer to purchase the Senior Notes.
Guarantee and Security
The Senior Notes are guaranteed by the Guarantors on a senior subordinated basis. The Senior Notes are secured by a second-ranking pledge over the shares of the Issuer and a second-ranking pledge over the Issuer’s rights in the proceeds loan in respect of the proceeds of the offering of the Senior Notes (the “Shared Collateral”). The Shared Collateral also secures the New Senior Credit Facilities (as defined below) on a first-ranking basis.
Certain Covenants and Events of Default
The Indenture contains a number of customary negative covenants that, among other things and subject to certain exceptions, may restrict the ability of the Company and its restricted subsidiaries (including the Issuer) to: (i) incur or guarantee additional indebtedness, (ii) make investments or other restricted payments, (iii) create liens, (iv) sell assets and subsidiary stock, (v) pay dividends or make other distributions or repurchase or redeem the capital stock or subordinated debt of the Company or its restricted subsidiaries, (vi) engage in certain transactions with affiliates, (vii) enter into agreements that restrict the payment of dividends by subsidiaries or the repayment of intercompany loans and advances, (viii) engage in mergers or consolidations and (ix) impair the security interests in the Shared Collateral. The Indenture also contains certain customary provisions relating to events of default.
Amended and Restated Senior Credit Facilities AgreementOn May 13, 2016, an indirect wholly-owned subsidiary of the Company entered into a credit and guaranty agreement (the “Original Senior Credit Facilities Agreement”) with certain lenders and financial institutions. The Original
於2021年5月15日之前的任何時候,發行人可以贖回部分或全部優先票據,贖回價等於所贖回優先票據本金額的100%加截至(但不包括)贖回日按「提前贖回」溢價計算的應計及未付利息,「提前贖回」溢價即使用截至贖回日的貼現率(契約中所指明者)加50個基點計算的截至贖回日的全部餘下預定利息付款的現值。
倘贖回於自以下所列年度的5月15日開始的十二個月期間內發生,則於2021年5月15日或之後,發行人可按下列贖回價(以本金額的百分比表示)加截至適用贖回日的應計及未付利息及其他款項(如有)贖回全部或不時贖回部分優先票據(受限於有關記錄日期的登記持有人於有關利息支付日期收取到期利息的權利):
此外,於2021年5月15日之前的任何時候,發行人可使用一項或多項特定股權發售的所得款項淨額贖回最多40%的優先票據,贖回價為所贖回優先票據本金額的103.500%加截至贖回日的應計及未付利息及其他款項(如有)。而且,倘若發生若干被界定為構成控制權變更的事件,則發行人可能須發出要約以收購優先票據。
擔保及抵押優先票據由擔保人以優先次級方式提供擔保。優先票據已就發行人的股份作出二級質押,以及就發行人在所得款項貸款(涉及發售優先票據的所得款項)中的權利作出二級質押,作為抵押(「分擔抵押品」)。分擔抵押品亦按一級方式為新優先信貸融通(定義見下文)提供抵押。
若干契諾及違約事件契約包含多個可限制本公司及其受限制附屬公司(包括發行人)從事(其中包括)下述事項的能力的慣常負面契諾(若干例外情況除外):(i)舉借或擔保額外負債;(ii)作出投資或其他受限制支付;(iii)設置留置權;(iv)出售資產及附屬股權;(v)派付股息或作出其他分配,或者回購或贖回本公司或其受限制附屬公司的股本或次級債務;(vi)與關聯方進行若干交易;(vii)訂立限制附屬公司派付股息或限制償付公司間貸款和放款的協議;(viii)進行合併或整合;及 (ix)削減分擔抵押品中的抵押權益。契約亦包含關於違約事件的若干慣常規定。
經修訂及重述的優先信貸融通協議於 2016年 5月 13日,本公司間接持有的全資附屬公司與若干貸款人及財務機構訂立信貸及擔保協議(「原優先信貸融通協議」)。原優先信貸融通協議訂
57Samsonite International S.A. Interim Report 2019 新秀麗國際有限公司 2019年中期報告
SAM005_IR.indb 57 9/9/2019 17:29

Senior Credit Facilities Agreement provided for (1) a US$1,250.0 million senior secured term loan A facility (the “Original Term Loan A Facility”), (2) a US$675.0 million senior secured term loan B facility (the “Original Term Loan B Facility” and, together with the Original Term Loan A Facility, the “Original Term Loan Facilities”) and (3) a US$500.0 million revolving credit facility (the “Original Revolving Credit Facility,” and, together with the Original Term Loan Facilities, the “Original Senior Credit Facilities”).
In conjunction with the Senior Notes offering, on April 25, 2018, the Company and certain of its direct and indirect wholly-owned subsidiaries entered into an amended and restated credit and guaranty agreement (the “Credit Agreement”) with certain lenders and financial institutions. The Credit Agreement provides for (1) a new US$828.0 million senior secured term loan A facility (the “New Term Loan A Facility”), (2) a new US$665.0 million senior secured term loan B facility (the “New Term Loan B Facility” and, together with the New Term Loan A Facility, the “New Term Loan Credit Facilities”) and (3) a new US$650.0 million revolving credit facility (the “New Revolving Credit Facility,” and, together with the New Term Loan Credit Facilities, the “New Senior Credit Facilities”).
On the Closing Date (see below), the gross proceeds from drawings under the New Senior Credit Facilities were used, together with the gross proceeds from the offering of the Senior Notes and existing cash on hand, to (i) repay in full the Original Senior Credit Facilities and (ii) pay certain commissions, fees and expenses in connection thereto.
Interest Rate and Fees
Interest on the borrowings under the New Term Loan Credit Facilities and the New Revolving Credit Facility began to accrue on April 25, 2018 when the closing on the New Senior Credit Facilities occurred (the “Closing Date”). Under the terms of the New Senior Credit Facilities:
(a) in respect of the New Term Loan A Facility and the New Revolving Credit Facility, the interest rate payable was set with effect from the Closing Date until the delivery of the financial statements for the fiscal quarter ended September 30, 2018 at the London Interbank Offered Rate (“LIBOR”) plus 1.50% per annum (or a base rate plus 0.50% per annum) and thereafter is based on the lower rate derived from either the first lien net leverage ratio of the Company and its restricted subsidiaries at the end of each fiscal quarter or the Company’s corporate ratings. The interest rate payable on the Original Term Loan A Facility and Original Revolving Credit Facility was an adjusted rate of LIBOR plus 2.00% per annum; and
(b) in respect of the New Term Loan B Facility, the interest rate payable was set with effect from the Closing Date at LIBOR plus 1.75% per annum with a LIBOR floor of 0.00% (or a base rate plus 0.75% per annum). The interest rate payable on the Original Term Loan B Facility was an adjusted rate of LIBOR plus 2.25% per annum with a LIBOR floor of 0.00%.
In addition to paying interest on outstanding principal under the New Senior Credit Facilities, the borrowers pay customary agency fees and a commitment fee in respect of the unutilized commitments under the New Revolving Credit Facility. The commitment fee payable with effect from the Closing Date until the delivery of the financial statements for the fiscal quarter ended September 30, 2018 was 0.20% per annum. The commitment fee payable thereafter is based on the lower rate derived from either the first lien net leverage ratio of the Company and its restricted subsidiaries at the end of each fiscal quarter or the Company’s corporate ratings, as applicable.
立 (1)一筆為數1,250.0百萬美元的優先有抵押A定期貸款融通(「原A定期貸款融通」)、(2)一筆為數675.0百萬美元的優先有抵押B定期貸款融通(「原B定期貸款融通」,連同原A定期貸款融通統稱「原定期貸款融通」)及 (3)一筆為數500.0百萬美元的循環信貸融通(「原循環信貸融通」,連同原定期貸款融通統稱「原優先信貸融通」)。
發售優先票據的同時,於2018年4月25日,本公司及其若干直接與間接持有的全資附屬公司與若干貸款人及財務機構訂立經修訂及重述的信貸及擔保協議(「信貸協議」)。信貸協議訂立 (1)一筆為數828.0百萬美元的新優先有抵押A定期貸款融通(「新A定期貸款融通」)、(2)一筆為數665.0百萬美元的新優先有抵押B定期貸款融通(「新B定期貸款融通」,連同新A定期貸款融通統稱「新定期貸款信貸融通」)及(3)一筆為數650.0百萬美元的新循環信貸融通(「新循環信貸融通」,連同新定期貸款信貸融通統稱「新優先信貸融通」)。
於完成日(見下文),新優先信貸融通下支取的所得款項總額連同發售優先票據的所得款項總額及現有的手頭現金已用於 (i)悉數償還原優先信貸融通以及 (ii)支付與此相關的若干佣金、費用及開支。
利率及費用新定期貸款信貸融通及新循環信貸融通項下的借款利息於2018年4月25日(「完成日」)新優先信貸融通完成起開始累計。根據新優先信貸融通的條款:
(a)就新A定期貸款融通及新循環信貸融通而言,自完成日起直至截至2018年9月30日止財政季度的財務報表交付時為止,應付利率定為倫敦銀行同業拆息(「LIBOR」)另加年利率1.50%(或基準利率另加年利率0.50%),其後以下述兩項中產生之較低利率為依據:本公司及其受限制附屬公司於各財政季度末的第一留置權淨槓桿比率,或本公司的企業評級。原A定期貸款融通及原循環信貸融通的應付利率為經調整利率LIBOR另加年利率2.00%;及
(b)就新B定期貸款融通而言,自完成日起,應付利率定為LIBOR(LIBOR下限為0.00%)另加年利率1.75%(或基準利率另加年利率0.75%)。原B定期貸款融通的應付利率為經調整利率LIBOR(LIBOR下限為0.00%)另加年利率2.25%。
除支付新優先信貸融通項下的未償還本金的利息外,借款人須就新循環信貸融通項下的未動用承諾金額支付慣常代理費及承諾費。自完成日起直至截至2018年9月30日止財政季度的財務報表交付時為止,應付承諾費為每年0.20%。其後交付的承諾費基於下述兩項中產生之較低利率:本公司及其受限制附屬公司於各財政季度末的第一留置權淨槓桿比率,或本公司的企業評級(倘適用)。
58
Management Discussion and Analysis 管理層討論與分析
SAM005_IR.indb 58 9/9/2019 17:29

Amortization and Final Maturity
The New Term Loan A Facility requires scheduled quarterly payments commencing on the first full fiscal quarter ended after the Closing Date, with an annual amortization of 2.5% of the original principal amount of the loans under the New Term Loan A Facility made during each of the first and second years, with a step-up to 5.0% annual amortization during each of the third and fourth years and 7.5% annual amortization during the fifth year, with the balance due and payable on the fifth anniversary of the Closing Date. The New Term Loan B Facility requires scheduled quarterly payments commencing on the quarter ended September 30, 2018, each equal to 0.25% of the original principal amount of the loans under the New Term Loan B Facility, with the balance due and payable on the seventh anniversary of the Closing Date. There is no scheduled amortization of the principal amounts of the loans outstanding under the New Revolving Credit Facility. Any principal amount outstanding under the New Revolving Credit Facility is due and payable on the fifth anniversary of the Closing Date.
Guarantees and Security
The obligations of the borrowers under the New Senior Credit Facilities are unconditionally guaranteed by the Company and certain of the Company’s existing direct or indirect wholly-owned material restricted subsidiaries, and are required to be guaranteed by certain future direct or indirect wholly-owned material restricted subsidiaries organized in the jurisdictions of Luxembourg, Belgium, Canada, Hong Kong, Hungary, Mexico and the United States (the “Credit Facility Guarantors”). All obligations under the New Senior Credit Facilities, and the guarantees of those obligations, are secured, subject to certain exceptions, by substantially all of the assets of the borrowers and the Credit Facility Guarantors (including the Shared Collateral).
Certain Covenants and Events of Default
The New Senior Credit Facilities contain a number of customary negative covenants that, among other things and subject to certain exceptions, may restrict the ability of the Company and its restricted subsidiaries to: (i) incur additional indebtedness; (ii) pay dividends or distributions on its capital stock or redeem, repurchase or retire its capital stock or its other indebtedness; (iii) make investments, loans and acquisitions; (iv) engage in transactions with its affiliates; (v) sell assets, including capital stock of its subsidiaries; (vi) consolidate or merge; (vii) materially alter the business it conducts; (viii) incur liens; and (ix) prepay or amend any junior debt or subordinated debt.
In addition, the Credit Agreement requires the Company and its subsidiaries to meet certain quarterly financial covenants. Commencing with the fiscal quarter ended September 30, 2018, the Company and its subsidiaries are required to maintain (i) a pro forma total net leverage ratio of not greater than 5.50:1.00, which ratio will decrease to 5.25:1.00 for test periods ending in 2020, 5.00:1.00 for test periods ending in 2021 and 4.50:1.00 for test periods ending in 2022; provided that such maximum pro forma total net leverage ratio is subject to a step up of 0.50x from the otherwise applicable ratio, up to a pro forma total net leverage ratio not to exceed 6.00:1.00 for the six fiscal quarter period following the fiscal quarter in which a permitted acquisition has been consummated, and (ii) a pro forma interest consolidated cash interest coverage ratio of not less than 3.00:1.00 (collectively, the “Financial Covenants”). The Financial Covenants only apply for the benefit of the lenders under the New Term Loan A Facility and the lenders under the New Revolving Facility. The Credit Agreement also contains certain customary representations and warranties, affirmative covenants and provisions relating to events of default (including upon a change of control). The Group was in compliance with the financial covenants as of June 30, 2019.
攤銷及最後到期日新A定期貸款融通規定預定季度付款於截至完成日後首個完整財政季度開始,並於第一及第二年各年就新A定期貸款融通項下貸款的原來本金額作出2.5%的年度攤銷,於第三及第四年各年上調至5.0%的年度攤銷及第五年上調至7.5%的年度攤銷,而餘額將於完成日第五個週年到期及須予支付。新B定期貸款融通規定預定季度付款於截至2018年9月30日止季度開始,每次付款等於新B定期貸款融通項下貸款的原來本金額的0.25%,而餘額將於完成日第七個週年到期及須予支付。新循環信貸融通項下未償還貸款的本金額概無預定攤銷。任何新循環信貸融通項下未償還本金額將於完成日第五個週年到期及須予支付。
擔保及抵押借款人於新優先信貸融通項下的債項由本公司及本公司若干現時直接或間接持有的受限制重大全資附屬公司無條件作出擔保,並須由於盧森堡、比利時、加拿大、香港、匈牙利、墨西哥及美國的司法權區成立的若干未來直接或間接持有的受限制重大全資附屬公司(「信貸融通擔保人」)作出擔保。所有新優先信貸融通項下的債項以及該等債項的擔保,均以借款人及信貸融通擔保人的絕大部分資產(包括分擔抵押品)作抵押(若干例外情況除外)。
若干契諾及違約事件新優先信貸融通包含多個可限制本公司及其受限制附屬公司進行(其中包括)以下事項的能力的慣常負面契諾(若干例外情況除外):(i)產生額外負債;(ii)就其股本支付股息或作出分派或贖回、回購或償付其股本或其他負債;(iii)作出投資、貸款及收購;(iv)與其聯屬公司進行交易;(v)出售資產(包括其附屬公司的股本);(vi)整合或合併;(vii)重大改變其現行業務;(viii)設立留置權;及 (ix)預先支付或修訂任何次級債務或後償債務。
此外,信貸協議規定本公司及其附屬公司須達成若干季度財務契諾。自截至 2018年 9月 30日止財政季度起,本公司及其附屬公司須維持 (i)不高於5.50:1.00的備考總淨槓桿比率(該比率將於截至2020年的測試期間下調至5.25:1.00,截至2021年的測試期間下調至5.00:1.00及截至2022年的測試期間下調至4.50:1.00;惟該最高備考總淨槓桿比率於准許收購完成的財政季度後的六個財政季度期間將由另行適用的比率上調0.50倍至最高不超過6.00:1.00的備考總淨槓桿比率),及 (ii)不低於3.00:1.00的備考合併現金利息保障比率(統稱為「財務契諾」)。財務契諾僅適用於新A定期貸款融通下貸款人及新循環融通下貸款人的權益。信貸協議亦包含有關違約事件(包括控制權變更)的若干慣常聲明及保證、肯定性契諾及條文。截至2019年6月30日,本集團符合財務契諾。
59Samsonite International S.A. Interim Report 2019 新秀麗國際有限公司 2019年中期報告
SAM005_IR.indb 59 9/9/2019 17:29
Interest Rate Swaps
The Group maintains interest rate swaps to hedge interest rate exposure under the floating-rate New Senior Credit Facilities by swapping certain US Dollar floating-rate bank borrowings with fixed-rate agreements. The interest rate swap agreements entered into in connection with the Original Senior Credit Facilities remained in effect following the 2018 Refinancing and will terminate on August 31, 2021. The notional amounts of the interest rate swap agreements decrease over time. LIBOR has been fixed at approximately 1.30% under each agreement. Each of the interest rate swap agreements have fixed payments due monthly that commenced January 31, 2017. The interest rate swap transactions qualify as cash flow hedges. As of June 30, 2019 and December 31, 2018, the interest rate swaps were marked-to-market, resulting in a net asset position to the Group in the amount of US$6.5 million and US$25.5 million, respectively, which was recorded as an asset with the effective portion of the gain (loss) deferred to other comprehensive income.
Cross-currency Swaps
In April 2019, the Group entered into cross-currency swaps which have been designated as net investment hedges. The hedges consist of a US$50.0 million notional loan amount between the Euro and US Dollar and a US$25.0 million notional loan amount between the Japanese Yen and US Dollar. The Group is benefitting from the interest rate spread between the two markets to receive fixed interest income over the five-year contractual period. As of June 30, 2019, the cross-currency swaps qualified as net investment hedges and the monthly mark-to-market is recorded to other comprehensive income. As of June 30, 2019, the cross-currency swaps were marked-to-market, resulting in a net liability position to the Group in the amount of US$1.9 million, which was recorded as a liability with the effective portion of the gain (loss) deferred to other comprehensive income.
Deferred Financing Costs
During the six months ended June 30, 2018, the Group incurred US$18.5 million of deferred financing costs related to the 2018 Refinancing. Such costs were deferred and offset against loans and borrowings and are being amortized using the effective interest method over the life of the Senior Notes and New Senior Credit Facilities. The amortization of deferred financing costs under the Senior Notes and New Senior Credit Facilities, which is included in interest expense, amounted to US$1.5 million and US$0.5 million for the six months ended June 30, 2019 and June 30, 2018, respectively. Prior to the 2018 Refinancing, amortization of deferred financing costs under the Original Senior Credit Facilities, which were extinguished in April 2018, amounted to US$3.3 million for the six months ended June 30, 2018.
Upon extinguishment of the Original Senior Credit Facilities, the Group recognized a non-cash charge of US$53.3 million for the six months ended June 30, 2018 to write-off the remaining balance of the previously existing deferred financing costs related to the Original Senior Credit Facilities.
Revolving FacilityAs of June 30, 2019, US$624.3 million was available to be borrowed on the New Revolving Credit Facility as a result of US$22.7 million of outstanding borrowings and the utilization of US$3.0 million of the facility for outstanding letters of credit extended to certain creditors. As of December 31, 2018, US$623.8 million was available to be borrowed on the New Revolving Credit Facility as a result of US$22.9 million of outstanding borrowings and the utilization of US$3.3 million of the facility for outstanding letters of credit extended to certain creditors.
利率掉期本集團繼續利用固定利率協議與若干浮息美元銀行借款進行利率掉期,以對沖浮息新優先信貸融通項下的利率風險。就原優先信貸融通訂立的利率掉期協議於2018年再融資後仍然有效,將於2021年8月31日終止。利率掉期協議的名義金額隨著時間遞減。各協議項下的固定LIBOR約為1.30%。各利率掉期協議須自2017年1月31日起每月支付固定利息。利率掉期交易可作為現金流量對沖。於2019年6月30日及2018年12月31日,利率掉期按市價計值,導致本集團分別產生淨資產6.5百萬美元及25.5百萬美元,並入賬列作資產,而實際收益(虧損)部分則遞延至其他全面收益。
交叉貨幣掉期於2019年4月,本集團訂立交叉貨幣掉期,指定為淨投資對沖。該對沖包括歐元與美元的名義貸款金額50.0百萬美元及日圓與美元的名義貸款金額25.0百萬美元。本集團自兩個市場的利差獲利,在五年合約期間收取固定利息收入。截至 2019年 6月 30日,交叉貨幣掉期符合淨投資對沖之條件,而每月按市值計價計入其他全面收益。截至2019年6月30日,交叉貨幣掉期按市值計價,導致本集團產生淨負債1.9百萬美元,並入賬列作負債,而實際收益(虧損)部分則遞延至其他全面收益。
遞延融資成本截至2018年6月30日止六個月,本集團產生與2018年再融資相關的遞延融資成本 18.5百萬美元。該等成本遞延入賬,並被貸款及借款所抵銷,以於優先票據及新優先信貸融通的年期內按實際利率法攤銷。截至2019年6月30日及2018年6月30日止六個月,計入利息開支項下的優先票據及新優先信貸融通所涉遞延融資成本攤銷分別為1.5百萬美元及0.5百萬美元。於2018年再融資前,截至2018年6月30日止六個月的原優先信貸融通(已於 2018年4月清償)所涉遞延融資成本攤銷為3.3百萬美元。
償清原優先信貸融通後,截至2018年6月30日止六個月,本集團確認非現金費用53.3百萬美元以撇銷與原優先信貸融通相關的過往遞延融資成本餘額。
循環信貸於2019年6月30日,由於未償還的借款22.7百萬美元及就提供予若干債權人的未償還信用狀而動用3.0百萬美元融資,故新循環信貸融通可予借出的金額為624.3百萬美元。於2018年12月31日,由於未償還的借款22.9百萬美元及就提供予若干債權人的未償還信用狀而動用3.3百萬美元融資,故新循環信貸融通可予借出的金額為623.8百萬美元。
60
Management Discussion and Analysis 管理層討論與分析
SAM005_IR.indb 60 9/9/2019 17:29

Other Loans and BorrowingsCertain consolidated subsidiaries of the Group maintain credit lines and other loans with various third party lenders in the regions in which they operate. Other loans and borrowings are generally variable rate instruments denominated in the functional currency of the borrowing Group entity. These credit lines provide short-term financing and working capital for the day-to-day business operations of the subsidiaries, including overdraft, bank guarantees, and trade finance facilities. The majority of the credit lines included in other loans and borrowings are uncommitted facilities. The total aggregate amount outstanding under the local facilities was US$33.7 million and US$29.5 million as of June 30, 2019 and December 31, 2018, respectively.
The following represents the contractual maturity dates of the Group’s loans and borrowings as of June 30, 2019 and December 31, 2018:
(Expressed in millions of US Dollars) (以百萬美元呈列)June 30, 2019
2019年6月30日December 31, 2018
2018年12月31日
On demand or within one year 按要求或於一年內 84.8 80.9
After one year but within two years 一年後但兩年內 49.0 38.8
After two years but within five years 兩年後但五年內 765.2 786.3
More than five years 五年以上 1,023.1 1,029.9
1,922.1 1,935.8
其他貸款及借款本集團若干綜合附屬公司與該等公司營運所在地區的多名第三方貸款人訂立信貸安排及其他貸款。其他貸款及借款一般為以借款集團實體的功能貨幣計值的浮息工具。該等信貸額為附屬公司日常業務營運提供短期融資及營運資金,包括透支、銀行擔保及貿易融資。此等信貸額(計入其他貸款及借款)大部分為無承諾的融資。於2019年6月30日及2018年12月31日,當地融資項下的未償還總額分別為33.7百萬美元及29.5百萬美元。
下表載列本集團於2019年6月30日及2018年12月31日的貸款及借款的合約到期日:
HedgingThe Group’s non-U.S. subsidiaries periodically enter into forward contracts related to the purchase of inventories denominated primarily in US Dollars which are designated as cash flow hedges. Cash outflows associated with these derivatives as of June 30, 2019 are expected to be US$135.4 million within one year.
Other Financial InformationWorking Capital RatiosInventory Analysis
The following table sets forth a summary of the Group’s average inventories, cost of sales and average inventory days for the six months ended June 30, 2019 and June 30, 2018:
Six months ended June 30,截至6月30日止六個月
(Expressed in millions of US Dollars) (以百萬美元呈列) 2019 2018
Average inventories(1) 平均存貨 (1) 624.4 603.6
Cost of sales 銷售成本 772.7 804.9
Average inventory turnover days(2) 平均存貨週轉日數 (2) 147 137
對沖本集團的非美國附屬公司定期訂立與採購主要以美元結算的存貨有關的遠期合約,此等合約旨在進行現金流量對沖。於2019年6月30日與此等衍生工具有關的現金流出預期於一年內為135.4百萬美元。
其他財務資料營運資金比率存貨分析下表載列截至2019年6月30日及2018年6月30日止六個月本集團平均存貨、銷售成本及平均存貨日數的概要:
Notes 註釋(1) Average inventories equal the average of net inventory at the beginning and end of a given period. 平均存貨相等於特定期間期初及期末的存貨淨額的平均數。(2) Average inventory turnover days for a given period equals average inventory for that period divided by cost of sales for that period and multiplied by the number of days in the
period. 特定期間的平均存貨週轉日數相等於該期間的平均存貨除以該期間的銷售成本,再乘以該期間的日數。
61Samsonite International S.A. Interim Report 2019 新秀麗國際有限公司 2019年中期報告
SAM005_IR.indb 61 9/9/2019 17:29

2019年上半年本集團平均存貨(於2019年6月30日為626.2百萬美元,而於2018年12月31日則為622.6百萬美元)較2018年上半年(於2018年6月30日為624.2百萬美元,而於2017年12月31日則為583.0百萬美元)有所增加,是由於支援推出新產品、增設新零售店以及Tumi品牌的全球擴張所致。存貨日數亦受銷售成本減少影響。
應收賬款及其他應收款項下表載列截至2019年6月30日及2018年6月30日止六個月本集團平均應收賬款及其他應收款項、銷售淨額以及應收賬款及其他應收款項週轉日數的概要:
2019年上半年本集團平均應收賬款及其他應收款項
The Group’s average inventories increased in the first half of 2019 (US$626.2 million as of June 30, 2019 compared to US$622.6 million as of December 31, 2018) compared to the first half of 2018 (US$624.2 million as of June 30, 2018 compared to US$583.0 million as of December 31, 2017) to support new product introductions, new retail stores and the global expansion of the Tumi brand. Inventory days were also impacted by the reduction in cost of sales.
Trade and Other Receivables
The following table sets forth a summary of the Group’s average trade and other receivables, net sales and turnover days of trade and other receivables for the six months ended June 30, 2019 and June 30, 2018:
Six months ended June 30,截至6月30日止六個月
(Expressed in millions of US Dollars) (以百萬美元呈列) 2019 2018
Average trade and other receivables(1) 平均應收賬款及其他應收款項 (1) 421.1 415.4
Net sales 銷售淨額 1,755.7 1,848.7
Turnover days of trade and other receivables(2)
應收賬款及其他應收款項週轉日數 (2)
44 41
Notes 註釋(1) Average trade and other receivables equal the average of net trade and other receivables at the beginning and end of a given period. 平均應收賬款及其他應收款項相等於特定期間期初及期末應收賬款及其他應收款項淨額的平均數。(2) Turnover days of trade and other receivables for a given period equals average trade and other receivables for that period divided by net sales for that period and multiplied by
the number of days in the period. 特定期間的應收賬款及其他應收款項週轉日數相等於該期間的平均應收賬款及其他應收款項除以該期間的銷售淨額,再乘以該期間的日數。
The Group’s average trade and other receivables increased slightly in the first half of 2019 (US$421.2 million as of June 30, 2019 compared to US$420.9 million as of December 31, 2018) compared to the first half of 2018 (US$419.4 million as of June 30, 2018 compared to US$411.5 million as of December 31, 2017). The trade and other receivables turnover days increased due to the decrease in net sales and the timing of receipts year-on-year.
Trade receivables as of June 30, 2019 are on average due within 60 days from the date of billing.
Trade and Other Payables
The following table sets forth a summary of the Group’s average trade and other payables, cost of sales and turnover days of trade and other payables for the six months ended June 30, 2019 and June 30, 2018:
Six months ended June 30,截至6月30日止六個月
(Expressed in millions of US Dollars) (以百萬美元呈列) 2019 2018
Average trade and other payables(1) 平均應付賬款及其他應付款項 (1) 756.2 773.1
Cost of sales 銷售成本 772.7 804.9
Turnover days of trade and other payables(2) 應付賬款及其他應付款項週轉日數 (2) 179 175
2019年上半年本集團平均應收賬款及其他應收款項(於2019年6月30日為421.2百萬美元,而於2018年12月31日則為420.9百萬美元)較2018年上半年(於2018年6月30日為419.4百萬美元,而於2017年12月31日則為411.5百萬美元)略有增加。應收賬款及其他應收款項週轉日數增加是由於銷售淨額減少及收款時間按年變動所致。
於2019年6月30日的應收賬款平均為於賬單日期起計60日內到期。
應付賬款及其他應付款項下表載列截至2019年6月30日及2018年6月30日止六個月本集團平均應付賬款及其他應付款項、銷售成本以及應付賬款及其他應付款項週轉日數的概要:
Notes 註釋(1) Average trade and other payables equal the average of trade and other payables at the beginning and end of a given period. 平均應付賬款及其他應付款項相等於特定期間期初及期末應付賬款及其他應付款項的平均數。(2) Turnover days of trade and other payables for a given period equals average trade and other payables for that period divided by cost of sales for that period and multiplied by
the number of days in the period. 特定期間的應付賬款及其他應付款項週轉日數相等於該期間的平均應付賬款及其他應付款項除以該期間的銷售成本,再乘以該期間的日數。
62
Management Discussion and Analysis 管理層討論與分析
SAM005_IR.indb 62 9/9/2019 17:29

The Group’s average trade and other payables decreased in the first half of 2019 (US$813.1 million as of June 30, 2019 compared to US$699.2 million as of December 31, 2018) compared to the first half of 2018 (US$809.1 million as of June 30, 2018 compared to US$737.0 million as of December 31, 2017) primarily due to the timing of payments associated with inventory purchases year-on-year.
Trade payables as of June 30, 2019 are on average due within 105 days from the invoice date.
Gearing Ratio
The following table sets forth the Group’s loans and borrowings (excluding deferred financing costs), total equity and gearing ratio as of June 30, 2019 and December 31, 2018:
(Expressed in millions of US Dollars) (以百萬美元呈列)June 30, 2019
2019年6月30日December 31, 2018
2018年12月31日
Loans and borrowings (excluding deferred financing costs)
貸款及借款 (撇除遞延融資成本) 1,922.1 1,935.8
Total equity 權益總額 1,907.1 1,991.1
Gearing ratio(1) 槓桿比率 (1) 100.8% 97.2%
Note 註釋(1) Calculated as total loans and borrowings (excluding deferred financing costs) divided by total equity. 按貸款及借款總額(撇除遞延融資成本)除以權益總額計算。
Contingent LiabilitiesDetails of contingent liabilities are set out in note 19 to the Consolidated Interim Financial Statements.
Subsequent EventsDetails of the events occurring subsequent to June 30, 2019 are set out in note 22 to the Consolidated Interim Financial Statements.
Other InformationTotal current assets were US$1,702.7 million and US$1,617.7 million, and total assets less current liabilities were US$4,607.2 million and US$4,205.2 million, as of June 30, 2019 and December 31, 2018, respectively.
Strategic Review and Full-year ProspectsFinancial results of the Group during the first half of 2019 were as follows:
Financial ResultsKey Group metrics for the six months ended June 30, 2019 compared to the six months ended June 30, 2018 were as follows:
• Net sales for the six months ended June 30, 2019 decreased by US$27.8 million, or 1.5%, on a constant currency basis compared to the six months ended June 30, 2018. US Dollar reported net sales were US$1,755.7 million for the six months ended June 30, 2019, reflecting a decrease of US$93.0 million, or 5.0% compared to the corresponding period in the previous year. The net sales decline was due to headwinds faced by the business in the United States, China’s B2B channel, South Korea and Chile, as well as due to unfavorable foreign currency impacts. Excluding the effects of
2019年上半年本集團平均應付賬款及其他應付款項(於2019年6月30日為813.1百萬美元,而於2018年12月31日則為699.2百萬美元)較2018年上半年(於2018年6月30日為809.1百萬美元,而於2017年12月31日則為737.0百萬美元)減少,主要因與採購存貨相關的付款時間按年變動所致。
於2019年6月30日的應付賬款平均為於發票日期起計105日內到期。
槓桿比率下表載列本集團於2019年6月30日及2018年12月31日的貸款及借款(撇除遞延融資成本)、權益總額及槓桿比率:
或然負債有關或然負債的詳情載於綜合中期財務報表附註19。
期後事項有關於2019年6月30日後發生的事項詳情載於綜合中期財務報表附註22。
其他資料於2019年6月30日及2018年12月31日,流動資產總額分別為1,702.7百萬美元及1,617.7百萬美元,資產總額減流動負債則分別為4,607.2百萬美元及4,205.2百萬美元。
策略評估及全年展望本集團2019年上半年的財務業績如下:
財務業績與截至2018年6月30日止六個月比較,截至2019年6月30日止六個月本集團各項主要指標如下:
• 截至2019年6月30日止六個月的銷售淨額較截至 2018年 6月 30日止六個月減少 27.8百萬美元或 1.5%(按不變匯率基準計算)。截至 2019年6月30日止六個月的以美元呈報的銷售淨額為1,755.7百萬美元,較去年同期減少93.0百萬美元或5.0%,銷售淨額減少是由於美國、中國B2B渠道、南韓及智利的業務受市場不景氣影響以及外匯的不利影響所致。撇除該等不利因
63Samsonite International S.A. Interim Report 2019 新秀麗國際有限公司 2019年中期報告
SAM005_IR.indb 63 9/9/2019 17:29

these headwinds, the Group’s constant currency net sales increased by US$34.6 million, or 3.5%, for the six months ended June 30, 2019 compared to the same period in the previous year, and US Dollar reported net sales decreased by US$19.5 million, or 2.0%, for the six months ended June 30, 2019 compared to the same period in the previous year.
• The Group spent US$103.1 million on marketing during the six months ended June 30, 2019 compared to US$114.3 million for the six months ended June 30, 2018, a decrease of US$11.3 million, or 9.8% (-6.8% constant currency). As a percentage of net sales, marketing expenses decreased by 30 basis points to 5.9% for the six months ended June 30, 2019 from 6.2% for the six months ended June 30, 2018.
• Based on an evaluation of loss-making stores in the six months ended June 30, 2019 and the anticipated closure of some of these stores, the Group recognized the Non-cash Impairment Charge totaling US$29.7 million for the first half of 2019, comprised of the write-off of US$21.0 million of lease right-of-use assets associated with such stores that were recently recognized with the adoption of IFRS 16 and a US$8.7 million impairment for property, plant and equipment of such stores.
• Operating profit for the six months ended June 30, 2019 decreased by US$44.7 million, or 21.5% (-19.6% constant currency), to US$163.6 million when excluding the Non-cash Impairment Charge and the costs to implement profit improvement initiatives during the six months ended June 30, 2019, compared to US$208.3 million for the same period in the previous year (as recast to adjust for IFRS 16 impacts). Operating profit, as reported, decreased by US$77.8 million, or 38.5% (-36.9% constant currency), year-on-year to US$124.0 million.
• Profit for the period for the six months ended June 30, 2019 decreased by US$14.7 million, or 13.4% (-12.1% constant currency), to US$95.3 million when excluding the Non-cash Impairment Charge and the costs to implement profit improvement initiatives, net of the related tax impact during the six months ended June 30, 2019, compared to US$110.0 million for the same period in the previous year (as recast to adjust for IFRS 16 impacts) when excluding the non-cash charge of US$53.3 million and the related tax impact during the six months ended June 30, 2018 to write-off the deferred financing costs associated with the Original Senior Credit Facilities in conjunction with the 2018 Refinancing. Profit for the period, as reported, decreased by US$19.6 million, or 25.1% (-23.8% constant currency), year-on-year to US$58.3 million.
• Profit attributable to the equity holders for the six months ended June 30, 2019 decreased by US$13.8 million, or 13.9% (-12.4% constant currency), to US$86.1 million when excluding the Non-cash Impairment Charge and the costs to implement profit improvement initiatives, net of the related tax impact during the six months ended June 30, 2019, compared to US$99.9 million for the six months ended June 30, 2018 (as recast to adjust for IFRS 16 impacts) when excluding the non-cash charge of US$53.3 million and the related tax impact during the six months ended June 30, 2018 to write-off the deferred financing costs associated with the Original Senior Credit Facilities in conjunction with the 2018 Refinancing. Profit attributable to the equity holders, as reported, decreased by US$18.7 million, or 27.5% (-26.0% constant currency), from the same period in the previous year to US$49.1 million.
素影響,本集團截至2019年6月30日止六個月按不變匯率基準計算的銷售淨額較去年同期上升34.6百萬美元或3.5%,而截至2019年6月30日止六個月的以美元呈報的銷售淨額較去年同期減少19.5百萬美元或2.0%。
• 本集團在營銷方面的開支由截至2018年6月30日止六個月的114.3百萬美元減少11.3百萬美元或9.8%(按不變匯率基準計算則減少6.8%)至截至2019年6月30日止六個月的103.1百萬美元。截至2019年6月30日止六個月的營銷開支佔銷售淨額百分比由截至2018年6月30日止六個月的6.2%減少30個基點至5.9%。
• 基於評估截至2019年6月30日止六個月錄得虧損的店舖及預計關閉部分該等店舖,本集團確認2019年上半年的非現金減值費用共計29.7百萬美元,包括撇銷有關該等店舖的租賃使用權資產21.0百萬美元(因採用 IFRS第16號而於近期確認)及該等店舖的物業、廠房及設備減值8.7百萬美元。
• 經撇除截至2019年6月30日止六個月的非現金減值費用及實施溢利改善措施的成本,截至2019年6月30日止六個月的經營溢利較去年同期的208.3百萬美元(就 IFRS第16號的影響作出調整)減少44.7百萬美元或21.5%(按不變匯率基準計算則減少19.6%)至163.6百萬美元。所呈報的經營溢利按年減少77.8百萬美元或38.5%(按不變匯率基準計算則減少36.9%)至124.0百萬美元。
• 經撇除截至2019年6月30日止六個月的非現金減值費用及實施溢利改善措施的成本及相關稅務影響,截至2019年6月30日止六個月的期內溢利較去年同期的110.0百萬美元(就 IFRS第16號的影響作出調整,並撇除截至2018年6月30日止六個月於2018年再融資的同時撇銷與原優先信貸融通相關的遞延融資成本的非現金費用53.3百萬美元及相關稅務影響)減少14.7百萬美元或13.4%(按不變匯率基準計算則減少12.1%)至95.3百萬美元。所呈報的期內溢利按年減少19.6百萬美元或25.1%(按不變匯率基準計算則減少23.8%)至58.3百萬美元。
• 經撇除截至2019年6月30日止六個月的非現金減值費用及實施溢利改善措施的成本及相關稅務影響,截至2019年6月30日止六個月的股權持有人應佔溢利較截至2018年6月30日止六個月的99.9百萬美元(就 IFRS第16號的影響作出調整,並撇除截至2018年6月30日止六個月於2018年再融資的同時撇銷與原優先信貸融通相關的遞延融資成本的非現金費用53.3百萬美元及相關稅務影響)減少13.8百萬美元或13.9%(按不變匯率基準計算則減少12.4%)至86.1百萬美元。所呈報的股權持有人應佔溢利較去年同期減少18.7百萬美元或27.5%(按不變匯率基準計算則減少26.0%)至49.1百萬美元。
64
Management Discussion and Analysis 管理層討論與分析
SAM005_IR.indb 64 9/9/2019 17:29

• Adjusted Net Income, a non-IFRS measure, decreased by US$14.2 million, or 12.8% (-11.3% constant currency), to US$97.0 million for the six months ended June 30, 2019 compared to US$111.2 million for the same period in the previous year (as recast to adjust for IFRS 16 impacts). Reported Adjusted Net Income for the six months ended June 30, 2018 was US$119.8 million.
• Adjusted EBITDA, a non-IFRS measure, decreased by US$51.5 million, or 19.4% (-16.4% constant currency), to US$213.5 million for the six months ended June 30, 2019 compared to US$265.0 million for the same period in the previous year (as recast to adjust for IFRS 16 impacts). Reported Adjusted EBITDA for the six months ended June 30, 2018 was US$276.8 million.
• Adjusted EBITDA margin, a non-IFRS measure, was 12.2% for the six months ended June 30, 2019 compared to 14.3% for the six months ended June 30, 2018 (as recast to adjust for IFRS 16 impacts). This decrease was primarily due to the effect of investments in the DTC distribution channel, particularly in connection with bricks-and-mortar retail stores that were opened in 2017 and 2018. Reported Adjusted EBITDA margin for the six months ended June 30, 2018 was 15.0%.
• The Group generated US$192.6 million of cash from operating activities during the six months ended June 30, 2019 compared to US$56.2 million for the same period in the previous year. Excluding the impacts from IFRS 16, operating cash flow more than doubled to US$113.0 million for the first half of 2019 compared to the first half of 2018. As of June 30, 2019, the Group had cash and cash equivalents of US$489.3 million and outstanding financial debt of US$1,922.1 million (excluding deferred financing costs of US$14.9 million), putting the Group in a net debt position of US$1,432.8 million compared to US$1,588.3 million as of June 30, 2018 and US$1,508.2 million as of December 31, 2018.
• On March 13, 2019, the Company’s Board of Directors recommended that a cash distribution in the amount of US$125.0 million be made to the Company’s shareholders, a 13.6% increase from the US$110.0 million distribution paid in 2018. The shareholders approved this distribution on June 6, 2019 at the Company’s Annual General Meeting and the distribution was paid on July 16, 2019.
Investment in advertising and promotionThe Group continued to make significant investments in marketing, which amounted to US$103.1 million, or approximately 5.9% of net sales, during the first half of 2019 compared to US$114.3 million, or 6.2%, of net sales during the first half of 2018, reflecting its commitment to advertise and promote its brands and products to support sales growth worldwide.
Introduction of new and innovative products to the marketThe Group continued to focus on innovation and ensuring that its products reflect local consumer tastes in each region. Innovation and a regional focus on product development are key drivers of sales growth and are the means to deliver quality and value to the Group’s customers.
Future ProspectsThe Group’s growth strategy will continue as planned for the second half of 2019, with a focus on the following:
• 經調整淨收入(一項非 IFRS財務計量工具)由去年同期的111.2百萬美元(就IFRS第16號的影響作出調整)減少14.2百萬美元或12.8%(按不變匯率基準計算則減少11.3%)至截至2019年6月30日止六個月的97.0百萬美元。截至2018年6月30日止六個月的所呈報的經調整淨收入為119.8百萬美元。
• 經調整EBITDA(一項非IFRS財務計量工具)較去年同期的265.0百萬美元(就IFRS第16號的影響作出調整)減少51.5百萬美元或19.4%(按不變匯率基準計算則減少16.4%)至截至2019年6月30日止六個月的213.5百萬美元。截至2018年6月30日止六個月的所呈報的經調整EBITDA為276.8百萬美元。
• 經調整EBITDA利潤率(一項非IFRS財務計量工具)截至2019年6月30日止六個月為12.2%,而截至2018年6月30日止六個月則為14.3%(就IFRS第16號的影響作出調整)。此減幅主要由於投資於DTC分銷渠道(尤其是2017年及2018年增設實體零售店)的影響所致。截至2018年6月30日止六個月的所呈報的經調整EBITDA利潤率為15.0%。
• 本集團截至2019年6月30日止六個月自經營活動產生現金192.6百萬美元,而去年同期產生現金56.2百萬美元。撇除IFRS第16號的影響,2019年上半年的經營現金流量達113.0百萬美元,為2018年上半年的兩倍有多。於2019年6月30日,本集團的現金及現金等價物為489.3百萬美元,未償還金融債務為1,922.1百萬美元(撇除遞延融資成本14.9百萬美元),故本集團的淨債務為1,432.8百萬美元,而截至2018年6月30日及2018年12月31日則分別為1,588.3百萬美元及1,508.2百萬美元。
• 於2019年3月13日,本公司董事會建議向本公司股東作出125.0百萬美元的現金分派,較2018年派付的110.0百萬美元分派增長13.6%。股東於2019年6月6日舉行的本公司股東週年大會上批准此項分派,而有關分派已於2019年7月16日派付。
投資於宣傳及推廣本集團繼續大幅投資於市場推廣,於 2019年上半年投資額為103.1百萬美元,佔銷售淨額約5.9%,而2018年上半年為114.3百萬美元,佔銷售淨額的6.2%,反映其致力於宣傳及推廣其品牌及產品,以支援全球銷售增長。
於市場推出革新及創意產品本集團繼續專注於創新及確保產品反映各地區的消費者品味。創新及專注於地區產品開發為銷售增長的主要動力,是向本集團客戶提供優質及富價值產品的方法。
未來前景於2019年下半年,本集團將繼續按照計劃實施其發展策略,同時專注於以下方面的工作:
65Samsonite International S.A. Interim Report 2019 新秀麗國際有限公司 2019年中期報告
SAM005_IR.indb 65 9/9/2019 17:29

• Deploy multiple brands to operate at wider price points in both the travel and non-travel product categories. Within the non-travel product categories, greater emphasis will be placed on backpacks and products that appeal to female consumers.
• Increase the proportion of net sales from the direct-to-consumer channel by growing the Company’s direct-to-consumer e-commerce net sales and through ’targeted’ expansion of its bricks-and-mortar retail presence.
• Sustain the Company’s focused investment in marketing to support the continued global expansion of Tumi, while continuing to drive visibility and traffic for Samsonite, American Tourister and other brands.
• Leverage the Company’s regional management structure, sourcing and distribution expertise and marketing engine to extend its brands into new markets and penetrate deeper into existing channels.
• Continue to invest in research and development to develop lighter and stronger new materials, advanced manufacturing processes, exciting new designs, as well as innovative functionalities that deliver real benefits to consumers.
• Continue to develop the Company into a well-diversified, multi-brand, multi-category and multi-channel luggage, bag and accessories business.
The Group aims to deliver top-line growth, maintain gross margins, increase profitability and enhance shareholder value.
Qualitative and Quantitative Market RisksCredit RiskCredit risk is the risk of financial loss to the Group if a customer or counterparty to a financial instrument fails to meet its contractual obligations and arises principally from the Group’s receivables from customers. Maximum exposure is limited to the carrying amounts of the financial assets presented in the Group’s consolidated interim financial statements.
The Group’s exposure to credit risk is influenced mainly by the individual characteristics of each customer. However, management also considers the demographics of its customer base, including the default risk of the industry and country in which customers operate, as these factors may have an influence on credit risk. There is no concentration of credit risk geographically or with any single customer.
The Group has established a credit policy under which each new customer is analyzed individually for credit worthiness before the Group’s standard payment and delivery terms and conditions are offered.
In monitoring customer credit risk, customers are grouped according to their credit characteristics, including aging profile and existence of previous financial difficulties. Trade and other receivables relate mainly to the Group’s wholesale customers. Customers that are graded as “high risk” are placed on credit hold and monitored by the Group and future sales are made on an approval basis.
Financial GuaranteesThe Group’s policy is to provide financial guarantees only on behalf of subsidiaries. No other guarantees have been made to third parties.
• 於旅遊及非旅遊產品類別部署多個不同品牌以涵蓋更廣泛的價格點。在非旅遊產品類別中,我們將更著力於開發背包及吸引女性消費者的產品。
• 透過提升本公司直接面向消費者電子商貿的銷售淨額及「針對性」地擴充實體零售業務,增加直接面向消費者渠道佔銷售淨額的比重。
• 維持本公司於營銷方面所作出的重點投資,以支援Tumi的持續全球擴展,同時繼續提升新秀麗、American Tourister及其他品牌的知名度及顧客流量。
• 憑藉本公司的地區管理架構、採購及分銷專長以及營銷動力,將其品牌拓展至新市場,並加深滲透現有渠道。
• 繼續投資於研究與開發,開發更輕巧及更堅固的新物料、先進的製造技術、具吸引力的新設計,以及為消費者帶來實際效益的創新功能。
• 繼續將本公司發展為具備多品牌、多產品類別及多分銷渠道的多元化行李箱包及配件企業。
本集團旨在取得銷售淨額增長、維持毛利率、提升盈利能力及提高股東價值。
定性及定量市場風險信貸風險信貸風險為倘金融工具的客戶或交易對手未能履行其合約責任而令本集團承受財務虧損的風險,主要來自本集團應收客戶的款項。最高的風險水平限於本集團的綜合中期財務報表所呈列金融資產的賬面值。
本集團的信貸風險水平主要受到每名客戶個別的特點影響。然而,管理層亦會考慮其客戶群的結構,包括客戶從事業務經營所屬行業及所在國家的違約風險,因為此等因素可能對信貸風險構成影響。從地理上而言或對任何單一客戶而言,並無信貸集中風險。
本集團已制定信貸政策,據此,本集團會在向每名新客戶提供標準的付款和交付條款與條件前,個別地對其信譽進行分析。
本集團在監察客戶的信貸風險時,是根據客戶的信貸特點(包括賬齡概況,以及之前是否存有財政困難)將客戶分組。應收賬款及其他應收款項主要與本集團的批發客戶有關。被評級為「高風險」的客戶的信貸會被暫擱及由本集團進行監察,未來的銷售需要經過審批方可進行。
財務擔保本集團的政策為只代表附屬公司提供財務擔保。並無向第三方作出其他擔保。
66
Management Discussion and Analysis 管理層討論與分析
SAM005_IR.indb 66 9/9/2019 17:29

Liquidity RiskLiquidity risk is the risk that the Group will encounter difficulty in meeting the obligations associated with its financial liabilities.
The Group’s primary sources of liquidity are its cash flows from operating activities, invested cash, and available lines of credit and, subject to shareholder approval, its ability to issue additional shares. The Group believes that its existing cash and estimated cash flows, along with current working capital and access to lines of credit, will be adequate to meet its operating and capital requirements for at least the next twelve months.
Foreign Exchange RiskThe Group conducts a portion of its business in currencies other than the US Dollar, the functional currency of the Company and the currency in which the consolidated interim financial statements are reported. Accordingly, the Group’s operating results could be adversely affected by foreign currency exchange rate volatility relative to the US Dollar. The Group’s foreign subsidiaries generally use the local currency as their functional currencies. The Group periodically uses forward exchange contracts to hedge its exposure to currency risk on product purchases denominated in a currency other than the respective functional currency of its subsidiaries. The forward exchange contracts typically have maturities of less than one year. Although the Group continues to evaluate strategies to mitigate risks related to the fluctuations in currency exchange rates, the Group will likely recognize gains or losses from international transactions. Changes in foreign currency exchange rates could adversely affect the Group’s operating results.
The Group is exposed to currency risk on purchases and, from time to time, borrowings that are denominated in a currency other than the respective functional currencies of its subsidiaries. Interest on borrowings is generally denominated in the local currency of the borrowing entity. Borrowings are generally denominated in currencies that match the cash flows generated by the underlying operations of the borrowing entity.
The Group is exposed to currency risk upon maturity of its cross-currency swaps that have been designated as net investment hedges.
Interest Rate RiskThe Group monitors its exposure to changes in interest rates on borrowings on variable rate debt instruments. The Group has entered into interest rate swap agreements as hedges to manage a portion of its interest rate risk. See note 13 to the Consolidated Interim Financial Statements for further details on interest rate swap agreements.
Tax Rates and LiabilitiesA number of international legislative and regulatory bodies have proposed or implemented legislation to change certain tax practices of multinational companies. One of these efforts has been led by The Organization for Economic Co-operation and Development (the “OECD”), an international association of 34 countries including the United States, which has finalized recommendations to revise many corporate taxes, transfer pricing, and tax treaty provisions in member countries. In addition, the European Union and its European Commission are continuing to review and opine on the appropriateness of certain agreements between various member countries and companies in light of the European Union competition rules against unjustified state aid. While the Company maintains that it is in compliance with corporate tax, transfer pricing, and tax treaty provisions, it is possible that these efforts may impact its income tax liabilities.
流動資金風險流動資金風險為本集團在履行與其金融負債有關的責任時將遇到困難的風險。
本集團流動資金的主要來源為其經營活動所產生的現金流量、投資現金、可用信貸額及其發行新股(惟須待股東批准後方可作實)的能力。本集團相信,其現有現金及估計現金流量,加上流動營運資金及所取得信貸額,將足以應付其未來最少十二個月的營運及資本需求。
外匯風險本集團部分業務以美元以外的貨幣進行,而美元為本公司的功能貨幣以及綜合中期財務報表所用的呈報貨幣。因此,本集團的經營業績可能會受到外幣兌美元匯率波動的不利影響。本集團的海外附屬公司通常採用當地貨幣為其功能貨幣。本集團定期使用遠期外匯合約對沖其以其附屬公司各自的功能貨幣以外的貨幣結算的產品採購的貨幣風險。該等遠期外匯合約的到期日一般少於一年。儘管本集團繼續評估策略以減低與外匯匯率波動有關的風險, 惟本集團很可能會從國際交易中確認收益或虧損。外匯匯率變動可能會對本集團的經營業績造成不利影響。
本集團就以其附屬公司各自的功能貨幣以外的貨幣結算的採購和不時就以該等貨幣計值的借款承受貨幣風險。借款的利息通常以借款實體的當地貨幣結算。借款一般以配合借款實體的相關營運產生的現金流量的貨幣計值。
本集團於指定為淨投資對沖的交叉貨幣掉期到期時承受貨幣風險。
利率風險本集團監察其浮息債務工具的借款利率變動的風險。本集團訂立利率掉期協議作為對沖,以管理部分利率風險。有關利率掉期協議的進一步詳情,請參閱綜合中期財務報表附註13。
稅率及負債多個國際立法及監管機構已建議立法或實施法例以修改若干跨國企業稅務常規。其中一項行動由經濟合作與發展組織(「經合組織」)帶領,其為一個由34個國家(包括美國)組成的國際組織,其已就成員國的多項企業稅、轉讓定價及稅務條約條文提出修訂建議。此外,歐盟及其歐盟委員會根據歐盟針對不合理國家援助的競爭規則,繼續檢討多個成員國與公司之間若干協議的合適性,並就此提出意見。儘管本公司持續遵守企業稅、轉讓定價及稅務條約條文,上述行動可能會影響其所得稅負債。
67Samsonite International S.A. Interim Report 2019 新秀麗國際有限公司 2019年中期報告
SAM005_IR.indb 67 9/9/2019 17:29

To proactively address the risk of changes in applicable tax legislation, the Company is evaluating various potential tax restructuring opportunities that it intends to implement within the next two years. The objectives of any such restructuring would be to seek to maintain the Company’s effective tax rate within a range that is reasonably consistent with its historical effective tax rate, to minimize any potential tax risk under evolving international tax laws, and to minimize the effects of any taxes that may be imposed in connection with such restructuring. The Company also intends for any such restructuring to result in a sustainable tax structure that is consistent with the Company’s management structure and operations.
Risks associated with our New Senior Credit FacilitiesThe Credit Agreement and the Indenture require the Company and its subsidiaries to comply with certain restrictive covenants, including certain financial covenants under the Credit Agreement. Although the Company is currently in compliance with these covenants, unexpected downturns in the Company’s business could trigger certain covenants that may increase the Group’s cost of borrowing, decrease the amounts available under the New Revolving Credit Facility, or both. The principal risks associated with the Company’s leverage include the following:
• the Company’s ability to obtain additional financing in the future for acquisitions, capital expenditures, general corporate purposes or other purposes could be limited;
• the Company’s borrowings under the Credit Agreement accrue interest at variable rates, and, increases in certain benchmark interest rates would increase the Company’s cost of borrowing (note, however, that the Group maintained interest rate swaps with respect to approximately 65% of the principal amount of the New Term Loan Facilities at June 30, 2019, which will significantly reduce the effect of interest rate increases on the Company);
• the Company’s leverage could increase its vulnerability to declining economic conditions, particularly if the decline is prolonged;
• failure to comply with any of the covenants under the Credit Agreement or the Indenture could result in an event of default which, if not cured or waived, could have a material adverse effect on the Company;
• financial and restrictive covenants under the Credit Agreement, and restrictive covenants under the Indenture, could adversely affect or limit the Company’s ability to, among other things, implement business plans, react to changes in economic conditions or return capital to the Company’s shareholders (whether through cash distributions, share repurchases, or otherwise); and
• a substantial portion of the Company’s cash flow from operations must be used to pay principal and interest on the New Senior Credit Facilities and interest on the Senior Notes until maturity, therefore reducing the cash flow available to fund the Company’s operations, capital expenditures and other business opportunities.
為預防相關稅務法例變更的風險,本公司現正評估不同的稅務重整方案,並計劃於未來兩年內實施。任何上述重整方案的目標在於致力將本公司實際稅率維持於與過往實際稅率合理相若的範圍內、減低國際稅法改變的潛在稅務風險以及減輕任何有關上述重整的稅務影響。本公司的任何上述重整方案亦旨在建立一個與本公司管理架構及營運相符的可持續稅務架構。
與新優先信貸融通相關的風險本公司的信貸協議及契約規定本公司及其附屬公司須遵守若干限制性契諾,包括信貸協議的財務契諾。儘管本公司目前遵守此等契諾,惟本公司業務一旦出乎意料地萎縮,或會觸發若干契諾,以致可能增加本集團的借款成本,減少新循環信貸融通項下的可用數額,甚至同時出現兩種情況。與本公司槓桿相關的主要風險包括以下各項:
• 本公司未來就用作收購、資本開支、一般企業用途或其他用途而獲得額外融資的能力可能受到限制;
• 本公司在信貸協議項下按浮動利率計息的借款及若干基準利率上升將增加本公司的借款成本(惟請注意,2019年6月30日,本集團已就新定期貸款融通約65%本金額維持利率掉期,此將大幅降低利率上升對本公司的影響);
• 本公司的槓桿可能會令其更易受到經濟環境衰退的影響,在長期衰退的情況下尤其嚴重;
• 未能遵守信貸協議或契約項下的任何契諾可能導致的違約事件,倘無法糾正或不獲豁免,可能對本公司構成重大不利影響;
• 信貸協議項下的財務及限制性契諾及契約項下的限制性契諾可能對本公司(其中包括)推行業務計劃、應對經濟環境轉變或向本公司股東提供資本回報(不論是透過現金分派、股份回購或其他方式)的能力帶來不利影響或限制;及
• 本公司自經營業務所得的大部分現金流量須用於支付新優先信貸融通的本金及利息及優先票據的利息直至到期,因而減少本公司在經營業務、資本開支及其他商機的可用現金流量。
68
Management Discussion and Analysis 管理層討論與分析
SAM005_IR.indb 68 9/9/2019 17:29
2019 INTERIM REPORT CONSOLIDATED
FINANCIAL STATEMENTS2019年中期報告 綜合財務報表
zz_SAM005_IR19_2C_AW.indd 70 9/9/2019 17:43
70
The Board of Directors and ShareholdersSamsonite International S.A.:
Report on the Financial StatementsWe have reviewed the accompanying consolidated statement of financial position of Samsonite International S.A. and its subsidiaries as of June 30, 2019, the related consolidated income statements, consolidated statements of comprehensive income, consolidated statements of changes in equity and the consolidated statements of cash flows for the six-month periods ended June 30, 2019 and June 30, 2018.
Management’s ResponsibilityThe Company’s management is responsible for the preparation and fair presentation of the interim financial information in accordance with IAS 34, Interim Financial Reporting, issued by the International Accounting Standards Board; this responsibility includes the design, implementation, and maintenance of internal control sufficient to provide a reasonable basis for the preparation and fair presentation of interim financial information in accordance with IAS 34, Interim Financial Reporting, issued by the International Accounting Standards Board.
Auditors’ ResponsibilityOur responsibility is to conduct our reviews in accordance with auditing standards generally accepted in the United States of America applicable to reviews of interim financial information and in accordance with International Standards on Review Engagements 2410, Review of Interim Financial Information Performed by the Independent Auditor of the Entity. A review of interim financial information consists principally of applying analytical procedures and making inquiries of persons responsible for financial and accounting matters. It is substantially less in scope than an audit conducted in accordance with auditing standards generally accepted in the United States of America and International Standards on Auditing, the objective of which is the expression of an opinion regarding the financial information. Accordingly, we do not express such an opinion.
ConclusionBased on our reviews, we are not aware of any material modifications that should be made to the accompanying consolidated interim financial information for it to be in accordance with IAS 34, Interim Financial Reporting, issued by the International Accounting Standards Board.
Boston, MassachusettsAugust 21, 2019
董事會及股東新秀麗國際有限公司:
有關財務報表的報告我們已審閱隨附的新秀麗國際有限公司及其附屬公司於 2019 年 6 月 30 日的綜合財務狀況表以及截至2019年6月30日及2018年6月30日止六個月期間的相關綜合收益表、綜合全面收益表、綜合權益變動表及綜合現金流量表。
管理層的責任貴公司管理層須負責根據國際會計準則理事會頒佈的《國際會計準則》第34號中期財務報告編製及公平呈列中期財務資料,此包括設計、實施及維護為根據國際會計準則理事會頒佈的《國際會計準則》第34號中期財務報告編製及公平呈列中期財務資料提供充分合理基準的內部控制。
核數師的責任我們的責任是根據適用於審閱中期財務資料的美利堅合眾國公認核數準則以及按照《國際審閱委聘準則》第 2410 號由實體獨立核數師審閱中期財務資料進行審閱。審閱中期財務資料主要包括進行分析程序,並向負責財務及會計事宜之人士作出查詢。審閱範圍遠較按照美利堅合眾國公認核數準則及《國際審計準則》所進行之審核範圍小,而有關審核目的乃對財務資料發表意見。因此,我們並不發表該等意見。
總結根據我們的審閱,我們並未注意到為令隨附的綜合中期財務資料符合國際會計準則理事會頒佈的《國際會計準則》第 34 號中期財務報告而應對此中期財務資料作出之任何重大修訂。
馬薩諸塞州波士頓2019年8月21日
獨立核數師審閱報告Independent Auditors’ Review Report

71Samsonite International S.A. Interim Report 2019 新秀麗國際有限公司 2019年中期報告
綜合收益表Consolidated Income Statements
(Expressed in millions of US Dollars, except per share data) (以百萬美元呈列,每股數據除外)
Note附註
Six months ended June 30,截至6月30日止六個月
2019 2018
Net sales 銷售淨額 4 1,755.7 1,848.7
Cost of sales 銷售成本 (772.7) (804.9)
Gross profit 毛利 983.0 1,043.8
Distribution expenses 分銷開支 (600.5) (598.4)
Marketing expenses 營銷開支 (103.1) (114.3)
General and administrative expenses 一般及行政開支 (113.8) (123.8)
Impairment of property, plant and equipment and lease right-of-use assets
物業、廠房及設備和租賃使用權 資產減值 7, 16 (29.7) –
Other expenses 其他開支 (11.9) (5.5)
Operating profit 經營溢利 124.0 201.8
Finance income 財務收入 18 0.9 0.4
Finance costs 財務費用 18 (51.0) (93.6)
Net finance costs 財務費用淨額 18 (50.1) (93.2)
Profit before income tax 除所得稅前溢利 73.9 108.6
Income tax expense 所得稅開支 17 (15.6) (30.7)
Profit for the period 期內溢利 58.3 77.9
Profit attributable to equity holders 股權持有人應佔溢利 49.1 67.8
Profit attributable to non-controlling interests 非控股權益應佔溢利 9.2 10.1
Profit for the period 期內溢利 58.3 77.9
Earnings per share 每股盈利
Basic earnings per share 每股基本盈利
(Expressed in US Dollars per share) (以每股美元呈列) 5 0.034 0.048
Diluted earnings per share 每股攤薄盈利
(Expressed in US Dollars per share) (以每股美元呈列) 5 0.034 0.047
The accompanying notes form part of the consolidated interim financial statements.隨附附註構成綜合中期財務報表的一部分。

72
綜合全面收益表Consolidated Statements of Comprehensive Income
(Expressed in millions of US Dollars) (以百萬美元呈列)
Note附註
Six months ended June 30,截至6月30日止六個月
2019 2018
Profit for the period 期內溢利 58.3 77.9
Other comprehensive income (loss): 其他全面收益(虧損):
Items that are or may be reclassified subsequently to profit or loss:
其後會或可能重新分類至損益之 項目:
Changes in fair value of hedges, net of tax 對沖之公允價值變動(除稅後) 13(a), 17(b) (16.9) 12.0
Foreign currency translation gains (losses) for foreign operations
境外業務外幣匯兌收益(虧損)17(b), 18 3.4 (7.3)
Other comprehensive income (loss) 其他全面收益(虧損) (13.5) 4.7
Total comprehensive income for the period 期內全面收益總額 44.8 82.6
Total comprehensive income attributable to equity holders
股權持有人應佔全面收益總額35.1 75.2
Total comprehensive income attributable to non-controlling interests
非控股權益應佔全面收益總額9.7 7.4
Total comprehensive income for the period 期內全面收益總額 44.8 82.6
The accompanying notes form part of the consolidated interim financial statements.隨附附註構成綜合中期財務報表的一部分。
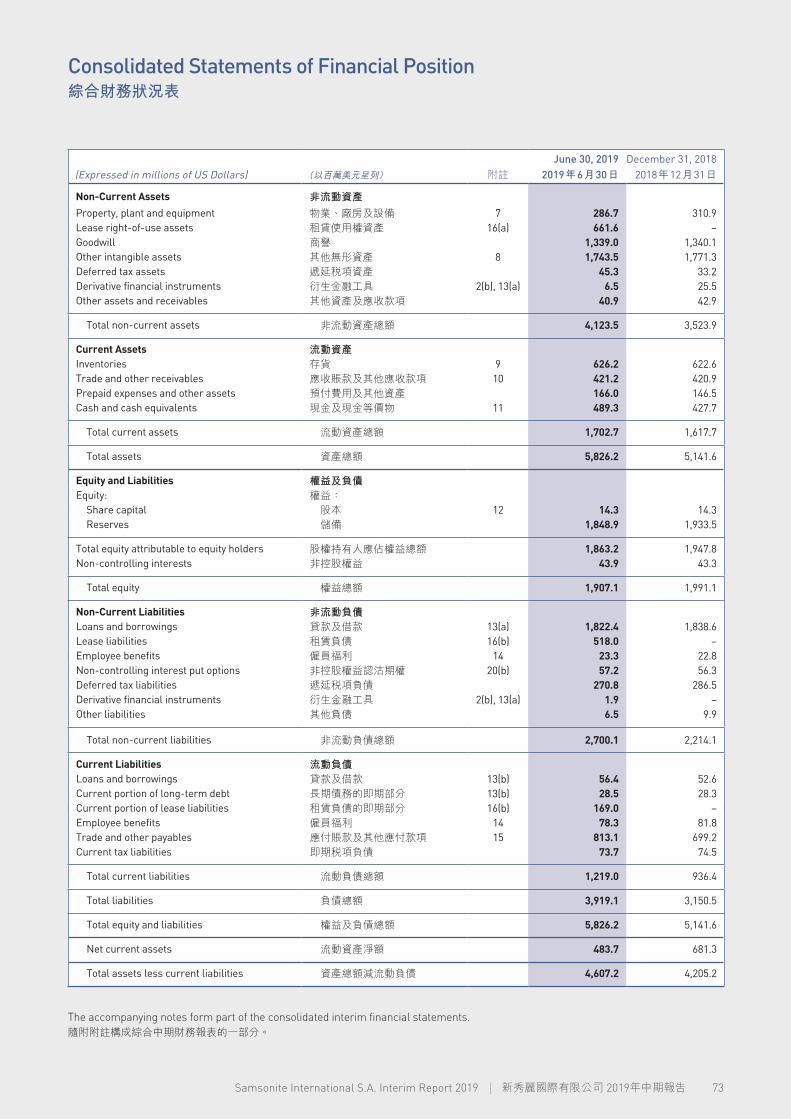
73Samsonite International S.A. Interim Report 2019 新秀麗國際有限公司 2019年中期報告
綜合財務狀況表Consolidated Statements of Financial Position
(Expressed in millions of US Dollars) (以百萬美元呈列) 附註June 30, 2019
2019年6月30日December 31, 2018
2018年12月31日
Non-Current Assets 非流動資產Property, plant and equipment 物業、廠房及設備 7 286.7 310.9Lease right-of-use assets 租賃使用權資產 16(a) 661.6 –Goodwill 商譽 1,339.0 1,340.1Other intangible assets 其他無形資產 8 1,743.5 1,771.3Deferred tax assets 遞延稅項資產 45.3 33.2Derivative financial instruments 衍生金融工具 2(b), 13(a) 6.5 25.5Other assets and receivables 其他資產及應收款項 40.9 42.9
Total non-current assets 非流動資產總額 4,123.5 3,523.9
Current Assets 流動資產Inventories 存貨 9 626.2 622.6Trade and other receivables 應收賬款及其他應收款項 10 421.2 420.9Prepaid expenses and other assets 預付費用及其他資產 166.0 146.5Cash and cash equivalents 現金及現金等價物 11 489.3 427.7
Total current assets 流動資產總額 1,702.7 1,617.7
Total assets 資產總額 5,826.2 5,141.6
Equity and Liabilities 權益及負債Equity: 權益: Share capital 股本 12 14.3 14.3 Reserves 儲備 1,848.9 1,933.5
Total equity attributable to equity holders 股權持有人應佔權益總額 1,863.2 1,947.8Non-controlling interests 非控股權益 43.9 43.3
Total equity 權益總額 1,907.1 1,991.1
Non-Current Liabilities 非流動負債Loans and borrowings 貸款及借款 13(a) 1,822.4 1,838.6Lease liabilities 租賃負債 16(b) 518.0 –Employee benefits 僱員福利 14 23.3 22.8Non-controlling interest put options 非控股權益認沽期權 20(b) 57.2 56.3Deferred tax liabilities 遞延稅項負債 270.8 286.5Derivative financial instruments 衍生金融工具 2(b), 13(a) 1.9 –Other liabilities 其他負債 6.5 9.9
Total non-current liabilities 非流動負債總額 2,700.1 2,214.1
Current Liabilities 流動負債Loans and borrowings 貸款及借款 13(b) 56.4 52.6Current portion of long-term debt 長期債務的即期部分 13(b) 28.5 28.3Current portion of lease liabilities 租賃負債的即期部分 16(b) 169.0 –Employee benefits 僱員福利 14 78.3 81.8Trade and other payables 應付賬款及其他應付款項 15 813.1 699.2Current tax liabilities 即期稅項負債 73.7 74.5
Total current liabilities 流動負債總額 1,219.0 936.4
Total liabilities 負債總額 3,919.1 3,150.5
Total equity and liabilities 權益及負債總額 5,826.2 5,141.6
Net current assets 流動資產淨額 483.7 681.3
Total assets less current liabilities 資產總額減流動負債 4,607.2 4,205.2
The accompanying notes form part of the consolidated interim financial statements.隨附附註構成綜合中期財務報表的一部分。

74
綜合權益變動表Consolidated Statements of Changes in Equity
(Expressed in millions of US Dollars, except number of shares) (以百萬美元呈列,股份數目除外)
Note附註
Number of shares
股份數目Share capital
股本
Reserves儲備 Total equity
attributable to equity holders股權持有人應佔權益總額
Non-controlling interests
非控股權益Total equity權益總額
Additional paid-in capital額外繳入股本
Translation reserve換算儲備
Other reserves其他儲備
Retained earnings保留盈利
Six months ended June 30, 2019 截至2019年6月30日止六個月
Balance, January 1, 2019 於2019年1月1日的結餘 1,430,940,380 14.3 1,050.2 (51.4) 83.1 851.6 1,947.8 43.3 1,991.1
Profit for the period 期內溢利 – – – – – 49.1 49.1 9.2 58.3
Other comprehensive income (loss): 其他全面收益(虧損): Changes in fair value of hedges, net of tax 對沖之公允價值變動(除稅後) 13(a), 17(b) – – – – (16.9) – (16.9) – (16.9) Foreign currency translation gains for foreign operations 境外業務外幣匯兌收益 17(b), 18 – – – 2.9 – – 2.9 0.5 3.4
Total comprehensive income (loss) for the period 期內全面收益(虧損)總額 – – – 2.9 (16.9) 49.1 35.1 9.7 44.8
Transactions with owners recorded directly in equity: 直接計入權益的與擁有人的交易: Change in fair value of put options included in equity 計入權益的認沽期權之公允價值變動 20 – – – – – (1.9) (1.9) – (1.9) Cash distributions declared to equity holders 向股權持有人作出之現金分派 5(c) – – – – – (125.0) (125.0) – (125.0) Share-based compensation expense 以股份支付的薪酬開支 14(a) – – – – 7.0 – 7.0 – 7.0 Exercise of share options 行使購股權 12, 14(a) 68,372 0.0 0.2 – 0.0 – 0.2 – 0.2 Dividends paid to non-controlling interests 向非控股權益派付股息 5(c) – – – – – – – (9.1) (9.1)
Balance, June 30, 2019 於2019年6月30日的結餘 1,431,008,752 14.3 1,050.4 (48.5) 73.2 773.8 1,863.2 43.9 1,907.1
Six months ended June 30, 2018 截至2018年6月30日止六個月Balance, January 1, 2018 於2018年1月1日的結餘 1,421,811,102 14.2 1,014.6 (47.2) 75.9 734.0 1,791.5 40.9 1,832.4
Profit for the period 期內溢利 – – – – – 67.8 67.8 10.1 77.9Other comprehensive income (loss): 其他全面收益(虧損): Changes in fair value of hedges, net of tax 對沖之公允價值變動(除稅後) 13(a), 17(b) – – – – 12.0 – 12.0 – 12.0 Foreign currency translation losses for foreign operations 境外業務外幣匯兌虧損 17(b), 18 – – – (4.6) – – (4.6) (2.7) (7.3)
Total comprehensive income (loss) for the period 期內全面收益(虧損)總額 – – – (4.6) 12.0 67.8 75.2 7.4 82.6
Transactions with owners recorded directly in equity: 直接計入權益的與擁有人的交易: Change in fair value of put options included in equity 計入權益的認沽期權之公允價值變動 20 – – – – – (0.8) (0.8) – (0.8) Cash distributions declared to equity holders 向股權持有人作出之現金分派 5(c) – – – – – (110.0) (110.0) – (110.0) Share-based compensation expense 以股份支付的薪酬開支 14(a) – – – – 8.6 – 8.6 – 8.6 Tax effect of outstanding share options 未行使購股權之稅務影響 – – – – (4.3) – (4.3) – (4.3) Exercise of share options 行使購股權 12, 14(a) 8,395,007 0.1 32.7 – (8.5) – 24.3 – 24.3 Dividends paid to non-controlling interests 向非控股權益派付股息 5(c) – – – – – – – (9.7) (9.7)
Balance, June 30, 2018 於2018年6月30日的結餘 1,430,206,109 14.3 1,047.3 (51.8) 83.7 691.0 1,784.5 38.6 1,823.1
The accompanying notes form part of the consolidated interim financial statements.隨附附註構成綜合中期財務報表的一部分。

75Samsonite International S.A. Interim Report 2019 新秀麗國際有限公司 2019年中期報告
(Expressed in millions of US Dollars, except number of shares) (以百萬美元呈列,股份數目除外)
Note附註
Number of shares
股份數目Share capital
股本
Reserves儲備 Total equity
attributable to equity holders股權持有人應佔權益總額
Non-controlling interests
非控股權益Total equity權益總額
Additional paid-in capital額外繳入股本
Translation reserve換算儲備
Other reserves其他儲備
Retained earnings保留盈利
Six months ended June 30, 2019 截至2019年6月30日止六個月
Balance, January 1, 2019 於2019年1月1日的結餘 1,430,940,380 14.3 1,050.2 (51.4) 83.1 851.6 1,947.8 43.3 1,991.1
Profit for the period 期內溢利 – – – – – 49.1 49.1 9.2 58.3
Other comprehensive income (loss): 其他全面收益(虧損): Changes in fair value of hedges, net of tax 對沖之公允價值變動(除稅後) 13(a), 17(b) – – – – (16.9) – (16.9) – (16.9) Foreign currency translation gains for foreign operations 境外業務外幣匯兌收益 17(b), 18 – – – 2.9 – – 2.9 0.5 3.4
Total comprehensive income (loss) for the period 期內全面收益(虧損)總額 – – – 2.9 (16.9) 49.1 35.1 9.7 44.8
Transactions with owners recorded directly in equity: 直接計入權益的與擁有人的交易: Change in fair value of put options included in equity 計入權益的認沽期權之公允價值變動 20 – – – – – (1.9) (1.9) – (1.9) Cash distributions declared to equity holders 向股權持有人作出之現金分派 5(c) – – – – – (125.0) (125.0) – (125.0) Share-based compensation expense 以股份支付的薪酬開支 14(a) – – – – 7.0 – 7.0 – 7.0 Exercise of share options 行使購股權 12, 14(a) 68,372 0.0 0.2 – 0.0 – 0.2 – 0.2 Dividends paid to non-controlling interests 向非控股權益派付股息 5(c) – – – – – – – (9.1) (9.1)
Balance, June 30, 2019 於2019年6月30日的結餘 1,431,008,752 14.3 1,050.4 (48.5) 73.2 773.8 1,863.2 43.9 1,907.1
Six months ended June 30, 2018 截至2018年6月30日止六個月Balance, January 1, 2018 於2018年1月1日的結餘 1,421,811,102 14.2 1,014.6 (47.2) 75.9 734.0 1,791.5 40.9 1,832.4
Profit for the period 期內溢利 – – – – – 67.8 67.8 10.1 77.9Other comprehensive income (loss): 其他全面收益(虧損): Changes in fair value of hedges, net of tax 對沖之公允價值變動(除稅後) 13(a), 17(b) – – – – 12.0 – 12.0 – 12.0 Foreign currency translation losses for foreign operations 境外業務外幣匯兌虧損 17(b), 18 – – – (4.6) – – (4.6) (2.7) (7.3)
Total comprehensive income (loss) for the period 期內全面收益(虧損)總額 – – – (4.6) 12.0 67.8 75.2 7.4 82.6
Transactions with owners recorded directly in equity: 直接計入權益的與擁有人的交易: Change in fair value of put options included in equity 計入權益的認沽期權之公允價值變動 20 – – – – – (0.8) (0.8) – (0.8) Cash distributions declared to equity holders 向股權持有人作出之現金分派 5(c) – – – – – (110.0) (110.0) – (110.0) Share-based compensation expense 以股份支付的薪酬開支 14(a) – – – – 8.6 – 8.6 – 8.6 Tax effect of outstanding share options 未行使購股權之稅務影響 – – – – (4.3) – (4.3) – (4.3) Exercise of share options 行使購股權 12, 14(a) 8,395,007 0.1 32.7 – (8.5) – 24.3 – 24.3 Dividends paid to non-controlling interests 向非控股權益派付股息 5(c) – – – – – – – (9.7) (9.7)
Balance, June 30, 2018 於2018年6月30日的結餘 1,430,206,109 14.3 1,047.3 (51.8) 83.7 691.0 1,784.5 38.6 1,823.1
The accompanying notes form part of the consolidated interim financial statements.隨附附註構成綜合中期財務報表的一部分。

76
Note附註
Six months ended June 30,截至6月30日止六個月
(Expressed in millions of US Dollars) (以百萬美元呈列) 2019 2018
Cash flows from operating activities: 經營活動之現金流量: Profit for the period 期內溢利 58.3 77.9 Adjustments to reconcile profit for the period to net cash generated from operating activities:
作出調整以將期內溢利與經營活動 所得現金淨額進行對賬:
Depreciation 折舊 7 40.1 44.0 Amortization of intangible assets 無形資產攤銷 8 16.1 17.0 Amortization of lease right-of-use assets 租賃使用權資產攤銷 16(a) 99.5 – Impairment of lease right-of-use assets 租賃使用權資產減值 16(a) 21.0 – Impairment of property, plant and equipment 物業、廠房及設備減值 7 8.7 – Change in fair value of put options included in finance costs
計入財務費用的認沽期權之 公允價值變動 18, 20(b) (1.0) (0.9)
Non-cash share-based compensation 以股份支付的非現金薪酬 14(a) 7.0 8.6 Interest expense on borrowings and lease liabilities
借款及租賃負債的利息開支13, 18 50.0 37.2
Non-cash charge to derecognize deferred financing costs
終止確認遞延融資成本的 非現金費用 13, 18 – 53.3
Income tax expense 所得稅開支 17 15.6 30.7
315.3 267.8Changes in operating assets and liabilities: 經營資產及負債變動: Trade and other receivables 應收賬款及其他應收款項 (1.5) (17.7) Inventories 存貨 (3.5) (56.4) Other current assets 其他流動資產 (14.9) (10.4) Trade and other payables 應付賬款及其他應付款項 (19.2) (41.4) Other assets and liabilities 其他資產及負債 0.6 (8.4)
Cash generated from operating activities 經營活動所得現金 276.8 133.5
Interest paid on borrowings and lease liabilities 借款及租賃負債的已付利息 (46.5) (30.5) Income tax paid 已付所得稅 (37.7) (46.8)
Net cash generated from operating activities 經營活動所得現金淨額 192.6 56.2
Cash flows from investing activities: 投資活動之現金流量: Purchases of property, plant and equipment 購買物業、廠房及設備 7 (26.0) (41.1) Other intangible asset additions 其他無形資產添置 8 (7.0) (9.7) Other proceeds 其他所得款項 0.3 0.7
Net cash used in investing activities 投資活動所用現金淨額 (32.7) (50.1)
Cash flows from financing activities: 融資活動之現金流量: Proceeds from issuance of Senior Notes and New Senior Credit Facilities
發行優先票據及新優先信貸融通 所得款項 13 – 1,922.9
Payment and settlement of Original Senior Credit Facilities
支付及結算原優先信貸融通13 – (1,869.7)
Payments of New Term Loan Facilities 支付新定期貸款融通 13 (14.2) – Proceeds (payments) from other current loans and borrowings, net
其他流動貸款及借款的所得款項 (付款),淨額 13 4.2 (4.3)
Principal payments on lease liabilities 租賃負債的本金付款 16(d) (79.5) – Payment of deferred financing costs 支付遞延融資成本 13 – (18.5) Proceeds from the exercise of share options 行使購股權所得款項 13(c), 14 0.2 24.3 Dividend payments to non-controlling interests 向非控股權益派付股息 5, 13(c) (9.1) (9.7)
Net cash (used in) generated from financing activities 融資活動(所用)所得現金淨額 (98.4) 45.0
Net increase in cash and cash equivalents 現金及現金等價物的增加淨額 61.5 51.1Cash and cash equivalents, at January 1 於1月1日的現金及現金等價物 427.7 344.5Effect of exchange rate changes 匯率變動的影響 0.1 (0.2)
Cash and cash equivalents, at June 30 於6月30日的現金及現金等價物 11 489.3 395.4
The accompanying notes form part of the consolidated interim financial statements.隨附附註構成綜合中期財務報表的一部分。
綜合現金流量表Consolidated Statements of Cash Flows

77Samsonite International S.A. Interim Report 2019 新秀麗國際有限公司 2019年中期報告
綜合中期財務報表附註Notes to the Consolidated Interim Financial Statements
1. BackgroundSamsonite International S.A. (the “Company”), together with its consolidated
subsidiaries (the “Group”), is principally engaged in the design, manufacture, sourcing and distribution of luggage, business and computer bags, women’s bags, outdoor and casual bags, travel accessories and slim protective cases for personal electronic devices throughout the world, primarily under the Samsonite®, Tumi®, American Tourister®, Speck®, High Sierra®, Gregory®, Lipault®, Kamiliant®, Hartmann® and eBags® brand names as well as other owned and licensed brand names. The Group sells its products through a variety of wholesale distribution channels, through its company-operated retail stores and through e-commerce. The Group sells its products in North America, Asia, Europe and Latin America.
The Company’s ordinary shares are listed on the Main Board of The Stock Exchange of Hong Kong Limited (the “Stock Exchange”). The Company was incorporated in Luxembourg on March 8, 2011 as a public limited liability company (a société anonyme), whose registered office is 13-15 avenue de la Liberté, L-1931 Luxembourg.
This consolidated interim financial information was authorized for issuance by the Company’s Board of Directors (the “Board”) on August 21, 2019 and is unaudited. The Company’s auditor, KPMG LLP, performed a review in accordance with auditing standards generally accepted in the United States of America applicable to reviews of interim financial information and in accordance with International Standards on Review Engagements 2410, Review of Interim Financial Information Performed by the Independent Auditor of the Entity.
2. Basis of Preparation(a) Statement of Compliance
The consolidated interim financial statements have been prepared in accordance with International Accounting Standard 34, Interim Financial Reporting, and the applicable disclosure provisions of the Rules Governing the Listing of Securities on The Stock Exchange of Hong Kong Limited. The consolidated interim financial statements should be read in conjunction with the Group’s audited consolidated financial statements as of and for the year ended December 31, 2018, which have been prepared in accordance with International Financial Reporting Standards (“IFRS”), which collective term includes all International Accounting Standards (“IAS”) and related interpretations, as issued by the International Accounting Standards Board (the “IASB”).
There were no changes in the Group’s business or economic circumstances which affected the fair value of the financial assets and financial liabilities, whether recognized at fair value or amortized cost, during the six months ended June 30, 2019. There were no transfers between the levels of the fair value hierarchy used in measuring the fair value of financial instruments and there were no changes in the classification of financial assets during the six months ended June 30, 2019.
The results presented for the six months ended June 30, 2019 reflect the adoption of IFRS 16, Leases ("IFRS 16") as of January 1, 2019, which had a material impact on the Company’s financial statements. Additional changes to significant accounting policies that did not materially impact the financial statements are described in Note 3. Comparative amounts have not been restated.
Intangible assets were not tested for impairment, as there were no impairment indicators during the six months ended June 30, 2019.
1. 背景新秀麗國際有限公司(「本公司」,連同其綜合
附屬公司統稱為「本集團」)主要在全球從事設計、製造、採購及分銷行李箱、商務包及電腦包、女士手袋、戶外包及休閒包、旅遊配件以及個人電子設備纖薄保護殼,旗下經營的品牌主要包括新秀麗 ®、Tumi ®、American Tourister ®、Speck ®、High Sierra®、Gregory®、Lipault®、Kamiliant®、Hartmann®及eBags®品牌以及其他自有及獲授權的品牌。本集團通過各種批發分銷渠道、自營的零售店及透過電子商貿銷售其產品。本集團於北美洲、亞洲、歐洲及拉丁美洲銷售其產品。
本公司的普通股於香港聯合交易所有限公司(「聯交所」)主板上市。本公司於 2011 年 3 月 8 日於盧森堡註冊成立為一家公眾有限責任公司,其註冊辦事處位於 13–15 avenue de la Liberté, L-1931 Luxembourg。
本綜合中期財務資料於2019年8月21日經本公司董事會(「董事會」)授權刊發,但未經審核。本公司的核數師KPMG LLP已根據適用於審閱中期財務資料的美利堅合眾國公認核數準則以及按照《國際審閱委聘準則》第 2410 號由實體獨立核數師審閱中期財務資料進行審閱。
2. 編製基準(a) 合規聲明
綜合中期財務報表是根據《國際會計準則》第34 號中期財務報告及《香港聯合交易所有限公司證券上市規則》的適用披露條文編製。綜合中期財務報表應與本集團於 2018 年 12 月 31 日及截至該日止年度的經審核綜合財務報表一併閱讀,該等報表是根據《國際財務報告準則》(「IFRS」)編製。該總稱包括由國際會計準則理事會(「IASB」)頒佈的所有《國際會計準則》(「IAS」)及相關詮釋。
本集團截至2019年6月30日止六個月的業務或影響以公允價值或攤銷成本確認的金融資產及金融負債之公允價值的經濟環境並無變化。截至 2019年6月30日止六個月,用於計量金融工具之公允價值的公允價值等級架構級別之間並無轉變,而金融資產分類亦無變化。
所呈列的截至2019年6月30日止六個月的業績反映自2019年1月1日起採納 IFRS第16號租賃(「IFRS第16號」),對本公司財務報表有重大影響。對財務報表概無重大影響的重大會計政策的額外變更載於附註3。並無重列比較金額。
由於截至2019年6月30日止六個月並無減值跡象,故並無對無形資產進行減值測試。

78
綜合中期財務報表附註 續
Notes to the Consolidated Interim Financial Statements Continued
Income tax expense is recognized based on management’s best estimate of the weighted average annual income tax rate expected for the full financial year applied to the pre-tax income of the interim period, adjusted for certain discrete items for the period.
The Group has not performed independent actuarial valuations of its defined benefit obligation plans as of June 30, 2019.
(b) Basis of MeasurementThe consolidated interim financial information has been prepared on the
historical cost basis, except for the following material item in the consolidated statements of financial position:
• derivative financial instruments are measured at fair value.
(c) Functional and Presentation CurrencyThis financial information is presented using the currency of the primary
economic environment in which the Group operates (“functional currency”). The functional currencies of the significant subsidiaries within the Group are the currencies of the primary economic environment and key business processes of these subsidiaries and include, but are not limited to, United States Dollars, Euros, Renminbi, South Korean Won, Japanese Yen and Indian Rupee.
Unless otherwise stated, the consolidated interim financial statements and related footnotes are presented in the United States Dollar (“USD”), which is the functional and presentation currency of the Company.
(d) Use of Judgments, Estimates and AssumptionsThe preparation of the consolidated interim financial statements in
conformity with IFRS requires the use of certain critical accounting estimates. It also requires management to exercise its judgment in the process of applying the Group’s accounting policies and to make estimates and assumptions that affect the reported amounts of assets and liabilities, disclosure of contingent assets and liabilities at the date of this consolidated interim financial information and the reported amounts of revenues and expenses during the reporting period. The estimates and associated assumptions are based on historical experience and various other factors that are believed to be reasonable under the circumstances, the results of which form the basis of making the judgments about carrying values of assets and liabilities that are not readily apparent from other sources. Actual results may differ from these estimates under different assumptions and conditions.
The estimates and underlying assumptions are reviewed on an ongoing basis. Revisions to accounting estimates are recognized in the period in which the estimate is revised if the revision affects only that period, or in the period of the revision and future periods if the revision affects both current and future periods. No significant changes occurred during the current reporting period of estimates reported in prior periods. New significant judgments related to lessee accounting under IFRS 16 are described in Note 3(b).
所得稅開支是根據管理層就整個財政年度的加權平均年度所得稅率作出的最佳評估並應用於中期期間稅前收入而確認,並就期內若干個別項目作調整。
本集團尚未對其於2019年6月30日的定額福利承擔計劃進行獨立精算估值。
(b) 計量基準綜合中期財務資料已按歷史成本基準編製,惟
下列綜合財務狀況表的重大項目則除外:
• 以公允價值計量的衍生金融工具。
(c) 功能及呈列貨幣本財務資料是以本集團經營所在的主要經濟環
境的貨幣(「功能貨幣」)呈列。本集團主要附屬公司的功能貨幣為此等附屬公司的主要經濟環境及主要業務流程的貨幣,包括(但不限於)美元、歐元、人民幣、韓元、日圓及印度盧比。
除另有載述者外,本綜合中期財務報表及相關腳註是以本公司的功能及呈列貨幣美元(「美元」)呈列。
(d) 採用判斷、估計及假設編製符合 IFRS 的綜合中期財務報表需要使用
若干關鍵會計估計,亦須管理層在應用本集團會計政策時行使其判斷及作出影響於本綜合中期財務資料日期的資產及負債呈報金額、或然資產及負債披露以及於報告期間收益及開支呈報金額的估計及假設。估計及相關假設是根據過往經驗及相信在當時情況下屬合理的各項其他因素而作出,其結果構成就難以自其他途徑取得的資產及負債的賬面值作出判斷的基準。在不同的假設及條件下,實際結果可能會與此等估計不同。
此等估計及相關假設將會持續作出檢討。就會計估計作出的修訂將在此等估計的修訂期間(若修訂僅影響該期間)或修訂期間及未來期間(若修訂影響現時及未來期間)予以確認。於過往期間呈報的估計於本報告期間並無出現重大變動。IFRS第16號有關承租人會計處理的新重大判斷載於附註3(b)。
2. Basis of Preparation Continued
(a) Statement of Compliance Continued
2. 編製基準 續(a) 合規聲明 續
79Samsonite International S.A. Interim Report 2019 新秀麗國際有限公司 2019年中期報告
3. Summary of Significant Accounting Policies(a) Significant Accounting Policies
Except as described below, the accounting policies and judgments applied by the Group used in the preparation of the consolidated interim financial statements are consistent with those applied by the Group in the consolidated annual financial statements as of and for the year ended December 31, 2018. The changes in accounting policies described below are also expected to be reflected in the Group’s consolidated financial statements as of and for the year ending December 31, 2019.
(b) Changes in Accounting PoliciesThe IASB has issued a number of new, revised and amended IFRS. For the
purpose of preparing the consolidated interim financial statements as of and for the six months ended June 30, 2019, the following standards became effective for the current reporting period.
The adoption of IFRS 16 on January 1, 2019 resulted in most of the Group’s leases being recognized on the consolidated statement of financial position, based on a single lessee accounting model. Under the new standard, an asset (the right-to-use the underlying asset) and a financial liability to make minimum contractual payments have been recognized. The only exceptions are short-term leases (lease periods that are twelve months or less), low-value leases (leases that are US$5,000 or less) and the expense relating to variable lease payments not included in the measurement of lease liabilities. The rental cost for short-term, low-value and expense for variable lease payments continue to be recorded in rent expense (see Note 16). The Group has applied IFRS 16 using the modified retrospective approach and therefore the comparative information for 2018 has not been restated and continues to be reported under IAS 17, Leases ("IAS 17") and IFRS Interpretations Committee ("IFRIC") 4, Determining whether an Arrangement Contains a Lease ("IFRIC 4").
The adoption of IFRS 16 affected the accounting for the Group’s operating leases, including retail stores, distribution centers, warehouses, office facilities, equipment and automobiles. There was no significant impact to the accounting for the Group’s previously existing capital leases.
Under IFRS 16, the Group recognizes a lease right-of-use asset and a lease liability at the lease commencement date. The lease right-of-use asset is initially measured at cost which comprises the present value of the lease liability plus any certain direct costs incurred by the Group and any payments made before the commencement date less any lease incentives received. Subsequently, the lease right-of-use asset is measured at cost less any accumulated amortization and impairment losses, and adjusted for certain remeasurements of the lease liability, in accordance with the Group’s accounting policies.
Lease liabilities are initially measured at the present value of the lease payments not yet paid using an incremental borrowing rate. For the Group, lease payments are discounted to present value based on its incremental borrowing rates, which are the costs of obtaining external financing for a corresponding asset with a financing period corresponding to the term of the lease denominated in the currencies in which lease payments are settled. The Group has determined the incremental borrowing rates of each portfolio of leases on a country-by-country basis.
3. 主要會計政策概要(a) 主要會計政策
除下文所述者外,本集團在編製本綜合中期財務報表時所應用的會計政策及判斷與本集團在2018年12月31日及截至該日止年度的綜合年度財務報表所應用者貫徹一致,並預期下文所述會計政策的變動將於本集團於 2019 年 12 月 31 日及截至該日止年度的綜合財務報表中反映。
(b) 會計政策的變動IASB 已頒佈若干新訂、經修訂及經修改的
IFRS。就編製於2019年6月30日及截至該日止六個月的綜合中期財務報表而言,以下準則於本報告期間生效。
於2019年1月1日採納 IFRS第16號令本集團的大部分租賃基於單一承租人會計模式於綜合財務狀況表確認。根據新準則,資產(使用相關資產的權利)及支付最低合約款項的金融負債已獲確認。例外情況為短期租賃(租期為十二個月或以下)、低價值租賃
(租金為 5,000 美元或以下)及計量租賃負債時不計入的可變租賃付款相關開支。短期租賃及低價值租賃的租賃成本及可變租賃付款開支繼續計入租賃開支(見附註16)。本集團以經修訂追溯法應用 IFRS第16 號,因此並無重列 2018 年的比較數字,並繼續根據《國際會計準則》第17號租賃(「IAS第17號」)及
《IFRS詮釋委員會》(「IFRIC」)第4號釐定安排是否包含租賃呈報。
採納 IFRS第16號影響本集團經營租賃(包括零售商店、配送中心、倉庫、辦公設施、設備及汽車)的會計處理,對本集團過往資本租賃的會計處理並無重大影響。
根據 IFRS 第 16 號,本集團於起租日確認租賃使用權資產及租賃負債。租賃使用權資產初步按成本計量,成本包括租賃負債的現值加本集團產生的任何特定直接成本及起租日前任何付款減已收的任何租賃優惠。其後,租賃使用權資產根據本集團會計政策以成本減累計攤銷及減值虧損計量,並就租賃負債的若干重新計量調整。
租賃負債初始使用增量借款利率按尚未支付之租賃付款的現值計量。本集團的租賃付款基於增量借款利率貼現至現值,即在等於租期的融資期間就資產獲取外部融資的成本,以租賃付款結算貨幣計值。本集團已按國家釐定各租賃組合的增量借款利率。
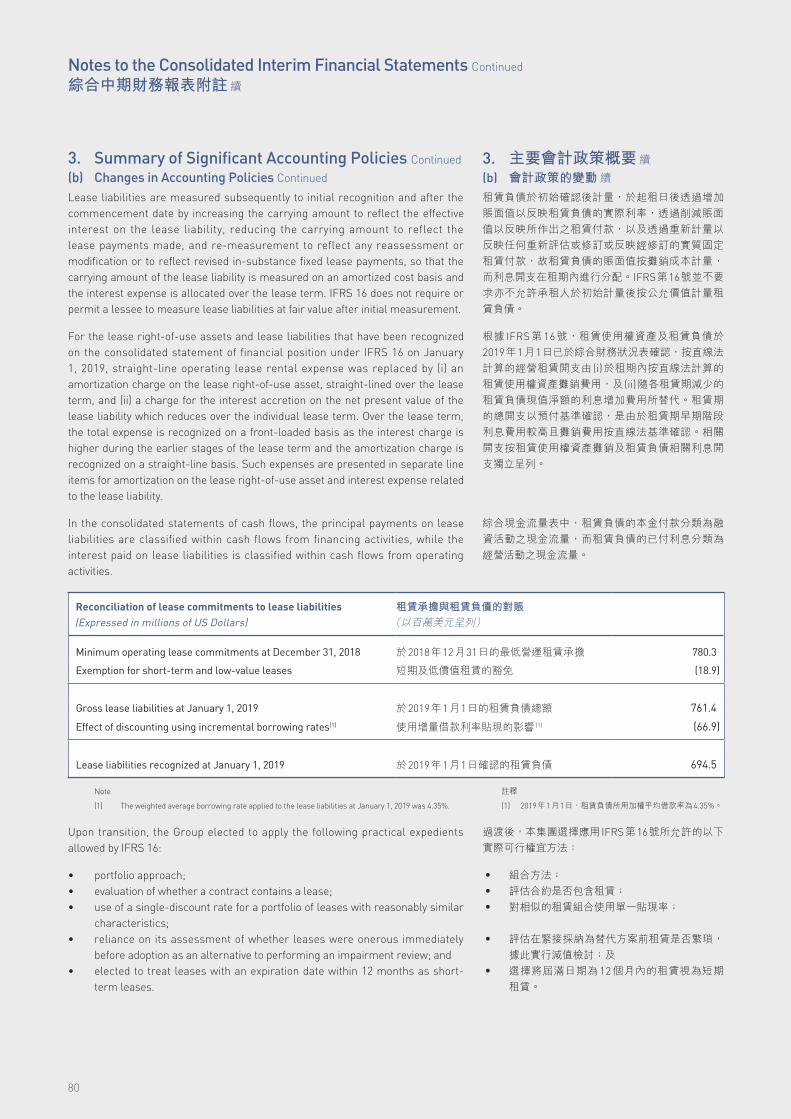
80
綜合中期財務報表附註 續
Notes to the Consolidated Interim Financial Statements Continued
Lease liabilities are measured subsequently to initial recognition and after the commencement date by increasing the carrying amount to reflect the effective interest on the lease liability, reducing the carrying amount to reflect the lease payments made, and re-measurement to reflect any reassessment or modification or to reflect revised in-substance fixed lease payments, so that the carrying amount of the lease liability is measured on an amortized cost basis and the interest expense is allocated over the lease term. IFRS 16 does not require or permit a lessee to measure lease liabilities at fair value after initial measurement.
For the lease right-of-use assets and lease liabilities that have been recognized on the consolidated statement of financial position under IFRS 16 on January 1, 2019, straight-line operating lease rental expense was replaced by (i) an amortization charge on the lease right-of-use asset, straight-lined over the lease term, and (ii) a charge for the interest accretion on the net present value of the lease liability which reduces over the individual lease term. Over the lease term, the total expense is recognized on a front-loaded basis as the interest charge is higher during the earlier stages of the lease term and the amortization charge is recognized on a straight-line basis. Such expenses are presented in separate line items for amortization on the lease right-of-use asset and interest expense related to the lease liability.
In the consolidated statements of cash flows, the principal payments on lease liabilities are classified within cash flows from financing activities, while the interest paid on lease liabilities is classified within cash flows from operating activities.
Reconciliation of lease commitments to lease liabilities(Expressed in millions of US Dollars)
租賃承擔與租賃負債的對賬(以百萬美元呈列)
Minimum operating lease commitments at December 31, 2018 於2018年12月31日的最低營運租賃承擔 780.3
Exemption for short-term and low-value leases 短期及低價值租賃的豁免 (18.9)
Gross lease liabilities at January 1, 2019 於2019年1月1日的租賃負債總額 761.4
Effect of discounting using incremental borrowing rates(1) 使用增量借款利率貼現的影響 (1) (66.9)
Lease liabilities recognized at January 1, 2019 於2019年1月1日確認的租賃負債 694.5
Note
(1) The weighted average borrowing rate applied to the lease liabilities at January 1, 2019 was 4.35%.
Upon transition, the Group elected to apply the following practical expedients allowed by IFRS 16:
• portfolio approach;• evaluation of whether a contract contains a lease;• use of a single-discount rate for a portfolio of leases with reasonably similar
characteristics;• reliance on its assessment of whether leases were onerous immediately
before adoption as an alternative to performing an impairment review; and• elected to treat leases with an expiration date within 12 months as short-
term leases.
租賃負債於初始確認後計量,於起租日後透過增加賬面值以反映租賃負債的實際利率,透過削減賬面值以反映所作出之租賃付款,以及透過重新計量以反映任何重新評估或修訂或反映經修訂的實質固定租賃付款,故租賃負債的賬面值按攤銷成本計量,而利息開支在租期內進行分配。IFRS第16號並不要求亦不允許承租人於初始計量後按公允價值計量租賃負債。
根據 IFRS 第 16 號,租賃使用權資產及租賃負債於2019年1月1日已於綜合財務狀況表確認,按直線法計算的經營租賃開支由 (i)於租期內按直線法計算的租賃使用權資產攤銷費用,及 (ii)隨各租賃期減少的租賃負債現值淨額的利息增加費用所替代。租賃期的總開支以預付基準確認,是由於租賃期早期階段利息費用較高且攤銷費用按直線法基準確認。相關開支按租賃使用權資產攤銷及租賃負債相關利息開支獨立呈列。
綜合現金流量表中,租賃負債的本金付款分類為融資活動之現金流量,而租賃負債的已付利息分類為經營活動之現金流量。
3. Summary of Significant Accounting Policies Continued
(b) Changes in Accounting Policies Continued
3. 主要會計政策概要 續(b) 會計政策的變動 續
註釋
(1) 2019年1月1日,租賃負債所用加權平均借款率為4.35%。
過渡後,本集團選擇應用 IFRS第16號所允許的以下實際可行權宜方法:
• 組合方法;• 評估合約是否包含租賃;• 對相似的租賃組合使用單一貼現率;
• 評估在緊接採納為替代方案前租賃是否繁瑣,據此實行減值檢討;及
• 選擇將屆滿日期為 12 個月內的租賃視為短期租賃。
81Samsonite International S.A. Interim Report 2019 新秀麗國際有限公司 2019年中期報告
Further discussion of the impacts of IFRS 16 as of and for the six months ended June 30, 2019 is disclosed in Note 16.
In June 2017, IFRIC 23, Uncertainty over Income Tax Treatments ("IFRIC 23") was issued. IFRIC 23 clarifies the accounting for uncertainties related to income taxes and is applied to the determination of taxable profit (loss), tax bases, unused tax losses, unused tax credits and tax rates, when there is uncertainty over income tax treatments under IAS 12, Income Taxes. IFRIC 23 became effective for annual reporting periods beginning on January 1, 2019. The adoption of IFRIC 23 did not have a material impact on the Group’s consolidated financial statements.
In February 2018, the IASB issued Plan Amendment, Curtailment or Settlement (Amendments to IAS 19) . The amendments are: (i) if a plan amendment, curtailment or settlement occurs, it is now mandatory that the current service cost and the net interest for the period after the remeasurement are determined using the assumptions used for the remeasurement; and (ii) the amendments have been included to clarify the effect of a plan amendment, curtailment or settlement on the requirements regarding asset ceiling. The amendments to IAS 19 became effective for annual reporting periods beginning on January 1, 2019. The adoption of Plan Amendment, Curtailment or Settlement (Amendments to IAS 19) did not have a material impact on the Group’s consolidated financial statements.
(c) New Standards and Interpretations Not Yet AdoptedThere were no new standards or interpretations not yet adopted that would
have a material impact on the Group’s financial statements.
4. Segment ReportingThe reportable segments for the six months ended June 30, 2019 are
consistent with the reportable segments included within the annual consolidated financial statements as of and for the year ended December 31, 2018.
The Group’s segment reporting information is based on geographical areas, representative of how the Group’s business is managed and its operating results are evaluated. The Group’s operations are organized primarily as follows: (i) “North America”; (ii) “Asia”; (iii) “Europe”; (iv) “Latin America”; and (v) “Corporate”.
Information regarding the results of each reportable segment is included below. Performance is measured based on segment operating profit or loss as included in the internal management reports that are reviewed by the Chief Operating Decision Maker. Segment operating profit or loss is used to measure performance as management believes that such information is the most relevant in evaluating the results of the Group’s segments.
IFRS第16號於2019年6月30日及截至該日止六個月的影響之詳細討論載於附註16。
於 2017 年 6 月,IFRIC 第 23 號所得稅不確定性的處理方法(「IFRIC第23號」)頒佈。IFRIC第23號澄清與所得稅相關的不確定性的會計處理,並於根據 IAS第12號所得稅的所得稅處理方法存在不確定性時予以應用,以釐定應課稅溢利(虧損)、稅基、未動用稅項虧損、未動用稅項抵免及稅率。IFRIC 第 23 號於 2019 年 1 月 1 日開始的年度報告期間生效。採納IFRIC第23號對本集團綜合財務報表並無重大影響。
於 2018 年 2 月,IASB 頒佈計劃修訂、縮減或結算(IAS 第 19 號的修訂)。該修訂為 (i) 倘發生計劃修
訂、縮減或結算,則目前強制經重新計量後的期內當前服務成本及淨利息採用重新計量所用假設釐定;及 (ii)已計入修訂以澄清計劃修訂、縮減或結算對資產上限要求的影響。IAS第19號的修訂於2019年 1 月 1 日開始的年度報告期間生效。採納計劃修訂、縮減或結算(IAS第 19 號的修訂)對本集團綜合財務報表並無重大影響。
(c) 尚未採納的新準則及詮釋尚未採納的新訂準則或詮釋不會對本集團財務
報表造成重大影響。
4. 分部報告截至 2019 年 6 月 30 日止六個月的可報告分部
與於 2018 年 12 月 31 日及截至該日止年度的年度綜合財務報表內的可報告分部一致。
本集團的分部報告資料是根據地理位置,顯示本集團如何管理業務及評估其經營業績。本集團的業務主要劃分如下:(i)「北美洲」;(ii)「亞洲」;(iii)「歐洲」;(iv)「拉丁美洲」;及 (v)「企業」。
與各可報告分部業績有關的資料載於下表。表現是根據包含於由主要營運決策者審閱的內部管理報告的分部經營溢利或虧損計量。由於管理層相信該等資料與本集團分部業績評估最相關,故分部經營溢利或虧損被用於計量表現。
3. Summary of Significant Accounting Policies Continued
(b) Changes in Accounting Policies Continued
3. 主要會計政策概要 續(b) 會計政策的變動 續

82
綜合中期財務報表附註 續
Notes to the Consolidated Interim Financial Statements Continued
Segment information as of and for the six months ended June 30, 2019 and June 30, 2018 is as follows:
(Expressed in millions of US Dollars) (以百萬美元呈列)
Six months ended June 30, 2019截至2019年6月30日止六個月
North America北美洲
Asia亞洲
Europe歐洲
Latin America拉丁美洲
Corporate企業
Consolidated合計
External revenues 外部收益 654.3 643.6 371.3 84.7 1.8 1,755.7
Operating profit (loss) 經營溢利(虧損) 34.9 109.7 13.0 (2.6) (31.0) 124.0
Depreciation and amortization(1) 折舊及攤銷 (1) 54.7 49.5 39.8 10.4 1.3 155.7
Capital expenditures 資本開支 5.0 6.9 10.2 1.1 2.8 26.0
Impairment of lease right-of-use assets
租賃使用權資產 減值 14.8 1.0 5.3 – 0.0 21.0
Impairment of property, plant and equipment
物業、廠房及 設備減值 6.2 – 2.5 – – 8.7
Finance income 財務收入 0.1 0.3 0.1 0.0 0.4 0.9
Finance costs(2) 財務費用 (2) (8.5) (3.5) (4.3) (1.6) (33.1) (51.0)
Income tax (expense) benefit 所得稅(開支)抵免 5.6 (15.2) 2.2 0.4 (8.6) (15.6)
Total assets 資產總額 2,877.7 1,419.1 831.6 174.7 523.0 5,826.2
Total liabilities 負債總額 1,771.1 589.1 508.1 98.2 952.6 3,919.1
(Expressed in millions of US Dollars) (以百萬美元呈列)
Six months ended June 30, 2018截至2018年6月30日止六個月
North America北美洲
Asia亞洲
Europe歐洲
Latin America拉丁美洲
Corporate企業
Consolidated合計
External revenues 外部收益 695.0 668.3 392.7 90.6 2.1 1,848.7
Operating profit (loss) 經營溢利(虧損) 78.7 120.8 36.5 2.5 (36.7) 201.8
Depreciation and amortization(1) 折舊及攤銷 (1) 21.6 19.4 15.5 3.5 1.0 61.0
Capital expenditures 資本開支 10.5 9.8 15.7 3.7 1.4 41.1
Finance income 財務收入 0.0 0.3 0.1 0.0 0.0 0.4
Finance costs(2) 財務費用 (2) (0.2) (2.6) (3.9) (1.4) (85.5) (93.6)
Income tax (expense) benefit 所得稅(開支)抵免 (9.2) (18.0) (6.8) (0.7) 4.0 (30.7)
Total assets 資產總額 2,328.5 1,282.2 688.2 111.0 761.6 5,171.5
Total liabilities 負債總額 1,129.2 495.1 355.7 38.3 1,330.1 3,348.4
Notes
(1) Depreciation and amortization expense for the six months ended June 30, 2019 includes amortization expense associated with lease right-of-use assets recorded in accordance with IFRS 16. Comparative amounts for the six months ended June 30, 2018 have not been restated (see further discussion in Note 3(b)).
(2) Finance costs for the six months ended June 30, 2019 primarily include interest expense on financial liabilities, which includes the amortization of deferred financing costs, interest expense on lease liabilities in accordance with IFRS 16 (see Note 3(b)), change in the fair value of put options and unrealized (gains) losses on foreign exchange that are presented on a net basis. Finance costs for the six months ended June 30, 2018 primarily include interest expense on financial liabilities, which includes the amortization of deferred financing costs, the non-cash charge of US$53.3 million to derecognize the deferred financing costs associated with the Original Senior Credit Facilities in conjunction with the 2018 Refinancing (see Note 13(a)), change in the fair value of put options and unrealized (gains) losses on foreign exchange that are presented on a net basis.
於2019年6月30日及2018年6月30日及截至該日止六個月的分部資料如下:
4. Segment Reporting Continued 4. 分部報告 續
註釋
(1) 截至2019年6月30日止六個月的折舊及攤銷費用包括根據 IFRS 第 16 號入賬的租賃使用權資產相關攤銷費用。並無重列截至2018年6月30日止六個月的比較數字(見附註3(b)的進一步討論)。
(2) 截至2019年6月30日止六個月的財務費用主要包括按淨額基準呈列的金融負債的利息開支(包括攤銷遞延融資成本)、IFRS第16號規定的租賃負債的利息開支(請參閱附註3(b))、認沽期權之公允價值變動及未變現外匯(收益)虧損。截至2018年6月30日止六個月的財務費用主要包括按淨額基準呈列的金融負債的利息開支
(包括攤銷遞延融資成本)、於2018 年再融資(見附註13(a))的同時終止確認與原優先信貸融通相關的遞延融資成本的非現金費用53.3百萬美元、認沽期權之公允價值變動及未變現外匯(收益)虧損。

83Samsonite International S.A. Interim Report 2019 新秀麗國際有限公司 2019年中期報告
The following table sets forth a disaggregation of net sales by brand for the six months ended June 30, 2019 and June 30, 2018:
(Expressed in millions of US Dollars) (以百萬美元呈列)
Six months ended June 30,截至6月30日止六個月
2019 2018
Net sales by brand: 按品牌劃分的銷售淨額:
Samsonite 新秀麗 792.6 847.3
Tumi Tumi 363.4 353.2
American Tourister American Tourister 320.6 338.9
Speck Speck 50.2 56.2
High Sierra High Sierra 39.3 45.0
Gregory Gregory 34.9 29.1
Other(1) 其他 (1) 154.8 179.0
Net sales 銷售淨額 1,755.7 1,848.7
Note
(1) "Other" includes certain other brands owned by the Group, such as Kamiliant, Lipault, Hartmann, eBags, Saxoline, Xtrem and Secret, as well as third party brands sold through the Group’s Rolling Luggage and Chic Accent retail stores and the eBags e-commerce website.
The following table sets forth a disaggregation of net sales by product category for the six months ended June 30, 2019 and June 30, 2018:
(Expressed in millions of US Dollars) (以百萬美元呈列)
Six months ended June 30,截至6月30日止六個月
2019 2018
Net sales by product category: 按產品類別劃分的銷售淨額:
Travel 旅遊 1,051.1 1,119.1
Non-travel(1) 非旅遊 (1) 704.7 729.6
Net sales 銷售淨額 1,755.7 1,848.7
Note
(1) The non-travel category comprises business, casual, accessories and other products.
下表載列截至2019年6月30日及2018年6月30日止六個月按品牌劃分的銷售淨額明細:
4. Segment Reporting Continued 4. 分部報告 續
註釋
(1) 「其他」包括Kamil iant 、Lipault 、Hartmann 、eBags、Saxoline、Xtrem 及Secret 等本集團若干其他自有品牌,以及透過Rolling Luggage、Chic Accent零售店及eBags電子商貿網站出售的第三方品牌。
下表載列截至2019年6月30日及2018年6月30日止六個月按產品類別劃分的銷售淨額明細:
註釋
(1) 非旅遊類別包括商務、休閒、配件及其他產品。

84
綜合中期財務報表附註 續
Notes to the Consolidated Interim Financial Statements Continued
The following table sets forth a disaggregation of net sales by distribution channel for the six months ended June 30, 2019 and June 30, 2018:
(Expressed in millions of US Dollars) (以百萬美元呈列)
Six months ended June 30,截至6月30日止六個月
2019 2018
Net sales by distribution channel: 按分銷渠道劃分的銷售淨額:
Wholesale 批發 1,129.1 1,226.0
Direct-to-consumer ("DTC")(1) 直接面向消費者(「DTC」)(1) 624.8 620.6
Other(2) 其他 (2) 1.8 2.1
Net sales 銷售淨額 1,755.7 1,848.7
Notes
(1) DTC, or direct-to-consumer, includes bricks-and-mortar retail and e-commerce sites owned and operated by the Group.
(2) “Other” primarily consists of licensing revenue.
5. Earnings Per Share(a) Basic
The calculation of basic earnings per share ("EPS") is based on the profit attributable to the equity holders of the Company for the six months ended June 30, 2019 and June 30, 2018.
(Expressed in millions of US Dollars, except share and per share data) (以百萬美元呈列,股份及每股數據除外)
Six months ended June 30,截至6月30日止六個月
2019 2018
Issued ordinary shares at the beginning of the period
期初已發行普通股1,430,940,380 1,421,811,102
Weighted-average impact of share options exercised during the period
期內已行使購股權的加權平均影響38,805 3,094,926
Weighted-average number of shares for the period
期內股份的加權平均數1,430,979,185 1,424,906,028
Profit attributable to the equity holders 股權持有人應佔溢利 49.1 67.8
Basic EPS (Expressed in US Dollars per share)
每股基本盈利 (以每股美元呈列) 0.034 0.048
For the six months ended June 30, 2019, basic EPS was negatively impacted by the non-cash impairment charge (as defined below) of US$29.7 million and the US$7.2 million in costs to implement profit improvement initiatives (net of tax). For the six months ended June 30, 2018, basic EPS was negatively impacted by the non-cash charge of US$53.3 million to derecognize the deferred financing costs associated with the Original Senior Credit Facilities in conjunction with the 2018 Refinancing and the related tax impact (see note 13(a)).
下表載列截至2019年6月30日及2018年6月30日止六個月按分銷渠道劃分的銷售淨額明細:
註釋
(1) DTC(或直接面向消費者)包括本集團擁有及運營的實體零售和電子商貿網站。
(2) 「其他」主要包括授權收入。
5. 每股盈利(a) 基本
截至 2019 年6月30 日及 2018 年6月30 日止六個月,每股基本盈利(「每股盈利」)是根據本公司股權持有人應佔溢利計算。
4. Segment Reporting Continued 4. 分部報告 續
截至2019年6月30日止六個月,每股基本盈利受到非現金減值費用(定義見下文)29.7百萬美元及實施溢利改善措施的成本7.2百萬美元(已扣除稅務)之負面影響。截至2018年6月30日止六個月,每股基本盈利受到2018年再融資的同時終止確認與原優先信貸融通相關的遞延融資成本的非現金費用53.3百萬美元及相關稅務影響(見附註13(a))之負面影響。

85Samsonite International S.A. Interim Report 2019 新秀麗國際有限公司 2019年中期報告
(b) DilutedDilutive EPS is calculated by adjusting the weighted-average number of
ordinary shares outstanding to assume conversion of all dilutive potential ordinary shares.
(Expressed in millions of US Dollars, except share and per share data) (以百萬美元呈列,股份及每股數據除外)
Six months ended June 30,截至6月30日止六個月
2019 2018
Weighted-average number of ordinary shares (basic) at end of the period
期末普通股的加權平均數(基本)1,430,979,185 1,424,906,028
Effect of share options and restricted share units
購股權及受限制股份單位影響2,686,749 15,462,021
Weighted-average number of shares for the period
期內股份的加權平均數1,433,665,934 1,440,368,049
Profit attributable to the equity holders 股權持有人應佔溢利 49.1 67.8
Diluted EPS (Expressed in US Dollars per share)
每股攤薄盈利 (以每股美元呈列) 0.034 0.047
Diluted EPS was impacted by the same factors noted above for basic EPS. At June 30, 2019 and June 30, 2018, 88,430,795 and 20,437,071 unvested share awards, respectively, were excluded from the diluted weighted-average number of ordinary shares calculation because their effect would have been anti-dilutive.
(c) Dividends and DistributionsOn March 13, 2019, the Company’s Board of Directors recommended that a
cash distribution in the amount of US$125.0 million, or approximately US$0.0873 per share, be made to the Company’s shareholders, a 13.6% increase from the US$110.0 million distribution paid in 2018. The shareholders approved this distribution on June 6, 2019 at the Company’s Annual General Meeting and the distribution was paid on July 16, 2019.
On March 14, 2018, the Company’s Board of Directors recommended that a cash distribution in the amount of US$110.0 million, or approximately US$0.0771 per share, be made to the Company’s shareholders of record on June 15, 2018 from its ad hoc distributable reserve. The shareholders approved this distribution on June 7, 2018 at the Company’s Annual General Meeting and the distribution was paid on July 12, 2018.
Dividend payments to non-controlling interests amounted to US$9.1 million and US$9.7 million during the six months ended June 30, 2019 and June 30, 2018, respectively.
No other dividends or distributions were declared or paid during the six months ended June 30, 2019 and June 30, 2018.
6. Seasonality of OperationsThere is some seasonal fluctuation in the business activity of the Group and,
as a result, net sales and working capital requirements may fluctuate from period to period.
(b) 攤薄每股攤薄盈利是經調整已發行普通股的加權平
均數,以假設所有可攤薄的潛在普通股獲兌換後而計算。
5. Earnings Per Share Continued 5. 每股盈利 續
每股攤薄盈利亦受上文所述影響每股基本盈利之因素影響。於 2019 年 6 月 30 日及 2018 年 6 月 30日,計算經攤薄加權平均普通股數時已分別撇除88,430,795份及20,437,071份未歸屬的股份獎勵,因為該等股份獎勵具有反攤薄作用。
(c) 股息及分派於 2019 年 3 月 13 日,本公司董事會建議向本
公司股東作出 125.0 百萬美元或每股約 0.0873 美元的現金分派,較 2018 年派付的 110.0 百萬美元增加13.6%。股東於2019年6月6日舉行的本公司股東週年大會上批准此項分派,而分派已於2019年7月16日派付。
於2018年3月14日,本公司董事會建議運用特別可供分派儲備向於2018年6月15日名列股東名冊的本公司股東作出110.0百萬美元或每股約0.0771美元的現金分派。股東於 2018 年 6 月 7 日舉行的股東週年大會上批准此項分派,而分派已於2018年7月12日派付。
截至2019年6月30日及2018年6月30日止六個月,向非控股權益派付的股息分別為9.1百萬美元及9.7百萬美元。
截至2019年6月30日及2018年6月30日止六個月,本公司並無宣派或派付任何其他股息或分派。
6. 業務季節性本集團的業務活動有若干季節性波動,故此銷
售淨額及營運資金需求或會在不同期間出現波動。

86
綜合中期財務報表附註 續
Notes to the Consolidated Interim Financial Statements Continued
7. Property, Plant and EquipmentFor the six months ended June 30, 2019 and June 30, 2018, the cost of
additions to property, plant and equipment was US$26.0 million and US$41.1 million, respectively. Depreciation expense for the six months ended June 30, 2019 and June 30, 2018 amounted to US$40.1 million and US$44.0 million, respectively. Of this amount, US$6.9 million and US$7.5 million was included in cost of sales during the six months ended June 30, 2019 and June 30, 2018, respectively. Remaining amounts were presented in distribution and general and administrative expenses.
In accordance with IAS 36, Impairment of Assets, the Group is required to evaluate its property, plant and equipment for potential impairment whenever events or changes in circumstance indicate that their carrying amount might not be recoverable. Based on the evaluation of loss-making stores in the six months ended June 30, 2019 and the anticipated closure of some of these stores, the Group determined that the carrying amounts of certain property, plant and equipment as of June 30, 2019 exceeded their respective recoverable amounts. The Group recognized an impairment loss reflecting the aggregate difference totaling US$8.7 million for property, plant and equipment of such stores. These impairment losses for the six months ended June 30, 2019 were recorded in the Group’s consolidated income statements in the line item "Impairment of property, plant and equipment and lease right-of-use assets" (see also Note 16 Leases further below).
Capital CommitmentsCapital commitments outstanding as of June 30, 2019 and December 31,
2018 were US$39.2 million and US$39.5 million, respectively, which were not recognized as liabilities in the consolidated statements of financial position as they have not met the recognition criteria.
8. Other Intangible AssetsAmortization expense related to intangible assets for the six months ended
June 30, 2019 and June 30, 2018 amounted to US$16.1 million and US$17.0 million, respectively, which was included within distribution expenses on the consolidated income statements.
In accordance with IAS 36, Impairment of Assets, the Group is required to evaluate its intangible assets for potential impairment whenever events or changes in circumstance indicate that their carrying amount might not be recoverable. There were no impairment indicators for intangible assets during the six months ended June 30, 2019.
7. 物業、廠房及設備截至 2019 年6月30 日及 2018 年6月30 日止六
個月,添置物業、廠房及設備的成本分別為26.0百萬美元及 41.1 百萬美元。截至 2019 年 6 月 30 日及2018年6月30日止六個月的折舊費用分別為40.1百萬美元及 44.0 百萬美元。該等金額中,6.9 百萬美元及 7.5 百萬美元分別計入截至 2019 年 6 月 30 日及2018年6月30日止六個月的銷售成本。餘下金額於分銷開支以及一般及行政開支內呈列。
根據 IAS 第 36 號資產減值,在出現任何顯示可能無法收回賬面值的事件或情況出現變化時,本集團須評估其物業、廠房及設備的潛在減值。基於評估截至2019年6月30日止六個月錄得虧損的店舖及預計關閉部分該等店舖,本集團認為若干物業、廠房及設備於2019年6月30日的賬面值超過各自的可收回金額。本集團確認反映總差額的該等店舖的物業、廠房及設備的減值虧損共計8.7百萬美元。截至2019年6月30 日止六個月的減值虧損計入本集團綜合收益表「物業、廠房及設備和租賃使用權資產減值」項目(亦請參閱下文附註16租賃)。
資本承擔於 2019 年 6 月 30 日及 2018 年 12 月 31 日尚未
履行的資本承擔分別為39.2百萬美元及39.5百萬美元,該等金額因並未符合確認準則,故並無於綜合財務狀況表中確認為負債。
8. 其他無形資產截至 2019 年6月30 日及 2018 年6月30 日止六
個月的無形資產攤銷費用分別為 16.1 百萬美元及17.0百萬美元,於綜合收益表中呈列為分銷開支。
根據 IAS 第 36 號資產減值,在出現任何顯示可能無法收回賬面值的事件或情況出現變化時,本集團須評估其無形資產的潛在減值。於截至2019年6月30日止六個月尚無無形資產減值跡象。

87Samsonite International S.A. Interim Report 2019 新秀麗國際有限公司 2019年中期報告
9. InventoriesInventories consisted of the following:
(Expressed in millions of US Dollars) (以百萬美元呈列)
June 30, 20192019年6月30日
December 31, 20182018年12月31日
Raw materials 原材料 31.9 37.3
Work in process 在製品 0.7 2.4
Finished goods 製成品 593.6 582.9
Total inventories 總存貨 626.2 622.6
The amounts above as of June 30, 2019 and December 31, 2018 include inventories carried at net realizable value (estimated selling price less costs to sell) of US$67.4 million and US$62.5 million, respectively. During the six months ended June 30, 2019 and June 30, 2018, the write-down of inventories to net realizable value amounted to US$7.4 million and US$4.4 million, respectively. During the six months ended June 30, 2019 and June 30, 2018 the reversal of reserves recognized in profit or loss amounted to US$5.1 million and US$1.4 million, respectively.
10. Trade and Other ReceivablesTrade and other receivables are presented net of related allowances for
doubtful accounts of US$15.8 million and US$14.8 million as of June 30, 2019 and December 31, 2018, respectively.
(a) Aging AnalysisIncluded in trade and other receivables are trade receivables (net of
allowance for doubtful accounts) of US$409.4 million and US$397.9 million as of June 30, 2019 and December 31, 2018, respectively, with the following aging analysis by due date of the respective invoice:
(Expressed in millions of US Dollars) (以百萬美元呈列)
June 30, 20192019年6月30日
December 31, 20182018年12月31日
Current 即期 334.2 322.5
0–30 days past due 逾期0至30日 54.0 57.0
Greater than 30 days past due 逾期超過30日 21.3 18.4
Total trade receivables 應收賬款總額 409.4 397.9
Credit terms are granted based on the credit worthiness of individual customers.
9. 存貨存貨包括以下各項:
上述於2019年6月30日及2018年12月31日的金額包括按可變現淨值(估計售價減銷售成本)列賬的存貨67.4百萬美元及62.5百萬美元。截至2019年6月30 日及 2018 年 6 月 30 日止六個月,存貨撇減至可變現淨值分別為7.4百萬美元及4.4百萬美元。截至2019年6月30日及2018年6月30日止六個月,於損益中確認的儲備撥回分別為5.1百萬美元及1.4百萬美元。
10. 應收賬款及其他應收款項應收賬款及其他應收款項是經扣除呆賬相關撥
備後呈列,呆賬相關撥備於2019年6月30日及2018年12月31日分別為15.8百萬美元及14.8百萬美元。
(a) 賬齡分析於 2019 年 6 月 30 日及 2018 年 12 月 31 日,應
收賬款(已扣除呆賬撥備)分別為 409.4 百萬美元及397.9百萬美元,已計入應收賬款及其他應收款項,其按各發票到期日的賬齡分析如下:
信貸期是根據個別客戶的信譽而授出。

88
綜合中期財務報表附註 續
Notes to the Consolidated Interim Financial Statements Continued
11. 現金及現金等價物
短期投資包括隔夜流動賬戶及定期存款。現金及現金等價物一般以本集團實體各自的功能貨幣計值。於2019年6月30日及2018年12月31日,本集團在使用現金方面並無受到任何限制。
12. 股本截至2019年6月30日止六個月,本公司就本公
司股份獎勵計劃項下授出的已歸屬購股權獲行使而按加權平均行使價每股17.36港元發行68,372股普通股。於2019年上半年,本公司股本並無其他變動。
截至2018年6月30日止六個月,本公司就本公司股份獎勵計劃項下授出的已歸屬購股權獲行使而按加權平均行使價每股22.68港元發行8,395,007股普通股。於2018年上半年,本公司股本並無其他變動。
11. Cash and Cash Equivalents
(Expressed in millions of US Dollars) (以百萬美元呈列)
June 30, 20192019年6月30日
December 31, 20182018年12月31日
Bank balances 銀行結餘 477.8 417.1
Short-term investments 短期投資 11.5 10.6
Total cash and cash equivalents 現金及現金等價物總額 489.3 427.7
Short-term investments comprise overnight sweep accounts and time deposits. Cash and cash equivalents are generally denominated in the functional currency of the respective Group entities. There were no restrictions on the use of any of the Group’s cash as of June 30, 2019 and December 31, 2018.
12. Share CapitalDuring the six months ended June 30, 2019, the Company issued 68,372
ordinary shares at a weighted-average exercise price of HK$17.36 per share in connection with the exercise of vested share options that were granted under the Company’s Share Award Scheme. There were no other movements in the share capital of the Company during the first half of 2019.
During the six months ended June 30, 2018, the Company issued 8,395,007 ordinary shares at a weighted-average exercise price of HK$22.68 per share in connection with the exercise of vested share options that were granted under the Company’s Share Award Scheme. There were no other movements in the share capital of the Company during the first half of 2018.
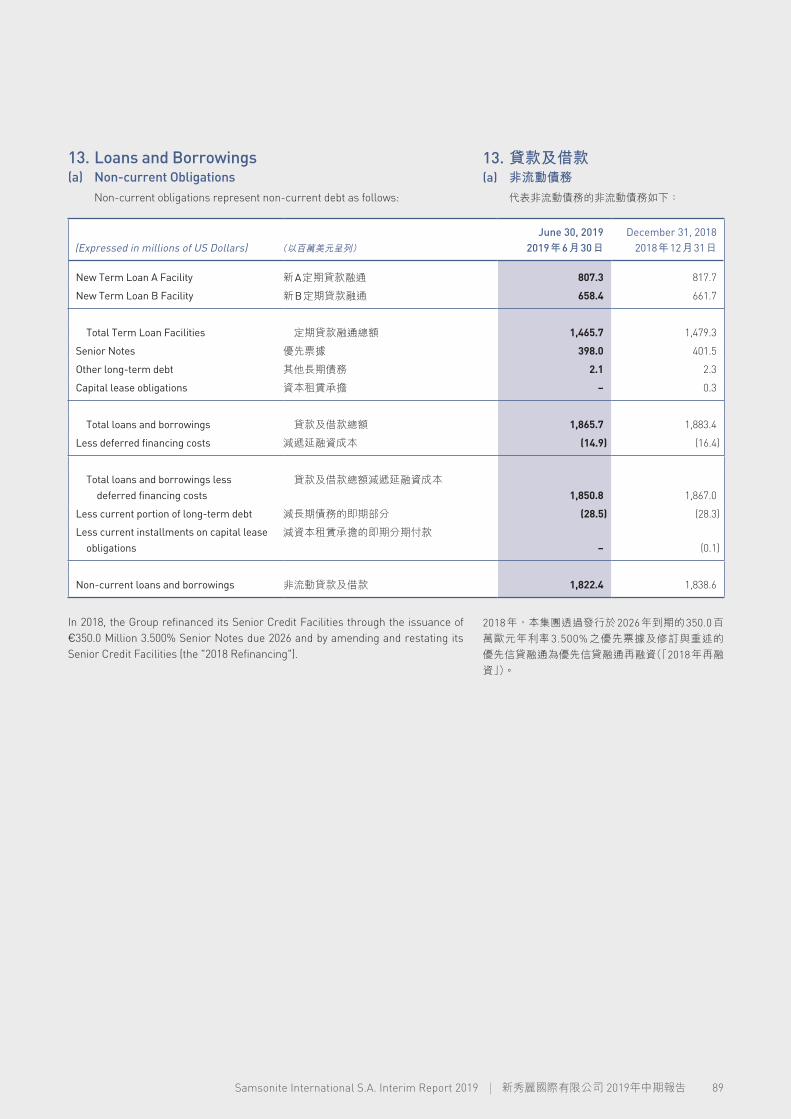
89Samsonite International S.A. Interim Report 2019 新秀麗國際有限公司 2019年中期報告
13. Loans and Borrowings(a) Non-current Obligations
Non-current obligations represent non-current debt as follows:
(Expressed in millions of US Dollars) (以百萬美元呈列)
June 30, 20192019年6月30日
December 31, 20182018年12月31日
New Term Loan A Facility 新A定期貸款融通 807.3 817.7
New Term Loan B Facility 新B定期貸款融通 658.4 661.7
Total Term Loan Facilities 定期貸款融通總額 1,465.7 1,479.3
Senior Notes 優先票據 398.0 401.5
Other long-term debt 其他長期債務 2.1 2.3
Capital lease obligations 資本租賃承擔 – 0.3
Total loans and borrowings 貸款及借款總額 1,865.7 1,883.4
Less deferred financing costs 減遞延融資成本 (14.9) (16.4)
Total loans and borrowings less deferred financing costs
貸款及借款總額減遞延融資成本1,850.8 1,867.0
Less current portion of long-term debt 減長期債務的即期部分 (28.5) (28.3)
Less current installments on capital lease obligations
減資本租賃承擔的即期分期付款– (0.1)
Non-current loans and borrowings 非流動貸款及借款 1,822.4 1,838.6
In 2018, the Group refinanced its Senior Credit Facilities through the issuance of €350.0 Million 3.500% Senior Notes due 2026 and by amending and restating its Senior Credit Facilities (the "2018 Refinancing").
13. 貸款及借款(a) 非流動債務
代表非流動債務的非流動債務如下:
2018年,本集團透過發行於2026年到期的350.0百萬歐元年利率 3.500% 之優先票據及修訂與重述的優先信貸融通為優先信貸融通再融資(「2018年再融資」)。

90
綜合中期財務報表附註 續
Notes to the Consolidated Interim Financial Statements Continued
€350.0 Million 3.500% Senior Notes Due 2026
On April 25, 2018 (the “Issue Date”), Samsonite Finco S.à r.l., a wholly-owned, indirect subsidiary of the Company (the “Issuer”), issued €350.0 million aggregate principal amount of its 3.500% senior notes due 2026 (the “Senior Notes”). The Senior Notes were issued at par pursuant to an Indenture (the “Indenture”), dated the Issue Date, among the Issuer, the Company and certain of its direct or indirect wholly-owned subsidiaries (together with the Company, the “Guarantors”).
On the Issue Date, the gross proceeds from the issuance of the Senior Notes were used, together with the gross proceeds from drawings under the New Senior Credit Facilities (as defined below) and existing cash on hand, to (i) refinance the Original Senior Credit Facilities (as defined below) and (ii) pay certain commissions, fees and expenses in connection thereto.
Maturity, Interest and Redemption
The Senior Notes will mature on May 15, 2026. Interest on the aggregate outstanding principal amount of the Senior Notes accrues at a fixed rate of 3.500% per annum, payable semi-annually in cash in arrears on May 15 and November 15 each year.
At any time prior to May 15, 2021, the Issuer may redeem some or all of the Senior Notes at a price equal to 100% of the principal amount of the Senior Notes redeemed plus accrued and unpaid interest to (but excluding) the redemption date at a “make-whole” premium, which is the present value of all remaining scheduled interest payments to the redemption date using the discount rate (as specified in the Indenture) as of the redemption date plus 50 basis points.
On or after May 15, 2021, the Issuer may redeem all, or from time to time a part, of the Senior Notes at the following redemption prices (expressed as a percentage of the principal amount) plus accrued and unpaid interest and additional amounts, if any, to the applicable redemption date (subject to the right of holders of record on the relevant record date to receive interest due on the relevant interest payment date), if redeemed during the twelve-month period commencing on May 15 of the years set forth below:
Year 年度Redemption Price
贖回價
2021 2021年 101.750%
2022 2022年 100.875%
2023 and thereafter 2023年及其後 100.000%
於2026年到期的350.0百萬歐元年利率3.500%之優先票據
於 2018 年 4 月 25 日(「發行日」),本公司間接持有的全資附屬公司Samsonite Finco S.à r.l(「發行人」)發行於 2026 年到期本金總額為 350.0 百萬歐元年利率3.500%之優先票據(「優先票據」)。優先票據是根據發行人、本公司及其若干直接或間接持有的全資附屬公司(連同本公司統稱為「擔保人」)之間所訂下的一項日期為發行日的契約(「契約」)而按面值發行。
於發行日,發行優先票據的所得款項總額連同新優先信貸融通(定義見下文)下支取的所得款項總額及現有的手頭現金已用於 (i)為原優先信貸融通(定義見下文)進行再融資以及 (ii) 支付與再融資相關的若干佣金、費用及開支。
到期日、利息及贖回
優先票據將於 2026 年 5 月 15 日到期。優先票據的發行在外本金總額按固定年利率3.500%計息,每半年以現金支付一次,於每年5月15日及11月15日到期支付。
於2021年5月15日之前的任何時候,發行人可以贖回部分或全部優先票據,贖回價相等於所贖回優先票據本金額的100%加截至(但不包括)贖回日按「提前贖回」溢價計算的應計及未付利息,「提前贖回」溢價即使用截至贖回日的貼現率(由契約指定)加50個基點計算的截至贖回日的全部餘下預定利息付款的現值。
倘贖回於自以下所列年度的 5月15日開始的十二個月期間內發生,則於2021年5月15日或之後,發行人可按下列贖回價(以本金額的百分比表示)加截至適用贖回日的應計及未付利息及其他款項(如有)贖回全部或不時贖回部分優先票據(受限於有關記錄日期的登記持有人於有關利息支付日期收取應收利息的權利):
13. Loans and Borrowings Continued
(a) Non-current Obligations Continued
13. 貸款及借款 續(a) 非流動債務 續

91Samsonite International S.A. Interim Report 2019 新秀麗國際有限公司 2019年中期報告
In addition, at any time prior to May 15, 2021, the Issuer may redeem up to 40% of the Senior Notes with the net proceeds of one or more specified equity offerings at a redemption price of 103.500% of the principal amount of the Senior Notes redeemed, plus accrued and unpaid interest and additional amounts, if any, to the date of redemption. Furthermore, in the event of certain events defined as constituting a change of control, the Issuer may be required to make an offer to purchase the Senior Notes.
Guarantee and Security
The Senior Notes are guaranteed by the Guarantors on a senior subordinated basis. The Senior Notes are secured by a second-ranking pledge over the shares of the Issuer and a second-ranking pledge over the Issuer’s rights in the proceeds loan in respect of the proceeds of the offering of the Senior Notes (the “Shared Collateral”). The Shared Collateral also secures the New Senior Credit Facilities (as defined below) on a first-ranking basis.
Certain Covenants and Events of Default
The Indenture contains a number of customary negative covenants that, among other things and subject to certain exceptions, may restrict the ability of the Company and its restricted subsidiaries (including the Issuer) to: (i) incur or guarantee additional indebtedness, (ii) make investments or other restricted payments, (iii) create liens, (iv) sell assets and subsidiary stock, (v) pay dividends or make other distributions or repurchase or redeem the capital stock or subordinated debt of the Company or its restricted subsidiaries, (vi) engage in certain transactions with affiliates, (vii) enter into agreements that restrict the payment of dividends by subsidiaries or the repayment of intercompany loans and advances, (viii) engage in mergers or consolidations and (ix) impair the security interests in the Shared Collateral. The Indenture also contains certain customary provisions relating to events of default.
Amended and Restated Senior Credit Facilities Agreement
On May 13, 2016, an indirect wholly-owned subsidiary of the Company entered into a credit and guaranty agreement (the “Original Senior Credit Facilities Agreement”) with certain lenders and financial institutions. The Original Senior Credit Facilities Agreement provided for (1) a US$1,250.0 million senior secured term loan A facility (the “Original Term Loan A Facility”), (2) a US$675.0 million senior secured term loan B facility (the “Original Term Loan B Facility” and, together with the Original Term Loan A Facility, the “Original Term Loan Facilities”) and (3) a US$500.0 million revolving credit facility (the “Original Revolving Credit Facility,” and, together with the Original Term Loan Facilities, the “Original Senior Credit Facilities”).
此外,於2021年5月15日之前的任何時候,發行人可使用一項或多項特定股權發售的所得款項淨額贖回最多40%的優先票據,贖回價為所贖回優先票據本金額的103.500%加截至贖回日的應計及未付利息及其他款項(如有)。而且,倘若發生若干被界定為構成控制權變更的事件,則發行人可能須發出要約以收購優先票據。
擔保及抵押
優先票據由擔保人以優先次級方式提供擔保。優先票據已就發行人的股份作出二級質押,以及就發行人在所得款項貸款(涉及發售優先票據的所得款項)中的權利作出二級質押,作為抵押(「分擔抵押品」)。分擔抵押品亦按一級方式為新優先信貸融通
(定義見下文)提供抵押。
若干契諾及違約事件
契約包含多個可限制本公司及其受限制附屬公司(包括發行人)從事(其中包括)下述事項的能力的慣常負面契諾(若干例外情況除外):(i)舉借或擔保額外負債;(ii)作出投資或其他受限制支付;(iii)設置留置權;(iv)出售資產及附屬股權;(v)派付股息或作出其他分配,或者回購或贖回本公司及其受限制附屬公司的股本或次級債務;(vi)與關聯方進行若干交易;(vii)訂立限制附屬公司派付股息或限制償付公司間貸款和放款的協議;(viii)進行合併或整合;及 (ix)削減分擔抵押品中的抵押權益。契約亦包含關於違約事件的若干慣常規定。
經修訂及重述的優先信貸融通協議
於 2016 年 5 月 13 日,本公司間接持有的全資附屬公司與若干貸款人及財務機構訂立信貸及擔保協議(「原優先信貸融通協議」)。原優先信貸融通協議訂立 (1)一筆為數1,250.0百萬美元的優先有抵押A定期貸款融通(「原A定期貸款融通」)、(2)一筆為數675.0百萬美元的優先有抵押B定期貸款融通(「原B定期貸款融通」,連同原A定期貸款融通統稱「原定期貸款融通」)及 (3)一筆為數500.0百萬美元的循環信貸融通(「原循環信貸融通」,連同原定期貸款融通統稱「原優先信貸融通」)。
13. Loans and Borrowings Continued
(a) Non-current Obligations Continued
€350.0 Million 3.500% Senior Notes Due 2026 Continued
Maturity, Interest and Redemption Continued
13. 貸款及借款 續(a) 非流動債務 續
於2026年到期的350.0百萬歐元年利率3.500%之優先票據 續
到期日、利息及贖回 續

92
綜合中期財務報表附註 續
Notes to the Consolidated Interim Financial Statements Continued
In conjunction with the Senior Notes offering, on April 25, 2018, the Company and certain of its direct and indirect wholly-owned subsidiaries entered into an amended and restated credit and guaranty agreement (the “Credit Agreement”) with certain lenders and financial institutions. The Credit Agreement provides for (1) a new US$828.0 million senior secured term loan A facility (the “New Term Loan A Facility”), (2) a new US$665.0 million senior secured term loan B facility (the “New Term Loan B Facility” and, together with the New Term Loan A Facility, the “New Term Loan Credit Facilities”) and (3) a new US$650.0 million revolving credit facility (the “New Revolving Credit Facility,” and, together with the New Term Loan Credit Facilities, the “New Senior Credit Facilities”).
On the Closing Date (see below), the gross proceeds from drawings under the New Senior Credit Facilities were used, together with the gross proceeds from the offering of the Senior Notes and existing cash on hand, to (i) repay in full the Original Senior Credit Facilities and (ii) pay certain commissions, fees and expenses in connection thereto.
Interest Rate and Fees
Interest on the borrowings under the New Term Loan Credit Facilities and the New Revolving Credit Facility began to accrue on April 25, 2018 when the closing on the New Senior Credit Facilities occurred (the “Closing Date”). Under the terms of the New Senior Credit Facilities:
(a) in respect of the New Term Loan A Facility and the New Revolving Credit Facility, the interest rate payable was set with effect from the Closing Date until the delivery of the financial statements for the fiscal quarter ended September 30, 2018 at the London Interbank Offered Rate (“LIBOR”) plus 1.50% per annum (or a base rate plus 0.50% per annum) and thereafter is based on the lower rate derived from either the first lien net leverage ratio of the Company and its restricted subsidiaries at the end of each fiscal quarter or the Company’s corporate ratings. The interest rate payable on the Original Term Loan A Facility and Original Revolving Credit Facility was an adjusted rate of LIBOR plus 2.00% per annum; and
(b) in respect of the New Term Loan B Facility, the interest rate payable was set with effect from the Closing Date at LIBOR plus 1.75% per annum with a LIBOR floor of 0.00% (or a base rate plus 0.75% per annum). The interest rate payable on the Original Term Loan B Facility was an adjusted rate of LIBOR plus 2.25% per annum with a LIBOR floor of 0.00%.
發售優先票據的同時,於2018年4月25日,本公司及其若干直接與間接持有的全資附屬公司與若干貸款人及財務機構訂立經修訂及重述的信貸及擔保協議(「信貸協議」)。信貸協議訂立 (1) 一筆為數 828.0百萬美元的新優先有抵押 A 定期貸款融通(「新 A 定期貸款融通」)、(2) 一筆為數 665.0 百萬美元的新優先有抵押B定期貸款融通(「新B定期貸款融通」,連同新A定期貸款融通統稱「新定期貸款信貸融通」)及(3) 一筆為數 650.0 百萬美元的新循環信貸融通(「新循環信貸融通」,連同新定期貸款信貸融通統稱「新優先信貸融通」)。
於完成日(見下文),新優先信貸融通下支取的所得款項總額連同發售優先票據的所得款項總額及現有的手頭現金已用於 (i)悉數償還原優先信貸融通以及(ii)支付與再融資相關的若干佣金、費用及開支。
利率及費用
新定期貸款信貸融通及新循環信貸融通項下的借款利息於2018年4月25日(「完成日」)新優先信貸融通完成起開始累計。根據新優先信貸融通的條款:
(a) 就新A定期貸款融通及新循環信貸融通而言,自完成日起直至截至2018年9月30日止財政季度的財務報表交付時為止,應付利率定為倫敦銀行同業拆息(「LIBOR」)另加年利率1.50%(或基準利率另加年利率 0.50%),其後應以下述兩項中產生之較低利率為依據:本公司及其受限制附屬公司於各財政季度末的第一留置權淨槓桿比率,或本公司的企業評級。原A定期貸款融通及原循環信貸融通的應付利率為經調整利率LIBOR另加年利率2.00%;及
(b) 就新B定期貸款融通而言,自完成日起,應付利率定為LIBOR(LIBOR下限為0.00%)另加年利率1.75%(或基準利率另加年利率 0.75%)。原 B 定期貸款融通的應付利率為經調整利率 LIBOR(LIBOR 下限為 0.00%)另加年利率2.25%。
13. Loans and Borrowings Continued
(a) Non-current Obligations Continued
Amended and Restated Senior Credit Facilities Agreement Continued
13. 貸款及借款 續(a) 非流動債務 續
經修訂及重述的優先信貸融通協議 續

93Samsonite International S.A. Interim Report 2019 新秀麗國際有限公司 2019年中期報告
In addition to paying interest on outstanding principal under the New Senior Credit Facilities, the borrowers pay customary agency fees and a commitment fee in respect of the unutilized commitments under the New Revolving Credit Facility. The commitment fee payable with effect from the Closing Date until the delivery of the financial statements for the fiscal quarter ended September 30, 2018 was 0.20% per annum. The commitment fee payable thereafter is based on the lower rate derived from either the first lien net leverage ratio of the Company and its restricted subsidiaries at the end of each fiscal quarter or the Company’s corporate ratings, as applicable.
Amortization and Final Maturity
The New Term Loan A Facility requires scheduled quarterly payments commencing on the first full fiscal quarter ended after the Closing Date, with an annual amortization of 2.5% of the original principal amount of the loans under the New Term Loan A Facility made during each of the first and second years, with a step-up to 5.0% annual amortization during each of the third and fourth years and 7.5% annual amortization during the fifth year, with the balance due and payable on the fifth anniversary of the Closing Date. The New Term Loan B Facility requires scheduled quarterly payments commencing on the quarter ended September 30, 2018, each equal to 0.25% of the original principal amount of the loans under the New Term Loan B Facility, with the balance due and payable on the seventh anniversary of the Closing Date. There is no scheduled amortization of the principal amounts of the loans outstanding under the New Revolving Credit Facility. Any principal amount outstanding under the New Revolving Credit Facility is due and payable on the fifth anniversary of the Closing Date.
Guarantees and Security
The obligations of the borrowers under the New Senior Credit Facilities are unconditionally guaranteed by the Company and certain of the Company’s existing direct or indirect wholly-owned material restricted subsidiaries, and are required to be guaranteed by certain future direct or indirect wholly-owned material restricted subsidiaries organized in the jurisdictions of Luxembourg, Belgium, Canada, Hong Kong, Hungary, Mexico and the United States (the “Credit Facility Guarantors”). All obligations under the New Senior Credit Facilities, and the guarantees of those obligations, are secured, subject to certain exceptions, by substantially all of the assets of the borrowers and the Credit Facility Guarantors (including the Shared Collateral).
除支付新優先信貸融通項下的未償還本金的利息外,借款人須就新循環信貸融通項下的未動用承諾金額支付慣常代理費及承諾費。自完成日起直至截至2018年9月30日止財政季度的財務報表交付時為止,應付承諾費為每年 0.20%。其後應付的承諾費是基於下述兩項中產生之較低利率而上調:本公司及其受限制附屬公司於各財政季度末的第一留置權淨槓桿比率,或本公司的企業評級(倘適用)。
攤銷及最後到期日
新A定期貸款融通規定預定季度付款於截至完成日後首個完整財政季度開始,並於第一及第二年各年就新 A 定期貸款融通項下貸款的原來本金額作出 2.5% 的年度攤銷,於第三及第四年各年上調至5.0%的年度攤銷及第五年上調至7.5%的年度攤銷,而餘額將於完成日第五個週年到期及須予支付。新B 定期貸款融通規定預定季度付款於截至 2018 年 9月30日止季度開始,每次付款相等於新B定期貸款融通項下貸款的原來本金額的 0.25%,而餘額將於完成日第七個週年到期及須予支付。新循環信貸融通項下未償還貸款的本金額概無預定攤銷。任何新循環信貸融通項下未償還本金額將於完成日第五個週年到期及須予支付。
擔保及抵押
借款人於新優先信貸融通項下的債項由本公司及本公司若干現時直接或間接持有的受限制重大全資附屬公司無條件作出擔保,並須由於盧森堡、比利時、加拿大、香港、匈牙利、墨西哥及美國的司法權區成立的若干未來直接或間接持有的受限制重大全資附屬公司(「信貸融通擔保人」)作出擔保。所有新優先信貸融通項下的債項以及該等債項的擔保,均以借款人及信貸融通擔保人的絕大部分資產
(包括分擔抵押品)作抵押(若干例外情況除外)。
13. Loans and Borrowings Continued
(a) Non-current Obligations Continued
Amended and Restated Senior Credit Facilities Agreement Continued
Interest Rate and Fees Continued
13. 貸款及借款 續(a) 非流動債務 續
經修訂及重述的優先信貸融通協議 續
利率及費用 續

94
綜合中期財務報表附註 續
Notes to the Consolidated Interim Financial Statements Continued
Certain Covenants and Events of Default
The New Senior Credit Facilities contain a number of customary negative covenants that, among other things and subject to certain exceptions, may restrict the ability of the Company and its restricted subsidiaries to: (i) incur additional indebtedness; (ii) pay dividends or distributions on its capital stock or redeem, repurchase or retire its capital stock or its other indebtedness; (iii) make investments, loans and acquisitions; (iv) engage in transactions with its affiliates; (v) sell assets, including capital stock of its subsidiaries; (vi) consolidate or merge; (vii) materially alter the business it conducts; (viii) incur liens; and (ix) prepay or amend any junior debt or subordinated debt.
In addition, the Credit Agreement requires the Company and its subsidiaries to meet certain quarterly financial covenants. Commencing with the fiscal quarter ended September 30, 2018, the Company and its subsidiaries are required to maintain (i) a pro forma total net leverage ratio of not greater than 5.50:1.00, which ratio will decrease to 5.25:1.00 for test periods ending in 2020, 5.00:1.00 for test periods ending in 2021 and 4.50:1.00 for test periods ending in 2022; provided that such maximum pro forma total net leverage ratio is subject to a step up of 0.50x from the otherwise applicable ratio, up to a pro forma total net leverage ratio not to exceed 6.00:1.00 for the six fiscal quarter period following the fiscal quarter in which a permitted acquisition has been consummated, and (ii) a pro forma interest consolidated cash interest coverage ratio of not less than 3.00:1.00 (collectively, the “Financial Covenants”). The Financial Covenants only apply for the benefit of the lenders under the New Term Loan A Facility and the lenders under the New Revolving Facility. The Credit Agreement also contains certain customary representations and warranties, affirmative covenants and provisions relating to events of default (including upon a change of control). The Group was in compliance with the financial covenants as of June 30, 2019.
Interest Rate Swaps
The Group maintains interest rate swaps to hedge interest rate exposure under the floating-rate New Senior Credit Facilities by swapping certain US Dollar floating-rate bank borrowings with fixed-rate agreements. The interest rate swap agreements entered into in connection with the Original Senior Credit Facilities remained in effect following the 2018 Refinancing and will terminate on August 31, 2021. The notional amounts of the interest rate swap agreements decrease over time. LIBOR has been fixed at approximately 1.30% under each agreement. Each of the interest rate swap agreements have fixed payments due monthly that commenced January 31, 2017. The interest rate swap transactions qualify as cash flow hedges. As of June 30, 2019 and December 31, 2018, the interest rate swaps were marked-to-market, resulting in a net asset position to the Group in the amount of US$6.5 million and US$25.5 million, respectively, which was recorded as an asset with the effective portion of the gain (loss) deferred to other comprehensive income.
若干契諾及違約事件
新優先信貸融通包含多個可限制本公司及其受限制附屬公司進行(其中包括)以下事項的能力的慣常負面契諾(若干例外情況除外):(i)產生額外負債;(ii)就其股本支付股息或作出分派或贖回、回購或償付其股本或其他負債;(iii)作出投資、貸款及收購;(iv)與其聯屬公司進行交易;(v)出售資產(包括其附屬公司的股本);(vi)整合或合併;(vii)重大改變其現行業務;(viii)設立留置權;及 (ix)預先支付或修訂任何次級債務或後償債務。
此外,信貸協議規定本公司及其附屬公司須達成若干季度財務契諾。自截至 2018 年 9 月 30 日止財政季度起,本公司及其附屬公司須維持 (i) 不高於5.50:1.00的備考總淨槓桿比率(該比率將於截至2020年的測試期間下調至5.25:1.00,截至2021年的測試期間下調至5.00:1.00及截至2022年的測試期間下調至4.50:1.00;惟該最高備考總淨槓桿比率於准許收購完成的財政季度後的六個財政季度期間將由另行適用的比率上調0.50倍至最高不超過6.00:1.00的備考總淨槓桿比率),及 (ii)不低於3.00:1.00的備考合併現金利息保障比率(統稱為「財務契諾」)。財務契諾僅適用於新 A 定期貸款融通下貸款人及新循環融通下貸款人的權益。信貸協議亦包含有關違約事件
(包括控制權變更)的若干慣常聲明及保證、肯定性契諾及條文。截至2019年6月30日,本集團符合財務契諾。
利率掉期
本集團繼續利用固定利率協議與若干浮息美元銀行借款進行利率掉期,以對沖浮息新優先信貸融通項下的利率風險。就原優先信貸融通訂立的利率掉期協議於2018年再融資後仍然有效,將於2021年8 月 31 日終止。利率掉期協議的名義金額隨著時間遞減。各協議項下的固定 LIBOR 約為 1.30%。各利率掉期協議須自2017年1月31日起每月支付固定利息。利率掉期交易可作為現金流量對沖。於2019年6 月 30 日及 2018 年 12 月 31 日,利率掉期按市價計值,導致本集團分別產生淨資產6.5百萬美元及25.5百萬美元,並入賬列作資產,而實際收益(虧損)部分則遞延至其他全面收益。
13. Loans and Borrowings Continued
(a) Non-current Obligations Continued
Amended and Restated Senior Credit Facilities Agreement Continued
13. 貸款及借款 續(a) 非流動債務 續
經修訂及重述的優先信貸融通協議 續

95Samsonite International S.A. Interim Report 2019 新秀麗國際有限公司 2019年中期報告
Cross-currency Swaps
In April 2019, the Group entered into cross-currency swaps which have been designated as net investment hedges. The hedges consist of a US$50.0 million notional loan amount between the Euro and US Dollar and a US$25.0 million notional loan amount between the Japanese Yen and US Dollar. The Group is benefitting from the interest rate spread between the two markets to receive fixed interest income over the five-year contractual period. As of June 30, 2019, the cross-currency swaps qualified as net investment hedges and the monthly mark-to-market is recorded to other comprehensive income. As of June 30, 2019, the cross-currency swaps were marked-to-market, resulting in a net liability position to the Group in the amount of US$1.9 million, which was recorded as a liability with the effective portion of the gain (loss) deferred to other comprehensive income.
Deferred Financing Costs
During the six months ended June 30, 2018, the Group incurred US$18.5 million of deferred financing costs related to the 2018 Refinancing. Such costs were deferred and offset against loans and borrowings and are being amortized using the effective interest method over the life of the Senior Notes and New Senior Credit Facilities. The amortization of deferred financing costs under the Senior Notes and New Senior Credit Facilities, which is included in interest expense, amounted to US$1.5 million and US$0.5 million for the six months ended June 30, 2019 and June 30, 2018, respectively. Prior to the 2018 Refinancing, amortization of deferred financing costs under the Original Senior Credit Facilities, which were extinguished in April 2018, amounted to US$3.3 million for the six months ended June 30, 2018.
Upon extinguishment of the Original Senior Credit Facilities, the Group recognized a non-cash charge of US$53.3 million for the six months ended June 30, 2018 to derecognize the remaining balance of the previously existing deferred financing costs related to the Original Senior Credit Facilities.
交叉貨幣掉期
於2019年4月,本集團訂立交叉貨幣掉期,指定為淨投資對沖。該對沖包括歐元與美元的名義貸款金額50.0百萬美元及日圓與美元的名義貸款金額25.0 百萬美元。本集團自兩個市場的利差獲利,在五年合約期間收取固定利息收入。截至2019年6月30日,交叉貨幣掉期符合淨投資對沖之條件,而每月按市值計價計入其他全面收益。截至2019年6月30日,交叉貨幣掉期按市值計價,導致本集團產生淨負債1.9百萬美元,並入賬列作負債,而實際收益
(虧損)部分則遞延至其他全面收益。
遞延融資成本
截至2018年6月30日止六個月,本集團產生與2018年再融資相關的遞延融資成本18.5百萬美元。該等成本遞延入賬,並被貸款及借款所抵銷,以於優先票據及新優先信貸融通的年期內按實際利率法攤銷。截至2019年6月30日及2018年6月30日止六個月計入利息開支項下的優先票據及新優先信貸融通所涉遞延融資成本攤銷分別為 1.5百萬美元及0.5百萬美元。於2018年再融資前,截至2018年6月30日止六個月的原優先信貸融通(已於 2018 年 4 月清償)所涉遞延融資成本攤銷為3.3百萬美元。
償清原優先信貸融通後,本集團確認截至 2018 年 6月30日止六個月的非現金費用53.3百萬美元以終止確認與原優先信貸融通相關的過往遞延融資成本餘額。
13. Loans and Borrowings Continued
(a) Non-current Obligations Continued
Amended and Restated Senior Credit Facilities Agreement Continued
13. 貸款及借款 續(a) 非流動債務 續
經修訂及重述的優先信貸融通協議 續

96
綜合中期財務報表附註 續
Notes to the Consolidated Interim Financial Statements Continued
(b) Current Obligations and Credit FacilitiesCurrent obligations represent current debt and capital lease obligations and
were as follows:
(Expressed in millions of US Dollars) (以百萬美元呈列)June 30, 2019
2019年6月30日December 31, 2018
2018年12月31日
Current portion of non-current loans and borrowings
非流動貸款及借款的 即期部分 28.5 28.3
New Revolving Credit Facility 新循環信貸融通 22.7 22.9
Other lines of credit 其他信貸額 33.7 29.5
Capital lease obligations 資本租賃承擔 – 0.1
Total current obligations 流動債務總額 84.9 80.9
Revolving Facility
As of June 30, 2019, US$624.3 million was available to be borrowed on the New Revolving Credit Facility as a result of US$22.7 million of outstanding borrowings and the utilization of US$3.0 million of the facility for outstanding letters of credit extended to certain creditors. As of December 31, 2018, US$623.8 million was available to be borrowed on the New Revolving Credit Facility as a result of US$22.9 million of outstanding borrowings and the utilization of US$3.3 million of the facility for outstanding letters of credit extended to certain creditors.
Other Loans and Borrowings
Certain consolidated subsidiaries of the Group maintain credit lines and other loans with various third party lenders in the regions in which they operate. Other loans and borrowings are generally variable rate instruments denominated in the functional currency of the borrowing Group entity. These credit lines provide short-term financing and working capital for the day-to-day business operations of the subsidiaries, including overdraft, bank guarantees, and trade finance facilities. The majority of the credit lines included in other loans and borrowings are uncommitted facilities. The total aggregate amount outstanding under the local facilities was US$33.7 million and US$29.5 million as of June 30, 2019 and December 31, 2018, respectively.
(b) 流動債務及信貸融資代表流動債務及資本租賃承擔的流動債務如
下:
13. Loans and Borrowings Continued 13. 貸款及借款 續
循環信貸
於 2019 年 6 月 30 日,由於未償還的借款 22.7百萬美元及就提供予若干債權人的未償還信用狀而動用3.0百萬美元融資,故新循環信貸融通可予借出的金額為624.3百萬美元。於2018年12月31日,由於未償還的借款22.9百萬美元及就提供予若干債權人的未償還信用狀而動用3.3百萬美元融資,故新循環信貸融通可予借出的金額為623.8百萬美元。
其他貸款及借款
本集團若干綜合附屬公司與該等公司營運所在地區的多名第三方貸款人訂立信貸安排及其他貸款。其他貸款及借款一般為以借款集團實體的功能貨幣計值的浮息工具。該等信貸額為附屬公司日常業務營運提供短期融資及營運資金,包括透支、銀行擔保及貿易融資。此等信貸額(計入其他貸款及借款)大部分為無承諾的融資。於 2019 年 6 月 30 日及2018年12月31日,當地融資項下的未償還總額分別為33.7百萬美元及29.5百萬美元。

97Samsonite International S.A. Interim Report 2019 新秀麗國際有限公司 2019年中期報告
(c) Reconciliation of Movements of Liabilities to Cash Flows Arising from Financing Activities
(Expressed in millions of US Dollars) (以百萬美元呈列)
Liabilities負債
Equity權益
Loans and borrowings(1)
貸款及借款 (1)
Lease liabilities(2)
租賃負債 (2)
Share capital股本
Reserves儲備
Non-controlling
interests非控股權益
Total總計
Balance at January 1, 2019(2) 於2019年1月1日的餘額 (2) 1,921.5 694.5 14.3 1,933.5 43.3 4,607.2
Changes from financing cash flows:
融資現金流量的變動:
Payments of New Term Loan Facilities
支付新定期貸款融通(14.2) – – – – (14.2)
Proceeds (payments) from other current loans and borrowings, net
其他流動貸款及借款 所得款項(付款), 淨額 4.2 – – – – 4.2
Principal payments on lease liabilities
租賃負債的本金付款– (79.5) – – – (79.5)
Proceeds from the exercise of share options
行使購股權所得款項– – 0.0 0.2 – 0.2
Dividend payments to non- controlling interests
向非控股權益派付 股息 – – – – (9.1) (9.1)
Total changes from financing cash flows
融資現金流量的 變動總額 (10.0) (79.5) 0.0 0.2 (9.1) (98.4)
The effect of changes in foreign exchange rates
外匯匯率變動的影響(5.3) (1.4) – – – (6.7)
Other changes: 其他變動:
Liability-related 負債相關
Net additions to lease liabilities 租賃負債增加淨額 – 73.3 – – – 73.3
Interest expense on borrowings and lease liabilities, including amortization of deferred financing costs
借款及租賃負債的 利息開支(包括遞延 融資成本攤銷)
34.6 15.4 – – – 50.0
Interest paid on borrowings and lease liabilities
借款及租賃負債的 已付利息 (31.1) (15.4) – – – (46.5)
Total other changes 其他變動總額 3.5 73.3 – – – 76.8
Other movements in equity(3)
其他權益變動 (3)
– – – (84.8) 9.7 (75.1)
Balance at June 30, 2019 於2019年6月30日的餘額 1,909.7 687.0 14.3 1,848.9 43.9 4,503.8
Notes
(1) Includes accrued interest which is included in trade and other payables in the consolidated statements of financial position.
(2) On January 1, 2019, the Group adopted IFRS 16 and applied the modified retrospective approach (see further discussion in Note 3(b)). Such liabilities did not exist at December 31, 2018.
(3) See consolidated statements of changes in equity for further details on movements during the period.
(c) 負債變動與融資活動所產生現金流量的對賬
13. Loans and Borrowings Continued 13. 貸款及借款 續
註釋
(1) 包括應計利息,計入綜合財務狀況表中的應付賬款及其他應付款項。
(2) 本集團於2019年1月1日採納 IFRS第16號,並應用經修訂追溯法(見附註3(b)的進一步討論)。2018年12月31日並無此等負債。
(3) 有關期內變動的進一步詳情,請參閱綜合權益變動表。

98
綜合中期財務報表附註 續
Notes to the Consolidated Interim Financial Statements Continued
13. Loans and Borrowings Continued
(c) Reconciliation of Movements of Liabilities to Cash Flows Arising from Financing Activities Continued
13. 貸款及借款 續(c) 負債變動與融資活動所產生現金流量的
對賬 續
(Expressed in millions of US Dollars) (以百萬美元呈列)
Liabilities負債
Equity權益
Loans and borrowings(1)
貸款及借款 (1)
Share capital股本
Reserves儲備
Non-controlling
interests非控股權益
Total總計
Balance at January 1, 2018 於2018年1月1日的餘額 1,897.9 14.2 1,777.3 40.9 3,730.3
Changes from financing cash flows:
融資現金流量的變動:
Proceeds from issuance of Senior Notes and New Senior Credit Facilities
發行優先票據及新優先信貸 融通所得款項
1,922.9 – – – 1,922.9
Payment and settlement of Original Senior Credit Facilities
支付及結算原優先信貸融通(1,869.7) – – – (1,869.7)
Proceeds (payments) from other current loans and borrowings, net
其他流動貸款及借款的 所得款項(付款), 淨額 (4.3) – – – (4.3)
Payment of deferred financing costs 支付遞延融資成本 (18.5) – – – (18.5)
Proceeds from the exercise of share options
行使購股權所得款項– – 24.3 – 24.3
Dividend payments to non- controlling interests
向非控股權益支付股息– – – (9.7) (9.7)
Total changes from financing cash flows
融資現金流量的變動總額30.5 – 24.3 (9.7) 45.0
The effect of changes in foreign exchange rates
外匯匯率變動的影響(19.3) – (4.6) (2.8) (26.6)
Other changes: 其他變動:
Liability-related 負債相關
Interest expense on financial liabilities, including amortization of deferred financing costs
金融負債的利息開支 (包括遞延融資成本 攤銷) 37.2 – – – 37.2
Non-cash charge to derecognize deferred financing costs
終止確認遞延融資成本的 非現金費用 53.3 – – – 53.3
Cash paid for interest 支付利息的現金 (30.5) – – – (30.5)
Total other changes 其他變動總額 59.9 – – – 59.9
Other movements in equity(2)
其他權益變動 (2)
– 0.1 (26.8) 10.1 (16.5)
Balance at June 30, 2018 於2018年6月30日的餘額 1,969.0 14.3 1,770.2 38.6 3,792.1
Notes
(1) Includes accrued interest which is included in trade and other payables in the consolidated statements of financial position.
(2) See consolidated statements of changes in equity for further details on movements during the period.
註釋
(1) 包括應計利息,計入綜合財務狀況表中的應付賬款及其他應付款項。
(2) 有關期內變動的進一步詳情,請參閱綜合權益變動表。
99Samsonite International S.A. Interim Report 2019 新秀麗國際有限公司 2019年中期報告
14. Employee BenefitsEmployee benefits expense, which consists of payroll, bonuses, pension
plan expenses, share-based payments and other benefits, amounted to US$278.1 million and US$274.9 million for the six months ended June 30, 2019 and June 30, 2018, respectively. Of these amounts, US$22.5 million and US$21.6 million was included in cost of sales during the six months ended June 30, 2019 and June 30, 2018, respectively. The remaining amounts were presented in distribution expenses and general and administrative expenses.
During the six months ended June 30, 2019, the Group incurred severance costs attributable to headcount reductions totaling US$9.8 million associated with profit improvement initiatives. These amounts were recorded in other expenses in the consolidated income statements for the six months ended June 30, 2019.
Share-based compensation expense of US$7.0 million and US$8.6 million was recognized in the consolidated income statements, with a corresponding increase in equity reserves, for the six months ended June 30, 2019 and June 30, 2018, respectively.
(a) Share-based Payment ArrangementsOn September 14, 2012, the Company’s shareholders adopted the Company’s
Share Award Scheme, which will remain in effect until September 13, 2022. The purpose of the Share Award Scheme is to attract skilled and experienced personnel, to incentivize them to remain with the Group and to motivate them to strive for the future development and expansion of the Group by providing them with the opportunity to acquire equity interests in the Company. Awards under the Share Award Scheme may take the form of either share options or restricted share units (“RSUs”), which may be granted at the discretion of the Remuneration Committee to executive directors of the Company and its subsidiaries, managers employed or engaged by the Group, and/or employees of the Group.
As of July 31, 2019 (the “Latest Practicable Date”), the maximum aggregate number of shares in respect of which awards may be granted pursuant to the Share Award Scheme is 21,891,568 shares, representing approximately 1.5% of the issued share capital of the Company at that date. An individual participant may be granted awards pursuant to the Share Award Scheme in respect of a maximum of 1% of the Company’s total issued shares in any 12-month period. Any grant of awards to an individual participant in excess of this limit is subject to independent shareholder’s approval.
Share Options
The exercise price of share options is determined at the time of grant by the Remuneration Committee in its absolute discretion, but in any event shall not be less than the higher of:
a) the closing price of the shares as stated in the daily quotation sheets issued by the Stock Exchange on the date of grant;
b) the average closing price of the shares as stated in the daily quotation sheets issued by the Stock Exchange for the five business days immediately preceding the date of grant; and
c) the nominal value of the shares.
14. 僱員福利截至 2019 年6月30 日及 2018 年6月30 日止六
個月的僱員福利開支(包括薪金、花紅、退休金計劃開支、以股份支付及其他福利)分別為 278.1百萬美元及274.9百萬美元。該等款項中,22.5百萬美元及21.6百萬美元分別計入截至2019年6月30日及2018年6月30 日止六個月的銷售成本中。剩餘款項呈列於分銷開支以及一般及行政開支中。
截至2019年6月30日止六個月,本集團產生與實施溢利改善措施相關的裁員遣散費合共9.8百萬美元。該等金額計入截至2019年6月30日止六個月綜合收益表的其他開支。
7.0百萬美元及8.6百萬美元的以股份支付的薪酬開支已分別於截至2019年6月30日及2018年6月30日止六個月的綜合收益表中確認,並於權益儲備中相應增加。
(a) 以股份支付安排於 2012 年 9 月 14 日,本公司股東採納本公司
股份獎勵計劃,該計劃有效期至2022年9月13日。股份獎勵計劃的目的是透過提供獲取本公司股權的機會吸引有技能和經驗的人員,激勵彼等留任本集團,以及鼓勵彼等為本集團的未來發展及擴展而努力。股份獎勵計劃項下的獎勵可為購股權或受限制股份單位,按薪酬委員會酌情決定授出的形式授予本公司及其附屬公司執行董事、本集團僱用或聘用的經理及╱或本集團的僱員。
於2019年7月31日(「最後實際可行日期」),根據股份獎勵計劃可予授出的獎勵的最高股份數目合共為21,891,568 股股份,相當於本公司於該日已發行股本約1.5%。個別參與者可於任何12個月期間根據股份獎勵計劃獲授本公司已發行股份總數不超過1%的獎勵。個別參與者如獲授予超出此限額的獎勵,則須經獨立股東批准。
購股權
購股權的行使價於授出時由薪酬委員會全權酌情釐定,惟在任何情況下不得低於以下三者中的較高者:
a) 於授出日聯交所刊發的每日報價表所列股份收市價;
b) 緊接授出日前五個營業日聯交所刊發的每日報價表所列股份平均收市價;及
c) 股份面值。
100
The grant-date fair value of equity-settled share-based payment awards granted to employees is recognized as an employee expense, with a corresponding increase in equity when such options represent equity-settled awards, over the period that the employees unconditionally become entitled to the awards. The amount recognized as an expense is adjusted to reflect the number of awards for which the related service and non-market performance conditions are expected to be met, such that the amount ultimately recognized as an expense is based on the number of awards that meet the related service and non-market performance conditions at the vesting date. For equity-settled share-based payment awards with market performance conditions or non-vesting conditions, the grant-date fair value of the share-based payment is measured to reflect such conditions and there is no true-up for differences between expected and actual outcomes.
Holders of vested share options are entitled to buy newly issued ordinary shares of the Company at a purchase price per share equal to the exercise price of the options. The fair value of services received in return for share options granted is based on the fair value of share options granted measured using the Black-Scholes valuation model. The fair value calculated for share options is inherently subjective due to the assumptions made and the limitations of the model utilized. Shares underlying an award of share options that forfeit (“lapse”) without the issuance of such shares upon the exercise of such options may be available for future grant under the Share Award Scheme.
On June 17, 2019, the Company granted share options exercisable for 10,462,500 ordinary shares to an executive director of the Company, certain key management personnel and other employees of the Group with an exercise price of HK$16.04 per share. Such options are subject to graded (“pro rata”) vesting over a four-year period from the date of grant, with 25% of the options vesting on each anniversary of the date of the grant, subject to the grantee continuing to be employed by, or continuing to provide services to, the Group on the applicable vesting date. Such options have a 10-year term.
Expected volatility is estimated taking into account historic average share price volatility. The expected dividends are based on the Group’s history and expectation of dividend payouts.
The following inputs were used in the measurement of the fair value at grant date of the share-based payment for the share options exercisable for 10,462,500 shares that were granted on June 17, 2019:
Fair value at grant date 於授出日的公允價值 HK$3.08港元
Share price at grant date 於授出日的股價 HK$15.80港元
Exercise price 行使價 HK$16.04港元
Expected volatility (weighted average volatility) 預期波動(加權平均波動) 32.8%
Option life (expected weighted average life) 購股權年期(預期加權平均年期) 6.25 years年
Expected dividends 預期股息 4.3%
Risk-free interest rate (based on government bonds) 無風險利率(以政府債券為基準) 1.6%
綜合中期財務報表附註 續
Notes to the Consolidated Interim Financial Statements Continued
授予僱員以股權結算以股份支付的獎勵,於僱員無條件地獲得獎勵的期間以授出日的公允價值確認為僱員開支,如該等購股權為以股權結算的獎勵,權益亦相應增加。確認為開支的金額會作出調整,以反映預期符合相關服務和非市場績效條件的獎勵數目。最終確認為開支的數額則按歸屬日符合相關服務和非市場績效條件的獎勵數目計算。就附設市場績效條件或不附設歸屬條件的以股權結算以股份支付的獎勵而言,以股份支付的薪酬於授出日期公允價值計量會反映有關條件,並無調整預期及實際結果之間的差額。
已歸屬購股權的持有人有權按等於購股權行使價的每股認購價認購本公司新發行的普通股。作為已授出購股權回報的已獲取服務的公允價值是基於以柏力克-舒爾斯估值模式計量的所授購股權的公允價值計算。由於所作假設及所用模式有所限制,故就購股權計算的公允價值難免有主觀成分。任何已沒收
(「失效」)且並無於行使時發行股份的購股權獎勵的相關股份日後可根據股份獎勵計劃授出。
於2019年6月17日,本公司向其一名執行董事、本集團的若干主要管理人員及其他僱員授出可行使以認購10,462,500 股普通股的購股權,行使價為每股16.04港元。該等購股權須於授出日起計4年期內根據年期平均(「按比例」)歸屬,當中25%的購股權於授出日的各個週年日歸屬,而承授人須於適用歸屬日仍持續受聘於本集團或持續向本集團提供服務。該等購股權的年期為10年。
預期波動是經計及歷史平均股價波動而估計。預期股息是按本集團的派息記錄及預期計算。
為計算 2019 年 6 月 17 日所授出 10,462,500 股股份的可行使購股權以股份支付款項在授出日的公允價值,本公司已採用以下輸入參數:
14. Employee Benefits Continued
(a) Share-based Payment Arrangements Continued
Share Options Continued
14. 僱員福利 續(a) 以股份支付安排 續
購股權 續
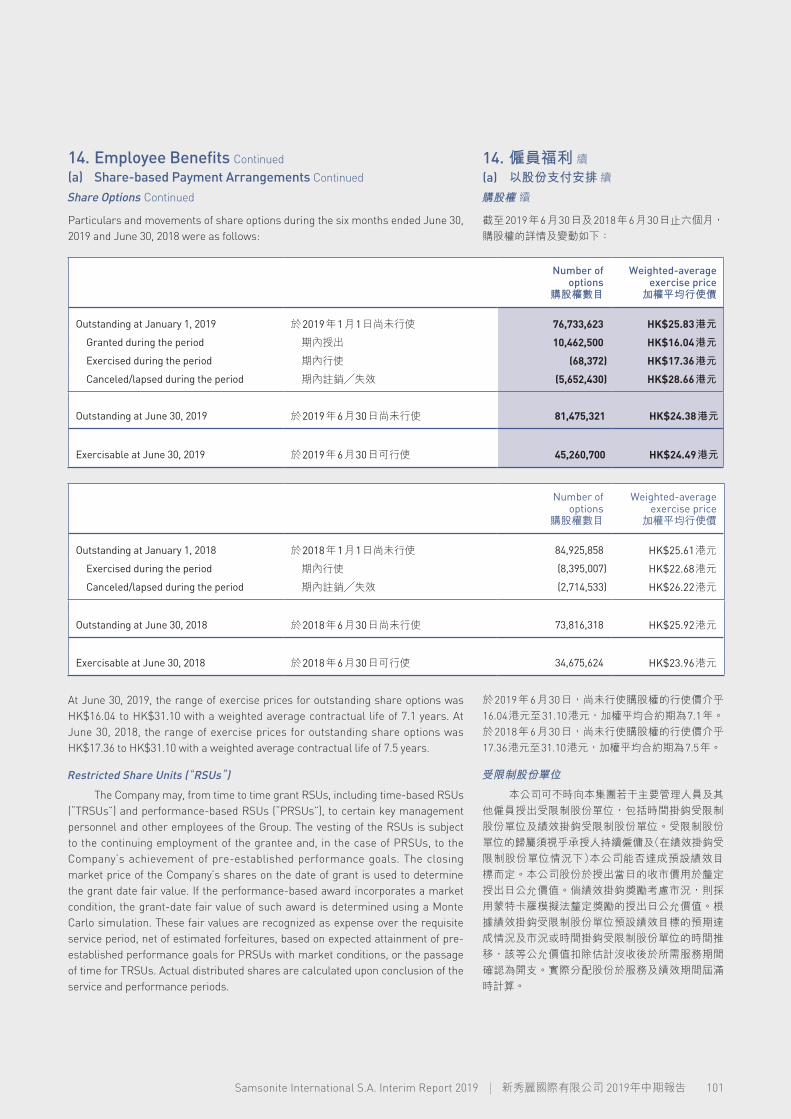
101Samsonite International S.A. Interim Report 2019 新秀麗國際有限公司 2019年中期報告
Particulars and movements of share options during the six months ended June 30, 2019 and June 30, 2018 were as follows:
Number of options
購股權數目
Weighted-average exercise price加權平均行使價
Outstanding at January 1, 2019 於2019年1月1日尚未行使 76,733,623 HK$25.83港元
Granted during the period 期內授出 10,462,500 HK$16.04港元
Exercised during the period 期內行使 (68,372) HK$17.36港元
Canceled/lapsed during the period 期內註銷╱失效 (5,652,430) HK$28.66港元
Outstanding at June 30, 2019 於2019年6月30日尚未行使 81,475,321 HK$24.38港元
Exercisable at June 30, 2019 於2019年6月30日可行使 45,260,700 HK$24.49港元
Number of options
購股權數目
Weighted-average exercise price加權平均行使價
Outstanding at January 1, 2018 於2018年1月1日尚未行使 84,925,858 HK$25.61港元
Exercised during the period 期內行使 (8,395,007) HK$22.68港元
Canceled/lapsed during the period 期內註銷╱失效 (2,714,533) HK$26.22港元
Outstanding at June 30, 2018 於2018年6月30日尚未行使 73,816,318 HK$25.92港元
Exercisable at June 30, 2018 於2018年6月30日可行使 34,675,624 HK$23.96港元
At June 30, 2019, the range of exercise prices for outstanding share options was HK$16.04 to HK$31.10 with a weighted average contractual life of 7.1 years. At June 30, 2018, the range of exercise prices for outstanding share options was HK$17.36 to HK$31.10 with a weighted average contractual life of 7.5 years.
Restricted Share Units (“RSUs”)
The Company may, from time to time grant RSUs, including time-based RSUs (“TRSUs”) and performance-based RSUs (“PRSUs”), to certain key management personnel and other employees of the Group. The vesting of the RSUs is subject to the continuing employment of the grantee and, in the case of PRSUs, to the Company’s achievement of pre-established performance goals. The closing market price of the Company’s shares on the date of grant is used to determine the grant date fair value. If the performance-based award incorporates a market condition, the grant-date fair value of such award is determined using a Monte Carlo simulation. These fair values are recognized as expense over the requisite service period, net of estimated forfeitures, based on expected attainment of pre-established performance goals for PRSUs with market conditions, or the passage of time for TRSUs. Actual distributed shares are calculated upon conclusion of the service and performance periods.
14. Employee Benefits Continued
(a) Share-based Payment Arrangements Continued
Share Options Continued
14. 僱員福利 續(a) 以股份支付安排 續
購股權 續
截至2019年6月30日及2018年6月30日止六個月,購股權的詳情及變動如下:
於2019年6月30日,尚未行使購股權的行使價介乎16.04港元至31.10港元,加權平均合約期為7.1年。於2018年6月30日,尚未行使購股權的行使價介乎17.36港元至31.10港元,加權平均合約期為7.5年。
受限制股份單位
本公司可不時向本集團若干主要管理人員及其他僱員授出受限制股份單位,包括時間掛鈎受限制股份單位及績效掛鈎受限制股份單位。受限制股份單位的歸屬須視乎承授人持續僱傭及(在績效掛鈎受限制股份單位情況下)本公司能否達成預設績效目標而定。本公司股份於授出當日的收市價用於釐定授出日公允價值。倘績效掛鈎獎勵考慮市況,則採用蒙特卡羅模擬法釐定獎勵的授出日公允價值。根據績效掛鈎受限制股份單位預設績效目標的預期達成情況及市況或時間掛鈎受限制股份單位的時間推移,該等公允價值扣除估計沒收後於所需服務期間確認為開支。實際分配股份於服務及績效期間屆滿時計算。

102
Time-based Restricted Share Units
TRSUs granted by the Company are subject to pro rata vesting over a three-year period, with one-third of such TRSUs vesting on each anniversary of the date of the grant, subject to the grantee continuing to be employed by, or continuing to provide services to, the Group on the applicable vesting date. Expense for TRSUs is based on the closing market price of the Company’s shares on the date of grant, discounted by the present value of expected future dividends, and is recognized ratably over the vesting period, net of expected forfeitures.
On June 17, 2019, the Company awarded TRSUs with respect to 4,074,414 shares to an executive director of the Company, certain key management personnel and other employees of the Group.
A summary of TRSU activity during the six months ended June 30, 2019 was as follows:
Number of TRSUs
時間掛鈎受限制股份單位數目
Weighted-average Fair Value per TRSU
時間掛鈎受限制股份單位的每股加權
平均公允價值
Outstanding at January 1, 2019 於2019年1月1日尚未行使 4,884,072 HK$22.50港元
Granted during the period 期內授出 4,074,414 HK$14.52港元
Vested during the period 期內歸屬 – –
Canceled/lapsed during the period 期內註銷╱失效 (475,329) HK$22.40港元
Outstanding at June 30, 2019 於2019年6月30日尚未行使 8,483,157 HK$18.67港元
Performance-based Restricted Share Units
PRSUs vest in full on the third anniversary of the date of grant, subject to the grantee continuing to be employed by, or continuing to provide services to, the Group on the vesting date, and only to the extent certain pre-established cumulative performance targets are met. Expense related to PRSUs with non-market performance criteria is recognized ratably over the performance period, net of forfeitures, based on the probability of attainment of the related performance targets. The potential number of shares that may be issued upon vesting of the PRSUs ranges from 0% of the target number of shares subject to the PRSUs, if the minimum level of performance is not attained, to up to 200% of the target number of shares subject to the PRSUs, if the level of performance is at or above the predetermined maximum achievement level. For PRSUs subject to market conditions, the expense is recognized over the vesting period based on the fair value as determined on the grant date utilizing a Monte Carlo simulation.
綜合中期財務報表附註 續
Notes to the Consolidated Interim Financial Statements Continued
14. Employee Benefits Continued
(a) Share-based Payment Arrangements Continued
Restricted Share Units (“RSUs”) Continued
14. 僱員福利 續(a) 以股份支付安排 續
受限制股份單位 續
時間掛鈎受限制股份單位
本公司授出的時間掛鈎受限制股份單位,於三年內每個授出日的週年日按比例歸屬三分之一,而承授人須於適用歸屬日仍持續受聘於本集團或持續向本集團提供服務。時間掛鈎受限制股份單位的開支按本公司股份於授出日的收市價計算,惟須扣減預計未來股息的貼現價值而於歸屬期內按比例確認,亦須扣除預期會沒收的時間掛鈎受限制股份單位的開支。
於 2019 年 6 月 17 日,本公司向其一名執行董事、本集團的若干主要管理人員及其他僱員授出涉及4,074,414股股份的時間掛鈎受限制股份單位。
截至2019年6月30日止六個月的時間掛鈎受限制股份單位活動概述如下:
績效掛鈎受限制股份單位
績效掛鈎受限制股份單位僅於若干預先確定的累計表現目標達成後,方會於授出日的第三個週年日全數歸屬,而承授人須於歸屬日仍持續受聘於本集團或持續向本集團提供服務。並非按市況標準授出的績效掛鈎受限制股份單位的相關開支在績效期內基於達到相關表現目標的概率按比例確認,並已扣除已沒收績效掛鈎受限制股份單位的開支。於績效掛鈎受限制股份單位歸屬時可能發行的股份數目介乎績效掛鈎受限制股份單位所涉目標股份數目的0%(倘無法達到最低表現要求)至績效掛鈎受限制股份單位所涉目標股份數目的 200%(倘達到或超過預先確定的最高表現要求)。與市況相關的績效掛鈎受限制股份單位的開支於歸屬期內確認,並按授出日採用蒙特卡羅模擬方法釐定的公允價值計算。

103Samsonite International S.A. Interim Report 2019 新秀麗國際有限公司 2019年中期報告
On June 17, 2019, the Group granted PRSUs with respect to a target number of 1,455,327 shares to an executive director and certain members of the Company’s senior management team assuming target level achievement of the performance conditions applicable to the PRSU grants. The performance targets cover the three-year (fiscal) period ending December 31, 2021. The actual number of shares that will vest under the PRSUs will vary depending on the level of achievement of the performance conditions applicable to the PRSU grants made to the relevant grantees, thereby ensuring that the actual payout is linked to the Company’s performance. The maximum number of shares underlying the PRSUs is 2,910,654 shares. The PRSUs granted on June 17, 2019 will vest on June 17, 2022, subject to the achievement of the performance conditions and subject to the applicable grantee continuing to be employed by, or continuing to provide services to, the Group on the vesting date.
A summary of PRSU activity during the six months ended June 30, 2019 was as follows:
Number of PRSUs
績效掛鈎受限制股份單位數目
Weighted-average Fair Value per PRSU
績效掛鈎受限制股份單位的每股加權
平均公允價值
Outstanding at January 1, 2019 於2019年1月1日尚未行使 1,564,368 HK$17.91港元
Granted during the period (at target level vesting)
期內授出(以目標水平歸屬)1,455,327 HK$12.56港元
Increase (decrease) due to performance condition achievement
因表現條件達成程度而增加(減少)– –
Vested during the period 期內歸屬 – –
Canceled/lapsed during the period 期內註銷╱失效 (109,562) HK$17.78港元
Outstanding at June 30, 2019 (at target level vesting)
於2019年6月30日尚未行使 (以目標水平歸屬) 2,910,133 HK$15.24港元
Shares underlying an award of TRSUs or PRSUs that lapse without the issuance of such shares upon vesting of such award may be available for future grant under the Share Award Scheme.
14. Employee Benefits Continued
(a) Share-based Payment Arrangements Continued
Restricted Share Units (“RSUs”) Continued
Performance-based Restricted Share Units Continued
14. 僱員福利 續(a) 以股份支付安排 續
受限制股份單位 續
績效掛鈎受限制股份單位 續
於2019年6月17日,本集團向一名執行董事及本公司高級管理層團隊的若干成員授出涉及1,455,327股目標股份的績效掛鈎受限制股份單位(假設達到適用於績效掛鈎受限制股份單位的表現條件目標水平)。表現目標覆蓋截至 2021 年 12 月 31 日止三個(財政)年度。根據績效掛鈎受限制股份單位歸屬的實際股份數目視乎向承授人授出適用於績效掛鈎受限制股份單位的表現條件達成程度而有所不同,從而確保實際支付與本公司表現掛鈎。績效掛鈎受限制股份單位涉及的最高股份數目為 2,910,654 股股份。於2019年6月17日授出的績效掛鈎受限制股份單位將於2022年6月17日歸屬,視乎表現條件達成程度而定,且合適承授人須於歸屬日仍持續受聘於本集團或持續向本集團提供服務。
截至2019年6月30日止六個月的績效掛鈎受限制股份單位活動概述如下:
時間掛鈎受限制股份單位或績效掛鈎受限制股份單位獎勵於歸屬後至失效時仍未發行的相關股份,可根據股份獎勵計劃於日後予以授出。
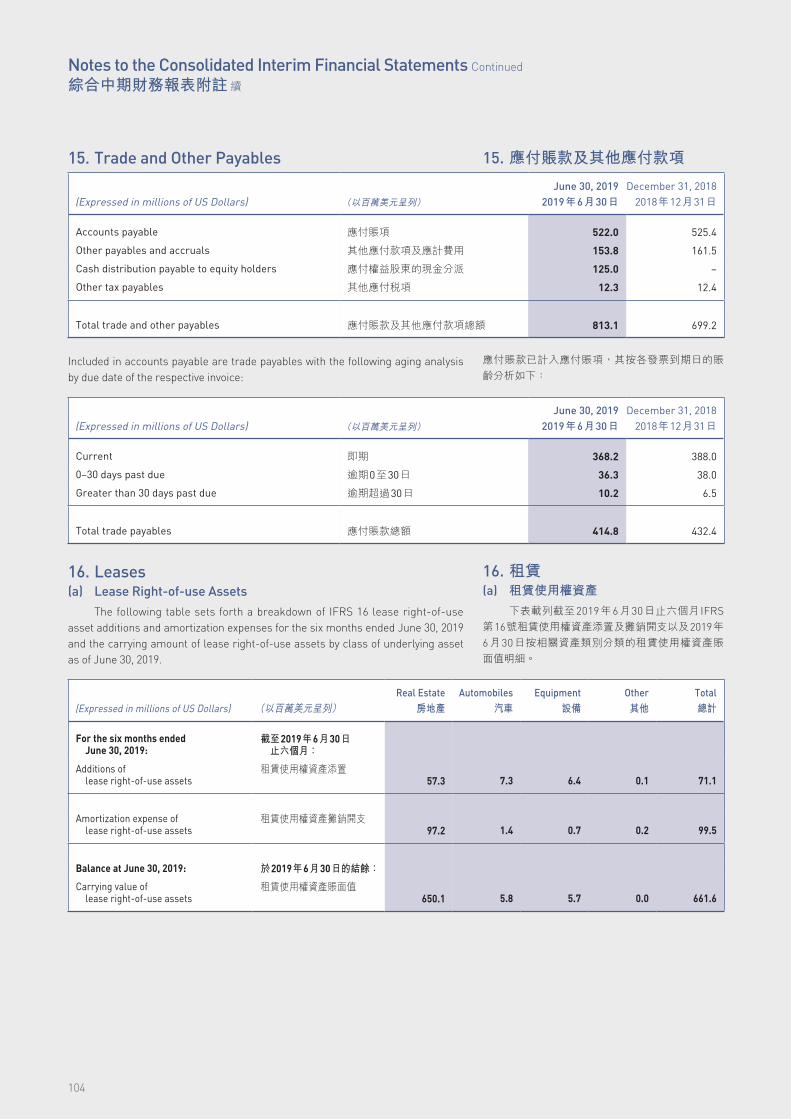
104
15. Trade and Other Payables
(Expressed in millions of US Dollars) (以百萬美元呈列)
June 30, 20192019年6月30日
December 31, 20182018年12月31日
Accounts payable 應付賬項 522.0 525.4
Other payables and accruals 其他應付款項及應計費用 153.8 161.5
Cash distribution payable to equity holders 應付權益股東的現金分派 125.0 –
Other tax payables 其他應付稅項 12.3 12.4
Total trade and other payables 應付賬款及其他應付款項總額 813.1 699.2
Included in accounts payable are trade payables with the following aging analysis by due date of the respective invoice:
(Expressed in millions of US Dollars) (以百萬美元呈列)
June 30, 20192019年6月30日
December 31, 20182018年12月31日
Current 即期 368.2 388.0
0–30 days past due 逾期0至30日 36.3 38.0
Greater than 30 days past due 逾期超過30日 10.2 6.5
Total trade payables 應付賬款總額 414.8 432.4
16. Leases(a) Lease Right-of-use Assets
The following table sets forth a breakdown of IFRS 16 lease right-of-use asset additions and amortization expenses for the six months ended June 30, 2019 and the carrying amount of lease right-of-use assets by class of underlying asset as of June 30, 2019.
(Expressed in millions of US Dollars) (以百萬美元呈列)Real Estate
房地產Automobiles
汽車Equipment
設備Other其他
Total總計
For the six months ended June 30, 2019:
截至2019年6月30日 止六個月:
Additions of lease right-of-use assets
租賃使用權資產添置57.3 7.3 6.4 0.1 71.1
Amortization expense of lease right-of-use assets
租賃使用權資產攤銷開支97.2 1.4 0.7 0.2 99.5
Balance at June 30, 2019: 於2019年6月30日的結餘:
Carrying value of lease right-of-use assets
租賃使用權資產賬面值650.1 5.8 5.7 0.0 661.6
綜合中期財務報表附註 續
Notes to the Consolidated Interim Financial Statements Continued
15. 應付賬款及其他應付款項
應付賬款已計入應付賬項,其按各發票到期日的賬齡分析如下:
16. 租賃(a) 租賃使用權資產
下表載列截至2019 年 6 月 30 日止六個月 IFRS第16號租賃使用權資產添置及攤銷開支以及2019年6 月 30 日按相關資產類別分類的租賃使用權資產賬面值明細。
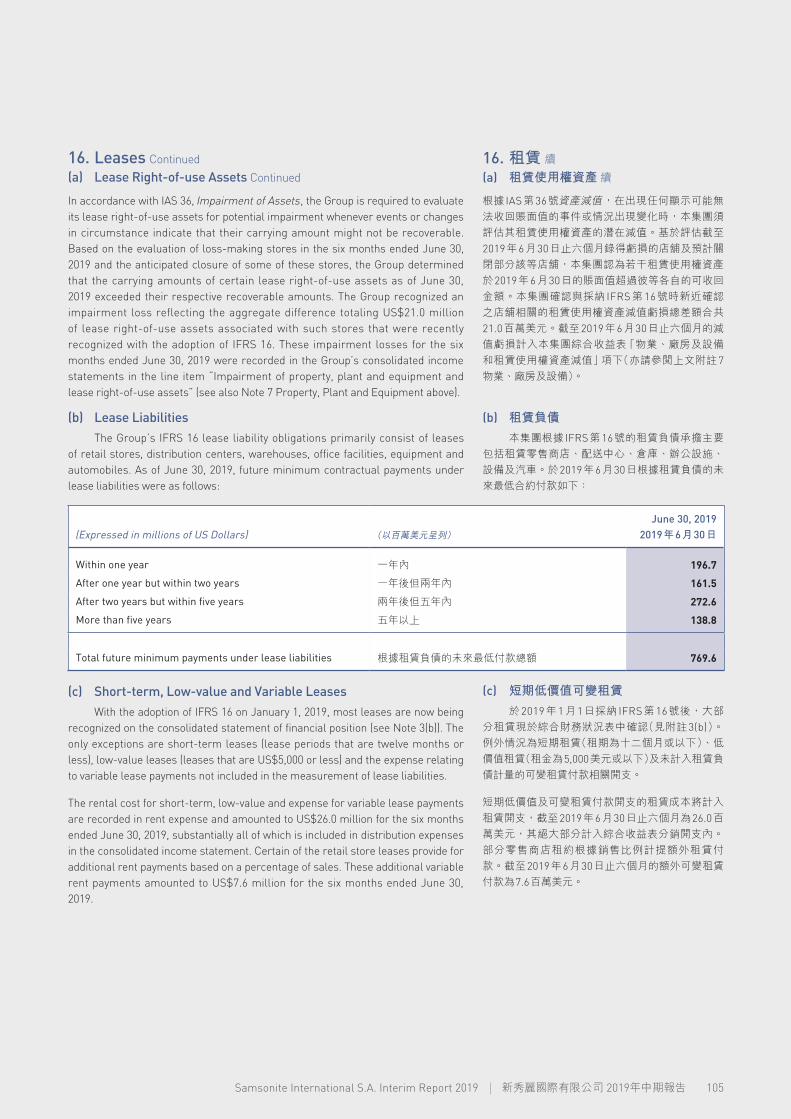
105Samsonite International S.A. Interim Report 2019 新秀麗國際有限公司 2019年中期報告
In accordance with IAS 36, Impairment of Assets, the Group is required to evaluate its lease right-of-use assets for potential impairment whenever events or changes in circumstance indicate that their carrying amount might not be recoverable. Based on the evaluation of loss-making stores in the six months ended June 30, 2019 and the anticipated closure of some of these stores, the Group determined that the carrying amounts of certain lease right-of-use assets as of June 30, 2019 exceeded their respective recoverable amounts. The Group recognized an impairment loss reflecting the aggregate difference totaling US$21.0 million of lease right-of-use assets associated with such stores that were recently recognized with the adoption of IFRS 16. These impairment losses for the six months ended June 30, 2019 were recorded in the Group’s consolidated income statements in the line item “Impairment of property, plant and equipment and lease right-of-use assets” (see also Note 7 Property, Plant and Equipment above).
(b) Lease LiabilitiesThe Group’s IFRS 16 lease liability obligations primarily consist of leases
of retail stores, distribution centers, warehouses, office facilities, equipment and automobiles. As of June 30, 2019, future minimum contractual payments under lease liabilities were as follows:
(Expressed in millions of US Dollars) (以百萬美元呈列)
June 30, 20192019年6月30日
Within one year 一年內 196.7
After one year but within two years 一年後但兩年內 161.5
After two years but within five years 兩年後但五年內 272.6
More than five years 五年以上 138.8
Total future minimum payments under lease liabilities 根據租賃負債的未來最低付款總額 769.6
(c) Short-term, Low-value and Variable LeasesWith the adoption of IFRS 16 on January 1, 2019, most leases are now being
recognized on the consolidated statement of financial position (see Note 3(b)). The only exceptions are short-term leases (lease periods that are twelve months or less), low-value leases (leases that are US$5,000 or less) and the expense relating to variable lease payments not included in the measurement of lease liabilities.
The rental cost for short-term, low-value and expense for variable lease payments are recorded in rent expense and amounted to US$26.0 million for the six months ended June 30, 2019, substantially all of which is included in distribution expenses in the consolidated income statement. Certain of the retail store leases provide for additional rent payments based on a percentage of sales. These additional variable rent payments amounted to US$7.6 million for the six months ended June 30, 2019.
16. Leases Continued
(a) Lease Right-of-use Assets Continued
16. 租賃 續(a) 租賃使用權資產 續
根據 IAS 第 36 號資產減值,在出現任何顯示可能無法收回賬面值的事件或情況出現變化時,本集團須評估其租賃使用權資產的潛在減值。基於評估截至2019年6月30日止六個月錄得虧損的店舖及預計關閉部分該等店舖,本集團認為若干租賃使用權資產於2019年6月30日的賬面值超過彼等各自的可收回金額。本集團確認與採納 IFRS 第 16 號時新近確認之店舖相關的租賃使用權資產減值虧損總差額合共21.0百萬美元。截至2019年6月30日止六個月的減值虧損計入本集團綜合收益表「物業、廠房及設備和租賃使用權資產減值」項下(亦請參閱上文附註 7物業、廠房及設備)。
(b) 租賃負債本集團根據 IFRS第16號的租賃負債承擔主要
包括租賃零售商店、配送中心、倉庫、辦公設施、設備及汽車。於2019年6月30日根據租賃負債的未來最低合約付款如下:
(c) 短期低價值可變租賃於 2019 年 1 月 1 日採納 IFRS 第 16 號後,大部
分租賃現於綜合財務狀況表中確認(見附註 3(b))。例外情況為短期租賃(租期為十二個月或以下)、低價值租賃(租金為5,000美元或以下)及未計入租賃負債計量的可變租賃付款相關開支。
短期低價值及可變租賃付款開支的租賃成本將計入租賃開支,截至2019年6月30日止六個月為26.0百萬美元,其絕大部分計入綜合收益表分銷開支內。部分零售商店租約根據銷售比例計提額外租賃付款。截至2019年6月30日止六個月的額外可變租賃付款為7.6百萬美元。

106
As of June 30, 2019, future minimum payments under short-term, low-value and expense for variable lease payments were as follows:
(Expressed in millions of US Dollars) (以百萬美元呈列)
June 30, 20192019年6月30日
Within one year 一年內 2.3
After one year but within two years 一年後但兩年內 0.5
After two years but within five years 兩年後但五年內 0.2
Total future minimum payments under short-term, low-value and variable leases
短期低價值可變租賃的未來最低付款總額3.0
(d) Total Cash Outflows for LeasesThe following table sets forth a breakdown of total cash outflows for the six
months ended June 30, 2019 related to IFRS 16 lease liabilities and those leases exempt from IFRS 16.
(Expressed in millions of US Dollars) (以百萬美元呈列)
IFRS 16 lease liabilities
IFRS第16號租賃負債
Short-term, low-value and
variable leases exempt from
IFRS 16獲豁免遵守
IFRS第16號之短期低價值可變租賃
Total cash outflow for
leases租賃現金流出總額
Principal payments on lease liabilities 租賃負債本金付款 79.5 – 79.5
Interest paid on lease liabilities 租賃負債已付利息 15.4 – 15.4
Rent expense — short-term and low value leases(1)
租賃開支 — 短期及低價值租賃 (1)
– 19.2 19.2
Rent expense — variable leases(1) 租賃開支 — 可變租賃 (1) – 6.8 6.8
Contingent rent 或然租金 – 7.6 7.6
Total cash outflow 現金流出總額 94.9 33.6 128.5
Note
(1) Reflects costs for leases which did not qualify for capitalization under IFRS 16.
綜合中期財務報表附註 續
Notes to the Consolidated Interim Financial Statements Continued
16. Leases Continued
(c) Short-term, Low-value and Variable Leases Continued
16. 租賃 續(c) 短期低價值可變租賃 續
2019年6月30日,短期低價值及可變租賃付款開支的未來最低付款如下:
(d) 租賃現金流出總額下表載列截至 2019 年 6 月 30 日止六個月有關
IFRS第16號租賃負債及獲豁免遵守 IFRS第16號之租賃的現金流出總額明細。
註釋
(1) 指根據 IFRS第16號不合資格資本化的租賃成本。
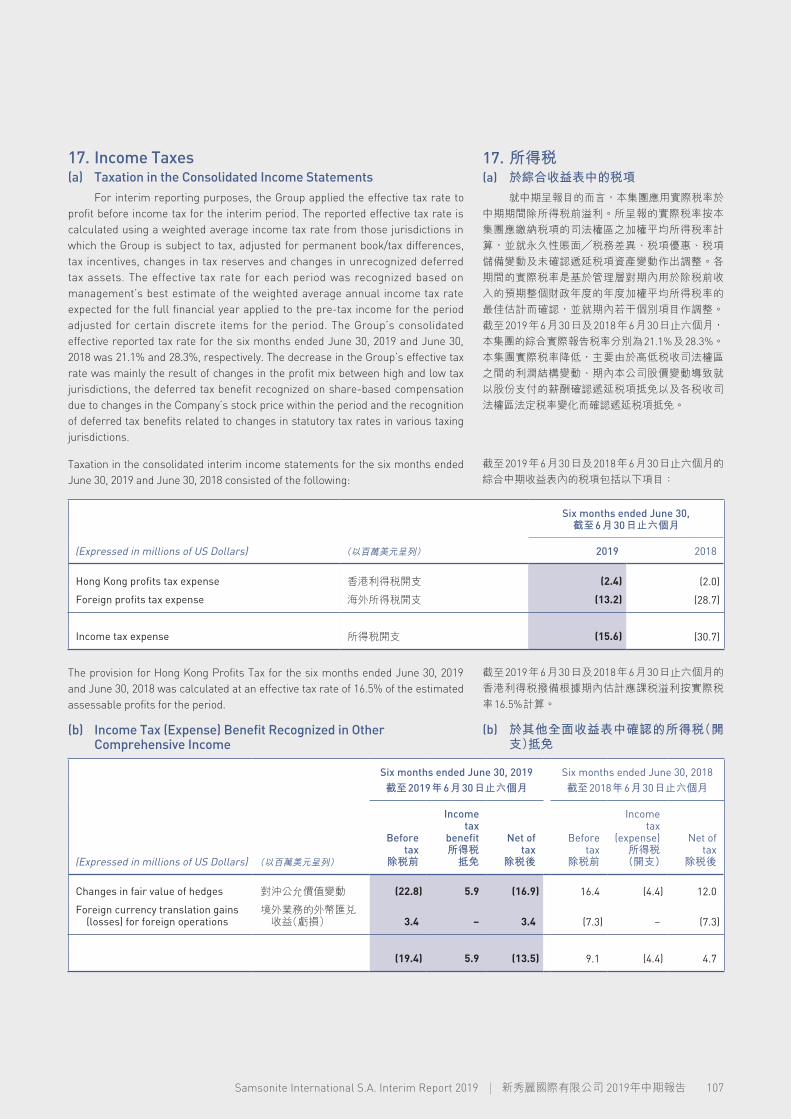
107Samsonite International S.A. Interim Report 2019 新秀麗國際有限公司 2019年中期報告
17. Income Taxes(a) Taxation in the Consolidated Income Statements
For interim reporting purposes, the Group applied the effective tax rate to profit before income tax for the interim period. The reported effective tax rate is calculated using a weighted average income tax rate from those jurisdictions in which the Group is subject to tax, adjusted for permanent book/tax differences, tax incentives, changes in tax reserves and changes in unrecognized deferred tax assets. The effective tax rate for each period was recognized based on management’s best estimate of the weighted average annual income tax rate expected for the full financial year applied to the pre-tax income for the period adjusted for certain discrete items for the period. The Group’s consolidated effective reported tax rate for the six months ended June 30, 2019 and June 30, 2018 was 21.1% and 28.3%, respectively. The decrease in the Group’s effective tax rate was mainly the result of changes in the profit mix between high and low tax jurisdictions, the deferred tax benefit recognized on share-based compensation due to changes in the Company’s stock price within the period and the recognition of deferred tax benefits related to changes in statutory tax rates in various taxing jurisdictions.
Taxation in the consolidated interim income statements for the six months ended June 30, 2019 and June 30, 2018 consisted of the following:
Six months ended June 30,截至6月30日止六個月
(Expressed in millions of US Dollars) (以百萬美元呈列) 2019 2018
Hong Kong profits tax expense 香港利得稅開支 (2.4) (2.0)
Foreign profits tax expense 海外所得稅開支 (13.2) (28.7)
Income tax expense 所得稅開支 (15.6) (30.7)
The provision for Hong Kong Profits Tax for the six months ended June 30, 2019 and June 30, 2018 was calculated at an effective tax rate of 16.5% of the estimated assessable profits for the period.
(b) Income Tax (Expense) Benefit Recognized in Other Comprehensive Income
Six months ended June 30, 2019截至2019年6月30日止六個月
Six months ended June 30, 2018截至2018年6月30日止六個月
(Expressed in millions of US Dollars) (以百萬美元呈列)
Before tax
除稅前
Income tax
benefit所得稅抵免
Net of tax
除稅後
Before tax
除稅前
Income tax
(expense)所得稅(開支)
Net of tax
除稅後
Changes in fair value of hedges 對沖公允價值變動 (22.8) 5.9 (16.9) 16.4 (4.4) 12.0
Foreign currency translation gains (losses) for foreign operations
境外業務的外幣匯兌 收益(虧損) 3.4 – 3.4 (7.3) – (7.3)
(19.4) 5.9 (13.5) 9.1 (4.4) 4.7
17. 所得稅(a) 於綜合收益表中的稅項
就中期呈報目的而言,本集團應用實際稅率於中期期間除所得稅前溢利。所呈報的實際稅率按本集團應繳納稅項的司法權區之加權平均所得稅率計算,並就永久性賬面╱稅務差異、稅項優惠、稅項儲備變動及未確認遞延稅項資產變動作出調整。各期間的實際稅率是基於管理層對期內用於除稅前收入的預期整個財政年度的年度加權平均所得稅率的最佳估計而確認,並就期內若干個別項目作調整。截至2019年6月30日及2018年6月30日止六個月,本集團的綜合實際報告稅率分別為21.1%及28.3%。本集團實際稅率降低,主要由於高低稅收司法權區之間的利潤結構變動、期內本公司股價變動導致就以股份支付的薪酬確認遞延稅項抵免以及各稅收司法權區法定稅率變化而確認遞延稅項抵免。
截至2019年6月30日及2018年6月30日止六個月的綜合中期收益表內的稅項包括以下項目:
截至2019年6月30日及2018年6月30日止六個月的香港利得稅撥備根據期內估計應課稅溢利按實際稅率16.5%計算。
(b) 於其他全面收益表中確認的所得稅(開支)抵免

108
The following table presents a summary of finance income and finance costs recognized in the consolidated income statements and consolidated statements of comprehensive income:
Six months ended June 30,截至6月30日止六個月
(Expressed in millions of US Dollars) (以百萬美元呈列) 2019 2018
Recognized in income or loss: 於收入或虧損中確認:
Interest income 利息收入 0.9 0.4
Total finance income 財務收入總額 0.9 0.4
Interest expense on loans and borrowings 貸款及借款利息開支 (33.1) (33.4)
Amortization of deferred financing costs associated with Original Senior Credit Facilities
與原優先信貸融通相關的遞延融資 成本攤銷 0.0 (3.3)
Amortization of deferred financing costs associated with New Senior Credit Facilities
與新優先信貸融通相關的遞延融資 成本攤銷 (1.5) (0.5)
Derecognition of remaining deferred financing costs associated with Original Senior Credit Facilities
終止確認與原優先信貸融通相關的 餘下遞延融資成本 – (53.3)
Interest expense on lease liabilities(1) 租賃負債利息開支 (1) (15.4) –
Change in fair value of put options 認沽期權之公允價值變動 1.0 0.9
Net foreign exchange gain (loss) 外匯收益(虧損)淨額 0.1 (2.5)
Other finance costs 其他財務費用 (2.1) (1.5)
Total finance costs 財務費用總額 (51.0) (93.6)
Net finance costs recognized in profit or loss 於損益中確認的財務費用淨額 (50.1) (93.2)
Recognized in other comprehensive income (loss): 於其他全面收益(虧損)中確認:
Foreign currency translation gains (losses) for foreign operations
境外業務的外幣匯兌收益(虧損)3.4 (7.3)
Changes in fair value of hedges 對沖之公允價值變動 (22.8) 16.4
Income tax benefit (expense) on finance income and finance costs recognized in other comprehensive income
於其他全面收益中確認的財務收入及 財務費用的所得稅抵免(開支)
5.9 (4.4)
Net finance costs recognized in total other comprehensive income, net of tax
於其他全面收益總額中確認的 財務費用淨額(除稅後) (13.5) 4.7
Attributable to: 下列人士應佔:
Equity holders of the Company 本公司股權持有人 (14.0) 7.4
Non-controlling interests 非控股權益 0.5 (2.7)
Note
(1) On January 1, 2019, the Group adopted IFRS 16 and applied the modified retrospective approach. Comparative amounts for the six months ended June 30, 2018 have not been restated (see further discussion in Note 3(b)).
綜合中期財務報表附註 續
Notes to the Consolidated Interim Financial Statements Continued
18. Finance Income and Finance Costs 18. 財務收入及財務費用下表呈列於綜合收益表及綜合全面收益表中確
認的財務收入及財務費用概要:
註釋
(1) 2019年1月1日,本集團採納 IFRS第16號,並應用經修訂追溯法。截至2018年6月30日止六個月的比較數字並無重列(見附註3(b)的進一步討論)。

109Samsonite International S.A. Interim Report 2019 新秀麗國際有限公司 2019年中期報告
19. Contingent LiabilitiesIn the ordinary course of business, the Group is subject to various forms of
litigation and legal proceedings. The facts and circumstances relating to particular cases are evaluated in determining whether it is more likely than not that there will be a future outflow of funds and, once established, whether a provision relating to specific litigation is sufficient. The Group records provisions based on its past experience and on facts and circumstances known at each reporting date. The provision charge is typically recognized within general and administrative expenses in the consolidated income statements. When the date of the settlement of an obligation is not reliably measurable, the provisions are not discounted and are classified in current liabilities.
The Group did not settle any material litigation during the six months ended June 30, 2019 or June 30, 2018.
20. Financial Instruments(a) Fair Value Versus Carrying Amounts
All financial assets and liabilities have fair values that approximate carrying amounts.
(b) Fair Value of Financial InstrumentsFair value is the price that would be received to sell an asset or paid to
transfer a liability in an orderly transaction between market participants at the measurement date. IFRS establishes a fair value hierarchy that prioritizes the inputs to valuation techniques used to measure fair value. The hierarchy gives the highest priority to unadjusted quoted prices in active markets for identical assets or liabilities (Level 1 measurements) and the lowest priority to measurements involving significant unobservable inputs (Level 3 measurements). The three levels of the fair value hierarchy are as follows:
• Level 1 inputs are quoted prices (unadjusted) in active markets for identical assets or liabilities that the Group has the ability to access at the measurement date.
• Level 2 inputs are inputs other than quoted prices included within Level 1 that are observable for the asset or liability, either directly or indirectly.
• Level 3 inputs are unobservable inputs for the asset or liability.
The level in the fair value hierarchy within which a fair measurement in its entirety falls is based on the lowest level input that is significant to the fair value measurement in its entirety.
The carrying amount of cash and cash equivalents, trade receivables, accounts payable, short-term debt, and accrued expenses approximates fair value because of the short maturity or duration of these instruments.
The fair value of foreign currency forward contracts, interest rate swaps and cross-currency swaps are estimated by reference to market quotations received from banks.
19. 或然負債於日常業務過程中,本集團面對各種形式的訴
訟及法律程序。在決定未來是否較有可能出現資金外流時會評估與特定情況相關的事實及環境,而一經確定,則評估與具體訴訟相關的撥備是否足夠。本集團基於過往經驗及於各報告日期已知的事實及情況記錄撥備。撥備開支通常於綜合收益表中的一般及行政開支中確認。當結算承擔的日期不可確切計量時,撥備將不貼現及將被分類為流動負債。
截至2019年6月30日或2018年6月30日止六個月,本集團並無解決任何重大訴訟。
20. 金融工具(a) 公允價值與賬面值的比較
所有金融資產及負債的公允價值與其賬面值相若。
(b) 金融工具之公允價值公允價值是於計量日市場參與者於有秩序交易
中出售資產可收取或轉讓負債須支付的價格。IFRS建立一套公允價值等級架構,該架構排列用以計量公允價值的估值方法輸入數據的優先等級。該等級架構給予於活躍市場中相同資產或負債的未經調整報價最高等級(第一級別計量),以及涉及重大不可觀察輸入數據的計量最低等級(第三級別計量)。公允價值等級架構的三個級別如下:
• 第一級別輸入數據為本集團有能力於計量日取得的完全相同的資產或負債於活躍市場的報價
(未調整)。
• 第二級別輸入數據為不包括第一級別的報價的資產或負債的可直接或間接觀察的輸入數據。
• 第三級別輸入數據為資產或負債的不可觀察輸入數據。
公允價值計量在公允價值等級架構中的層級分類,是基於對公允價值計量整體而言屬重大的最低層級輸入數據。
由於現金及現金等價物、應收賬款、應付賬項、短期債務及應計開支的到期日或年期較短,因此,該等工具的賬面值與公允價值相若。
遠期外匯合約、利率掉期及交叉貨幣掉期之公允價值透過參考銀行提供的市場報價估計。

110
The following table presents assets and liabilities that are measured at fair value on a recurring basis (including items that are required to be measured at fair value) as of June 30, 2019 and December 31, 2018:
Fair value measurements at reporting date using
於報告日期使用下列各項計量的公允價值
(Expressed in millions of US Dollars) (以百萬美元呈列)
June 30, 20192019年
6月30日
Quoted prices in active
markets for identical
assets (Level 1)
完全相同資產於活躍市場的報價
(第一級別)
Significant other
observable inputs
(Level 2)其他
重大可觀察輸入數據
(第二級別)
Significant unobservable
inputs (Level 3)
重大不可觀察輸入數據
(第三級別)
Assets: 資產: Cash and cash equivalents 現金及現金等價物 489.3 489.3 – – Interest rate swap agreements 利率掉期協議 6.5 – 6.5 – Foreign currency forward contracts 遠期外匯合約 2.2 2.2 – –
Total assets 資產總額 498.0 491.5 6.5 –
Liabilities: 負債: Non-controlling interest put options 非控股權益認沽期權 57.2 – – 57.2
Cross currency swap agreements 交叉貨幣掉期協議 1.9 – 1.9 –
Total liabilities 負債總額 59.1 – 1.9 57.2
Fair value measurements at reporting date using
於報告日期使用下列各項計量的公允價值
(Expressed in millions of US Dollars) (以百萬美元呈列)
December 31, 2018
2018年12月31日
Quoted prices in active
markets for identical
assets (Level 1)
完全相同資產於活躍市場
的報價(第一級別)
Significant other
observable inputs
(Level 2)其他
重大可觀察輸入數據
(第二級別)
Significant unobservable
inputs (Level 3)
重大不可觀察輸入數據
(第三級別)
Assets: 資產: Cash and cash equivalents 現金及現金等價物 427.7 427.7 – – Interest rate swap agreements 利率掉期協議 25.5 – 25.5 – Foreign currency forward contracts 遠期外匯合約 3.7 3.7 – –
Total assets 資產總額 456.9 431.4 25.5 –
Liabilities: 負債: Non-controlling interest put options 非控股權益認沽期權 56.3 – – 56.3
Total liabilities 負債總額 56.3 – – 56.3
20. Financial Instruments Continued
(b) Fair Value of Financial Instruments Continued
20. 金融工具 續(b) 金融工具之公允價值 續
綜合中期財務報表附註 續
Notes to the Consolidated Interim Financial Statements Continued
下表呈列於2019年6月30日及2018年12月31日按持續基準以公允價值計量的資產及負債(包括規定以公允價值計量的項目):
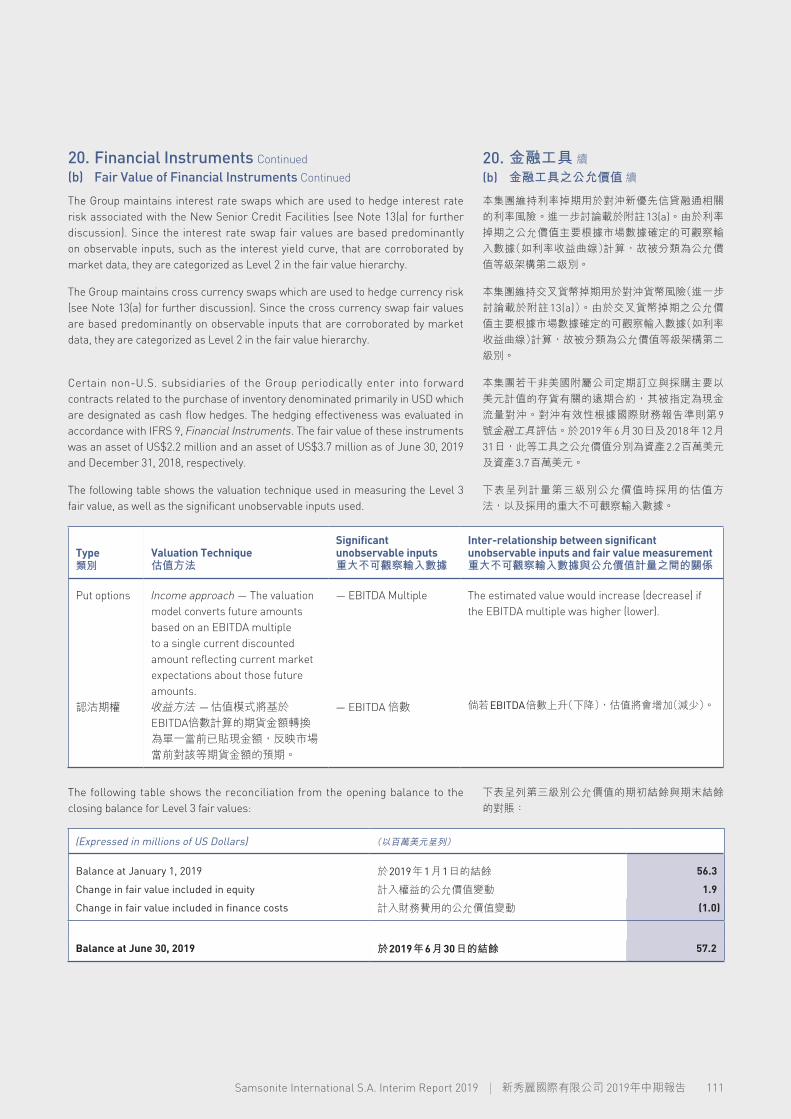
111Samsonite International S.A. Interim Report 2019 新秀麗國際有限公司 2019年中期報告
The Group maintains interest rate swaps which are used to hedge interest rate risk associated with the New Senior Credit Facilities (see Note 13(a) for further discussion). Since the interest rate swap fair values are based predominantly on observable inputs, such as the interest yield curve, that are corroborated by market data, they are categorized as Level 2 in the fair value hierarchy.
The Group maintains cross currency swaps which are used to hedge currency risk (see Note 13(a) for further discussion). Since the cross currency swap fair values are based predominantly on observable inputs that are corroborated by market data, they are categorized as Level 2 in the fair value hierarchy.
Certain non-U.S. subsidiaries of the Group periodically enter into forward contracts related to the purchase of inventory denominated primarily in USD which are designated as cash flow hedges. The hedging effectiveness was evaluated in accordance with IFRS 9, Financial Instruments. The fair value of these instruments was an asset of US$2.2 million and an asset of US$3.7 million as of June 30, 2019 and December 31, 2018, respectively.
The following table shows the valuation technique used in measuring the Level 3 fair value, as well as the significant unobservable inputs used.
Type 類別
Valuation Technique 估值方法
Significant unobservable inputs 重大不可觀察輸入數據
Inter-relationship between significant unobservable inputs and fair value measurement 重大不可觀察輸入數據與公允價值計量之間的關係
Put options
認沽期權
Income approach — The valuation model converts future amounts based on an EBITDA multiple to a single current discounted amount reflecting current market expectations about those future amounts. 收益方法 — 估值模式將基於EBITDA倍數計算的期貨金額轉換為單一當前已貼現金額,反映市場當前對該等期貨金額的預期。
— EBITDA Multiple
— EBITDA 倍數
The estimated value would increase (decrease) if the EBITDA multiple was higher (lower).
倘若EBITDA倍數上升(下降),估值將會增加(減少)。
The following table shows the reconciliation from the opening balance to the closing balance for Level 3 fair values:
(Expressed in millions of US Dollars) (以百萬美元呈列)
Balance at January 1, 2019 於2019年1月1日的結餘 56.3
Change in fair value included in equity 計入權益的公允價值變動 1.9
Change in fair value included in finance costs 計入財務費用的公允價值變動 (1.0)
Balance at June 30, 2019 於2019年6月30日的結餘 57.2
20. Financial Instruments Continued
(b) Fair Value of Financial Instruments Continued
20. 金融工具 續(b) 金融工具之公允價值 續
本集團維持利率掉期用於對沖新優先信貸融通相關的利率風險。進一步討論載於附註13(a)。由於利率掉期之公允價值主要根據市場數據確定的可觀察輸入數據(如利率收益曲線)計算,故被分類為公允價值等級架構第二級別。
本集團維持交叉貨幣掉期用於對沖貨幣風險(進一步討論載於附註 13(a))。由於交叉貨幣掉期之公允價值主要根據市場數據確定的可觀察輸入數據(如利率收益曲線)計算,故被分類為公允價值等級架構第二級別。
本集團若干非美國附屬公司定期訂立與採購主要以美元計值的存貨有關的遠期合約,其被指定為現金流量對沖。對沖有效性根據國際財務報告準則第 9號金融工具評估。於2019年6月30日及2018年12月31日,此等工具之公允價值分別為資產2.2百萬美元及資產3.7百萬美元。
下表呈列計量第三級別公允價值時採用的估值方法,以及採用的重大不可觀察輸入數據。
下表呈列第三級別公允價值的期初結餘與期末結餘的對賬:

112
20. Financial Instruments Continued
(b) Fair Value of Financial Instruments Continued
20. 金融工具 續(b) 金融工具之公允價值 續
For the fair value of put options, reasonably possible changes to one of the significant unobservable inputs, holding other inputs constant, would have the following effects at June 30, 2019:
Profit or Loss損益
Shareholders’ Equity股東權益
(Expressed in millions of US Dollars) (以百萬美元呈列)
Increase上升
Decrease下調
Increase上升
Decrease下調
EBITDA multiple (movement of 0.1x) EBITDA 倍數(變動0.1倍) 1.0 (1.0) 0.8 (0.8)
Fair value estimates are made at a specific point in time, based on relevant market information and information about the financial instrument. These estimates are subjective in nature and involve uncertainties and matters of significant judgment and therefore cannot be determined with precision. Changes in assumptions could significantly affect the estimates.
21. Related Party Transactions(a) Transactions with Key Management Personnel
In addition to their cash compensation, the Group also provides non-cash benefits to certain directors and other key management personnel, and contributes to a post-employment plan on their behalf.
Key management personnel is comprised of the Group’s directors and senior management. Compensation paid to key management personnel during the six months ended June 30, 2019 and June 30, 2018 comprised:
Six months ended June 30,截至6月30日止六個月
(Expressed in millions of US Dollars) (以百萬美元呈列) 2019 2018
Director’s fees 董事袍金 0.7 0.7
Salaries, allowances and other benefits in kind 薪金、津貼及其他實物利益 3.4 4.2
Bonus(1) 花紅 (1) 3.6 5.6
Share-based compensation(2) 以股份支付的薪酬 (2) 4.3 5.4
Contributions to post-employment plans 退休後計劃供款 0.2 0.1
Total compensation 薪酬總額 12.2 16.0
Notes
(1) Bonus reflects amounts paid during the period and is generally based on the performance of the Group for the previous year.
(2) Share-based compensation amounts reported represent the expense taken during the period of awards granted previously.
綜合中期財務報表附註 續
Notes to the Consolidated Interim Financial Statements Continued
就認沽期權之公允價值而言,當其中一個重大不可觀察輸入數據出現合理可能變動,而其他輸入數據維持不變,將會於2019年6月30日產生以下影響:
公允價值估計是於某一特定時間根據有關市場資料及金融工具的資料作出。該等估計性質主觀及涉及不確定因素及須作出重大判斷,因此無法準確釐定。假設的任何變動可能會對估計構成重大影響。
21. 關連方交易(a) 與主要管理人員的交易
本集團除了給予若干董事及其他主要管理人員現金薪酬外,亦向彼等提供非現金福利,並代彼等向退休後計劃供款。
主要管理層人員包括本集團董事及高級管理層。截至2019年6月30日及2018年6月30日止六個月支付予主要管理人員的薪酬包括:
註釋
(1) 花紅反映期內已付的金額並一般以上一年度本集團的表現為基準。
(2) 呈報的以股份支付的薪酬金額指過往授出獎勵期間產生的開支。

113Samsonite International S.A. Interim Report 2019 新秀麗國際有限公司 2019年中期報告
21. Related Party Transactions Continued
(b) Other Related Party TransactionsMr. Ramesh Tainwala (“Mr. Tainwala”), a former Executive Director and
former Chief Executive Officer of the Group, ceased being a related party upon his resignation from the Company with effect from May 31, 2018. The disclosure below has been included with respect to the six months ended June 30, 2018 only.
I. Certain subsidiaries of the Group purchase raw materials and finished goods from, and Samsonite South Asia Private Limited sells certain raw materials and components to, Abhishri Packaging Pvt. Ltd, which is managed and controlled by the family of Mr. Tainwala, together with his family, and are the owners of 40.0% non-controlling interests in Samsonite South Asia Private Limited and in the Group’s United Arab Emirates subsidiary, Samsonite Middle East FZCO. Abhishri Packaging Pvt. Ltd also manufactures hard-side luggage products on behalf of Samsonite South Asia Private Limited.
Related amounts of purchases, sales, payables and receivables were the following:
(Expressed in millions of US Dollars) (以百萬美元呈列)
Six months ended June 30, 2018
截至2018年6月30日
止六個月
Purchases 採購 7.7
(Expressed in millions of US Dollars) (以百萬美元呈列)December 31, 2018
2018年12月31日
Payables 應付款項 5.8
II. The Group’s Indian subsidiary, Samsonite South Asia Private Limited, sells finished goods to Bagzone Lifestyle Private Limited. Bagzone Lifestyle Private Limited is managed and controlled by the family of Mr. Tainwala. The Group’s Chinese subsidiary, Samsonite (China) Co., Ltd., provided sourcing support and quality inspection services in respect of products under certain other brands sold by Bagzone Lifestyle Private Limited until the agreement’s expiration on December 31, 2018.
21. 關連方交易 續(b) 其他關連方交易
本集團前執行董事兼前行政總裁 R a m e s h Tainwala先生(「Tainwala先生」)於本公司離職後不再是關連方,自2018年5月31日起生效。以下披露僅是截至2018年6月30日止六個月的數據。
I. 本集團的若干附屬公司向Abhishri Packaging Pvt. Ltd(由Tainwala先生的家族管理及控制,彼等亦擁有 Samsonite South Asia Private L i m i t e d 及本集團於阿拉伯聯合酋長國之附屬公司 Samsonite Middle East FZCO 的40.0% 非控股權益)採購原材料及製成品,而Samsonite South Asia Private Limited則向Abhishri Packaging Pvt. Ltd出售若干原材料及零部件。Abhishri Packaging Pvt. Ltd亦為Samsonite South Asia Private Limited製造硬身行李箱產品。
採購、銷售、應付款項及應收款項的相關金額如下:
II. 本集團的印度附屬公司Samsonite South Asia Private Limited向Bagzone Lifestyle Private Limited 出售製成品。Bagzone Li festyle Private Limited 由 Tainwala 先生的家族管理及控制。本集團的中國附屬公司 Samsonite (China) Co., Ltd就Bagzone Lifestyle Private Limited 銷售的若干其他品牌產品提供採購支援及品質檢查服務,直至協議於2018 年 12 月31日屆滿為止。

114
21. Related Party Transactions Continued
(b) Other Related Party Transactions Continued
21. 關連方交易 續(b) 其他關連方交易 續
(Expressed in millions of US Dollars) (以百萬美元呈列)
Six months ended June 30, 2018
截至2018年6月30日
止六個月
Sales 銷售 6.8
Support and Services 支援及服務 0.1
Rent 租金 0.0
(Expressed in millions of US Dollars) (以百萬美元呈列)December 31, 2018
2018年12月31日
Receivables 應收款項 11.7
Approximately US$0.5 million was paid to entities owned by Mr. Tainwala and his family, for office space rent for the six months ended June 30, 2018. As of December 31, 2018, there were no payables due to Mr. Tainwala and his family.
All outstanding balances with these related parties were priced at an arm’s length basis and are to be settled in cash. None of the balances are secured.
22. Subsequent EventsThe Group has evaluated events occurring subsequent to June 30, 2019, the
reporting date, through August 21, 2019, the date this financial information was authorized for issuance by the Board.
On March 13, 2019, the Company’s Board of Directors recommended that a cash distribution in the amount of US$125.0 million, or approximately US$0.0873 per share, be made to the Company’s shareholders. The shareholders approved this distribution on June 6, 2019 at the Company’s Annual General Meeting and the distribution was paid on July 16, 2019.
From June 30, 2019 to the Latest Practicable Date, the Company issued 154,304 ordinary shares in connection with the exercise of share options that were granted under the Company’s Share Award Scheme. There were no purchases or redemptions of the Company’s listed securities by the Company or any of its subsidiaries since June 30, 2019.
綜合中期財務報表附註 續
Notes to the Consolidated Interim Financial Statements Continued
截至 2018 年 6 月 30 日止六個月,約 0.5 百萬美元已分別支付予由Tainwala先生及其家族擁有的實體,以作辦公地點的租金。於 2018 年 12 月 31 日,並無應向Tainwala先生及其家族支付的款項。
所有與此等關連方有關的未償還結餘的金額均按公平磋商基準而定,且將以現金支付。所有結餘均無抵押。
22. 期後事項本集團已評估於 2019 年 6 月 30 日(報告日期)
後至 2019 年 8 月 21 日(本財務資料獲董事會授權刊發日期)所發生事項。
於2019年3月13日,本公司董事會建議向本公司股東作出125.0百萬美元或每股約0.0873美元的現金分派。股東於 2019 年 6 月 6 日舉行的本公司股東週年大會上批准此項分派,而分派已於2019年7月16日派付。
由2019年6月30日至最後實際可行日期,本公司就本公司股份獎勵計劃項下授出的購股權獲行使而發行 154,304 股普通股。自 2019 年 6 月 30 日以來,本公司或其任何附屬公司概無購買或贖回本公司上市證券。

115Samsonite International S.A. Interim Report 2019 新秀麗國際有限公司 2019年中期報告
Directors’ and Chief Executive Officer’s Interests and Short Positions in the Shares and Underlying Shares
As of June 30, 2019, the interests and short positions of the directors and chief executive officer of the Company in the shares and underlying shares of the Company and its associated corporations (within the meaning of Part XV of the Securities and Futures Ordinance (the “SFO”)) which were required to be notified to the Company and The Stock Exchange of Hong Kong Limited (the “Stock Exchange”) pursuant to Divisions 7 and 8 of Part XV of the SFO (including interests or short positions which they were taken or deemed to have under such provisions of the SFO), or as recorded in the register required to be kept by the Company under Section 352 of Part XV of the SFO or as otherwise notified to the Company and the Stock Exchange pursuant to the Model Code for Securities Transactions by Directors of Listed Issuers (the “Model Code”) as set out in Appendix 10 of the Rules Governing the Listing of Securities on the The Stock Exchange of Hong Kong Limited (the “Listing Rules”) were as follows:
1. Long position in the shares of the Company
Name of Director董事姓名
Nature of Interest權益性質
Number of ordinary shares/underlying shares
held at June 30, 2019(a)
於2019年6月30日持有的普通股╱相關股份數目 (a)
Approximate shareholding %
佔股權的概約百分比
Timothy Charles Parker Beneficial owner 實益擁有人
60,645,644 (L)(b) 4.2
Kyle Francis Gendreau Beneficial owner and founder of a discretionary trust實益擁有人及一個全權信託的創辦人
11,182,878 (L)(c) 0.7
Tom Korbas Beneficial owner 實益擁有人
1,442,704 (L)(d) 0.1
Bruce Hardy McLain Beneficial owner 實益擁有人
883,400 (L)(e) 0.0
Keith Hamill Beneficial owner 實益擁有人
193,745 (L) 0.0
Paul Kenneth Etchells Beneficial owner 實益擁有人
99,900 (L)(f) 0.0
Ying Yeh 葉鶯
Beneficial owner 實益擁有人
3,000 (L) 0.0
Notes
(a) (L) represents long position.
(b) Comprised of 28,312,540 shares held by Mr. Parker and 28,142,740 shares held by his spouse, Ms. Therese Charlotte Christiaan Marie Parker, each as beneficial and registered owner. Mr. Parker is deemed by virtue of the SFO to be interested in the shares held by Ms. Parker. Also includes share options held by Mr. Parker that are exercisable for 4,190,364 shares once vested.
(c) Comprised of 1,575,848 shares held by a discretionary trust of which Mr. Gendreau is the founder, share options exercisable for 7,788,391 shares once vested, TRSUs in respect of 606,216 shares once vested and PRSUs in respect of an initial or target number of 1,212,423 shares (with the final number of shares being subject to the level of achievement of the performance conditions applicable to the grant of such PRSUs).
(d) Comprised of 696,171 shares held by Mr. Korbas as beneficial and registered owner and share options exercisable for 746,533 shares once vested.
(e) Comprised of 500,000 shares held by Mr. McLain and 383,400 shares held by his spouse, Ms. Helle Elisabeth Skov McLain, each as beneficial and registered owner. Mr. McLain is deemed by virtue of the SFO to be interested in the shares held by Ms. McLain.
(f) Comprised of 99,900 shares held by Mr. Etchells and his spouse, Ms. Fanny Fan Miu Tsang, each as beneficial and registered owner.
董事及最高行政人員於股份及相關股份的權益及淡倉
於2019年6月30日,本公司董事及最高行政人員於本公司及其相聯法團(按《證券及期貨條例》第XV部的定義)的股份及相關股份中擁有根據《證券及期貨條例》第XV部第7及8分部須知會本公司及香港聯合交易所有限公司(「聯交所」)的權益及淡倉(包括根據《證券及期貨條例》的有關條文彼等被當作或視作擁有的權益或淡倉),或記入本公司須根據《證券及期貨條例》第XV部第352條備存的登記冊的權益及淡倉,或根據《香港聯合交易所有限公司證券上市規則》(「《上市規則》」)附錄10所載的《上市發行人董事進行證券交易的標準守則》(「《標準守則》」)須另行知會本公司及聯交所的權益及淡倉如下:
1. 於本公司股份的好倉
註釋
(a) (L)代表好倉。
(b) 包括 2 8 , 3 1 2 , 5 4 0 股由 P a r k e r 先生持有的股份及28,142,740股由其配偶Therese Charlotte Christiaan Marie Parker女士持有的股份,彼等各自為實益及登記擁有人。根據《證券及期貨條例》,Parker 先生被視為擁有 Parker 女士所持有的股份的權益。亦包括Parker先生所持有於歸屬後可行使以認購4,190,364股股份的購股權。
(c) 包括1,575,848股由Gendreau先生為創辦人的全權信託所持有的股份、可於歸屬後行使以認購7,788,391股股份的購股權、可於歸屬後認購606,216股股份的時間掛鈎受限制股份單位及初始或目標數目為1,212,423股股份(最終股份數目視適用於授出有關績效掛鈎受限制股份單位的表現條件達成程度而定)的績效掛鈎受限制股份單位。
(d) 包括696,171股由Korbas先生作為實益及登記擁有人持有的股份及可於歸屬後行使以認購746,533股股份的購股權。
(e) 包括500,000股由McLain先生持有的股份及383,400股由其配偶Helle Elisabeth Skov McLain女士持有的股份,彼等各自為實益及登記擁有人。根據《證券及期貨條例》,McLain先生被視為擁有McLain女士所持有股份的權益。
(f) 包括99,900股由Etchells先生及其配偶Fanny Fan Miu Tsang 女士持有的股份,彼等各自為實益及登記擁有人。
權益披露Disclosure of Interests

116
2. Interests in the shares of associated corporationsAs of June 30, 2019, none of the directors or chief executive of the Company
have or are deemed to have interests or short positions in the shares, underlying shares or debentures of the Company and any of its associated corporations (within the meaning of Part XV of the SFO) which were notifiable to the Company and the Stock Exchange pursuant to Divisions 7 and 8 of Part XV of the SFO (including interests and short positions which they are taken or deemed to have under such provisions of the SFO), or recorded in the register required to be maintained by the Company under Section 352 of Part XV of the SFO, or as otherwise notifiable to the Company and the Stock Exchange pursuant to the Model Code.
Substantial Shareholders’ Interests and Short Positions in the Shares and Underlying Shares1. Long and short position in the shares of the Company
Name of Shareholder股東名稱
Nature of Interest權益性質
Number of ordinary shares
held at June 30, 2019(a)
於2019年6月30日持有的普通股數目 (a)
Approximate shareholding %
佔股權的概約百分比
Schroders Plc Investment manager投資管理人
118,448,000 (L) 8.2
The Capital Group Companies, Inc. Interest in a controlled corporation於受控制法團的權益
98,031,879 (L) 6.8
Citigroup Inc. Custodian corporation/Approved lending agent託管法團╱核准借出代理人
83,223,135 (P) 5.8
Citigroup Inc. Interest in a controlled corporation於受控制法團的權益
2,659,279 (L) 0.1
Citigroup Inc. Interest in a controlled corporation於受控制法團的權益
2,658,849 (S) 0.1
The Bank of New York Mellon Corporation Interest in a controlled corporation於受控制法團的權益
51,022,233 (P) 3.5
The Bank of New York Mellon Corporation Interest in a controlled corporation於受控制法團的權益
21,954,320 (L) 1.5
The Bank of New York Mellon Corporation Interest in a controlled corporation於受控制法團的權益
21,312,825 (S) 1.4
JPMorgan Chase & Co. Custodian corporation/Approved lending agent託管法團╱核准借出代理人
65,392,365 (P) 4.5
JPMorgan Chase & Co. Interest in a controlled corporation於受控制法團的權益
5,464,420 (L) 0.3
JPMorgan Chase & Co. Person having a security interest in shares擁有股份抵押權益之人士
671,563 (L) 0.0
JPMorgan Chase & Co. Investment manager投資管理人
36,000 (L) 0.0
JPMorgan Chase & Co. Trustee託管人
34,540 (L) 0.0
JPMorgan Chase & Co. Interest in a controlled corporation於受控制法團的權益
5,401,689 (S) 0.3
Notes
(a) (L) represents long position, (S) represents short position, (P) represents lending pool.
Save as disclosed above, as of June 30, 2019, so far as the directors are aware, no other persons (except the directors or chief executive officer of the Company) or corporations had 5% or more interests or short positions in shares and underlying shares of the Company which were recorded in the register required to be maintained by the Company pursuant to Section 336 of Part XV of the SFO.
2. 於相聯法團股份的權益於 2019 年 6 月 30 日,概無本公司董事或最高
行政人員於或被視作於本公司及其任何相聯法團(按《證券及期貨條例》第XV部的定義)的股份、相關股份或債權證中擁有根據《證券及期貨條例》第XV部第7 及 8 分部須知會本公司及聯交所的權益或淡倉(包括根據《證券及期貨條例》的有關條文彼等被當作或視作擁有的權益及淡倉),或記入本公司須根據《證券及期貨條例》第XV部第352條備存的登記冊的權益或淡倉,或根據《標準守則》須另行知會本公司及聯交所的權益或淡倉。
主要股東於股份及相關股份的權益及淡倉1. 於本公司股份的好倉及淡倉
註釋
(a) (L)代表好倉,(S)代表淡倉,(P)代表可借出的股份。
除上文披露者外,於2019年6月30日,董事並不知悉任何其他人士(本公司董事或行政總裁除外)或法團於本公司股份及相關股份中擁有記入本公司須根據《證券及期貨條例》第XV部第336條備存的登記冊的5%或以上的權益或淡倉。
權益披露 續Disclosure of Interests Continued

117Samsonite International S.A. Interim Report 2019 新秀麗國際有限公司 2019年中期報告
The Board of Directors (the “Board”) of the Company is pleased to present this Corporate Governance Report for the six months ended June 30, 2019.
DirectorsAs of June 30, 2019, the composition of the Board of Directors of the Company (the “Board”) was as follows:
Executive Director (“ED”)Kyle Francis Gendreau
Non-Executive Directors (“NEDs”)Timothy Charles ParkerTom Korbas
Independent Non-Executive Directors (“INEDs”)Paul Kenneth EtchellsJerome Squire GriffithKeith HamillBruce Hardy McLain (Hardy)Ying Yeh
At June 30, 2019, the Board committees were as follows:
Audit Committee/Review of AccountsThe Board has established an Audit Committee and has adopted written
terms of reference that set forth the authority and duties of the committee. The Audit Committee consists of three members, namely Mr. Paul Kenneth Etchells (Chairman of the Audit Committee) (INED), Mr. Keith Hamill (INED) and Ms. Ying Yeh (INED).
In compliance with Rule 3.21 of the Listing Rules, at least one member of the Audit Committee possesses appropriate professional qualifications in accounting or related financial management expertise in discharging the responsibilities of the Audit Committee.
All members have sufficient experience in reviewing audited financial statements as aided by the auditors of the Company whenever required.
The primary duties of the Audit Committee are to review and supervise the Company’s financial reporting process and risk management and internal control systems, to monitor the integrity of the Company’s consolidated financial statements and financial reporting, and to oversee the audit process.
The Audit Committee has reviewed the interim report of the Group as of and for the six months ended June 30, 2019 with the Board of Directors. The interim financial information has also been reviewed by the Group’s external auditors.
本公司董事會(「董事會」)欣然呈列截至2019年6月30日止六個月的本企業管治報告。
董事於2019年6月30日,本公司董事會(「董事會」)由以下人士組成:
執行董事Kyle Francis Gendreau
非執行董事Timothy Charles ParkerTom Korbas
獨立非執行董事Paul Kenneth EtchellsJerome Squire GriffithKeith HamillBruce Hardy McLain (Hardy)葉鶯
於2019年6月30日,各董事會委員會如下:
審核委員會╱審閱賬目董事會已成立審核委員會,並已採納載列委員
會權力及職責的書面職權範圍。審核委員會由三名成員組成,即Paul Kenneth Etchells先生(審核委員會主席)(獨立非執行董事)、Keith Hamill先生(獨立非執行董事)及葉鶯女士(獨立非執行董事)。
為符合《上市規則》第3.21條,至少一名審核委員會成員擁有會計或相關財務管理專業方面的適當專業資格,以履行審核委員會的責任。
所有成員均在審閱經審核財務報表方面有充足經驗,並在需要時由本公司的核數師協助。
審核委員會的主要職責為檢討及監察本公司財務報告程序以及風險管理及內部控制系統、監控本公司綜合財務報表及財務報告的完整性以及監督審核程序。
審核委員會已連同董事會審閱本集團截至 2019 年 6月30日及截至該日止六個月的中期報告。中期財務資料亦已經由本集團的外聘核數師審閱。
企業管治及其他資料Corporate Governance and Other Information

118
Nomination CommitteeThe Board has established a Nomination Committee and has adopted written
terms of reference that set forth the authority and duties of the committee. The Nomination Committee consists of three members, namely Mr. Timothy Charles Parker (Chairman of the Nomination Committee) (NED), Mr. Paul Kenneth Etchells (INED) and Ms. Ying Yeh (INED).
The primary duties of the Nomination Committee are to review the structure, size and composition of the Board, to make recommendations to the Board with respect to any changes to the composition of the Board, and to assess the independence of the INEDs. When identifying suitable candidates, the Nomination Committee shall (where applicable and appropriate) use open advertising or the services of external advisers and consider candidates from a wide range of backgrounds on merit and against objective criteria. The Nomination Committee’s policy for evaluating and nominating any candidate for directorship includes considering various criteria, including character and integrity, qualifications (including professional qualifications), skills, knowledge and experience and diversity aspects under the Board’s diversity policy, potential contributions the candidate can make to the Board and such other matters that are appropriate to the Company’s business and succession plan.
Remuneration CommitteeThe Board has established a Remuneration Committee and has adopted
written terms of reference that set forth the authority and duties of the committee. The Remuneration Committee consists of four members, namely Mr. Keith Hamill (Chairman of the Remuneration Committee) (INED), Mr. Paul Kenneth Etchells (INED), Mr. Bruce Hardy McLain (Hardy) (INED) and Ms. Ying Yeh (INED).
The primary duties of the Remuneration Committee are to make recommendations to the Board on the Company’s policy and structure for the remuneration of directors and senior management and on the establishment of a formal and transparent procedure for developing policy on such remuneration, as well as to determine the specific remuneration packages of all EDs and certain members of senior management.
Corporate Governance PracticesThe Company is committed to maintaining high standards of corporate
governance. The Company recognizes that sound corporate governance practices are fundamental to the effective and transparent operation of the Company and to its ability to protect the rights of its shareholders and enhance shareholder value.
The Company has adopted its own corporate governance manual, which is based on the principles, provisions and practices set out in the Corporate Governance Code (as in effect from time to time, the “CG Code”) contained in Appendix 14 of the Listing Rules.
The Company complied with all applicable code provisions set out in the CG Code throughout the period from January 1, 2019 to June 30, 2019.
提名委員會董事會已成立提名委員會,並已採納載列委員
會權力及職責的書面職權範圍。提名委員會由三名成員組成,即Timothy Charles Parker先生(提名委員會主席)(非執行董事)、Paul Kenneth Etchells先生(獨立非執行董事)及葉鶯女士(獨立非執行董事)。
提名委員會的主要職責為檢討董事會架構、規模及組成、就董事會組成的任何變動向董事會提供推薦建議及評估獨立非執行董事的獨立性。於物色合適人選時,提名委員會將(如適用及合適)利用公開招聘廣告或外聘顧問的服務及按客觀標準考慮來自不同背景人選的勝任能力。提名委員會有關評估及提名任何董事候選人的政策須考慮多項準則,包括品格與誠信、資格(包括專業資格)、技能、知識及經驗以及董事會成員多元化政策下的多元化因素、候選人對董事會的潛在貢獻及其他適用於本公司業務及繼任計劃的事宜。
薪酬委員會董事會已成立薪酬委員會,並已採納載列委員
會權力及職責的書面職權範圍。薪酬委員會由四名成員組成,即Keith Hamill先生(薪酬委員會主席)
(獨立非執行董事)、Paul Kenneth Etchells先生(獨立非執行董事)、Bruce Hardy McLain (Hardy)先生
(獨立非執行董事)及葉鶯女士(獨立非執行董事)。
薪酬委員會的主要職責為就本公司董事及高級管理層的薪酬政策及架構及就有關薪酬設立正規而具透明度的程序的政策向董事會作出推薦建議,以及釐定全體執行董事及若干高級管理層成員的具體薪酬待遇。
企業管治常規本公司致力維持高水平的企業管治。本公司認
為健全的企業管治常規是本公司能有效及具透明度地營運以及保障股東權利及提高股東價值的基礎。
本公司所採納的企業管治手冊,是根據《上市規則》附錄14所載不時生效的《企業管治守則》的原則、條文及常規所編製。
本公司自2019年1月1日起至2019年6月30日止整個期間已遵守《企業管治守則》所載的所有適用守則條文。
企業管治及其他資料 續
Corporate Governance and Other Information Continued

119Samsonite International S.A. Interim Report 2019 新秀麗國際有限公司 2019年中期報告
Risk Management and Internal ControlThe Board is responsible for ensuring that the Company establishes and
maintains appropriate and effective risk management and internal control systems. The Board has delegated to the Audit Committee the responsibility for reviewing the effectiveness of the Group’s risk management and internal control systems. The Company’s management, under the oversight of the Board, is responsible for the design, implementation and monitoring of the Company’s risk management and internal control systems.
Changes in Information of DirectorsNo changes in information concerning Directors of the Company have
occurred subsequent to the publication of the Company’s 2018 annual report that are required to be disclosed pursuant to Rule 13.51(B)(1) of the Listing Rules.
Company Secretaries and Authorized RepresentativesMr. John Bayard Livingston and Ms. Chow Yuk Yin Ivy (“Ms. Chow”) are the
joint company secretaries of the Company while Mr. Kyle Francis Gendreau and Ms. Chow are the Company’s authorized representatives (pursuant to the Listing Rules).
Directors’ Securities TransactionsThe Company has adopted its own policies (the “Trading Policy”) for
securities transactions by directors and relevant employees who are likely to be in possession of unpublished inside information of the Group on terms no less exacting than the Model Code for Securities Transactions by Directors of Listed Issuers as set out in Appendix 10 of the Listing Rules. Having made specific enquiry of all Directors, all Directors have confirmed that they complied with the required standard set out in the Trading Policy during the six months ended June 30, 2019.
Share Award SchemeOn September 14, 2012, the Company’s shareholders adopted the Company’s
Share Award Scheme, which will remain in effect until September 13, 2022. The purpose of the Share Award Scheme is to attract skilled and experienced personnel, to incentivize them to remain with the Group and to motivate them to strive for the future development and expansion of the Group by providing them with the opportunity to acquire equity interests in the Company. Awards under the Share Award Scheme may take the form of either share options or restricted share units (“RSUs”), which may be granted at the discretion of the Remuneration Committee to executive directors of the Company and its subsidiaries, managers employed or engaged by the Group, and/or employees of the Group.
As of July 31, 2019 (the “Latest Practicable Date”), the maximum aggregate number of shares in respect of which awards may be granted pursuant to the Share Award Scheme is 21,891,568 shares, representing approximately 1.5% of the issued share capital of the Company at that date. An individual participant may be granted awards pursuant to the Share Award Scheme in respect of a maximum of 1% of the Company’s total issued shares in any 12-month period. Any grant of awards to an individual participant in excess of this limit is subject to independent shareholder’s approval.
風險管理及內部控制董事會負責確保本公司制訂及維持適當及有效
的風險管理及內部控制系統。董事會已授權審核委員會負責檢討本集團的風險管理及內部控制系統的有效性。在董事會的監督下,本公司的管理層負責設計、實施及監察本公司的風險管理及內部控制系統。
董事資料變動自本公司 2018 年年報刊發以來,本公司董事
資料並無任何變更而根據上市規則第13.51(B)(1)條須予披露。
公司秘書及授權代表John Bayard Livingston 先生及周玉燕女士
(「周女士」)為本公司聯席公司秘書,而Kyle Francis Gendreau先生及周女士為本公司的授權代表(根據
《上市規則》)。
董事證券交易本公司已採納其本身就可能擁有本集團未公
開內幕消息的董事及相關僱員進行證券交易的政策(「交易政策」),有關條款不比《上市規則》附錄10所載的《上市發行人董事進行證券交易的標準守則》寬鬆。經向全體董事作出詳盡查詢後,全體董事均已確認彼等於截至2019年6月30日止六個月一直遵守交易政策所載的規定準則。
股份獎勵計劃於 2012 年 9 月 14 日,本公司股東採納本公司
股份獎勵計劃,該計劃有效期至2022年9月13日為止。股份獎勵計劃的目的是通過提供獲取本公司股權的機會吸引有技能和經驗的人員,激勵彼等留任本集團,以及鼓勵彼等為本集團的未來發展及擴展而努力。股份獎勵計劃項下的獎勵可為購股權或受限制股份單位,按薪酬委員會酌情決定授出的形式授予本公司及其附屬公司執行董事、本集團僱佣或聘任的管理人員、及╱或本集團僱員。
於 2019 年 7 月 31 日(「最後實際可行日期」),根據股份獎勵計劃可能授出的獎勵最高股份數目合共為21,891,568 股股份,佔本公司於該日已發行股本約1.5%。個別參與者可於任何12個月期間根據股份獎勵計劃獲授本公司已發行股份總數不超過 1% 的獎勵。個別參與者如獲授予超出此限額的獎勵,則須經獨立股東批准。

120
Share Award Scheme Continued
Share-based compensation expense of US$7.0 million and US$8.6 million was recognized in the consolidated income statements, with a corresponding increase in equity reserves, for the six months ended June 30, 2019 and June 30, 2018, respectively.
Share OptionsThe exercise price of share options is determined at the time of grant by the
Remuneration Committee in its absolute discretion, but in any event shall not be less than the higher of:
a) the closing price of the shares as stated in the daily quotation sheets issued by the Stock Exchange on the date of grant;
b) the average closing price of the shares as stated in the daily quotation sheets issued by the Stock Exchange for the five business days immediately preceding the date of grant; and
c) the nominal value of the shares.
The grant-date fair value of equity-settled share-based payment awards granted to employees is recognized as an employee expense, with a corresponding increase in equity when such options represent equity-settled awards, over the period that the employees unconditionally become entitled to the awards. The amount recognized as an expense is adjusted to reflect the number of awards for which the related service and non-market performance conditions are expected to be met, such that the amount ultimately recognized as an expense is based on the number of awards that meet the related service and non-market performance conditions at the vesting date. For equity-settled share-based payment awards with market performance conditions or non-vesting conditions, the grant-date fair value of the share-based payment is measured to reflect such conditions and there is no true-up for differences between expected and actual outcomes.
Holders of vested share options are entitled to buy newly issued ordinary shares of the Company at a purchase price per share equal to the exercise price of the options. The fair value of services received in return for share options granted is based on the fair value of share options granted measured using the Black-Scholes valuation model. The fair value calculated for share options is inherently subjective due to the assumptions made and the limitations of the model utilized. Shares underlying an award of share options that forfeit (“lapse”) without the issuance of such shares upon the exercise of such options may be available for future grant under the Share Award Scheme.
On June 17, 2019, the Company granted share options exercisable for 10,462,500 ordinary shares to an executive director of the Company, certain key management personnel and other employees of the Group with an exercise price of HK$16.04 per share. Such options are subject to graded (“pro rata”) vesting over a four-year period from the date of grant, with 25% of the options vesting on each anniversary of the date of the grant, subject to the grantee continuing to be employed by, or continuing to provide services to, the Group on the applicable vesting date. Such options have a 10-year term.
Expected volatility is estimated taking into account historic average share price volatility. The expected dividends are based on the Group’s history and expectation of dividend payouts.
股份獎勵計劃 續7.0百萬美元及8.6百萬美元以股份支付的薪酬開支已分別於截至2019年6月30日及2018年6月30日止六個月的綜合收益表中確認,並於權益儲備中相應增加。
購股權購股權的行使價於授出時由薪酬委員會全權酌
情釐定,惟在任何情況下不得低於以下三者中的較高者:
a) 於授出日聯交所刊發的每日報價表所列股份收市價;
b) 緊接授出日前五個營業日聯交所刊發的每日報價表所列股份平均收市價;及
c) 股份面值。
授予僱員以股權結算以股份支付的獎勵,於僱員無條件地獲得獎勵的期間以授出日的公允價值確認為僱員開支,如該等購股權為以股權結算的獎勵,權益亦相應增加。確認為開支的金額會作出調整,以反映預期符合相關服務和非市場績效條件的獎勵數目。最終確認為開支的數額則按歸屬日符合相關服務和非市場績效條件的獎勵數目計算。就附設市場績效條件或不附設歸屬條件的以股權結算以股份支付的獎勵而言,以股份支付的薪酬於授出日期公允價值計量會反映有關條件,並無調整預期及實際結果之間的差額。
已歸屬購股權的持有人有權按等於購股權行使價的每股認購價認購本公司新發行的普通股。作為已授出購股權回報的已獲取服務的公允價值是基於以柏力克 — 舒爾斯估值模式計量的所授購股權的公允價值計算。由於所作假設及所用模式有所限制,故就購股權計算的公允價值難免有主觀成分。任何已沒收(「失效」)且並無於行使時發行股份的購股權獎勵的相關股份日後可根據股份獎勵計劃授出。
於 2019 年 6 月 17 日,本公司向本公司一名執行董事、若干主要管理人員及本集團其他僱員授出可行使以認購 10,462,500 股普通股的購股權,行使價為每股 16.04 港元。該等購股權須於授出日起 4 年期內根據年期平均(「按比例」)歸屬,當中25%的購股權於授出日的各個週年日歸屬,惟承授人須於相關歸屬日仍持續受聘於本集團或持續向本集團提供服務。該等購股權的年期為10年。
預期波動是經計及歷史平均股價波動而估計。預期股息是按本集團的派息紀錄及預期計算。
企業管治及其他資料 續
Corporate Governance and Other Information Continued

121Samsonite International S.A. Interim Report 2019 新秀麗國際有限公司 2019年中期報告
Share Award Scheme Continued
Share Options Continued
The following inputs were used in the measurement of the fair value at grant date of the share-based payment for the share options exercisable for 10,462,500 shares that were granted on June 17, 2019:
Fair value at grant date 於授出日的公允價值 HK$3.08港元
Share price at grant date 於授出日的股價 HK$15.80港元
Exercise price 行使價 HK$16.04港元
Expected volatility (weighted average volatility) 預期波動(加權平均波動) 32.8%
Option life (expected weighted average life) 購股權年期(預期加權平均年期) 6.25 years年
Expected dividends 預期股息 4.3%
Risk-free interest rate (based on government bonds) 無風險利率(以政府債券為基準) 1.6%
Particulars and movements of share options during the six months ended June 30, 2019 were as follows:
Number of share options
購股權數目
Name/category of grantee承授人的姓名╱類別
As of January 1,
2019於2019年
1月1日
Granted during
the period期內授出
Exercised during
the period(1)
期內行使 (1)
Canceled/forfeited
(“lapsed”) during
the period期內註銷╱
沒收(「失效」)
As of June 30,
2019於2019年6月30日
Date of grant
授出日
Exercise period
行使期
Exercise price per share
(HK$)
每股行使價
(港元)
Closing price immediately
preceding the date of
grant (HK$)緊接授出日前
的收市價(港元)
Directors 董事
Timothy Parker 1,821,615 – – – 1,821,615 January 7, 20142014年1月7日
January 7, 2015–January 6, 20242015年1月7日至2024年1月6日
23.30 23.30
Timothy Parker 2,368,749 – – – 2,368,749 January 8, 20132013年1月8日
January 8, 2014–January 7, 20232014年1月8日至2023年1月7日
17.36 16.90
Kyle Gendreau – 1,544,980 – – 1,544,980 June 17, 20192019年6月17日
June 17, 2020–June 16, 20292020年6月17日至2029年6月16日
16.04 16.18
Kyle Gendreau 1,336,988 – – – 1,336,988 October 11, 20182018年10月11日
October 11, 2019–October 10, 20282019年10月11日至2028年10月10日
27.06 25.95
Kyle Gendreau 952,676 – – – 952,676 May 26, 20172017年5月26日
May 26, 2018–May 25, 20272018年5月26日至2027年5月25日
31.10 30.45
Kyle Gendreau 1,230,464 – – – 1,230,464 May 6, 20162016年5月6日
May 6, 2017–May 5, 20262017年5月6日至2026年5月5日
24.91 24.00
Kyle Gendreau 216,683 – – – 216,683 January 7, 20152015年1月7日
January 7, 2016–January 6, 20252016年1月7日至2025年1月6日
23.31 23.30
Kyle Gendreau 2,506,600 – – – 2,506,600 January 7, 20152015年1月7日
January 7, 2018–January 6, 20252018年1月7日至2025年1月6日
23.31 23.30
Tom Korbas 714,182 – – – 714,182 January 7, 20152015年1月7日
January 7, 2016–January 6, 20252016年1月7日至2025年1月6日
23.31 23.30
Tom Korbas 32,351 – – – 32,351 January 7, 20142014年1月7日
January 7, 2015–January 6, 20242015年1月7日至2024年1月6日
23.30 23.30
Total Directors董事總計 11,180,308 1,544,980 – – 12,725,288
股份獎勵計劃 續購股權 續
在 計 算 於 2 0 1 9 年 6 月 1 7 日 授 出 可 行 使 以 認 購10,462,500 股股份的購股權的以股份支付在授出日的公允價值時採用的輸入參數如下:
截至2019年6月30日止六個月,購股權的詳情及變動如下:
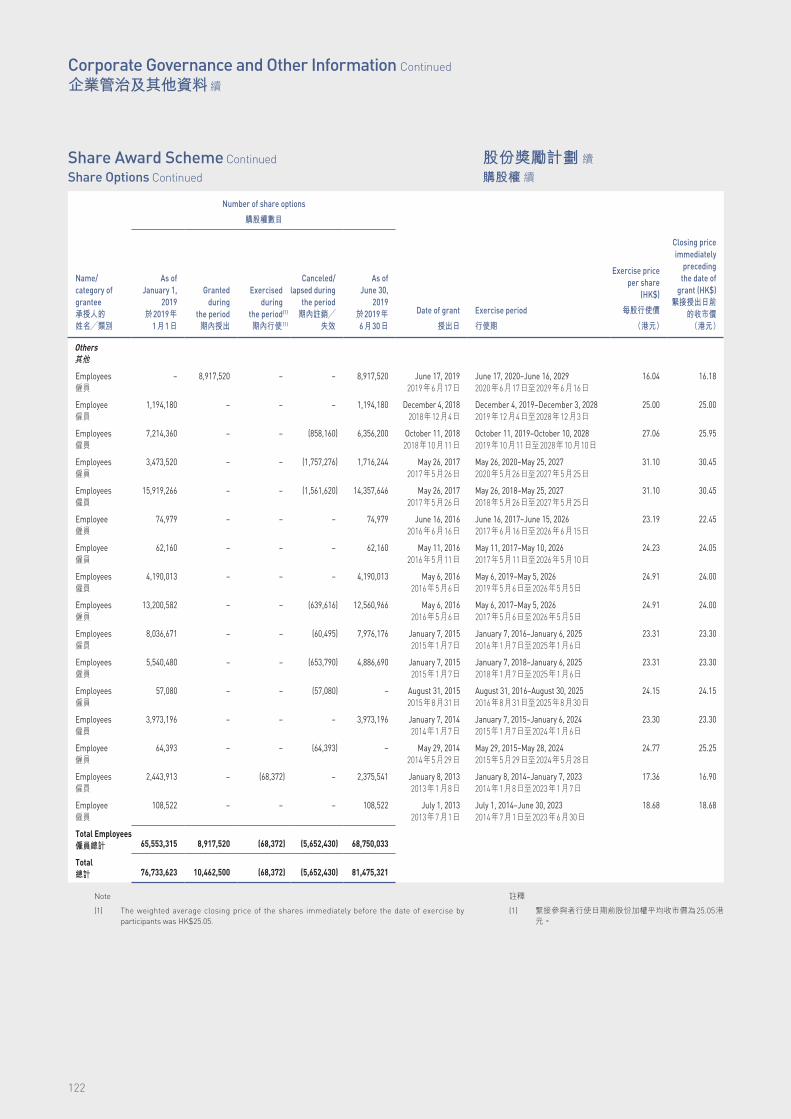
122
Share Award Scheme Continued
Share Options Continued
Number of share options
購股權數目
Name/category of grantee承授人的姓名╱類別
As of January 1,
2019於2019年
1月1日
Granted during
the period期內授出
Exercised during
the period(1)
期內行使 (1)
Canceled/lapsed during
the period期內註銷╱
失效
As of June 30,
2019於2019年6月30日
Date of grant
授出日
Exercise period
行使期
Exercise price per share
(HK$)
每股行使價
(港元)
Closing price immediately
preceding the date of
grant (HK$)緊接授出日前
的收市價(港元)
Others其他
Employees僱員
– 8,917,520 – – 8,917,520 June 17, 20192019年6月17日
June 17, 2020–June 16, 20292020年6月17日至2029年6月16日
16.04 16.18
Employee僱員
1,194,180 – – – 1,194,180 December 4, 20182018年12月4日
December 4, 2019–December 3, 20282019年12月4日至2028年12月3日
25.00 25.00
Employees僱員
7,214,360 – – (858,160) 6,356,200 October 11, 20182018年10月11日
October 11, 2019–October 10, 20282019年10月11日至2028年10月10日
27.06 25.95
Employees僱員
3,473,520 – – (1,757,276) 1,716,244 May 26, 20172017年5月26日
May 26, 2020–May 25, 20272020年5月26日至2027年5月25日
31.10 30.45
Employees僱員
15,919,266 – – (1,561,620) 14,357,646 May 26, 20172017年5月26日
May 26, 2018–May 25, 20272018年5月26日至2027年5月25日
31.10 30.45
Employee僱員
74,979 – – – 74,979 June 16, 20162016年6月16日
June 16, 2017–June 15, 20262017年6月16日至2026年6月15日
23.19 22.45
Employee僱員
62,160 – – – 62,160 May 11, 20162016年5月11日
May 11, 2017–May 10, 20262017年5月11日至2026年5月10日
24.23 24.05
Employees僱員
4,190,013 – – – 4,190,013 May 6, 20162016年5月6日
May 6, 2019–May 5, 20262019年5月6日至2026年5月5日
24.91 24.00
Employees僱員
13,200,582 – – (639,616) 12,560,966 May 6, 20162016年5月6日
May 6, 2017–May 5, 20262017年5月6日至2026年5月5日
24.91 24.00
Employees僱員
8,036,671 – – (60,495) 7,976,176 January 7, 20152015年1月7日
January 7, 2016–January 6, 20252016年1月7日至2025年1月6日
23.31 23.30
Employees僱員
5,540,480 – – (653,790) 4,886,690 January 7, 20152015年1月7日
January 7, 2018–January 6, 20252018年1月7日至2025年1月6日
23.31 23.30
Employees僱員
57,080 – – (57,080) – August 31, 20152015年8月31日
August 31, 2016–August 30, 20252016年8月31日至2025年8月30日
24.15 24.15
Employees僱員
3,973,196 – – – 3,973,196 January 7, 20142014年1月7日
January 7, 2015–January 6, 20242015年1月7日至2024年1月6日
23.30 23.30
Employee僱員
64,393 – – (64,393) – May 29, 20142014年5月29日
May 29, 2015–May 28, 20242015年5月29日至2024年5月28日
24.77 25.25
Employees僱員
2,443,913 – (68,372) – 2,375,541 January 8, 20132013年1月8日
January 8, 2014–January 7, 20232014年1月8日至2023年1月7日
17.36 16.90
Employee僱員
108,522 – – – 108,522 July 1, 20132013年7月1日
July 1, 2014–June 30, 20232014年7月1日至2023年6月30日
18.68 18.68
Total Employees僱員總計 65,553,315 8,917,520 (68,372) (5,652,430) 68,750,033
Total總計 76,733,623 10,462,500 (68,372) (5,652,430) 81,475,321
Note
(1) The weighted average closing price of the shares immediately before the date of exercise by participants was HK$25.05.
股份獎勵計劃 續購股權 續
註釋
(1) 緊接參與者行使日期前股份加權平均收市價為25.05港元。
企業管治及其他資料 續
Corporate Governance and Other Information Continued

123Samsonite International S.A. Interim Report 2019 新秀麗國際有限公司 2019年中期報告
Share Award Scheme Continued
Restricted Share Units (“RSUs”)Two types of RSU awards have been granted by the Company: time-based
RSUs (“TRSUs”) and performance-based RSUs (“PRSUs”).
Time-based Restricted Share Units
TRSUs granted by the Company are subject to pro rata vesting over a three-year period, with one-third of such TRSUs vesting on each anniversary of the date of the grant, subject to the grantee continuing to be employed by, or continuing to provide services to, the Group on the applicable vesting date. Expense for TRSUs is based on the closing market price of the Company’s shares on the date of grant, discounted by the present value of expected future dividends, and is recognized ratably over the vesting period, net of expected forfeitures.
On June 17, 2019, the Company awarded TRSUs with respect to 4,074,414 shares to an executive director of the Company, certain key management personnel and other employees of the Group.
Particulars and movements of TRSUs during the six months ended June 30, 2019 were as follows:
Number of TRSUs時間掛鈎受限制股份單位數目
Name/category of grantee承授人的姓名╱類別
As of January 1,
2019於2019年
1月1日
Granted during the
period期內授出
Vested during
the period期內歸屬
Canceled/lapsed
during the period
期內註銷╱失效
As of June 30,
2019於2019年6月30日
Date of grant授出日
Vesting period 歸屬期
Directors董事
Kyle Gendreau – 302,475 – – 302,475 June 17, 2019
2019年6月17日
1/3 of TRSUs will vest on each of J u n e 1 7 , 2 0 2 0 , June 17, 2021 and June 17, 2022三分之一的時間掛鈎受限制股份單位將分別於 2020 年 6月17日、2021年6月 17 日及至 2022年6月17日歸屬
Kyle Gendreau 303,741 – – – 303,741 October 11, 2018
2018年10月11日
1/3 of TRSUs will vest on each of October 11, 2019, October 11, 2020 and October 11, 2021三分之一的時間掛鈎受限制股份單位將分別於 2 0 1 9 年10 月 11 日、2020年 10 月 11 日及至2021 年 10 月 11 日歸屬
Total Directors董事總計 303,741 302,475 – – 606,216
股份獎勵計劃 續受限制股份單位
本公司授出兩類受限制股份單位:時間掛鈎受限制股份單位及績效掛鈎受限制股份單位。
時間掛鈎受限制股份單位
本公司授出的時間掛鈎受限制股份單位,於三年內每個授出日的週年日按比例歸屬三分之一,而承授人須於適用歸屬日仍持續受聘於本集團或持續向本集團提供服務。時間掛鈎受限制股份單位的開支按本公司股份於授出日的收市價計算,惟須扣減預計未來股息的貼現價值而於歸屬期內按比例確認,亦須扣除預期會沒收的時間掛鈎受限制股份單位的開支。
於 2019 年 6 月 17 日,本公司向其一名執行董事、本集團的若干主要管理人員及其他僱員授出涉及4,074,414股股份的時間掛鈎受限制股份單位。
截至2019年6月30日止六個月,時間掛鈎受限制股份單位的詳情及變動如下:

124
Share Award Scheme Continued
RSUs Continued
Time-based Restricted Share Units Continued
Number of TRSUs時間掛鈎受限制股份單位數目
Name/category of grantee承授人的姓名╱類別
As of January 1,
2019於2019年
1月1日
Granted during the
period期內授出
Vested during
the period期內歸屬
Canceled/lapsed
during the period
期內註銷╱失效
As of June 30,
2019於2019年6月30日
Date of grant授出日
Vesting period 歸屬期
Others其他
Employees
僱員
– 3,771,939 – – 3,771,939 June 17, 2019
2019年6月17日
1/3 of TRSUs will vest on each of J u n e 1 7 , 2 0 2 0 , June 17, 2021 and June 17, 2022三分之一的時間掛鈎受限制股份單位將分別於 2020 年 6月17日、2021年6月 17 日及至 2022年6月17日歸屬
Employee
僱員
462,762 – – – 462,762 December 4, 2018
2018年12月4日
1/3 of TRSUs will vest on each of December 4, 2019, December 4, 2020 and December 4, 2021三分之一的時間掛鈎受限制股份單位將分別於 2 0 1 9 年12月4日、2020年12月4日及至2021年12月4日歸屬
Employees
僱員
4,117,569 – – (475,329) 3,642,240 October 11, 2018
2018年10月11日
1/3 of TRSUs will vest on each of October 11, 2019, October 11, 2020 and October 11, 2021三分之一的時間掛鈎受限制股份單位將分別於 2 0 1 9 年10 月 11 日、2020年 10 月 11 日及至2021 年 10 月 11 日歸屬
Total Employees僱員總計 4,580,331 3,771,939 – (475,329) 7,876,941
Total總計 4,884,072 4,074,414 – (475,329) 8,483,157
股份獎勵計劃 續受限制股份單位 續
時間掛鈎受限制股份單位 續
企業管治及其他資料 續
Corporate Governance and Other Information Continued
125Samsonite International S.A. Interim Report 2019 新秀麗國際有限公司 2019年中期報告
Share Award Scheme Continued
RSUs Continued
Performance-based Restricted Share Units
PRSUs vest in full on the third anniversary of the date of grant, subject to the grantee continuing to be employed by, or continuing to provide services to, the Group on the vesting date, and only to the extent certain pre-established cumulative performance targets are met. Expense related to PRSUs with non-market performance criteria is recognized ratably over the performance period, net of forfeitures, based on the probability of attainment of the related performance targets. The potential number of shares that may be issued upon vesting of the PRSUs ranges from 0% of the target number of shares subject to the PRSUs, if the minimum level of performance is not attained, to up to 200% of the target number of shares subject to the PRSUs, if the level of performance is at or above the predetermined maximum achievement level. For PRSUs subject to market conditions, the expense is recognized over the vesting period based on the fair value as determined on the grant date utilizing a Monte Carlo simulation.
On June 17, 2019, the Group granted PRSUs with respect to a target number of 1,455,327 shares to an executive director and certain members of the Company’s senior management team assuming target level achievement of the performance conditions applicable to the PRSU grants. The performance targets cover the three-year (fiscal) period ending December 31, 2021. The actual number of shares that will vest under the PRSUs will vary depending on the level of achievement of the performance conditions applicable to the PRSU grants made to the relevant grantees, thereby ensuring that the actual payout is linked to the Company’s performance. The maximum number of shares underlying the PRSUs is 2,910,654 shares. The PRSUs granted on June 17, 2019 will vest on June 17, 2022, subject to the achievement of the performance conditions and subject to the applicable grantee continuing to be employed by, or continuing to provide services to, the Group on the vesting date.
股份獎勵計劃 續受限制股份單位 續
績效掛鈎受限制股份單位
績效掛鈎受限制股份單位僅於若干預先確定的累計表現目標達成後,方會於授出日的第三個週年日全數歸屬,而承授人須於歸屬日仍持續受聘於本集團或持續向本集團提供服務。並非按市況標準授出的績效掛鈎受限制股份單位的相關開支在績效期內基於達到相關表現目標的概率按比例確認,並已扣除已沒收績效掛鈎受限制股份單位的開支。於績效掛鈎受限制股份單位歸屬時可能發行的股份數目介乎績效掛鈎受限制股份單位所涉目標股份數目的0%(倘無法達到最低表現要求)至績效掛鈎受限制股份單位所涉目標股份數目的200%(倘達到或超過預先確定的最高表現要求)。與市況相關的績效掛鈎受限制股份單位的開支於歸屬期內確認,並按授出日採用蒙特卡羅模擬方法釐定的公允價值計算。
於2019年6月17日,本集團向一名執行董事及本公司高級管理層團隊的若干成員授出涉及1,455,327股目標股份的績效掛鈎受限制股份單位(假設達到適用於績效掛鈎受限制股份單位的表現條件目標水平)。表現目標覆蓋截至 2021 年 12 月 31 日止三個(財政)年度。根據績效掛鈎受限制股份單位歸屬的實際股份數目視乎向承授人授出適用於績效掛鈎受限制股份單位的表現條件達成程度而有所不同,從而確保實際支付與本公司表現掛鈎。績效掛鈎受限制股份單位涉及的最高股份數目為 2,910,654 股股份。於2019年6月17日授出的績效掛鈎受限制股份單位將於2022年6月17日歸屬,視乎表現條件達成程度而定,且適用承授人須於歸屬日仍持續受聘於本集團或持續向本集團提供服務。

126
Share Award Scheme Continued
RSUs Continued
Performance-based Restricted Share Units Continued
Particulars and movements of performance-based RSUs during the six months ended June 30, 2019 were as follows:
Number of PRSUs績效掛鈎受限制股份單位數目
Name/category of grantee承授人的姓名╱類別
As of January 1,
2019於2019年
1月1日
Initial or target
number of shares
for PRSUs granted
during the period期內授出的初始或目標績效掛鈎
受限制股份單位的相關股份數目
Change due to
performance condition
achievement因表現條件達成程度而變動
Vested during
the period期內歸屬
Canceled/lapsed during
the period期內註銷╱
失效
As of June 30,
2019於2019年6月30日
Date of grant授出日
Vesting period 歸屬期
Directors董事
Kyle Gendreau – 604,945 – – – 604,945 June 17, 2019
2019年6月17日
PRSUs w i l l ves t on June 17, 2022績效掛鈎受限制股份單位將於2022年6月17日歸屬
Kyle Gendreau 607,478 – – – – 607,478 October 11, 2018
2018年10月11日
PRSUs w i l l ves t on October 11, 2021績效掛鈎受限制股份單位將於 2021 年 10 月 11 日歸屬
Total Directors董事總計 607,478 604,945 – – – 1,212,423
股份獎勵計劃 續受限制股份單位 續
績效掛鈎受限制股份單位 續
截至2019年6月30日止六個月,績效掛鈎受限制股份單位的詳情及變動如下:
企業管治及其他資料 續
Corporate Governance and Other Information Continued

127Samsonite International S.A. Interim Report 2019 新秀麗國際有限公司 2019年中期報告
Share Award Scheme Continued
RSUs Continued
Performance-based Restricted Share Units Continued
Number of PRSUs績效掛鈎受限制股份單位數目
Name/category of grantee承授人的姓名╱類別
As of January 1,
2019於2019年
1月1日
Initial or target
number of shares
for PRSUs granted
during the period期內授出的初始或目標績效掛鈎
受限制股份單位的相關股份數目
Change due to
performance condition
achievement因表現條件達成程度而變動
Vested during
the period期內歸屬
Canceled/lapsed during
the period期內註銷╱
失效
As of June 30,
2019於2019年6月30日
Date of grant授出日
Vesting period 歸屬期
Others其他
Employees僱員
– 850,382 – – – 850,382 June 17, 2019
2019年6月17日
PRSUs wi l l vest on June 17, 2022績效掛鈎受限制股份單位將於 2022 年6月17日歸屬
Employee僱員
157,449 – – – – 157,449 December 4, 2018
2018年12月4日
PRSUs wi l l vest on December 4, 2021績效掛鈎受限制股份單位將於 2021 年12月4日歸屬
Employees僱員
799,441 – – – (109,562) 689,879 October 11, 2018
2018年10月11日
PRSUs wi l l vest on October 11, 2021績效掛鈎受限制股份單位將於 2021 年10月11日歸屬
Total Employees僱員總計 956,890 850,382 – – (109,562) 1,697,710
Total總計 1,564,368 1,455,327 – – (109,562) 2,910,133
Shares underlying an award of TRSUs or PRSUs that lapse without the issuance of such shares upon vesting of such award may be available for future grant under the Share Award Scheme.
股份獎勵計劃 續受限制股份單位 續
績效掛鈎受限制股份單位 續
時間掛鈎受限制股份單位或績效掛鈎受限制股份單位獎勵於歸屬後至失效時仍未發行的相關股份,可根據股份獎勵計劃於日後予以授出。

128
Human Resources and RemunerationAs of June 30, 2019, the Group had approximately 14,500 employees
worldwide. The Group regularly reviews remuneration and benefits of its employees according to the relevant market practice, employee performance and the financial performance of the Group.
Dividends and Distributions to Equity HoldersThe Company will evaluate its distribution policy and distributions made (by
way of the Company’s ad hoc distributable reserve, dividends or otherwise) in any particular year in light of its financial position, the prevailing economic climate and expectations about the future macro-economic environment and business performance. The Company intends to increase distributions to shareholders in line with its growth in earnings. The determination to make distributions will be made upon the recommendation of the Board and the approval of the Company’s shareholders and will be based upon the Group’s earnings, cash flow, financial condition, capital and other reserve requirements and any other conditions which the Board deems relevant. The payment of distributions may also be limited by legal restrictions and by the Credit Agreement, the Indenture or other financing agreements that the Group may enter into in the future.
On March 13, 2019, the Company’s Board of Directors recommended that a cash distribution in the amount of US$125.0 million, or approximately US$0.0873 per share, be made to the Company’s shareholders, a 13.6% increase from the US$110.0 million distribution paid in 2018. The shareholders approved this distribution on June 6, 2019 at the Company’s Annual General Meeting and the distribution was paid on July 16, 2019.
No dividends or distributions to equity holders have been declared or paid subsequent thereto.
Issue, Purchase, Sale, or Redemption of the Company’s Listed Securities
During the six months ended June 30, 2019, the Company issued 68,372 ordinary shares at a weighted-average exercise price of HK$17.36 per share, or HK$1.2 million in aggregate, in connection with the exercise of share options that were granted under the Company’s Share Award Scheme. There were no purchases or redemptions of the Company’s listed securities by the Company or any of its subsidiaries during the six months ended June 30, 2019.
人力資源及薪酬於 2019 年 6 月 30 日,本集團於全球擁有約
14,500名僱員。本集團定期根據有關市場慣例、僱員表現及本集團財務表現檢討其僱員薪酬及福利。
向股權持有人作出的股息及分派本公司將於任何特定年度根據其財務狀況、當
前經濟氣候以及有關未來宏觀經濟環境及業務表現的預期,評估其分派政策及作出的分派(以本公司特別可供分派儲備、股息或其他方式)。本公司擬配合其盈利增長增加向股東作出的分派。於董事會作出推薦建議及本公司股東批准後將作出分派的決定,並將以本集團的盈利、現金流量、財務狀況、資本及其他儲備要求以及任何董事會認為有關的其他條件為根據。分派付款亦可能受法律限制及信貸協議、契約或本集團可能於日後訂立的其他融資協議所規限。
於 2019 年 3 月 13 日,本公司董事會建議向本公司股東作出 125.0 百萬美元或每股約 0.0873 美元的現金分派,較 2018 年派付的 110.0 百萬美元分派增長13.6%。股東於2019年6月6日舉行的本公司股東週年大會上批准此項分派,而有關分派已於2019 年 7月16日派付。
其後概無宣派或派付予股權持有人的任何股息或分派。
發行、購買、出售或贖回本公司上 市證券
截至 2019 年 6 月 30 日止六個月,本公司就本公司股份獎勵計劃項下授出的購股權獲行使而按加權平均行使價每股17.36港元或合共1.2百萬港元發行 68,372 股普通股。截至 2019 年 6 月 30 日止六個月,本公司或其任何附屬公司概無購買或贖回本公司上市證券。
企業管治及其他資料 續
Corporate Governance and Other Information Continued

Since our listing in 2011, the Group has consistently pursued a
strategy to diversify its business across geographical markets,
brands, product categories and distribution channels. Through a
combination of steady organic growth and strategic acquisitions,
we have transformed the business from being dependent largely on
one brand, Samsonite, active primarily in travel goods sold mainly
through wholesale channels in the developed markets of the U.S.
and Europe to one that operates multiple brands across global
markets through all major channels.
自2011年上市以來,本集團一直實施跨地區市場、品牌、產品類別及
分銷渠道業務多元化的策略。通過穩健自然增長和策略性收購的互相
結合,我們實現業務轉型,不再過度倚賴新秀麗單一品牌主要透過美
國及歐洲發達市場的批發渠道銷售旅遊產品,轉向通過所有主要渠道
在全球市場經營多個品牌的企業。
# WE CARRY THE WORLD
Timothy Charles Parker
Chairman 主席
If there are any discrepancies between the Chinese translation and the
English version of this report and accounts, the English version shall prevail.
本報告及賬目之中文譯本與英文版本如有任何差異, 概以英文版本為準。
Published by Samsonite International S.A.
出版 新秀麗國際有限公司
Concept & Design by Yellow Creative (HK) Limited
設計
Production & Printing by Donnelley Financial Solutions Hong Kong Limited
印製 當納利財經服務香港有限公司
© Copyright Samsonite International S.A. 2019
© 新秀麗國際有限公司 2019年
All rights reserved
版權所有
No part of this publication may be reproduced, stored in a retrieval system,
or transmitted, in any form or by any means, electronic, mechanical,
photocopying, recording, or otherwise, without the prior written permission of
Samsonite International S.A.
未得新秀麗國際有限公司事先書面許可,不得以電子、機械、複印、錄製或任
何其他形式或方法,將本刊物的任何部分複製、儲存於檢索系統之內或傳送。
SAM005_IR.indb 2 9/9/2019 17:25

INTERIM REPORT 2019 年中期報告
Samsonite International S.A. 新秀麗國際有限公司 Stock Code 股份代號 1910
# WE CARRY THE WORLD
Samso
nite In
ternatio
nal S.A
. 新秀
麗國
際有
限公
司
Interim
Rep
ort 2019 年
中期
報告
Samsonite International S.A.新秀麗國際有限公司
13-15 avenue de la Liberté, L-1931 Luxembourg
(Incorporated under the laws of Luxembourg with limited liability)
(根據盧森堡法律註冊成立的有限公司)
00_SAM005_IR19_Cover_AW.indd 1 10/9/2019 13:15