s&t ag | q2 2018 results - ir.snt.at
TRANSCRIPT

Hannes Niederhauser, CEORichard Neuwirth, CFO
January/February 2020 Update
COMPANY PRESENTATION

*Source: IMS Report, ABI Research, Oracle, MarketsandMarkets Analysis
1 S&T provides globally IoT 4.0 technology
S&T offers IoT solutions for Industrial & Transportation IoT grows fast: The whole Industry 4.0 market is
expected to grow at a CAGR of ~15% by 2022*
3 S&T in figures
2018: EUR 991 Mio. revenues and EUR 90,5 Mio. EBITDA Target 2019: ~ EUR 1.145 Mio. revenues and EUR 105 Mio. EBITDA 4.880 employees in 30 countries
4 Listed in Frankfurt and member of the TecDAX® & SDAX®
Headquarter in Linz, Austria, listed in Frankfurt, Germany ~EUR 1.4 Bn. market cap 2018 trading volume of ~1,4 Bn.
2 S&T is an IT service provider with regional focus
Germany, Austria, Switzerland (DACH) East Europe
S&T AT A GLANCE
SAN DIEGO
MONTREAL
AUGSBURG
LINZ
TOULON
PENANG
BEIJING
TAIPEI
MOSCOWWARSAW
2

S&T HIGHLIGHTS
Revenue 9M 2019 (9M 2018): +14,1% EUR 753,2 Mio. (EUR 660,0 Mio.) EBITDA 9M 2019 (9M 2018): +25,3% EUR 71,7 Mio. (EUR 57,2 Mio.) Net income after NCI 9M 2019 (9M 2018): +13,5% EUR 29,0 Mio. (EUR 25,6 Mio.)
Manufacturing cooperation and IoT cooperation with Foxconn in progress Alliance with Microsoft and Intel for Industry 4.0 Cloud Solutions IoT software framework SUSiEtec expanded by AIS acquisition
ESG rating improvements ongoing Continuous dividend increase: 2014 - 2018: 7ct; 8ct; 10ct; 13ct; 16ct 2019: Share buyback program II 2019 executed with ~EUR 15 Mio. and ~788T shares
Profit Focus
Shareholder Focus
Leading IoT alliance
Cash and cash equivalents of EUR 261,0 Mio. at hand (31.9.2019) Sufficient liquidity available to finance organic and an-organic growth Working Capital Optimization progressing well through PEC program
Finance Growth
3

9M 2019: GOOD RESULTS IN ALL PARAMETERS
660.0
237.3
753.2
279.4
9M 2019 comparison Q3 2019 comparison
2018
2019
Revenue (in EUR Mio.)
+ 14%
+ 18%
57.2
20.5
71.7
27.4
9M 2019 comparison Q3 2019 comparison
2018
2019
EBITDA (in EUR Mio.)
235.9
81.1
279.9
105.4
9M 2019 comparison Q3 2019 comparison
2018
2019
Gross profit (in EUR Mio.)
25.6
9.3
29.0
10.8
9M 2019 comparison Q3 2019 comparison
2018
2019
Net income after NCI (in EUR Mio.)
4
+ 19%
+ 30%
+ 25%+ 34%
+ 14%+ 16%
(35,7%)
(37,2%)
(34,2%)(37,7%)
FY 2019 Preliminary: S&T on track for revenue target while exceeding initial EBITDA guidance

S&T BUSINESS MODEL
* incl. I/C revenues | **before MGMT fee distribution
Communications
IoT Solutions America
Revenue plan 2020: EUR 175 Mio.*
Mid-term targets: EBITDA** > 12% GM > 40% Growth p.a.: 12%
Avionics
IT Services | Europe
DACH RegionEastern Europe
Revenue plan 2020: EUR 513 Mio.*
Mid-term targets: EBITDA** > 6% GM > 30% Growth p.a.: 6%
Services DACHServices EE Services DACH
5
Revenue plan 2020: EUR 672 Mio.*
Mid-term targets: EBITDA** > 14% GM > 40% Growth p.a.: 12%
Industrial MedicalMedical Smart Energy
IoT Solutions Europe
Transportation Asia

EBITDA9M 2018 vs 9M 2019
14.7
24.5
IT Services
17,5*
+7,0**
3.6%
5.4%
IT Services
Adj. EBITDA margins 9M***
9M 2019: “IT SERVICES” SEGMENT
*3rd party revenues including IC | ** Difference based on charged management fees to S&T AG (part of IT Services Segment)***HQ-fee adjusted EBITDA margins in % of external revenue
Macroeconomic situation: Eastern Europe grows stronger than Western Europe
299.6
337.6
IT Services
Revenue9M 2018 vs 9M 2019*
6
LEFT: 9M 2018 | RIGHT: 9M 2019
Eastern Europe economy grows at +5% p.a.; thus stronger than Western Europe/Germany
EBITDA rise based in
improved operations additional HQ-fees IFRS 16-effect
Part of the Kapsch acquisition in Eastern Europe incorporated into IT Services
Good growth of SAP Hana and SI Business (Rohrer, GMG, etc.)

EBITDA9M 2018 vs 9M 2019
Adj. EBITDA margins 9M***
9M 2019: “IOT SOLUTION EUROPE” SEGMENT
*3rd party revenues including IC | ** Difference based on charged management fees to S&T AG (part of IT Services Segment)***HQ-fee adjusted EBITDA margins in % of external revenue
“Iot Solutions Europe” segment drives profitability
Revenue9M 2018 vs 9M 2019*
7
LEFT: 9M 2018 | RIGHT: 9M 2019
Highest EBITDA contribution to the group of 58% after 9M 2019
Profit growth continues due to increased share of software products in the S&T portfolio
Part of Kapsch consolidated since 1st of June 2019, still dilutive to EBITDA but turnaround faster then planned
Software portion to be increased further by R&D (SUSiEtec Rollout) and M&A (AIS)
300.2
382.1
IoT Solutions Europe
34.541.4
IoT Solutions Europe
14.0%
14.0%
IoT Solutions Europe
44,8**
-3,4**

EBITDA9M 2018 vs 9M 2019
Adj. EBITDA margins 9M****
9M 2019: “IOT SOLUTION AMERICA” SEGMENT
*3rd party revenues including IC | ** USD FX effect ~ EUR 2,2 Mio. | *** Difference based on charged management fees to S&T AG (part of IT Services Segment)****HQ-fee adjusted EBITDA margins in % of external revenue
Upswing in USA ongoing
Revenue9M 2018 vs 9M 2019*
8
LEFT: 9M 2018 | RIGHT: 9M 2019
Two largest customers (~ 50% of revenues, but low margin) phasing out
New projects are not yet fully compensating phase out, as of 2020 double-digit growth expected
Negative impact of restructuring in Q3 2019 approx. EUR 0,5 Mio.
EBITDA would have reachedEUR 9,3 Mio. excl. HQ-fees
122.8
116.5**
IoT Solutions America
7.95,7
IoT Solutions America
9.3%
8.6%
IoT Solutions America
-3,6***
Isolated Q3 2019 EBITDA margin improved to 10,7%
9,3***

ITP PROGRAM (`IMPROVE TECHNOLOGY PENETRATION´): PROGRAM TO BOOST S&T’S GROWTH AND MARGINS
1. Smart factory: SUSiEtec IoT software framework: Enabling machine learning (AI)
Improve software product portfolio: Embedded SW, Soft PLC, TSN (real time networks) EUR 80 Mio. software revenues planned by 2023 + triggering additional IoT product sales
2. Smart Energy: IoT-ready Smart Grids: From hardware (meter) up to data management software
Revenue plan of EUR 100 Mio. until 2023
3. Avionics technologies: In-Flight-Entertainment & Connectivity technologies
Revenue plan of min. EUR 120 Mio. until 2023
4. Train control systems: Mission critical control systems for high speed trains
Revenue plan of EUR 140 Mio. until 2023
9
Excellent pool of engineers Cost efficient in-house
resources in Eastern Europe
2018: EUR 122,8 million R&D costs (12,4% of revenues)
Around 3.000 engineering heads worldwide
2,619
467
669
1125
Engineering Field Engineers
Sales Others
ITP Program: Expected revenue development until 2023
FY 2019 FY 2023
1. SUSiEtec EUR 19 Mio. EUR 80 Mio.
2. Smart energy EUR 45 Mio. EUR 100 Mio.
3. Avionics technologies EUR 36 Mio. EUR 120 Mio.
4. Train control systems EUR 99 Mio. EUR 140 Mio.

TECHNOLOGY SMART FACTORY
Our offering for a Smart Factory: from Edge to Cloud
Cooperation with Foxconn
Roll out of IoT Software together in Asia
Cooperate on leading Industry 4.0 production standards and technologies
Create a global Industry 4.0 factory
Customer Examples Driverless transport vehicles for production and logistics operations
Enabling IoT navigation software for sensor-based tracking Printing industry
IoT Industry Computer Platforms to operate printing presses Manufacturer of injection molding machines
Modern user experience and process control in factory environment
Edge Devices Gateways / PLC FOG Cloud
Cooperation with Microsoft Azure
Embedded Softwarecustomized
IoT interfacesecurity
On premise computing & storage
“Real-Time Networks”
10

TECHNOLOGY AI FOR AUTONOMOUS DRIVING
Use Cases
For professional vehicles, car prototypes (Level 4)
Automated Guided Vehicles (AGV)
Cooperation with Intel (Mobileye)
USD 28 Mio. revenue in 2018
Smart Vehicles Embedded Edge Server
Facts and customer projects
US, Europe and China lead customers
High-growth potential
Design wins with three major car manufacturers to boost revenues to
USD 50 Mio. in 2019
11

TECHNOLOGY FOR CONNECTIVITY IN AVIONICS
Use Cases
Secure wireless connectivity for Commercial Airlines and Aviation
Solutions for BYOD devices enabling cost savings
Ethernet based solutions for line-fit or retro fit installation
Increasing software content
Secure wireless connectivity S&T outperforms TecDaxComprehensive solution offering
Facts
Used in 4.500+ airplanes worldwide
US certification ‘FAA’s PMA Supplement’ for worldwide deployment
Customers: EasyJet, Lufthansa, Pegasus Airlines, Immfly
Global Eagle Entertainment, Gogo, Ameco, Air China, New: Aircom
12
SUSiEtec in avionics: New product in development for IoT control of airplane equipment

13
STATUS PEC PROGRAM (PROFITABILITY | EFFICIENCY | CASHFLOW)
* Former working capital target for 2020 was 15%
Gain 2% EBITDA margin by 2023, reduce working capital from 22% (6M 2019) to 13%* (12M 2020)
Profitability
GOAL: INCREASE EBITDA MARGIN MID TERM BY 2%
Better ROI: Global roll out of new technologies: ITP program initiated for 2020, 2020 separate P&L reporting
Intensify Manufacturing cooperation with Foxconn and further benefit from their supply chain power: Implemented, visible in Q4, US tariffs addressed
Achieve savings of EUR 20 Mio. pa. within 12 months: Measures identified – visible in H1 2020 like for like
Efficiency
GOAL: OPTIMIZATION AND EFFICIENCY GAINS ACROSS THE GROUP
Reduce/merge number of legal entities Status: Minus 8 legal entities in 2019, 2020 further reduction of 16 entities
Process improvements measured by extensive reporting. Status: Reporting partially established, ITP, Divisions, working capital → fully running 2020
General tax optimization: Status: Implemented and visible as of today
Cashflow
GOAL: GENERATE EUR 60 MIO. CASH ACROSS THE GROUP
Reduction in inventory and working capital Status: despite revenue growth inventory reduced by EUR 7,5 Mio., additional reduction of EUR > 20 Mio. in Q4
Adjustment of supplier contracts (VMI) Status: Renegotiations partially completed, first improvements in Q4 2019 (EUR 10 Mio. working capital reduction)
Strict Accounts Receivable management Status: Q3 A/R outstanding improved from 83 to 77 days

14
STATUS PEC PROGRAM (PROFITABILITY | EFFICIENCY | CASHFLOW)
PEC program: Significant improvements in operating cash flow in Q3 2019
26.7
61.4
44.9
35.5
~60
2015 2016 2017 2018 2019
Operating cash flow (in EUR Mio.)
EUR 26 Mio. one-time effect
0
-5.8
-8.4
-19.9
4.5
9M 2015 9M 2016 9M 2017 9M 2018 9M 2019
Operating cash flow 9 months (in EUR Mio.) in EUR Mio.
Q2 2019 Q3 2019
Revenues 248,7 279,4
Inventory95 days (167 Mio.)
84 days (161 Mio.)
A/R gross83 days (228 Mio.)
77 days (237 Mio.)
in EUR Mio.Dec. 31, 2018 Sep. 30, 2019
Factoring 55,8 Mio. 50,3 Mio.

ONE-TIME EFFECTS ON PROFIT IN Q3 2019
No major impacts of one time effects on Q3 results
in TEUR One time effects
+1.649 Release purchase price consideration
-396 Restructuring – close Fremont office
-103 FX losses
-312 Expenses on stock options
-289 Side costs from M&A
+549 Total impact on Q3 results
in TEUR R&D capitalization Q3
+4.193 Capitalization R&D in Q3*
-3.882 Amortization of R&D in Q3
+311 Impact R&D Capitalization
15
in TEUR PPA
1.394 Q3 2018 Amortization
2.084 Q3 2019 Amortization
+690 Increase in PPA Amort.
* Only 13,6% of R&D&E cost capitalized

KAPSCH M&A: TURNAROUND FASTER THAN EXPECTED
Kapsch forecast 2018* 2019** 2020 2021
Revenues 124 ~50 100 110
EBITDA -16,9 -1,5 10 13,6
Status Turnaround measures 2019 2020 2021
Revenues / Growth
Revenues: 2019: stop EUR 20 Mio. unprofitable biz, 2021: 10% growth
- - 4,8 Mo.
Sales Synergies
Sales channel synergies 1,0 Mio. 3,2 Mio. -
SynergiesTechnology
Use Kapsch Software in Kontron 1,2 Mio. 2,3 Mio.
SynergiesEngineering
Insource engineers to cost efficient S&T
2,0 Mio.4,2 Mio. -
Cost savings Reduce 70 FTE, space, better GM 3,5 Mio. 2,9 Mio. - 2,5 Mio.
Improvement Total improvement per year +6,5 Mio. +11,5 Mio. +4,6 Mio.
Turnaround of Kapsch goes faster and better than expected
EUR 100 Mio. profitable biz remains (2018: EUR 124 Mio.), 470 employees reduce to < 400
Q3 2019 was profitable, FY 2019 incl. restructuring charges: EUR 1,5 Mio. (before 4,9 Mio.) of loss
For 2020 we expect ~ 10% of EBITDA, 2021: 12% of EBITDA and 10% growth
*FY: 4/2018 – 3/2019; **consolidated in S&T16
20202018
Synergies
Savings
One time effect: majority MAV Hungary
2019Savings
Synergies S&T
Increase Decrease Sum

S&T GROUP BALANCE SHEET
PEC Program to increase balance sheet ratios*From 2019 onwards new calculation of net cash based on IFRS 16: Cash and cash equivalents less non-current and current financial liabilities (incl. liabilities from leasing) ** WC= Inventories + AR (trade) + Contract Assets – AP (trade)
Mio. EUR 30.09.2019 31.12.2018 30.09.2019 31.12.2018
NON-CURRENT ASSETS 447,3 292,5 CAPITAL AND RESERVES 370,1 367,3
Fixed Assets 407,6 262,7 Equity 370,1 367,3
Other Assets 39,8 29,8 NON-CURRENT LIABILITIES 340,1 131,9
CURRENT ASSETS 711,7 555,5 Long-term loans and borrowings 225,0 79,4
Inventories 160,7 130,8 Other Non-Current Liabilities 115,2 52,4
Trade accounts receivable 186,8 202,7 CURRENT LIABILITIES 448,8 348,8
Contract Assets from Customers 24,0 4,4 Trade accounts payable 146,1 177,0
Cash and cash equivalents 261,0 171,8 Contract Liabilities from Customers 67,5 37,5
Other receivables and prepayments 79,2 46,0 Short-term loans and borrowings 85,0 39,6
Other Current Liabilities 150,4 94,7
Total Assets 1.159,1 847,9 Total Liabilities & Equity 1.159,1 847,9
Equity Ratio 31,9% 43,3%
Net Cash -105,4 44,6
Working Capital 225,4 160,8**
17
*
607
1633
815
1989
0
400
800
1200
1600
2000
Backlog Project pipeline
12M 2018
9M 2019
18
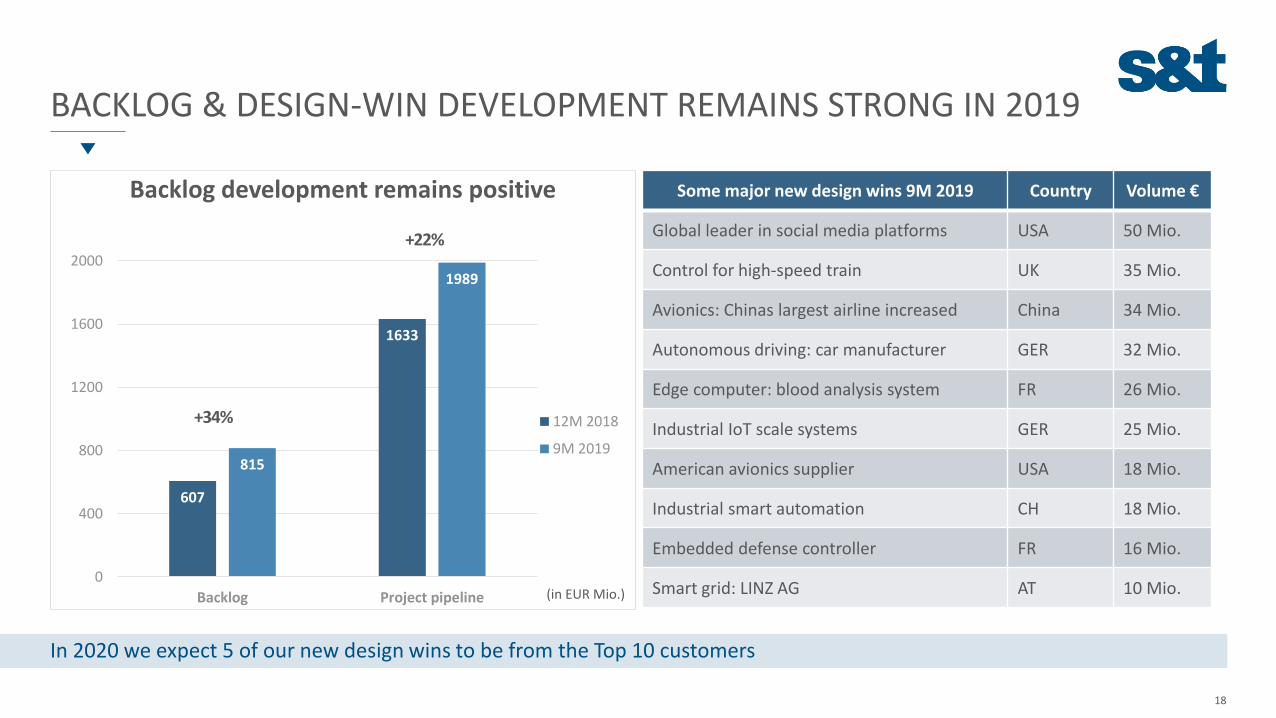
BACKLOG & DESIGN-WIN DEVELOPMENT REMAINS STRONG IN 2019
Backlog development remains positive
In 2020 we expect 5 of our new design wins to be from the Top 10 customers
+34%
+22%
Some major new design wins 9M 2019 Country Volume €
Global leader in social media platforms USA 50 Mio.
Control for high-speed train UK 35 Mio.
Avionics: Chinas largest airline increased China 34 Mio.
Autonomous driving: car manufacturer GER 32 Mio.
Edge computer: blood analysis system FR 26 Mio.
Industrial IoT scale systems GER 25 Mio.
American avionics supplier USA 18 Mio.
Industrial smart automation CH 18 Mio.
Embedded defense controller FR 16 Mio.
Smart grid: LINZ AG AT 10 Mio.(in EUR Mio.)
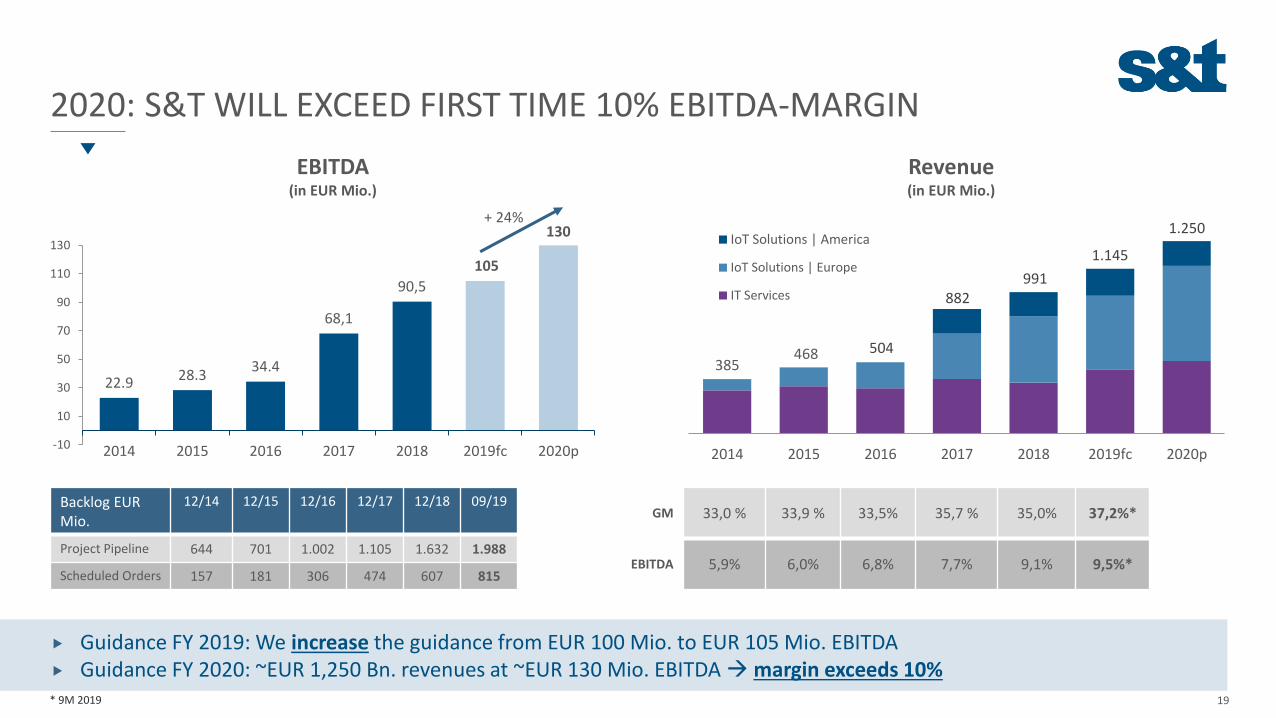
2020: S&T WILL EXCEED FIRST TIME 10% EBITDA-MARGIN
* 9M 2019
Guidance FY 2019: We increase the guidance from EUR 100 Mio. to EUR 105 Mio. EBITDA Guidance FY 2020: ~EUR 1,250 Bn. revenues at ~EUR 130 Mio. EBITDA →margin exceeds 10%
EBITDA(in EUR Mio.)
22.9 28.334.4
68,1
90,5
105
130
-10
10
30
50
70
90
110
130
2014 2015 2016 2017 2018 2019fc 2020p
+ 24%
Backlog EURMio.
12/14 12/15 12/16 12/17 12/18 09/19
Project Pipeline 644 701 1.002 1.105 1.632 1.988
Scheduled Orders 157 181 306 474 607 815
GM 33,0 % 33,9 % 33,5% 35,7 % 35,0% 37,2%*
EBITDA 5,9% 6,0% 6,8% 7,7% 9,1% 9,5%*
2014 2015 2016 2017 2018 2019fc 2020p
IoT Solutions | America
IoT Solutions | Europe
IT Services
385504468
882991
Revenue(in EUR Mio.)
1.145
19
1.250
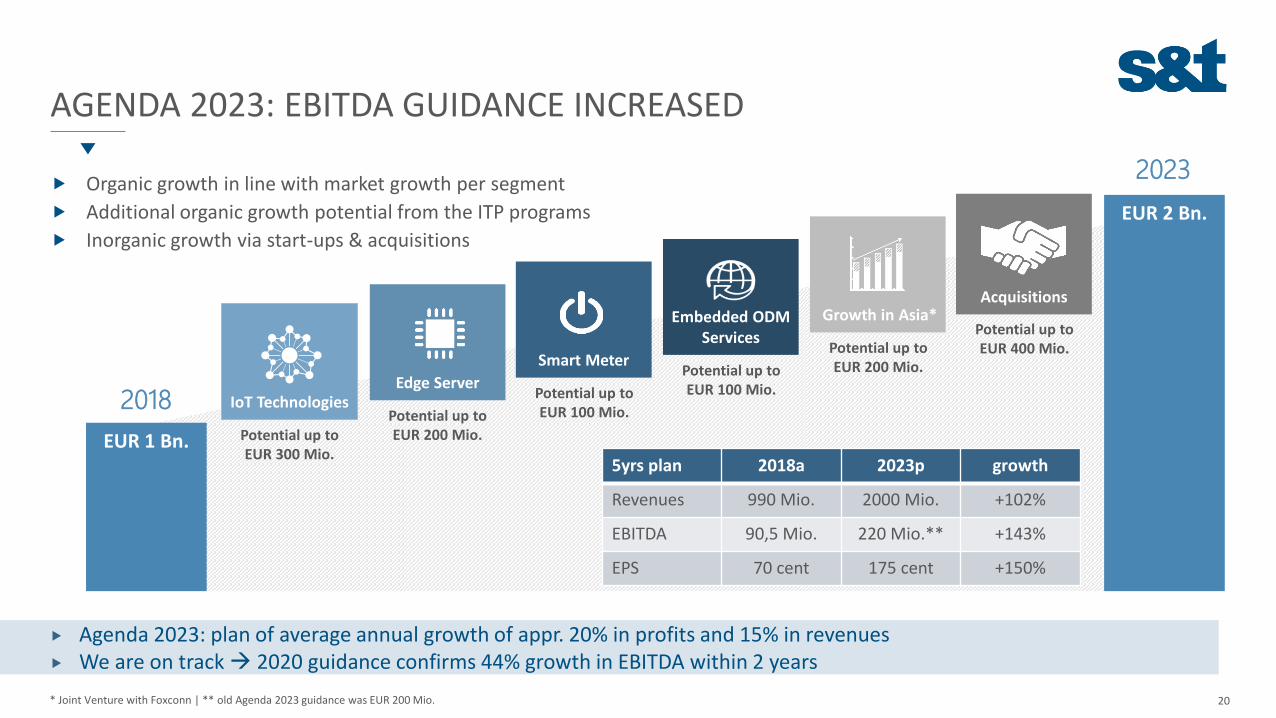
AGENDA 2023: EBITDA GUIDANCE INCREASED
* Joint Venture with Foxconn | ** old Agenda 2023 guidance was EUR 200 Mio.
Organic growth in line with market growth per segment
Additional organic growth potential from the ITP programs
Inorganic growth via start-ups & acquisitions
EUR 2 Bn.
2023
2018
IT Services
420
IoT Solutions
450
EUR 1 Bn.
Growth in Asia*Acquisitions
Embedded ODM Services
Edge Server
Smart Meter
IoT Technologies
Potential up to EUR 300 Mio.
Potential up to EUR 200 Mio.
Potential up to EUR 100 Mio.
Potential up to EUR 100 Mio.
Potential up to EUR 200 Mio.
Potential up to EUR 400 Mio.
20
5yrs plan 2018a 2023p growth
Revenues 990 Mio. 2000 Mio. +102%
EBITDA 90,5 Mio. 220 Mio.** +143%
EPS 70 cent 175 cent +150%
Agenda 2023: plan of average annual growth of appr. 20% in profits and 15% in revenues We are on track → 2020 guidance confirms 44% growth in EBITDA within 2 years

21
ACQUISITION STRATEGY – AGENDA 2023: 2 BN OF REVENUES
M&A focus on restructuring cases with low multiples and technology/synergy potential
EUR 220 Mio. and EUR 17 Mio. in shares (buy back) for M&A → add EUR 100 Mio. revenues p.a.
EUR 100 Mio. for organic growth → add EUR 100 Mio. revenues p.a.
Agenda 2023: Achieve 2 Bn. of revenues without major capital increases, focus on cash generation (PEC program)
Acquisition targets:
Dedicated acquisition department installed at S&T responsible for: Due diligence
Technology synergies
1 year integration phase
No. 1: “Volume companies” – 2019: Kapsch Buy synergetic loss companies at reasonable prices (multiples <6)
Turnaround by synergies, savings and reduction of unprofitable biz
Increase GM from 25% to 40% and 10% EBITDA under S&T ownership
No. 2: “Technology Pearls” – 2019: Kapsch + AIS Complement our technology with focus on Software at reasonable prices (e.g. AIS)
Increase GM constantly by replacing low margin HW biz by SW enabled IoT biz
Target opportunities at reasonable prices

0.00
5.00
10.00
15.00
20.00
25.00
30.00
0
100
200
300
400
500
600
SDAX S&T AG EUR
22
THE S&T SHARE - TECDAX & SDAX MEMBER; TARGET: MDAX
Share buyback program II finalized: ~788K bought back shares, ~EUR 15 Mio. executed, program ended Dec. 2019 | ESG rating improvements ongoing
Ennoconn Corporation -27%
Freefloat - 73% - includes as follows:
Investec Asset Management Ltd - 5%
BNP Paribas Asset Management - 5%
Allianz Global Investors GmbH - 4%
Morgan Stanley Investment Management 4%
Dorval Asset Management - 3%
Hannes Niederhauser - 2%
Coverage Hauck & Aufhäuser | Buy: EUR 30,00
HSBC | Buy: EUR 30,00
Kepler Cheuvreux | Buy: EUR 27,00
Pareto Securities | Buy: EUR 27,00
Warburg Research | Buy: EUR 26,00
Raiffeisen Centrobank | Hold: EUR 20,00
Share liquidity
Two new analysts will take on coverage of S&T AG
Shareholder Structure S&T share: A TecDAX® & SDAX® member
0
500,000,000
1,000,000,000
1,500,000,000
2012 2013 2014 2015 2016 2017 2018 2019

SUMMARY
PEC Program boosts CF and EBITDA
Growth areas America + China Leading technologies in the high
growing IIoT marketOpportunities
2019 EBITDA guidance exceeded: EUR 105 Mio. instead of EUR 100 Mio.
Q3 2019: Revenue growth of 14% and EBITDA growth of 25%
PEC in Q3: EUR 16 Mio. operating cash flow and 37,7% Gross Margin
Achievements
Big players enter our niches in Industry 4.0
US-Dollar development Address right technology trends Risks
Guidance 2020: 1,250 Mio. revenues and ~ 130 Mio. EBITDA
2 Bn. revenues at > 11% EBITDA in 2023
Ongoing Working Capital improvement
MDAX membership
Targets
23

DISCLAIMER
This document includes 'forward-looking statements'. Forward-looking statements are all statements, which do not describe facts of the past, but containing the words "believe", "estimate","expect", "anticipate", "assume", "plan", "intend", "could", and words of similar meaning. These forward-looking statements are subject to inherent risks and uncertainties since they relate tofuture events and are based on current assumptions and estimates of S&T AG, which might not occur at all or occur not as assumed. They therefore do not constitute a guarantee for theoccurrence of future results or performances of S&T AG. The actual financial position and the actual results of S&T AG, as well as the overall economic development and the regulatory environmentmay differ materially from the expectations, which are assumed explicitly or implicitly in the forward-looking statements and do not comply to them. Analysts and investors, and any other person orentity that may need to take decisions, or prepare or release opinions about the shares / securities issued by S&T AG are cautioned not to place undue reliance on those forward-lookingstatements, which speak only as of the date of this document. Past performance cannot be relied upon as a guide to future performance.
Except as required by applicable law, S&T AG undertakes no obligation to revise these forward-looking statements to reflect events and circumstances after the date of this presentation, including,without limitation, changes in S&T’s business or strategy or to reflect the occurrence of unanticipated events. The financial information and opinions contained in this document are unaudited andare subject to change without notice. This document contains summarized information or information that has not been audited. In this sense, this information is subject to, and must be read inconjunction with, all other publicly available information, including if it is necessary, any fuller disclosure document published by S&T AG. None of the Company, its subsidiaries or affiliates or by anyof its officers, directors, employees, advisors, representatives or agents shall be liable whatsoever for any loss however arising, directly or indirectly, from any use of this document its content orotherwise arising in connection with this document.
This document or any of the information contained herein do not constitute, form part of or shall be construed as an offer or invitation to purchase, subscribe, sale or exchange, nor a request for anoffer of purchase, subscription, sale or exchange of shares / securities of S&T AG, or any advice or recommendation with respect to such shares / securities. This document or a part of it shall notform the basis of or relied upon in connection with any contract or commitment whatsoever.
This document does not constitute an offer to purchase securities in the United States, Canada, Australia, South Africa and Japan. Securities, including the bond of S&T AG may not be sold oroffered for sale within the United States or to or for the account of / in favor of US citizens (as defined in Regulation S under the U.S. Securities Act of 1933 in the current version (the "SecuritiesAct") unless they are registered under the regulations of the Securities Act or unless they are subject to an exemption from registration. Neither S&T AG nor any other person intend to register theoffer or a part thereof in the United States or to make a public offer of the securities in the United States.
24

APPENDIXEXPERIENCED MANAGEMENT TEAM
Executive Board
Hannes Niederhauser Richard Neuwirth Peter Sturz Michael Jeske Carlos Queiroz
CEO CFO COO Services EE COO Services DACH COO IoT Europe
25
Extended Management
BoardMichael Riegert Olga Sinenko Steve Chen Robert Courteau
EVP Transportation EVP Smart Energy EVP Asia EVP America
Vice Presidents
Christoph Neumann Andy Mason Bernhard Günthner
VP Technology VP Avionics VP Smart Factory

APPENDIX S&T KEY FIGURES
*From 2019 onwards new calculation of net cash based on IFRS 16: Cash and cash equivalents less non-current and current financial liabilities (incl. liabilities from leasing)
In Mio. EUR 2016 2017 2018 9M 2018 9M 2019 Q3 2018 Q3 2019
Revenues 503,7 882,0 990,9 660,0 753,2 237,3 279,4
Gross Profit (Margin)168,9
(33,5%)315,0
(35,7%)346,5
(35,0%)235,9
(35,7%)279,9
(37,2%)81,1
(34,2%)105,4
(37,7%)
EBITDA (Margin) 34,4 (6,8%)
68,1(7,7%)
90,5 (9,1%)
57,2 (8,7%)
71,7 (9,5%)
20,5 (8,6%)
27,4(9,8%)
EBIT before PPA amortization 28,2 47,9 67,3 40,6 42,4
Net Income 20,4 29,4 48,5 27,3 28,0 10,1 10,7
EBITDA Interest Coverage Ratio 7,9 9,8 14,5 12,6 12,4 17,9 10,1
Net Cash* 32,0 101,8 44,6 -7,3 -105,4 -7,3 -105,4
Working Capital 119,2 121,5 160,8 192,0 225,4 192,0 225,4
Equity Ratio 36,0% 41,2% 43,3% 45,7% 31,9% 45,7% 31,9%
Operating Cashflow 61,4 44,9 35,5 -19,9 4,5 -4,0 16,2
Employees 3.786 3.918 4.335 4.286 4.880
26
