s&p 1500 peer group report - fwcook.com
TRANSCRIPT

2014
S&P 1500Peer Group Report
Featuring Commentary From:

Equilar, Inc.
1100 Marshall Street
Redwood City, CA 94063
Phone: (650) 241-6600
Fax: (650) 701-0993
E-mail: [email protected]
www.equilar.com
Featured In
About Equilar
Equilar is the leading provider of executive compensation and corporate governance data for corporations, nonprofits, consulting firms, institutional investors, and the media. As the trusted data provider to 70% of the Fortune 500, Equilar helps companies accurately benchmark and track executive and board compensation, Say on Pay results, and compensation practices.
Equilar's award-winning Equilar Insight product suite is the gold standard for benchmarking and tracking executive compensation, board compensation, equity grants, and award policies. With an extensive database and more than a decade’s worth of data, the Equilar Insight platform allows clients to accurately measure executive and board pay practices. With Equilar’s Governance Center, companies can better prepare by analyzing historical voting results and modeling pay for performance analyses to ensure successful Say on Pay outcomes.
Equilar Insight’s Governance Center provides a comprehensive set of tools including:
• Institutional Shareholder Services (ISS) Simulator
• Glass Lewis Modeler
• Pay for Performance Analytics Solution
Equilar’s C-Suite mapping technology within the Equilar Atlas platform identifies pathways to executives and board members at target companies. With over 350,000 executive and board member profiles, Equilar Atlas is the premier executive resource for identifying new business opportunities. Equilar regularly publishes proprietary research reports and articles on the most pertinent issues and trends in executive compensation and corporate governance.

Contents
©2014 Equilar, Inc. The material in this publication may not be reproduced or distributed in whole or in part without the
written consent of Equilar, Inc. This report provides information of general interest in an abridged manner and is not intended
as a substitute for accounting, tax, investment, legal or other professional advice or services. Readers should consult with
the appropriate professional(s) before acting on information contained in this publication. All disclosure examples in this
report are reformatted to fit this document, and certain sections of sample texts may be bolded to add emphasis. If you have
questions or comments regarding this publication, please email [email protected].
Introduction 4
Executive Summary 4
Key Findings 4
Report Scope and Methodology 5
Creation of a Peer Group 5
Disclosure Prevalence 5
Peer Group Size 5
Multiple Peer Groups 7
Selection Criteria 7
Industry Considerations 8
Inclusion of Foreign Peers 9
Peer Group Comparisons 10
Revenue Percentile Ranking 10
Effects of Peer Criteria on Percentile Ranking 11
CEO Total Direct Compensation Percentile Ranking 12
CEO Total Cash Compensation Percentile Ranking 13
Equilar Market Peers 13
Market Peers Comparisons 13
Revenue Percentile Ranking 14
CEO Total Direct Compensation Ranking 14
CEO Total Cash Compensation Ranking 15
Disclosure Examples 15
Changes in Peer Group Construction 15
Selection of Peer Criteria 16
Use of Multiple Peer Groups 16

2014 S&P 1500 Peer Group Report | 4
Executive SummaryIn recent years, companies have come under increased scrutiny to justify their executives’ compensation packages. Faced with various pressures from proxy advisory firms and shareholders, companies must take great care to create peer groups appropriate for their benchmarking needs.
The two leading proxy advisory firms take different approaches when establishing peer groups for comparison purposes. Institutional Shareholder Services (ISS) creates a peer group ranging from 14 to 24 companies, primarily chosen by GICS industry classification, and by financial constraints, such as revenue and market capitalization. Glass Lewis uses Equilar Market Peers, which uses a relational approach in creating peer groups, looking at whom a company benchmarks to and its peers, as well as who benchmarks back to the company, and assigning weight to the strength of all those relationships. Companies employ a variety of methods and criteria when creating their peer groups, and many look beyond industry and revenue to consider additional factors such as competition for talent, geographic location, or company and industry complexity. Since compensation among peer firms is one way companies justify compensation, clear disclosure of the approach taken to select peer groups is important to include in an annual proxy statement. It helps clarify benchmarking decisions for both shareholders and proxy advisory firms.
In this study of peer group creation, Equilar examined the peer groups of S&P 1500 companies. This analysis determines how companies formulate their peer groups. It then compares the percentile rankings of companies against their disclosed peers and Equilar Market Peers. This detailed review offers information on peer group size, selection criteria, revenue, and CEO compensation.
Key Findings � Some companies are more popular than others: 3M continues to be the most commonly
referenced peer, named by 62 companies. Johnson & Johnson follows with 57 references and Eaton Corp. comes in third with 53 references.
� Most peer groups consist of 11 to 20 companies: 68.7% of peer groups in the S&P 1500 included 11 to 20 companies. The number of peers increased with the size of the company; the median number of peers for the S&P SmallCap 600 was 15, while the S&P MidCap 400 was 16, and 17 for the S&P 500.
� Most commonly utilized peer criterion is industry: Industry was used as a peer group determination criterion by more than 1,200 companies. Industry was followed in popularity by revenue and market capitalization.
� Most companies used peers in the same industry: 56.1% of S&P 1500 companies used peer groups with 80% to 100% of companies in their same industry.
� Companies tend to consider multiple criteria when selecting peers: The median number of criteria considered in the S&P 1500 was four, while the greatest number of criteria used by a company was nine.
� S&P 1500 companies look outside of the country when making peer decisions: 32.0% of companies that disclosed a peer group had at least one peer headquartered outside of the United States. The three most popular countries to benchmark to were Ireland, Canada, and Switzerland.
� Companies typically benchmark to one peer group: 90.8% of S&P 1500 companies benchmarked to only one peer group, while 8.1% of companies disclosed two peer groups, and 1.0% of companies disclosed three peer groups. One company disclosed five peer groups, one for each NEO.
� S&P 1500 companies select peers with larger revenues: Within the S&P 1500, 80.6% of companies had revenues equal to or below the 60th percentile of their peer groups. The average and median revenue rank both were at the 44th percentile.
Introduction

2014 S&P 1500 Peer Group Report | 5
� S&P 1500 companies had pay packages smaller than that of their peers: The median S&P 1500 CEO’s total direct compensation and total cash compensation ranks both were at the 46th percentile.
� Most disclosed peer groups overlap with Equilar Market Peers: 75.1% of disclosed peer groups in the S&P 1500 shared at least 60.0% overlap with Equilar Market Peers, while 16.8% of disclosed peer groups in the S&P 1500 shared less than a 50.0% overlap. The average overlap of an S&P 1500 disclosed peer group versus Equilar Market Peers was 68.0%, while the median was 73.3%.
Report Scope and MethodologyAlthough a number of criteria are considered in determining a peer group, for the purpose of this analysis, Equilar focused on industry, annual revenue, CEO total cash compensation, and CEO total direct compensation.
Due to the lack of peer group disclosure by certain companies, the sample group consisted of 1,329 companies within the S&P 1500 that disclosed at least one peer between July 1, 2012 and June 30, 2013. All companies that disclosed a general industry group or index in lieu of listing individual peer companies were excluded from this study.
Disclosure PrevalenceBenchmarking to a peer group is an increasingly common practice in executive compensation. However, not all companies in the S&P 1500 benchmark to a peer group or disclose the peers they use for benchmarking. In the S&P 1500, 89.0% of companies disclosed a peer group in their most recent proxy. As the size of a company increases, it is more likely that the company will disclose a peer group. In the S&P 500, 95.4% of companies disclosed a peer group, compared to 87.7% of companies in the S&P MidCap 400 and 84.4% of companies in the S&P SmallCap 600.
Some companies are more popular benchmarks. Ten companies in the S&P 1500 were referenced as peers by between 43 and 62 other companies. Their industry classifications and revenue ranges
may have made these companies appeal to a wide array of companies. All but two of these ten companies were classified as Industrial or Consumer Goods. Additionally, they all belonged to the S&P 500 and had revenues of at least $14 billion.
3M continued to be the most benchmarked company in the S&P 1500 with 62 references. The top ten most benchmarked companies in the S&P 1500 are shown below.
Peer Group SizeIn 2013, companies in the S&P 1500 selected between 2 and 278 companies when creating a peer group. The median number of peers disclosed in the S&P 1500 in the past fiscal year was 16. When making peer group selections, ISS generally uses a peer group size containing a minimum of 14 and a maximum of 24 companies. Equilar Market Peers establishes a peer group of 15 companies.
Introduction / Creation of a Peer Group
S&P 1500
Company NameNumber of
References
3M 62
Johnson & Johnson 57
Eaton Corp 53
PepsiCo 50
Honeywell International 50
Procter & Gamble 46
General Mills 45
Emerson Electric 44
United Technologies 44
Colgate Palmolive 43
Illinois Tool Works 43
Kellogg 43

2014 S&P 1500 Peer Group Report | 6
Although 35.9% of companies disclosed a peer group of between 16 and 20 companies, companies may disclose significantly more or less depending on their benchmarking needs. The graph below shows the prevalence of peer group sizes for companies in the S&P 1500.
Breaking the S&P 1500 down by index, it is evident that larger companies tend to disclose more peers. In 2013, the median number of peers for the S&P 500 was 17 compared to a median of 16 for the S&P MidCap 400 and 15 for the S&P SmallCap 600. The three graphs show the prevalence of peer group sizes for companies by index.
Creation of a Peer Group
S&P 1500 Peer Group Size
0.0%
5.0%
10.0%
15.0%
20.0%
25.0%
30.0%
35.0%
40.0%
>25.0
21.0-25.0
16.0-20.0
11.0-15.0
10.0 or Less
11.0
%
32.8
% 35.9
%
11.2
%
9.1%
S&P 500 Peer Group Size
0.0%
5.0%
10.0%
15.0%
20.0%
25.0%
30.0%
35.0%
40.0%
>25.0
21.0-25.0
16.0-20.0
11.0-15.0
10.0 or Less
8.8%
26.7
%
37.3
%
13.1
%
14.1
%
S&P 400 Peer Group Size
0.0%
5.0%
10.0%
15.0%
20.0%
25.0%
30.0%
35.0%
40.0%
>25.0
21.0-25.0
16.0-20.0
11.0-15.0
10.0 or Less
8.9%
35.8
%
35.2
%
11.7
%
8.3%

2014 S&P 1500 Peer Group Report | 7
Creation of a Peer Group
Multiple Peer GroupsA company may choose to create multiple peer groups. One of the most common reasons cited is that the company belongs to a smaller, niche industry. Its first peer group may contain a small number of companies within the same industry, while a second peer group may be composed of companies within a broader industry index or within a certain revenue range. Other companies may choose to establish separate peer groups for different executives, or for different geographies.
Whatever the reason, the number of companies that disclose multiple peer groups is low. In the S&P 1500, 90.8% of companies had only one peer group, 8.1% had two peer groups, and 1.0% had three. One company disclosed five peer groups (Stamps.com). Stamps.com chooses to benchmark to a different set of companies for each of its named executive officers.
Selection CriteriaWhen selecting peers, companies want to be able to justify to shareholders why they have included certain companies. The explanations vary, but companies often cite that they reference their peers’ industry classifications, financial metrics (such as market capitalization or revenue), or competition for talent. It is important for a company to justify to shareholders that chosen companies are appropriate for benchmarking purposes and have not been selected just to make company performance look better or to increase executive compensation. The median number of
S&P 600 Peer Group Size
0.0%
5.0%
10.0%
15.0%
20.0%
25.0%
30.0%
35.0%
40.0%
>25.0
21-25.0
16.0-20.0
11.0-15.0
10.0 or Less
14.5
%
36.4
%
35.0
%
9.1%
5.0%
Number of Peer Groups
5 Peer Groups
4 Peer Groups
3 Peer Groups
2 Peer Groups
1 Peer Group90.8%
8.1%
1.0%0.1%
We find that most companies now use a single peer group to simplify administration and streamline disclosure. However, some companies use multiple peer groups to address unique issues caused by few industry peers existing within their size ranges. We also find that there is often confusion over various peer groups. Proxy advisory firms have different selection criteria to identify peer groups that they use to evaluate companies and those peer groups may vary from peer groups developed by companies to evaluate compensation opportunity levels, incentive practices, relative dilution levels, etc. If companies do use multiple peer groups, it is important to disclose the rationale, selection process, and actual use of each peer group in the decision-making process.
Frederic W. Cook & Co. Analysis:
2014 S&P 1500 Peer Group Report | 8
Creation of a Peer Group
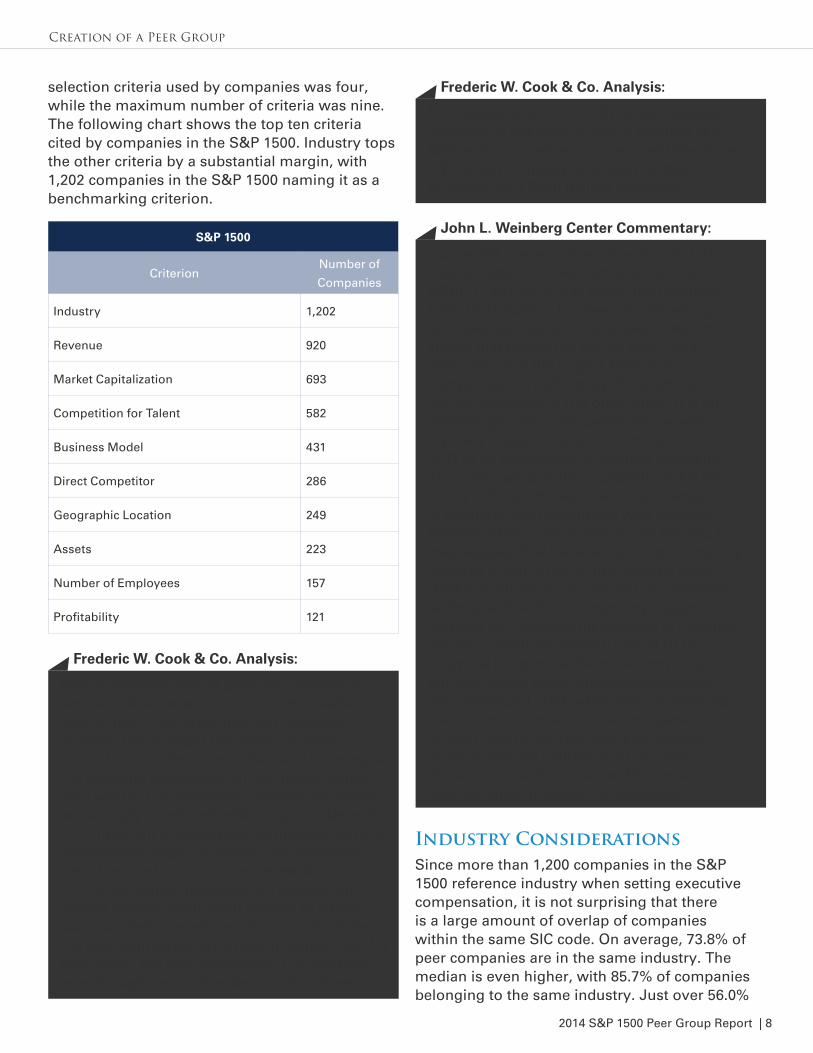
selection criteria used by companies was four, while the maximum number of criteria was nine. The following chart shows the top ten criteria cited by companies in the S&P 1500. Industry tops the other criteria by a substantial margin, with 1,202 companies in the S&P 1500 naming it as a benchmarking criterion.
Industry ConsiderationsSince more than 1,200 companies in the S&P 1500 reference industry when setting executive compensation, it is not surprising that there is a large amount of overlap of companies within the same SIC code. On average, 73.8% of peer companies are in the same industry. The median is even higher, with 85.7% of companies belonging to the same industry. Just over 56.0%
S&P 1500
CriterionNumber of
Companies
Industry 1,202
Revenue 920
Market Capitalization 693
Competition for Talent 582
Business Model 431
Direct Competitor 286
Geographic Location 249
Assets 223
Number of Employees 157
Profitability 121
Peer companies should generally operate in similar industries and to the extent possible have similar cost structures and business models. The stronger the match on these characteristics, the more robust and meaningful the resulting compensation and performance data will be. Compensation opportunity levels are strongly correlated with company size and it is important to avoid peer companies that are substantially larger or smaller. As illustrated here, the most common size determinants for compensation purposes are revenue and market capitalization. With respect to criteria such as talent competitors, it is important that the peer companies are in talent competition for executives, not only employees. For example, even though two companies might compete
Frederic W. Cook & Co. Analysis:
for engineers, a CFO at a $7 billion revenue company is not likely to take a position at a $200 million revenue company, and therefore a $7 billion company is unlikely suitable as a peer for a $200 million company.
Frederic W. Cook & Co. Analysis:
Our recent research (Executive Superstars, Peer Groups and Overcompensation, 38 J. CORP. L. 487, 2013) has called the retention-based justification for peer benchmarking into question. We provide evidence which shows that during the period from 1993-2009, amongst the largest 1500 or so companies, only 27 sitting CEOs left their current positions to run other firms. It is an exceedingly rare – and performance-wise typically disappointing – occurrence for a CEO to be hired away by another company. There are two possible explanations for this. It may indicate the success of companies in retaining chief executives with effective benchmarking. Conversely, as we believe, it may suggest that because running a company requires a vast array of firm-specific skills, chief executives are simply not as marketable as the practice of benchmarking suggests – and that the retention justification is therefore merely a platitude. Indeed, typical CEOs, at typical companies, have had very long tenures during which intensive knowledge was developed. And, when they or other top executives do move to other companies, it is most often in extraordinary situations, so as to execute a turnaround or a sale of the business for instance. The correct interpretation, however, is debatable.
John L. Weinberg Center Commentary:

2014 S&P 1500 Peer Group Report | 9
Creation of a Peer Group
of companies had peer groups in which 80.0% to 100.0% of their peers belonged to their same industry. Only 6.5% of companies had peer groups with less than 20.0% industry overlap. These companies may have decided to place more of an emphasis on a certain financial metric or stage of development, rather than on the industry classification.
To illustrate this comparison, the first digit of the company’s Standard Industrial Code (SIC) was compared to its peers’ SIC codes. The following chart shows the percentage of companies that included peers of similar industry.
Inclusion of Foreign PeersSometimes companies decide to go beyond the border in order to properly benchmark executives’ pay. While only 249 companies in the S&P 1500 specifically state that they use geography as a criterion for selecting peers, nearly 32% of S&P 1500 companies disclose a peer headquartered located outside of the United States. The larger a company, the more likely it will include a foreign company as part of its peer group. This may be because larger companies are more likely to have global operations. Within the S&P 500, 46.5% of companies have at least one peer headquartered outside of the United States compared to 30.4% in the S&P MidCap 400 and 19.4% in the S&P SmallCap 600.
The three most common countries to benchmark to were Ireland (202 references), Canada (187), and Switzerland (140). Since Eaton Corp. maintains headquarters in Ireland and is the third most referenced company in the S&P 1500, this may account for Ireland’s higher number.
The following graph shows the percentage of peer groups that have a peer with headquarters outside of the United States by index.
We find that some companies benefit from examining not only financial and industry metrics, but also current executives’ previous employment to determine their peer companies. For example, a telecommunications company may find that the predominant background for their executives is information technology or software, indicating that strict adherence to its industry classification may not be the best approach to peer group company identification. Taken in isolation, any one peer company may be singled out or criticized as not a great
Frederic W. Cook & Co. Analysis:
S&P 1500 Industry Peer Percentage
0.0%
10.0%
20.0%
30.0%
40.0%
50.0%
60.0%
80.0-100%
60.0-79.9%
40.0-59.9%
20.0-39.9%
<20.0%
6.5%
9.0% 13
.3%
15.0
%
56.1
%
comparator. The critical determination is whether, in totality, the peer group is reasonable and defensible for comparison purposes.
Frederic W. Cook & Co. Analysis:

2014 S&P 1500 Peer Group Report | 10
Creation of a Peer Group / Peer Group Comparisons
Revenue Percentile RankingThe second most prevalent criterion S&P 1500 companies used to select their peers in 2013 was revenue, disclosed by 920 companies. In order to investigate how relevant revenue was in determining a company’s peers, Equilar compared each company’s revenue in the S&P 1500 to the revenue of its selected peers. The percentile ranking used for this analysis refers to the position the company ranks in revenue when compared to its peer group.
Companies within the S&P 1500 generally had
lower revenues compared to other companies in their peer groups. Within the S&P 1500, 63.7% of companies ranked at or below the 50th percentile of peer revenue, with a median of 43.8% and an average of 43.7%. 65.4% of peers fell within 0.5 to two times the range of the benchmarking company’s revenue, a common rule of thumb for determining relevant peers.
The following chart illustrates the distribution of revenue percentile rankings within the S&P 1500. The vertical axis represents the percentage of S&P 1500 companies that fall into each percentile range. The “Above” and “Below” classifications in the chart indicate companies that had revenue outside of the given peer-group revenue range.
Peers Located Outside of the U.S.
0.0%
5.0%
10.0%
15.0%
20.0%
25.0% S&PSmallCap 600
S&PMidCap 400
S&P 500
80.0-100%
60.0-79.9%
40.0-59.9%
20.0-39.9%
10.0-19.9%
<10.0%
Caution must be used when including peer companies that are headquartered outside the United States. Several factors impact compensation between countries. These influencers include tax laws, accounting rules, securities regulations and the culture of the country of residence. Some countries have very different compensation models that result in different levels of compensation and different mixes of pay as between guaranteed pay and variable pay, and cash and equity. Often the availability of compensation data from foreign peers is limited. Additionally, there may be perquisites specific to a country that might have substantial value, but are not offered in the United States.
Frederic W. Cook & Co. Analysis:S&P 1500 Revenue Percentile Rank vs. Peer Group
0.0%
5.0%
10.0%
15.0%
20.0%
25.0%
30.0%
35.0%
40.0%
Above
80.0-100%
60.0-79.9%
40.0-59.9%
20.0-39.9%
0.0-19.9%Below
1.6% 4.
0%
0.4%
11.6
%
29.6
%
37.8
%
15.0
%
Revenue is the most common metric for company size used in identifying peers because it generally has the highest correlation with compensation levels. Market capitalization is frequently used in conjunction with revenue, but its volatility reduces its correlation with compensation levels. Often we see market capitalization to revenue ratios also used as a proxy to determine similarity in company stage, performance, and vitality. Managed
Frederic W. Cook & Co. Analysis:

2014 S&P 1500 Peer Group Report | 11
Effects of Peer Criteria on Percentile RankingEquilar compared revenues for companies within the S&P 1500 that explicitly stated revenue as a criterion against their peer groups’ revenue, and compared companies that did not state revenue as a criterion against peer group revenue. A percentile ranking was used to compare the company’s revenue to that of its peers.
For the companies that disclosed revenue as a criterion, the median ranking was 43.6% with an average of 43.0%. The most prevalent ranking was between the 40th and 60th percentiles, with 40.4% of companies fitting into that range.
The results between companies that disclosed revenue as a criterion versus those that did not were very similar. The median ranking for those companies that did not state revenue as a criterion was 44.6% with an average of 45.3%. The 40th to 60th percentile remained a common range, with
32.1% of companies in that range.
The following charts present the distribution of revenue percentile rankings among the S&P 1500 for companies that disclosed revenue as a criterion and for companies that did not. The vertical axis of the chart represents the number of companies that fell into each percentile range. The “Above” and “Below” classifications in the chart indicate companies that had revenue outside of the peer-group revenue range.
Peer Group Comparisons
assets are often favored over revenue for financial institutions when measuring size.
Frederic W. Cook & Co. Analysis:
The most consistent empirical finding concerning executive pay is that larger firms pay more. It is therefore problematic for companies to construct peer groups which are comprised of larger companies. Because pay is almost always targeted to the peer group median or higher, such an approach will have a tendency to raise pay levels in an inappropriate fashion. The best practice is for companies to aim to be at the median in revenue and market-capitalization when constructing peer groups. A number of studies have examined the tendency for biased peer group company selection in terms of their relative size or pay levels. For instance, Professors Michael Faulkender and Jun Yang show empirically that companies, particularly those with weak governance, engage in “strategic peer selection activities” by actively selecting highly-paid peers as opposed to lower-paid peers.
John L. Weinberg Center Commentary:
S&P 1500 Disclosed Revenue Percentile Rank vs. Peer Group
0.0%
5.0%
10.0%
15.0%
20.0%
25.0%
30.0%
35.0%
40.0%
45.0%
Above
80.0-100%
60.0-79.9%
40.0-59.9%
20.0-39.9%
0.0-19.9%Below
1.0% 3.
5%
0.0%
12.3
%
29.3
%
40.4
%
13.6
%
2014 S&P 1500 Peer Group Report | 12
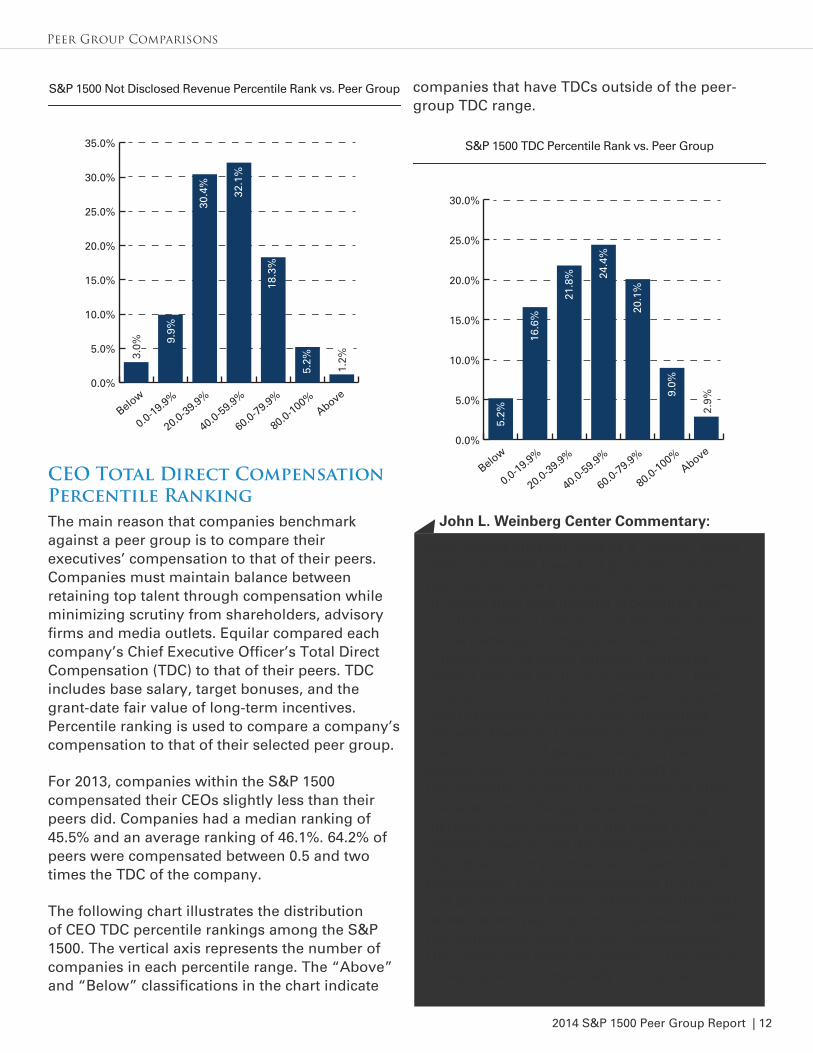
CEO Total Direct Compensation Percentile RankingThe main reason that companies benchmark against a peer group is to compare their executives’ compensation to that of their peers. Companies must maintain balance between retaining top talent through compensation while minimizing scrutiny from shareholders, advisory firms and media outlets. Equilar compared each company’s Chief Executive Officer’s Total Direct Compensation (TDC) to that of their peers. TDC includes base salary, target bonuses, and the grant-date fair value of long-term incentives. Percentile ranking is used to compare a company’s compensation to that of their selected peer group.
For 2013, companies within the S&P 1500 compensated their CEOs slightly less than their peers did. Companies had a median ranking of 45.5% and an average ranking of 46.1%. 64.2% of peers were compensated between 0.5 and two times the TDC of the company.
The following chart illustrates the distribution of CEO TDC percentile rankings among the S&P 1500. The vertical axis represents the number of companies in each percentile range. The “Above” and “Below” classifications in the chart indicate
companies that have TDCs outside of the peer-group TDC range.
Peer Group Comparisons
S&P 1500 Not Disclosed Revenue Percentile Rank vs. Peer Group
0.0%
5.0%
10.0%
15.0%
20.0%
25.0%
30.0%
35.0%
Above
80.0-100%
60.0-79.9%
40.0-59.9%
20.0-39.9%
0.0-19.9%Below
3.0%
1.2%
9.9%
30.4
%
32.1
%
18.3
%
5.2%
S&P 1500 TDC Percentile Rank vs. Peer Group
0.0%
5.0%
10.0%
15.0%
20.0%
25.0%
30.0%
Above
80.0-100%
60.0-79.9%
40.0-59.9%
20.0-39.9%
0.0-19.9%Below
2.9%
5.2%
16.6
%
21.8
% 24.4
%
20.1
%
9.0%
Peer groups are best used as a “sanity” check after companies have first gone through a rigorous decision process. It is best to set pay in accordance with internal procedures and practices, taking into account the idiosyncrasies of the particular company and executive. A board should weigh retention concerns against internal equity considerations. They should consider what compensation structure most effectively governs pay differentials between levels and positions throughout the company, and design executive pay accordingly. The promotion to CEO is fundamentally similar to promotions at other levels and accordingly the accompanying increase in pay should be the result of a process governed by the same general logic. Boards should try to maintain organizational consistency. They should consider the pay and performance history of the executive and relate current pay to prior compensation. With the heightened focus on the Compensation Discussion and Analysis section of the annual proxy statement, especially in response
John L. Weinberg Center Commentary:

2014 S&P 1500 Peer Group Report | 13
Peer Group Comparisons / Equilar Market Peers
CEO Total Cash Compensation Percentile Ranking Another way to evaluate a company’s compensation against its peer group is to use Total Cash Compensation (TCC). TCC includes base salary, discretionary bonuses, and non-equity incentive plan cash earned.
Similar to TDC, companies within the S&P 1500 tended to have cash compensation at a lower level than their peer group. There was a small difference in median percentile ranks between TDC and TCC, with the median TCC at 46.4% and the average percentile rank at 47.5%. The 20th to 40th percentile was most prevalent with 279 companies, followed by the 40th to 60th percentile with 264 companies.
The following chart illustrates the distribution of CEO TCC percentile rankings among the S&P 1500. The vertical axis of the chart represents the number of companies in each percentile range. The “Above” and “Below” classifications in the chart indicate companies that have TCCs outside of the peer-group TCC range.
Market Peers ComparisonsEquilar Market Peers consist of the 15 companies that have the strongest connections to each target company resulting from an algorithm that considers self-constructed peers, incoming peers, peers of peers, and peers of incoming peers. Equilar Market Peers provides a way to evaluate a company against a peer group that consists of not only the peers disclosed by each company, but also a group of peers that represents the complex relationships in the marketplace.
The average overlap of Market Peers and peers disclosed by the S&P 1500 is 68.0%, while the median overlap of peers is 73.3%. Additionally, 75.1% of these companies had at least a 60% overlap, while only 16.8% had less than a 50% overlap. The following chart shows the average and median overlap for each of the S&P 500, S&P MidCap 400, and S&P SmallCap 600.
S&P 1500 CEO TCC Percentile Rank vs. Peer Group
0.0%
5.0%
10.0%
15.0%
20.0%
25.0%
Above
80th-100%
60th-79.9%
40th-59.9%
20th-39.9%
0-19.9%Below
5.5%
17.4
%
21.1
%
20.0
%
19.7
%
12.5
%
3.9%
to the controversial and forthcoming CEO-to-median worker pay disclosures, these considerations are critically important. They create a far more compelling justification to shareholders and employees, of compensation decisions than peer benchmarking does.
John L. Weinberg Center Commentary:

2014 S&P 1500 Peer Group Report | 14
The following graph illustrates the distribution of percentile rankings among the S&P 1500. The vertical axis represents the number of companies that fell within each percentile range of overlap.
Revenue Percentile Ranking In addition to analyzing revenue and compensation data for each S&P 1500 company’s disclosed peer group, Equilar also analyzed the same metrics using Equilar Market Peers. As stated, revenue is a major factor in the peer determination process. The percentile rank represents the relative position of the company within its peer group.
Many results found using Equilar Market Peers were similar to those found using publically disclosed peers. Of the companies analyzed, 30.1% had revenues falling within the 40th and 60th percentiles of the Market Peers, 24.9% fell between
the 20th and 40th percentiles of the Market Peers, and 20.0% of companies had revenues between the 60th and 80th percentiles of the Market Peers. Of the companies analyzed, 71.4% had revenues that fell below the 60th percentile. The median and average ranking of a company’s revenue versus its Market Peers were both at the 47th percentile. 63.4% of Market Peers had revenues 0.5 to two times the company’s revenue.
The following chart illustrates the distribution of revenue percentile rankings among the S&P 1500. The vertical axis shows the number of companies that fell into each percentile range. The “Above” and “Below” categories depicted in the chart capture companies that have revenues that fell outside of the peer-group revenue range.
CEO Total Direct Compensation Ranking Equilar analyzed how companies in the S&P 1500 pay their CEOs in comparison to their Market Peers. The most common percentile range was from the 40th to 60th percentile, with 21.8% of companies. The higher prevalence of companies falling at or below the 40th percentile (38.9% of companies) compared to those falling between the 60th and 100th percentiles (29.9% of companies) indicates that most companies had smaller pay
Equilar Market Peers
Percent of Market Peers Overlap
S&P
500
S&P
MidCap
400
S&P
SmallCap
600
S&P
1500
Average 71.5% 68.5% 64.5% 68.0%
Median 73.3% 73.3% 66.7% 73.3%
Overlap between Equilar Market Peers and Disclosed Peers
0.0
50.0
100.0
150.0
200.0
250.0 S&PSmallCap 600
S&PMidCap 400
S&P 500
80.0-100%
60.0-79.9%
40.0-59.9%
20.0-39.9%
<20.0%
3.0
4.0 12
.0 18.0
17.0
41.0
69.0
62.0
103.
0
181.
0 200.
0
200.
012
3.0 14
6.0
141.
0
Revenue Percentile Rankings
0.0%
5.0%
10.0%
15.0%
20.0%
25.0%
30.0%
35.0%
Above
>80.0%
60.0-79.9%
40.0-59.9%
20.0-39.9%
<20.0%Below
1.3%2.
2%
14.1
%
24.9
%
30.1
%
20.1
%
7.4%

2014 S&P 1500 Peer Group Report | 15
packages than their Market Peers. In fact, for companies whose TDC fell within that of its Market Peer Group, the median and average CEO TDC rank were both in the 47th percentile.
The following chart illustrates the distribution of CEO TDC percentile rankings among the S&P 1500. The vertical axis of the chart represents the number of companies that fell into each percentile range. The “Above” and “Below” classifications in the chart indicate companies that had TDCs outside of the peer-group TDC range.
CEO Total Cash Compensation Ranking Similar to TDC, peer groups are used to provide a benchmark to establish total cash compensation (TCC). The most common percentile range was from the 40th to 60th percentiles, 19.9% of companies. The slightly higher prevalence of companies at or below the 40th percentile (37.2% of companies), compared to those falling between the 60th and 100th percentiles (32.5% of companies), indicates that more companies had smaller cash compensation packages than their Market Peers. Moreover, the median CEO TCC rank was in the 48th percentile and the average CEO TCC rank was in the 49th percentile.
The following chart illustrates the distribution of CEO TCC percentile rankings among the S&P 1500. TCC includes base salary, discretionary bonus and non-equity incentive awards. The vertical axis of the chart represents the number of companies that fell into each percentile range. The “Above” and “Below” classifications in the chart indicate companies that have TDCs outside of the peer-group TDC range.
Changes in Peer Group Construction � Abercrombie & Fitch (ANF) DEF 14A filed May 16, 2013
“The peer group was revised in Fiscal 2012 to put the Company closer to the median of the group in terms of revenues and to implement other changes based on size, business focus and location. At the time the peer group was determined, in January 2012, the Company’s revenues approximated the peer group median and its market capitalization was positioned between median and the 75th percentile. At the end of Fiscal 2012, the Company was positioned at the 58th percentile in terms of sales and the 40th percentile in terms of market capitalization.”
Equilar Market Peers / Disclosure Examples
TDC Percentile Rankings
0.0%
5.0%
10.0%
15.0%
20.0%
25.0%
Above
>80.0%
60.0-79.9%
40.0-59.9%
20.0-39.9%
<20.0%Below
5.3%
17.2
%
21.7
%
21.8
%
17.2
%
12.8
%
4.1%
TCC Percentile Rankings
0.0%
5.0%
10.0%
15.0%
20.0%
25.0%
Above
>80.0%
60.0-79.9%
40.0-59.9%
20.0-39.9%
<20.0%Below
5.3%
18.8
%
18.4
% 19.9
%
17.7
%
14.9
%
5.0%

2014 S&P 1500 Peer Group Report | 16
� Kilroy Realty (KRC) DEF 14A filed April 12, 2013
“Our peer group was significantly redesigned following our 2012 annual meeting relative to our 2011 peer group and reflects our determination to incorporate more sector-specific and direct geographic competitors in the group. We received feedback from certain institutional stockholders regarding the relative size of the companies in our previous peer group. We believe that the new peer group, which was reduced from 27 to 18 companies, addresses these concerns because, as of December 31, 2012, our equity market capitalization of approximately $3.5 billion was greater than the median equity market capitalization of the companies in our peer group, which was approximately $3.2 billion.”
Selection of Peer Criteria � Spartan Stores (SPTN) DEF 14A filed June 14, 2013
“In establishing the current peer group, the Compensation Committee looked for companies having characteristics similar to Spartan Stores, including revenue (approximately $1.4 to $5.2 billion), business operations, customer base, distribution channels, geographic diversity and locations, and market capitalization. The Compensation Committee believes that comparator groups selected by limited criteria, such as industrial classification code, do not present a fair means of comparison because they do not account for factors such as ownership and control by a small group, simplicity or complexity of operations, business strategy (e.g., balanced focus on retail and wholesale operations), and other factors that can create a misleading comparison.”
� Corning (GLW) DEF 14A filed March 11, 2013
“In 2012, the Company and the Committee undertook a rigorous review of our Peer Group for use in benchmarking pay practices and the target median pay level for the CEO. This was necessary because our previous approach of
looking solely at “similarly sized” companies did not focus on particular industries or business segments that Corning actually operates in, and with changes over time, did not result in a stable peer group from year to year.
We engaged both management’s compensation consultant as well as the Committee’s compensation consultant in formulating recommended Peer Group companies. In constructing the new Peer Group, we looked for companies to reflect the global business segments that Corning operates in with revenues generally in the range of 0.5x and 2.1x Corning’s revenues. As a result of this review,
� Four companies were identified in the Life Sciences segment;
� Five companies were identified in Telecommunications;
� Two companies were identified in the Automotive supply segment; and
� Three companies were identified in Specialty and Chemicals.”
Use of Multiple Peer Groups � Pfizer (PFE) DEF 14A filed March 14, 2013
“In support of our compensation philosophy, we target the median compensation values of both a peer group of U.S.-based pharmaceutical companies and a general industry comparator group to determine an appropriate total value and mix of pay for our executives. We include general industry comparators because Pfizer’s size, revenue, assets, and market capitalization are more closely aligned with these general industry comparators. Both groups were chosen because they are a source of talent, based on the complexity of their businesses as well as the availability of comparative data. They define the market for benchmarking and pay positioning, which serves to attract and retain senior executive leaders for both pharmaceutical and general industry roles. The Committee reviews these peer groups on an annual basis.”
Disclosure Examples

2014 S&P 1500 Peer Group Report | 17
*The committee recognizes that while data are available on the performance of our non-U.S.-based peer companies the compensation data are limited in terms of comparable benchmarks and other information for select non-U.S. peers
Disclosure Examples
2012 Pharmaceutical Peer Group
Abbott
Laboratories
Bristol-Myers
Squibb
Johnson &
JohnsonRoche*
Amgen Eli Lilly MerckSanofi-
Aventis*
AstraZeneca GlaxoSmithKline Novartis*
2012 General Industry Comparator Group
Alcoa Comcast HoneywellUnited Parcel
Service
Altria Group Dell IBMUnited
Technologies
BoeingDow
Chemical
Lockheed
Martin
UnitedHealth
Group
Caterpillar DuPont PepsiCo Verizon
Chevron FedExProcter &
GambleWalt Disney
Coca-ColaGeneral
ElectricTimeWarner

2014 S&P 1500 Peer Group Report | 18
Equilar Contacts
For more information, please contact Aaron Boyd at [email protected]. Aaron Boyd is the Director of Governance Research at Equilar. The contributing authors of this paper are Shelby Dempsey, Anthony DyPac, and Robert Lee, Research Analysts.
Report Partners:
About Frederic W. Cook & Co., Inc.
Frederic W. Cook & Co., Inc. is a nationally-recognized, independent firm providing consulting assistance to corporations in order to develop compensation programs for senior executives, key employees, and board of directors. The firm is a leading advisor to Board Compensation Committees, with specific expertise in incentive plan design and insight into external trends and developments.
Since 1973, Frederic W. Cook & Co. has served over 2,700 clients across a broad range of industries. As named advisors to Board Compensation Committees, the firm is proud to have achieved market-leading positions among the Dow Jones Industrials, the S&P 500 and the Nasdaq 100. In addition, Frederic W. Cook & Co. serves private firms (including partnerships, ESOPs and pre-IPO companies), foreign companies and tax-exempt organizations (including trusts, foundations and universities).
Frederic W. Cook & Co. Contact
Matthew T. StinnerManaging [email protected]
Matthew T. Stinner is a Managing Director and head of the Boston Office. He joined the firm in 2013, having previously been a Senior Managing Director at Pearl Meyer & Partners, a Principal at Mercer HR Consulting and a Partner at Arthur Andersen. He also previously held positions at Fidelity Investments. He holds a B.A. from Hamilton College and a J.D. from Boston College Law School. He is admitted to the Bar in both Massachusetts and New York.
About the John L. Weinberg Center for Corporate Governance
Established in 2000 in the University of Delaware’s Alfred Lerner College of Business and Economics, the vision of the John L. Weinberg Center for Corporate Governance is to propose progressive changes in corporate structure and management through education and interaction. The Center provides a forum for business leaders, members of corporate boards, the judiciary and the legal community, shareholders, academics, practitioners, graduate and undergraduate students, and others interested in corporate governance issues to meet, interact, learn and teach. Using the fully endowed Edgar S. Woolard, Jr., Chair in Corporate Governance as the base for the Center, we develop programs that generate local, national and even international interest.
John L. Weinberg Center for Corporate Governance Contacts

2014 S&P 1500 Peer Group Report | 19
Equilar Contacts
Charles M. Elson Director [email protected]
Charles M. Elson is the Edgar S. Woolard, Jr., Chair in Corporate Governance and the Director of the John L. Weinberg Center for Corporate Governance at the University of Delaware. He is also "Of Counsel" to the law firm of Holland & Knight. His fields of expertise include corporations, securities regulation and corporate governance. He is a graduate of Harvard College and the University of Virginia Law School. Professor Elson has written extensively on the subject of boards of directors. He is a frequent contributor on corporate governance issues to various scholarly and popular publications. He is Vice Chairman of the ABA Business Law Section’s Committee on Corporate Governance. He is presently a member of the Board of Directors of HealthSouth Corporation, a healthcare services provider. He is presently a trustee at the Hagley Museum and Library, the Delaware Art Museum and the Museum of American Finance.
Craig Ferrere Fellow [email protected]
Craig K. Ferrere is the Edgar S. Woolard, Jr., Fellow in Corporate Governance at the Weinberg Center for Corporate Governance at the University of Delaware. He is a graduate of the University of Delaware. He has conducted research in the field of corporate governance and is interested in pursuing study in law, economics and organizations.

2014 S&P 1500 Peer Group Report | 20
Related Content Links
Clawbacks 101 Ownership Guidelines 101 Behind The Numbers Say on Pay
Videos
Inputs Matter—A Comparison of Diverse
Peer Group and Pay Models
Say on Pay Peer Group Turnaround Changes
ISS and Glass Lewis 2013 Policy Update
Comparison
Articles
2014 Realizable Pay 101 2014 Compensation and Governance Outlook
2013 Say on Pay Warning Signs
2013 Benefits and Perquisites
Reports

www.equilar.com