sampling of boreholes wl-3a through -12 in support of … summary this report presents the results...
TRANSCRIPT

PNNL-13631
Sampling of Boreholes WL-3A through -12 in Support of the Vadose Zone Transport Field Study G. V. Last T. G. Caldwell A. T. Owen September 2001 Prepared for the U.S. Department of Energy under Contract DE-AC06-76RL01830

DISCLAIMER This report was prepared as an account of work sponsored by an agency of the United States Government. Neither the United States Government nor any agency thereof, nor Battelle Memorial Institute, nor any of their employees, makes any warranty, express or implied, or assumes any legal liability or responsibility for the accuracy, completeness, or usefulness of any information, apparatus, product, or process disclosed, or represents that its use would not infringe privately owned rights. Reference herein to any specific commercial product, process, or service by trade name, trademark, manufacturer, or otherwise does not necessarily constitute or imply its endorsement, recommendation, or favoring by the United States Government or any agency thereof, or Battelle Memorial Institute. The views and opinions of authors expressed herein do not necessarily state or reflect those of the United States Government or any agency thereof. PACIFIC NORTHWEST NATIONAL LABORATORY operated by BATTELLE for the UNITED STATES DEPARTMENT OF ENERGY under Contract DE-AC06-76RL01830 Printed in the United States of America
This document was printed on recycled paper. (8/00)

PNNL-13631
Sampling of Boreholes WL-3A through -12 in Support of the Vadose Zone Transport Field Study G. V. Last T. G. Caldwell A. T. Owen September 2001 Prepared for the U.S. Department of Energy under Contract DE-AC06-76RL01830 Pacific Northwest National Laboratory Richland, Washington 99352
iii
Summary This report presents the results of the fiscal year (FY) 2001 core sampling effort conducted to support the Vadose Zone Transport Field Study (VZTFS). The VZTFS has been conducting a series of controlled near-surface tracer tests at the 299-E24-111 Experiment Test-Well Site (also known as the Sisson and Lu site). The purpose of these tests is to address principal uncertainties affecting the understanding of current contaminant distributions under Hanford waste sites, and to improve the prediction of future migration through the vadose zone (Ward and Gee 2000). The FY 2001 tests were conducted using a concentrated sodium thiosulfate tracer (Ward and Gee 2001). Subsurface monitoring of the tracer test was conducted using various geophysical and geochemical methods. This report presents the results from ten soil borings installed before, during, and after the tracer was injected. The first two soil borings were sampled seven days prior to the initiation of the tracer injections. Two more soil borings were sampled midway during the series of injections, and the remaining six soil borings were installed at three different times after the cessation of the injections. Over 300 soil samples were collected using a cone penetrometer and wireline sampling tools. The samples generally ranged in depth from 4.6 to 17.4 m (15 to 57 ft). Selected samples were analyzed for percent fines, moisture content, and/or tracer concentrations. Preliminary results from the core sample analyses indicate that the major concentration front of the thiosulfate tracer reached a relative depth of at least 5.5 m (18 ft) below the injection point 17 days after the tracer injections began. Fifty-one days later the tracer appears to have migrated to a relative depth of at least 12.3 m (40.5 ft). Lateral spreading appears to have exceeded 5.8 m (19 ft) even at these deepest points of migration. These data will be used in combination with other geophysical and geochemical results to further our understanding of contaminant transport within the vadose zone.

v
Acknowledgments The authors wish to thank the Vadose Zone Transport Field Study project team for support during execution of work described in this document. The Vadose Zone Transport Field Study project team is led by Andy Ward and Glendon Gee. We also wish to thank Eric Mcgarrah, Jason Ritter, Karen Waters-Husted, and Alex Mitroshkov for their field and laboratory support. We especially wish to thank Wesley Bratton, Wilhelmina Dickerson, and John Mayhew of the Applied Research Associates, Inc. cone penetrometer crew for their ingenuity and perseverance at obtaining the core samples in some rather challenging locations.
vii
Contents Summary ................................................................................................................................................. iii Acknowledgments................................................................................................................................... v Introduction............................................................................................................................................. 1 Sampling Locations ................................................................................................................................ 1 Sampling Methodology........................................................................................................................... 3 Geologic Descriptions............................................................................................................................. 4 Borehole Decommissioning.................................................................................................................... 5 Laboratory Analyses ............................................................................................................................... 7 Discussion ............................................................................................................................................... 15 Conclusions............................................................................................................................................. 15 References............................................................................................................................................... 16 Appendix A – Borehole Logs ................................................................................................................. A.1 Appendix B – Percent Fine Data............................................................................................................. B.1 Appendix C – Moisture Content Data..................................................................................................... C.1 Appendix D – Anion Analytical Data..................................................................................................... D.1
Figures 1 Location of Boreholes and Cross Sections at the Vadose Zone Transport Field Study Site ............ 2 2 Grain Size Nomenclature and Sediment Classification Scheme Used at the Hanford Site.............. 5 3 Lithostratigraphic Cross Section A-A' Showing the Relative Percent Fines ................................... 8 4 Lithostratigraphic Cross Section B-B' Showing the Relative Percent Fines.................................... 9
viii
5 Water Content and Thiosulfate Concentration 7 Days Before Injections Began ............................. 10 6 Water Content and Thiosulfate Concentration 17 Days After Injections Began.............................. 11 7 Water Content and Thiosulfate Concentration 40 Days After Injections Began.............................. 12 8 Water Content and Thiosulfate Concentration 54 Days After Injections Began.............................. 13 9 Water Content and Thiosulfate Concentration 68 Days After Injections Began.............................. 14
Tables 1 Soil Sampling, Injection Dates, and Other Pertinent Sampling Information ................................... 3 2 General Description of Materials Penetrated by Boreholes WL-5 through -12 ............................... 6 3 Lithostratigraphic Contacts .............................................................................................................. 7
1
Introduction The Vadose Zone Transport Field Study (VZTFS) was initiated to study the principal uncertainties that affect the understanding of current contaminant distributions under Hanford waste sites and to improve the prediction of future migration through the vadose zone (Ward and Gee 2000). This study called for a series of controlled near-surface tracer tests to be conducted at the 299-E24-111 Experiment Test-Well Site (also known as the Sisson and Lu site) in fiscal year (FY) 2000 and 2001. This site was the location of a controlled contaminant transport study conducted in 1980-81 (Sisson and Lu 1984) as well as a series of water and tracer tests conducted in FY 2000.1 The FY 2001 tests were a series of controlled injections of a tracer with a high concentration of salt (Ward and Gee 2001). The injected fluid was a concentrated sodium thiosulfate pentahydrate solution. Subsurface monitoring of the tracer used various geophysical and geochemical methods. Core sampling was used to determine selected physical, hydrologic, and geochemical properties. This report presents the results of the core sampling efforts.
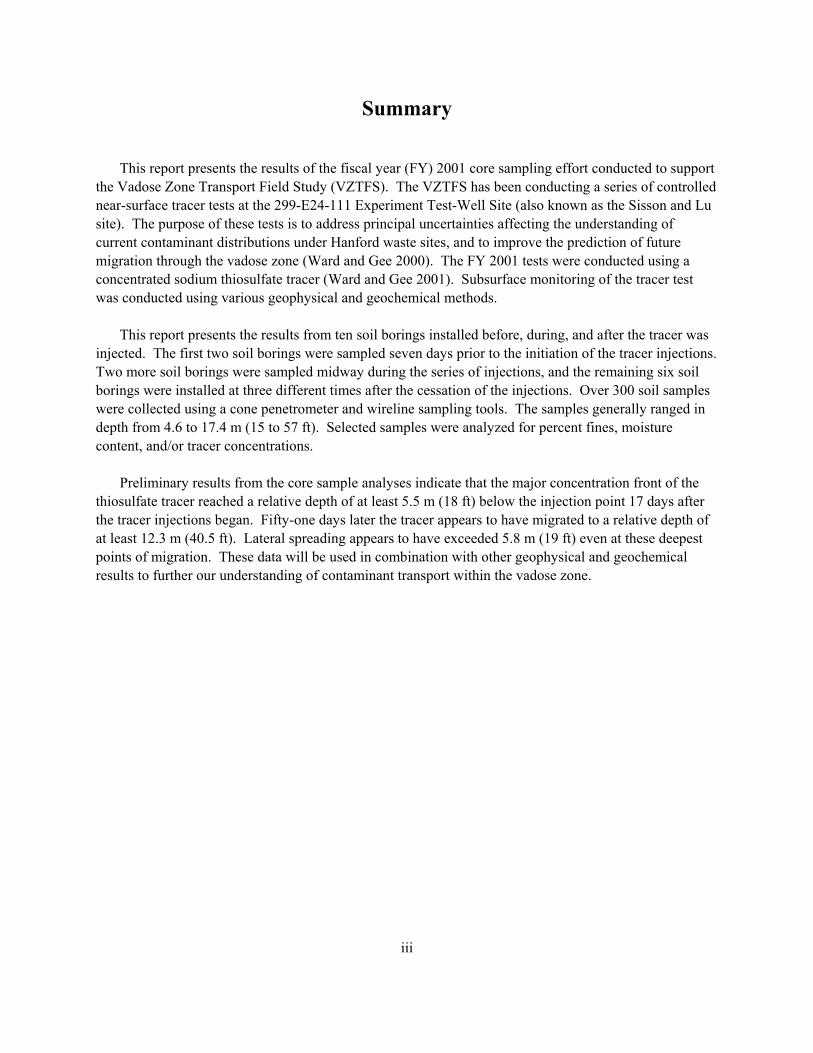
Sampling Locations The VZTFS sampling and analysis plan (Ward and Gee 2001) called for the installation and near continuous sampling of four cone penetrometer boreholes, using wireline sampling techniques. However, a total of ten boreholes were actually sampled (Figure 1). Thus, the actual numbering of the boreholes varies somewhat from that planned. The sampling and analysis plan (Ward and Gee 2001) generally called for continuous sampling to a depth of 18 m (60 ft). Subsamples (e.g., individual liners within the sampler) would then be selected from stratigraphic units of interest and analyzed for chemical, physical, and hydrogeologic characteristics. Samples were actually collected (nearly continuously) from depths of 4.5 m (15 ft) to between 15 m (49 ft) and 17.3 m (57 ft) in depth. The first two soil borings were sampled seven days prior to the initiation of the tracer injections. Two more soil borings were sampled midway during the series of injections, and the remaining six soil borings were installed at three different times after the cessation of the injections. Table 1 summarizes the pertinent sampling information for each borehole.
1 Results are available online at http://vadose.pnl.gov

2
Adv.Tensiometer Nest (Augered)Adv. Tensiometer Nest (CPT)Cross-Borehole AccessERT Array
Auger Drilled Boreholes
Steel-cased Well
New Injection Point
G-7
G-5
G-3
G-1
C-5
C-7
D-8
D-6
D-4
E-3E-5E-7
H-2
H-6
H-8
A-7A-5A-3
F-8
F-6
F-4
F-2
B-4
B-6
B-8
N
1 m
H-4
C-1D-2
E-1 A-1
B-2
C-3
X-1
X-2
X-3
X-4
WL-1 (CP1)WL-3 (S-6)
FY00 CPT Wireline Boreholes
WL-5
WL-6
WL-12
WL-8
WL-11
WL-3a (S-7)
WL-4 (S-8)
WL-7 WL-10
S-3 S-2
S-1WL-9
WL-2(S-5)
FY01 CPT Wireline Boreholes
A
A’
B
B’
Figure 1. Location of Boreholes and Cross Sections at the Vadose Zone Transport Field Study Site
3
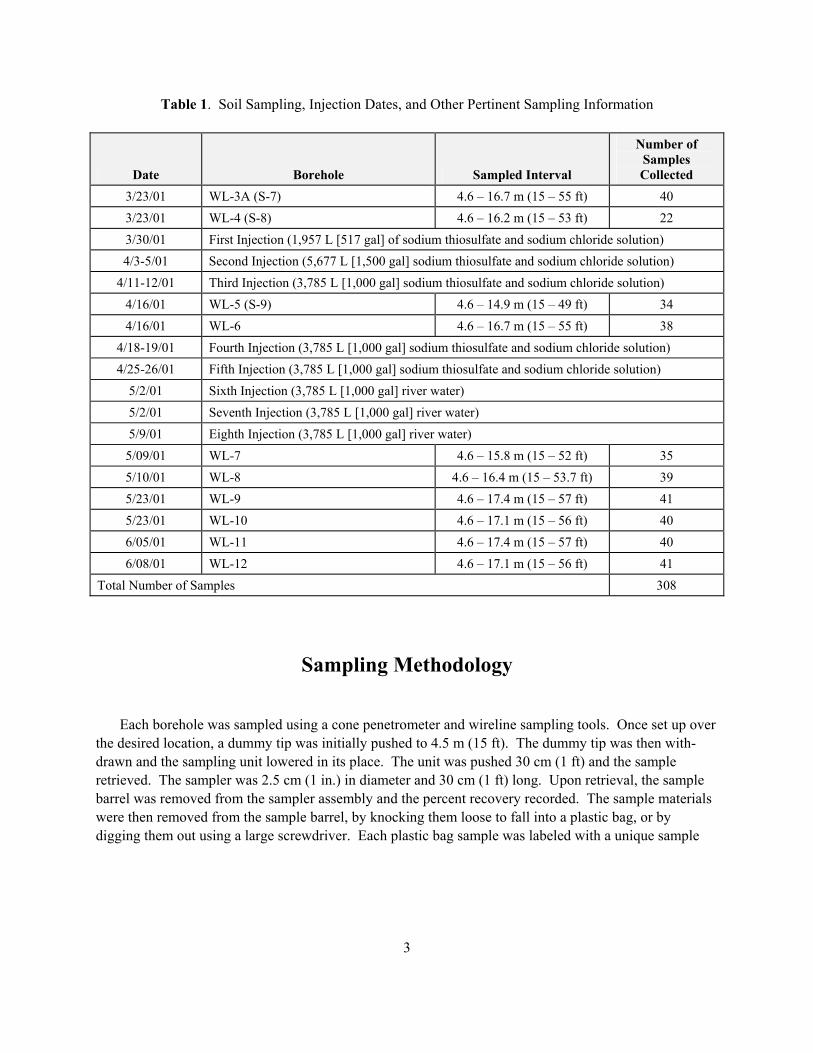
Table 1. Soil Sampling, Injection Dates, and Other Pertinent Sampling Information
Date Borehole Sampled Interval
Number of Samples Collected
3/23/01 WL-3A (S-7) 4.6 – 16.7 m (15 – 55 ft) 40 3/23/01 WL-4 (S-8) 4.6 – 16.2 m (15 – 53 ft) 22 3/30/01 First Injection (1,957 L [517 gal] of sodium thiosulfate and sodium chloride solution) 4/3-5/01 Second Injection (5,677 L [1,500 gal] sodium thiosulfate and sodium chloride solution)
4/11-12/01 Third Injection (3,785 L [1,000 gal] sodium thiosulfate and sodium chloride solution) 4/16/01 WL-5 (S-9) 4.6 – 14.9 m (15 – 49 ft) 34 4/16/01 WL-6 4.6 – 16.7 m (15 – 55 ft) 38
4/18-19/01 Fourth Injection (3,785 L [1,000 gal] sodium thiosulfate and sodium chloride solution) 4/25-26/01 Fifth Injection (3,785 L [1,000 gal] sodium thiosulfate and sodium chloride solution)
5/2/01 Sixth Injection (3,785 L [1,000 gal] river water) 5/2/01 Seventh Injection (3,785 L [1,000 gal] river water) 5/9/01 Eighth Injection (3,785 L [1,000 gal] river water) 5/09/01 WL-7 4.6 – 15.8 m (15 – 52 ft) 35 5/10/01 WL-8 4.6 – 16.4 m (15 – 53.7 ft) 39 5/23/01 WL-9 4.6 – 17.4 m (15 – 57 ft) 41 5/23/01 WL-10 4.6 – 17.1 m (15 – 56 ft) 40 6/05/01 WL-11 4.6 – 17.4 m (15 – 57 ft) 40 6/08/01 WL-12 4.6 – 17.1 m (15 – 56 ft) 41
Total Number of Samples 308
Sampling Methodology Each borehole was sampled using a cone penetrometer and wireline sampling tools. Once set up over the desired location, a dummy tip was initially pushed to 4.5 m (15 ft). The dummy tip was then with-drawn and the sampling unit lowered in its place. The unit was pushed 30 cm (1 ft) and the sample retrieved. The sampler was 2.5 cm (1 in.) in diameter and 30 cm (1 ft) long. Upon retrieval, the sample barrel was removed from the sampler assembly and the percent recovery recorded. The sample materials were then removed from the sample barrel, by knocking them loose to fall into a plastic bag, or by digging them out using a large screwdriver. Each plastic bag sample was labeled with a unique sample

4
number consisting of the borehole number, depth interval, and the date of sample collection. The samples were then placed in an ice chest with blue ice for transport the laboratory. This sampling procedure was similar to that tested in FY 2000.1
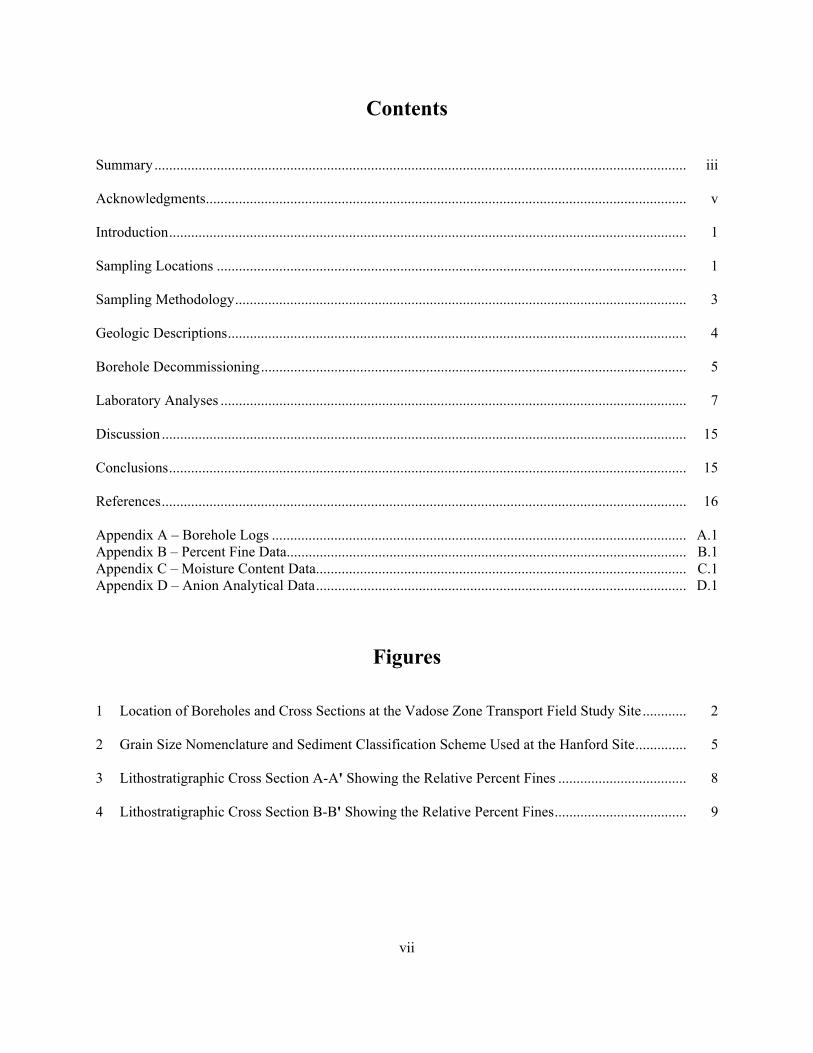
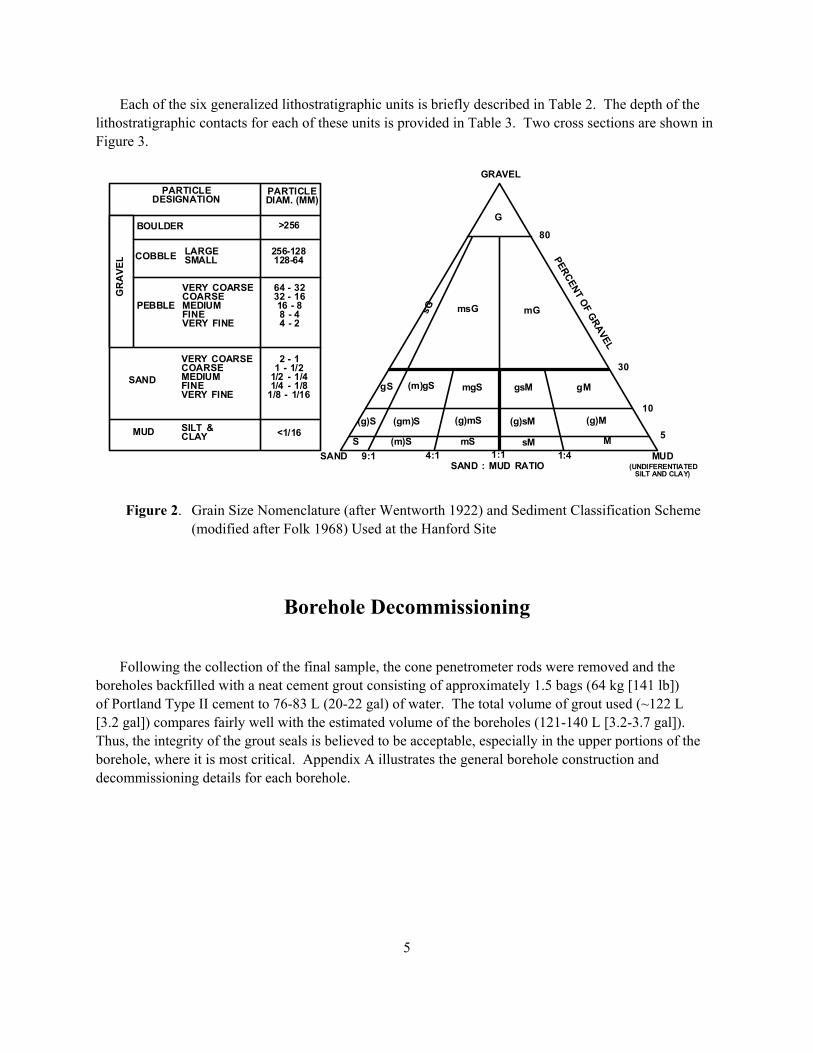
Geologic Descriptions Sample materials were examined both during removal from the sample barrel and again once in the sample bag. The sample materials were generally disaggregated and showed no sedimentary structure. Visual descriptions were made of the moisture content, any residual sedimentary structure, and the dominant grain size(s). Each sample also was subjectively assigned to one of nineteen sediment types based on the modified Folk (1968) and Wentworth (1922) classification scheme historically used at the Hanford Site (Figure 2) and described by Fecht, Last, and Marratt (1978). This information was noted on daily borehole logs in accordance with PNNL procedure PNL-MA-567, DO-1. Where sample recovery was good, a small aliquot was collected from the sample bag and placed in a chip tray for future detailed geologic description in the laboratory. Once back at the laboratory, the chip tray samples were further examined for grain size, color, gross mineralogy/lithology, and reaction to hydrochloric acid, again in accordance with PNNL procedure PNL-MA-567, DO-1 and ASTM D 2488. Detailed borehole logs are presented in Appendix A. Note that the geologic materials above a depth of 4.6 m (15 ft) were not sampled. The materials penetrated below this depth generally consisted of stratified sand deposits, with variable silt content and rare pebbles. Last and Caldwell (2001) reported that these materials were consistent with the third layer (Layer 3) of a sandy sequence described by Reidel and Horton (1999) within the uppermost Hanford formation beneath the southeast portion of 200 East Area. The latest ILAW borehole 299-E24-21 con-firmed the presence of a thick bedded sand sequence from near the surface to ~91.5 m (300 ft) depth. The near continuous nature of the samples and the ability to observe all of the sampled materials, albeit with limited observation of the sedimentary structures, has lead to increased understanding of the nature and continuity of the geologic materials. Last and Caldwell (2001) grouped these materials into eight general lithostratigraphic units. However, the detailed information derived from these new bore-holes suggests that the three middle units described by Last and Caldwell should be combined, resulting in six (not eight) fairly distinct and correlative units. Also, the sediment classification for these units provided by Last and Caldwell has been modified to reflect the newly acquired sieve data (see Section 6).
1 Bratton, Wesley L, and Wilhelmina Dickerson. August 2000. Vadose Zone Transport Field Study, Cone Penetrometer Tests, ERT, Advanced Tensiometer, and Well Installation at the Sisson and Lu Site. ARA Report No. 0099. Applied Research Associates, Inc., Richland, Washington.
5
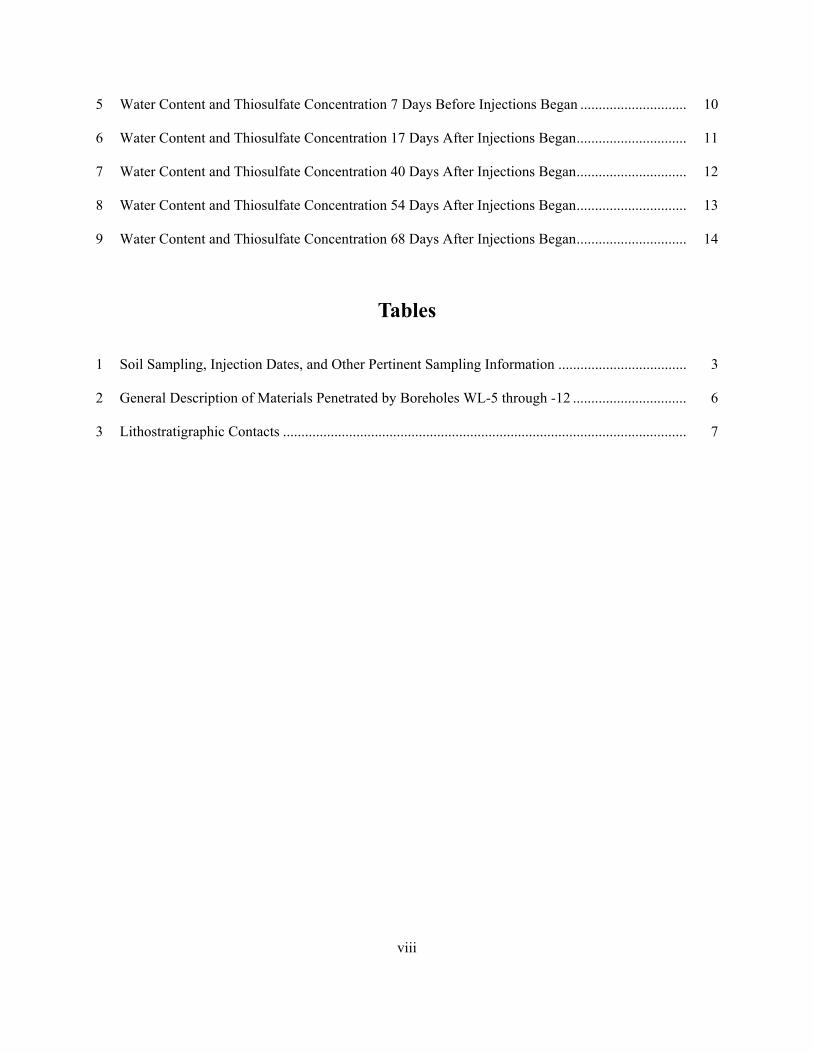
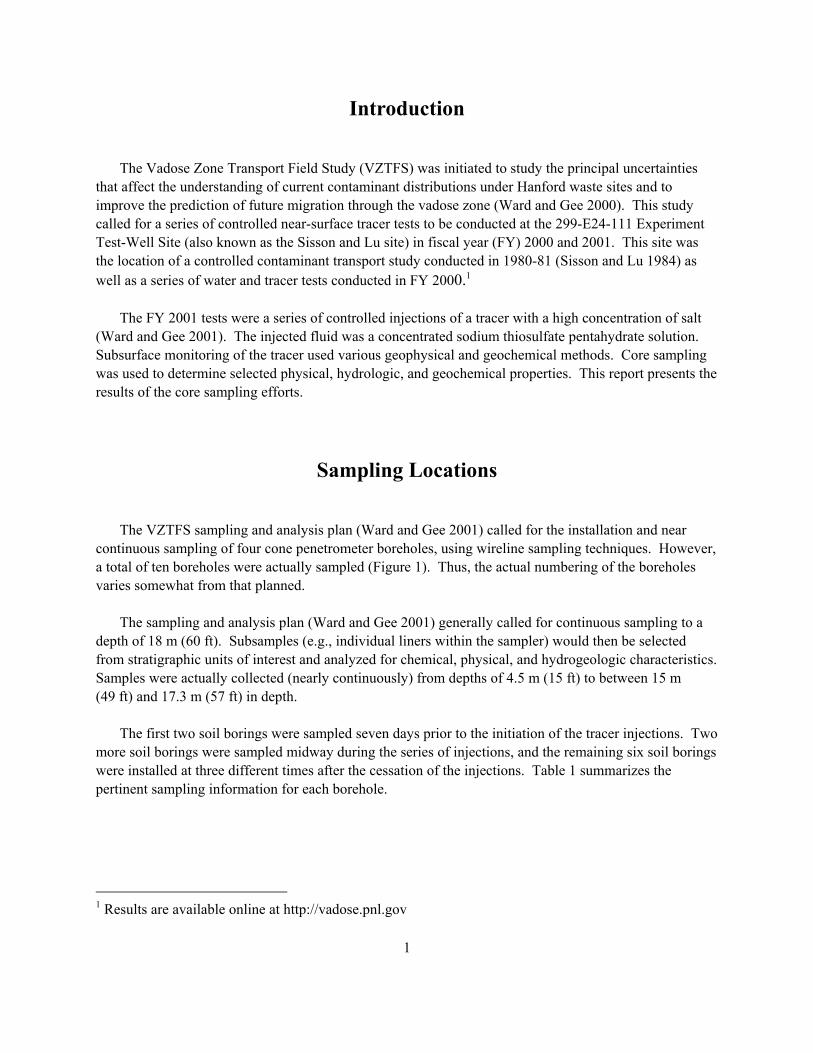
Each of the six generalized lithostratigraphic units is briefly described in Table 2. The depth of the lithostratigraphic contacts for each of these units is provided in Table 3. Two cross sections are shown in Figure 3.
PARTICLEDESIGNATION
PARTICLEDIAM. (MM)
BOULDER
COBBLE LARGESMALL
256-128128-64
VERY COARSECOARSEMEDIUMFINEVERY FINE
VERY COARSECOARSEMEDIUMFINEVERY FINE
PEBBLE
SAND
MUD SILT &CLAY
GR
AVE
L
64 - 3232 - 1616 - 88 - 44 - 2
2 - 11 - 1/2
1/2 - 1/41/4 - 1/8
1/8 - 1/16
<1/16
>256
(UNDIFERENTIATED
5
80
30
10
GRAVEL
G
SAND MUD9:1 4:1 1:1 1:4
sG msG mG
SILT AND CLAY)
PERCENT OF GRAVEL
SAND : MUD RATIO
gS (m)gS mgS gsM gM
(g)S (gm)S (g)mS (g)sM (g)M
S (m)S mS sM M
Figure 2. Grain Size Nomenclature (after Wentworth 1922) and Sediment Classification Scheme (modified after Folk 1968) Used at the Hanford Site
Borehole Decommissioning Following the collection of the final sample, the cone penetrometer rods were removed and the boreholes backfilled with a neat cement grout consisting of approximately 1.5 bags (64 kg [141 lb]) of Portland Type II cement to 76-83 L (20-22 gal) of water. The total volume of grout used (~122 L [3.2 gal]) compares fairly well with the estimated volume of the boreholes (121-140 L [3.2-3.7 gal]). Thus, the integrity of the grout seals is believed to be acceptable, especially in the upper portions of the borehole, where it is most critical. Appendix A illustrates the general borehole construction and decommissioning details for each borehole.

6
Table 2. General Description of Materials Penetrated by Boreholes WL-5 through -12 (modified after Last and Caldwell 2001)
Approximate Depth Range
(m/ft) General Description
Reaction to HCl
(per ASTM D 2488)
% Fines Determined in
Laboratory (Ave. ± 1 SD)
0-4 m (0-13 ft)
UNIT A - GRAVELLY SAND. Not sampled. NA NA
4-6 m (13-19 ft)
UNIT B - POORLY LAMINATED SLIGHTLY MUDDY MEDIUM SAND (CORRELATIVE WITH THE UPPER MOST SAND UNIT DESCRIBED BY LAST AND CALDWELL [2001]). This unit consists of mostly medium sand, generally ranging from coarse to fine sand with an occasional very fine pebble. The sand has been visually described as fairly clean, ranging from virtually no mud (silt) to a trace of mud (silt) and/or very fine sand, however, wet sieving has found an average mud (fines) content of about 15.3 wt%. Sedimentary structures are generally not obvious, with the exception of occasional laminations of coarse and fine sand. A thin (2.5 cm [1in.] thick) very fine sand to silt unit was identified near the bottom of this unit is borehole WL-12. Last and Caldwell (2001) also reported some upward fining sequences. The color is generally light gray with some grayish brown reported by Last and Caldwell (2001). The coarser sand fractions exhibit a “salt and pepper” texture due to the abundance of both mafic and felsic grains. Some micas have also been noted.
None to Strong
15.3 ± 1.8
6-7 m (19-23 ft)
UNIT C - WELL STRATIFIED SLIGHTLY MUDDY TO MUDDY COARSE TO MEDIUM SAND (CORRELATIVE WITH THE UPPER MOST SAND TO SLIGHTLY SITE SAND DESCRIBED BY LAST AND CALDWELL [2001]). This unit is generally about 1.5 m (5 ft) thick, but thins to only thin 0.8 m (2.5 ft) thick in borehole WL-12. It generally consists of coarse or coarse to medium sand stratified with fine to very fine sand in 2.5 to 5 cm (1 to 2") thick layers. The coarser strata are generally light gray to light brownish gray and exhibit the same “salt and pepper” texture described above. However, the finer grained strata are brownish gray to dark grayish brown (when wet). This unit generally contains more mud (fines) than the above unit.
Weak to Strong*
17.2 ± 2.8
7-10 (22-32 ft)
UNIT D - WEAKLY STRATIFIED MEDIUM SAND (CORRELATIVE WITH THE THREE MIDDLE SAND, AND SAND TO SLIGHTLY SILTY SAND UNITS DESCRIBED BY LAST AND CALDWELL [2001]). This unit is generally about 2.4 m (8 ft) thick, but thickens to 3 m (10 ft) in borehole WL-12. This unit generally consists of medium sand which coarsens upward to coarse to medium sand and fines downward to medium to fine sand. Last and Caldwell (2001) broken this unit up into three units. However, evidence from these new boreholes suggests that the variation in materials is gradational, so there is no clear differentiation between where one of these "subunits" ends and another begins. Thus, these materials have been combined into one unit. The upper portion of this unit is generally a weakly laminated, mostly coarse to medium sand exhibiting “salt and pepper” texture. Occasional coarse sand strata (on the order of 2.5 cm [1 in] thick) and scattered very fine pebbles have been observed. The overall color is generally described as light gray to gray, although Last and Caldwell reported some grayish brown to dark grayish brown. These coarser materials appear to grade downward to a lighter color with less mafics, and some mica. The middle portion of this unit is mostly medium or medium to fine sand with an occasional very fine pebble (e.g. WL-9) and some mud. The overall color changes from light gray to brownish gray of even dark grayish brown when wet. Last and Caldwell observed some weakly cemented clods that reacted strongly to HCl. The lower portion of this unit grades downward to medium to fine or fine sand, with some laminations and limonitic staining observed.
None to Strong*
7.8 ± 2.5
10-12 (32-39 ft)
UNIT E - HIGHLY STRATIFIED SLIGHTLY MUDDY TO MUDDY COARSE SAND (CORRELATIVE WITH SAND TO SILTY SAND DESCRIBED BY LAST AND CALDWELL [2001]). This unit is generally 2.1 m (7 ft) thick, thinning to 1.7 m (5.5 ft) at borehole WL-11. The material is highly stratified, consisting of clean (no fines) coarse sand units on the order of 30 cm (1 ft) or more thick, to muddy very fine sand units on the order of 2.5 cm (1 in) thick. One of these muddy sand units is 15 cm (6 in) thick, contains up to ~28% mud (silt + clay), and can be correlated between at least three boreholes (WL-9, -10, -11). Some of the strata contain obvious muddy as well as occasional very coarse sand laminations. Last and Caldwell reported weakly cemented clods that react strongly to HCl near the top of this material. The overall color of this material generally light brownish gray to dark grayish brown (when wet).
Weak to Strong*
18.5 ± 4.7
12-17 (39-56 ft)
UNIT F - SAND TO SLIGHTLY MUDDY SAND. This material is weakly stratified, consisting mostly of coarse and medium sand with variable mud content and scattered pebbles. Strata of coarse to very coarse sand are common. However, fine sand strata are uncommon. Individual strata appear to range on the order of 7 cm (2-3 in) to perhaps as much as 60 cm (2 ft). The overall color generally ranges from light gray to light brownish gray or brownish gray (when wet).
None to Strong*
12.6 ± 2.4
*Note: Reaction to HCl may have been at least partially in response to the presence of the sodium thiosulfate and sodium chloride tracer.

7
Table 3. Lithostratigraphic Contacts
Depth to Top of Lithostratigraphic Unit (m [ft]) Borehole Unit A Unit B Unit C Unit D Unit E Unit F
WL-3A (S-7) 0 NA 5.8 (19) 7.3 (24) 9.8 (32) 11.9 (39) WL-4 (S-8) 0 NA 5.8 (19) 6.6 (21.5) 9.6 (31.5) 11.6 (38) WL-5 (S-9) 0 NA 5.8 (19) 7.3 (24) 9.8 (32) 11.9 (39) WL-6 0 NA 5.8 (19) 7.3 (24) 9.8 (32) 11.9 (39) WL-7 0 NA 5.8 (19) 7.3 (24) 9.8 (32) 11.9 (39) WL-8 0 NA 5.8 (19) 7.3 (24) 9.8 (32) 11.9 (39) WL-9 0 NA 5.8 (19) 7 (23) 9.8 (32) 11.6 (38) WL-10 0 NA 5.8 (19) 7 (23) 9.8 (32) 11.9 (39) WL-11 0 NA 5.8 (19) 7 (23) 9.9 (32.5) 11.6 (38) WL-12 0 NA 5.8 (19) 6.6 (21.5) 9.6 (31.5) 11.6 (38)
NA = Not available because sampling began at 15' depth within Unit B.
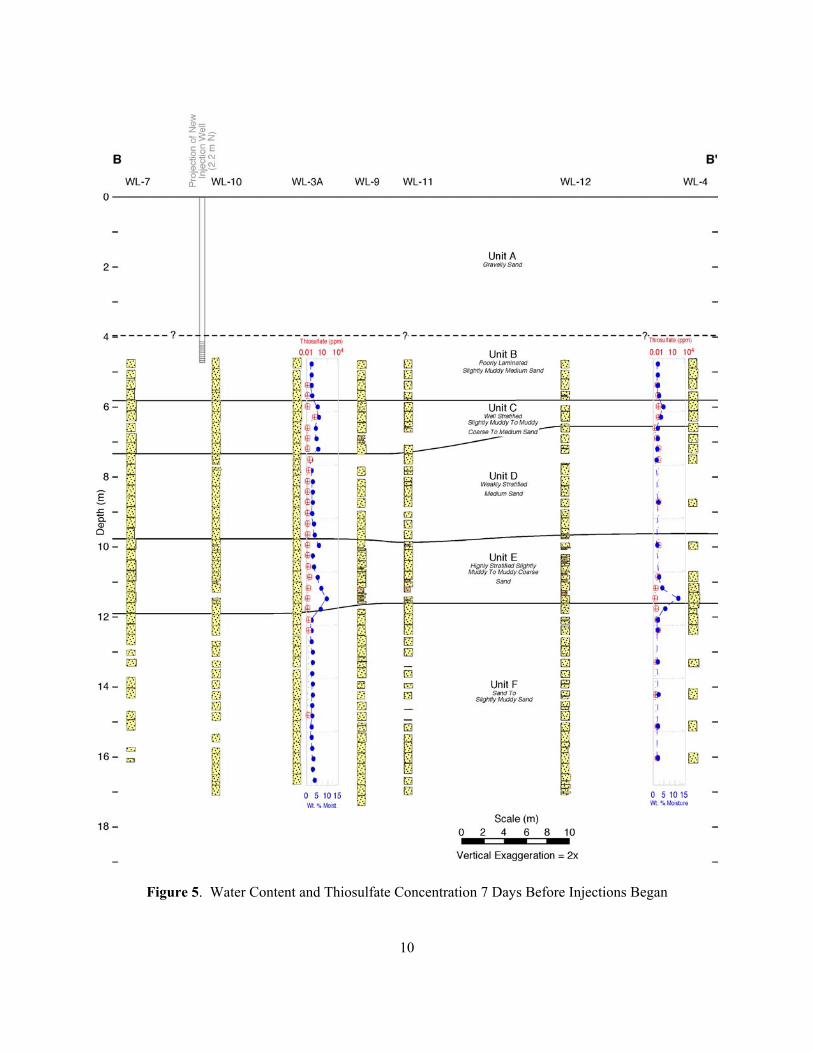
Laboratory Analyses Laboratory analyses consisted of water content, percent fine material, and tracer concentration. Percent fines (silt and clay fraction) were determined by wet sieving through a #270 sieve (0.053 mm). Results are presented in Appendix B. The gravimetric water content (gwater/gsoil) was determined by weight loss after oven drying at 105°C for 24 hrs per PNNL procedures (PNL-MA-567-S7 Water Content). Approximately 200 g of soil from each sub-sample was transferred into containers and prepared for moisture content measurements. Tare and soil weights were recorded before and after the samples were dried. Results are presented in Appen-dix C. The remaining portions of each sub-sample (after removal of the 100 g for moisture content) also were oven dried overnight and used for the tracer analyses. Tracer analyses were conducted using 1:1 extracts of soil/water (Methods of soil analysis, part 2; 62-1.3.2.2), and ionic chromatography (IC) analysis using method (IC-2 PNL Test Method for anions in water by ion chromatography). For the extractions, 50 g of both soil and deionized (DI) water were meas-ured and placed in containers. The containers were closed and put on a mechanical shaker for 2 hours. After 2 hours, the shaker was stopped and the extracts were allowed to settle overnight. The water was then decanted into centrifuge tubes and placed in a centrifuge for 30 minutes. The samples were then filtered through a 0.45 µm syringe filter in preparation for IC analysis. A 10 ml aliquot of each filtered solution was added to scintillation vials and sent for IC analysis. The primary constituents of interest were chloride, bromide, and thiosulfate. Analytical results for all samples are presented in Appendix D. Figures 5 through 9 illustrate the water content and tracer concentrations for five different time slices.

8
Figure 3. Lithostratigraphic Cross Section A-A' Showing the Relative Percent Fines (See Figure 1 for location of cross sections.)

9
Figure 4. Lithostratigraphic Cross Section B - B' Showing Relative Percent Fines (See Figure 1 for location of cross sections.)
10
Figure 5. Water Content and Thiosulfate Concentration 7 Days Before Injections Began

11
Figure 6. Water Content and Thiosulfate Concentrations 17 Days After the Injections Began

12
Figure 7. Water Content and Thiosulfate Concentrations 40 Days After Injections Began

13
Figure 8. Water Content and Thiosulfate Concentrations 54 Days After Injections Began
14
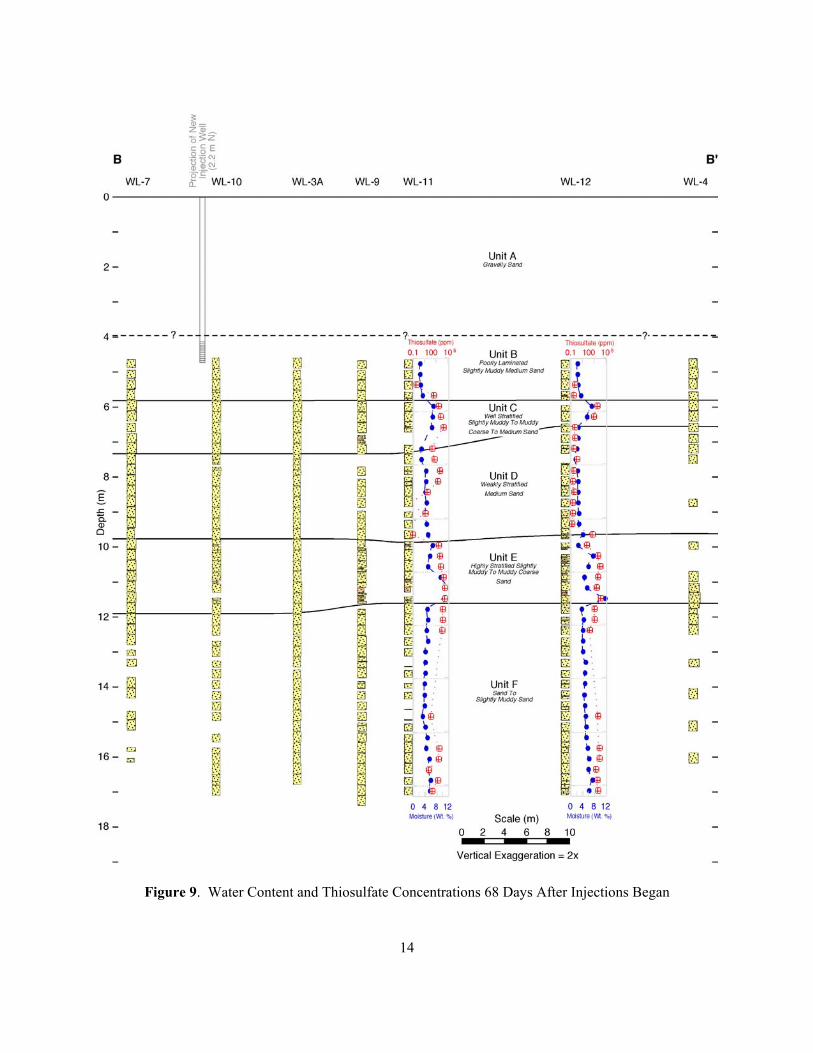
Figure 9. Water Content and Thiosulfate Concentrations 68 Days After Injections Began

15
Discussion Figures 5 through 9 illustrate the water content and thiosulfate concentration profiles before, during, and after the series of injections. These results indicate that by 17 days after the injections began, the thiosulfate tracer had penetrated to depth of at least 10.1 m (33 ft). The greatest amount of lateral spreading appears to have taken place along the contact between units B and C, with the tracer extending laterally at least 4.3 m (14 ft) from the point of injection. Forty days after the injections began the tracer had penetrated to a depth of at least 11.6 m (38 ft), and had spread laterally at least 5 m (16.4 ft) within unit C as well as along the contact between units D and E. Within 54 days, the tracer had penetrated to a depth of at least 12.5 m (41 ft). Sixty-eight days after the injections began, and 30 days after injections were terminated, the tracer had penetrated to a depth of at least 16.9 m (55.5 ft). Lateral spreading exceeded 5.8 m (19 ft) in both fine grained units C and E as well as the deepest unit (unit F).
Conclusions Over 300 soil samples were collected from ten soil borings installed to gather data from the second (FY 2001) tracer injection test conducted at the Sission and Lu (299-E24-111 Experimental Test Well) site in support of the VZFTS. The first two soil borings were sampled 7 days prior to the initiation of the tracer injections. Two more soil borings were sampled midway during the series of injections, and the remaining six soil borings were installed at three different times after the cessation of the injections. All soil samples were collected using a cone penetrometer and wireline sampling tools with a 2.5 cm (1 in.) diameter and 30 cm (1 ft) long sampling tube. The samples generally ranged in depth from 4.6 to 17.4 m (15 to 57 ft). Selected samples were analyzed for percent fines, moisture content, and/or tracer analyses. Preliminary results indicate that the major concentration front of the thiosulfate tracer reached a relative depth of at least 5.5 m (18 ft) below the injection point 17 days after the tracer injections began and had migrated to a relative depth of at least 12.3 m (40.5 ft) 51 days later. Lateral spreading appears to have exceeded 5.8 m (19 ft) even at the deepest points of migration. These data will be used in combination with other geophysical and geochemical results to further our understanding of contaminant transport within the vadose zone.
16
References ASTM – American Society for Testing and Materials. 1993. “Standard Practice for Description and Identification of Soils (Visual-Manual Procedure D2488)” Annual Book of ASTM Standards, Philadelphia, Pennsylvania. Fecht, K. R., G. V. Last, and M. C. Marratt. 1978. Granulometric Data, 216-A Crib Facilities Monitoring Well Sediments. RHO-LD-44. Rockwell Hanford Operations, Richland, Washington. Folk, R. L. 1968. Petrology of Sedimentary Rocks. University of Texas, Austin, Texas. Last, G. V. and T. G. Caldwell. 2001. Core Sampling in Support of the Vadose Zone Transport Field Study. PNNL-13454. Pacific Northwest National Laboratory, Richland, Washington. Reidel, S. P. and D. G. Horton. 1999. Geologic Data Package for 2001 Immobilized Low-Activity Waste Performance Assessment. PNNL-12257, Rev. 1. Pacific Northwest National Laboratory, Richland, Washington. Sission, J. B. and A. H. Lu. 1984. Field calibration of computer models for application to buried liquid discharges: A status report. RHO-ST-46P. Rockwell Hanford Operations, Richland, Washington. Ward, A. L. and G. W. Gee. 2000. Vadose Zone Transport Field Study: Detailed Test Plan for Simulated Leak Tests. PNNL-13263. Pacific Northwest National Laboratory, Richland, Washington. Ward, A. L. and G. W. Gee. 2001. Vadose Zone Transport Field Study: FY 2001 Test Plan. PNNL-13451, Rev. 1. Pacific Northwest National Laboratory, Richland, Washington. Wentworth, C. K. 1922. “A Grade Scale and Class Terms for Clastic Sediments” in Journal of Geology, Vol. 30, p 377-392.

Appendix A
Borehole Logs

Boring/Well No Depth Date
Location Project of
Logged by T. G. Caldwell Drilling ContractoApplied Research Assoc.Print Sign Print Sign
Reviewed by Date Driller Willi Dickerson / John MayhewPrint Sign
Lithologic Class. Scheme Folk/Wentworth Procedure PNL-MA-567, DO-1 Rev 1 Rig/MethodCPT with Wire Line Sampler
Steel Tape/E-Tape NA / NA Field Indicator Equip. 1) NA 2) NA Depth Control PointGround Surface
C Z S G 6" 3" 0 3" 6"
Sampler bound at 15.5 ft (recovered sluff).
Broke tube's threads.
WL
SAND. Coarse sand and pea gravel, w/ fines
SAND. Coarse w/ fines, salt & pepper textur
SAND. Fine to medium.
8.08.59.09.5
DRILLING AND COMPLETION COMMENTS(drilling rate, down time, blow counts,
water level, drill fluid, casing, seals, etc.)
CASINGLOG
1.52.0
1.0
LITHOLOGIC DESCRIPTION(particle size distribution, sorting, mineralogy,
roundness, color, reaction to HCl, etc.)
DEPTH
( Ft )
TIME MOIS-TURE
11.0
2.53.03.54.04.55.0
6.06.5
0.50.0
SAND. Fine to medium.
SAND. Fine.
7.5
5.5
10.010.5
7.0
100%
11.5
NAMETYPERECOVERY
SAMPLES COLORGRAPHICLOG
MUNSELL CODE
12.0
13.012.5
13.514.014.5
15.5 11:00 WL15.0
SAND. Fine.
Reran sampler, very fine material.
16.5 WL 90% Grout at top.
18.0
16.0
17.5 100% D17.0
18.5 WL W
19.519.0
WL 100%
SAND. Fine to medium.
21.0
22.0SAND. Fine to medium.1/2 moist (upper)21.5 WL 100%
20.5 100% M-WWL20.0
W
D?
SAND. Fine sand over medium salt & pepper
M
23.0
24.0
22.5 100%WL
23.5 WL 100% SAND. Medium. Salt & pepper texture. Very
Sheet
1 1
LBNL Sample (80%)
Pacific NorthwestNational Laboratory
BOREHOLE LOG
WL-3A (S-7) 0-55'
Sisson & Lu Site, 200 East Area VZTF Study
3/23/2001
24.5 WL 100%
25.5 WL 100%25.0
26.5 WL 100% LBNL Sample (80%).26.0
27.027.5 WL 100%28.028.5 WL 100%
29.5 SAND. Fine. LBNL Sample.29.0
30.5
100%
WL SAND. Fine.
WL30.0
100%31.0
Ground SurfaceHole is located near H2.With Jason Ritter. See Todd notes in Lab.
31 5 WL 100% SAND Fine
2" ID Borehole.
HCl REACTIO
N
SAND. 1/2 Salt & pepper, 1/2 fine sand.
SAND. Fine.
SAND. Fine, w/salt & pepper texture.
Not Sampled.
book.
SAND. Salt & pepper texture. Very moist.
A.1

Note: Lithologic description based on field examination of chip sample as well as later examination in the laboratory
W = Wet, M = Moist, D = Dry 2000/GVL/GW-VZ S&T/001
LBNL Sample.
LBNL Sample.
SAND. Fine, salt & pepper.
SAND. Fine to medium, salt & pepper.
SAND. Fine, salt & pepper.
SAND. Fine sand w/fines.
SAND. Fine to medium, salt & pepper, suban
SAND. Fine to medium.
SAND. Fine.
SAND. Fine to medium, subangular.
SAND. Fine.
SAND. Fine, salt & pepper.
SAND. Medium, salt & pepper.
SAND. Fine to medium.
52.0
SAND. Fine to medium, subangular.
50.050.551.051.5
47.548.048.5
49.549.0
45.546.046.547.0
LBNL Sample (80%)M-W36.5 100% SAND. Fine to coarse. Very moist.
SAND. Medium.Neet Cement grout.
WL 100%35.0
36.035.5
SAND. Coarse w/clay.37.0
WL
M-W LBNL Sample (80%)
SAND. Medium to coarse.38.038.5 WL 100%
100% D SAND. Medium.WL
41.041.542.042.543.043.544.044.545.0
39.540.040.5
LBNL Sample.
39.0M-W
37.5 WL 100%
60.0
58.559.059.5
57.558.0
54.5
52.553.053.554.0
57.0
55.0
SAND. Fine to medium, subangular.
SAND. Fine to medium, subangular.
WL 100%
WL 90%
WL 100%
WL 100%
WL 80%
WL 100%
WL 100%
WL 100%
WL 100%
WL 100%
WL 100%
WL 100%
WL 100%
WL 100%
13:30 WL 100%
55.556.056.5
A.2

Boring/Well No Depth Date
Location Project of
Logged by T. G. Caldwell Drilling ContractoApplied Research Assoc.Print Sign Print Sign
Reviewed by Date Driller Willi Dickerson / John MayhewPrint Sign
Lithologic Class. Scheme Folk/Wentworth Procedure PNL-MA-567, DO-1 Rev 1 Rig/MethodCPT with Wire Line Sampler
Steel Tape/E-Tape NA / NA Field Indicator Equip. 1) NA 2) NA Depth Control PointGround Surface
C Z S G 6" 3" 0 3" 6"
book.
SAND. Medium. Moist.
SAND. Fine.
Not Sampled.
SAND. Fine.
Not Sampled.
HCl REACTIO
N
2" ID Borehole.
31 531.0
Ground SurfaceHole is located near H8.With Jason Ritter. See Todd notes in Lab.
Not Sampled.30.030.5
29.5 LBNL Sample (80%)29.0
28.028.5 WL 75%
27.527.026.526.025.525.024.5 WL 90%
Pacific NorthwestNational Laboratory
BOREHOLE LOG
WL-4 (S-8) 0-53'
Sisson & Lu Site, 200 East Area VZTF Study
3/23/2001
LBNL Sample (80%).
Sheet
1 1
90% SAND. Fine to medium.
22.5 80% DWL
23.5 WL23.0
24.0
SAND. Medium, subangular.
20.5 100% MWL20.0
21.0
22.0SAND. Fine to medium.21.5 WL 80%
18.0
19.519.0
WL
18.5 WL
17.5 WL 100%17.0
SAND. Fine to medium.16.5 WL 100%16.0
90%15.5 14:30 WL SAND. Fine.15.0
14.014.5
13.5
12.0
13.012.5
SAMPLES COLORGRAPHICLOG
MUNSELL CODE NAMETYPERECOVERY
100%
SAND. Fine.
7.5
5.5
0.50.0
10.010.511.0
2.53.03.54.04.55.0
DRILLING AND COMPLETION COMMENTS(drilling rate, down time, blow counts,
water level, drill fluid, casing, seals, etc.)
CASINGLOG
1.52.0
1.0
LITHOLOGIC DESCRIPTION(particle size distribution, sorting, mineralogy,
roundness, color, reaction to HCl, etc.)
DEPTH
( Ft )
TIME MOIS-TURE
6.06.57.0
80%
11.5
8.08.59.09.5
SAND. Medium to fine w/salt & pepper textu
SAND. Fine to medium.
A.3

Note: Lithologic description based on field examination of chip sample as well as
W = Wet, M = Moist, D = Dry 2000/GVL/GW-VZ S&T/001
55.556.0
15:50 WL 100% D
WL 100% D
WL 100% D
WL 100%
WL 100%
57.558.0
54.5
52.553.053.554.0
56.557.0
55.0
60.0
58.559.0
49.0
39.0
later examination in the laboratory
39.540.040.541.041.542.042.543.043.544.044.545.0
100% D SAND. Medium, salt & pepper. Dry.D SAND. Fine. Dry.
WL
W SAND. Coarse. Wet.38.038.5 WL 100%
SAND. Very coarse w/clay. Moist.M
WL
37.5 WL 100%37.0
WL
35.0
36.035.5 100%
Neet Cement grout.SAND. Fine to medium, subangular.
36.5 90% M
45.546.046.547.047.548.048.5
59.5
49.550.050.551.051.552.0
SAND. Coarse fragments w/many fines.
SAND. Medium to fine, subangular.
Not Sampled.
SAND. Fine to medium. Some pebble fragme
SAND. Fine. Dry.
Not Sampled.
SAND. Fine. Dry.
SAND. Fine. Dry.
Not Sampled.
Not Sampled.
Called hole.
LBNL Sample (80%)
A.4

Boring/Well No Depth Date
Location Project of
Logged by T. G. Caldwell (In the field) G. V. Last (In the lab.) Drilling ContractoApplied Research Assoc.Print Sign Print Sign
Reviewed by Date Driller Wes Bratton/ Willi DickersonPrint Sign
Lithologic Class. Scheme Folk/Wentworth Procedure PNL-MA-567, DO-1 Rev 1 Rig/MethodCPT with Wire Line Sampler
Steel Tape/E-Tape NA / NA Field Indicator Equip. 1) NA 2) NA Depth Control PointGround Surface
C Z S G 6" 3" 0 3" 6"
light brownish
100% 2.5Y6/2
2.5Y6/2
2.5Y6/2
SAND. Fine to coarse.
M SAND. Fine to medium.
4.55.0
10.010.5
7.5
5.56.06.57.0
2.53.03.54.0
DRILLING AND COMPLETION COMMENTS
(drilling rate, down time, blow counts,water level drill fluid casing seals etc )
CASINGLOG
1.52.0
1.0
LITHOLOGIC DESCRIPTION(particle size distribution, sorting, mineralogy,
roundness, color, reaction to HCl, etc.)
DEPTH
( Ft )
TIME MOIS-TURE
11.011.5
8.08.59.09.5
TYPERECOVERY
0.00.5
MUNSELL CODE NAME
Not Sampled.
100%
100%
SAMPLES DRY (MOIST) COLORGRAPHICLOG
12.0
13.012.5
13.514.014.515.0 8:2715.5 WL 75% SAND. Fine to medium (salt and pepper).16.0
SAND. Fine (some salt and pepper).16.5 WL 80% 2.5Y7/1
17.5 WL17.0
SAND. Fine (some salt and pepper).90%18.0
19.5 M-W19.018.5
2.5Y6/1
light brownish
SAND. Fine to coarse. Poorly sorted.
light brownishgray
21.0
22.0
SAND. Fine to very coarse.
21.5 WL
Mostly medium to coarse sand.20.5 100% M-WWL20.0
D-M Mostly medium, some coarse
M
SAND. Medium to coarse.
SAND. Fine to medium (salt and pepper).
M (W)
23.0
24.0
22.5 100%
23.5 WL 100%
Sheet
1 1
gray
Pacific NorthwestNational Laboratory
BOREHOLE LOG
WL-5 (S-9) 0-49'
Sisson & Lu Site, 200 East Area VZTF Study
4/16/2001
D-M SAND. Medium to coarse (salt and pepper)24.5 WL 90%25.025.5 WL 90% D-M SAND. Medium (less salt and pepper)26.026.5 WL 100% M SAND. Fine to medium.27.027.5 WL 100% D-M SAND. Fine to medium.28.028.5 WL 100% M-W SAND. Fine to coarse.
29.5 WL 100% SAND. Fine to medium.29.0
D-M
30.5 100% D-M SAND. Fine to medium.30.0
31.0
Ground SurfaceTodd Caldwell and Jason Ritter collected and described the samples in the field.
Hole is located near S-5.
Mostly medium sand.31 5 WL 100% D SAND Fine to medium (some salt and peppe
WL
WL
WL
WL
2" ID Borehole.
HCl REACTIO
N
2.5Y6/2
2.5Y7/1
light gray
light brownish
gray
gray
light gray
gray
weak tostrong
weak
weak
weak tostrongstrong
weak
weak tostrong
Refer to Todd's notes in lab. book.
A.5

Boring/Well No Depth Date
Location Project of
Logged by T. G. Caldwell (In the field) G. V. Last (In the lab.) Drilling ContractoApplied Research Assoc.Print Sign Print Sign
Reviewed by Date Driller Wes Bratton/ Willi DickersonPrint Sign
Lithologic Class. Scheme Folk/Wentworth Procedure PNL-MA-567, DO-1 Rev 1 Rig/MethodCPT with Wire Line Sampler
Steel Tape/E-Tape NA / NA Field Indicator Equip. 1) NA 2) NA Depth Control PointGround Surface
C Z S G 6" 3" 0 3" 6"
DRILLING AND COMPLETION COMMENTS
(drilling rate, down time, blow counts,water level drill fluid casing seals etc )
CASINGLOG
LITHOLOGIC DESCRIPTION(particle size distribution, sorting, mineralogy,
roundness, color, reaction to HCl, etc.)
DEPTH
( Ft )
TIME MOIS-TURE
TYPERECOVERY MUNSELL CODE NAME
SAMPLES DRY (MOIST) COLORGRAPHICLOG
Sheet
1 1Pacific Northwest
National LaboratoryBOREHOLE
LOGWL-5 (S-9) 0-49'
Sisson & Lu Site, 200 East Area VZTF Study
4/16/2001
HCl REACTIO
N
W = Wet, M = Moist, D = Dry 2000/GVL/GW-VZ S&T/001
odor observed after applying HCl - likely due to presence of sodium thiosulfate
100%
D
M
WL
100%
100%
WL D
WL
100%
40%
D
WL D
100%
80%
WL
WL
WL
WL
SAND. Fine to medium.
WL 100%
SAND. Fine to medium (some salt and peppe Some VC sand to VF pebble.
Some VC sand to VF pebble.D
D
SAND. Fine to medium (salt and pepper) Some VF pebble. Pinkish color on some g
2.5Y7/1
light gray2.5Y7/1 weak
SAND. Medium, some coarse. 2.5Y7/1 weak
SAND. Medium, some coarse. 2.5Y7/1 weak
SAND. Fine to medium.
2.5Y7/2 Poorly sorted coarse to fine sandSAND. Medium, some coarse.
48.549.049.550.0
46.547.047.548.0
44.545.045.546.0
42.543.043.544.0
Neet cement grout.
36.5 100% D
SAND. Medium, some coarse.WL 100% D35.0
36.035.5
WL37.037.5 WL 100% D-M SAND. Medium, some coarse.
M-W SAND. Medium w/clay38.038.5 WL 100%
100% D SAND. Fine to medium. Coarse to fine sand, some silt
Mostly M-F sand, some VF pebble.SAND. Fine to medium.
SAND. Medium, some coarse.
SAND. Medium, some coarse (salt and peppe
39.540.040.541.041.542.0
WL39.0
2.5Y6/2
light gray
light brownishgray
light gray
light gray
light gray
Note: Lithologic description based on field examination of chip sample as well as later examination in the laboratory. H2S
weak
weak
weak
60.0
58.5
59.5
50.551.051.552.052.553.053.5
56.5
55.0
56.0
54.054.5
55.5
57.5
59.0
57.0
58.0
9:50 Dirt in hole. End.
A.6

Boring/Well No Depth Date
Location Project of
Logged by T. G. Caldwell (In the field) G. V. Last (In the lab.) Drilling ContractoApplied Research Assoc.Print Sign Print Sign
Reviewed by Date Driller Wes Bratton/ Willi DickersonPrint Sign
Lithologic Class. Scheme Folk/Wentworth Procedure PNL-MA-567, DO-1 Rev 1 Rig/MethodCPT with Wire Line Sampler
Steel Tape/E-Tape NA / NA Field Indicator Equip. 1) NA 2) NA Depth Control PointGround Surface
C Z S G 6" 3" 0 3" 6"
weak tostrong
none
strongweaklight gray
2.5Y7/1
light brownish
gray
light brownish
light brownishgray
gray2.5Y6/2
10YR7/1
HCl REACTIO
N
2" ID Borehole.
WL
WL
WL
31 5 WL 100% D-M SAND Fine31.0
Ground SurfaceTodd Caldwell and Jason Ritter collected and described the samples in the field.
Poorly sorted, some very fine sand to silt.30.030.5 100% D-M
SAND. Fine to medium (salt and pepper)
SAND. Fine.
light brownish
Neet cement grout.
2.5Y6/2D100%29.029.5 WL
D SAND. Fine to medium (salt and pepper)28.5 WL 100%
D SAND. Medium, some fine and coarse.28.027.5 WL 100%
D SAND. Fine, some medium.27.026.5 WL 100%
SAND. Medium to fine (little salt and pepper26.025.5 WL 100%25.024.5 WL 100%
light gray
Pacific NorthwestNational Laboratory
BOREHOLE LOG
WL-6 0-55'
Sisson & Lu Site, 200 East Area VZTF Study
4/16/2001
2.5Y6/2 weaklight brownish
Sheet
1 1
23.5 WL 100%
22.5 100% M23.0
24.0
grayM
SAND. Medium to coarse.
D SAND. Medium to fine (little salt and pepper
D
SAND. Medium to coarse. Mostly medium, very little coarse, some fin
M
Some very fine sand to silt.20.5 100% M-WWL20.0
SAND. Medium to coarse (salt and pepper).
SAND. Medium, some coarse (salt and peppeWL 100% Fairly well sorted, very little silt.
weak2.5Y6/2
18.0
19.5 M-W19.0
2.5Y7/2
18.5 WL D 3rd run.light gray weak to
17.5 Skipped.17.016.5 11:00 No good.16.015.5 10:41 WL 30% Grouty, not a good sample, pulling pipe.15.014.514.013.5
12.5
SAMPLES DRY (MOIST) COLORGRAPHICLOG
NAME
Not Sampled.
TYPE MUNSELL CODERECOVERY
4.55.0
10.5
5.56.06.57.0
2.53.03.54.0
0.00.5
DRILLING AND COMPLETION COMMENTS
(drilling rate, down time, blow counts,water level drill fluid casing seals etc )
CASINGLOG
1.52.0
1.0
LITHOLOGIC DESCRIPTION(particle size distribution, sorting, mineralogy,
roundness, color, reaction to HCl, etc.)
DEPTH
( Ft )
TIME MOIS-TURE
7.5
11.5
8.08.59.09.5
10.0
SAND. Medium. Very poorly sorted with70%
11.0
12.0
13.0
SAND. Medium to coarse (salt and pepper). lots of very fine sand to silt, and some coar
100%
21.0
22.021.5
weak
weak
2 5Y6/2
Refer to Todd's notes in lab. Book.
A.7
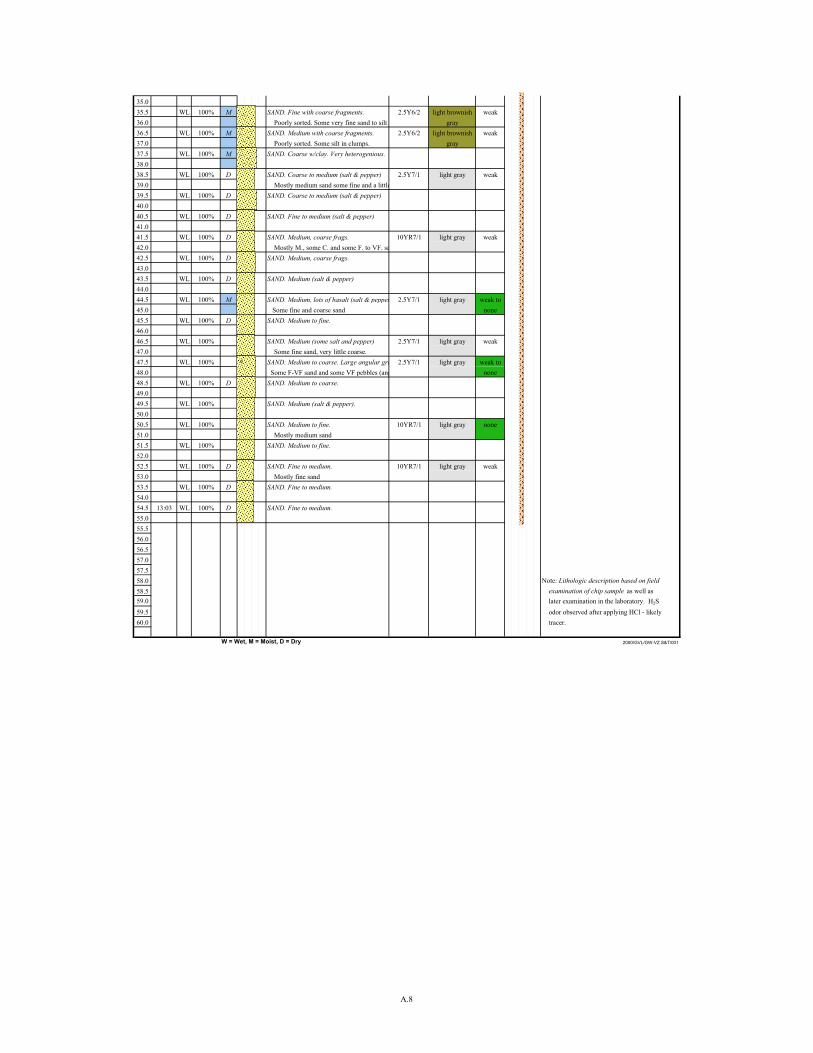
Note: Lithologic description based on field examination of chip sample as well as later examination in the laboratory. H2S odor observed after applying HCl - likely
W = Wet, M = Moist, D = Dry 2000/GVL/GW-VZ S&T/001
100%
100%
100%
100%
100%
100%
100%
D
tracer.
weak
weak2.5Y7/1
2.5Y6/2
light gray
light brownishgray
2.5Y6/2 light brownishgray
39.039.540.040.5
Mostly medium sand some fine and a littleWL 100% D
100%
SAND. Coarse to medium (salt & pepper)38.038.5 WL 100%
M Poorly sorted. Some silt in clumps.SAND. Coarse w/clay. Very heterogenious.37.5 WL
WL
WL35.0
36.035.5
Poorly sorted. Some very fine sand to silt100% M
10YR7/1 weak
none
100% SAND. Medium with coarse fragments.
44.0
47.5
36.5
49.0
weak
46.547.0
43.5 D
41.041.542.042.5 100%43.0
37.0100%
WL
100%
48.5
44.545.045.546.0
48.0
SAND. Fine to medium (salt & pepper)
SAND. Medium, coarse frags. 10YR7/1 light gray weak Mostly M., some C. and some F. to VF. sa
weak tolight gray2.5Y7/1none
weaklight gray2.5Y7/1
weak tolight gray
Mostly medium sandSAND. Medium to fine.
SAND. Fine to medium. light gray
10YR7/1 light gray
SAND. Medium (salt & pepper).
SAND. Medium to fine.
Some F-VF sand and some VF pebbles (ang none2.5Y7/1
Some fine and coarse sand
SAND. Medium (some salt and pepper) Some fine sand, very little coarse.
100%
100%
WL
WL 100% SAND. Medium, lots of basalt (salt & pepperM
SAND. Medium (salt & pepper)
100%
WL
SAND. Medium to coarse. Large angular gra
SAND. Medium to fine.
WL
55.0
49.550.050.551.051.552.052.553.053.5
54.554.0
SAND. Coarse to medium (salt & pepper)
SAND. Medium, coarse frags.
SAND. Medium to coarse.
WL
D
D
M
SAND. Fine with coarse fragments.
D
WL
WL 100%
D
WL D
WL
D
D
D
WL
WL
WL
WL
WL
Mostly fine sandSAND. Fine to medium.
SAND. Fine to medium.
56.557.0
58.5
55.556.0
57.558.0
59.059.560.0
13:03
A.8
Boring/Well No Depth Date
Location Project of
Logged by T. G. Caldwell (In the field) G. V. Last (In the lab.) Drilling ContractoApplied Research Assoc.Print Sign Print Sign
Reviewed by Date Driller Wes Bratton / John MayhewPrint Sign
Lithologic Class. Scheme Folk/Wentworth Procedure PNL-MA-567, DO-1 Rev 1 Rig/MethodCPT with Wire Line Sampler
Steel Tape/E-Tape NA / NA Field Indicator Equip. 1) NA 2) NA Depth Control PointGround Surface
C Z S G 6" 3" 0 3" 6"
Not Sampled.
SAND. Fine-medium, some salt&pepper.
SAND. Coarse, subangular, salt/pep. Very w
SAND. Medium-coarse, salt&pepper, less we
SAND. Medium-fine.
SAND. Medium-fine.
SAND. Fine-medium, less damp.
SAND. Fine-medium.
100%
SAND. Fine w/coarse, subangular, very wet.
SAND. Coarse, subangular, salt/pep. Very w
4.55.0
10.010.5
7.5
5.56.06.57.0
2.53.03.54.0
DRILLING AND COMPLETION COMMENTS(drilling rate, down time, blow counts,
water level, drill fluid, casing, seals, etc.)
CASINGLOG
1.52.0
1.0
LITHOLOGIC DESCRIPTION(particle size distribution, sorting, mineralogy,
roundness, color, reaction to HCl, etc.)
DEPTH
( Ft )
TIME MOIS-TURE
11.011.5
8.08.59.09.5
TYPERECOVERY
0.00.5
MUNSELL CODE NAME
SAMPLES COLORGRAPHICLOG
12.0
13.012.5
13.5
15.014.514.0
15.5 15:10 80% SAND. Fine-medium, some fines, some salt Possible slough. Had to pull rods at 14' and redo.
16.5 80% D16.0
light gray17.0
SAND. Fine-medium, some salt&pepper.
17.5 90% stronglight grayD
18.5 W100% gray weak-2.5Y6/1strong
18.0
19.5 W19.0
2.5Y6/2
2.5Y6/2
2.5Y6/2
21.0
22.0SAND. Medium, some coarse fragments. Les21.5 80%
with fines.20.5 100% W20.0
SAND. Medium-coarse, salt&pepper, less we
M-W
M-W with fines.
M
2.5Y6/223.0
24.0
22.5 90% M-W
23.5 100%gray
Sheet
1 1
gray2.5Y6/2
light brownish
weak-
2 5Y6/2
Pacific NorthwestNational Laboratory
BOREHOLE LOG
WL-7 0-52'
Sisson & Lu Site, 200 East Area VZTF Study
5/9/2001
SAND. Medium, some coarse, less salt&pepp 2.5Y6/2 light brownish weak-24.5 100%25.025.5 100% M-D SAND. Medium, some quartz fragments, less26.026.5 100% SAND. Medium-fine.
27.5 100%gray27.0
28.5 100%28.0
29.5 100%29.0
gray tolightM-D
30.5 100%30.0
2.5Y6/2brownish gray
31.0
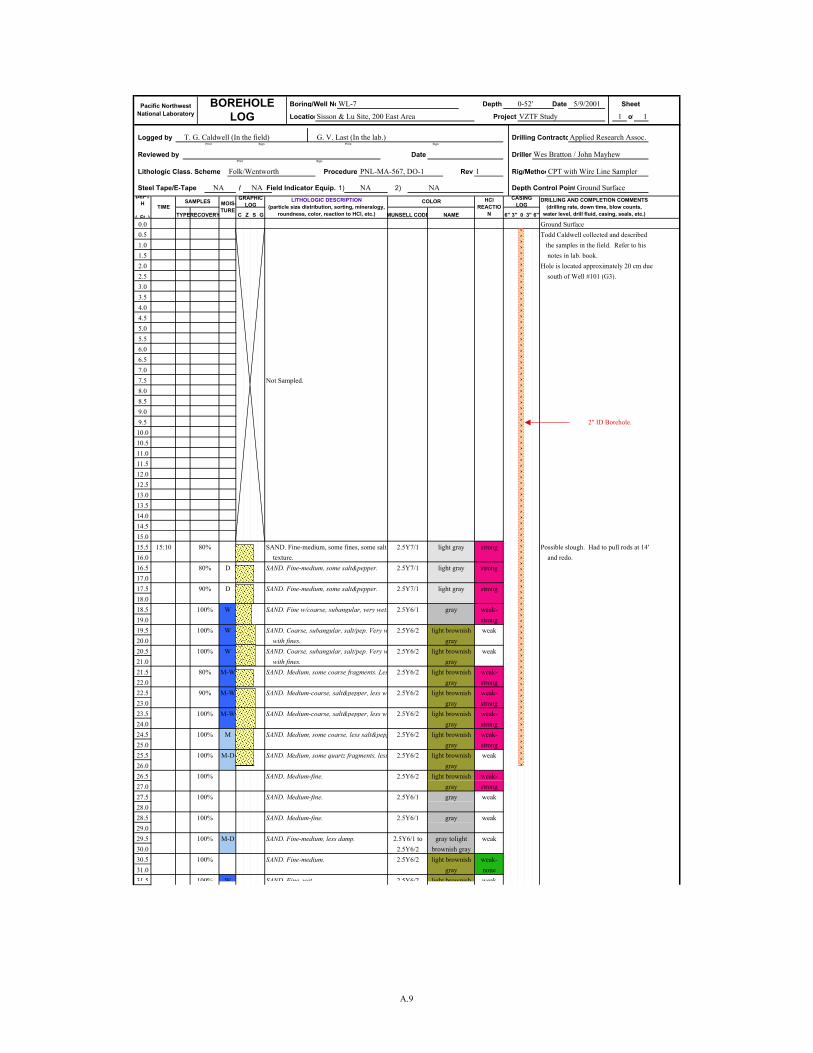
Ground SurfaceTodd Caldwell collected and described the samples in the field. Refer to his notes in lab. book.Hole is located approximately 20 cm due south of Well #101 (G3).
31 5 100% W SAND Fine wet
2" ID Borehole.
HCl REACTIO
N
2.5Y7/1
2.5Y7/1
2.5Y7/1
2.5Y6/2
2.5Y6/1
2.5Y6/2
2.5Y6/2
2.5Y6/1 to
2.5Y6/1
light gray
light brownish
light brownishgray
light brownishgray
light brownishgray
graylight brownish
graylight brownish
gray
gray
light brownishgray
light brownish
strong
strong
weak
weak
strong
strong
weak-
weak-strong
strongweak
weak
weak-strongweak
weak
weak-noneweak
texture.
A.9

Note: Lithologic description based on field examination of chip sample as well as later examination in the laboratory. H2S odor observed after applying HCl - likely
W = Wet, M = Moist, D = Dry 2000/GVL/GW-VZ S&T/001
No sample, latch problems again.
End hole (sampler jammed up)
Slough from above.
previous sample.
No sample, chamber unlocking.
SAND. Fine-medium, salt&pepper. Very dry
SAND. Fine-medium. 2.5Y7/1 light gray weak50%52.051.5
0%51.050.5
100%50.049.5
80%
52.553.0
59.560.0
17:0553.5
59.0
40%
0%
50%
100%
0%
70%
60%
100% D
100% D
weak2.5Y7/2 light gray
light gray weak
SAND, Fine-medium, salt with some pepper.
SAND. Fine.
Medium to fine sand.
Coarse to fine sand.
SAND. Medium (to fine), with some large fra
SAND. Medium-fine, lots of quartz (white mi
SAND. Fine-medium.
SAND. Fine-medium, some rounded pebbles.
graylight brownish none.2.5Y6/2
gray2.5Y6/2 light brownish weak
graySAND. Medium, salt&pepper. 2.5Y6/2 light brownish weak Coarse to fine sand. gray
weak-
2.5Y6/2 light brownish weakgray strong
SAND. Medium-fine, salt&pepper. Dry.
48.549.0
46.547.047.548.0
44.545.045.546.0
42.543.043.544.0
Neet Cement grout.
light brownish
SAND. Fine to medium. Some fines.
2.5Y6/2
2.5Y6/236.5 70%
strong
SAND. Coarse. Some fines.100%35.0
36.035.5
37.037.5 16:15 100% 2.5Y6/2 light brownish weak-
strongSAND. Coarse to fine. Some fines.
D-M SAND. Fine-medium, much less water38.038.5 100%
Some coarse sand.100% D SAND. Fine-medium, salt&pepper. Very dry39.5
40.040.541.041.542.0
39.02.5Y6/2
2.5Y7/1
2.5Y6/2
light brownishgray
light gray
graylight brownish
graylight brownish
gray
gray strong
weak
weak-
No recovery, sample fell out.
Sample may contain some slough from
weak-strongweak-
54.054.555.055.5
58.058.5
56.056.557.057.5
tracer.
2.5Y7/1 light gray weak
2.5Y7/1
A.10

Boring/Well No Depth Date
Location Project of
Logged by G. V. Last Drilling ContractoApplied Research Assoc.Print Sign Print Sign
Reviewed by Date Driller Wes Bratton / John MayhewPrint Sign
Lithologic Class. Scheme Folk/Wentworth Procedure PNL-MA-567, DO-1 Rev 1 Rig/MethodCPT with Wire Line Sampler
Steel Tape/E-Tape NA / NA Field Indicator Equip. 1) NA 2) NA Depth Control PointGround Surface
C Z S G 6" 3" 0 3" 6"
Not Sampled.
SAND. Coarse to fine. Laminated.
SAND. Coarse to fine. Poorly sorted, some fi
SAND. Coarse to fine. Poorly sorted, some fi
SAND. Med. to fine. Better sorted. Laminated
Probably laminated with perhaps some gr
Probably laminated with perhaps some gr
weak
weak
weak-strong
strong
weak
weak
weak
weak-strong
weak
strong
strong
weak-strong
strongweak-
strong
strong
light gray
light gray
lt brownish gray
light gray
light gray
light gray
light gray to
light gray
light gray
light gray
light gray
light gray
2 5Y7/2
2.5Y7/2
2.5Y7/2
2.5Y7/1
2.5Y7/2to 6/2
2.5Y7/2
2.5Y7/2to 6/2
2.5Y7/1
2.5Y7/1
2.5Y7/1
HCl REACTIO
N
WL
WL
WL
31 5 9:55 WL 90% M SAND Medium Partially laminated31.0
Ground SurfaceInitiate direct push, using dummy tip.Hole location is 1 m SW of G-5.Refer also to Todd Caldwell's notes.
Mostly fine to medium sand.30.5 9:52 80% M SAND. Medium. Better sorted. Laminated.30.0
D-M80%9:50 WL29.5 SAND. Coarse to VF sand, with some fines.29.0
light gray
D-M28.0
light gray28.5 9:46 WL 50%
D light gray27.5 9:42 WL 80%27.0
Probably laminated with perhaps some gr26.5 9:40 WL 60% D26.0
light gray
Coarser w/less fines. Salt & pepper textur25.5 9:36 WL 50% D SAND. Coarse to fine. Poorly sorted, some fi Sampler delatched.25.024.5 WL 100% 2.5Y7/1
2.5Y7/1 to 7/2
2.5Y7/2
Pacific NorthwestNational Laboratory
BOREHOLE LOG
WL-8 0-53.7'
Sisson & Lu Site, 200 East Area VZTF Study
5/10/2001
2" ID Borehole.
2.5Y7/2
light gray to
strong
weaklt brownish gray
Sheet
1 1
weak-23.5 9:31 WL 80% SAND. Coarse to med. Laminated.
22.5 9:30 100% D-M23.0
24.0
100% D-M to very fine sand.
dry to wet (wet layers).SAND. Coarse to med, with some fines, lamin
M-W
D-M
20.5 9:24 100% M-WWL20.0
21.0
22.0
SAND. Coarse to very coarse, laminated with
SAND. Coarse to fine, laminated. Alternatin21.5 9:28 WL
2.5Y7/2
18.0
19.5 9:23 M-W19.0
2.5Y7/2
18.5 9:19 WL M
to VC.17.5 WL 90% D17.0
SAND. Fine, with some silt to VF sand. Trac16.5 WL 90% D 2.5Y7/216.0
80%9:11 Replace dummy tip with wireline sampler.
15.5 9:14 WL D SAND. Fine, with some silt to VF sand. Trac15.0
light gray
14.014.5
13.5
12.0
13.012.5
SAMPLES COLORGRAPHICLOG
MUNSELL CODE NAMETYPERECOVERY
100%
SAND. Fine, with some silt to VF sand. Trac
SAND. A little coarser, less fines, more C. sa
7.5
5.5
0.5 9:060.0
10.010.511.0
2.53.03.54.04.55.0
DRILLING AND COMPLETION COMMENTS(drilling rate, down time, blow counts,
water level, drill fluid, casing, seals, etc.)
CASINGLOG
1.52.0
1.0
LITHOLOGIC DESCRIPTION(particle size distribution, sorting, mineralogy,
roundness, color, reaction to HCl, etc.)
DEPTH
( Ft )
TIME MOIS-TURE
6.06.57.0
60%
11.5
8.08.59.09.5
SAND. Medium (coarser still). Wet layers. Some VC sand.
to VC. Mostly medium sand, coarser than
A.11

Note: Lithologic description based on field examination of chip sample as well as later examination in the laboratory. H2S odor observed after applying HCl - likely
W = Wet, M = Moist, D = Dry 2000/GVL/GW-VZ S&T/001
10:55
10:52 WL 70% D
10:50 WL 100% D
10:48 WL 100% D
10:46 WL 100% D
10:43 WL 100% D
10:40 WL 90% D
10:38 WL 100% D-M
10:35 WL 40% M
10:32 WL 100% D-M
10:27 WL 100% D-M
10:25 WL 80% D-M
10:22 WL 80% D-M
10:20 WL 80% M
10:18 WL 80% D-M
SAND. Medium. Some fines. 2.5Y7/1 light gray weaknone
2.5Y7/1 light gray weak-
strong2.5Y7/1 light gray weak
56.557.057.558.0
54.555.055.556.0
52.553.053.554.0
60.0
58.559.0
49.0
39.0
none
weak
weak-
strong
none
weak
weak
weak
tracer.
Reached end of rod at 53.7'. Decided to stop.
Tripped out of hole. Both well (WL-7 & WL-8) filled & grouted to surface.
strongweak-
weak
gray
light gray
light gray
light gray
light gray
graylight brownish
gray
gray
light brownishgray
light brownish
2.5Y7/139.5 10:1440.040.541.041.542.042.543.043.544.044.545.0
80% D SAND. Medium to fine.WL
M-W SAND. Medium, better sorted, with some coa38.038.5 10:12 WL 100%
SAND. Medium, laminated with VF sand striM-W 2.5Y6/2 weak37.5 10:10 WL 100%37.0
WL to silt. Some coarse sand.
35.0
36.035.5 10:05 WL 90% M-W SAND. Medium to fine, with string of VF san
Some coarse sand.2.5Y6/2
2.5Y7/1 light gray
36.5 10:08 40% M-W SAND. Medium to fine. Some VF sand (from
Neet Cement grout.
45.546.046.547.047.548.048.5
59.5
49.550.050.551.051.552.0
2.5Y6/2 stringers?), moist with clays & coarse.
2.5Y7/1 light gray laminations.SAND. Medium, better sorted. Some Coarse
(to silt).2.5Y6/1
gray weak
SAND. Coarse to fine. weak
SAND. Coarse to fine. Poorly sorted. (lamin 2.5Y7/1 light gray weak
2.5Y6/1
SAND. Medium to fine. 2.5Y7/1 light gray none
2.5Y7/1 light gray weak-
none
2.5Y7/1 light gray weak-
SAND. Medium to fine. Poorly sorted, some 2.5Y7/1
2.5Y7/1 Some VC sand to VF pebble.SAND. Medium to fine. More fines.
SAND. Medium, clean, well sorted. Some VF Mostly coarse to medium sand.
SAND. Coarse to medium. Few fines
2.5Y7/1
Some VC sand to VF pebble.
SAND. Medium.
SAND. Medium. Some fines.
SAND. Medium. Some fines.
Sampler was slightly over driven (45-46.2')
SAND. Medium, with some coarse sand lami
light gray weak-SAND. Medium, some VC sand and VF pebb 2.5Y7/1
A.12

Boring/Well No Depth Date
Location Project of
Logged by G. V. Last Drilling ContractoApplied Research Assoc.Print Sign Print Sign
Reviewed by Date Driller Willi Dickerson / John MayhewPrint Sign
Lithologic Class. Scheme Folk/Wentworth Procedure PNL-MA-567, DO-1 Rev 1 Rig/MethodCPT with Wire Line Sampler
Steel Tape/E-Tape NA / NA Field Indicator Equip. 1) NA 2) NA Depth Control PointGround Surface
C Z S G 6" 3" 0 3" 6"
SAND. Medium to coarse, laminated. (A little moister)
Mostly medium to fine sand.
6.06.57.0
100%
11.5
8.08.59.09.5
DRILLING AND COMPLETION COMMENTS(drilling rate, down time, blow counts,
water level, drill fluid, casing, seals, etc.)
CASINGLOG
1.52.0
1.0
LITHOLOGIC DESCRIPTION(particle size distribution, sorting, mineralogy,
roundness, color, reaction to HCl, etc.)
DEPTH
( Ft )
TIME MOIS-TURE
10.010.511.0
2.53.03.54.04.55.0
7.5
5.5
0.5 9:430.0
100%
SAND. Medium. (A little moisture)
SAND. Medium w/fines. Some salt & pepper
MUNSELL CODE NAMETYPERECOVERY
SAMPLES COLORGRAPHICLOG
12.0
13.012.5
13.514.014.5
Replace dummy tip with wireline sampler.15.5 9:50 WL D SAND, Fine to coarse, some silt Grout?15.0
2.5Y7/180%9:49
SAND. Medium, less silt16.5 9:52 WL 90% D-M 2.5Y7/116.0
17.5 9:54 WL 100% D-M17.0 Mostly fine to medium sand.
18.5 9:58 WL D-M light gray weak-18.0
19.5 9:59 M19.0
2.5Y6/2
2.5Y7/1
2.5Y7/2
2.5Y7/2
stronggray
21.0
22.0
SAND. Medium to coarse.
SAND. Coarse.21.5 10:08 WL
20.5 10:01 100% WWL20.0
SAND. Medium. With thin ~1.5" silt layer. S dry laminations. Some VC sand to VF pe
M
100%gray
light brownishW 2.5Y6/2
23.0
24.0
22.5 10:10 80% W-M
SAND. Medium to coarse. Some VF pebble.23.5 10:14 WL 80%
Sheet
1 1
2.5Y5/2
light brownish
weak-
weakstrong (silt)gray
graybrownish strong
light gray
No recovery.gray
weak
2" ID Borehole.
Pacific NorthwestNational Laboratory
BOREHOLE LOG
WL-9 0-57'
Sisson & Lu Site, 200 East Area VZTF Study
5/23/2001
24.5 10:18 WL 0%
25.5 10:23 WL 80% D-M SAND. Medium. Perhaps some sluff from previous sample25.0
Mostly medium to fine sand. attempt.26.5 10:26 WL 70% D-M26.0
light gray27.027.5 10:30 WL 100% D-M light gray
D-M28.0
light gray28.5 10:32 WL 90% Mostly medium to fine sand.
29.5 SAND. Medium, some fines.29.0
light gray2.5Y7/2D-M70%10:37 WL Mostly medium to fine sand.
30.5 10:42 100% D-M SAND. Medium, some fines.30.0
31.0
Ground SurfaceInitiated direct push, using dummy tip.No samples.Refer also to Todd Caldwell's notes.Hole location is between H6 and G5.
31 5 10:46 WL 100% D-M SAND Medium fairly clean (few fines)
WL
WL
WL
HCl REACTIO
N
2.5Y7/1
2.5Y7/1
2.5Y7/2
2.5Y7/2
2.5Y6/2
2.5Y6/2
2 5Y7/2
light gray
light gray
light gray
light brownish
light brownish
light gray
light gray
weak
weak-strongweak
strongstrong
weak
weak -
weak
none
weak-strong
none
weak
weak -
Mostly fine sand.
SAND. Medium. 1 VF pebble.
SAND. Medium, some fines.
SAND. Medium, some fines.
Mostly medium to fine sand.
Mostly medium to fine sand.
Not Sampled.
A.13

Some sample lost down hole.
W = Wet, M = Moist, D = Dry 2000/GVL/GW-VZ S&T/001
Very hard to remove sample.
Easier to remove sample.
Very hard to remove sample.
Very hard to remove sample.
SAND. Fine-coarse, some VC sand.
light brownish weakgray
SAND. Medium. Some laminations. 2.5Y6/2
2.5Y6/2 light brownish
SAND. Medium - coarse.
SAND. Medium. Less wet.
SAND. Medium.
SAND. Medium.
SAND. Coarse - medium. Wetter.
SAND. Coarse-fine, some pebbles. 2.5Y7/1
2.5Y7/1SAND. Coarse. 1 wetter lamination.
2.5Y6/2 light brownish weak
lt. brownish gray none2.5Y7/1 light gray weak
2.5Y6/1-6/2gray
gray to weak -
SAND. Fine to coarse, with thin C-VC sand l 2.5Y6/1 gray weakgray none
SAND. Fine to coarse. 2.5Y6/2 light brownish weak -
2.5Y6/2 light brownish weakgray
2.5Y5/2 brownish graySILT. Silt (mud) layer at bottom. 2.5Y6/1 gray
47.548.048.5
59.5
49.550.050.551.051.552.0
45.546.046.547.0
Neet Cement grout.
M-W SAND. Coarse sand at top.36.5 10:59 100%
SAND. Coarse - medium. Laminated, with v Laminated.
2.5Y6/2100% M-W moisture.
35.0
36.035.5 10:57 WL
37.0WL
37.5 11:02 WL 100% SAND/SILT. Laminated/stratified coarse sanWW
2.5Y5/2 brownish gray weakweak
M SAND. Medium, some coarse.38.038.5 11:10 WL 50%
100% M SAND. Medium.WL
41.041.542.042.543.043.544.044.545.0
39.5 11:1240.040.5
2.5Y7/1
2.5Y7/1
light gray
light gray
graylight brownish
gray
light gray
graylight brownish
light gray
light grayto gray
weak
weak
examination of chip sample as well as later examination in the laboratory
Note: Lithologic description based on field
Very hard to remove sample.
Tripped out of hole.
weak-strongweak
none
weak
weak
weak2.5Y7/1 -2.5Y6/1
SAND. Medium.
SAND. Medium, more fines? Fine-coarse san
49.0
39.0
60.0
58.559.0
57.558.0
54.5
52.553.053.554.0
2.5Y6/2 weakgray
2.5Y6/2 light brownish weakgray
SAND. Medium.
2.5Y6/2 light brownish weakSAND. Medium. Wet.
2.5Y6/2 light brownish weakgray
gray2.5Y6/2 light brownish weak-SAND. Medium-Fine.
11:15 WL 100% M
11:18 WL 100% M-D
11:19 WL 100% M-D
11:22 WL 100% M-D
11:26 WL 100% M-D
11:28 WL 70% M-D
11:30 WL 80% M-D
11:34 WL 80% M-D
11:36 WL 80% M-D
11:38 WL 80% M-D
11:41 WL 90% W
11:43 WL 100% M
11:46 WL 100% M
11:48 WL 100% M
11:51 WL 100% M-W
11:54 WL 100% Mgray strong
11:58 WL 100% M-D SAND. Medium-Fine.57.0
12:00
55.055.556.056.5
A.14

Boring/Well No Depth Date
Location Project of
Logged by G. V. Last Drilling ContractoApplied Research Assoc.Print Sign Print Sign
Reviewed by Date Driller Willi Dickerson / John MayhewPrint Sign
Lithologic Class. Scheme Folk/Wentworth Procedure PNL-MA-567, DO-1 Rev 1 Rig/MethodCPT with Wire Line Sampler
Steel Tape/E-Tape NA / NA Field Indicator Equip. 1) NA 2) NA Depth Control PointGround Surface
C Z S G 6" 3" 0 3" 6"
samples until 15'.
WL-10A 15-16'. Pulled out of hole and
SAND. Coarse to medium.
SAND. Medium.
Not Sampled.
SAND. Medium.
strongweak-
weak-
strong
weak-
weak-strong
strong
strong
noneweak
weak -
weak
noneweak -
weak
weak
weak -
(moist)brownish gray
light gray
gray
light brownish
light brownish
light gray
graylight brownish
graylight brownish
light gray
light gray
2 5Y5/2
2.5Y6/2
2.5Y5/2
2.5Y5/2
2.5Y6/2
2.5Y6/2
2.5Y6/2
2.5Y6/1
2.5Y6/1
2.5Y7/2
2.5Y7/2
2.5Y7/2
HCl REACTIO
N
2" ID Borehole.
WL
31 5 14:56 WL 100% M-W SAND Medium31.0
Ground SurfaceInitiated direct push, using dummy tip.Hole located ~50-45cm from S-3. No
With Todd Caldwell, refer also to his notes.
Hit bentonite at ~15.5'. Took sample
moved backward 1.5 ft. Started new hole.
SAND. Medium.30.0 (moist)
brownish gray weak-30.5 14:53 100% M-W
14:49 WL
WL
M-W100% weak-29.5 SAND. Medium.29.0 gray
brownish graystrong
M Over driven?28.0 gray
light brownish28.5 14:47 WL 110%
M light brownish27.5 14:45 WL 100%27.026.5 14:43 WL 100% M26.0
light graySAND. Medium.
25.5 14:40 WL 80% M SAND. Coarse-medium. 1 coarser/wetter lam25.024.5 14:38 WL 100%
Pacific NorthwestNational Laboratory
BOREHOLE LOG
WL-10 0-56'
Sisson & Lu Site, 200 East Area VZTF Study
5/23/2001
gray
weak-
weak-gray strong
2.5Y6/2 weak-
Sheet
1 1
23.5 14:36 WL 100%
22.5 14:32 100% W23.0
24.0
M
SAND. Coarse
Less moisture.SAND. Medium. Laminated.
SAND. Coarse to medium
M-W
M-W
20.5 14:28 100% M-WWL20.0
21.0
22.0SAND. Medium to fine.21.5 14:30 WL 100%
2.5Y7/2
gray weakstrong
strong
SAND. Coarse to medium.
18.0
19.5 14:26 M-W19.018.5 14:24 WL M
2.5Y6/2WL
2.5Y7/2
17.5 14:22 WL 100% D-M17.016.5 14:19 WL 100% D 2.5Y7/216.0
100%14:17 Replace dummy tip with wireline sampler.
15.5 14:18 WL D SAND. Fine. Grout?15.0
light gray
14.014.5
13.5
12.0
13.012.5
SAMPLES COLORGRAPHICLOG
NAMETYPERECOVERY
100%
SAND. Fine to medium.
SAND. Fine to medium, some coarser lamina
MUNSELL CODE
SAND. Fine to medium. Trace of VC sand to VF pebble.
7.5
5.5
0.5 13:5913:310.0
10.010.511.0
2.53.03.54.04.55.0
DRILLING AND COMPLETION COMMENTS
(drilling rate, down time, blow counts,water level drill fluid casing seals etc )
CASINGLOG
1.52.0
1.0
LITHOLOGIC DESCRIPTION(particle size distribution, sorting, mineralogy,
roundness, color, reaction to HCl, etc.)
DEPTH
( Ft )
TIME MOIS-TURE
6.06.57.0
100%
11.5
8.08.59.09.5
Moist
A.15
W = Wet, M = Moist, D = Dry 2000/GVL/GW-VZ S&T/001
16:05
16:04 WL
57.0
gray strong100% M
16:02 WL 100% M
16:00 WL 100% M-D
15:57 WL 100% M-D
15:55 WL 50% M-D
15:52 WL 80% M-D
15:47 0%
15:44 WL 80% M
15:41 WL 80% M-D
15:39 WL 80% M
15:37 WL 80% M
15:35 WL 80% M-D
15:32 WL 70% M
15:28 WL 100% M
15:25 WL 50% M
15:22 WL 100% M-D
2.5Y6/2 light brownish weak-SAND. Medium.
2.5Y7/2 light gray weakSAND. Fine to coarse. Some coarser wet lam
57.5
strongSAND. Fine to medium. 2.5Y7/2 light gray
none2.5Y7/2 light gray weak
2.5Y7/2 light gray weak -
58.0
54.5
52.553.053.554.0
55.055.556.056.5
60.0
58.559.059.5
39.0
W
M-W SAND. Coarse.38.0
strong
weak
weak-
none
weak
weak
weak -
weak
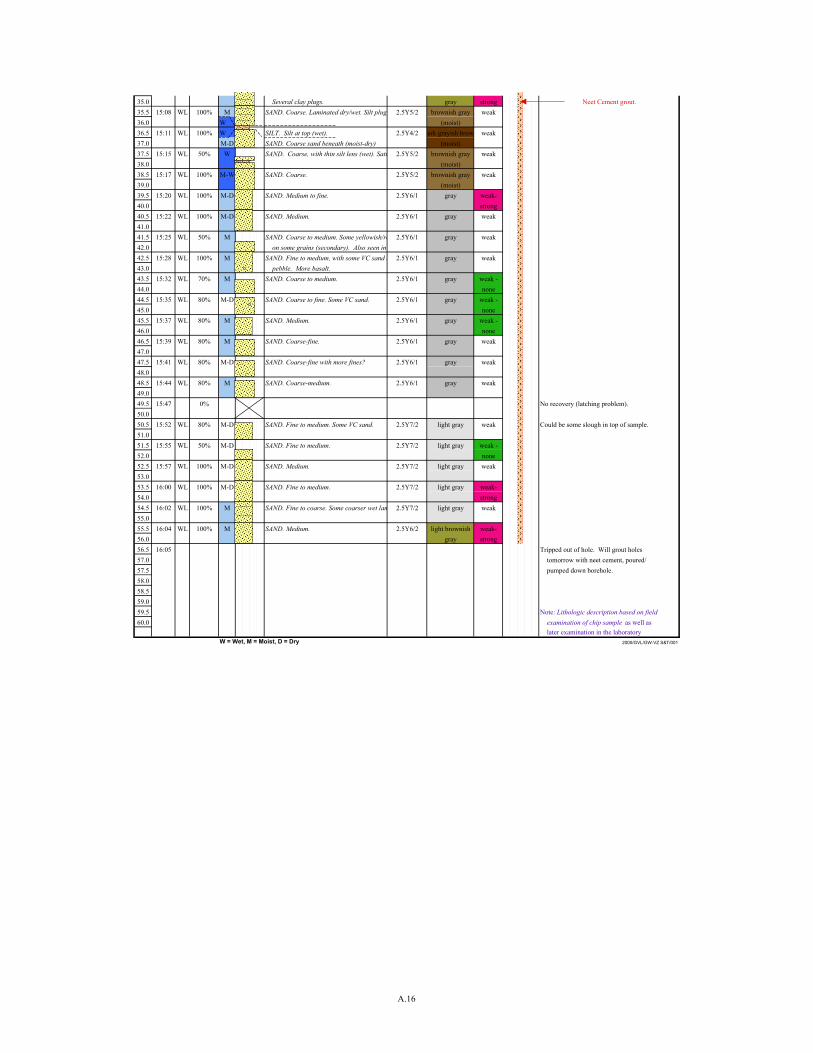
Note: Lithologic description based on field
Could be some slough in top of sample.
pumped down borehole.
examination of chip sample as well as later examination in the laboratory
weak
strongweak
brownish gray(moist)
gray
gray
gray
graybrownish gray
(moist)
2.5Y6/1
2.5Y5/2
2.5Y4/2
2.5Y5/2
39.5 15:2040.040.541.041.542.042.543.043.544.044.545.0
100% M-D SAND. Medium to fine.WL
38.5 15:17 WL 100%
WM-D
2.5Y5/2 brownish gray weakSAND. Coarse, with thin silt lens (wet). Satu(moist)
50%(moist)
37.5 15:15 WL37.0
WL
100%35.0
36.035.5 15:08 WL M
Neet Cement grout.SAND. Coarse. Laminated dry/wet. Silt plug Several clay plugs.
36.5 15:11 100% W SILT. Silt at top (wet).
45.5
SAND. Coarse to fine. Some VC sand.
SAND. Medium.46.046.547.047.548.048.5
49.549.0
50.050.551.051.552.0
dark grayish browSAND. Coarse sand beneath (moist-dry)
2.5Y6/1 gray
SAND. Coarse to medium. Some yellowish/re 2.5Y6/1 gray
weakSAND. Medium.
weak on some grains (secondary). Also seen in SAND. Fine to medium, with some VC sand t 2.5Y6/1 gray weak pebble. More basalt.
noneSAND. Coarse to medium. 2.5Y6/1 gray weak -
nonegray
2.5Y7/2 light gray weak
SAND. Coarse-medium. 2.5Y6/1
SAND. Coarse-fine with more fines?
SAND. Coarse-fine.
2.5Y6/1
SAND. Fine to medium.
SAND. Medium.
SAND. Fine to medium. Some VC sand.
2.5Y6/1 gray
gray weak -2.5Y6/1
2.5Y6/1
No recovery (latching problem).
weak-
Tripped out of hole. Will grout holes tomorrow with neet cement, poured/
A.16

Boring/Well No Depth Date
Location Project of
Logged by G. V. Last Drilling ContractoApplied Research Assoc.Print Sign Print Sign
Reviewed by Date Driller Willi Dickerson / John MayhewPrint Sign
Lithologic Class. Scheme Folk/Wentworth Procedure PNL-MA-567, DO-1 Rev 1 Rig/MethodCPT with Wire Line Sampler
Steel Tape/E-Tape NA / NA Field Indicator Equip. 1) NA 2) NA Depth Control PointGround Surface
C Z S G 6" 3" 0 3" 6"
SAND. Medium to coarse.SAND. Medium, on bottom. Wet to moist.
1 VF pebble.
W-M
6.06.57.0
80%
11.5
8.08.59.09.5
DRILLING AND COMPLETION COMMENTS(drilling rate, down time, blow counts,
water level, drill fluid, casing, seals, etc.)
CASINGLOG
1.52.0
1.0
LITHOLOGIC DESCRIPTION(particle size distribution, sorting, mineralogy,
roundness, color, reaction to HCl, etc.)
DEPTH
( Ft )
TIME MOIS-TURE
10.010.511.0
2.53.03.54.04.55.0
7.5
5.5
0.5 12:150.0
SAND. Medium-very fine. A little finer than
SAND. Medium-very fine.
MUNSELL CODE NAMETYPERECOVERY
SAMPLES COLORGRAPHICLOG
12.0
13.012.5
13.514.014.5
Stopped direct push. Set up to sample.15.5 12:28 WL D SAND. Fine to medium. (not really much silt Note: No D.I. water to rinse samplers.15.0
2.5Y7/212:24
SAND. Medium.16.5 12:30 WL D-M 2.5Y6/216.0
17.5 12:35 WL 80% D-M17.0
2.5Y6/2
18.5 12:37 WL D-M Good moisture contact at 18.8'.light gray strong18.0
19.5 12:40 M-W19.0
2.5Y6/1
2.5Y6/1
No recovery.
weak21.0
22.0SAND. Coarse over Coarse-medium, with 1"21.5 12:50 WL 100%
20.5 12:46 100% M-WWL20.0
D-M 1 VF pebble.
D-M
(moist)dark grayish browM-W 2.5Y4/2
23.0
24.0
22.5 12:51 0%
weak -23.5 12:58 WL 80% SAND. Coarse to medium. gray2.5Y6/1
Sheet
1 1
can now be rinced.
With Todd Caldwell. Refer to his notes as well.
2.5Y5/2
(moist)
gray (moist)brownish gray
Note: Todd brought D.I. water. Samplers
Pacific NorthwestNational Laboratory
BOREHOLE LOG
WL-11 0-57'
Sisson & Lu Site, 200 East Area VZTF Study
6/5/2001
2.5Y6/1 weakgray24.5 13:01 WL 100%
25.5 13:03 WL 80% M SAND. Coarse to medium. Wetter at bottom.25.0
W26.5 13:06 WL 80% W26.0
gray27.027.5 13:08 WL 100%
MM light brownish
M28.0 gray
gray28.5 13:10 WL 100%
29.5 SAND. Medium.29.0
gray2.5Y6/1M60%13:13 WL
30.5 13:17 80% M SAND. Medium.30.0
2.5Y6/1 gray weak31.0
Ground SurfaceStarted direct push, no sampling.Location is near H-6. (70 cm from H6
31 5 13:20 WL 80% M SAND Medium
WL
WL
2" ID Borehole.
HCl REACTIO
N
2.5Y7/2
2.5Y7/2
2.5Y6/2
2 5Y6/1
2.5Y6/1
light gray
light brownishgray
light gray
light brownish
gray
gray
strong
weak
weak -strong
strong
weak -strong
none
weak -
weak
strongweak
weak
weak -strong
weak
VF sand)
SAND. Coarse to medium.
SAND. Medium. Drier at bottom.
SAND. Medium.
Not Sampled.
and 140 cm from H4).
SAND. Medium to coarse.
SAND. Medium.
H4
H6
140 cm
70 cm
A.17

W = Wet, M = Moist, D = Dry 2000/GVL/GW-VZ S&T/001
Having trouble with sampler.
Out of hole.
No recovery.
Could be some slough in top of sample.
SAND. Medium
gray weak -SAND. Coarse to medium. 2.5Y6/1
2.5Y6/1 gray
Rebuilt sampling head (wireline)
SAND. Medium.
SAND. Medium.
SAND. Medium 1 VF pebble, angular.
SAND. Coarse to medium.
SAND. Coarse to medium.
SAND. Medium. 2.5Y6/2
2.5Y6/2SAND. Medium.
2.5Y6/1 gray to weakgray
light brownish weak
2.5Y6/1none
gray weak
SAND. Medium.(moist)
SAND. Coarse to fine. 2.5Y6/1 gray weak(moist) none
SAND. Coarse.
SAND. Coarse to medium. 2.5Y5/2 brownish gray
dark grayish browSILTY SAND. Very fine sand to silt. (moist)
2.5Y4/2
47.548.048.5
59.5
49.550.050.551.051.552.0
45.546.046.547.0
W SAND. Coarse.36.5 13:32 100%
SAND. Coarse to medium. 2.5Y5/2to 2.5Y6/2
SILTY SAND. Very fine sand to silt.
Neet Cement grout.lt. brownish graybrownish grayW
35.0
36.035.5 13:30 WL 100%
37.0WL
37.5 13:35 WL 60% SAND. Coarse, with thin VF Sand to silt lensW 2.5Y4/2 dark grayish brow weak
M-W SAND. Coarse to medium.38.038.5 13:37 WL 100%
100% M-W SAND. Coarse to medium.WL
41.041.542.042.543.043.544.044.545.0
39.5 13:4240.040.5
2.5Y5/2
2.5Y5/2
none
light brownish weak
(moist)brownish gray
(moist)brownish gray
gray
lt. brownish graygray to
weak
weak
examination of chip sample as well as later examination in the laboratory
Note: Lithologic description based on field
No recovery. Pulling out of hole.
weak
weak -
weak -none
weak -
(moist) none2.5Y5/2 brownish gray
(moist)
49.0
39.0
60.0
58.559.0
57.558.0
54.5
52.553.053.554.0
56.557.0
55.0
to 2.5Y6/22.5Y6/1 weak
to 2.5Y6/2 lt. brownish gray2.5Y6/2 light brownish weak
gray2.5Y6/1 gray weakSAND. Medium.
2.5Y5/2 brownish gray weak -(moist) strong
SAND. Coarse to medium.
2.5Y6/2 light brownish weakSAND. Medium.
13:49 WL 100% M-W
13:53 WL 80% M-W
13:57 WL 75% M
14:05 WL 10% M
14:09 WL 70% M
14:11 WL 50% M
14:14 WL 70% M
14:20 WL 5% M-W
14:57 WL 10% M
15:00 WL 70% M
15:04 WL 70% M
15:07 WL 100% M
15:09 WL 100% M
15:11 WL 100% M
15:15 WL 70% M-W
70% M-Wgray
0%
14:46
55.556.0
15:21 WL
15:18 WL
A.18
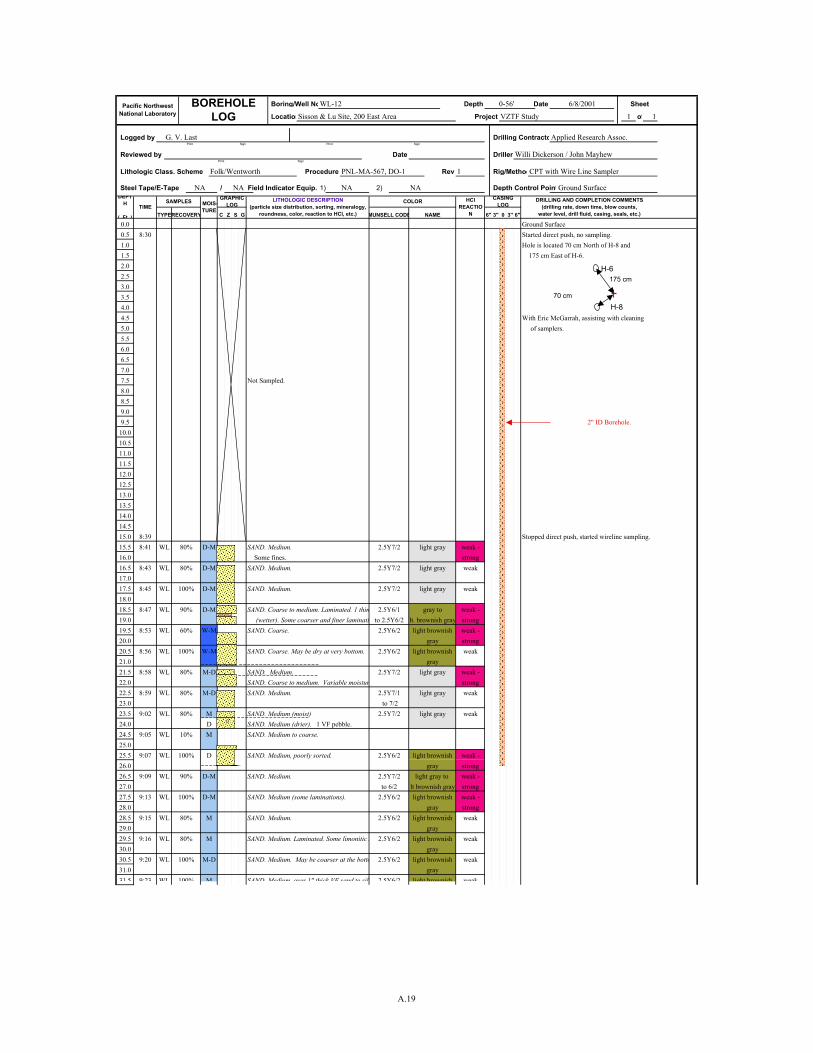
Boring/Well No Depth Date
Location Project of
Logged by G. V. Last Drilling ContractoApplied Research Assoc.Print Sign Print Sign
Reviewed by Date Driller Willi Dickerson / John MayhewPrint Sign
Lithologic Class. Scheme Folk/Wentworth Procedure PNL-MA-567, DO-1 Rev 1 Rig/MethodCPT with Wire Line Sampler
Steel Tape/E-Tape NA / NA Field Indicator Equip. 1) NA 2) NA Depth Control PointGround Surface
C Z S G 6" 3" 0 3" 6"
175 cm East of H-6.
SAND. Coarse. May be dry at very bottom.
SAND. Medium.
Not Sampled.
SAND. Medium to coarse.
SAND. Medium.
SAND. Medium (some laminations).
Some fines.
weak
weak
strongweak -strongweak -strong
weak
weak
weak
strongweak -
weak -strongweak
light gray
lt. brownish graylight brownish
light gray
gray to
graylight brownish
graylight gray
light gray
light gray
2 5Y6/2
2.5Y6/2
2.5Y6/2
2.5Y6/2
2.5Y7/1 to 7/2
2.5Y7/2
HCl REACTIO
N
2" ID Borehole.
WL
M SAND Medium over 1" thick VF sand to silt light brownish weak31 5 9:23 WL 100%gray
Ground SurfaceStarted direct push, no sampling.Hole is located 70 cm North of H-8 and
9:2031.0
WL SAND. Medium. May be coarser at the botto30.0 gray
light brownish weak30.5
9:16 WL M80%
100% M-D
29.5 SAND. Medium. Laminated. Some limonitic s29.0 gray
light brownish
M28.0 gray
light brownish28.5 9:15 WL 80%
D-Mlt brownish graylight brownish2.5Y6/227.5 9:13 WL 100%
27.0D-M
26.0light gray to 2.5Y7/2
gray26.5 9:09 WL 90%
D SAND. Medium, poorly sorted.25.0
2.5Y6/2 light brownish weak -25.5 9:07 WL 100%
24.5 9:05 WL 10%
Pacific NorthwestNational Laboratory
BOREHOLE LOG
WL-12 0-56'
Sisson & Lu Site, 200 East Area VZTF Study
6/8/2001
strongweak -
strong2.5Y6/2
Sheet
1 1
With Eric McGarrah, assisting with cleaning of samplers.
SAND. Medium (moist) light gray23.5 9:02 WL 80%
22.5 8:59 80% M-D23.0
24.0
M-D 2.5Y7/2SAND. Coarse to medium. Variable moisturSAND. Medium.
MSAND. Medium (drier). 1 VF pebble.D
M
20.5 8:56 100% W-MWL20.0
21.0
22.0SAND. Medium.21.5 8:58 WL 80%
to 6/2
weak
18.0
19.5 8:53 W-M19.0
WL
18.5 8:47 WL D-M
2.5Y6/2SAND. Coarse. (wetter). Some coarser and finer laminati
2.5Y6/1to 2.5Y6/2
weak -
2.5Y7/217.5 8:45 WL 100% D-M17.016.5 8:43 WL 80% D-M 2.5Y7/216.0
80%8:39 Stopped direct push, started wireline sampling.
15.5 8:41 WL D-M SAND. Medium.15.0
14.014.5
13.5
12.0
13.012.5
SAMPLES COLORGRAPHICLOG
NAMETYPERECOVERY
SAND. Medium.
SAND. Coarse to medium. Laminated. 1 thin
MUNSELL CODE
SAND. Medium.
2.5Y7/2
7.5
5.5
0.5 8:300.0
10.010.511.0
2.53.03.54.04.55.0
DRILLING AND COMPLETION COMMENTS(drilling rate, down time, blow counts,
water level, drill fluid, casing, seals, etc.)
CASINGLOG
1.52.0
1.0
LITHOLOGIC DESCRIPTION(particle size distribution, sorting, mineralogy,
roundness, color, reaction to HCl, etc.)
DEPTH
( Ft )
TIME MOIS-TURE
6.06.57.0
90%
11.5
8.08.59.09.5
60%
H-6
H-870 cm
175 cm
A.19

W = Wet, M = Moist, D = Dry 2000/GVL/GW-VZ S&T/001
56.5 10:30
10:27 WL
10:5610:46
gray (moist)100% M-W
10:25 WL 100% M-W
10:23 WL 100% M
10:19 WL 100% MM
10:17 WL 100% W
10:15 WL 100% M-W
10:12 WL 80% M-W
10:10 WL 90% M
10:07 WL 80% M-W
10:06 WL 80% M-W
10:02 WL 80% M-W
10:01 WL 70% M-W
10:00 WL 80% M-W
9:56 WL 80% M
9:55 WL 80% M-W
9:53 WL 90% M-W
SAND. Coarse to very coarse.
2.5Y6/2 light brownish weakSAND. Coarse to very coarse, laminated withSAND. Medium to fine. (moist)
2.5Y6/2 light brownish weak
2.5Y5/2 brownish gray strong
(moist)
57.0
gray (moist)SAND. Medium to fine.
(moist)2.5Y5/2 - 4/2 brownish gray weak
(moist)2.5Y5/2 brownish gray weak
57.558.0
54.5
52.553.053.554.0
55.055.556.0
60.0
58.559.059.5
11:17
39.0M-D SAND. Medium, laminated - variable moistu
38.038.5
strong
weak
weak -
Variable moisture. none
20-22 gal. H2O. Grout poured downhole
weak
weak -
weak
weak -
weak -
later examination in the laboratory
Note: Lithologic description based on field examination of chip sample as well as
from bucket. Demobe from site.
Tripping out of hole
Portland Type I/II cement - 1.5 bags to
weak
weak
brownish gray
gray to
light brownish
brownish graygray
(moist)gray
2.5Y5/2
2.5Y6/1
2.5Y6/2
2.5Y6/2
39.5 9:4940.040.541.041.542.042.543.043.544.044.545.0
70% M SAND. Coarse to medium, with 1" VF. Sand Clean, little fines.
WL
9:43 WL 100%
M-W 2.5Y4/2 dark grayish brow weakgray
SAND. Coarse, laminated, with fines.SILT. (at top, 2-3" thick)
MWL 100%
37.5 9:39 WL 100%37.0
WL
35.0
36.035.5 9:35 W-D light brownish
Neet Cement grout.SAND. Coarse to medium, laminated with VFSAND. Medium (drier).
silt (wet).36.5 9:37 100% M SAND. Coarse to medium, to F-M.
gray
(moist)
45.546.0
SAND. Coarse. 1 Fine pebble.SAND. Coarse.
46.547.047.548.048.5
49.550.050.5
49.0
51.051.552.0
light brownishSILT. (wetter)
2.5Y6/1 gray
SAND. Coarse to medium. 2.5Y6/1 gray to
weakSAND. Coarse to medium, laminated. Wette
none Some VC sand to VF pebble. to 2.5Y6/2 lt. brownish gray
to 2.5Y6/2 lt. brownish graySAND. Coarse to fine, laminated. Variable m 2.5Y6/1 gray to weak Some VC sand to VF pebble.
graySAND. Coarse to medium. 2.5Y6/2 light brownish weak
2.5Y6/1to 2.5Y6/2 lt. brownish gray none
gray toto 2.5Y6/2 lt. brownish gray none
none2.5Y6/1
to 2.5Y6/2 lt. brownish gray
SAND. Coarse to medium, some F. sand lam
2.5Y5/2 brownish gray weak
2.5Y5/2
SAND. Medium. 1 Fine pebble (subround). (moist)
SAND. Coarse.SAND. Medium (drier)
1 VF-F pebble, angular.
SAND. Coarse (some VC sand to VF pebble)SAND. Medium.
SAND. Coarse
SAND. MediumSAND. Fine (drier)
SAND. Medium (drier)
SAND. Coarse to medium. 2.5Y6/2
2.5Y6/2 light brownish
gray to weak -gray
2.5Y6/1
Out of hole.Grouting hole with neet cement. Using
A.20

Appendix B
Percent Fine Data

Borehole ID
Sample ID Depth (ft)
Date Sampled
Dry Soil Wt.(g)
Sieve Tare Wt.(g)
Sieve + Retained Soil Dry
Wt.(g)
Retained Soil Dry
Wt.(g) % Fine
WL-5 17-18' 17.5 4/16/2001 20.04 344.19 361.65 17.46 12.87WL-5 18-19' 18.5 4/16/2001 20.04 294.54 311.95 17.41 13.12WL-5 19-20' 19.5 4/16/2001 19.99 292.27 309.04 16.77 16.11WL-5 22-23' 22.5 4/16/2001 19.99 299.95 316.89 16.94 15.26WL-5 33-34' 33.5 4/16/2001 20.03 351.71 369.10 17.39 13.18WL-5 37-38' 37.5 4/16/2001 20.03 344.21 360.98 16.77 16.28WL-5 38-39' 38.5 4/16/2001 20.03 294.55 311.38 16.83 15.98WL-5 42-43' 42.5 4/16/2001 20.03 292.17 310.38 18.21 9.09
WL-6 15-16' 15.5 4/16/2001 20.00 344.17 361.57 17.40 13.00WL-6 18-19' 18.5 4/16/2001 20.03 292.22 308.86 16.64 16.92WL-6 19-20' 19.5 4/16/2001 20.01 294.55 311.86 17.31 13.49WL-6 22-23' 22.5 4/16/2001 20.02 299.91 316.92 17.01 15.03WL-6 33-34' 33.5 4/16/2001 20.02 351.69 368.94 17.25 13.84WL-6 37-38' 37.5 4/16/2001 19.99 344.15 360.41 16.26 18.66WL-6 38-39' 38.5 4/16/2001 20.01 292.21 308.59 16.38 18.14WL-6 42-43' 42.5 4/16/2001 20.00 294.56 312.58 18.02 9.90WL-6 52-53' 52.5 4/16/2001 20.00 299.89 317.34 17.45 12.75
WL-7 17-18' 17.5 5/9/2001 20.01 351.69 368.29 16.60 17.04WL-7 18-19' 18.5 5/9/2001 20.03 344.20 361.70 17.50 12.63WL-7 19-20' 19.5 5/9/2001 20.02 293.78 308.77 14.99 25.12WL-7 22-23' 22.5 5/9/2001 20.00 294.57 311.10 16.53 17.35WL-7 33-34' 33.5 5/9/2001 20.01 299.88 315.98 16.10 19.54WL-7 38-39' 38.5 5/9/2001 20.01 351.71 368.02 16.31 18.49WL-7 42-43' 42.5 5/9/2001 19.99 344.18 362.00 17.82 10.86WL-7 52-53' 52.5 5/9/2001 20.03 292.17 309.30 17.13 14.48
WL-8 17-18' 17.5 5/10/2001 20.03 344.18 360.81 16.63 16.97WL-8 18-19' 18.5 5/10/2001 19.99 294.55 311.35 16.80 15.96WL-8 19-20' 19.5 5/10/2001 20.03 335.43 351.57 16.14 19.42WL-8 22-23' 22.5 5/10/2001 20.02 299.87 316.14 16.27 18.73WL-8 33-34' 33.5 5/10/2001 20.00 351.69 368.71 17.02 14.90WL-8 37-38' 37.5 5/10/2001 20.01 344.19 361.67 17.48 12.64WL-8 38-39' 38.5 5/10/2001 20.02 294.56 310.99 16.43 17.93WL-8 42-43' 42.5 5/10/2001 20.00 335.45 352.68 17.23 13.85WL-8 52-53' 52.5 5/10/2001 20.00 299.87 316.57 16.70 16.50
WL-9 17-18' 17.5 5/23/2001 19.99 344.21 361.46 17.25 13.71WL-9 18-19' 18.5 5/23/2001 19.98 294.58 311.62 17.04 14.71WL-9 19-20' 19.5 5/23/2001 19.99 335.75 352.40 16.65 16.71WL-9 22-23' 22.5 5/23/2001 20.02 299.88 316.31 16.43 17.93WL-9 33-34' 33.5 5/23/2001 20.02 351.93 369.12 17.19 14.14WL-9 37-38' 37.5 5/23/2001 20.02 344.21 358.92 14.71 26.52WL-9 38-39' 38.5 5/23/2001 20.03 294.57 312.68 18.11 9.59WL-9 42-43' 42.5 5/23/2001 20.01 335.70 353.29 17.59 12.09WL-9 52-53' 52.5 5/23/2001 20.01 299.87 317.25 17.38 13.14
B.1

Borehole ID
Sample ID Depth (ft)
Date Sampled
Dry Soil Wt.(g)
Sieve Tare Wt.(g)
Sieve + Retained Soil Dry
Wt.(g)
Retained Soil Dry
Wt.(g) % Fine
WL-10 17-18' 17.5 5/23/2001 20.01 351.92 368.84 16.92 15.44WL-10 18-19' 18.5 5/23/2001 19.99 344.20 360.94 16.74 16.26WL-10 19-20' 19.5 5/23/2001 19.99 294.55 311.45 16.90 15.46WL-10 22-23' 22.5 5/23/2001 20.01 335.72 352.59 16.87 15.69WL-10 33-34' 33.5 5/23/2001 20.02 300.14 316.24 16.10 19.58WL-10 37-38' 37.5 5/23/2001 19.99 351.96 367.22 15.26 23.66WL-10 38-39' 38.5 5/23/2001 19.99 344.19 360.30 16.11 19.41WL-10 42-43' 42.5 5/23/2001 20.01 294.57 312.87 18.30 8.55WL-10 52-53' 52.5 5/23/2001 20.00 335.72 352.43 16.71 16.45
WL-11 17-18' 17.5 6/5/2001 20.01 299.87 316.98 17.11 14.49WL-11 18-19' 18.5 6/5/2001 20.00 351.90 368.34 16.44 17.80WL-11 19-20' 19.5 6/5/2001 20.00 344.17 360.65 16.48 17.60WL-11 23-24' 23.5 6/5/2001 20.00 294.57 313.37 18.80 6.00WL-11 33-34' 33.5 6/5/2001 20.00 335.70 352.14 16.44 17.80WL-11 37-38' 37.5 6/5/2001 20.01 299.91 314.12 14.21 28.99WL-11 38-39' 38.5 6/5/2001 20.02 351.94 369.34 17.40 13.09WL-11 42-43' 42.5 6/5/2001 20.01 344.17 361.94 17.77 11.19WL-11 52-53' 52.5 6/5/2001 19.99 294.56 311.73 17.17 14.11
WL-12 17-18' 17.5 6/8/2001 20.00 335.70 352.53 16.83 15.85WL-12 18-19' 18.5 6/8/2001 20.02 299.87 316.38 16.51 17.53WL-12 19-20' 19.5 6/8/2001 20.02 351.91 368.58 16.67 16.73WL-12 23-24' 23.5 6/8/2001 20.00 344.19 362.28 18.09 9.55WL-12 33-34' 33.5 6/8/2001 20.02 294.57 311.73 17.16 14.29WL-12 37-38' 37.5 6/8/2001 20.01 335.69 350.41 14.72 26.44WL-12 38-39' 38.5 6/8/2001 20.00 299.85 316.70 16.85 15.75WL-12 42-43' 42.5 6/8/2001 20.00 351.91 369.56 17.65 11.75WL-12 52-53' 52.5 6/8/2001 20.00 344.16 361.44 17.28 13.60
B.2

Appendix C
Moisture Content Data

Water Content WL-3A (S-7)Analyst: Scale Number:
Analysis date: Callibration date:
Sample ID Depth (ft) Beaker No.Beaker Wt.
(g)
Soil/Beaker Wet Wt.(g)
Soil/Beaker Dry Wt.
(g) % Water Comments15-16 15.50 52 30.06 59.58 58.90 2.36%16-17 16.50 50 29.89 245.66 240.71 2.35%17-18 17.50 38 30.17 276.55 271.08 2.27%18-19 18.50 21 30.07 269.47 263.46 2.58%19-20 19.50 8 29.42 84.42 81.65 5.30%20-21 20.50 5 30.28 277.88 264.69 5.63%21-22 21.50 6 30.08 278.52 267.88 4.47%22-23 22.50 7 28.25 247.61 238.04 4.56%23-24 23.50 1A 29.70 264.64 252.44 5.48%24-25 24.50 41 40.05 218.23 214.47 2.16%25-26 25.50 2 30.06 197.06 193.30 2.30%
25-26D 25.50 34 30.06 79.98 78.87 2.27%26-27 26.50 36 30.16 114.12 111.87 2.75%27-28 27.50 10 26.86 178.29 173.98 2.93%28-29 28.50 4 30.24 193.72 189.14 2.88%29-30 29.50 49 30.16 115.25 113.05 2.65%30-31 30.50 3 30.45 174.99 170.33 3.33%31-32 31.50 19 30.28 163.45 158.53 3.84%
31-32D 31.50 43 29.77 119.46 116.08 3.92%32-33 32.50 1 30.27 152.31 145.62 5.80%33-34 33.50 48 30.30 110.67 108.35 2.97%34-35 34.50 53 30.30 188.53 183.22 3.47%35-36 35.50 30 29.98 171.35 164.51 5.08%
35-36D 35.50 A 30.08 146.02 140.61 4.89%36-37 36.50 51 29.99 154.81 146.71 6.94%37-38 37.50 K 30.10 193.10 179.00 9.47%38-39 38.50 22 30.02 127.14 121.06 6.68%39-40 39.50 I 30.23 193.43 189.68 2.35%40-41 40.50 L 29.96 175.15 171.77 2.38%
41-42D 40.50 13 30.17 103.03 101.24 2.52%41-42 41.50 J 30.29 175.52 172.05 2.45%42-43 42.50 M 30.05 202.36 197.45 2.93%43-44 43.50 E 29.99 173.70 169.67 2.89%44-45 44.50 H 30.36 71.79 70.75 2.57%45-46 45.50 N 30.07 192.97 188.55 2.79%46-47 46.50 G 29.89 192.61 188.13 2.83%47-48 47.50 O 30.09 217.61 212.62 2.73%48-49 48.50 F 30.18 197.80 193.56 2.60%49-50 49.50 56 30.15 106.77 105.00 2.36%50-51 50.50 40 30.12 186.02 182.29 2.45%51-52 51.50 31 30.07 158.69 155.41 2.62%
51-52D 51.50 B 30.46 110.69 108.54 2.75%52-53 52.50 28 30.18 154.38 150.67 3.08%53-54 53.50 14 30.02 186.29 181.85 2.92%54-55 54.50 46 29.89 118.32 115.23 3.62%
C.1

Water Content WL-4 (S-8)Analyst: Scale Number:
Analysis date: Callibration date:
Sample ID Depth (ft) Beaker No.Beaker Wt.
(g)
Soil/Beaker Wet Wt.(g)
Soil/Beaker Dry Wt.
(g) % Water Comments15-16 15.50 15 27.06 163.85 160.87 2.23%16-17 16.50 25 30.04 209.38 205.24 2.36%17-18 17.50 26 30.20 190.24 186.41 2.45%18-19 18.50 C 30.18 191.13 186.45 2.99%19-20 19.50 23 29.97 165.81 159.50 4.87%
19-20D 19.50 4A 30.22 135.11 129.69 5.45%20-21 20.50 44 30.13 119.14 115.85 3.84%21-22 21.50 11 30.02 200.31 196.28 2.42%22-23 22.50 39 29.86 231.23 226.67 2.32%23-24 23.50 47 30.25 219.68 215.68 2.16%24-25 24.50 20 30.26 214.83 211.51 1.83%28-29 28.50 33 30.17 192.46 188.46 2.53%32-33 32.50 35 30.16 227.29 223.43 2.00%35-36 35.50 24 30.21 212.45 207.16 2.99%36-37 36.50 16 30.13 193.23 186.50 4.30%37-38 37.50 32 30.03 139.61 128.05 11.79%38-39 38.50 12 30.06 163.45 156.21 5.74%
38-39D 38.50 2A 30.20 104.39 100.40 5.68%39-40 39.50 D 30.31 170.45 167.48 2.17%40-41 40.50 37 30.30 147.75 145.11 2.30%
40-41D 40.50 10A 30.08 123.94 121.88 2.24%43-44 43.50 29 30.20 82.01 80.87 2.25%46-47 46.50 6A 30.11 195.47 191.38 2.54%49-50 49.50 7A 29.86 185.93 182.31 2.37%52-53 52.50 15A 30.39 172.97 169.68 2.36%
52-53D 52.50 Z 30.21 101.54 99.81 2.49%
C.2

Water Content WL-5 Collection date: 17-Apr-05Analyst: Karen Waters-Husted Scale Number: 512-06-01-013
Analysis date: 18-Apr-05 Callibration date: 28-Feb-05
Sample ID Depth (ft) Beaker No.Beaker Wt.
(g)
Soil/Beaker Wet Wt.
(g)
Soil/Beaker Dry Wt.
(g) % Water Comments15-16 15.5 6A 30.13 217.62 213.60 2.19%16-17 16.5 26 30.18 233.29 228.92 2.20%17-18 17.5 22 30.06 250.42 245.40 2.33%18-19 18.5 56 30.13 261.76 254.37 3.30%19-20 19.5 47 30.28 291.65 278.27 5.40%20-21 20.5 30 29.98 305.18 287.82 6.73%21-22 21.5 13 30.18 264.39 254.83 4.26%22-23 22.5 46 29.89 277.68 265.89 5.00%23-24 23.5 4A 30.23 255.90 243.88 5.63%24-25 24.5 28 30.18 235.77 227.82 4.02%25-26 25.5 23 29.97 215.03 208.11 3.88%26-27 26.5 25 30.05 274.31 262.99 4.86%27-28 27.5 51 29.99 259.31 248.26 5.06%28-29 28.5 36 30.14 258.10 248.16 4.56%29-30 29.5 40 30.12 265.63 254.82 4.81%30-31 30.5 35 30.16 236.59 227.13 4.80%31-32 31.5 31 30.06 250.60 241.64 4.23%32-33 32.5 39 29.84 263.27 245.03 8.48%33-34 33.5 24 30.19 206.12 199.82 3.71%34-35 34.5 44 30.12 272.45 263.73 3.73%35-36 35.5 11 29.99 291.80 279.21 5.05%36-37 36.5 16 30.13 244.72 236.06 4.21%37-38 37.5 C 30.16 285.56 268.99 6.94%38-39 38.5 37 30.30 231.37 219.46 6.30%39-40 39.5 33 30.18 223.98 219.71 2.25%40-41 40.5 14 30.01 245.99 241.04 2.35%41-42 41.5 20 30.26 219.31 214.67 2.52%42-43 42.5 19 30.28 229.14 223.68 2.82%43-44 43.5 D 30.26 187.57 183.56 2.62%44-45 44.5 2A 30.22 250.89 244.64 2.91%45-46 45.5 32 30.00 231.22 225.84 2.75%46-47 46.5 12 30.07 216.31 211.44 2.69%47-48 47.5 10A 30.09 75.77 74.78 2.22%48-49 48.5 29 30.21 246.21 240.83 2.55%49-50 49.5 J 30.28 235.29 230.52 2.38%
C.3
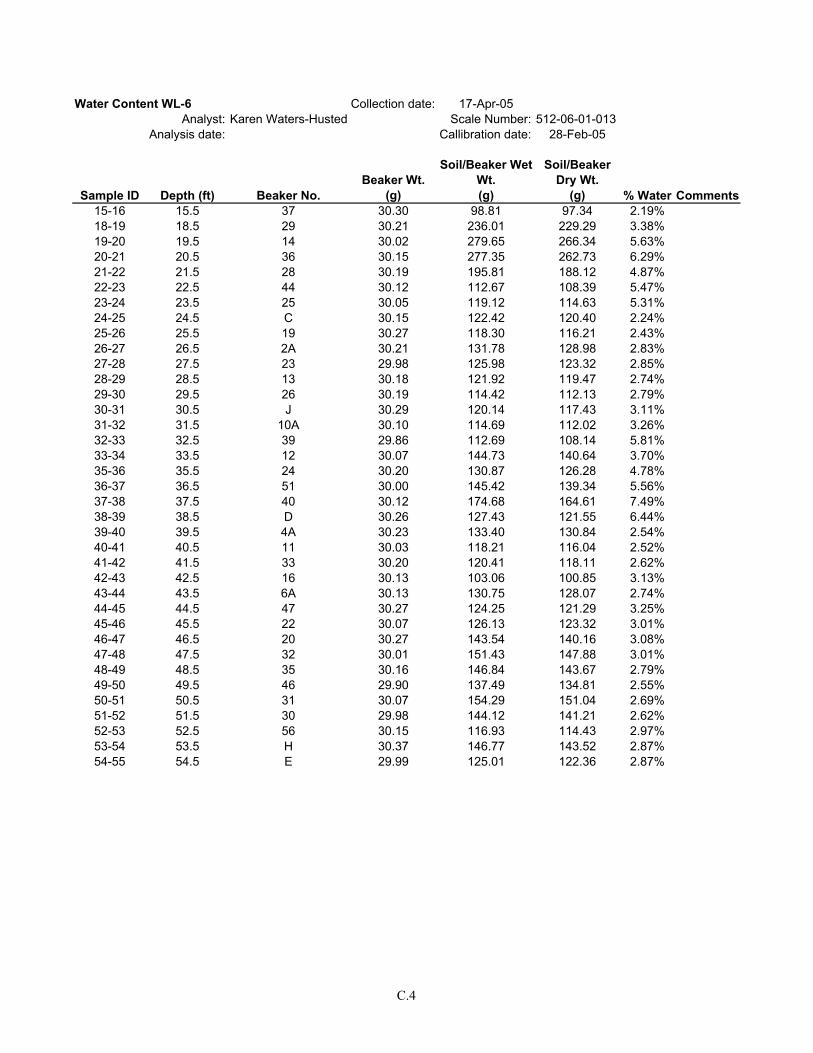
Water Content WL-6 Collection date: 17-Apr-05Analyst: Karen Waters-Husted Scale Number: 512-06-01-013
Analysis date: Callibration date: 28-Feb-05
Sample ID Depth (ft) Beaker No.Beaker Wt.
(g)
Soil/Beaker Wet Wt.(g)
Soil/Beaker Dry Wt.
(g) % Water Comments15-16 15.5 37 30.30 98.81 97.34 2.19%18-19 18.5 29 30.21 236.01 229.29 3.38%19-20 19.5 14 30.02 279.65 266.34 5.63%20-21 20.5 36 30.15 277.35 262.73 6.29%21-22 21.5 28 30.19 195.81 188.12 4.87%22-23 22.5 44 30.12 112.67 108.39 5.47%23-24 23.5 25 30.05 119.12 114.63 5.31%24-25 24.5 C 30.15 122.42 120.40 2.24%25-26 25.5 19 30.27 118.30 116.21 2.43%26-27 26.5 2A 30.21 131.78 128.98 2.83%27-28 27.5 23 29.98 125.98 123.32 2.85%28-29 28.5 13 30.18 121.92 119.47 2.74%29-30 29.5 26 30.19 114.42 112.13 2.79%30-31 30.5 J 30.29 120.14 117.43 3.11%31-32 31.5 10A 30.10 114.69 112.02 3.26%32-33 32.5 39 29.86 112.69 108.14 5.81%33-34 33.5 12 30.07 144.73 140.64 3.70%35-36 35.5 24 30.20 130.87 126.28 4.78%36-37 36.5 51 30.00 145.42 139.34 5.56%37-38 37.5 40 30.12 174.68 164.61 7.49%38-39 38.5 D 30.26 127.43 121.55 6.44%39-40 39.5 4A 30.23 133.40 130.84 2.54%40-41 40.5 11 30.03 118.21 116.04 2.52%41-42 41.5 33 30.20 120.41 118.11 2.62%42-43 42.5 16 30.13 103.06 100.85 3.13%43-44 43.5 6A 30.13 130.75 128.07 2.74%44-45 44.5 47 30.27 124.25 121.29 3.25%45-46 45.5 22 30.07 126.13 123.32 3.01%46-47 46.5 20 30.27 143.54 140.16 3.08%47-48 47.5 32 30.01 151.43 147.88 3.01%48-49 48.5 35 30.16 146.84 143.67 2.79%49-50 49.5 46 29.90 137.49 134.81 2.55%50-51 50.5 31 30.07 154.29 151.04 2.69%51-52 51.5 30 29.98 144.12 141.21 2.62%52-53 52.5 56 30.15 116.93 114.43 2.97%53-54 53.5 H 30.37 146.77 143.52 2.87%54-55 54.5 E 29.99 125.01 122.36 2.87%
C.4

Water Content WL-7 Collection date: 10-May-05Analyst: Karen Waters-Husted Scale Number: 512-06-01-013
Analysis date: 31-May-05 Callibration date: 28-Feb-05
Sample ID Depth (ft) Beaker No.Beaker Wt.
(g)
Soil/Beaker Wet Wt.
(g)
Soil/Beaker Dry Wt.
(g) % Water Comments15-16 15.5 10 26.86 230.87 225.50 2.70%16-17 16.5 55 29.86 222.31 217.15 2.76%17-18 17.5 2C 29.97 255.15 247.43 3.55%18-19 18.5 53 30.32 136.00 128.07 8.11%19-20 19.5 49 30.18 256.55 234.01 11.06%20-21 20.5 43 29.76 286.72 257.60 12.78%21-22 21.5 38 30.18 216.87 203.57 7.67%22-23 22.5 21 30.06 243.13 231.11 5.98%23-24 23.5 52 30.07 117.94 111.89 7.39%24-25 24.5 13 28.19 229.77 220.84 4.64%25-26 25.5 7 28.25 236.16 226.73 4.75%26-27 26.5 2 30.28 182.31 174.37 5.51%27-28 27.5 18 29.94 261.89 247.88 6.43%28-29 28.5 27 30.31 243.28 230.88 6.18%29-30 29.5 54 30.22 137.39 130.50 6.87%30-31 30.5 5 30.29 256.94 241.68 7.22%31-32 31.5 9 30.34 235.96 219.99 8.42%32-33 32.5 3 30.18 244.35 225.88 9.44%33-34 33.5 11 30.29 150.78 144.83 5.19%34-35 34.5 14 30.07 211.21 200.34 6.38%35-36 35.5 4 30.09 288.03 270.36 7.35%36-37 36.5 17 30.03 196.64 186.09 6.76%37-38 37.5 16 30.10 111.35 106.53 6.31%38-39 38.5 20 29.95 241.10 227.02 7.14%39-40 39.5 19 30.13 95.48 93.86 2.54%40-41 40.5 12 30.01 239.98 234.68 2.59%41-42 41.5 6 30.27 226.86 221.70 2.70%42-43 42.5 8 30.22 198.67 193.74 3.01%43-44 43.5 1 30.11 205.99 201.49 2.63%45-46 45.5 15 30.12 216.23 210.86 2.97%46-47 46.5 22 29.97 148.59 145.78 2.43%48-49 48.5 23 30.28 80.63 79.32 2.67%49-50 49.5 24 30.12 225.57 221.04 2.37%51-52 51.5 25 29.93 172.13 168.96 2.28%52-53 52.5 26 30.19 101.40 99.57 2.64%
C.5

Water Content WL-8 Collection date: 11-May-05Analyst: Karen Waters-Husted Scale Number: 512-06-01-013
Analysis date: 1-Jun-05 Callibration date: 28-Feb-05
Sample ID Depth (ft) Beaker No.Beaker Wt.
(g)
Soil/Beaker Wet Wt.(g)
Soil/Beaker Dry Wt.
(g) % Water Comments15-16 15.5 2 30.25 229.11 224.95 2.14%16-17 16.5 2C 29.95 213.30 209.55 2.09%17-18 17.5 3 30.17 248.81 244.03 2.24%18-19 18.5 4 30.09 176.84 171.61 3.70%19-20 19.5 5 30.27 131.12 125.67 5.71%20-21 20.5 7 28.25 262.42 250.24 5.49%21-22 21.5 9 30.28 262.34 252.13 4.60%22-23 22.5 10 26.86 252.56 243.50 4.18%23-24 23.5 11 30.28 93.70 89.65 6.82%24-25 24.5 13 28.15 221.68 217.38 2.27%25-26 25.5 14 30.07 181.41 178.04 2.28%26-27 26.5 16 30.09 195.47 191.44 2.50%27-28 27.5 17 30.03 247.45 241.58 2.77%28-29 28.5 18 29.93 172.56 168.77 2.73%29-30 29.5 20 29.95 81.38 80.12 2.51%30-31 30.5 21 30.07 233.64 227.49 3.12%31-32 31.5 27 30.30 215.31 209.76 3.09%32-33 32.5 38 30.17 257.33 243.83 6.32%33-34 33.5 43 29.76 136.41 132.00 4.31%34-35 34.5 49 30.16 250.89 238.86 5.76%35-36 35.5 52 30.06 239.66 227.70 6.05%36-37 36.5 53 30.33 110.67 106.72 5.17%37-38 37.5 54 30.20 121.84 117.45 5.03%38-39 38.5 55 29.85 135.91 129.67 6.25%39-40 39.5 28 30.21 209.05 204.76 2.46%40-41 40.5 1 30.01 219.44 214.74 2.54%41-42 41.5 2 30.25 210.19 205.60 2.62%42-43 42.5 3 30.18 68.22 67.33 2.40%43-44 43.5 4 30.09 169.74 166.01 2.74%44-45 44.5 5 30.28 259.00 252.87 2.75%45-46 45.5 6 30.26 91.52 89.94 2.65%46-47 46.5 7 28.25 116.75 114.62 2.47%47-48 47.5 8 30.21 218.65 214.25 2.39%48-49 48.5 9 30.28 217.63 213.07 2.49%49-50 49.5 10 26.86 231.97 226.34 2.82%50-51 50.5 11 30.28 226.42 221.70 2.47%51-52 51.5 12 30.00 222.65 218.05 2.45%52-53 52.5 13 28.15 92.75 91.17 2.51%53-54 53.5 14 30.06 178.47 174.73 2.59%
C.6

Water Content WL-9 Collection date: 10-May-05Analyst: Karen Waters-Husted Scale Number: 512-06-01-013
Analysis date: 31-May-05 Callibration date: 28-Feb-05
Sample ID Depth (ft) Beaker No.Beaker Wt.
(g)
Soil/Beaker Wet Wt.
(g)
Soil/Beaker Dry Wt.
(g) % Water Comments15-16 15.5 15 30.11 230.09 225.59 2.30%16-17 16.5 16 30.11 228.22 223.76 2.30%17-18 17.5 17 30.04 214.53 210.12 2.45%18-19 18.5 18 29.93 228.86 222.81 3.14%19-20 19.5 19 30.13 150.61 144.71 5.15%20-21 20.5 20 29.96 265.95 249.89 7.30%21-22 21.5 21 30.07 236.18 224.54 5.99%22-23 22.5 22 29.97 209.29 198.35 6.50%23-24 23.5 23 30.28 88.54 86.99 2.73%25-26 25.5 24 30.13 221.17 217.07 2.19%26-27 26.5 25 29.93 192.13 187.86 2.70%27-28 27.5 26 30.19 240.32 234.56 2.82%28-29 28.5 27 30.29 107.99 106.01 2.61%29-30 29.5 28 30.20 185.34 181.44 2.58%30-31 30.5 38 30.18 249.83 243.48 2.98%31-32 31.5 43 29.76 237.06 230.04 3.51%32-33 32.5 49 30.17 192.33 184.78 4.88%33-34 33.5 52 30.06 127.36 123.33 4.32%34-35 34.5 53 30.33 253.46 245.96 3.48%35-36 35.5 54 30.21 262.51 252.43 4.54%36-37 36.5 55 29.86 246.66 227.26 9.83%37-38 37.5 2C 29.94 118.66 109.99 10.83%38-39 38.5 29 30.15 175.18 168.65 4.71%39-40 39.5 30 30.12 105.67 102.10 4.96%40-41 40.5 31 30.19 237.68 228.81 4.47%41-42 41.5 32 30.22 222.74 217.27 2.92%42-43 42.5 1 30.02 205.51 201.38 2.41%43-44 43.5 2 30.25 177.40 173.30 2.87%44-45 44.5 3 30.16 202.25 197.75 2.69%45-46 45.5 4 30.09 215.63 211.31 2.38%46-47 46.5 5 30.27 205.75 201.75 2.33%47-48 47.5 6 30.26 85.91 84.69 2.24%48-49 48.5 7 28.25 210.06 205.30 2.69%49-50 49.5 8 30.19 224.12 216.90 3.87%50-51 50.5 9 30.27 130.00 124.84 5.46%51-52 51.5 10 26.86 234.68 224.82 4.98%52-53 52.5 11 30.28 249.55 237.42 5.86%53-54 53.5 12 30.00 263.20 250.98 5.53%54-55 54.5 13 28.15 241.91 231.61 5.06%55-56 55.5 14 30.06 194.46 186.73 4.93%56-57 56.5 15 30.12 256.11 248.36 3.55%
C.7

Water Content WL-10 Collection date: 11-May-05Analyst: Karen Waters-Husted Scale Number: 512-06-01-013
Analysis date: 1-Jun-05 Callibration date: 28-Feb-05
Sample ID Depth (ft) Beaker No.Beaker Wt.
(g)
Soil/Beaker Wet Wt.(g)
Soil/Beaker Dry Wt.
(g) % Water Comments15-16 15.5 32 30.22 227.02 222.86 2.16%
15-16A 15.5 13 28.16 199.65 184.23 9.88%16-17 16.5 16 30.09 224.52 220.38 2.18%17-18 17.5 38 30.17 248.90 243.82 2.38%18-19 18.5 43 29.75 258.83 250.88 3.60%19-20 19.5 17 30.03 147.38 140.11 6.60%20-21 20.5 18 29.92 265.96 251.22 6.66%21-22 21.5 19 30.13 249.27 238.94 4.95%22-23 22.5 20 29.96 246.98 232.91 6.93%23-24 23.5 21 30.08 96.74 94.37 3.69%24-25 24.5 22 29.97 211.03 203.98 4.05%25-26 25.5 23 30.27 257.21 247.27 4.58%26-27 26.5 24 30.12 251.73 240.81 5.18%27-28 27.5 25 29.93 233.59 223.39 5.27%28-29 28.5 26 30.19 132.51 127.56 5.08%29-30 29.5 27 30.29 251.46 239.52 5.71%30-31 30.5 28 30.19 245.03 231.73 6.60%31-32 31.5 29 30.14 257.95 243.00 7.02%32-33 32.5 30 30.12 265.28 242.60 10.67%33-34 33.5 31 30.19 129.69 124.19 5.85%34-35 34.5 49 30.16 273.59 261.30 5.32%35-36 35.5 52 30.07 128.37 123.47 5.25%36-37 36.5 53 30.32 266.76 248.78 8.23%37-38 37.5 54 30.20 126.54 117.08 10.89%38-39 38.5 55 29.87 168.93 158.42 8.18%39-40 39.5 2C 29.95 260.72 251.89 3.98%40-41 40.5 I 30.24 90.99 88.79 3.76%41-42 41.5 M 30.06 186.65 180.46 4.12%42-43 42.5 N 30.07 177.63 172.40 3.67%43-44 43.5 1 30.01 205.16 200.02 3.02%44-45 44.5 2 30.26 180.82 176.11 3.23%45-46 45.5 3 30.17 71.53 70.24 3.22%46-47 46.5 4 30.09 207.64 200.96 3.91%47-48 47.5 5 30.29 218.03 212.74 2.90%48-49 48.5 6 30.21 192.97 188.70 2.69%50-51 50.5 7 28.24 232.55 227.72 2.42%51-52 51.5 8 30.19 171.08 167.05 2.94%52-53 52.5 9 30.25 235.58 229.42 3.09%53-54 53.5 10 26.85 113.32 110.71 3.11%54-55 54.5 11 30.29 258.83 248.86 4.56%55-56 55.5 12 30.00 246.85 237.10 4.71%
C.8

Water Content WL-11 Collection date: 6-Jun-05Analyst: Karen Waters-Husted Scale Number: 512-06-01-013
Analysis date: 12-Jun-05 Callibration date: 28-Feb-05
Sample ID Depth (ft) Beaker No.Beaker Wt.
(g)
Soil/Beaker Wet Wt.
(g)
Soil/Beaker Dry Wt.
(g) % Water Comments15-16 15.5 1 29.99 228.53 224.16 2.25%16-17 16.5 2 30.25 234.45 230.00 2.23%17-18 17.5 3 30.18 235.04 230.12 2.46%18-19 18.5 4 30.10 243.37 236.74 3.21%19-20 19.5 5 30.28 283.10 267.10 6.76%20-21 20.5 6 30.26 277.32 262.28 6.48%21-22 21.5 7 28.24 275.17 260.37 6.38%23-24 23.5 8 30.20 185.90 181.81 2.70%24-25 24.5 9 30.27 251.16 245.52 2.62%25-26 25.5 10 26.85 221.02 213.02 4.30%26-27 26.5 11 30.29 237.89 229.43 4.25%27-28 27.5 12 30.01 270.12 260.62 4.12%28-29 28.5 13 28.16 222.80 214.54 4.43%29-30 29.5 14 30.07 196.47 189.64 4.28%30-31 30.5 15 30.11 199.42 192.09 4.53%31-32 31.5 16 30.07 243.11 232.85 5.06%32-33 32.5 17 30.03 223.24 211.31 6.58%33-34 33.5 18 29.93 245.04 233.47 5.68%34-35 34.5 19 30.12 244.22 234.11 4.96%35-36 35.5 20 29.95 249.77 231.26 9.19%36-37 36.5 21 30.06 240.73 217.45 12.42%37-38 37.5 22 29.98 220.70 202.75 10.39%38-39 38.5 23 30.27 230.59 221.51 4.75%39-40 39.5 24 30.11 200.80 192.76 4.94%40-41 40.5 25 29.94 166.75 160.68 4.64%41-42 41.5 26 30.19 201.36 193.23 4.99%42-43 42.5 27 30.30 218.60 211.12 4.14%43-44 43.5 28 30.19 60.32 59.14 4.08%44-45 44.5 29 30.14 180.47 174.45 4.17%45-46 45.5 30 30.12 157.36 152.59 3.89%46-47 46.5 31 30.18 186.23 180.61 3.74%47-48 47.5 32 30.19 42.12 41.69 3.74%48-49 48.5 33 30.04 100.85 98.62 3.25%49-50 49.5 38 30.17 192.41 186.13 4.03%50-51 50.5 43 29.76 218.45 209.96 4.71%51-52 51.5 49 30.16 236.38 227.85 4.31%52-53 52.5 52 30.07 227.61 217.45 5.42%53-54 53.5 53 30.32 250.86 239.69 5.34%54-55 54.5 54 30.21 206.62 196.89 5.84%55-56 55.5 55 29.86 233.86 222.92 5.67%
C.9

Water Content WL-12 Collection date: 9-Jun-05Analyst: Karen Waters-Husted Scale Number: 512-06-01-013
Analysis date: 14-Jun-05 Callibration date: 28-Feb-05
Sample ID Depth (ft) Beaker No.Beaker Wt.
(g)
Soil/Beaker Wet Wt.(g)
Soil/Beaker Dry Wt.
(g) % Water Comments15-16 15.5 1 30.00 226.92 222.52 2.29%16-17 16.5 2 30.25 236.74 232.08 2.31%17-18 17.5 3 30.17 255.49 250.15 2.43%18-19 18.5 4 30.09 233.70 227.04 3.38%19-20 19.5 5 30.27 201.59 190.37 7.01%20-21 20.5 6 30.26 257.82 246.06 5.45%21-22 21.5 7 28.25 214.89 210.56 2.38%22-23 22.5 8 30.20 218.23 213.66 2.49%23-24 23.5 9 30.27 222.42 218.59 2.03%24-25 24.5 10 26.85 71.41 70.67 1.69%25-26 25.5 11 30.28 269.73 264.53 2.22%26-27 26.5 12 30.00 242.83 237.50 2.57%27-28 27.5 13 28.15 244.23 238.96 2.50%28-29 28.5 14 30.06 225.26 220.44 2.53%29-30 29.5 15 30.11 217.60 212.70 2.68%30-31 30.5 16 30.09 255.76 249.69 2.76%31-32 31.5 17 30.03 242.34 233.86 4.16%32-33 32.5 18 29.93 220.35 215.65 2.53%33-34 33.5 19 30.12 197.40 185.81 7.44%34-35 34.5 20 29.95 267.42 254.15 5.92%35-36 35.5 21 30.07 265.87 255.69 4.51%36-37 36.5 22 29.97 248.60 237.34 5.43%37-38 37.5 23 30.27 280.55 254.80 11.47%38-39 38.5 24 30.11 253.56 245.54 3.72%39-40 39.5 25 29.92 202.04 195.04 4.24%40-41 40.5 26 30.19 243.00 234.57 4.12%41-42 41.5 27 30.29 222.21 214.70 4.07%42-43 42.5 28 30.19 223.21 215.55 4.13%43-44 43.5 29 30.15 236.45 226.60 5.01%44-45 44.5 30 30.11 209.28 200.99 4.85%45-46 45.5 31 30.18 236.92 227.49 4.78%46-47 46.5 32 30.21 222.11 213.72 4.57%47-48 47.5 33 30.04 228.85 219.69 4.83%48-49 48.5 38 30.16 245.47 235.17 5.02%49-50 49.5 43 29.75 246.15 235.64 5.10%50-51 50.5 49 30.16 257.10 245.68 5.30%51-52 51.5 52 30.06 254.35 242.47 5.59%52-53 52.5 53 30.33 252.41 239.50 6.17%53-54 53.5 54 30.21 265.50 252.48 5.86%54-55 54.5 55 29.85 270.62 254.34 7.25%55-56 55.5 M 30.05 254.74 242.02 6.00%
C.10
Appendix D
Anion Analytical Data

D.1
Anions in WELL WL-3A (S-7), ppmSample No Depth (ft) Date Dilution Fluoride Chloride Bromide Nitrate Phosphate Sulfate Thiosulfate Comments
WL_S7_17' 17.5 6/12/2001 1 0.45 8.21 0.03 1.47 0.06 27.9 <0.02WL_S7_18' 18.5 6/12/2001 1 0.4 4.83 0.17 0.89 0.07 22.9 <0.02WL_S7_19' 19.5 6/12/2001 1 0.45 0.76 0.14 1.15 0.1 11.2 <0.02WL_S7_20' 20.5 6/12/2001 1 0.3 0.56 0.1 0.24 0.09 4.93 0.6WL_S7_21' 21.5 6/12/2001 1 0.33 0.55 0.03 0.23 0.09 6 <0.02WL_S7_22' 22.5 6/12/2001 1 0.39 0.64 0.19 0.39 0.05 6.21 <0.02WL_S7_23' 23.5 6/12/2001 1 0.42 0.57 3.18 1.21 0.13 8.34 <0.02WL_S7_24' 24.5 6/12/2001 1 0.4 0.6 0.79 0.57 0.09 5.6 0.06WL_S7_25' 25.5 6/12/2001 1 0.47 0.65 0.38 0.55 0.08 5.47 0.04WL_S7_26' 26.5 6/12/2001 1 0.57 0.72 0.65 0.61 0.09 6.04 <0.02WL_S7_27' 27.5 6/12/2001 1 0.5 0.65 0.66 0.53 0.08 6.63 <0.02WL_S7_28' 28.5 6/12/2001 1 0.48 0.53 0.71 0.28 0.04 7.3 <0.02WL_S7_29' 29.5 6/12/2001 1 0.46 0.56 2.22 0.39 0.04 7 <0.02WL_S7_30' 30.5 6/12/2001 1 0.47 0.71 2.04 0.38 0.08 10 <0.02WL_S7_31' 31.5 6/12/2001 1 0.53 0.62 0.87 0.56 0.1 10.7 <0.02WL_S7_32' 32.5 6/12/2001 1 0.53 0.62 2.13 0.57 0.1 12.5 <0.02WL_S7_33' 33.5 6/12/2001 1 0.47 0.89 1.56 1.21 0.07 8.86 <0.02WL_S7_34' 34.5 6/12/2001 1 0.43 1.3 2.11 1.68 0.05 10.4 0.03WL_S7_35' 35.5 6/12/2001 1 0.41 4.14 0.66 5.19 0.08 18 0.05WL_S7_36' 36.5 6/12/2001 1 0.42 6.32 0.16 9.53 0.17 29.2 0.03WL_S7_37' 37.5 6/11/2001 1 0.52 9.54 0.06 14.5 0.12 38 <0.02WL_S7_38' 38.5 6/11/2001 1 0.37 7.5 0.08 10.7 0.16 27.9 <0.02WL_S7_39' 39.5 6/11/2001 1 0.33 3.14 0.05 2.94 0.09 14.6 0.04WL_S7_40' 40.5 6/12/2001 1 0.31 3.81 0.02 2.6 0.05 15.2 0.04WL_S7_48' 48.5 6/12/2001 1 0.34 2.17 0.01 1.53 0.07 12 0.03
Note: E- exceeded Upper Quantitation Limit
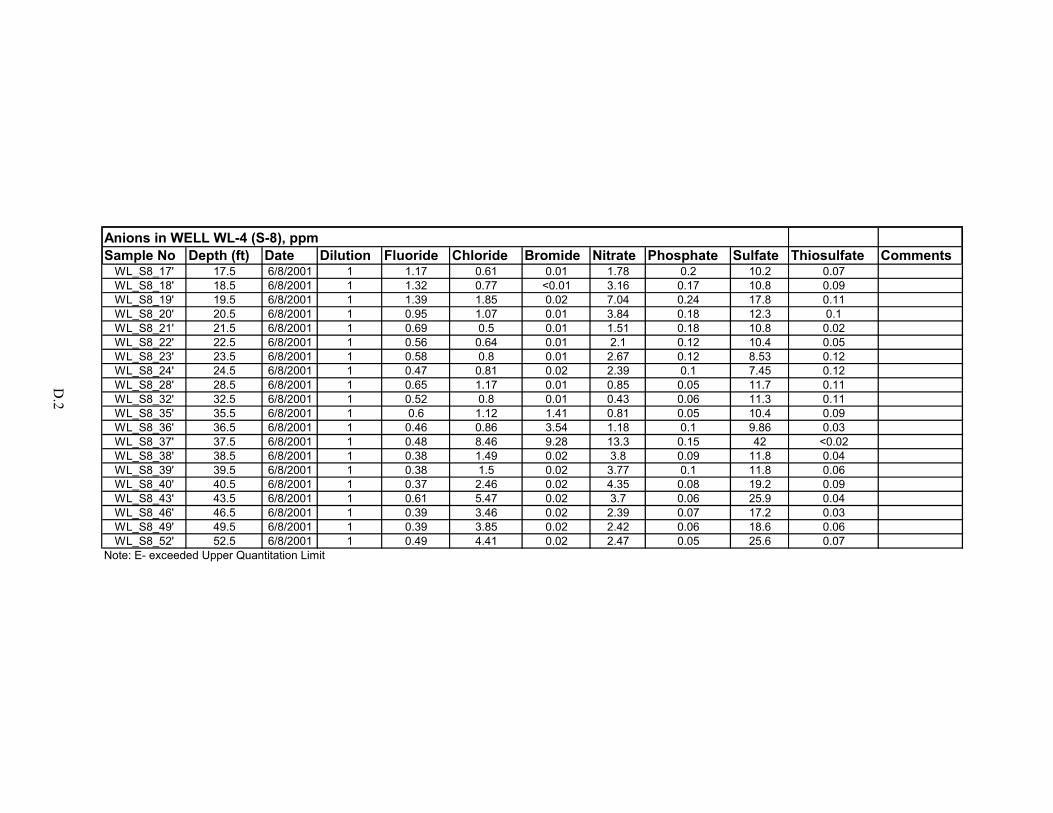
D.2
Anions in WELL WL-4 (S-8), ppmSample No Depth (ft) Date Dilution Fluoride Chloride Bromide Nitrate Phosphate Sulfate Thiosulfate Comments
WL_S8_17' 17.5 6/8/2001 1 1.17 0.61 0.01 1.78 0.2 10.2 0.07WL_S8_18' 18.5 6/8/2001 1 1.32 0.77 <0.01 3.16 0.17 10.8 0.09WL_S8_19' 19.5 6/8/2001 1 1.39 1.85 0.02 7.04 0.24 17.8 0.11WL_S8_20' 20.5 6/8/2001 1 0.95 1.07 0.01 3.84 0.18 12.3 0.1WL_S8_21' 21.5 6/8/2001 1 0.69 0.5 0.01 1.51 0.18 10.8 0.02WL_S8_22' 22.5 6/8/2001 1 0.56 0.64 0.01 2.1 0.12 10.4 0.05WL_S8_23' 23.5 6/8/2001 1 0.58 0.8 0.01 2.67 0.12 8.53 0.12WL_S8_24' 24.5 6/8/2001 1 0.47 0.81 0.02 2.39 0.1 7.45 0.12WL_S8_28' 28.5 6/8/2001 1 0.65 1.17 0.01 0.85 0.05 11.7 0.11WL_S8_32' 32.5 6/8/2001 1 0.52 0.8 0.01 0.43 0.06 11.3 0.11WL_S8_35' 35.5 6/8/2001 1 0.6 1.12 1.41 0.81 0.05 10.4 0.09WL_S8_36' 36.5 6/8/2001 1 0.46 0.86 3.54 1.18 0.1 9.86 0.03WL_S8_37' 37.5 6/8/2001 1 0.48 8.46 9.28 13.3 0.15 42 <0.02WL_S8_38' 38.5 6/8/2001 1 0.38 1.49 0.02 3.8 0.09 11.8 0.04WL_S8_39' 39.5 6/8/2001 1 0.38 1.5 0.02 3.77 0.1 11.8 0.06WL_S8_40' 40.5 6/8/2001 1 0.37 2.46 0.02 4.35 0.08 19.2 0.09WL_S8_43' 43.5 6/8/2001 1 0.61 5.47 0.02 3.7 0.06 25.9 0.04WL_S8_46' 46.5 6/8/2001 1 0.39 3.46 0.02 2.39 0.07 17.2 0.03WL_S8_49' 49.5 6/8/2001 1 0.39 3.85 0.02 2.42 0.06 18.6 0.06WL_S8_52' 52.5 6/8/2001 1 0.49 4.41 0.02 2.47 0.05 25.6 0.07
Note: E- exceeded Upper Quantitation Limit
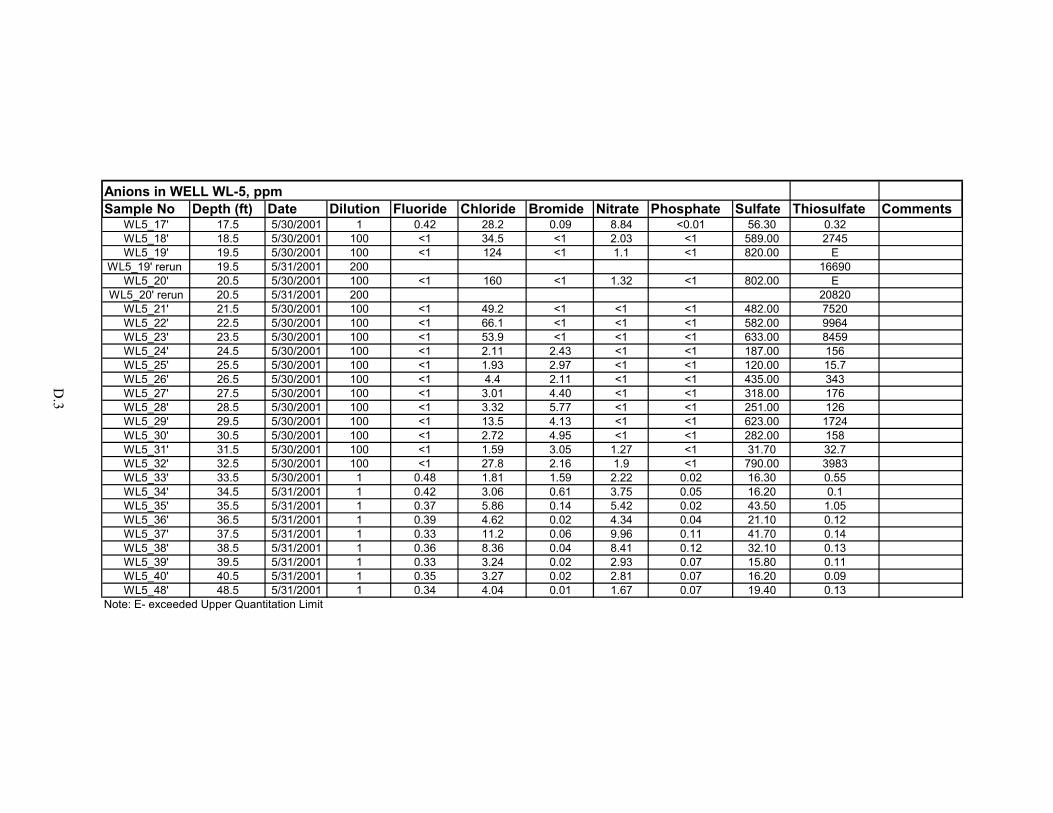
D.3
Anions in WELL WL-5, ppmSample No Depth (ft) Date Dilution Fluoride Chloride Bromide Nitrate Phosphate Sulfate Thiosulfate Comments
WL5_17' 17.5 5/30/2001 1 0.42 28.2 0.09 8.84 <0.01 56.30 0.32WL5_18' 18.5 5/30/2001 100 <1 34.5 <1 2.03 <1 589.00 2745WL5_19' 19.5 5/30/2001 100 <1 124 <1 1.1 <1 820.00 E
WL5_19' rerun 19.5 5/31/2001 200 16690WL5_20' 20.5 5/30/2001 100 <1 160 <1 1.32 <1 802.00 E
WL5_20' rerun 20.5 5/31/2001 200 20820WL5_21' 21.5 5/30/2001 100 <1 49.2 <1 <1 <1 482.00 7520WL5_22' 22.5 5/30/2001 100 <1 66.1 <1 <1 <1 582.00 9964WL5_23' 23.5 5/30/2001 100 <1 53.9 <1 <1 <1 633.00 8459WL5_24' 24.5 5/30/2001 100 <1 2.11 2.43 <1 <1 187.00 156WL5_25' 25.5 5/30/2001 100 <1 1.93 2.97 <1 <1 120.00 15.7WL5_26' 26.5 5/30/2001 100 <1 4.4 2.11 <1 <1 435.00 343WL5_27' 27.5 5/30/2001 100 <1 3.01 4.40 <1 <1 318.00 176WL5_28' 28.5 5/30/2001 100 <1 3.32 5.77 <1 <1 251.00 126WL5_29' 29.5 5/30/2001 100 <1 13.5 4.13 <1 <1 623.00 1724WL5_30' 30.5 5/30/2001 100 <1 2.72 4.95 <1 <1 282.00 158WL5_31' 31.5 5/30/2001 100 <1 1.59 3.05 1.27 <1 31.70 32.7WL5_32' 32.5 5/30/2001 100 <1 27.8 2.16 1.9 <1 790.00 3983WL5_33' 33.5 5/30/2001 1 0.48 1.81 1.59 2.22 0.02 16.30 0.55WL5_34' 34.5 5/31/2001 1 0.42 3.06 0.61 3.75 0.05 16.20 0.1WL5_35' 35.5 5/31/2001 1 0.37 5.86 0.14 5.42 0.02 43.50 1.05WL5_36' 36.5 5/31/2001 1 0.39 4.62 0.02 4.34 0.04 21.10 0.12WL5_37' 37.5 5/31/2001 1 0.33 11.2 0.06 9.96 0.11 41.70 0.14WL5_38' 38.5 5/31/2001 1 0.36 8.36 0.04 8.41 0.12 32.10 0.13WL5_39' 39.5 5/31/2001 1 0.33 3.24 0.02 2.93 0.07 15.80 0.11WL5_40' 40.5 5/31/2001 1 0.35 3.27 0.02 2.81 0.07 16.20 0.09WL5_48' 48.5 5/31/2001 1 0.34 4.04 0.01 1.67 0.07 19.40 0.13
Note: E- exceeded Upper Quantitation Limit

D.4
Anions in WELL WL-6, ppmSample No Depth (ft) Date Dilution Fluoride Chloride Bromide Nitrate Phosphate Sulfate Thiosulfate Comments
WL6_18' 18.5 6/1/2001 1 0.66 25.3 1.16 1.61 0.05 89.7 3.98WL6_19' rerun 19.5 6/1/2001 1 0.4 4.27 0.99 0.53 0.02 E 14.5
WL6_19' 19.5 5/31/2001 100 121WL6_20' 20.5 5/31/2001 100 143
WL6_20' rerun 20.5 6/1/2001 1 0.34 2.17 0.4 0.42 0.02 E 30.3WL6_21' 21.5 5/31/2001 100 109
WL6_21' rerun 21.5 6/1/2001 1 0.36 1.78 1.62 0.46 0.02 E 22.8WL6_22' 22.5 6/1/2001 1 0.5 1.1 0.71 0.38 0.14 10.3 0.14WL6_23' 23.5 6/1/2001 1 0.68 0.67 1.61 1 0.2 12.1 0.11WL6_24' 24.5 6/1/2001 1 0.64 0.74 0.64 1.3 0.11 11.9 0.02WL6_25' 25.5 6/1/2001 1 0.64 0.92 0.04 2.41 0.04 14.6 0.02WL6_26' 26.5 6/1/2001 1 0.6 1.11 0.01 3.39 0.12 18.4 0.05WL6_27' 27.5 6/1/2001 1 0.6 1.51 0.02 3.64 0.09 19.3 0.02WL6_28' 28.5 6/1/2001 1 0.62 1.61 0.01 4.18 0.13 20.3 0.08WL6_29' 29.5 6/1/2001 1 0.6 1.38 0.02 3.83 0.06 19.3 0.02WL6_30' 30.5 6/1/2001 1 0.64 1.67 0.09 4.84 0.11 19.5 <0.02WL6_31' 31.5 6/1/2001 1 0.61 2.62 0.04 4.7 0.11 18.2 <0.02WL6_32' 32.5 6/1/2001 1 0.75 2.34 2.06 4.4 0.09 27.3 0.14WL6_33' 33.5 6/1/2001 1 0.61 2.18 0.93 3.81 0.06 15 0.04WL6_35' 35.5 6/1/2001 1 0.66 3.62 0.04 6.12 0.1 24.4 0.05WL6_36' 36.5 6/1/2001 1 0.67 4.47 0.03 7.01 0.09 24.8 0.03WL6_37' 37.5 6/1/2001 1 0.65 7.39 0.04 7.85 0.08 31.7 0.04WL6_38' 38.5 6/1/2001 1 0.53 8.79 0.05 10.1 0.16 36.7 <0.02WL6_39' 39.5 6/1/2001 1 0.5 3.45 0.02 3.92 0.07 17.4 0.1WL6_40' 40.5 6/1/2001 1 0.52 5.28 0.02 1.56 0.06 20.3 0.04WL6_48' 48.5 6/1/2001 1 0.48 3.52 0.02 4.02 0.06 17.8 <0.02
Note: E- exceeded Upper Quantitation Limit

D.5
Anions in WELL WL-7, ppmSample No Depth (ft) Date Dilution Fluoride Chloride Bromide Nitrate Phosphate Sulfate Thiosulfate Comments
WL7_17' 17.5 6/1/2001 100 2.28 60.8 <1 5.99 <1 544 95.7WL7_18' 18.5 6/1/2001 100 <1 46.9 <1 1.89 <1 645 2703WL7_19' 19.5 6/1/2001 100 <1 58 <1 1.34 <1 734 7745WL7_20' 20.5 6/1/2001 100 <1 24.9 <1 <1 <1 302 3752WL7_21' 21.5 6/1/2001 100 <1 21.8 <1 <1 <1 414 3553WL7_22' 22.5 6/4/2001 100 <1 15.6 <1 <1 <1 504 2036WL7_23' 23.5 6/4/2001 100 <1 35.9 <1 <1 <1 463 4925WL7_24' 24.5 6/4/2001 100 <1 43.1 <1 <1 <1 423 6852WL7_25' 25.5 6/4/2001 100 <1 73.4 <1 <1 <1 488 E
WL7_25'.1 25.5 6/5/2001 200 11460WL7_26' 26.5 6/4/2001 100 <1 80.3 <1 <1 <1 528 E
WL7_26'.1 26.5 6/5/2001 200 12570WL7_27' 27.5 6/4/2001 100 <1 122 <1 <1 <1 700 E
WL7_27'.1 27.5 6/5/2001 300 17810WL7_28' 28.5 6/4/2001 100 <1 136 <1 <1 <1 785 E
WL7_28'.1 28.5 6/5/2001 300 20940WL7_29' 29.5 6/4/2001 100 <1 159 <1 <1 <1 664 E
WL7_29'.1 29.5 6/5/2001 400 23510WL7_30' 30.5 6/4/2001 100 <1 161 <1 <1 <1 984 E
WL7_30'.1 30.5 6/5/2001 400 24410WL7_31' 31.5 6/4/2001 100 <1 184 <1 <1 <1 E E
WL7_31'.1 31.5 6/5/2001 1000 1138 26490WL7_32' 32.5 6/4/2001 100 <1 238 <1 <1 <1 E E
WL7_32'.1 32.5 6/5/2001 1000 986 32400WL7_33' 33.5 6/4/2001 100 <1 133 <1 <1 <1 E E
WL7_33'.1 33.5 6/5/2001 1000 1015 19930WL7_34' 34.5 6/4/2001 100 <1 138 <1 <1 <1 E E
WL7_34'.1 34.5 6/5/2001 300 1088 20710WL7_35' 35.5 6/4/2001 100 <1 146 <1 <1 <1 E E
WL7_35'.1 35.5 6/5/2001 300 1241 21390WL7_36' 36.5 6/4/2001 100 <1 38.5 <1 <1 <1 739 5488 Sufite=40 ( tentatively)WL7_37' 37.5 6/5/2001 2 0.35 11.1 0.06 7.85 <0.02 136 10.8WL7_38' 38.5 6/5/2001 1 0.36 11.5 0.06 10.8 0.01 53.3 0.68WL7_40' 40.5 6/5/2001 1 0.43 3.48 <0.01 2.96 0.04 20.8 0.18WL7_48' 48.5 6/5/2001 1 0.48 5.44 0.02 2.41 0.05 27.3 0.57
Note: E- exceeded Upper Quantitation Limit

D.6
Anions in WELL WL-8, ppmSample No Depth (ft) Date Dilution Fluoride Chloride Bromide Nitrate Phosphate Sulfate Thiosulfate Comments
WL_8_17' 17.5 6/15/2001 1 0.37 22.7 0.07 1.53 0.06 27.7 0.12WL_8_18' 18.5 6/14/2001 2 0.31 30.6 0.88 2.17 <0.01 155 8.1WL_8_19' 19.5 6/13/2001 100 <1 35.1 <1 <1 45.4 945 3817WL_8_20' 20.5 6/13/2001 100 <1 62.9 <1 <1 49.5 1390 8118WL_8_21' 21.5 6/13/2001 100 <1 13 1.83 <1 <1 783 1598WL_8_22' 22.5 6/13/2001 100 <1 7.4 2.06 <1 <1 604 672WL_8_23' 23.5 6/15/2001 3 0.38 2.98 1.54 0.22 <0.03 364 60.4WL_8_24' 24.5 6/15/2001 1 0.5 0.85 0.58 1.68 0.15 13.3 0.18WL_8_25' 25.5 6/15/2001 1 0.56 0.84 0.02 1.93 0.12 15.6 0.18WL_8_26' 26.5 6/15/2001 1 0.56 0.97 0.01 2.51 0.08 18.6 0.13WL_8_27' 27.5 6/15/2001 1 0.55 1.77 0.02 3.6 0.06 20.4 0.11WL_8_28' 28.5 6/15/2001 1 0.53 1.83 0.02 3.77 0.06 20.2 0.09WL_8_29' 29.5 6/15/2001 1 0.54 2.03 0.02 4.37 0.07 28.4 0.2WL_8_30' 30.5 6/15/2001 1 0.48 2.19 0.02 4.63 0.08 25.3 0.09WL_8_31' 31.5 6/15/2001 1 0.46 3.45 0.02 5.02 0.07 27.2 0.11WL_8_32' 32.5 6/15/2001 100 <1 39.8 <1 2.94 3.34 1276 5191WL_8_33' 33.5 6/15/2001 2 0.39 3.92 1.11 4.12 <0.02 181.4 16.2WL_8_34' 34.5 6/15/2001 1 0.45 5.36 0.49 6.08 0.08 34.2 0.09WL_8_35' 35.5 6/15/2001 1 0.48 6.11 0.1 6.18 0.1 29.2 0.11WL_8_36' 36.5 6/15/2001 1 0.46 7.76 0.06 7.78 0.12 39 0.28WL_8_37' 37.5 6/15/2001 1 0.46 8.96 0.06 7.9 0.09 39.1 0.27WL_8_38' 38.5 6/15/2001 1 0.48 10.5 0.05 10.1 0.05 42.7 0.22WL_8_39' 39.5 6/15/2001 1 0.42 3.75 0.03 3.39 0.07 18.7 0.13WL_8_40' 40.5 6/15/2001 1 0.49 3.29 0.03 3.11 0.09 21.6 0.14WL_8_48' 48.5 6/14/2001 1 0.52 3.72 0.02 1.17 0.07 36.3 0.37
Note: E- exceeded Upper Quantitation Limit
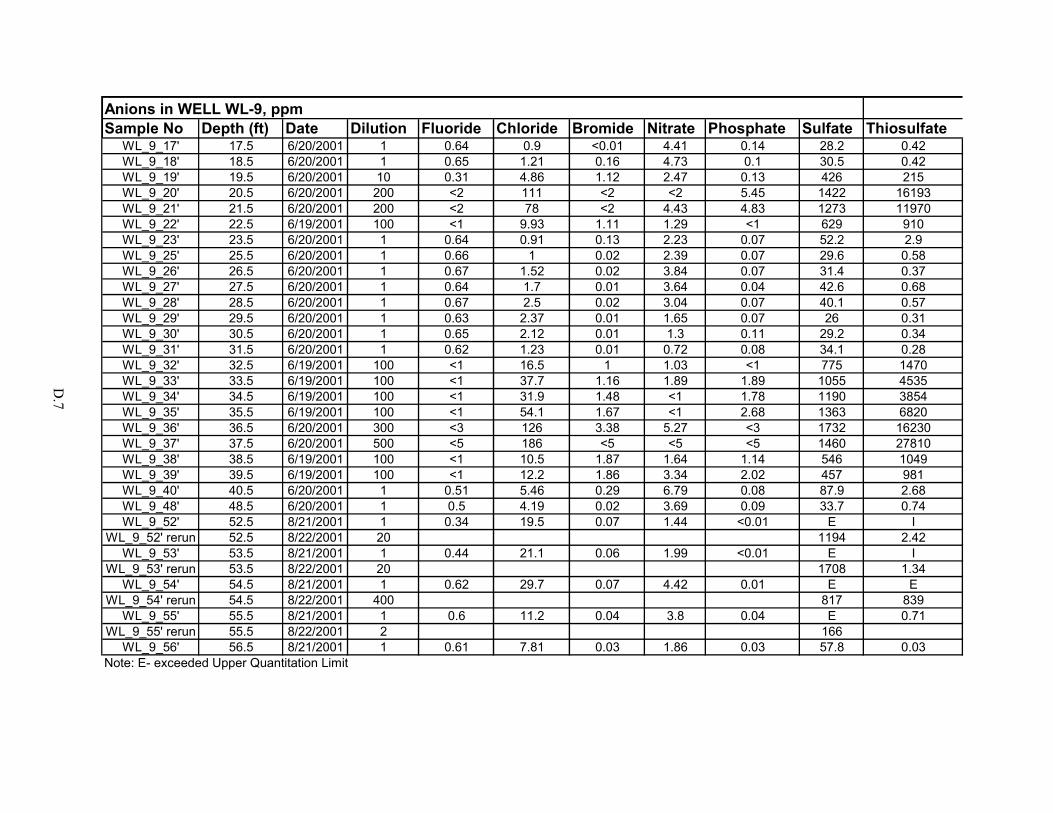
D.7
Anions in WELL WL-9, ppmSample No Depth (ft) Date Dilution Fluoride Chloride Bromide Nitrate Phosphate Sulfate Thiosulfate
WL_9_17' 17.5 6/20/2001 1 0.64 0.9 <0.01 4.41 0.14 28.2 0.42WL_9_18' 18.5 6/20/2001 1 0.65 1.21 0.16 4.73 0.1 30.5 0.42WL_9_19' 19.5 6/20/2001 10 0.31 4.86 1.12 2.47 0.13 426 215WL_9_20' 20.5 6/20/2001 200 <2 111 <2 <2 5.45 1422 16193WL_9_21' 21.5 6/20/2001 200 <2 78 <2 4.43 4.83 1273 11970WL_9_22' 22.5 6/19/2001 100 <1 9.93 1.11 1.29 <1 629 910WL_9_23' 23.5 6/20/2001 1 0.64 0.91 0.13 2.23 0.07 52.2 2.9WL_9_25' 25.5 6/20/2001 1 0.66 1 0.02 2.39 0.07 29.6 0.58WL_9_26' 26.5 6/20/2001 1 0.67 1.52 0.02 3.84 0.07 31.4 0.37WL_9_27' 27.5 6/20/2001 1 0.64 1.7 0.01 3.64 0.04 42.6 0.68WL_9_28' 28.5 6/20/2001 1 0.67 2.5 0.02 3.04 0.07 40.1 0.57WL_9_29' 29.5 6/20/2001 1 0.63 2.37 0.01 1.65 0.07 26 0.31WL_9_30' 30.5 6/20/2001 1 0.65 2.12 0.01 1.3 0.11 29.2 0.34WL_9_31' 31.5 6/20/2001 1 0.62 1.23 0.01 0.72 0.08 34.1 0.28WL_9_32' 32.5 6/19/2001 100 <1 16.5 1 1.03 <1 775 1470WL_9_33' 33.5 6/19/2001 100 <1 37.7 1.16 1.89 1.89 1055 4535WL_9_34' 34.5 6/19/2001 100 <1 31.9 1.48 <1 1.78 1190 3854WL_9_35' 35.5 6/19/2001 100 <1 54.1 1.67 <1 2.68 1363 6820WL_9_36' 36.5 6/20/2001 300 <3 126 3.38 5.27 <3 1732 16230WL_9_37' 37.5 6/20/2001 500 <5 186 <5 <5 <5 1460 27810WL_9_38' 38.5 6/19/2001 100 <1 10.5 1.87 1.64 1.14 546 1049WL_9_39' 39.5 6/19/2001 100 <1 12.2 1.86 3.34 2.02 457 981WL_9_40' 40.5 6/20/2001 1 0.51 5.46 0.29 6.79 0.08 87.9 2.68WL_9_48' 48.5 6/20/2001 1 0.5 4.19 0.02 3.69 0.09 33.7 0.74WL_9_52' 52.5 8/21/2001 1 0.34 19.5 0.07 1.44 <0.01 E I
WL_9_52' rerun 52.5 8/22/2001 20 1194 2.42WL_9_53' 53.5 8/21/2001 1 0.44 21.1 0.06 1.99 <0.01 E I
WL_9_53' rerun 53.5 8/22/2001 20 1708 1.34WL_9_54' 54.5 8/21/2001 1 0.62 29.7 0.07 4.42 0.01 E E
WL_9_54' rerun 54.5 8/22/2001 400 817 839WL_9_55' 55.5 8/21/2001 1 0.6 11.2 0.04 3.8 0.04 E 0.71
WL_9_55' rerun 55.5 8/22/2001 2 166WL_9_56' 56.5 8/21/2001 1 0.61 7.81 0.03 1.86 0.03 57.8 0.03
Note: E- exceeded Upper Quantitation Limit

D.8
Anions in WELL WL-10, ppmSample No Depth (ft) Date Dilution Fluoride Chloride Bromide Nitrate Phosphate Sulfate Thiosulfate Comments
WL_10_17' 17.5 6/22/2001 1 0.48 4.64 0.03 1.5 0.08 38.6 0.21WL_10_18' 18.5 6/21/2001 100 <1 9.84 <1 <1 <1 590 420WL_10_19' 19.5 6/21/2001 100 <1 5.2 <1 <1 1.76 337 320WL_10_20' 20.5 6/21/2001 100 <1 5.1 <1 <1 1.03 319 338WL_10_21' 21.5 6/21/2001 100 <1 4.5 <1 <1 328 284WL_10_22' 22.5 6/21/2001 100 <1 17.2 <1 <1 1.1 417 2015WL_10_23' 23.5 6/21/2001 100 <1 12.8 <1 <1 1.14 289 1583WL_10_24' 24.5 6/21/2001 100 <1 11.8 <1 <1 1 380 1421WL_10_25' 25.5 6/21/2001 100 <1 14.1 <1 <1 <1 471 1775WL_10_26' 26.5 6/21/2001 100 <1 17.2 <1 <1 1.15 475 2211WL_10_27' 27.5 6/21/2001 100 <1 20.2 <1 <1 1.19 461 2675WL_10_28' 28.5 6/21/2001 100 <1 39.5 <1 <1 <1 402 5746WL_10_29' 29.5 6/21/2001 100 <1 68.2 <1 <1 <1 663 E
WL_10_29' rerun 29.5 6/22/2001 200 10214WL_10_30' 30.5 6/21/2001 100 <1 98.4 <1 <1 2.04 793 E
WL_10_30' rerun 30.5 6/22/2001 200 14860WL_10_31' 31.5 6/21/2001 100 <1 134 <1 <1 1.33 E E
WL_10_31' rerun 31.5 6/22/2001 300 913 19600WL_10_32' 32.5 6/21/2001 100 <1 80.1 <1 <1 <1 733 E
WL_10_32' rerun 32.5 6/22/2001 200 11640WL_10_33' 33.5 6/21/2001 100 <1 50.7 <1 <1 <1 430 7413WL_10_34' 34.5 6/21/2001 100 <1 82 <1 <1 1.36 673 E
WL_10_34' rerun 34.5 6/22/2001 200 12220WL_10_35' 35.5 6/21/2001 100 <1 123 1.23 <1 2.98 587 E
WL_10_35' rerun 35.5 6/22/2001 300 17890WL_10_36' 36.5 6/21/2001 100 <1 189 <1 <1 3.47 E E
WL_10_36' rerun 36.5 6/22/2001 500 923 27200WL_10_38' 38.5 6/21/2001 100 <1 159 <1 1.97 4.16 905 E
WL_10_38' rerun 38.5 6/22/2001 500 23620WL_10_39' 39.5 6/21/2001 100 <1 13.8 <1 3.27 <1 601 1294WL_10_40' 40.5 6/21/2001 100 <1 6.37 <1 4.53 7.04 241 249WL_10_48' 48.5 6/22/2001 100 0.38 2.72 0.01 2.27 0.04 17.2 <0.02WL_10_51' 51.5 8/21/2001 1 0.59 5.33 0.02 0.1 0.02 48.1 0.03WL_10_52' 52.5 8/21/2001 1 0.64 5.79 0.02 0.71 0.05 51.6 <0.02WL_10_53' 53.5 8/21/2001 1 0.43 5.43 0.03 0.01 1.05 E 39.5
WL_10_53' rerun 53.5 8/22/2001 4 282WL_10_54' 54.5 8/21/2001 1 0.47 3.51 0.02 0.53 0.03 41.4 <0.02WL_10_55' 55.5 8/21/2001 1 0.58 8.88 0.04 1.58 0.01 55.4 <0.02
Note: E- exceeded Upper Quantitation Limit

D.9
Anions in WELL W -11, ppmSample No Depth (ft) Date Dilution Fluoride Chloride Bromide Nitrate Phosphate Sulfate Thiosulfate Comments
WL_11_17' 17.5 6/22/2001 1 0.65 1.64 0.01 3.9 0.16 28.5 0.45WL_11_18' 18.5 6/22/2001 100 <1 9.3 <1 2.78 <1 425 376WL_11_19' 19.5 6/22/2001 100 <1 20.9 <1 <1 1.42 620 2263WL_11_20' 20.5 6/22/2001 100 <1 37.7 <1 <1 <1 503 5598WL_11_21' 21.5 6/22/2001 100 <1 86.5 <1 <1 1.49 576 E
WL_11_21' rerun 21.5 6/25/2001 200 13710WL_11_23' 23.5 6/22/2001 100 <1 4.03 <1 1.85 <1 205 219WL_11_24' 24.5 6/22/2001 100 <1 6.23 <1 2.07 4.11 298 487WL_11_25' 25.5 6/22/2001 100 <1 35.5 <1 1.4 <1 644 4138WL_11_26' 26.5 6/22/2001 100 <1 17.4 <1 1.69 <1 770 2084WL_11_27' 27.5 6/22/2001 100 <1 3.38 3.7 <1 <1 355 33.4WL_11_28' 28.5 6/25/2001 1 0.56 1.16 4.55 1.05 0.06 88.3 0.08WL_11_29' 29.5 6/22/2001 100 168
WL_11_29' rerun 29.5 6/25/2001 1 0.48 1.98 3.87 0.73 0.06 E 14.1WL_11_30' 30.5 6/25/2001 2 0.52 1.72 1.91 0.99 0.06 213 0.06WL_11_31' 31.5 6/25/2001 1 0.62 2.22 0.86 4.95 0.06 42.5 0.12WL_11_32' 32.5 6/22/2001 100 <1 22.7 <1 1.91 1.28 589 2442WL_11_33' 33.5 6/22/2001 100 <1 32.9 <1 <1 <1 676 4384WL_11_34' 34.5 6/22/2001 100 <1 41.9 <1 <1 <1 638 6105WL_11_35' 35.5 6/22/2001 100 <1 93 <1 <1 1.58 705 E
WL_11_35' rerun 35.5 6/25/2001 200 15460WL_11_36' 36.5 6/25/2001 100 <1 236 <1 <1 9.01 951 E
WL_11_36' rerun 36.5 6/26/2001 1000 30030WL_11_37' 37.5 6/25/2001 100 <1 234 <1 <1 9.82 852 E
WL_11_37' rerun 37.5 6/26/2001 1000 30060WL_11_38' 38.5 6/25/2001 100 <1 82.9 <1 <1 5.6 493 E
WL_11_38' rerun 38.5 6/26/2001 300 11560WL_11_39' 39.5 6/25/2001 100 <1 81.7 <1 <1 2.98 462 E
WL_11_39' rerun 39.5 6/26/2001 300 11520WL_11_40' 40.5 6/25/2001 100 <1 65 <1 <1 3.35 532 E
WL_11_40' rerun 40.5 6/26/2001 300 8940WL_11_48' 48.5 6/25/2001 1 0.36 7.11 0.01 5.58 0.07 E E
WL_11_48' rerun 48.5 6/26/2001 3 152 132WL_11_51' 51.5 8/21/2001 1 1.27 41.2 0.09 3.06 <0.01 E E
WL_11_51' rerun 51.5 8/22/2001 400 808 2904WL_11_52' 52.5 8/21/2001 1 1.62 43.3 0.09 5 I E E
WL_11_52' rerun 52.5 8/22/2001 400 1.36 1073 2741WL_11_53' 53.5 8/21/2001 1 0.49 15.6 0.05 4.77 0.14 E 53.5
WL_11_53' rerun 53.5 8/23/2001 10 818WL_11_54' 54.5 8/21/2001 1 0.88 36.6 0.09 5.18 I E E
WL_11_54' rerun 54.5 8/22/2001 400 3.85 1159 1754WL_11_55' 55.5 8/21/2001 1 0.47 13.7 0.06 3.31 0.11 E E
WL_11_55' rerun 55.5 8/23/2001 10 640 206Note: E- exceeded Upper Quantitation Limit
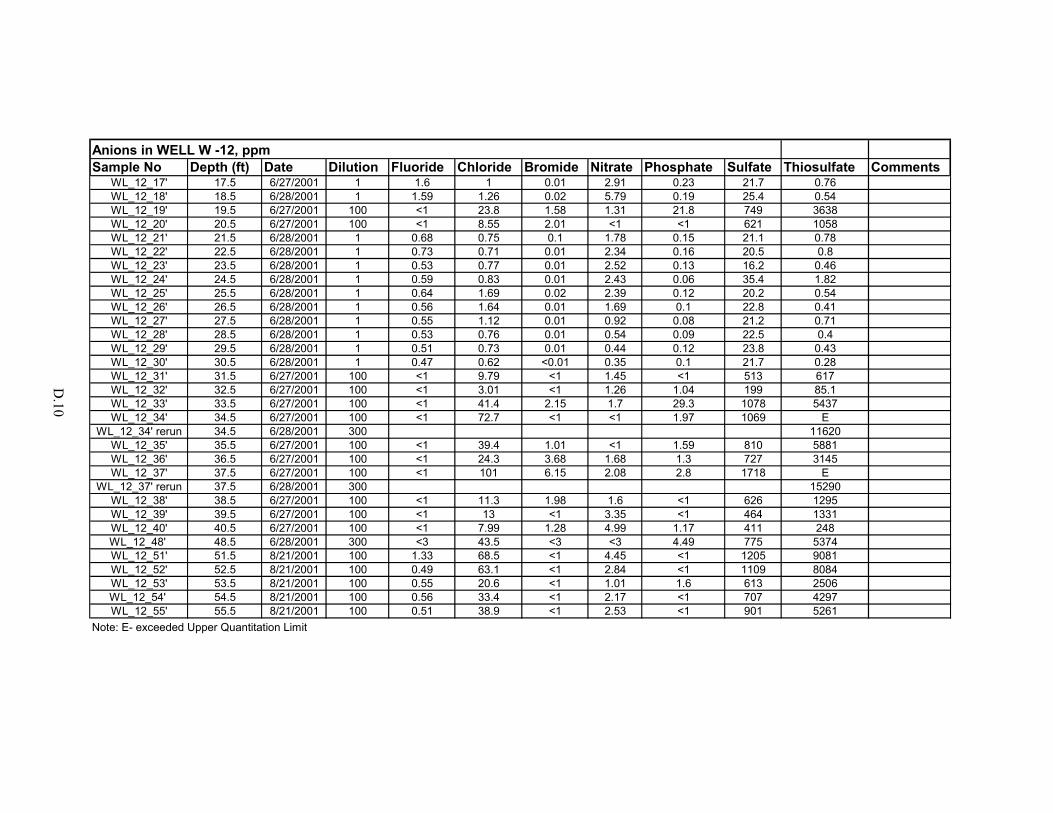
D.10
Anions in WELL W -12, ppmSample No Depth (ft) Date Dilution Fluoride Chloride Bromide Nitrate Phosphate Sulfate Thiosulfate Comments
WL_12_17' 17.5 6/27/2001 1 1.6 1 0.01 2.91 0.23 21.7 0.76WL_12_18' 18.5 6/28/2001 1 1.59 1.26 0.02 5.79 0.19 25.4 0.54WL_12_19' 19.5 6/27/2001 100 <1 23.8 1.58 1.31 21.8 749 3638WL_12_20' 20.5 6/27/2001 100 <1 8.55 2.01 <1 <1 621 1058WL_12_21' 21.5 6/28/2001 1 0.68 0.75 0.1 1.78 0.15 21.1 0.78WL_12_22' 22.5 6/28/2001 1 0.73 0.71 0.01 2.34 0.16 20.5 0.8WL_12_23' 23.5 6/28/2001 1 0.53 0.77 0.01 2.52 0.13 16.2 0.46WL_12_24' 24.5 6/28/2001 1 0.59 0.83 0.01 2.43 0.06 35.4 1.82WL_12_25' 25.5 6/28/2001 1 0.64 1.69 0.02 2.39 0.12 20.2 0.54WL_12_26' 26.5 6/28/2001 1 0.56 1.64 0.01 1.69 0.1 22.8 0.41WL_12_27' 27.5 6/28/2001 1 0.55 1.12 0.01 0.92 0.08 21.2 0.71WL_12_28' 28.5 6/28/2001 1 0.53 0.76 0.01 0.54 0.09 22.5 0.4WL_12_29' 29.5 6/28/2001 1 0.51 0.73 0.01 0.44 0.12 23.8 0.43WL_12_30' 30.5 6/28/2001 1 0.47 0.62 <0.01 0.35 0.1 21.7 0.28WL_12_31' 31.5 6/27/2001 100 <1 9.79 <1 1.45 <1 513 617WL_12_32' 32.5 6/27/2001 100 <1 3.01 <1 1.26 1.04 199 85.1WL_12_33' 33.5 6/27/2001 100 <1 41.4 2.15 1.7 29.3 1078 5437WL_12_34' 34.5 6/27/2001 100 <1 72.7 <1 <1 1.97 1069 E
WL_12_34' rerun 34.5 6/28/2001 300 11620WL_12_35' 35.5 6/27/2001 100 <1 39.4 1.01 <1 1.59 810 5881WL_12_36' 36.5 6/27/2001 100 <1 24.3 3.68 1.68 1.3 727 3145WL_12_37' 37.5 6/27/2001 100 <1 101 6.15 2.08 2.8 1718 E
WL_12_37' rerun 37.5 6/28/2001 300 15290WL_12_38' 38.5 6/27/2001 100 <1 11.3 1.98 1.6 <1 626 1295WL_12_39' 39.5 6/27/2001 100 <1 13 <1 3.35 <1 464 1331WL_12_40' 40.5 6/27/2001 100 <1 7.99 1.28 4.99 1.17 411 248WL_12_48' 48.5 6/28/2001 300 <3 43.5 <3 <3 4.49 775 5374WL_12_51' 51.5 8/21/2001 100 1.33 68.5 <1 4.45 <1 1205 9081WL_12_52' 52.5 8/21/2001 100 0.49 63.1 <1 2.84 <1 1109 8084WL_12_53' 53.5 8/21/2001 100 0.55 20.6 <1 1.01 1.6 613 2506WL_12_54' 54.5 8/21/2001 100 0.56 33.4 <1 2.17 <1 707 4297WL_12_55' 55.5 8/21/2001 100 0.51 38.9 <1 2.53 <1 901 5261
Note: E- exceeded Upper Quantitation Limit

PNNL-13631
Distr.1
Distribution No. of Copies OFFSITE 5 T. G. Caldwell Earth and Ecosystem Science Desert Research Institute 2215 Raggio Parkway Reno, NV 89512 ONSITE 4 DOE Richland Operations Office B. L. Foley H0-12 J. P. Hanson K8-50 R. D. Hildebrand A5-13 K. M. Thompson A5-13 3 Bechtel Hanford, Inc. K. R. Fecht H0-02 B. H. Ford H0-21 M. J. Graham H0-09
No. of Copies CH2M HILL Hanford Group F. M. Mann H0-22 Fluor Federal Services R. Khaleel B4-43 25 Pacific Northwest National Laboratory M. J. Fayer K9-33 M. D. Freshley H0-21 G. W. Gee (5) K9-33 D. G. Horton K6-81 G. V. Last (5) K6-81 W. J. Martin K6-81 G. W. McNair H0-21 P. D. Meyer BPO A. T. Owen (5) K6-81 S. P. Reidel K6-81 A. L. Ward K9-33 F. Z. Zhang K9-33 Hanford Technical Library (2) P8-55