sample - sasta · sample only sasta year 9 ... understandings and skills of the australian...
TRANSCRIPT

SAMPLE O
NLY
SASTA Year 9 Practical Workbook
4
About this book
This student workbook provides a hands-on program of science investigations developed by
SASTA in conjunction with Thomas More College. It has been carefully written to ensure that
students can work confidently and independently, developing and enhancing the
understandings and skills of the Australian Curriculum: Science.
The 22 practical investigations in the workbook are in four main sections; Biological sciences,
Chemical sciences, Earth and space science and Physical sciences. They cover the entire scope
and sequence of the Year 9 Australian Curriculum: Science, with an emphasis on the Science
Inquiry Skills, including practical design.
To reflect the emerging emphasis on STEM skills and dispositions, each of the four sections
includes one Engineering Design Challenge. This challenge asks students to apply their content
knowledge and skills to create solutions to real world applications of science.
A Curriculum map is provided on pages 6 and 7.
An assessment rubric has been developed for each practical investigation. This rubric assesses
students level of achievement of the Science Inquiry Skills relevant to the practical and has been
developed using the Australian Curriculum Achievement Standards.
The workbook includes introductory sections that build necessary skills and provide clear
guidelines for scientific literacy.
Each practical has a consistent format with language that reflects that of the Australian
Curriculum; Science.
Each investigation has been tested by teachers and students to ensure usefulness and
feasibility.
Safety is always of upmost concern and we encourage students and teachers to make
themselves aware of safety procedures for each practical investigation and wear personal
protective equipment at all times.

SAMPLE O
NLY
SASTA Year 9 Practical Workbook
5
Contents
Curriculum Overview....................................................................................................................... 7
Science understanding ................................................................................................................. 7
Science as a human endeavour .................................................................................................... 7
Science inquiry skills ..................................................................................................................... 8
Safety in the Science Laboratory .................................................................................................... 9
Equipment ..................................................................................................................................... 10
Light microscope ........................................................................................................................ 10
Bunsen burner ............................................................................................................................ 11
Working Scientifically .................................................................................................................... 14
Variables and investigatable questions ...................................................................................... 14
Hypotheses ................................................................................................................................. 14
Conclusions................................................................................................................................. 15
Graphing ..................................................................................................................................... 16
Measurement ............................................................................................................................. 19
PRACTICALS
Biological Sciences ......................................................................................................................... 37
Practical 1 – Home is where the heart is ................................................................................... 39
Practical 2 – Responding to stimuli ............................................................................................ 43
Practical 3 – Clear that artery (Engineering Design Challenge) ................................................. 48
Practical 4 – Fighting infection ................................................................................................... 52
Practical 5 – Fueling the ecosystem ........................................................................................... 58
Practical 6 – Ecosystems on your doorstep ............................................................................... 52
Practical 7 – Nutrient impact ..................................................................................................... 58
Chemical Sciences.......................................................................................................................... 65
Practical 8 – Conservation of mass ............................................................................................. 67
Practical 9 – Decomposition reactions ....................................................................................... 75
Practical 10 – Energy changes in chemical reactions.................................................................. 79
Practical 11 – Fighting combustion ............................................................................................. 87
Practical 12 – Reactions in nature .............................................................................................. 87
Practical 13 - Indicators .............................................................................................................. 94
Practical 14 - Neutralisation........................................................................................................ 97
Practical 15 – Soft impact (Engineering Design Challenge) ...................................................... 103

SAMPLE O
NLY
SASTA Year 9 Practical Workbook
6
Earth and Space Sciences ............................................................................................................ 111
Practical 16 – Observing convection ......................................................................................... 113
Practical 17 – Sea floor spreading ............................................................................................. 119
Practical 18 – Rock of ages ........................................................................................................ 125
Practical 19 – Recording earthquakes (Engineering Design Challenge) ................................... 133
Physical Sciences ......................................................................................................................... 131
Practical 20 – Modelling energy transfer through waves ......................................................... 139
Practical 21 – Pitch perfect ....................................................................................................... 149
Practical 22 – Potato battery (Engineering Design Challenge) ................................................. 157

SAMPLE O
NLY
SASTA Year 9 Practical Workbook Biological sciences
34
Practical 3 – Clear that artery – ENGINEERING DESIGN CHALLENGE
Background
In a correctly working human circulatory system, blood vessels are clean and smooth, however, sometimes material (plaque) coats the interior walls of blood vessels. This plaque, whether it hardens and stays in place, or hardens and gets dislodged, can block or restrict the normal movement of blood through the body, leading to problems such as heart attacks or strokes.
If one of the heart’s coronary arteries gets clogged, the heart muscle does not receive sufficient
oxygen-rich blood, the muscle begins to die. The result is a myocardial infarction, or heart attack.
Design Challenge
To create a device that could remove or flatten built up plaque material inside artery walls.
Materials:
• 2 model "blocked arteries" per group, made from about 10 cm clear flexible tubing,
approx. 3.8 cm in diameter, clogged with play dough (or icing)
• 1 clear piece of tubing 10 cm long per group as a control.
• clown balloons (long and thin)
• air pump, for clown balloons
• straws
• paper clips
• thin wire
• pipe cleaners
• rubber bands
• tape
• other equipment as available e.g. swizzle sticks, bin ties, alfoil.
• water source
• 2 L container (from which to pour the same volume of water)
• large jug, bin or container, to catch poured water
Preparing the blocked arteries:
1. Cut enough tubing so that each group has four 5 cm pieces.
2. Pack the icing or playdough into each of the 5 cm tubes until the icing is approximately 2cm.
deep.
3. Tape two of the tubes together with transparent tape so that the icing makes one complete (4
cm) section in the centre of the now 10 cm ‘artery’.
4. Chill the “arteries” overnight in a refrigerator.
5. Using a straw, create a narrow opening in each of the “arteries” to allow minimal blood flow.

SAMPLE O
NLY
SASTA Year 9 Practical Workbook Biological sciences
35
Defining the problem
• Notice that the icing is packed in the centre of the tubing and not easily accessed.
• What are some of the difficulties doctors might face during the procedure to clear the
artery?
• How big would the hole need to be to restore blood flow?
• Could a doctor scrape away all the plaque? What effect would this have on the walls of
the arteries? As you saw in the heart-dissection, the arteries are soft tissue and can be
easily torn or punctured, causing bleeding.
• Could you push the plaque all the way through the artery? What do you think happens
to the plaque that breaks off and is carried away in the bloodstream?
Success criteria:
The device needs to create maximum blood flow through the artery.
The increase in blood flow needs to be quantifiable.
Constraints:
Keep as much plaque as possible in the tube.
Clear a path for blood flow by pushing the plaque to the sides of the artery.
Research
• Collect your blocked arteries and your clear artery.
• Time how long it takes for two litres of water to flow through the clear piece of tubing at a 45° angle versus through a blocked piece of tubing at the same angle.
• Record these measurements in table 1.
• Calculate the flow rate in both the clear and the clogged artery. Flow rate = Fluid Volume/time
Artery type Time for 2 L of water to flow through artery (s) Flow rate
Clear artery
Blocked artery

SAMPLE O
NLY
SASTA Year 9 Practical Workbook Biological sciences
36
Imagine
• Brainstorm ideas for clearing your clogged arteries. Record your ideas here.
Plan
• Find a consensus design, the idea that you think will work best and decide how you will design it.
• Make a specific design plan, including list of materials and a labelled diagram.

SAMPLE O
NLY
SASTA Year 9 Practical Workbook Biological sciences
37
Create
• Build your design prototype.
• This step may not go as planned. You may need to brainstorm new designs and/or create on-the-spot modifications and improvements to your plan.
• Any changes should be documented.
Test and evaluate
• Test your designs and evaluate whether the design works according to the established success criteria. Does it work? Does it solve the problem?
• Measure success by timing how fast 2 L of water flows through your cleared artery after the treatment method. Hold the arteries at 45° angle while the water flows. Record these measurements.
• What percentage increase in flow was there in the cleared artery?
• Did you apply the constraints when creating your design?
• Look at the designs of other groups. What works? What doesn’t work?

SAMPLE O
NLY
SASTA Year 9 Practical Workbook Biological sciences
38
Evaluate and redesign
• Decide how to improve your design, based on the analysis of the data from the testing stage.
• The data and observations can come from your own testing or from observing other teams.
• Discuss improvements and draw up another design, create and retest.
Communicate
Design a way to share your designed solution and the results. (video, posters, digital representations, photography, story boards……) What choices did you make? (with regard to materials, construction, shape, sustainability etc.) What were the reasons for your choices? What alternatives did you consider? How did you make your decision? Were there any scientific concepts considered in your reasoning? Describe how successful you were in meeting the criteria and keeping within the constraints. Did the tests give you the results you expected? Did your choices work as intended? Did you notice anything that you didn't originally think about? Reflect on the procedure of clearing the artery. Did your procedure mimic real-life surgery?
Did you dislodge any of the plaque from the artery?
Did you enter the tubes from both sides? How would a surgeon access both ends of
an artery?
How long did it take to perform your procedures? What effect could this have on the
patient? How is blood circulated through the body while a patient’s heart is being
operated on?
What information would inform your next design?
What factors would influence your next design choices?
SAMPLEONLY
SASTA Year 9 Practical Workbook Biological sciences
39
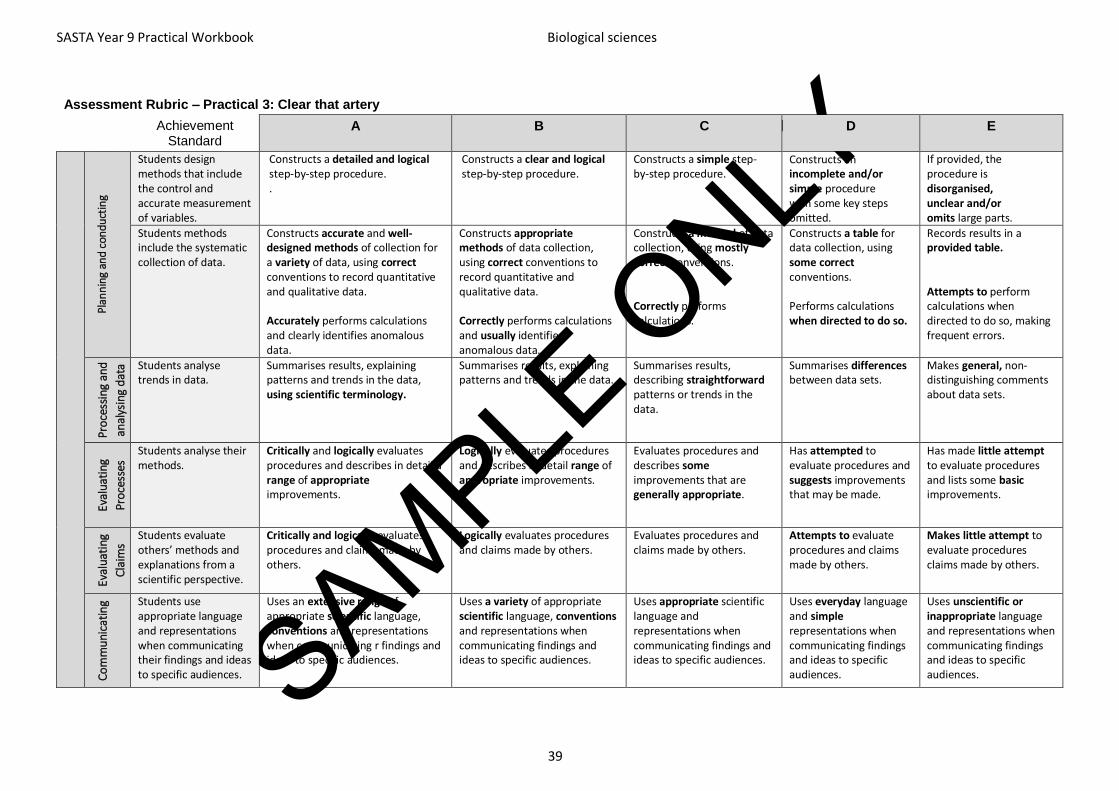
Assessment Rubric – Practical 3: Clear that artery
Achievement Standard
A B C D E
Plan
nin
g an
d co
ndu
ctin
g
Students design methods that include the control and accurate measurement of variables.
Constructs a detailed and logical step-by-step procedure. .
Constructs a clear and logical step-by-step procedure.
Constructs a simple step-by-step procedure.
Constructs an incomplete and/or simple procedure with some key steps omitted.
If provided, the procedure is disorganised, unclear and/or omits large parts.
Students methods include the systematic collection of data.
Constructs accurate and well-designed methods of collection for a variety of data, using correct conventions to record quantitative and qualitative data.
Accurately performs calculations and clearly identifies anomalous data.
Constructs appropriatemethods of data collection, using correct conventions to record quantitative andqualitative data.
Correctly performs calculations and usually identifies anomalous data.
Constructs a method of datacollection, using mostly correct conventions.
Correctly performs calculations.
Constructs a table for data collection, using some correct conventions.
Performs calculations when directed to do so.
Records results in a provided table.
Attempts to perform calculations when directed to do so, making frequent errors.
Pro
cess
ing
and
anal
ysin
g d
ata
and
info
rmat
ionStudents analyse
trends in data.
Summarises results, explaining patterns and trends in the data, using scientific terminology.
Summarises results, explainingpatterns and trends in the data.
Summarises results, describing straightforward patterns or trends in the data.
Summarises differences between data sets.
Makes general, non- distinguishing comments about data sets.
Eval
uat
ing
Pro
cess
es Students analyse their
methods. Critically and logically evaluates procedures and describes in detail a range of appropriate improvements.
Logically evaluates procedures and describes in detail range of appropriate improvements.
Evaluates procedures and describes some improvements that are generally appropriate.
Has attempted to evaluate procedures and suggests improvements that may be made.
Has made little attempt to evaluate procedures and lists some basic improvements.
Eval
uati
ng
Cla
ims
Students evaluate others’ methods and explanations from a scientific perspective.
Critically and logically evaluatesprocedures and claims made byothers.
Logically evaluates procedures and claims made by others.
Evaluates procedures and claims made by others.
Attempts to evaluate procedures and claims made by others.
Makes little attempt to evaluate procedures claims made by others.
Co
mm
uni
cati
ng Students use
appropriate language and representations when communicating their findings and ideas to specific audiences.
Uses an extensive range of appropriate scientific language, conventions and representations when communicating r findings and ideas to specific audiences.
Uses a variety of appropriate scientific language, conventions and representations when communicating findings and ideas to specific audiences.
Uses appropriate scientific language and representations when communicating findings and ideas to specific audiences.
Uses everyday language and simple representations when communicating findings and ideas to specific audiences.
Uses unscientific or inappropriate language and representations when communicating findings and ideas to specific audiences.

SAMPLE O
NLY
SASTA Year 9 Practical Workbook Biological sciences
47
Practical 5 – Fuelling the Ecosystem
Background
Energy flow in an ecosystem.
Life on earth is dependent on the flow of energy from the sun. At the base of an ecosystem,
primary producers are actively converting solar energy into stored chemical energy. This process
is called photosynthesis. During this process, carbon dioxide combines with simple sugars to
form more complex carbohydrates in special structures called chloroplasts.
During plant growth and other processes, sugars are broken down in a series of reactions called
respiration. Oxygen is consumed in these reactions and energy is released to power the growth
of the plant.
Measuring the rate of photosynthesis
A leaf is composed of layers of cells. The spongy mesophyll layer has spaces that are filled with
gases including carbon dioxide and oxygen. Oxygen and carbon dioxide are exchanged through
openings in the leaf called stoma.
Leaves will normally float in water because of these gases. When these gases are replaced with
water the overall density of the leaf increases and the leaf will sink.
Photosynthesis in plants requires a source of carbon dioxide. If a leaf is placed in a solution with
a source of carbon dioxide in the form of bicarbonate ions, then photosynthesis can occur in a
sunken leaf. As photosynthesis proceeds oxygen is released into the interior of the leaf which
changes the buoyancy, causing the leaf to rise.
While this is going on, the leaf is also carrying out cellular respiration, consuming the
accumulated oxygen, possibly causing the leaf to sink again.
Using small leaf discs sunken in a solution of bicarbonate ions, we can measure the rate that
the discs rise. This rate is an indirect measurement of the net rate of photosynthesis.
PART A:
Purpose
To conduct a procedure that allows you to measure the rate of photosynthesis.
Material
• 2 x 10 ml syringes
• small tweezers
• desk lamps with 18- to 23-w fluorescent or led bulbs
• jumbo plastic straws (all of the same diameter or a hole punch)
• 50 ml beakers
• approx. 20 ml of 0.2 moll-1 sodium hydrogen carbonate solution. (4–5 drops ofdetergent should be added to a litre of solution. this helps prevent the discs fromsticking to the sides of the syringe.)
• fresh plant leaves (ivy, spinach or leaves of radish seedlings work equally well, andalmost any leaf with a smooth, as opposed to a hairy, surface works)

SAMPLE O
NLY
SASTA Year 9 Practical Workbook Biological sciences
48
Procedure
1. Fill the 50 mL beaker with 20 mL of 0.2 molL-1 sodium hydrogen carbonate solution.
2. Remove the plunger from a syringe.
3. Use a straw or hole punch to punch out discs from the leaves. The discs should be as
uniform in size and mass as possible. Avoid the larger veins of the leaves.
4. As you punch out the leaf discs, put them into the syringe. Continue until you have 20
discs.
5. Use the tweezers to push the discs down as far as they can go. Be careful not to crush or
damage them.
6. Once you have all the leaf discs in the syringe, replace the plunger.
7. Put the tip of the syringe in the sodium hydrogen carbonate solution and pull back the
plunger to suck up 10 mL of the solution.
8. Tap the syringe to dislodge discs that are stuck to the sides.
9. Hold the syringe vertically, with the tip pointed upwards, and push in the plunger to
expel any trapped air.
10. Cover the end of the syringe with your finger, and then draw back on the plunger to
create a vacuum and pull the air out of the leaf discs. Alternate drawing back on the
plunger and pushing it in (remember to keep the end covered with your finger the whole
time). Pushing the plunger in is forcing the carbonate solution into the leaf discs and
drawing it out will remove any air from spaces in the leaves.
11. Continue to do this until you see the leaf discs start to sink. Once all your leaf discs have
sunk, pour the discs and solution back into the 50 mL beaker.
12. Place under the light source and start the timer.
13. At the end of each minute, record the number of floating discs.

SAMPLE O
NLY
SASTA Year 9 Practical Workbook Biological sciences
49
Results:
Plot the number of floating discs against time.
Analysis
1. Would this experiment have worked with normal tap water? Why or why not?

SAMPLE O
NLY
SASTA Year 9 Practical Workbook Biological sciences
50
2. What was happening when the leaf discs sunk?
3. What does the slope of your graph represent?

SAMPLE O
NLY
SASTA Year 9 Practical Workbook Biological sciences
51
Part B: Design Investigation
Based on your observations and analysis in PART A, design an investigation to explore some
factors that may affect the rate of photosynthesis.
Identify:
Independent variable
______________________________________________________________________________
Dependent variable
______________________________________________________________________________
Hypothesis
(This is a statement about what you expect to observe for the dependent variable as the
independent variable is changed.)
Controlled Factors
Materials
(The following materials will be provided; however, as this is a design investigation you may like to request or bring other materials to your laboratory station.)
• 4 x 50 mL beakers • 2 x 10 mL syringes• various types and sizes of leaves • desk lamps with 18- to 23-W fluorescent or LED
bulbs• 20 mL measuring cylinder • jumbo plastic straws• spatula • 100 mL of 0.2 molL-1 sodium hydrogen carbonate
solution• thermometer
Procedure
(Write a detailed step by step procedure of how you will carry out your investigation.)
Hints:
• You will measure the number of discs floating per unit time.
• You will compare the slope of your new graph to the one constructed in PART A todetermine how your chosen factor affected the rate of photosynthesis.
• You will need to clearly identify your controlled factors within the procedure to ensurethat you design a “fair test”.

SAMPLE O
NLY
SASTA Year 9 Practical Workbook Biological sciences
52
REMEMBER: The procedure needs to have sufficient detail so that someone else could repeat exactly what you did.

SAMPLE O
NLY
SASTA Year 9 Practical Workbook Biological sciences
53
Results
(Draw a table for recording the results of your experiment here.)
Table (Title): __________________________________________________________________
Plot the number of floating discs against time.

SAMPLE O
NLY
SASTA Year 9 Practical Workbook Biological sciences
54
Analysis
1. What do the results suggest about factors that affect the rate of photosynthesis?
2. Use what you understand about photosynthesis in green plants to EXPLAIN your results
above.
Conclusion
Claim
Evidence
Reasoning

SAMPLE O
NLY
SASTA Year 9 Practical Workbook Biological sciences
55
Evaluation
1. Describe some of the details in your procedure that did not work well, and that might have affected your results.
2. Suggest some improvements to your design that might improve the validity of your results
if you were to do the experiment again.
SAMPLE O
NLYSASTA Year 9 Practical Workbook Biological sciences
56
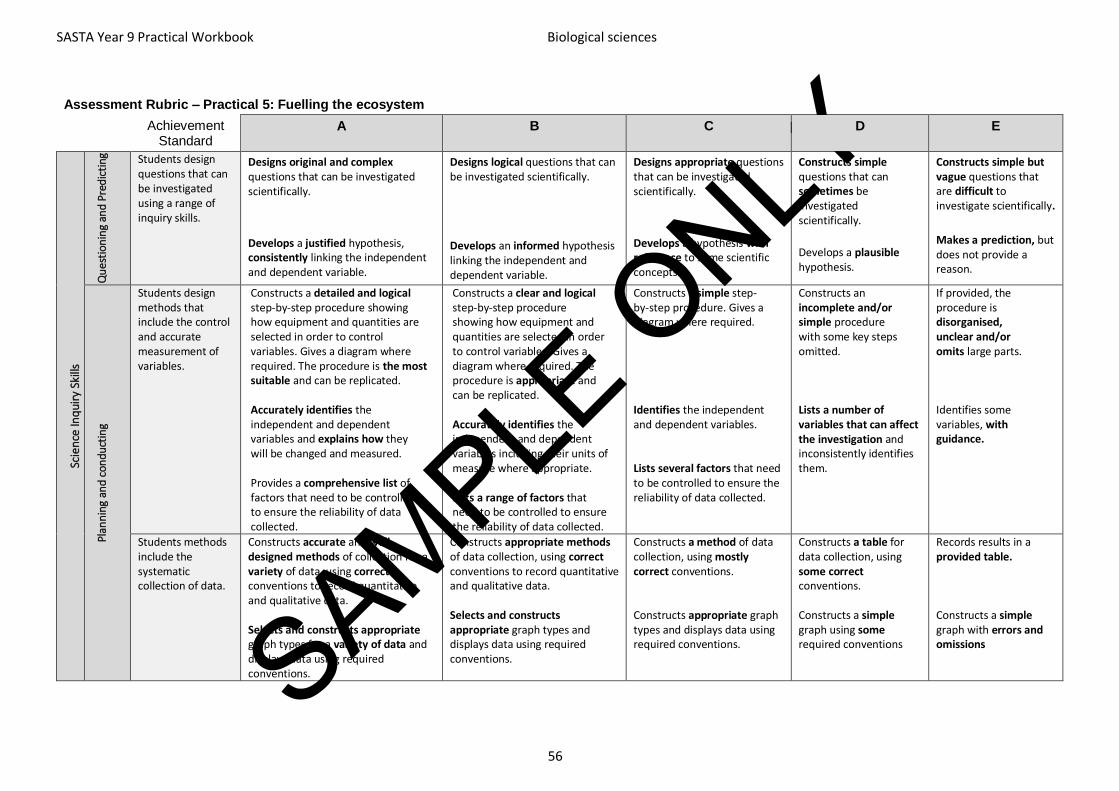
Assessment Rubric – Practical 5: Fuelling the ecosystem
Achievement Standard
A B C D E
Scie
nce
Inq
uir
y Sk
ills
Qu
esti
on
ing
and
Pred
icti
ng
Students design questions that can be investigated using a range of inquiry skills.
Designs original and complex questions that can be investigated scientifically.
Develops a justified hypothesis, consistently linking the independent and dependent variable.
Designs logical questions that can be investigated scientifically.
Develops an informed hypothesis linking the independent and dependent variable.
Designs appropriate questions that can be investigated scientifically.
Develops a hypothesis with reference to some scientific concepts.
Constructs simple questions that can sometimes be investigated scientifically.
Develops a plausible hypothesis.
Constructs simple but vague questions that are difficult to investigate scientifically.
Makes a prediction, but does not provide a reason.
Plan
nin
g an
d co
ndu
ctin
g
Students design methods that include the control and accurate measurement of variables.
Constructs a detailed and logical step-by-step procedure showing how equipment and quantities are selected in order to control variables. Gives a diagram where required. The procedure is the most suitable and can be replicated. Accurately identifies the independent and dependent variables and explains how they will be changed and measured. Provides a comprehensive list of factors that need to be controlled to ensure the reliability of data collected.
Constructs a clear and logical step-by-step procedure showing how equipment and quantities are selected in order to control variables. Gives a diagram where required. The procedure is appropriate and can be replicated. Accurately identifies the independent and dependent variables including their units of measure where appropriate. Lists a range of factors that need to be controlled to ensure the reliability of data collected.
Constructs a simple step-by-step procedure. Gives a diagram where required. Identifies the independent and dependent variables. Lists several factors that need to be controlled to ensure the reliability of data collected.
Constructs an incomplete and/or simple procedure with some key steps omitted. Lists a number of variables that can affect the investigation and inconsistently identifies them.
If provided, the procedure is disorganised, unclear and/or omits large parts. Identifies some variables, with guidance.
Students methods include the systematic collection of data.
Constructs accurate and well-designed methods of collection for a variety of data, using correct conventions to record quantitative and qualitative data. Selects and constructs appropriate graph types for a variety of data and displays data using required conventions.
Constructs appropriate methods of data collection, using correct conventions to record quantitative and qualitative data. Selects and constructs appropriate graph types and displays data using required conventions.
Constructs a method of data collection, using mostly correct conventions. Constructs appropriate graph types and displays data using required conventions.
Constructs a table for data collection, using some correct conventions. Constructs a simple graph using some required conventions
Records results in a provided table. Constructs a simple graph with errors and omissions

SAMPLE O
NLYSASTA Year 9 Practical Workbook Biological sciences
57
Assessment Rubric – Practical 5: Fuelling the ecosystem
Achievement Standard
A B C D E
Pro
cess
ing
and
an
alys
ing
dat
a an
d
info
rmat
ion
Students analyse trends in data.
Summarises results, explaining patterns and trends in the data, using scientific terminology.
Summarises results, explaining patterns and trends in the data.
Summarises results, describing straightforward patterns or trends in the data.
Summarises differences between data sets.
Makes general, non- distinguishing comments about data sets.
Students identify relationships between variables and reveal inconsistencies in results.
Formulates a logical and perceptive conclusion. Provides a clear and detailed explanation of how evidence from the investigation supports the conclusion. Makes clear and detailed connections with relevant scientific concepts.
Formulates a logical conclusion. Provides an explanation of how evidence from the investigation supports the conclusion. Makes connections with relevant scientific concepts.
Provides a conclusion, linking it to the results. Makes a connection with scientific concepts.
Provides a conclusion loosely related to the results.
Provides a conclusion without linking it to the results.
Eval
uati
ng
Pro
cess
es
Students analyse their methods.
Critically and logically evaluates procedures and describes in detail a range of appropriate improvements.
Logically evaluates procedures and describes in detail range of appropriate improvements.
Evaluates procedures and describes some improvements that are generally appropriate.
Has attempted to evaluate procedures and suggests improvements that may be made.
Has made little attempt to evaluate procedures and lists some basic improvements.
Students analyse the quality of their data and explain specific actions to improve the quality of their evidence.
Identifies a number of sources of uncertainty and makes specific suggestions for improvements to increase accuracy and reliability.
Identifies sources of uncertainty and makes specific suggestions for improving the reliability of the data.
Identifies sources of uncertainty and makes general suggestions for improvement.
Identifies general areas of error sometimes linked to the investigation.
Makes comments that are not linked to the investigation.
Co
mm
un
icat
ing
Students use appropriate language and representations when communicating their findings and ideas to specific audiences.
Uses an extensive range of appropriate scientific language, conventions and representations when communicating r findings and ideas to specific audiences.
Uses a variety of appropriate scientific language, conventions and representations when communicating findings and ideas to specific audiences.
Uses appropriate scientific language and representations when communicating findings and ideas to specific audiences.
Uses everyday language and simple representations when communicating findings and ideas to specific audiences.
Uses unscientific or inappropriate language and representations when communicating findings and ideas to specific audiences.