sample costs to produce onions - university of …€¦ · · 2015-04-022006 sample costs to...
TRANSCRIPT

ON-VS-06
UNIVERSITY OF CALIFORNIA COOPERATIVE EXTENSION
2006
SAMPLE COSTS TO PRODUCE
ONIONS RED ONION
SAN JOAQUIN VALLEY - South
Prepared by: Richard H. Molinar UC Cooperative Extension Farm Advisor, Fresno County Michael Yang UC Agricultural Assistant, Fresno County Karen M. Klonsky UC Cooperative Extension Specialist, Department of Agricultural and Resource
Economics, UC Davis Richard L. De Moura Staff Research Associate, Department of Agricultural and Resource Economics, UC
Davis

2006 Red Onions Costs and Returns Study San Joaquin Valley South UC Cooperative Extension 2
UNIVERSITY OF CALIFORNIA COOPERATIVE EXTENSION
SAMPLE COSTS TO PRODUCE ONIONS San Joaquin Valley - South 2006
STUDY CONTENTS
INTRODUCTION…...........................................................................................……………………................... 2 ASSUMPTIONS ............................................................................................................................................... 3 Production Operating Costs......…….................................................................................................................... 3 Cash Overhead ………......................................................................................................................................... 5 Non-Cash Overhead …........................................................................................................................ ................ 5 REFERENCES ………....................................................................................................................... ................... 7 Table 1. COSTS PER ACRE to PRODUCE ONION ........................................................................................... 8 Table 2. COSTS AND RETURNS PER ACRE to PRODUCE ONION .............................................................. 9 Table 3. MONTHLY CASH COSTS PER ACRE to PRODUCE ONION ................................. ....................... 10 Table 4. RANGING ANALYSIS..................................................................................................................... 11 Table 5. WHOLE FARM ANNUAL EQUIPMENT, INVESTMENT and OVERHEAD COSTS. ................... 12 Table 6. HOURLY EQUIPMENT COSTS …………………………………………………............................. 13 Table 7. OPERATIONS WITH EQUIPMENT ................................................................................................ 14
INTRODUCTION
Sample costs to produce onions in the San Joaquin Valley are shown in this study. The study is intended as a guide only, and can be used to make production decisions, determine potential returns, prepare budgets and evaluate production loans. The practices described are based on production operations considered typical for this crop and region, but will not apply to every farm. Sample costs for labor, materials, equipment and custom services are based on current figures. “Your Costs” columns in Tables 1 and 2 are provided for entering your farm costs.
The hypothetical farm operations, production practices, overhead, and calculations are described under the assumptions. For additional information or an explanation of the calculations used in the study call the Department of Agricultural and Resource Economics, University of California, Davis, California, (530) 752-3589 or the local UC Cooperative Extension office.
Sample Cost of Production Studies for many commodities can be downloaded at http://coststudies.ucdavis.edu, requested through the Department of Agricultural and Resource Economics, UC Davis, (530) 752-4424 or obtained from the local county UC Cooperative Extension offices. Some archived studies are also available on the website.
The University of California does not discriminate in any of its policies, procedures or practices. The university is an affirmative action/equal opportunity employer.
University of California and USDA, Risk Management Cooperating.

2006 Red Onions Costs and Returns Study San Joaquin Valley South UC Cooperative Extension 3
ASSUMPTIONS
The assumptions refer to Tables 1 to 6 and pertain to sample costs to produce onions in the San Joaquin Valley. The cultural practices described represent production operations and materials considered typical for a small farm in the region. Costs, materials, and practices in this study will not apply to all farms. Timing of and types of cultural practices will vary among growers within the region and from season to season due to variables such as weather, soil, and insect and disease pressure. The use of trade names and cultural practices in this report does not constitute an endorsement or recommendation by the University of California nor is any criticism implied by omission of other similar products or cultural practices.
Farm. This report is based on a 60 contiguous acre farm on rented land. In this study 20 acres are planted to red onions and the remaining acres to other vegetables.
Production Operating Costs
Land Preparation. The grower rips the land one time, discs two times, rolls the ground and lists the
beds in October. In a single operation after listing, the beds are shaped, and the drip tape laid. Besides the tractor driver, two people follow the shaper to handle the drip tape.
Plant. In this study, a specialty onion, Early Red Burger is planted. The onion transplants are planted
in November, two lines (rows) per 38-inch bed at 4.5 inch in-row spacing or 73,000 plants per acre. Labor includes planting labor, a crew foreman, and two persons to deliver the plants throughout the day to the planting labor. Many growers will grow their own transplants, by planting onion seed in a nursery field in late August. For this study, the transplants are purchased.
Irrigation. Irrigation includes the water costs per irrigation and irrigation labor. The drip line is laid or
buried in the center of the bed at bed shaping. After which, the laterals are laid and the drip line connected. Irrigation begins in November two to three days after planting. The field is irrigated twice a month from November through February and weekly in March and April, and during the early part of May. Water costs were provided from the growers pumping charges for the summer months and calculated per acre-inch. The crop uses 30 - 36 acres-inches per season. Assuming an efficiency application of 90%, 40 acre inches are applied. Rainfall is not taken into account in this study, but can affect the number of irrigations and irrigation water applied. Irrigation labor is calculated as 0.15 hours per acre per irrigation.
Fertilization. The crop is fertilized prior to planting by banding 15-15-15 in the bed at 500 pounds per
acre. Another 500 pounds is banded in January at three to four leaf stage and at mid-season in March. Pest Management. The pesticides and rates mentioned in this cost study are listed in UC Integrated
Pest Management, Onions. For more information on other pesticides available, pest identification, monitoring, and management visit the above UC IPM website at www.ipm.ucdavis.edu or contact your local farm advisor or pest control adviser. Adjuvants are recommended for many pesticides for effective control, but are not included in this study. Pesticide costs in this study are take from a single dealer and shown as full retail.
Weeds. Dacthal herbicide is sprayed over the beds after planting. Insects. Treatment usually not necessary. Thrips can be a problem and are treated with Spinosaid
(Entrust or Success).

2006 Red Onions Costs and Returns Study San Joaquin Valley South UC Cooperative Extension 4
Diseases. Ridomil Gold/Bravo fungicide is applied in January February, or March if disease pressure and rains are a problem for downy mildew control. The grower applies all sprays – in bad years there could be up to four or more applications. Pesticides in all applications are rotated to avoid resistance build-up.
Pickup/ATV. Costs for a 1/2-ton pickup are included in the study. The grower drives another 250
miles per acre for farming purposes. The miles driven is assumed and not taken from any specific data. Grower miles vary by farm size and location, and by crops grown.
Harvest. The crop is hand harvested in May beginning when 10% of the leaves are laying over. In
some situations the grower may roll the plants to enhance maturity but this sometimes damages the bulbs. The bulb surface is exposed, so the furrows are listed to throw dirt over the bulbs to reduce sun damage. The onions are undercut and lifted with a rod weeder or onion blade and left to cure for about five days. The onions are put into burlap bags (approximately 40 lbs) and left in the field 5 to 8 days, after which they are graded and field packed. The grower has four self-contained packing units on trailers. The units move from bag to bag through the field and it takes the four units 4.0 hours (1.0 hour each) per acre to grade and pack. Each unit has one tractor driver, one stacker and six grader/packers. A tractor driver with a trailer hauls the boxes to the grower’s packinghouse. The stacker for each unit is also the stacker for the trailer and in this study one-half of the total stacking labor cost is allocated to hauling.
Yields. Based on grower information, the crop yields average 650 to 800 forty-pound boxes per acre.
The average yield used in this report is 650 or 13 tons to calculate a range of yields over various prices. Returns. Returns of $8.00 per 40 pound box are 70% of the calculated average of shipping point prices
(USDA market report) for June 2005 and 2006. The returns are used in the Ranging Analysis Table to calculate a range of returns over various yields.
Labor. Labor rates of $12.42 per hour for machine operators and $9.32 for general labor includes
payroll overhead of 38%. The basic hourly wages are $9.00 for machine operators and $6.75 for general labor. The overhead includes the employers’ share of federal and California state payroll taxes, workers' compensation insurance for truck crops (code 0172), and a percentage for other possible benefits. Workers’ compensation costs will vary among growers, but for this study the cost is based upon the average industry final rate as of January 5, 2005 (California Department of Insurance). Labor for operations involving machinery are 20% higher than the operation time given in Table 1 to account for the extra labor involved in equipment set up, moving, maintenance, work breaks, and field repair.
Equipment Operating Costs. Repair costs are based on purchase price, annual hours of use, total
hours of life, and repair coefficients formulated by ASAE. Fuel and lubrication costs are also determined by ASAE equations based on maximum PTO horsepower, and fuel type. Prices for on-farm delivery of red dye diesel and gasoline are $2.00 and $2.55 per gallon, respectively. The cost includes a 2% local sales tax on diesel fuel, but does not include excise taxes. Gasoline costs include an 8% sales tax plus federal and state excise tax. Some federal and excise tax can be refunded for on-farm use when filing your income tax. The costs are based on 2005 American Automobile Association (AAA) and Department of Energy (DOE) monthly data. The fuel, lube, and repair cost per acre for each operation in Table 1 is determined by multiplying the total hourly operating cost in Table 6 for each piece of equipment used for the selected operation by the hours per acre. Tractor time is 10% higher than implement time for a given operation to account for setup, travel and down time.
Interest on Operating Capital. Interest on operating capital is based on cash operating costs and is calculated monthly until harvest at a nominal rate of 9.25% per year. A nominal interest rate is the typical

2006 Red Onions Costs and Returns Study San Joaquin Valley South UC Cooperative Extension 5
market cost of borrowed funds. The interest rate is from a local agricultural lending agency and is the basic rate in effect as of January 2006. The interest cost of post harvest operations is discounted back to the last harvest month using a negative interest charge.
Risk. Production risks should not be minimized. While this study makes every effort to model a production system based on typical, real world practices, it cannot fully represent financial, agronomic and market risks, which affect the profitability and economic viability.
Cash Overhead
Cash overhead consists of various cash expenses paid out during the year that are assigned to the whole
farm and not to a particular operation. These costs include property taxes, interest on operating capital, office expense, liability and property insurance, and investment repairs.
Property Taxes. Counties charge a base property tax rate of 1% on the assessed value of the property.
In some counties special assessment districts exist and charge additional taxes on property including equipment, buildings, and improvements. For this study, county taxes are calculated as 1% of the average value of the property. Average value equals new cost plus salvage value divided by 2 on a per acre basis.
Insurance. Insurance for farm investments varies depending on the assets included and the amount of coverage. Property insurance provides coverage for property loss and is charged at 0.70% of the average value of the assets over their useful life. Liability insurance covers accidents on the farm and costs $529 for the entire farm.
Office Expense. Office and business expenses are estimated at $30 per acre. These expenses include office supplies, telephones, bookkeeping, accounting, and legal fees. The cost is a general estimate and not based on any actual data.
Land Rent. The 60 acres are rented for cash at $300 per acre. The rented land includes the irrigation
system that is maintained by the landlord. Land rents range from $250 to $350 per acre. Investment Repairs. Annual maintenance except land is calculated as two percent of the purchase
price.
Non-Cash Overhead Non-cash overhead is calculated as the capital recovery cost for equipment and other farm investments.
Capital Recovery Costs. Capital recovery cost is the annual depreciation and interest costs for a capital
investment. It is the amount of money required each year to recover the difference between the purchase price and salvage value (unrecovered capital). It is equivalent to the annual payment on a loan for the investment with the down payment equal to the discounted salvage value. This is a more complex method of calculating ownership costs than straight-line depreciation and opportunity costs, but more accurately represents the annual costs of ownership because it takes the time value of money into account (Boehlje and Eidman). The formula for the calculation of the annual capital recovery costs is ((Purchase Price – Salvage Value) x Capital Recovery Factor) + (Salvage Value x Interest Rate).
Salvage Value. Salvage value is an estimate of the remaining value of an investment at the end of its useful life. For farm machinery (tractors and implements) the remaining value is a percentage of the new cost

2006 Red Onions Costs and Returns Study San Joaquin Valley South UC Cooperative Extension 6
by the American Society of Agricultural Engineers (ASAE) based on equipment type and years of life. The life in years is estimated by dividing the wear out life, as given by ASAE by the annual hours of use in this operation. For other investments including irrigation systems, buildings, and miscellaneous equipment, the value at the end of its useful life is zero. The salvage value for land is the purchase price because land does not depreciate. The purchase price and salvage value for equipment and investments are shown in the tables.
Capital Recovery Factor. Capital recovery factor is the amortization factor or annual payment whose present value at compound interest is 1. The amortization factor is a table value that corresponds to the interest rate used and the life of the machine.
Interest Rate. The interest rate of 6.25% used to calculate capital recovery cost is the effective long term interest rate in January 2006. The interest rate is provided by a local farm lending agency and will vary according to risk and amount of loan.
Tools. This includes shop tools, hand tools, and miscellaneous field tools. The tools are an estimated
value and not taken from any specific data. Irrigation/Laterals. The landlord maintains the irrigation system. The grower purchases drip tape for
the beds annually and owns the lateral lines that connect to the drip tape. The filed is broken into sections with drip irrigation runs of no more than 300 feet long.
Equipment. Farm equipment is purchased new or used, but the study shows the current purchase price
for new equipment. The new purchase price is adjusted to 60% to indicate a mix of new and used equipment. Annual ownership costs for equipment and other investments are shown in the Whole Farm Annual Equipment, Investment, and Business Overhead Costs table. Equipment costs are composed of three parts: non-cash overhead, cash overhead, and operating costs. Both of the overhead factors have been discussed in previous sections. The operating costs consist of repairs, fuel, and lubrication and are discussed under operating costs.
Table Values. Due to rounding, the totals may be slightly different from the sum of the components.

2006 Red Onions Costs and Returns Study San Joaquin Valley South UC Cooperative Extension 7
REFERENCES American Society of Agricultural Engineers. 1994. American Society of Agricultural Engineers Standards
Yearbook. Russell H. Hahn and Evelyn E. Rosentreter (ed.) St. Joseph, Missouri. 41st edition.
Barker, Doug. April 22, 2005. California Workers’ Compensation Rating Data for Selected Agricultural Classifications as of January 1, 2004 (Updated). California Department of Insurance, Rate Regulation Branch.
Boehlje, Michael D., and Vernon R. Eidman. 1984. Farm Management. John Wiley and Sons. New York, New
York California State Automobile Association. 2006. Gas Price Survey 2005. AAA Public Affairs, San Francisco, California State Board of equalization. Fuel Tax Division Tax Rates. Internet accessed January 2006.
http://www.boe.ca.gov/sptaxprog/spftdrates.htm Energy Information Administration. 2005. Weekly Retail on Highway Diesel Prices. Internet accessed January
2006. http://tonto.eix.doe.gov/oog/info/wohdp USDA, NASS, California Field Office. 2006. 2005 California Almond Acreage Report. Almond Board of
California. http://www.almondboard.com/
Voss, Ronald E. and Keith S. Mayberry. 1999. Fresh-Market Bulb Onion Production in California. University of California, Division of Agriculture and Natural Resources. Davis, CA. Publication 7242.
For information concerning University of California publications contact UC DANR Communications Services (1-800-994-
8849), online at http://anrcatalog.ucdavis.edu or your local county Cooperative Extension office.
2006 Red Onions Costs and Returns Study San Joaquin Valley South UC Cooperative Extension 8
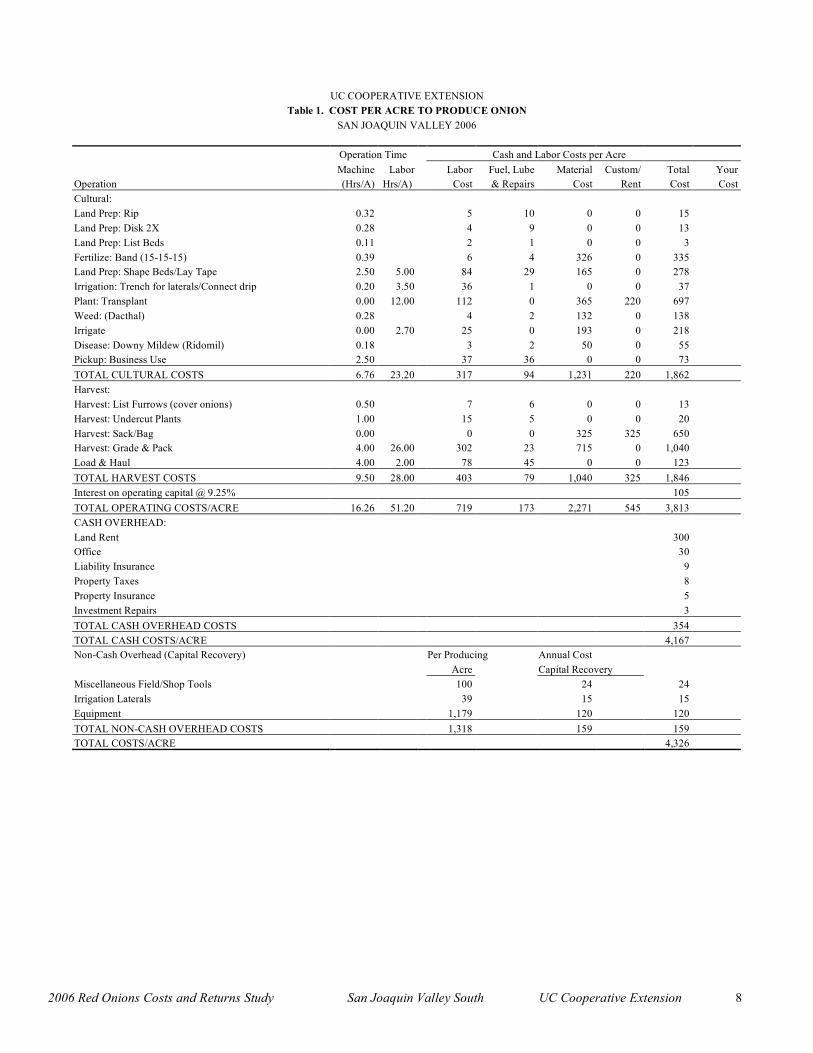
UC COOPERATIVE EXTENSION
Table 1. COST PER ACRE TO PRODUCE ONION SAN JOAQUIN VALLEY 2006
Operation Time Cash and Labor Costs per Acre Machine Labor Labor Fuel, Lube Material Custom/ Total Your Operation (Hrs/A) Hrs/A) Cost & Repairs Cost Rent Cost Cost Cultural: Land Prep: Rip 0.32 5 10 0 0 15 Land Prep: Disk 2X 0.28 4 9 0 0 13 Land Prep: List Beds 0.11 2 1 0 0 3 Fertilize: Band (15-15-15) 0.39 6 4 326 0 335 Land Prep: Shape Beds/Lay Tape 2.50 5.00 84 29 165 0 278 Irrigation: Trench for laterals/Connect drip 0.20 3.50 36 1 0 0 37 Plant: Transplant 0.00 12.00 112 0 365 220 697 Weed: (Dacthal) 0.28 4 2 132 0 138 Irrigate 0.00 2.70 25 0 193 0 218 Disease: Downy Mildew (Ridomil) 0.18 3 2 50 0 55 Pickup: Business Use 2.50 37 36 0 0 73 TOTAL CULTURAL COSTS 6.76 23.20 317 94 1,231 220 1,862 Harvest: Harvest: List Furrows (cover onions) 0.50 7 6 0 0 13 Harvest: Undercut Plants 1.00 15 5 0 0 20 Harvest: Sack/Bag 0.00 0 0 325 325 650 Harvest: Grade & Pack 4.00 26.00 302 23 715 0 1,040 Load & Haul 4.00 2.00 78 45 0 0 123 TOTAL HARVEST COSTS 9.50 28.00 403 79 1,040 325 1,846 Interest on operating capital @ 9.25% 105 TOTAL OPERATING COSTS/ACRE 16.26 51.20 719 173 2,271 545 3,813 CASH OVERHEAD: Land Rent 300 Office 30 Liability Insurance 9 Property Taxes 8 Property Insurance 5 Investment Repairs 3 TOTAL CASH OVERHEAD COSTS 354 TOTAL CASH COSTS/ACRE 4,167 Non-Cash Overhead (Capital Recovery) Per Producing Annual Cost Acre Capital Recovery Miscellaneous Field/Shop Tools 100 24 24 Irrigation Laterals 39 15 15 Equipment 1,179 120 120 TOTAL NON-CASH OVERHEAD COSTS 1,318 159 159 TOTAL COSTS/ACRE 4,326

2006 Red Onions Costs and Returns Study San Joaquin Valley South UC Cooperative Extension 9
UC COOPERATIVE EXTENSION Table 2. COSTS AND RETURNS PER ACRE TO PRODUCE ONION
SAN JOAQUIN VALLEY - 2006 Quantity/ Price or Value or Your Acre Unit Cost/Unit Cost/Acre Cost GROSS RETURNS Red Onion 650 box 8.00 5,200
OPERATING COSTS Fertilizer: 15-15-15 1,500.00 lb 0.22 326
Irrigation: DripTape 5 mil 13,755.00 foot 0.01 165 Water Pumped 40.00 acin 4.83 193
Seed: Onion Transplants 73.00 thou 5.00 365
Custom: Transplant Onion Labor 13,750.00 foot 0.02 220 Bagging Labor (harvest) 650.00 each 0.50 325
Herbicide: Dacthal W-75 7.00 lb 18.85 132
Fungicide: Ridomil Gold Bravo 2.00 lb 25.06 32
Carton: Onion Bags (harvest) 650.00 each 0.50 325 Boxes 40 lb 650.00 each 1.10 715
Labor (machine) 19.51 hrs 12.42 242 Labor (non-machine) 51.20 hrs 9.32 477 Fuel - Gas 10.41 gal 2.55 27 Fuel - Diesel 47.54 gal 2.00 95 Lube 18 Machinery repair 33 Interest on operating capital @ 9.25% 105 TOTAL OPERATING COSTS/ACRE 3,813 NET RETURNS ABOVE OPERATING COSTS 1,387 CASH OVERHEAD COSTS: Land Rent 300 Office 30 Liability Insurance 9 Property Taxes 8 Property Insurance 5 Investment Repairs 3 TOTAL CASH OVERHEAD COSTS/ACRE 354 TOTAL CASH COSTS/ACRE 4,167 NON-CASH OVERHEAD COSTS (Capital Recovery) Miscellaneous Field/Shop Tools 24 Irrigation Laterals 15 Equipment 120 TOTAL NON-CASH OVERHEAD COSTS/ACRE 159 TOTAL COSTS/ACRE 4,326 NET RETURNS ABOVE TOTAL COSTS 874

2006 Red Onions Costs and Returns Study San Joaquin Valley South UC Cooperative Extension 10
UC COOPERATIVE EXTENSION
Table 3. MONTHLY CASH COSTS PER ACRE TO PRODUCE ONION SAN JOAQUIN VALLEY - 2006
Beginning OCT 05 OCT NOV DEC JAN FEB MAR APR MAY JUN JUL AUG SEP TOTAL Ending SEPT 06 05 05 05 06 06 06 06 06 06 06 06 06 Cultural: Land Prep: Rip 15 15 Land Prep: Disk 2X 13 13 Land Prep: List Beds 3 3 Fertilize: Band (15-15-15) 112 112 112 335 Land Prep: Shape Beds/Lay Tape 278 278 Trench for laterals/Connect drip 37 37 Plant: Transplant 697 697 Weed: (Dacthal) 138 138 Irrigate 22 22 22 22 52 52 26 218 Disease: Downy Mildew (Ridomil) 55 55 Pickup: Business Use 9 9 9 9 9 9 9 9 73 TOTAL CULTURAL COSTS 467 866 31 198 31 173 61 35 0 0 0 0 1,862 Harvest: Harvest: List Furrows 13 13 Harvest: Undercut Plants 20 20 Harvest: Sack/Bag 650 650 Harvest: Grade & Pack 1,040 1,040 Load & Haul 123 123 TOTAL HARVEST COSTS 0 0 0 0 0 0 0 1,846 0 0 0 0 1,846 Interest on operating capital @ 9.25% 4 10 11 12 12 14 14 29 0 0 0 0 105 TOTAL OPERATING COSTS/ACRE 470 876 42 210 44 186 75 1,910 0 0 0 0 3,813 OVERHEAD: Land Rent 300 300 Office 4 4 4 4 4 4 4 4 30 Liability Insurance 1 1 1 1 1 1 1 1 9 Property Taxes 4 4 8 Property Insurance 3 3 6 Investment Repairs 0 0 0 0 0 0 0 0 0 0 0 0 3 TOTAL CASH OVERHEAD COSTS 5 5 9 8 5 5 9 305 0 0 3 0 354 TOTAL CASH COSTS/ACRE 475 881 51 218 49 191 84 2,215 0 0 3 0 4,167

2006 Red Onions Costs and Returns Study San Joaquin Valley South UC Cooperative Extension 11
UC COOPERATIVE EXTENSION Table 4. RANGING ANALYSIS SAN JOAQUIN VALLEY - 2006
COSTS PER ACRE AT VARYING YIELD TO PRODUCE RED ONIONS
YIELD (40 lb boxes/acre) 350 450 550 650 750 850 950 OPERATING COSTS/ACRE: Cultural Cost 1,862 1,862 1,862 1,862 1,862 1,862 1,862 Harvest Cost (Pick & Haul) 982 1,270 1,558 1,846 2,134 2,422 2,710 Interest on operating capital 98 101 103 105 107 109 112 TOTAL OPERATING COSTS/ACRE 2,942 3,233 3,523 3,813 4,103 4,393 4,684 TOTAL OPERATING COSTS/box 8.41 7.18 6.41 5.87 5.47 5.17 4.93 CASH OVERHEAD COSTS/ACRE 352 353 354 354 355 356 356 TOTAL CASH COSTS/ACRE 3,294 3,586 3,877 4,167 4,458 4,749 5,040 TOTAL CASH COSTS/box 9.41 7.97 7.05 6.41 5.94 5.59 5.31 NON-CASH OVERHEAD COSTS/ACRE 139 146 153 159 165 170 175 TOTAL COSTS/ACRE 3,433 3,732 4,030 4,326 4,623 4,919 5,215 TOTAL COSTS/box 9.81 8.29 7.33 6.66 6.16 5.79 5.49
NET RETURNS PER ACRE ABOVE OPERATING COSTS
PRICE YIELD (40 lb boxes/acre) $/box 350 450 550 650 750 850 950 7.00 -492 -83 327 737 1,147 1,557 1,966 7.50 -317 142 602 1,062 1,522 1,982 2,441 8.00 -142 367 877 1,387 1,897 2,407 2,916 8.50 33 592 1,152 1,712 2,272 2,832 3,391 9.00 208 817 1,427 2,037 2,647 3,257 3,866 9.50 383 1,042 1,702 2,362 3,022 3,682 4,341 10.00 558 1,267 1,977 2,687 3,397 4,107 4,816
NET RETURNS PER ACRE ABOVE CASH COSTS
PRICE YIELD (40 lb boxes/acre) $/box 350 450 550 650 750 850 950 7.00 -844 -436 -27 383 792 1,201 1,610 7.50 -669 -211 248 708 1,167 1,626 2,085 8.00 -494 14 523 1,033 1,542 2,051 2,560 8.50 -319 239 798 1,358 1,917 2,476 3,035 9.00 -144 464 1,073 1,683 2,292 2,901 3,510 9.50 31 689 1,348 2,008 2,667 3,326 3,985 10.00 206 914 1,623 2,333 3,042 3,751 4,460
NET RETURNS PER ACRE ABOVE TOTAL COSTS
PRICE YIELD (40 lb boxes/acre) $/box 350 450 550 650 750 850 950 7.00 -983 -582 -180 224 627 1,031 1,435 7.50 -808 -357 95 549 1,002 1,456 1,910 8.00 -633 -132 370 874 1,377 1,881 2,385 8.50 -458 93 645 1,199 1,752 2,306 2,860 9.00 -283 318 920 1,524 2,127 2,731 3,335 9.50 -108 543 1,195 1,849 2,502 3,156 3,810 10.00 67 768 1,470 2,174 2,877 3,581 4,285

2006 Red Onions Costs and Returns Study San Joaquin Valley South UC Cooperative Extension 12
UC COOPERATIVE EXTENSION Table 5. WHOLE FARM ANNUAL EQUPMENT, INVESTMENT, AND BUSINESS OVERHEAD COSTS
SAN JOAQUIN VALLEY - 2006
ANNUAL EQUIPMENT COSTS Cash Overhead Yrs Salvage Capital Insur- Yr Description Price Life Value Recovery ance Taxes Total 06 180HP 4WD Tractor 110,000 20 14,114 9,412 434 621 10,467 06 35HP 2WD Tractor #1 15,265 20 1,959 1,306 60 86 1,453 06 35HP 2WD Tractor #2 15,265 20 1,959 1,306 60 86 1,453 06 35HP 2WD Tractor #3 15,265 20 1,959 1,306 60 86 1,453 06 35HP 2WD Tractor #4 15,265 20 1,959 1,306 60 86 1,453 06 75HP 2WD Tractor 28,891 20 3,707 2,472 114 163 2,749 06 Bed Shaper 15' 10,000 10 1,768 1,242 41 59 1,342 06 Blade Rear 3 point 6' 1,012 20 53 89 4 5 98 06 Boom Sprayer 300 gal 4,500 10 796 559 19 26 604 06 Disk Offset 15' 21,000 20 1,095 1,839 77 110 2,027 06 Fertilizer Applicator 15' 12,000 20 625 1,051 44 63 1,158 06 Furrowing Shank 5' 150 20 8 13 1 1 14 06 Lister - 15' 3,800 12 526 429 15 22 466 06 Packing Unit Onion #1 900 10 159 112 4 5 121 06 Packing Unit Onion #2 900 10 159 112 4 5 121 06 Packing Unit Onion #3 900 10 159 112 4 5 121 06 Packing Unit Onion #4 900 10 159 112 4 5 121 06 Pickup 1/2 Ton 28,000 5 12,549 4,477 142 203 4,822 06 Ripper 15' 11,000 20 573 963 41 58 1,062 06 Rod Weeder 6' 1,200 15 115 121 5 7 133 06 Trailer 12x16 4,500 20 235 394 17 24 434 06 Weed Sprayer 100 gal 3,424 10 606 425 14 20 460 TOTAL 304,137 45,242 29,159 1,223 1,748 32,130 60% of New Cost * 182,482 27,145 17,496 734 1,049 19,278 *Used to reflect a mix of new and used equipment
ANNUAL INVESTMENT COSTS
Cash Overhead Yrs Salvage Capital Insur- Description Price Life Value Recovery ance Taxes Repairs Total Irrigation Laterals 2904 ft. 784 3 295 3 4 16 317 Miscellaneous Field/Shop Tools 6,000 5 1,434 21 30 120 1,605 TOTAL INVESTMENT 6,784 0 1,729 24 34 136 1,922
ANNUAL BUSINESS OVERHEAD COSTS Units/ Price/ Total Description Farm Unit Unit Cost Land Rent 60 acre 300.00 18,000 Liability Insurance 60 acre 8.82 529 Office Expense 60 acre 30.00 1,800

2006 Red Onions Costs and Returns Study San Joaquin Valley South UC Cooperative Extension 13
UC COOPERATIVE EXTENSION Table 6. HOURLY EQUIPMENT COSTS
SAN JOAQUIN VALLEY 2006 Actual Cash Overhead Operating Hours Capital Insur- Fuel & Total Total Yr Description Used Recovery ance Taxes Repairs Lube Oper. Costs/Hr. 06 180HP 4WD Tractor 800.20 7.06 0.33 0.47 2.54 24.03 26.57 34.43 06 35HP 2WD Tractor #1 571.20 1.37 0.06 0.09 0.62 3.95 4.57 6.09 06 35HP 2WD Tractor #2 88.00 8.91 0.41 0.59 0.62 3.95 4.57 14.48 06 35HP 2WD Tractor #3 88.00 8.91 0.41 0.59 0.62 3.95 4.57 14.48 06 35HP 2WD Tractor #4 88.00 8.91 0.41 0.59 0.62 3.95 4.57 14.48 06 75HP 2WD Tractor 620.30 2.39 0.11 0.16 1.17 8.47 9.64 12.30 06 Bed Shaper 15' 200.00 3.73 0.12 0.18 1.13 0 1.13 5.16 06 Blade Rear 3 point 6' 100.00 0.53 0.02 0.03 0.15 0 0.15 0.73 06 Boom Sprayer 300 gal 149.60 2.24 0.07 0.11 1.2 0 1.20 3.62 06 Disk Offset 15' 99.50 11.09 0.47 0.67 3.11 0 3.11 15.34 06 Fertilizer Applicator 15' 64.90 9.72 0.41 0.58 4.41 0 4.41 15.12 06 Furrowing Shank 5' 10.00 0.79 0.03 0.05 0.03 0 0.03 0.90 06 Lister - 15' 166.20 1.55 0.05 0.08 0.76 0 0.76 2.44 06 Packing Unit Onion #1 20.00 3.35 0.11 0.16 0.73 0 0.73 4.35 06 Packing Unit Onion #2 20.00 3.35 0.11 0.16 0.73 0 0.73 4.35 06 Packing Unit Onion #3 20.00 3.35 0.11 0.16 0.73 0 0.73 4.35 06 Packing Unit Onion #4 20.00 3.35 0.11 0.16 0.73 0 0.73 4.35 06 Pickup 1/2 Ton 285.00 9.43 0.30 0.43 2.08 12.22 14.30 24.46 06 Ripper 15' 100.50 5.75 0.24 0.35 2.35 0 2.35 8.69 06 Rod Weeder 6' 20.00 3.62 0.14 0.20 0.26 0 0.26 4.22 06 Trailer 12x16 150.00 1.58 0.07 0.10 0.65 0 0.65 2.40 06 Weed Sprayer 100 gal 149.60 1.71 0.06 0.08 0.91 0 0.91 2.76

2006 Red Onions Costs and Returns Study San Joaquin Valley South UC Cooperative Extension 14
UC COOPERATIVE EXTENSION
Table 7. OPERATIONS WITH EQUIPMENT SAN JOAQUIN VALLEY - 2006
Operation Labor Broadcast Operation Month Tractor Implement Hrs Material Rate/acre Unit Cultural: Land Prep: Rip Oct 180HP 4WD Ripper 15' Land Prep: Disk Oct 180HP 4WD Disk 15' Land Prep: List Beds Oct 75HP 2WD Lister 15' Fertilize: Band Oct 35HP 2WD Fertilizer Spreader 15-15-15 500.00 lb Jan 35HP 2WD Fertilizer Spreader 15-15-15 500.00 lb Mar 35HP 2WD Fertilizer Spreader 15-15-15 500.00 lb Land Prep: Shape Beds/Lay Drip Tape Oct 75HP 2WD Bedshaper 3R 5.00 Drip Tape 13,755.00 ft Trench for laterals/Connect Drip Oct 35HP 2WD Furrowing Shank 5' 3.00 Trench for laterals/Connect Drip Oct 35HP 2WD Rear Blade 0.50 Transplant Nov 12.00 Transplants 73.00 thou Transplant onions 1.60 ft Weed:(Dacthal) Nov 35HP 2WD Weed Sprayer Dacthal 7.00 lb Irrigate 2X Nov 0.30 Water 4.00 acin Irrigate 2X Dec 0.30 Water 4.00 acin Irrigate 2X Jan 0.30 Water 4.00 acin Irrigate 2X Feb 0.30 Water 4.00 acin Irrigate 4X Mar 0.60 Water 9.60 acin Irrigate 4X Apr 0.60 Water 9.60 acin Irrigate 2X Mar 0.30 Water 4.80 acin Disease: Downy Mildew Jan 75HP 2WD Boom Sprayer Ridomil 2.00 lb Harvest: List furrows, cover plants May 75HP 2WD Lister 15' Harvest: Undercut Plants May 35HP 2WD Rod Weeder Harvest: Sack/Bag May Onion Bags 650.00 ea Bagging Labor 650.00 ea Harvest: Pickup, Grade, & Pack May 35HP 2WD Packing Unit 1 6.50 Boxes 162.00 ea 35HP 2WD Packing Unit 2 6.50 Boxes 163.00 ea 35HP 2WD Packing Unit 3 6.50 Boxes 163.00 ea 35HP 2WD Packing Unit 4 6.50 Boxes 162.00 ea Harvest: Load & Haul May 75HP 2WD Trailer 2.00