sample costs to produce field corn - university …€¦ · · 2015-04-02cost per acre to produce...
TRANSCRIPT
CO-SV-08
UNIVERSITY OF CALIFORNIA - COOPERATIVE EXTENSION
2008
SAMPLE COSTS TO PRODUCE
FIELD CORN
ON MINERAL SOILS IN THE
SACRAMENTO VALLEY
Prepared by: Kent L. Brittan UC Cooperative Extension Farm Advisor, Yolo, Solano, and Sacramento
Counties Jerry L. Schmierer U.C. Cooperative Extension Farm Advisor, Colusa, Sutter & Yuba Counties Douglas J. Munier UC Cooperative Extension Farm Advisor, Glenn, Butte, & Tehama Counties Karen M. Klonsky UC Cooperative Extension Economist, Department of Agricultural and
Resource Economics, UC Davis Pete Livingston UC Cooperative Extension Staff Research Associate, Department of
Agricultural and Resource Economics, UC Davis
2008 Field Corn Costs and Returns Study (on Mineral Soils) Sacramento Valley UC Cooperative Extension 2
UNIVERSITY OF CALIFORNIA – COOPERATIVE EXTENSION
SAMPLE COSTS TO PRODUCE FIELD CORN on Mineral Soils in the Sacramento Valley – 2008
CONTENTS INTRODUCTION ………………………………………………………………………….…………...….... 2 ASSUMPTIONS …………………………………………………………………………………..……….… 3 CULTURAL PRACTICES AND MATERIAL INPUT ………………………..….………………………................... 3 CASH OVERHEAD ………………………………………………………………….……………………….…. 5 NON-CASH OVERHEAD …………………………………………………………………….……………….… 6 REFERENCES …………………………………………………………………………………...................... 8 Table 1. Cost per acre to Produce Field Corn ………………………………………………..…………….….. 9 Table 2. Costs and Returns per acre to Produce Field Corn ………………………………….….……….……. 10 Table 3. Monthly Cash Costs per acre to Produce Field Corn ………………………..…………….………….. 11 Table 4. Whole Farm Annual Equipment, Investment, and Business Overhead Costs …………..……………. 12 Table 5. Hourly Equipment Costs ………………………………………………………………………….….. 13 Table 6. Ranging Analysis ………………………………………………….………………………………….. 14 Table 7. Costs and Returns/Breakeven Analysis …………………………………….……………………….... 15 Table 8. Details of Operations ……………………………………………………………….……………….... 16
INTRODUCTION
The sample costs to produce field corn in the Sacramento Valley are presented in this study. The study is intended as a guide only, and can be used in making production decisions, determining potential returns, preparing budgets and evaluating production loans. Practices described are based on those production procedures considered typical for this crop and area. Sample costs for labor, materials, equipment, and custom services are based on current figures. Some costs and practices detailed in this study may not be applicable to your situation. A blank column, “Your Costs,” is provided to enter your actual costs on Tables 1 and 2.
The hypothetical farm operation, production practices, overhead, and calculations are described under the assumptions. For additional information or an explanation of the calculations used in the study call the Department of Agricultural and Resource Economics, University of California, Davis, 530-752-2414 or your local UC Cooperative Extension office. Sample Cost of Production Studies for many commodities are available and can be requested through the Department of Agricultural and Resource Economics, UC Davis, 530-752-2414. Current studies can be obtained from selected county UC Cooperative Extension offices or downloaded from the department website at http://coststudies.ucdavis.edu. The University of California prohibits discrimination or harassment of any person on the basis of race, color, national origin, religion, sex, gender identity , pregnancy (including childbirth, and medical conditions related to pregnancy or childbirth), physical or mental disability , medical condition (cancer-related or genetic characteristics), ancestry, marital status, age, sexual orientation, citizenship, or service in the uniformed services (as defined by the Uniformed Services Employment and Reemployment Rights Act of 1994: service in the uniformed services includes membership, application for membership, performance of service, application for service, or obligation for service in the uniformed services) in any of its programs or activities. University policy also prohibits reprisal or retaliation against any person in any of its programs or activities for making a complaint of discrimination or sexual harassment or for using or participating in the investigation or resolution process of any such complaint. University policy is intended to be consistent with the provisions of applicable State and Federal laws. Inquiries regarding the University’s nondiscrimination policies may be directed to the Affirmative Action/Equal Opportunity Director, University of California, Agriculture and Natural Resources, 1111 Franklin Street, 6th Floor, Oakland, CA 94607, (510) 987-0096.

2008 Field Corn Costs and Returns Study (on Mineral Soils) Sacramento Valley UC Cooperative Extension 3
ASSUMPTIONS The following assumptions pertain to sample costs to produce field corn in the Sacramento Valley. Practices described should not be considered recommendations by the University of California, but rather represent production procedures considered typical for this crop and area. Some practices listed may not be needed nor used during every production year. Additional ones not indicated may be needed. Cultural practices for the production of field corn vary by grower and region, and variations can be significant. The practices and inputs used in the cost study serve only as a sample or guide. The costs shown are on an annual, per acre basis. The use of trade names in this report does not constitute an endorsement or recommendation by the University of California nor is any criticism implied by omission of other similar products.
Land. This report is based on a 2,900 acre field and row crop farm. Field corn is planted on 600 acres and the other 2,300 acres, planted in rotation with the corn, processing tomatoes, alfalfa hay, rice, safflower, sunflower, dry beans and/or wheat. Typically, a grower with this amount of corn acreage will have several non-adjacent fields. A charge for equipment moving and set-up is shown in the tables under cultural costs. The entire 600 acres which is rented includes developed wells and irrigation system. All costs associated with land and the irrigation system is incurred by the landowner. The grower also owns land, a shop and an equipment yard.
CULTURAL PRACTICES AND MATERIAL INPUTS Land Preparation. Primary tillage which includes laser leveling, discing, rolling, subsoiling, land leveling, and listing beds is in October of the year preceding planting. All operations are done on 100% of the acres unless noted. To reduce annual expenses, only 25% of the acreage is laser leveled each year. Subsoiling to a depth of 22 to 24 inches and discing are done on 25% (150 acres) of the corn acreage. Ground is smoothed in two passes with a triplane. Beds on 2.5 foot centers are made with a six-row lister, and shaped with a bed-shaper cultivator. Some growers may use other row configurations including three rows on 60 inch centers. Stand Establishment. Field corn is generally planted from late March through April. In this study 36,000 seeds per acre are planted in April. An herbicide resistant variety is used. Fertilization. Nitrogen is the primary nutrient applied to corn throughout the growing season. At planting 151 pounds (15 gallons) of ammonium phosphate (10-34-0) plus one quart of chelated zinc is applied. This is equivalent to 15 pounds of actual nitrogen and 51 pounds of phosphorous (P2O5) per acre. Aqua Ammonia (20-0-0) is applied at a rate of 225 pounds (152 gallons) of N per acre. Irrigation. In this study, water is calculated to cost $19.56 per acre foot and is a combination of 1/2 well water and 1/2 canal delivered surface water. The irrigation costs shown in Tables 1, 2, and 3 include water, pumping, and labor charges. A total of 3 and a half acre-feet (42 acre inch) are applied to the crop in this study. A single pre-irrigation of 6.0 acre-inches (when needed) and six post-plant irrigations are applied bi-weekly in April, May, June, and July. Pesticide Recommendations. Not all treatments mentioned in this report will be needed every year. Other materials other than those discussed in this report are available for labeled use on this crop. For specific pesticides choices and rates consult the publication UC IPM Pest Management Guidelines, Corn or can be accessed online at http://www.ipm.ucdavis.edu/PMG/crops-agriculture.html. Written

2008 Field Corn Costs and Returns Study (on Mineral Soils) Sacramento Valley UC Cooperative Extension 4
recommendations made by licensed pest control advisors are required for many pesticides. For information and pesticide use permits, contact the local county Agricultural Commissioner's office. Weeds. A mix of materials and cultural practices are used to manage weeds in corn. Beginning in February a contact herbicide, Roundup, is applied by aircraft to the fallow beds to control early season weeds. For broadleaf weed control, Shark herbicide is applied in May on 25% of the corn acreage by the grower using a tractor mounted sprayer. Roundup is also used in May for additional grass weed control. Cultivation using a rolling or mechanical cultivator is done twice, once in March and once in May. The May cultivation is done as part of the furrowing out and fertilizing operation. Many growers are utilizing precision weed control with a gps unit installed on the tractor. Insects and Diseases. Corn has many insect and mite pests that can cause economic damage during any given season. In this study cutworms (Agrotis spp., Feltia spp., and Peridroma spp.) are assumed to be above the treatment threshold on 20% of the acreage. Sevin bait is applied to control cutworms on the infested acres. A tractor mounted applicator is used to apply the bait in May. Mites (Tetranychus spp.) can be a problem late in the season, and may be controlled with an application of Oberon sprayed on 60% of the acres in June. The mite treatment is applied by air. Harvest. It is assumed that the grower owns a harvest combine and bankout wagon. The combine attaches to a 30-inch row, six-row header. The corn is dumped from the combine directly into the bankout wagon which transports the grain to semi-truck bulk grain trailers for transport to the buyer. Transportation from the field to the warehouse is paid by the buyer. Equipment for harvest operations are shown in investment costs on Table 4, and labor, fuel, repairs, and operating interest, are calculated as harvest costs in Tables 1 and 3. If a grower contracts his harvest operation, all harvesting equipment should be subtracted from investment costs in Table 4. Related costs should be subtracted from harvest costs in Tables 1 and 3 and a custom charge added. Yields. Annual field corn yields for individual counties in the Sacramento Valley from 1998 to 2007 range from a low of 3.40 tons per acre to a high of 6.85. This is the average of the 10 years weighted average (1998-2007). The reporting counties are Butte, Colusa, Glenn, Sacramento, Solano, Sutter, Tehama Yolo, and Yuba counties. The 10-year weighted average corn yield over that same period and region is 5.12. The yield used in this study is 6.0 tons per acre to reflect best management practices. Weighted average valley yields are shown in Table A. Returns. Individual county average prices for field corn ranged from $80 to $126 per ton over the last ten years. Return prices to growers in the Sacramento Valley over the last 10 years are shown in Table A and a weighted average return of $94.29 was calculated. Because of a large increase in corn prices for the last two years, a price of $170.00 per ton is used. Labor. Labor rates of $15.72 per hour for machine operators and $10.88 for general labor includes payroll overhead of 36%. The basic hourly wages are $11.55 for machine operators and $8.00 for general labor. The overhead includes the employers’ share of federal and California state payroll taxes, workers'
Table A. Sacramento Valley weighted average field corn yield and price* Year Tons Per Acre $ Per Ton 2007§ 4.89 NA 2006 4.81 114.40 2005 5.03 95.15 2004 5.49 96.74 2003 5.11 96.90 2002 5.48 95.19 2001 5.24 82.04 2000 5.56 88.34 1999 4.96 86.36 1998 4.64 93.50
Annualized 5.12 94.29 * Source: California Crop Reports, 1998 – 2007 § Preliminary report

2008 Field Corn Costs and Returns Study (on Mineral Soils) Sacramento Valley UC Cooperative Extension 5
compensation insurance for field crops (code 0171), and a percentage for other possible benefits. Workers’ compensation insurance costs will vary among growers, but for this study the cost is based upon the average industry final rate as of January 1, 2008 (California Department of Insurance). Labor for operations involving machinery are 20% higher than the operation time given in Table 1 and 4 to account for the extra labor involved in equipment set up, moving, maintenance, work breaks, and field repair. Interest on Operating Capital. Interest on operating capital is based on cash operating costs and is calculated monthly until harvest at a nominal rate of 6.75% per year. A nominal interest rate is the typical market cost of borrowed funds. The interest cost of post harvest operations is discounted back to the last harvest month using a negative interest charge. To prevent a negative calculation in this study, interest is calculated based on an August harvest. The monthly interest is then distributed in Table 4 beginning in September after the August harvest, which corresponds to the month following the August harvest date. Equipment Cash Costs. Equipment costs fall into three categories; capital recovery, cash overhead, and operating costs. The cash overhead and capital recovery costs will be discussed in later sections. The operating costs consist of fuel, lubrication, and repairs. Repair costs are based on purchase price, annual hours of use, total hours of life, and repair coefficients formulated by the American Society of Agricultural Engineers (ASAE). Fuel and lubrication costs are also determined by ASAE equations based on maximum PTO hp, and type of fuel used. The fuel and repair cost per acre for each operation in Table 2 is determined by multiplying the total hourly operating cost in Table 6 for each piece of equipment used for the cultural practice by the number of hours per acre for that operation. Tractor time is 10% higher than implement time (Operation Time) for a given operation to account for fueling, moving equipment, and setup time. Prices for on-farm delivery of diesel and gasoline are $3.54 and $3.57 per gallon, respectively. Risk. Risks associated with field corn production are not assigned a production cost. While this study makes an effort to model a production system based on typical, real world practices, it cannot fully represent financial, agronomic and market risks which affect the profitability and economic viability of corn production. Because of the risk involved, growers should consider all of the agronomic and economic risks before committing resources to corn production in the Sacramento Valley. Crop insurance may be a viable option that each grower should review to determine if it is appropriate for their situation.
CASH OVERHEAD Cash overhead consists of various cash expenses paid out during the year that are assigned to the whole farm and not to a particular operation. These costs include property taxes, interest on operating capital, office expense, liability and property insurance, sanitation services, equipment repairs, and management. Property Taxes. Counties charge a base property tax rate of 1% on the assessed value of the property. In some counties special assessment districts exist and charge additional taxes on property including equipment, buildings, and improvements. For this study, county taxes are calculated as 1% of the average value of the property. Average value equals new cost plus salvage value divided by 2 on a per acre basis. Insurance. Insurance for farm investments vary depending on the assets included and the amount of coverage. Property insurance provides coverage for property loss and is charged at 0.74% of the average value of the assets over their useful life. Liability insurance covers accidents on the farm and costs $1,438 for the entire farm or $0.50 per acre.

2008 Field Corn Costs and Returns Study (on Mineral Soils) Sacramento Valley UC Cooperative Extension 6
Office Expense: Office and business expenses are estimated at $16.69 per acre. These expenses include office supplies, telephones, bookkeeping, accounting, legal fees, road maintenance, etc. Cash overhead costs are found in Tables 1, 2, 3 and 4. Share Rent. Leasing practices and rental rates for agricultural property are continually being adjusted due to changing production and market economics, land values, and relative bargaining positions of the landlord and tenant. Land used for corn production in the Sacramento Valley is commonly rented on a tenant-landowner basis with the landowner receiving between 18-25% of the gross income. In this study the landowner receives 18% of the gross crop receipts from the sale of 6.0 tons of corn. The share rent calculated using a $170.00 per ton return price provides the landowner $183.60 per acre. The tenant pays all cash costs to produce the crop except for the landowner's share of grain drying costs if required. Salary. Supervisor salaries, including benefits, are $117,465 per year for two supervisors and are allocated among the farm’s other crops on a gross returns basis. In this study it is assumed that field corn provides 16% of the farm’s gross returns. Any returns above total costs are considered returns to investment.
NON-CASH OVERHEAD COSTS Non-cash overhead is calculated as the capital recovery cost for equipment and other farm investments. Capital Recovery Costs. Capital recovery cost is the annual depreciation and interest costs for a capital investment. It is the amount of money required each year to recover the difference between the purchase price and salvage value (unrecovered capital). It is equivalent to the annual payment on a loan for the investment with the down payment equal to the discounted salvage value. This is a more complex method of calculating ownership costs than straight-line depreciation and opportunity costs, but more accurately represents the annual costs of ownership because it takes the time value of money into account (Boehlje and Eidman). The formula for the calculation of the annual capital recovery costs is
!
Purchase " SalvagePr ice Value
#
$ %
&
' ( )
Factor
Capital
Recovery#
$ % %
&
' ( (
*
+ , ,
-
. / /
+ Salvage ) InterestValue Rate
*
+ ,
-
. /
Salvage Value. Salvage value is an estimate of the remaining value of an investment at the end of its useful life. For farm machinery (tractors and implements) the remaining value is a percentage of the new cost of the investment (Boehlje and Eidman). The percent remaining value is calculated from equations developed by the ASAE based on equipment type and years of life. The life in years is estimated by dividing the wear out life, as given by ASAE, by the annual hours of use in this operation. For other investments including irrigation systems, buildings, and miscellaneous equipment, the value at the end of its useful life is zero. The salvage value for land is the purchase price because land does not depreciate. Capital Recovery Factor. Capital recovery factor is the amortization factor or annual payment whose present value at compound interest is 1. The amortization factor is a table value that corresponds to the interest rate used and the life of the machine. Interest Rate. The interest rate of 4.25% used to calculate capital recovery cost is an interest rate from an agricultural lender. It is used to reflect the long-term realized rate of return to these specialized resources that can only be used effectively in the agricultural sector. In other words, the next best alternative use for these resources is in another agricultural enterprise.
2008 Field Corn Costs and Returns Study (on Mineral Soils) Sacramento Valley UC Cooperative Extension 7
Irrigation System. The fields are irrigated using a flood irrigation system. Water is delivered from a pump and district ditch and distributed by way of surface mainlines and valves. The life of the irrigation system is estimated at 40 years. The irrigation system is considered an improvement to the property and is shown in the capital recovery sections of Tables 1-3 and the Investments portion of Table 5. Shop Building. The shop building is an 8,000 square foot metal building or buildings on a cement slab. Shop Tools. This includes an assortment of shop tools. Fuel Tanks. Two 4,000-gallon fuel tanks using electric pumps are used to hold diesel and gasoline. The tanks are setup in a cement containment pad that meets federal, state, and county regulations. Equipment. Farm equipment is purchased new or used, but the study shows the current purchase price for new equipment. The new purchase price is adjusted to 60% to indicate a mix of new and used equipment. Equipment costs are composed of three parts: non-cash overhead, cash overhead, and operating costs. Both of the overhead factors have been discussed in previous sections. The operating costs consist of repairs, fuel, and lubrication and are discussed under operating costs. Table Values. Due to rounding, the totals may be slightly different from the sum of the components.

2008 Field Corn Costs and Returns Study (on Mineral Soils) Sacramento Valley UC Cooperative Extension 8
REFERENCES American Society of Agricultural Engineers. 2002. American Society of Agricultural Engineers Standards
Yearbook. Russell H. Hahn and Evelyn E. Rosentreter (ed.) St. Joseph, MO. 41st edition.
Boehlje, Michael D., and Vernon R. Eidman. 1984. Farm Management. John Wiley and Sons. New York, NY.
Blank, Steve, Karen Klonsky, Kim Norris, and Steve Orloff. 1992. Acquiring alfalfa hay equipment: A
financial analysis of alternatives. University of California. Oakland, CA. Giannini Information Series No. 92-1. http://giannini.ucop.edu/InfoSeries/921-HayEquip.pdf. Internet accessed April, 2008.
California Chapter of the American Society of Farm Managers and Rural Appraisers. 2007. Trends in
Agricultural Land and Lease Values. California Chapter of the American Society of Farm Managers and Rural Appraisers, Inc. Woodbridge, CA.
California Department of Food and Agriculture. 1999, 2000, 2001, 2002, 2003, 2004, 2005, 2006, 2007,
2008. County Agricultural Commissioners’ Data. http://www.nass.usda.gov/Statistics_by_State/California/Publications/AgComm/indexcac.asp. Internet accessed April, 2008.
California State Automobile Association. 2008. Gas Price Averages 2007. AAA Press Room, San
Francisco, CA. http://www.csaa.com/portal/site/CSAA/menuitem.5313747aa611bd4e320cfad592278a0c/?vgnextoid=8d642ce6cda97010VgnVCM1000002872a8c0RCRD. Internet accessed April, 2008.
California State Board of Equalization. Fuel Tax Division Tax Rates.
http://www.boe.ca.gov/sptaxprog/spftdrates.htm. Internet accessed April, 2008. Energy Information Administration. 2007. Weekly Retail on Highway Diesel Prices.
http://tonto.eia.doe.gov/oog/info/gdu/gasdiesel.asp. Internet accessed April, 2008. Integrated Pest Management Education and Publications. “UC IPM Pest Management Guidelines: Corn”.
2007. In M. L. Flint (ed.) UC IPM Pest Management Guidelines. University of California. Division of Agriculture and Natural Resources. Oakland, CA. Publication 3339. http://www.ipm.ucdavis.edu/PMG/selectnewpest.corn.html. Internet accessed April, 2008.
Brittan, Kent, Doug Munier, Karen M. Klonsky, and Pete Livingston. 2004. Sample Costs to Produce
Field Corn, Sacramento Valley. University of California, Cooperative Extension. Department of Agricultural and Resource Economics. Davis, CA. http://coststudies.ucdavis.edu/files/cornsv2004.pdf Internet accessed April, 2008.
For information concerning the above or other University of California publications, contact UC DANR Communications Services at 1-800-994-8849, online at www.ucop.edu, or your local county UC Cooperative Extension office.
2008 Field Corn Costs and Returns Study (on Mineral Soils) Sacramento Valley UC Cooperative Extension 9
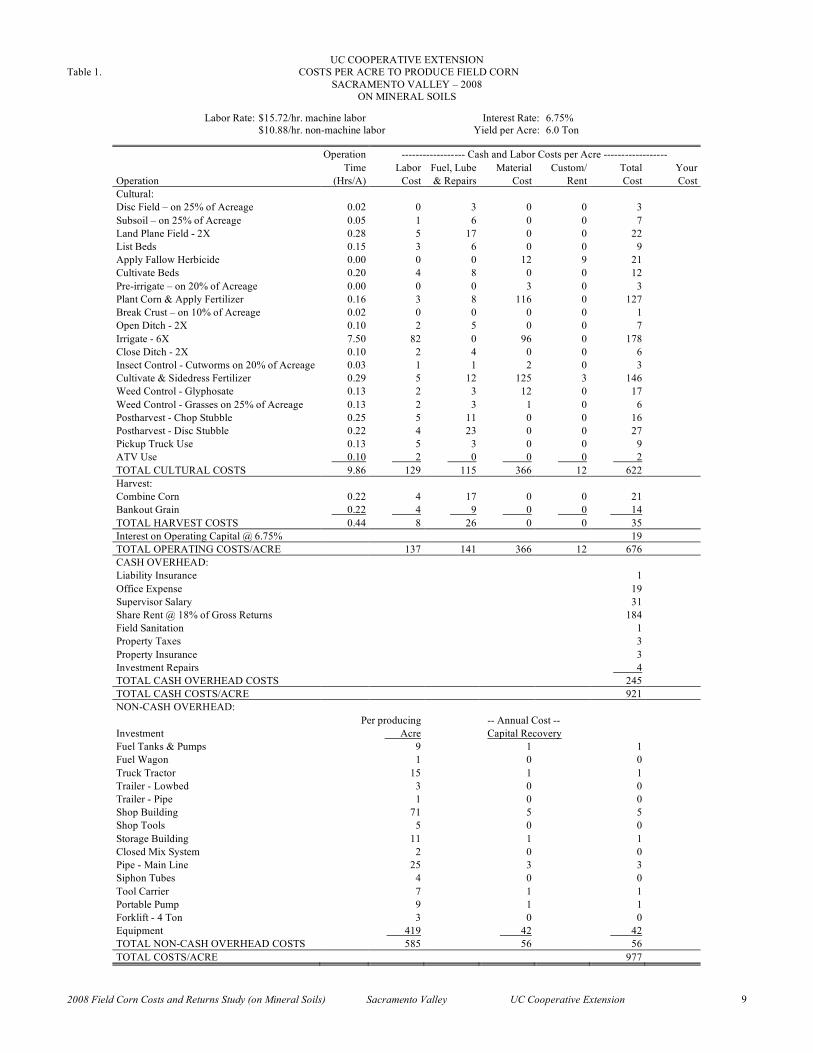
UC COOPERATIVE EXTENSION Table 1. COSTS PER ACRE TO PRODUCE FIELD CORN
SACRAMENTO VALLEY – 2008 ON MINERAL SOILS
Labor Rate: $15.72/hr. machine labor Interest Rate: 6.75% $10.88/hr. non-machine labor Yield per Acre: 6.0 Ton
Operation ------------------ Cash and Labor Costs per Acre ------------------ Time Labor Fuel, Lube Material Custom/ Total Your Operation (Hrs/A) Cost & Repairs Cost Rent Cost Cost Cultural: Disc Field – on 25% of Acreage 0.02 0 3 0 0 3 Subsoil – on 25% of Acreage 0.05 1 6 0 0 7 Land Plane Field - 2X 0.28 5 17 0 0 22 List Beds 0.15 3 6 0 0 9 Apply Fallow Herbicide 0.00 0 0 12 9 21 Cultivate Beds 0.20 4 8 0 0 12 Pre-irrigate – on 20% of Acreage 0.00 0 0 3 0 3 Plant Corn & Apply Fertilizer 0.16 3 8 116 0 127 Break Crust – on 10% of Acreage 0.02 0 0 0 0 1 Open Ditch - 2X 0.10 2 5 0 0 7 Irrigate - 6X 7.50 82 0 96 0 178 Close Ditch - 2X 0.10 2 4 0 0 6 Insect Control - Cutworms on 20% of Acreage 0.03 1 1 2 0 3 Cultivate & Sidedress Fertilizer 0.29 5 12 125 3 146 Weed Control - Glyphosate 0.13 2 3 12 0 17 Weed Control - Grasses on 25% of Acreage 0.13 2 3 1 0 6 Postharvest - Chop Stubble 0.25 5 11 0 0 16 Postharvest - Disc Stubble 0.22 4 23 0 0 27 Pickup Truck Use 0.13 5 3 0 0 9 ATV Use 0.10 2 0 0 0 2 TOTAL CULTURAL COSTS 9.86 129 115 366 12 622 Harvest: Combine Corn 0.22 4 17 0 0 21 Bankout Grain 0.22 4 9 0 0 14 TOTAL HARVEST COSTS 0.44 8 26 0 0 35 Interest on Operating Capital @ 6.75% 19 TOTAL OPERATING COSTS/ACRE 137 141 366 12 676 CASH OVERHEAD: Liability Insurance 1 Office Expense 19 Supervisor Salary 31 Share Rent @ 18% of Gross Returns 184 Field Sanitation 1 Property Taxes 3 Property Insurance 3 Investment Repairs 4 TOTAL CASH OVERHEAD COSTS 245 TOTAL CASH COSTS/ACRE 921 NON-CASH OVERHEAD: Per producing -- Annual Cost -- Investment Acre Capital Recovery Fuel Tanks & Pumps 9 1 1 Fuel Wagon 1 0 0 Truck Tractor 15 1 1 Trailer - Lowbed 3 0 0 Trailer - Pipe 1 0 0 Shop Building 71 5 5 Shop Tools 5 0 0 Storage Building 11 1 1 Closed Mix System 2 0 0 Pipe - Main Line 25 3 3 Siphon Tubes 4 0 0 Tool Carrier 7 1 1 Portable Pump 9 1 1 Forklift - 4 Ton 3 0 0 Equipment 419 42 42 TOTAL NON-CASH OVERHEAD COSTS 585 56 56 TOTAL COSTS/ACRE 977

2008 Field Corn Costs and Returns Study (on Mineral Soils) Sacramento Valley UC Cooperative Extension 10
UC COOPERATIVE EXTENSION Table 2. COSTS AND RETURNS PER ACRE TO PRODUCE FIELD CORN
SACRAMENTO VALLEY – 2008 ON MINERAL SOILS
Price or Value or Your Quantity/Acre Unit Cost/Unit Cost/Acre Cost GROSS RETURNS Corn For Grain 6.00 Ton 170.00 1,020 TOTAL GROSS RETURNS FOR CORN 1,020 OPERATING COSTS Herbicide: Roundup Weathermax 44.00 FlOz 0.54 24 Shark 0.08 Oz 8.20 1 Custom: Air Application 1.00 Acre 9.25 9 Irrigation: Water 37.20 AcIn 2.67 99 Seed: Seed Corn (Herbicide Resistant Variety) 36.00 Thou 2.24 81 Fertilizer: 10-34-0 151.00 Lb 0.223 34 Zinc Chelate 6% 2.00 Pint 0.913 2 20-0-0 (Aqua) 225.00 Lb N 0.555 125 Insecticide: Sevin 5 Pellets 2.00 Lb 0.81 2 Rent: Rig to Inject Aqua 1.00 Acre 3.00 3 Labor (machine) 3.53 Hrs 15.72 55 Labor (non-machine) 7.50 Hrs 10.88 82 Fuel - Gas 0.83 Gal 3.57 3 Fuel - Diesel 27.83 Gal 3.54 99 Lube 15 Machinery repair 25 Interest on Operating Capital @ 6.75% 19 TOTAL OPERATING COSTS/ACRE 676 NET RETURNS ABOVE OPERATING COSTS 344 CASH OVERHEAD COSTS: Liability Insurance 1 Office Expense 19 Supervisor Salary 31 Share Rent @ 18% of Gross Returns 184 Field Sanitation 1 Property Taxes 3 Property Insurance 3 Investment Repairs 4 TOTAL CASH OVERHEAD COSTS/ACRE 245 TOTAL CASH COSTS/ACRE 921 NON-CASH OVERHEAD COSTS (CAPITAL RECOVERY) Fuel Tanks & Pumps 1 Fuel Wagon 0 Truck Tractor 1 Trailer - Lowbed 0 Trailer - Pipe 0 Shop Building 5 Shop Tools 0 Storage Building 1 Closed Mix System 0 Pipe - Main Line 3 Siphon Tubes 0 Tool Carrier 1 Portable Pump 1 Forklift - 4 Ton 0 Equipment (Listed in Tables 4 & 5) 42 TOTAL NON-CASH OVERHEAD COSTS/ACRE 56 TOTAL COSTS/ACRE 977 NET RETURNS ABOVE TOTAL COSTS 43

2008 Field Corn Costs and Returns Study (on Mineral Soils) Sacramento Valley UC Cooperative Extension 11
U.C. COOPERATIVE EXTENSION Table 3. MONTHLY CASH COSTS
SACRAMENTO VALLEY – 2008 ON MINERAL SOILS
Beginning OCT 07 OCT NOV DEC JAN FEB MAR APR MAY JUN JUL AUG SEP TOTAL Ending SEP 08 07 07 07 08 08 08 08 08 08 08 08 08 Cultural: Disc Field – on 25% of Acreage 3 3 Subsoil – on 25% of Acreage 7 7 Land Plane Field - 2X 22 22 List Beds 9 9 Apply Fallow Herbicide 21 21 Cultivate Beds 12 12 Pre-irrigate – on 20% of Acreage 3 3 Plant Corn & Apply Fertilizer 127 127 Break Crust - 10% of Acreage 1 1 Open Ditch - 2X 7 7 Irrigate - 6X 30 30 59 59 178 Close Ditch - 2X 3 3 6 Insect Control - Cutworms on 20% of Acreage 3 3 Cultivate & Sidedress Fertilizer 146 146 Weed Control - Glyphosate 17 17 Weed Control - Grasses on 25% of Acreage 6 6 Postharvest - Chop Stubble 16 16 Postharvest - Disc Stubble 27 27 Pickup Truck Use 1 1 1 1 1 1 1 1 1 1 1 1 9 ATV Use 0 0 0 0 0 0 0 0 0 0 0 0 2 TOTAL CULTURAL COSTS 42 1 1 1 22 1 173 213 60 60 4 44 622 Harvest: Combine Corn 21 21 Bankout Grain 14 14 TOTAL HARVEST COSTS 35 35 Interest on Operating Capital @ 6.75% 0 0 0 0 0 0 1 3 3 3 3 4 19 TOTAL OPERATING COSTS/ACRE 43 1 1 1 22 1 175 215 63 63 7 82 676 CASH OVERHEAD: Liability Insurance 1 1 Office Expense 2 2 2 2 2 2 2 2 2 2 2 2 19 Supervisor Salary 3 3 3 3 3 3 3 3 3 3 3 3 31 Share Rent @ 18% of Gross Returns 184 184 Field Sanitation 0 0 0 0 0 0 0 0 0 0 0 0 1 Property Taxes 2 2 3 Property Insurance 1 1 3 Investment Repairs 0 0 0 0 0 0 0 0 0 0 0 0 4 TOTAL CASH OVERHEAD COSTS 5 5 5 8 5 5 5 5 5 8 5 188 245 TOTAL CASH COSTS/ACRE 47 6 6 9 27 6 179 220 68 71 12 270 921
2008 Field Corn Costs and Returns Study (on Mineral Soils) Sacramento Valley UC Cooperative Extension 12
UC COOOPERATIVE EXTENSION
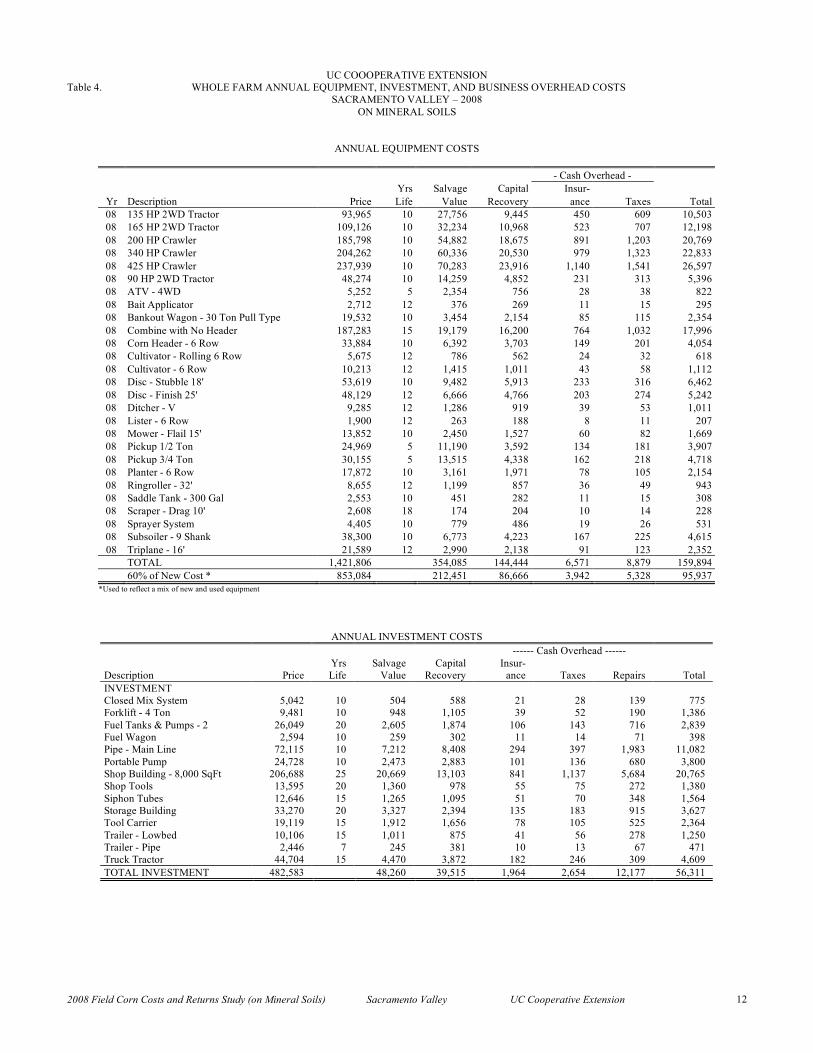
Table 4. WHOLE FARM ANNUAL EQUIPMENT, INVESTMENT, AND BUSINESS OVERHEAD COSTS SACRAMENTO VALLEY – 2008
ON MINERAL SOILS
ANNUAL EQUIPMENT COSTS
- Cash Overhead - Yrs Salvage Capital Insur-
Yr Description Price Life Value Recovery ance Taxes Total 08 135 HP 2WD Tractor 93,965 10 27,756 9,445 450 609 10,503 08 165 HP 2WD Tractor 109,126 10 32,234 10,968 523 707 12,198 08 200 HP Crawler 185,798 10 54,882 18,675 891 1,203 20,769 08 340 HP Crawler 204,262 10 60,336 20,530 979 1,323 22,833 08 425 HP Crawler 237,939 10 70,283 23,916 1,140 1,541 26,597 08 90 HP 2WD Tractor 48,274 10 14,259 4,852 231 313 5,396 08 ATV - 4WD 5,252 5 2,354 756 28 38 822 08 Bait Applicator 2,712 12 376 269 11 15 295 08 Bankout Wagon - 30 Ton Pull Type 19,532 10 3,454 2,154 85 115 2,354 08 Combine with No Header 187,283 15 19,179 16,200 764 1,032 17,996 08 Corn Header - 6 Row 33,884 10 6,392 3,703 149 201 4,054 08 Cultivator - Rolling 6 Row 5,675 12 786 562 24 32 618 08 Cultivator - 6 Row 10,213 12 1,415 1,011 43 58 1,112 08 Disc - Stubble 18' 53,619 10 9,482 5,913 233 316 6,462 08 Disc - Finish 25' 48,129 12 6,666 4,766 203 274 5,242 08 Ditcher - V 9,285 12 1,286 919 39 53 1,011 08 Lister - 6 Row 1,900 12 263 188 8 11 207 08 Mower - Flail 15' 13,852 10 2,450 1,527 60 82 1,669 08 Pickup 1/2 Ton 24,969 5 11,190 3,592 134 181 3,907 08 Pickup 3/4 Ton 30,155 5 13,515 4,338 162 218 4,718 08 Planter - 6 Row 17,872 10 3,161 1,971 78 105 2,154 08 Ringroller - 32' 8,655 12 1,199 857 36 49 943 08 Saddle Tank - 300 Gal 2,553 10 451 282 11 15 308 08 Scraper - Drag 10' 2,608 18 174 204 10 14 228 08 Sprayer System 4,405 10 779 486 19 26 531 08 Subsoiler - 9 Shank 38,300 10 6,773 4,223 167 225 4,615 08 Triplane - 16' 21,589 12 2,990 2,138 91 123 2,352 TOTAL 1,421,806 354,085 144,444 6,571 8,879 159,894 60% of New Cost * 853,084 212,451 86,666 3,942 5,328 95,937
*Used to reflect a mix of new and used equipment
ANNUAL INVESTMENT COSTS ------ Cash Overhead ------ Yrs Salvage Capital Insur- Description Price Life Value Recovery ance Taxes Repairs Total INVESTMENT Closed Mix System 5,042 10 504 588 21 28 139 775 Forklift - 4 Ton 9,481 10 948 1,105 39 52 190 1,386 Fuel Tanks & Pumps - 2 26,049 20 2,605 1,874 106 143 716 2,839 Fuel Wagon 2,594 10 259 302 11 14 71 398 Pipe - Main Line 72,115 10 7,212 8,408 294 397 1,983 11,082 Portable Pump 24,728 10 2,473 2,883 101 136 680 3,800 Shop Building - 8,000 SqFt 206,688 25 20,669 13,103 841 1,137 5,684 20,765 Shop Tools 13,595 20 1,360 978 55 75 272 1,380 Siphon Tubes 12,646 15 1,265 1,095 51 70 348 1,564 Storage Building 33,270 20 3,327 2,394 135 183 915 3,627 Tool Carrier 19,119 15 1,912 1,656 78 105 525 2,364 Trailer - Lowbed 10,106 15 1,011 875 41 56 278 1,250 Trailer - Pipe 2,446 7 245 381 10 13 67 471 Truck Tractor 44,704 15 4,470 3,872 182 246 309 4,609 TOTAL INVESTMENT 482,583 48,260 39,515 1,964 2,654 12,177 56,311

2008 Field Corn Costs and Returns Study (on Mineral Soils) Sacramento Valley UC Cooperative Extension 13
UC COOPERATIVE EXTENSION Table 4 continued
ANNUAL BUSINESS OVERHEAD COSTS Units/ Price/ Total Description Farm Unit Unit Cost Field Sanitation 2,900 Acre 0.86 2,494 Liability Insurance 2,900 Acre 0.50 1,450 Office Expense 2,900 Acre 18.97 55,013 Share Rent @ 18% of Gross Returns 600 Acre 183.60 110,160 Supervisor Salary 600 Acre 31.32 18,792
Table 5. HOURLY EQUIPMENT COSTS
------------------------- COSTS PER HOUR ----------------------------------- Actual - Cash Overhead - -------- Operating -------- Hours Capital Insur- Fuel & Total Total
Yr Description Used Recovery ance Taxes Repairs Lube Oper. Costs/Hr. 08 135 HP 2WD Tractor 1,199.6 4.72 0.23 0.30 4.41 31.90 36.31 41.56 08 165 HP 2WD Tractor 1,200.0 5.48 0.26 0.35 5.12 38.98 44.10 50.20 08 200 HP Crawler 1,599.2 7.01 0.33 0.45 4.99 47.25 52.24 60.03 08 340 HP Crawler 1,599.2 7.70 0.37 0.50 5.48 80.33 85.81 94.37 08 425 HP Crawler 1,599.2 8.97 0.43 0.58 6.38 100.40 106.78 116.76 08 90 HP 2WD Tractor 1,230.8 2.37 0.11 0.15 2.27 18.39 20.66 23.29 08 ATV - 4WD 285.0 1.59 0.06 0.08 0.34 4.11 4.45 6.18 08 Bait Applicator 100.0 1.61 0.07 0.09 1.05 0.00 1.05 2.82 08 Bankout Wagon - 30 Ton Pull Type 200.0 6.46 0.26 0.34 2.71 0.00 2.71 9.77 08 Combine with No Header 200.2 48.55 2.29 3.09 13.40 50.80 64.20 118.14 08 Corn Header - 6 Row 200.0 11.11 0.45 0.60 6.44 0.00 6.44 18.61 08 Cultivator - Rolling 6 Row 166.0 2.03 0.09 0.12 1.20 0.00 1.20 3.43 08 Cultivator - 6 Row 192.0 3.16 0.13 0.18 2.16 0.00 2.16 5.64 08 Disc - Stubble 18' 200.0 17.74 0.70 0.95 8.90 0.00 8.90 28.29 08 Disc - Finish 25' 153.9 18.58 0.79 1.07 7.88 0.00 7.88 28.31 08 Ditcher - V 166.0 3.32 0.14 0.19 2.60 0.00 2.60 6.26 08 Lister - 6 Row 166.0 0.68 0.03 0.04 0.40 0.00 0.40 1.15 08 Mower - Flail 15' 200.0 4.58 0.18 0.24 5.88 0.00 5.88 10.89 08 Pickup 1/2 Ton 285.0 7.56 0.28 0.38 1.63 10.26 11.89 20.12 08 Pickup 3/4 Ton 285.0 9.13 0.34 0.46 1.97 12.32 14.29 24.22 08 Planter - 6 Row 150.0 7.88 0.31 0.42 4.97 0.00 4.97 13.58 08 Ringroller - 32' 166.0 3.10 0.13 0.18 0.99 0.00 0.99 4.40 08 Saddle Tank - 300 Gal 150.0 1.13 0.04 0.06 0.69 0.00 0.69 1.92 08 Scraper - Drag 10' 166.0 0.74 0.04 0.05 0.39 0.00 0.39 1.21 08 Sprayer System 177.4 1.64 0.06 0.09 1.19 0.00 1.19 2.98 08 Subsoiler - 9 Shank 170.0 14.91 0.59 0.80 8.78 0.00 8.78 25.07 08 Triplane - 16' 250.6 5.12 0.22 0.29 3.31 0.00 3.31 8.94

2008 Field Corn Costs and Returns Study (on Mineral Soils) Sacramento Valley UC Cooperative Extension 14
UC COOPERATIVE EXTENSION Table 6. RANGING ANALYSIS
SACRAMENTO VALLEY - 2008
COSTS PER ACRE AT VARYING YIELDS TO PRODUCE FIELD CORN FOR GRAIN YIELD (ton/acre) 4.5 5.0 5.5 6.0 6.5 7.0 7.5
OPERATING COSTS/ACRE: Cultural Cost 622 622 622 622 622 622 622 Harvest Cost 26 29 32 35 38 40 43
Interest on Operating Capital 19 19 19 19 19 19 19
TOTAL OPERATING COSTS/ACRE 667 670 673 676 679 682 685 TOTAL OPERATING COSTS/TON 148 134 122 113 104 97 91
CASH OVERHEAD COSTS/ACRE 245 245 245 245 245 245 246
TOTAL CASH COSTS/ACRE 912 915 918 921 924 927 930 TOTAL CASH COSTS/TON 203 183 167 154 142 132 124
NON-CASH OVERHEAD COSTS/ACRE 54 55 55 56 56 56 57
TOTAL COSTS/ACRE 966 970 973 977 980 983 987 TOTAL COSTS/TON 215 194 177 163 151 140 132
NET RETURNS PER ACRE ABOVE OPERATING COSTS FOR FIELD CORN FOR GRAIN PRICE YIELD
(DOLLARS/TON) (TON/ACRE) Field Corn 4.5 5.0 5.5 6.0 6.5 7.0 7.5
---------- $/ton ----------
140 -37 30 97 164 231 298 365 150 8 80 152 224 296 368 440 160 53 130 207 284 361 438 515 170 98 180 262 344 426 508 590 180 143 230 317 404 491 578 665 190 188 280 372 464 556 648 740 200 233 330 427 524 621 718 815
NET RETURN PER ACRE ABOVE CASH COST FOR FIELD CORN FOR GRAIN PRICE YIELD
(DOLLARS/TON) (TON/ACRE) Field Corn 4.5 5.0 5.5 6.0 6.5 7.0 7.5
---------- $/ton ----------
140 -282 -215 -148 -81 -14 53 120 150 -237 -165 -93 -21 51 123 195 160 -192 -115 -38 39 116 193 270 170 -147 -65 17 99 181 263 345 180 -102 -15 72 159 246 333 420 190 -57 35 127 219 311 403 495 200 -12 85 182 279 376 473 570
NET RETURNS PER ACRE ABOVE TOTAL COST FOR FIELD CORN FOR GRAIN PRICE YIELD
(DOLLARS/TON) (TON/ACRE) Field Corn 4.5 5.0 5.5 6.0 6.5 7.0 7.5
---------- $/ton ----------
140 -336 -270 -203 -137 -70 -3 63 150 -291 -220 -148 -77 -5 67 138 160 -246 -170 -93 -17 60 137 213 170 -201 -120 -38 43 125 207 288 180 -156 -70 17 103 190 277 363 190 -111 -20 72 163 255 347 438 200 -66 30 127 223 320 417 513

2008 Field Corn Costs and Returns Study (on Mineral Soils) Sacramento Valley UC Cooperative Extension 15
UC COOPERATIVE EXTENSION Table 7. COSTS AND RETURNS/BREAKEVEN ANALYSIS
SACRAMENTO VALLEY - 2008
1. Gross 2. Operating 3. Net Returns 4. Cash 5. Net Returns 6. Total 7. Net Returns Returns Costs Above Oper. Costs Above Cash Costs Above Total Crop Costs (1-2) Costs (1-4) Costs (1-6) Field Corn 1,020 676 344 921 99 977 43
COSTS AND RETURNS - TOTAL ACREAGE
1. Gross 2. Operating 3. Net Returns 4. Cash 5. Net Returns 6. Total 7. Net Returns Returns Costs Above Oper. Costs Above Cash Costs Above Total Crop Costs (1-2) Costs (1-4) Costs (1-6) Field Corn 612,000 405,494 206,506 552,736 59,264 586,061 25,939
BREAKEVEN PRICES PER YIELD UNIT -------- Breakeven Price To Cover -------- Base Yield Yield Operating Cash Total CROP (Units/Acre) Units Costs Costs Costs ------------ $ per Yield Unit ------------ Field Corn 6.0 Ton 112.64 153.54 162.79
BREAKEVEN YIELDS PER ACRE -------- Breakeven Yield To Cover -------- Yield Base Price Operating Cash Total CROP Units ($/Unit) Costs Costs Costs ----------- Yield Units / Acre ----------- Field Corn Ton 170.00 4.0 5.4 5.7
2008 Field Corn Costs and Returns Study (on Mineral Soils) Sacramento Valley UC Cooperative Extension 16
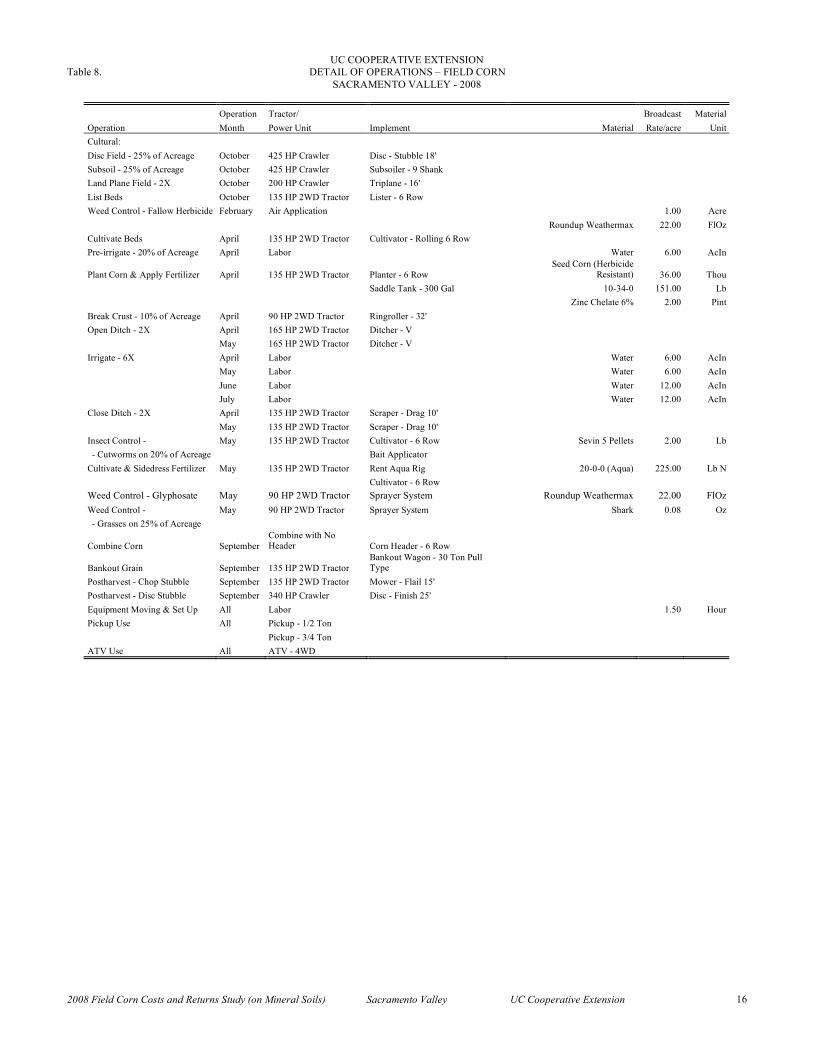
UC COOPERATIVE EXTENSION Table 8. DETAIL OF OPERATIONS – FIELD CORN
SACRAMENTO VALLEY - 2008
Operation Tractor/ Broadcast Material Operation Month Power Unit Implement Material Rate/acre Unit Cultural: Disc Field - 25% of Acreage October 425 HP Crawler Disc - Stubble 18' Subsoil - 25% of Acreage October 425 HP Crawler Subsoiler - 9 Shank Land Plane Field - 2X October 200 HP Crawler Triplane - 16' List Beds October 135 HP 2WD Tractor Lister - 6 Row Weed Control - Fallow Herbicide February Air Application 1.00 Acre Roundup Weathermax 22.00 FlOz Cultivate Beds April 135 HP 2WD Tractor Cultivator - Rolling 6 Row Pre-irrigate - 20% of Acreage April Labor Water 6.00 AcIn
Plant Corn & Apply Fertilizer April 135 HP 2WD Tractor Planter - 6 Row Seed Corn (Herbicide
Resistant) 36.00 Thou Saddle Tank - 300 Gal 10-34-0 151.00 Lb Zinc Chelate 6% 2.00 Pint Break Crust - 10% of Acreage April 90 HP 2WD Tractor Ringroller - 32' Open Ditch - 2X April 165 HP 2WD Tractor Ditcher - V May 165 HP 2WD Tractor Ditcher - V Irrigate - 6X April Labor Water 6.00 AcIn May Labor Water 6.00 AcIn June Labor Water 12.00 AcIn July Labor Water 12.00 AcIn Close Ditch - 2X April 135 HP 2WD Tractor Scraper - Drag 10' May 135 HP 2WD Tractor Scraper - Drag 10' Insect Control - May 135 HP 2WD Tractor Cultivator - 6 Row Sevin 5 Pellets 2.00 Lb - Cutworms on 20% of Acreage Bait Applicator Cultivate & Sidedress Fertilizer May 135 HP 2WD Tractor Rent Aqua Rig 20-0-0 (Aqua) 225.00 Lb N Cultivator - 6 Row Weed Control - Glyphosate May 90 HP 2WD Tractor Sprayer System Roundup Weathermax 22.00 FlOz Weed Control - May 90 HP 2WD Tractor Sprayer System Shark 0.08 Oz - Grasses on 25% of Acreage
Combine Corn September Combine with No Header Corn Header - 6 Row
Bankout Grain September 135 HP 2WD Tractor Bankout Wagon - 30 Ton Pull Type
Postharvest - Chop Stubble September 135 HP 2WD Tractor Mower - Flail 15' Postharvest - Disc Stubble September 340 HP Crawler Disc - Finish 25' Equipment Moving & Set Up All Labor 1.50 Hour Pickup Use All Pickup - 1/2 Ton Pickup - 3/4 Ton ATV Use All ATV - 4WD