same jeans, same stitch? a comparison of denim · pdf filewe map the manufacturing process for...
TRANSCRIPT

The Lahore Journal of Economics 21 : SE (September 2016): pp. 211–236
Same Jeans, Same Stitch? A Comparison of Denim
Production Across Three Factories in Punjab, Pakistan
Theresa Thompson Chaudhry* and Mahvish Faran**
Abstract
In this paper, we look at denim production in three different factories in Punjab, Pakistan. We map the manufacturing process for a standard pair of denim jeans produced for an international retailer. We asked three factories of different scales and proximities to the technological frontier to stitch, finish and wash an identical pair of jeans. These firms included a large-scale exporter with established links to a major multinational brand, a medium exporter with links to regional European labels and a small producer selling primarily to the domestic market. Timing the operations ourselves, we find that the stitching time of the large-scale exporter is about one-third less than that of the medium exporter and about half the stitching time of the small firm. Of the three firms, only the large exporter pays wages based strictly on standard minute value – the time expected to complete an operation. The two smaller firms pay piece rates that reflect the market rates paid for individual operations by firms throughout the sector. Even without increases in stitching efficiency, the two smaller firms could reduce their stitching costs by 30–50 percent if they were able to switch to paying wages based on stitching times. We also calculate the labor cost savings that the two smaller firms could accrue by adopting some of the more advanced equipment used by the large exporter, along with lower piece rates. Of these, the most reasonable investment would be in better loop-making machines; the cost of equipment could be recuperated by producing 325,000–500,000 garments, which for the medium firm is four to eight months’ production at current levels. However, piece rates are entrenched and, if sticky, could reduce the incentives for firms to adopt labor-saving technologies.
Keywords: readymade garments, manufacturing, Pakistan, piece rates, SMV, choice of technology.
JEL classification: O14.
* Professor, Department of Economics, Lahore School of Economics. I would like to thank the
firms who participated in our stitching experiment for their openness and cooperation. I would also
like to thank Rashid Amjad, Rajah Rasiah, and Irfan ul Haque for their valuable comments at the
conference. ** Visiting lecturer, Lahore School of Economics.

Theresa Thompson Chaudhry and Mahvish Faran 212
1. Introduction
Textiles account for over half of Pakistan’s exports, with readymade garments (RMGs) and textile made-ups comprising more than half of textile exports in 2011/12 (Hamid, Nabi & Zafar, 2014).1 Pakistan produces both woven fabrics and knitwear, in about equal amounts. Due to restrictions on the import of synthetic fabrics, Pakistan’s garment producers are concentrated in home textiles (towels and bed linen), menswear (socks and polo shirts) and denim. Pakistan’s homegrown cotton is well suited to woven denim production, the product category that we focus on in this study.
When the European Union granted preferential GSP+ status to Pakistan in December 2013, garment manufacturers were palpably excited about the prospects of increased export opportunities to Europe.2 They also hoped to capitalize on the trend of rising wages in China as international brands sought cheaper sourcing options (Figure 1).
Figure 1: Labor cost (USD/hour) in the textiles industry
Source: Technopak and Werner International, Textile Intelligence.
To these ends, the current government announced the development of a 1,500-acre industrial estate for garments – the proposed Quaid-e-Azam Apparel Park outside Lahore, near Sheikhupura.3 However, Pakistan faces
1 As of 2014, Pakistan was the sixth largest exporter of textiles and eighth largest exporter of
clothing outside Europe and the US (http://stat.wto.org/StatisticalProgram/
WSDBStatProgramSeries.aspx?Language=E, accessed 31 January 2016). 2 Indeed, exports of apparel rose in the first six months of 2015 (compared to the previous year)
even though overall exports to Europe fell in the same period (McGregor, 2015). 3 As of June 2016, a masterplan has been approved.
0.7 0.8 0.9
1.9 2.1
0.00.51.01.52.02.53.03.54.04.55.0
2002 2004 2007 2008 2011
Turkey China, coastal IndiaIndonesia Vietnam PakistanBangladesh

A Comparison of Denim Production Across Factories in Punjab 213
a number of competitors for the business expected to move out of China, including Bangladesh, Cambodia, India, Indonesia and Vietnam. From Figure 1, we can see that, as of 2011, Pakistan and India’s labor costs per hour were comparable, but that of Bangladesh was even lower.
As we know, however, it does not make sense to look at wages alone when there are significant differences in labor productivity. The New Delhi-based consulting firm Technopak estimates that, while wages are higher in Bangladesh, workers are less efficient and the level of technology is lower (Table 1). Similarly, our pilot project to benchmark physical output productivity – rather than the standard revenue productivity – using high-frequency worker and line-level data finds a 16 percent productivity advantage when comparing a Pakistani knitwear manufacturer to the most efficient units in a sample of Bangladeshi firms producing very similar products (Chaudhry, Macchiavello, Chaudhry & Woodruff, 2016).
Table 1: Worker efficiency, wages and technology in selected Asian
countries
Countries Average
payout
(US$ p.m.)
Key product
category
Country av.
operational
efficiency
Technological
advancement
Raw
material
availability
China 220-270 All products 55-57% High All
Indonesia 170 Woven synthetic
44-46% Medium Synthetic fiber
Vietnam 120 All products 40-42% Medium None
Pakistan 116 Denim 42-44% Medium Cotton
Cambodia 88 Denim, woven 42-44% Medium None
Bangladesh 83 Knitwear, woven bottoms
38-40% Low None
India 130 All products 44-46% Medium Cotton
Source: Presentation by Technopak, 9 December 2013, International Textile and Clothing Conference, Lahore.
In addition, Pakistan has the advantage of homegrown cotton, reducing material costs over competitors such as Bangladesh, Vietnam and Cambodia. On the other hand, its manufacturers tend to face higher energy costs and greater political instability in comparison to the same. When looking at overall costs (labor, materials, overheads, shipping, tariffs, etc.), Nathan Associates (2009) find that Pakistan compares favorably to Bangladesh in the production of t-shirts and chinos.

Theresa Thompson Chaudhry and Mahvish Faran 214
Along with researchers at the University of Warwick, we recently carried out a pilot project to compare the sewing efficiencies of Bangladeshi factories to those in Pakistan (Chaudhry et al., 2016). We intended to make these comparisons using measures of the time allocated to each sewing operation carried out along the line, known in the RMG sector as the standard minute value (SMV) or standard allowed minute (SAM). Although international databases of SMVs exist, many factories develop their own standards, usually based on their time and motion studies. Since similar stitching operations are performed for a variety of garments, we hypothesized that SMV/SAM could be used to compare factories’ efficiency levels even though different styles of garments were being manufactured. As long as there is consistency within the factory in how the local SMV is calculated, relative efficiencies between firms can be compared based on the SMVs for identical processes.4
It is much easier to match processes across factories to compare SMVs when they produce the same category of apparel, for example, t-shirts or trousers. However, the data our co-researchers had collected in Bangladesh was mainly for knitwear (t-shirts), while the data we collected in Pakistan was principally for denim (jeans). This variety in the garments being produced made it difficult to compare SMVs. Another constraint was that only the large firms had industrial engineers to calculate SMVs, and so we were unable to compare the larger, more organized firms with smaller units. In our work on the RMG sector, we have noted significant variation in the scale of production, the technologies utilized and the ways that factories collect data and plan production, despite producing similar products and exporting to some of the same markets.
Given the issues encountered in the pilot benchmarking project in matching processes across factories producing different garments, and the fact that smaller factories lack data on SMVs, this case study is an attempt to compare efficiencies between factories of different levels of sophistication by timing their stitching of an identical denim garment. We then compare these firms based on stitching times, stitching cost and quality of the finished garment.
The remaining paper proceeds as follows. In Section 2, we describe the three firms, the stitching experiment and the results. In Section 3, we discuss the benefits and drawbacks (for the smaller firms) of adopting
4 The benchmarking exercise requires making adjustments for ‘helpers’ who assist sewing
operators and can be made more precise if there is data on the types of sewing machines used (for
example, auto-trimmers).

A Comparison of Denim Production Across Factories in Punjab 215
some of the advanced technology used by the large exporter. Section 4 concludes the study.
2. The Experiment
Starting with the already woven fabric, the production of denim jeans is broken down into several stages, roughly, fabric cutting, sewing, dry and wet processes (the application of chemicals, lasers, sandpaper and washes for a fashionable ‘worn’ look) and packing/shipping. Details of these processes and the different technologies used by denim producers in Pakistan are given in Appendix 1.
For this case study, we engaged three firms at different scales of production in an experiment – where each produced a batch of identical jeans – in order to better understand the differences between firms, particularly in the efficiency of sewing operators. To a lesser extent, we attempt to compare some of the other processes, including cutting, washing and finishing. Only the large-scale firm in our sample regularly produces the garment chosen for the experiment. The other two firms do not produce this exact style, but produce very similar products so that the experimental garment was easily within their skill set.
We start by describing the three firms that agreed to participate in the experiment. Then, we describe the stitching experiment carried out and discuss the results. The results include comparisons of the stitching times, stitching costs and garment quality.
1.1 The Three Experimental Firms: Characteristics and Technology
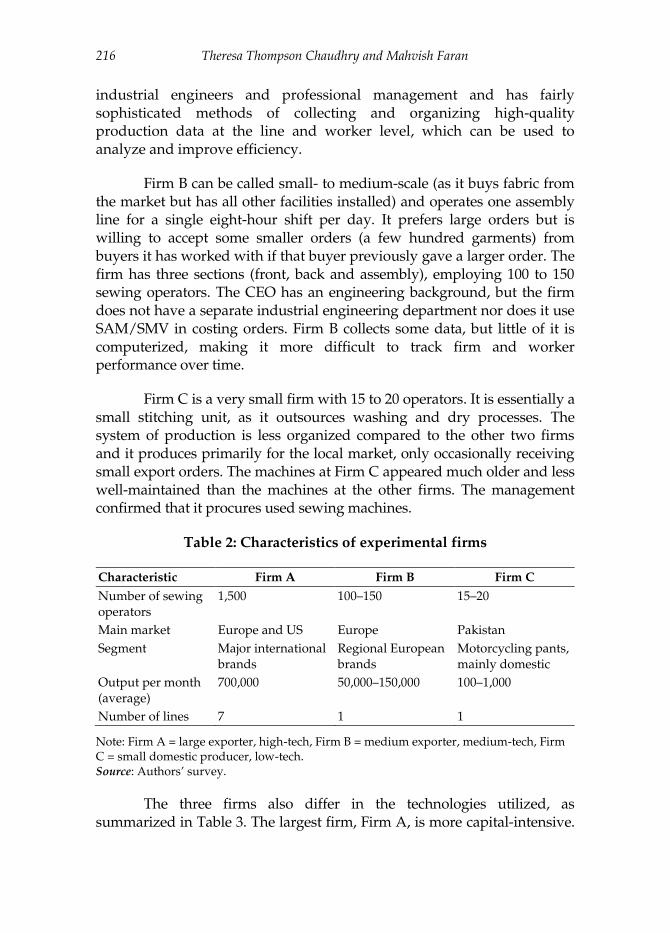
We engaged three firms for the experiment: a large exporter (Firm A), a small to medium exporter (Firm B) and a small producer for the domestic market (Firm C). We summarize the basic characteristics of the firms in Table 2 and the technologies they use in Table 3.
Firm A is a large-scale vertically integrated firm, operating two shifts a day on seven assembly lines. It uses some of the most technologically advanced equipment such as laser machines that add elaborate designs to the jeans. Some lines are dedicated to basic garments; others specialize in higher-fashion garments (such as denim products with embroidery or special accessories). Firm A employs around 1,500 sewing operators. The minimum order it accepts from any buyer is not less than a few thousand garments. The firm is well organized, employs
Theresa Thompson Chaudhry and Mahvish Faran 216
industrial engineers and professional management and has fairly sophisticated methods of collecting and organizing high-quality production data at the line and worker level, which can be used to analyze and improve efficiency.
Firm B can be called small- to medium-scale (as it buys fabric from the market but has all other facilities installed) and operates one assembly line for a single eight-hour shift per day. It prefers large orders but is willing to accept some smaller orders (a few hundred garments) from buyers it has worked with if that buyer previously gave a larger order. The firm has three sections (front, back and assembly), employing 100 to 150 sewing operators. The CEO has an engineering background, but the firm does not have a separate industrial engineering department nor does it use SAM/SMV in costing orders. Firm B collects some data, but little of it is computerized, making it more difficult to track firm and worker performance over time.
Firm C is a very small firm with 15 to 20 operators. It is essentially a small stitching unit, as it outsources washing and dry processes. The system of production is less organized compared to the other two firms and it produces primarily for the local market, only occasionally receiving small export orders. The machines at Firm C appeared much older and less well-maintained than the machines at the other firms. The management confirmed that it procures used sewing machines.
Table 2: Characteristics of experimental firms
Characteristic Firm A Firm B Firm C
Number of sewing operators
1,500 100–150 15–20
Main market Europe and US Europe Pakistan
Segment Major international brands
Regional European brands
Motorcycling pants, mainly domestic
Output per month (average)
700,000 50,000–150,000 100–1,000
Number of lines 7 1 1
Note: Firm A = large exporter, high-tech, Firm B = medium exporter, medium-tech, Firm C = small domestic producer, low-tech. Source: Authors’ survey.
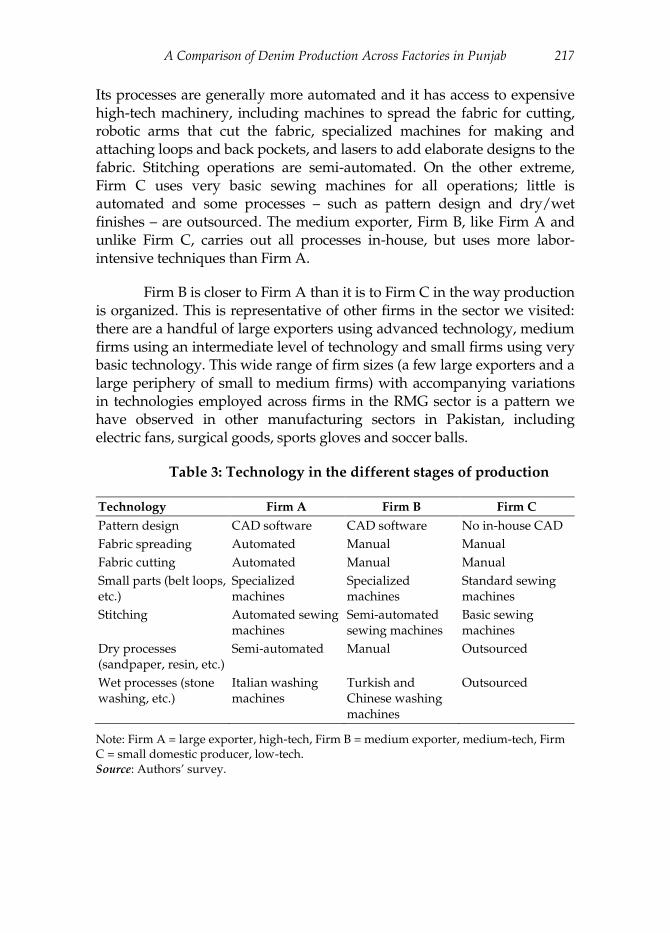
The three firms also differ in the technologies utilized, as summarized in Table 3. The largest firm, Firm A, is more capital-intensive.
A Comparison of Denim Production Across Factories in Punjab 217
Its processes are generally more automated and it has access to expensive high-tech machinery, including machines to spread the fabric for cutting, robotic arms that cut the fabric, specialized machines for making and attaching loops and back pockets, and lasers to add elaborate designs to the fabric. Stitching operations are semi-automated. On the other extreme, Firm C uses very basic sewing machines for all operations; little is automated and some processes – such as pattern design and dry/wet finishes – are outsourced. The medium exporter, Firm B, like Firm A and unlike Firm C, carries out all processes in-house, but uses more labor-intensive techniques than Firm A.
Firm B is closer to Firm A than it is to Firm C in the way production is organized. This is representative of other firms in the sector we visited: there are a handful of large exporters using advanced technology, medium firms using an intermediate level of technology and small firms using very basic technology. This wide range of firm sizes (a few large exporters and a large periphery of small to medium firms) with accompanying variations in technologies employed across firms in the RMG sector is a pattern we have observed in other manufacturing sectors in Pakistan, including electric fans, surgical goods, sports gloves and soccer balls.
Table 3: Technology in the different stages of production
Technology Firm A Firm B Firm C
Pattern design CAD software CAD software No in-house CAD
Fabric spreading Automated Manual Manual
Fabric cutting Automated Manual Manual
Small parts (belt loops, etc.)
Specialized machines
Specialized machines
Standard sewing machines
Stitching Automated sewing machines
Semi-automated sewing machines
Basic sewing machines
Dry processes (sandpaper, resin, etc.)
Semi-automated Manual Outsourced
Wet processes (stone washing, etc.)
Italian washing machines
Turkish and Chinese washing machines
Outsourced
Note: Firm A = large exporter, high-tech, Firm B = medium exporter, medium-tech, Firm C = small domestic producer, low-tech. Source: Authors’ survey.

Theresa Thompson Chaudhry and Mahvish Faran 218
1.2 The Stitching Experiment
Typically, for each style of garment a firm manufactures, factories first design an operational breakdown, laying out the individual steps in the stitching process. In factories employing industrial engineers, the time allocated for each operation by machine operators and helpers, known as the SMV or SAM, is quantified as well. The total amount of time estimated for the garment to be stitched is then determined as the sum of SMVs for all operations.
For this case study, we have collected data on the SMV/SAM from the three firms that produced an identical pair of denim jeans. The data for Firm A, the most technologically advanced firm, was already available for the garment – a standard five-pocket pair of denim jeans that the factory regularly produces. For Firms B and C, however, we had to conduct our own time and motion studies to measure their SMVs since they do not produce exactly the same garment nor do they employ industrial engineers who calculate the SMVs.
First, we asked Firm B and Firm C to develop their own operational breakdowns based on the sample garment we provided; this was not a difficult task as it was very similar to styles they already produce. As mentioned earlier, Firm A regularly produces this exact garment so that its operational breakdown was already available. Next, we conducted time and motion studies to calculate the SMV/SAM for Firms B and C. The cycle time – the total time needed to complete each operation – was calculated using a stopwatch, as the average of five consecutive timed motions. To obtain the SMV/SAM, we added a 10 percent bundle allowance and 20 percent personal and machine allowances to the cycle times, according to common practice in the industry.
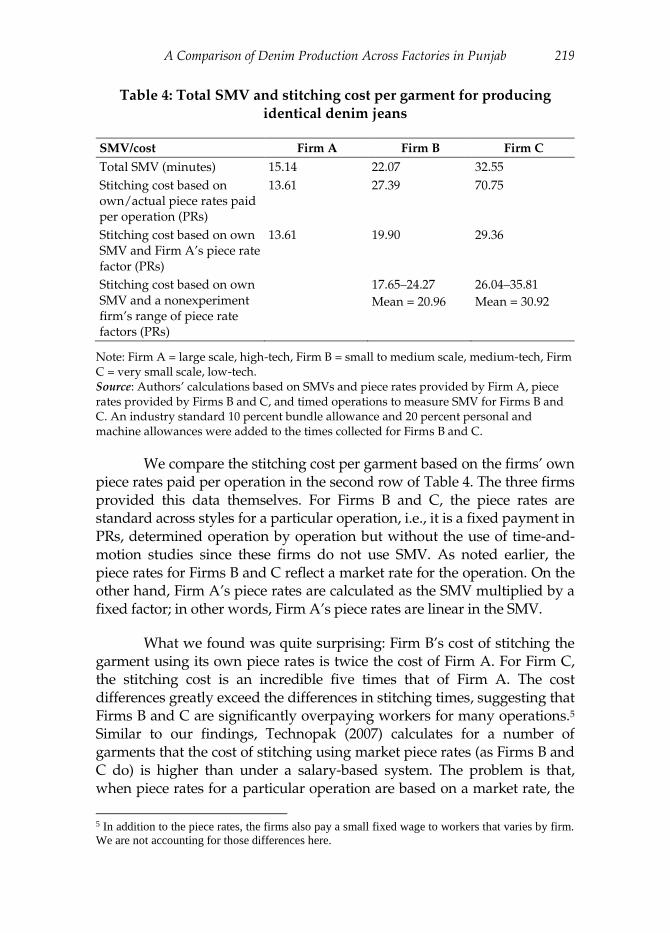
The total SMV (in minutes) to stitch a garment is given in the first row of Table 4. The results are striking: the total stitching time for Firm B is 50 percent higher and for Firm C is double that of the SMV provided by Firm A. To be fair, the SMVs of Firms B and C could fall with more experience; for our experiment, just two-and-a-half dozen garments were produced. Nonetheless, we expect that, even with practice, substantial differences in stitching efficiency would remain. We should note here that we are unable to decompose the differences in stitching efficiency to differences in technology as opposed to other factors that differ between the firms, such as worker characteristics and management – all of these are likely to play a part and to differ across firms.
A Comparison of Denim Production Across Factories in Punjab 219
Table 4: Total SMV and stitching cost per garment for producing
identical denim jeans
SMV/cost Firm A Firm B Firm C
Total SMV (minutes) 15.14 22.07 32.55
Stitching cost based on own/actual piece rates paid per operation (PRs)
13.61 27.39 70.75
Stitching cost based on own SMV and Firm A’s piece rate factor (PRs)
13.61 19.90 29.36
Stitching cost based on own SMV and a nonexperiment firm’s range of piece rate factors (PRs)
17.65–24.27
Mean = 20.96
26.04–35.81
Mean = 30.92
Note: Firm A = large scale, high-tech, Firm B = small to medium scale, medium-tech, Firm C = very small scale, low-tech. Source: Authors’ calculations based on SMVs and piece rates provided by Firm A, piece rates provided by Firms B and C, and timed operations to measure SMV for Firms B and C. An industry standard 10 percent bundle allowance and 20 percent personal and machine allowances were added to the times collected for Firms B and C.
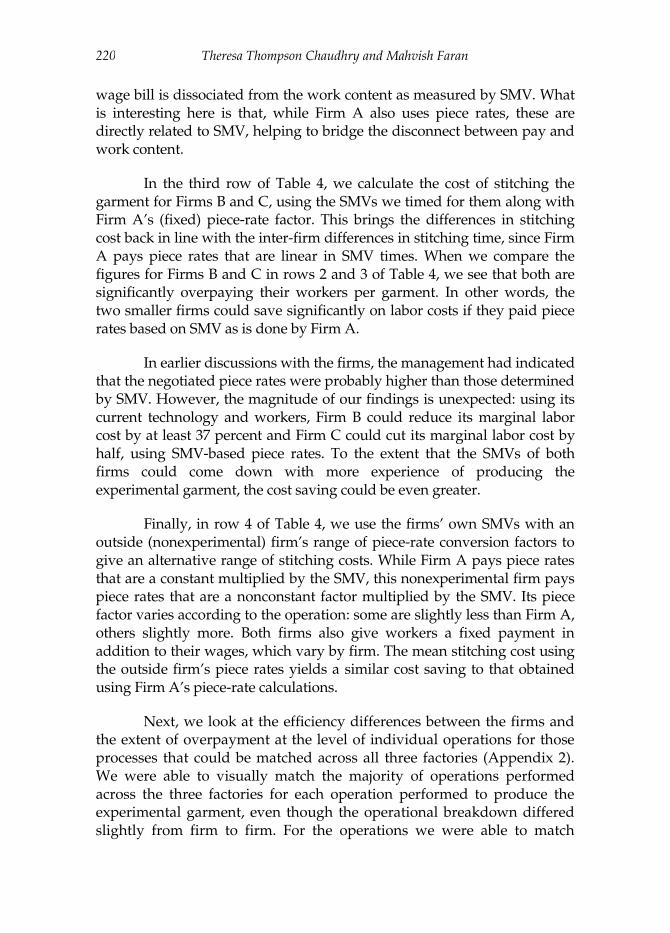
We compare the stitching cost per garment based on the firms’ own piece rates paid per operation in the second row of Table 4. The three firms provided this data themselves. For Firms B and C, the piece rates are standard across styles for a particular operation, i.e., it is a fixed payment in PRs, determined operation by operation but without the use of time-and-motion studies since these firms do not use SMV. As noted earlier, the piece rates for Firms B and C reflect a market rate for the operation. On the other hand, Firm A’s piece rates are calculated as the SMV multiplied by a fixed factor; in other words, Firm A’s piece rates are linear in the SMV.
What we found was quite surprising: Firm B’s cost of stitching the garment using its own piece rates is twice the cost of Firm A. For Firm C, the stitching cost is an incredible five times that of Firm A. The cost differences greatly exceed the differences in stitching times, suggesting that Firms B and C are significantly overpaying workers for many operations.5 Similar to our findings, Technopak (2007) calculates for a number of garments that the cost of stitching using market piece rates (as Firms B and C do) is higher than under a salary-based system. The problem is that, when piece rates for a particular operation are based on a market rate, the
5 In addition to the piece rates, the firms also pay a small fixed wage to workers that varies by firm.
We are not accounting for those differences here.
Theresa Thompson Chaudhry and Mahvish Faran 220
wage bill is dissociated from the work content as measured by SMV. What is interesting here is that, while Firm A also uses piece rates, these are directly related to SMV, helping to bridge the disconnect between pay and work content.
In the third row of Table 4, we calculate the cost of stitching the garment for Firms B and C, using the SMVs we timed for them along with Firm A’s (fixed) piece-rate factor. This brings the differences in stitching cost back in line with the inter-firm differences in stitching time, since Firm A pays piece rates that are linear in SMV times. When we compare the figures for Firms B and C in rows 2 and 3 of Table 4, we see that both are significantly overpaying their workers per garment. In other words, the two smaller firms could save significantly on labor costs if they paid piece rates based on SMV as is done by Firm A.
In earlier discussions with the firms, the management had indicated that the negotiated piece rates were probably higher than those determined by SMV. However, the magnitude of our findings is unexpected: using its current technology and workers, Firm B could reduce its marginal labor cost by at least 37 percent and Firm C could cut its marginal labor cost by half, using SMV-based piece rates. To the extent that the SMVs of both firms could come down with more experience of producing the experimental garment, the cost saving could be even greater.
Finally, in row 4 of Table 4, we use the firms’ own SMVs with an outside (nonexperimental) firm’s range of piece-rate conversion factors to give an alternative range of stitching costs. While Firm A pays piece rates that are a constant multiplied by the SMV, this nonexperimental firm pays piece rates that are a nonconstant factor multiplied by the SMV. Its piece factor varies according to the operation: some are slightly less than Firm A, others slightly more. Both firms also give workers a fixed payment in addition to their wages, which vary by firm. The mean stitching cost using the outside firm’s piece rates yields a similar cost saving to that obtained using Firm A’s piece-rate calculations.
Next, we look at the efficiency differences between the firms and the extent of overpayment at the level of individual operations for those processes that could be matched across all three factories (Appendix 2). We were able to visually match the majority of operations performed across the three factories for each operation performed to produce the experimental garment, even though the operational breakdown differed slightly from firm to firm. For the operations we were able to match
A Comparison of Denim Production Across Factories in Punjab 221
across all three factories, we can compare the individual SMVs (see Table A1 in Appendix 2). Firm A’s stitching is more efficient than that of Firm B for 19 operations and less efficient for 11 operations. Firm A is more efficient in stitching than Firm C in 27 operations and less efficient in four operations. Firm B is more efficient than Firm C in 25 operations and less efficient in six operations.
Table A2 in the Appendix compares the piece rates paid by Firms B and C to the piece rates implied by their SMVs, using Firm A’s piece-rate conversion factor. Compared to what it would pay workers using an SMV-based piece rate, Firm B’s actual piece rates lead to overpayment for 24 operations, underpayment for three operations, and accurate payments for three operations. Firm C’s actual piece rates overcompensate for 27 operations and accurately compensate for three operations.
1.3 Quality of Experimental Garments
We asked an industrial engineer from a local firm with experience in the denim sector to examine a sample of the jeans stitched for the experiment (Table 5). The consultant viewed the jeans produced by Firms B and C mostly favorably. Overall, the jeans produced by Firm B more closely resembled the sample provided by Firm A.
We did not have a full batch from Firm A for examination, but we did have some information gathered from factory visits and discussions with management. Sewing defects found at inspection tables along the line are around 10–12 percent. However, this rises significantly when one adds the defects that emerge after the dry and wet processes (sandpaper, chemicals, lasers, stone washing) – up to 30 or 40 percent. These processes add considerable value, but by intentionally damaging the fabric for a fashionable effect, unintended damage to the stitching also occurs frequently. Fortunately, rework brings the ultimate rejection rate down to around 4 percent (although there is a fair amount of month-to-month variation), of which about a quarter is due to faults in the fabric itself. While the quality data was collected in real time (shared on the company portal), there are no tools to analyze the data continuously. The upper-level manager in charge of quality checks the data at least twice a day and brings it along for discussions on the floor.

Theresa Thompson Chaudhry and Mahvish Faran 222
Table 5: Quality comparison of jeans stitched by Firms B and C to
sample from Firm A
Firm A Firm B Firm C
Estimated price for foreign buyer
– US$8 US$6
Some sewing repairs needed
Finishing (clipping loose threads)
US$3–4
Some sewing repairs needed
Finishing (clipping loose threads)
Cheap accessories (main reason for discount compared to B)
General impression
– Closely resembles sample piece
Solid sewing
Same silicone washing, same heat applied as sample piece
Issues with finishing (extra threads not cut)
Solid sewing, though not quite as close to sample as firm B
Issues with finishing (extra threads not cut)
Good wash, though different fabric used, so more shrinkage observed
Errors common throughout batch
– Different thread used from sample (so more stitches per inch observed
Incorrect stitch on bottom hem (single instead of chain)
Waist band narrower than sample (by two points or 1/8 in.), either because cut too small or because operator folded too much before stitching
Incomplete finishing (extra threads not trimmed)
Incorrect stitch on bottom hem (single instead of chain)
Loose buttons (machine error)
Back-pocket stitching defect (decorative “v” in the middle of pocket loose), machine or fabric issue
Incomplete finishing (extra threads not trimmed)
Other defects observed in individual pieces
– High/low defect in back pockets (unequal distance from top of jeans, uneven), operator fault
Broken stitch on a belt (machine fault)
Dry process fault (too aggressive rubbing of sandpaper on one leg)
Bartack on back pocket uneven in one pair
Bartack slip on one back loop
Inner pocket not pressed before stitched inside (so pocket lumpy inside)
Back pocket upper seam had skip stitch
Note: Firm A = large exporter, high-tech, Firm B = medium exporter, medium-tech, Firm C = small domestic producer, low-tech. Source: Authors’ survey.
A Comparison of Denim Production Across Factories in Punjab 223
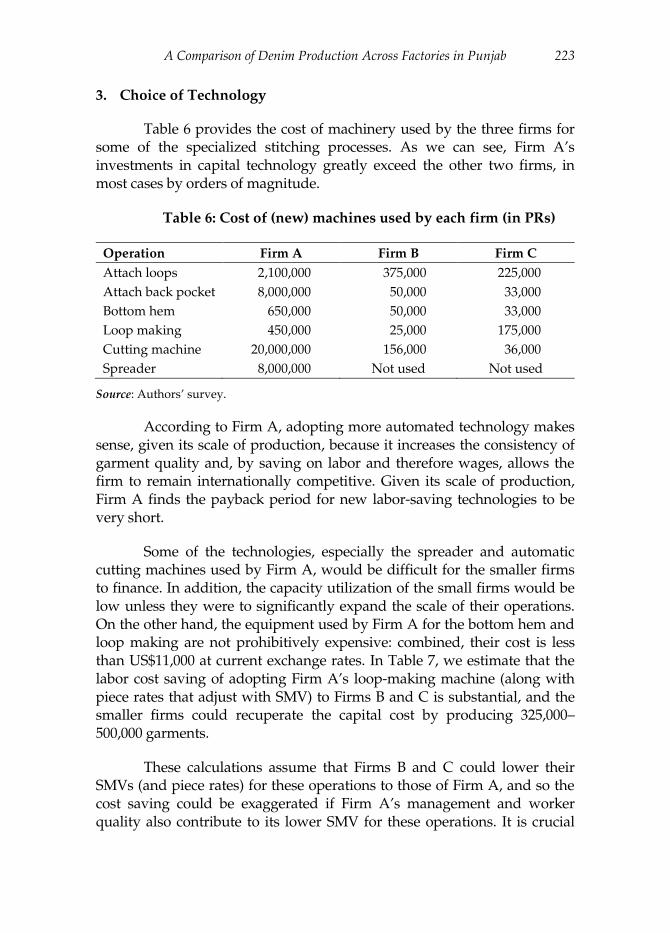
3. Choice of Technology
Table 6 provides the cost of machinery used by the three firms for some of the specialized stitching processes. As we can see, Firm A’s investments in capital technology greatly exceed the other two firms, in most cases by orders of magnitude.
Table 6: Cost of (new) machines used by each firm (in PRs)
Operation Firm A Firm B Firm C
Attach loops 2,100,000 375,000 225,000
Attach back pocket 8,000,000 50,000 33,000
Bottom hem 650,000 50,000 33,000
Loop making 450,000 25,000 175,000
Cutting machine 20,000,000 156,000 36,000
Spreader 8,000,000 Not used Not used
Source: Authors’ survey.
According to Firm A, adopting more automated technology makes sense, given its scale of production, because it increases the consistency of garment quality and, by saving on labor and therefore wages, allows the firm to remain internationally competitive. Given its scale of production, Firm A finds the payback period for new labor-saving technologies to be very short.
Some of the technologies, especially the spreader and automatic cutting machines used by Firm A, would be difficult for the smaller firms to finance. In addition, the capacity utilization of the small firms would be low unless they were to significantly expand the scale of their operations. On the other hand, the equipment used by Firm A for the bottom hem and loop making are not prohibitively expensive: combined, their cost is less than US$11,000 at current exchange rates. In Table 7, we estimate that the labor cost saving of adopting Firm A’s loop-making machine (along with piece rates that adjust with SMV) to Firms B and C is substantial, and the smaller firms could recuperate the capital cost by producing 325,000–500,000 garments.
These calculations assume that Firms B and C could lower their SMVs (and piece rates) for these operations to those of Firm A, and so the cost saving could be exaggerated if Firm A’s management and worker quality also contribute to its lower SMV for these operations. It is crucial

Theresa Thompson Chaudhry and Mahvish Faran 224
that piece rates also adjust along with SMV; the labor cost saving will not materialize at all if the firms stay with the market-determined piece rates.
Table 7: Labor cost savings of adopting the technology of the most
advanced firms
Firm B Firm C
Operation Piece rate saving per garment (PRs)
No. garments to recover capital cost
Piece rate saving per garment (PRs)
No. garments to recover capital cost
Bartack loops 0.72 2,916,667 2.14 981,308
Attach back pocket and second seam back pocket
0.13 61,538,462 5.38 1,486,989
Make and fuse loops
1.41 319,149 0.91 494,505
Bottom hem 0.39 1,666,667 2.64 246,212
Source: Authors’ calculations based on cost of equipment and differences in piece rates based on timed performance of operations. Data on energy and maintenance costs were not available.
Note that we do not have data on the electricity or maintenance costs and so, the total cost savings may be greater (lower) than the figures in Table 7, depending on whether the energy use and maintenance requirements of Firm A’s machines are less (more) than the current capital of Firms B and C. On the other hand, the calculations may underestimate the value of investing in the same equipment used by Firm A if the quality also improves, reducing defects (and, therefore, rework) and raising the price received from buyers.
4. Conclusion
Across the garments sector, firms vary widely in their level of sophistication in producing technically the same product (jeans). This pattern, however, is not unique. We have observed the same across manufacturing sectors in Pakistan – a small number of larger exporters using technologies close to the frontier, a somewhat larger cohort of medium firms using some older and some newer technology and a large periphery of small players using second-hand machinery, outdated technologies and often reverse-engineered equipment.
How do they coexist? Smaller, less formal, firms are significantly less productive, but also have lower overheads and other costs. In addition,

A Comparison of Denim Production Across Factories in Punjab 225
these three types of firms are not necessarily competing head-to-head; rather, they are operating in different segments of the market. Firm A is one of many suppliers competing globally for the business of a major international brand. Firm B also faces international competition, but is operating in a lower segment of the denim market, producing for smaller regional European brands. Firm C fills some minor export orders, but focuses primarily on domestic sales.
Previous studies have highlighted some reasons for the slow adoption of technology in the manufacturing sector. Some literature points to the role of labor in opposing new technologies. Lazonick (1979) and Mokyr (1990) explain how trade unions slowed down the process of technology adoption during the industrial revolution. The practice of paying piece rates, extremely common in Pakistan, may also induce workers not to accurately report the benefits of new technologies (Holmstrom & Milgrom, 1991). Milgrom and Roberts (1995) and Atkin et al. (2015) suggest that misaligned incentives between workers and owners within firms is an important barrier to the adoption of technology and workers may perform better while learning new technologies if piece rates are combined with incentives to use the technology.
On the other hand, firm owners themselves may also be responsible for the lag in adoption. Bloom and Van Reenen (2007, 2010) and Bloom, Schankerman and Van Reenen (2013) suggest that firms may fail to adopt innovative management practices in the absence of product market competition. The process of adopting new technologies may also require changes in complementary technologies, which takes time to implement (Rosenberg, 1982; David, 1990; Bresnahan & Trajtenberg, 1995).
In our view, small and even medium firms in Pakistan likely lack the ability to finance as well as the operational scale to make use of many state-of-the-art technologies. We have not even considered the role of human capital in adopting new technologies here; large exporters likely attract a better pool of workers who will have less difficulty operating more complex machinery. Another consideration is that it is often more appropriate to pay fixed wages rather than piece rates if the newer technology is more automated, as often it is. Even if firms can increase their scale, if they are confined to paying piece rates that are unrelated to the SMV, investment in time-saving equipment will be hard to justify because the labor cost saving will be negligible.
Theresa Thompson Chaudhry and Mahvish Faran 226
What role, then, can the government play to encourage greater innovation and vibrancy in the sector? Let us start with the first issues mentioned: scale, skills and finance. Many technologies are realistic only for export firms operating on a fairly large scale. Reducing the impediments to exporting (including easier imports of high quality intermediate inputs) could allow firms to grow to a scale of operations that would support investments in state-of-the-art technology. Training workers would give them the skills to operate more advanced equipment, but would be costly and help only if firms decide to invest in it. Policies to increase access to finance capital investment may help some, but is not likely the full answer. Even if we limit our discussion to those technologies that may be appropriate for a smaller scale, we have noticed in our discussions with firms that many prefer the self-financing model. For those firms that shy away from banks for religious reasons, wider access to Islamic finance may encourage them to borrow. The availability of Islamic banking products has grown rapidly in the last several years in Pakistan. Its role in encouraging firm-level capital investment should be an area of future research.
As mentioned earlier, adopting more advanced and automated technologies may not be profitable for firms if they cannot then lower their labor costs due to sticky piece rates that are disconnected from the work content. The benefits of a fixed wage system go deeper. On top of the cost savings that Technopak (2007) estimates, it suggests that, if factories were to shift to salaries from piece rates, the salary system would be more conducive to producing quality output. Fixed wages require firms to be better managed, but also encourage innovation and the adoption of modern management techniques such as 6-sigma, lean manufacturing and total quality management (Technopak, 2007). In its experience, the most efficient garment firms internationally work on salaries.
Manufacturing workers in Pakistan work mainly on piece rates in a variety of sectors. In garments, firms feel they have to pay the market rate for an operation or else their best stitchers will move to another firm (Chaudhry & Faran, 2015). Fixed wages makes firms’ wage bills less responsive to demand, which may be difficult for smaller firms facing greater variability in orders. Even if firms wish to shift to fixed salaries, they would need to place more emphasis on actively managing those workers, on top of the fact that workers may resist the change and prefer the flexibility of piece-rate work (see Chaudhry & Faran, 2015, for an example from the fan sector).
A Comparison of Denim Production Across Factories in Punjab 227
The piece rate is an entrenched system in Pakistan and there would almost certainly be resistance to change. How do we deal with this impasse? One way to move firms toward salaries from piece rates is by external pressure: according to Verhoogen (2016), one of the largest soccer-ball firms in Sialkot (Pakistan) moved to fixed wages under pressure from a foreign buyer. An unintended bonus of the shift was that the new salary system facilitated the adoption of a cost-saving technology. Other soccer-ball producers paying piece rates were much slower to adopt the technology, if at all.
In our sample, Firm A has found a partial solution by tying its piece rates directly to the SMV, so that cost matches work content. As we have calculated here, Firms B and C might be able to reduce their wage bills significantly by using SMV to compute piece rates, but only if they are able to keep their workers from leaving for other firms. This could prove difficult if other firms in the sector continue to pay the ‘market rate’. Being a large exporter, Firm A is probably an attractive employer and faces less difficulty in retaining workers.6 Firms could benefit from industrial engineering services to calculate SMVs, which might help them align their piece rates with their stitching times. Along these lines, a recent project funded by UNDP, Promoting Employment and Productivity in the Garment Industry, builds on an earlier project, Gender Promotion in the Garment and Clothing Industry through Skills Development (GENPROM), which provided master trainers – intended to help recruit and train women stitchers – and consulting services for quality, cutting and industrial engineering.7
This paper offers only a snapshot of the distribution of technologies and efficiency levels of firms. But are firms innovating over time? Other articles in this special edition provide some answers. These include Wadho and Chaudhry’s piece on the textiles sector more broadly defined, Firdousi and Chaudhry on sports gloves, and Raza and Chaudhry on the soccer-ball sector.
6 It also differs from many RMG producers in Pakistan in that it employs a relatively large number
of women stitchers. 7 According to our sources, mainly large firms (exporters) availed of these services in the earlier
GENPROM project.
Theresa Thompson Chaudhry and Mahvish Faran 228
References
Atkin, D., Chaudhry, A., Chaudry, S., Khandelwal, A. K., & Verhoogen, E. (2015). Organizational barriers to technology adoption: Evidence from soccer-ball producers in Pakistan (Working Paper No. 21417). Cambridge, MA: National Bureau of Economic Research.
Bloom, N., & Van Reenen, J. (2007). Measuring and explaining management practices across firms and countries. Quarterly Journal of Economics, 122(4), 1351–1408.
Bloom, N., & Van Reenen, J. (2010). Why do management practices differ across firms and countries? Journal of Economic Perspectives, 24(1), 203–224.
Bloom, N., Schankerman, M., & Van Reenen, J. (2013). Identifying technology spillovers and product market rivalry. Econometrica, 81(4), 1347–1393.
Bresnahan, T. F., & Trajtenberg, M. (1995). General purpose technologies ‘Engines of growth’? Journal of Econometrics, 65(1), 83–108.
Chaudhry, A., Macchiavello, R., Chaudhry, T., & Woodruff, C. (2016). Understanding productivity in the Pakistani garment sector (Working Paper). London: International Growth Centre.
Chaudhry, T., & Faran, M. (2015). Organization, management and wage practices in Pakistan’s electrical fan and readymade garment sectors [Special edition]. Lahore Journal of Economics, 20, 183–204.
David, P. A. (1990). The dynamo and the computer: An historical perspective on the modern productivity paradox. American Economic Review, 80(2), 355–361.
Hamid, N., Nabi, I., & Zafar, R. (2014). The textiles and garments sector: Moving up the value chain [Special edition]. Lahore Journal of Economics, 19, 283–306.
Holmstrom, B., & Milgrom, P. (1991). Multitask principal–agent analyses: Incentive contracts, asset ownership and job design. Journal of Law, Economics and Organization, 7, 24–52.
A Comparison of Denim Production Across Factories in Punjab 229
Lazonick, W. (1979). Industrial relations and technical change: The case of the self-acting mule. Cambridge Journal of Economics, 3(3), 231–262.
McGregor, L. (2015, October 29). Can Pakistan capitalize on GSP plus? Sourcing Journal. Retrieved from https://sourcingjournalonline.com/can-pakistans-garment-sector-capitalize-on-gsp-plus/
Milgrom, P., & Roberts, J. (1995). The economics of modern manufacturing: Reply. American Economic Review, 85(4), 997–999.
Mokyr, J. (1990). The lever of riches: Technological creativity and economic progress. Oxford: Oxford University Press.
Nathan Associates. (2009). Cost competitiveness of Pakistan’s textiles and apparel industry. Washington, DC: United States Agency for International Development.
Rosenberg, N. (1982). Inside the black box: Technology and economics. Cambridge: Cambridge University Press.
Technopak. (2007, December 23). Discussion and analysis: Piece rate vs. salary-based production system [PowerPoint presentation].
Verhoogen, E. (2016). How labor standards can be good for growth. Harvard Business Review. Retrieved from https://hbr.org/2016/04/how-labor-standards-can-be-good-for-growth
Theresa Thompson Chaudhry and Mahvish Faran 230
Appendix 1
Mapping the Manufacturing Process and Technologies
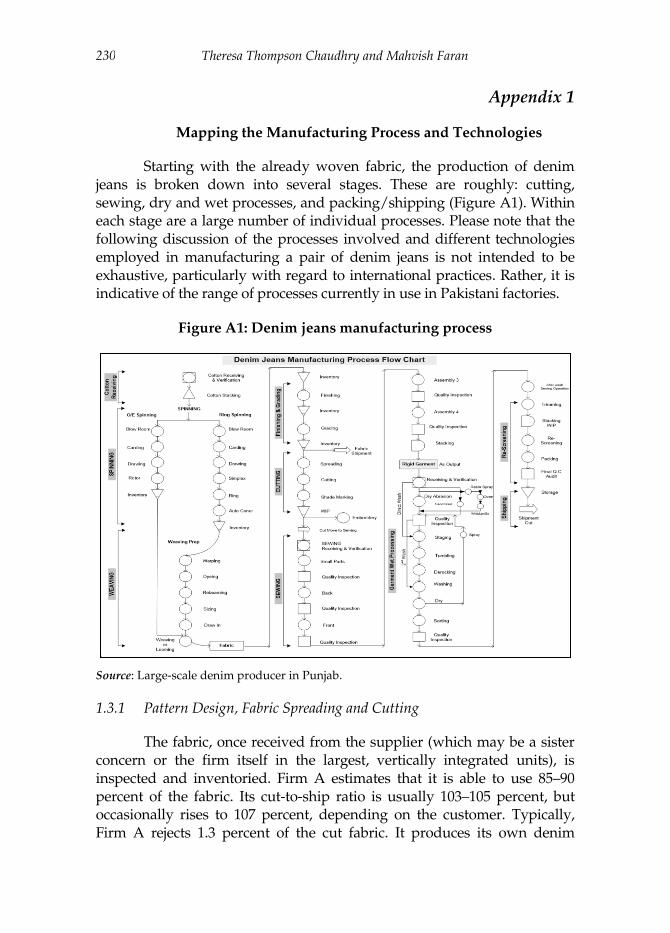
Starting with the already woven fabric, the production of denim jeans is broken down into several stages. These are roughly: cutting, sewing, dry and wet processes, and packing/shipping (Figure A1). Within each stage are a large number of individual processes. Please note that the following discussion of the processes involved and different technologies employed in manufacturing a pair of denim jeans is not intended to be exhaustive, particularly with regard to international practices. Rather, it is indicative of the range of processes currently in use in Pakistani factories.
Figure A1: Denim jeans manufacturing process
Source: Large-scale denim producer in Punjab.
1.3.1 Pattern Design, Fabric Spreading and Cutting
The fabric, once received from the supplier (which may be a sister concern or the firm itself in the largest, vertically integrated units), is inspected and inventoried. Firm A estimates that it is able to use 85–90 percent of the fabric. Its cut-to-ship ratio is usually 103–105 percent, but occasionally rises to 107 percent, depending on the customer. Typically, Firm A rejects 1.3 percent of the cut fabric. It produces its own denim
A Comparison of Denim Production Across Factories in Punjab 231
material, but also procures specialized fabrics, such as stretch fabrics incorporating Lycra, from outside firms when needed. Fabric producers typically give concessions or discounts to make up for wastage due to fabric defects.
Before the pieces for a pair of denim jeans are cut, a pattern is designed, usually with the aid of computer programs. Variations in the shade (color) of fabric from roll to roll – particularly after it is subjected to chemicals and washed for special finishes – necessitate that factories cut all the different pieces for an individual pair of jeans from the same roll of fabric. We do not know if this is a common practice internationally. Computer-aided design (CAD) software takes the information on the size and shape of the fabric pieces needed for the jeans and fits them into a pattern intended to minimize the amount of fabric wasted. In many cases, the software lays out the pieces without enough space between them to be cut. Often, workers in the CAD section will at least partially rearrange the pattern to make it more amenable to cutting.
The pattern is then printed and laid over the spread fabric for cutting. Before the fabric is cut, it is spread on long tables, dozens of layers thick, so that stacks of pieces are cut simultaneously. As the fabric is spread, it is checked for defects. Spreading can be done manually or through an automated process whereby a large machine mechanically spreads the fabric many layers thick.
Cutting can also be done either manually or by an automated process. In manual cutting, workers use long mechanical saws to cut through the layers of fabric, using the pattern laid on top. Automated cutting involves a robotic arm cutting the fabric with a mechanical saw. The most advanced technology (not used in any firm we visited) is laser cutting. Complementarities may exist between the more advanced technologies. For example, automated cutting may be better able to handle the tight patterns generated by the auto-CAD software programs, reducing fabric wastage. Even though fabric is the costliest portion of a garment (verbal estimates are given at 50–70 percent), most firms have paid little attention to increasing efficiency here.
1.3.2 Sewing
Stitching is where the most workers are employed in manufacturing a garment. Garments are stitched on a line (consisting of ?? machines and workers). In denim jeans production, there are typically four

Theresa Thompson Chaudhry and Mahvish Faran 232
sections for sewing: small parts (such as pockets, waist belts, belt loops), fronts, backs and assembly. Garments move along the assembly line in bundles of 20–30 garments. Each operation on the garment takes a different length of time to complete; some sewing operations can be done very quickly while others take longer. Therefore, production supervisors (sometimes with the assistance of an industrial engineer) organize production to ‘balance the line’, in other words, to minimize the time that operators and machines are idle on the line, waiting for work.
One or more sewers may be assigned to an operation, depending on how long it takes in relation to other operations. Operations completed quickly may be assigned to one operator, whereas a complex operation taking longer to complete may have two or three operators assigned to it. Helpers are sometimes assigned to assist sewing operators by preparing a garment for stitching, for example, aligning pieces or cutting threads. Additionally, more or less experienced operators may be strategically placed in order to minimize downtime.
Different technologies can be employed in the sewing section, in particular, the sewing machines themselves and the equipment used to move garments along the line. In the least technologically advanced factories, garments are transported by hand or cart and basic or standard sewing machines are used for all processes. More advanced technologies include auto-trimming sewing machines, set to make only a certain length of stitch after which the thread is automatically cut; specialized machines for stitching certain small parts such as belt loops; and specialized machines for performing particular operations such as attaching a back pocket to each pair of jeans. At the most sophisticated level, there are also fully automated solutions for transporting in-process garments from one sewing operator to the next, such as Eton. Factories may also employ an intermediate system where garments are clipped on and manually pulled along a track.
1.3.3 Dry and Wet Processes
Dry and wet processes add a great deal of value to denim garments. These include the application of chemicals, sandpaper, rubbing, and stone washing, which intentionally damage the denim for the purpose of making the garment more fashionable. Pakistani factories have been able to incorporate these techniques into their production process and the quality of these value-added finishes is internationally accepted.
A Comparison of Denim Production Across Factories in Punjab 233
We observed a number of differences among denim factories in how the same dry and wet processes were carried out. In firms using less technology, the dry processes were mostly done manually. For example, a process known as ‘scraping’ was carried out using emery paper (sandpaper). Manual scraping was done on plain wooden boards, with operators applying hand pressure to give the garment the desired ‘worn’ look. In the more technologically advanced firms, scraping was done while the garment was stretched over inflated balloons. Another process involved adding the effect of ‘whiskers’ to create lines at the hips and thighs similar to those made after the garment has been worn. This can be done manually on jeans using wooden boards and the sharp edge of emery paper or with a machine that presses the lines into the jeans. Chemicals such as potassium permanganate and resin were also applied. In the less technical firms, jeans were simply hung out for the application while placing them on inflated balloons was used in the more mechanized firms.
Following the dry processes are the wet processes (including stone washing) in massive washing machines. The best machines are Italian, followed by Turkish and then Chinese machines. Firms sometimes bring in specialized washing consultants from Italy or Turkey. The jeans are then dried and repairs made (as the dry and wet processes may damage the stitching). Accessories such as buttons and rivets are attached, the jeans are pressed and retail tags added and the garments are then packed for shipment.

Theresa Thompson Chaudhry and Mahvish Faran 234
Appendix 2
SMVs, Actual Piece Rates and SMV-Based Piece Rates at the Operation
Level
Table A1: Comparison of SMVs per garment (of matched processes
only)
Operation description Firm A Firm B Firm C
1. Hem watch pocket 0.15 0.12 0.17
2. Serge facing 0.24 0.08 0.04
3. Attach facing to pocket bag 0.42 0.26 0.59
4. Att. watch pocket (mittered) with show seam toward WB CF side
0.40 0.49 1.11
5. Serge left fly from side and bottom 0.12 0.07 0.05
6. Attach zip to left fly 0.07 0.11 0.92
7. Edge-stitch left fly 0.21 0.35
8. Fold and attach zip to right fly 0.22 0.25 1.33
9. Serge right pnl with fly 0.20 1.34
10. Top-stitch right fly and hem crotch 0.28
11. Join crotch 0.28
12. Hem back pocket (dnls) 0.35 0.54 0.24
13. Mock-stitch back pocket 0.20 1.62 1.07
14. Make and fuse loops = 5 0.10 0.35 1.64
15. Attach back pocket auto 1.00 1.49 2.30
16. Second seam back pocket 0.80
17. Attach yokes 0.29 0.29 0.46
18. Seat seam 0.35 0.34 0.73
19. Bartack back pocket 0.35 0.24 0.43
20. Set front pocket 0.45 0.15 0.54
21. Turn and top-stitch front pocket 0.47 0.41 0.68
22. Close pocket bag 0.70 0.22 1.11
23. J-stitch 0.17 0.17 0.37
24. Close out-seam busted 0.70 0.57 0.66
25. Press busted seam 0.35 1.30 1.52
26. Top-stitch sides 7” 0.30 0.46 0.91
27. Fell inseam 0.64 0.87 1.48
28. Attach waist band (auto) 0.80 0.44 0.92
29. Close band ends 0.15 0.73 1.65
30. Buttonhole 0.08 0.16 0.48

A Comparison of Denim Production Across Factories in Punjab 235
Operation description Firm A Firm B Firm C
31. Attach stud 0.13 0.15 0.39
32. Rivets = 6 0.30 0.73 1.30
33. Bartack loops = 5 0.40 0.69 0.89
34. Hem bottom snls 0.40 0.50 1.28
35. Attach leather patch 0.20 0.29 1.06
36. Thread trimming final 1.13 2.93 5.20
Total 13.38 15.79 31.52
Source: Firm A’s SMVs provided by Firm A and timed by authors for Firms B and C.
Table A2: Comparison of actual piece rate and piece rate implied by
timed SMVs, using Firm A’s pay scale (for matched processes only) per garment (in PRs)
Firm A Firm B Firm C
Operation description Piece rate
(actual =
implied)
Actual
piece rate
Piece rate
implied
by timed
SMV
Actual
piece rate
Piece rate
implied
by timed
SMV
1. Hem watch pocket 0.14 0.15 0.11 0.50 0.15
2. Serge facing 0.22 0.25 0.07 0.50 0.04
3. Att. facing to pocket bag 0.38 0.25 0.24 1.00 0.53
4. Att. watch pocket (mittered) with show seam toward WB CF side
0.36 0.50 0.44 1.00 1.00
5. Serge left fly from side and bottom
0.10 0.10 0.06 0.50 0.05
6. Attach zip to left fly 0.06 0.10 1.50 0.83
7. Edge-stitch left fly 0.19 0.32
8. Fold and attach zip to right fly
0.20 0.30 0.23 4.00 1.20
9. Serge right pnl with fly 0.18 1.10 1.21
10. Top-stitch right fly and hem crotch
0.25
11. Join crotch 0.25
12. Hem back pocket (dnls) 0.32 0.30 0.49 1.00 0.21
13. Mock-stitch back pocket 0.18 1.50 1.46 1.00 0.97
14. Make and fuse loops = 5 0.09 1.50 0.32 1.48
15. Attach back pocket auto 0.90 1.75 1.34 7.00 2.07
0.00 16. Second seam back pocket 0.72
17. Attach yokes 0.26 0.40 0.27 3.00 0.41
18. Seat seam 0.32 0.50 0.30 3.00 0.66
19. Bartack back pocket 0.32 0.36 0.21 1.00 0.39

Theresa Thompson Chaudhry and Mahvish Faran 236
Firm A Firm B Firm C
Operation description Piece rate
(actual =
implied)
Actual
piece rate
Piece rate
implied
by timed
SMV
Actual
piece rate
Piece rate
implied
by timed
SMV
20. Set front pocket 0.41 0.25 0.14 1.00 0.49
21. Turn and top-stitch front pocket
0.42 0.60 0.37 2.00 0.62
22. Close pocket bag 0.63 0.60 0.20 1.00 1.00
23. J-stitch 0.15 0.35 0.15 2.00 0.33
24. Close out-seam busted 0.63 1.00 0.51 3.00 0.60
25. Press busted seam 0.32 1.15 1.17 3.50 1.37
26. Top-stitch sides 7” 0.27 0.50 0.41 2.00 0.82
27. Fell inseam 0.58 1.20 0.79 4.00 1.34
28. Attach waist band (auto) 0.72 0.70 0.40 3.00 0.83
29. Close band ends 0.14 0.65 0.66 3.00 1.49
30. Buttonhole 0.07 0.20 0.14 1.00 0.43
31. Attach stud 0.12 0.20 0.14 1.00 0.35
32. Rivets = 6 0.27 0.75 0.66 2.00 1.17
33. Bartack loops = 5 0.36 1.08 0.62 2.50 0.80
34. Hem bottom snls 0.36 0.75 0.45 3.00 1.15
35. Attach leather patch 0.18 0.60 0.26 1.50 0.96
36. Thread trimming final 0.64 1.50 1.64 4.00 2.92
Total 11.68 21.04 15.89 64.50 26.67
Source: Piece rates provided by Firm A, piece rates provided by Firms B and C, and timed operations for Firms B and C. Added were an industry standard 10 percent bundle allowance and 20 percent personal and machine allowances.